Embed Size (px)
Citation preview

1
X-ray Crystallography
Prof. Leonardo ScapozzaPharmceutical Biochemistry
School of Pharmaceutical SciencesUniversity of Geneva, University of LausanneE-mail: [email protected]
Aim
• Introduce the students to X-ray crystallography• Give the students the tools to “evaluate” a X-ray
structure based scientific paper

2
Outline
• The History of X-ray• The Principle of X-ray• The Steps towards the 3D structure
– Crystallization– X-ray diffraction and data collection– From Pattern of Diffraction to Electron Density– X-ray structure quality assessment
An extract of a structure paper2.1. Crystallization• The hTK1 was cloned as N-terminal thrombin-cleavable His6–tagged fusion protein missing 14 amino
acids of the N-terminus and 40 amino acids of the C–terminus of the wild type hTK1 sequence of 234 amino acids (this construct is further on called hTK1). The purified hTK1, consisting of residues 15-194 of the wild type sequence plus an N–terminal extension of 15 residues containing a His6–tag, was eluted from gel filtration column at a concentration of approximate 7 mg/ml with a buffer containing 5 mM Tris at pH 7.2, 10 mM NaCl and 10 mM DTT. For protein crystallization we used the hanging drop method at 23°C. Initial conditions for crystallization were found using Crystal screen Cryo no. 40 (Hampton Research). The protein solution was mixed in a 1:1 ratio with crystallization buffer (0.095 mM tri–sodium citrate pH 5.5, 12% PEG 4000, 10% isopropanol) to set up drops of 6 μl. The reservoir contained 500 μl of crystallization buffer.
• Crystals appeared after 3 days and grew within 3 days to sizes of about 300 x 150 x 70 μm3 and diffracted to 1.8 Å resolution. They belong to space group C2 with a= 157.5 Å, b= 122.9 Å, c= 115.3 Å, α = γ = 90° and β= 130°. The asymmetric unit contains 8 monomers forming two tetramers. The solvent content is 48%. For X–ray data collection the crystals were cryo–protected using crystallization buffer with additional 30% glycerol soaking for one minute. The crystals diffract up to 1.8 Å resolution and are stable under X–radiation from beamline X06SA at Swiss Light Source (Villigen/CH).
2.2. Data collection, phase determination and refinement• Three datasets were collected from two crystals. A fluorescence scan from one crystal was performed
and data were collected at two wavelengths (lambda=1.2776 Å (zinc edge) and 0.9196 Å). The data processing was performed with the program XDS [11]. These data sets were used for Multi-wavelength Anomalous Diffraction (MAD) phasing. The zinc coordinates were determined with program CNS [12]. Initial two wavelength MAD phases to 4 Å were obtained with SHARP [13] and extended to 1.83 Å by eight-fold NCS averaging, solvent flattening and histogram matching implemented in RESOLVE [14] using the third data set (lambda= 0.9793 Å) collected from the second crystal. An initial model was obtained with RESOLVE, which was subsequently rebuilt and refined with XFIT [15] and REFMAC [16], respectively. Model refinement was started using NCS restraints, which were stepwise released and finally omitted. Water molecules were introduced using ARP_WATERS [16] when the R–factor reached 20%. Refinement results were checked with PROCHECK [17] and WHATCHECK [18]. Coordinates and structure factors have been deposited in the Brookhaven Protein Data Bank (accession code 1w4r). The figures were produced with POVScript+ [19]. For secondary structure assignment DSSP [20] was used. The B–factor plot was calculated with BAVERAGE [16] and the density correlation was done with the program OVERLAPMAP [21]. The numbering of the hTK1 [EC 2.7.1.21] sequence corresponds to the hTK1 SwissProt entry P04183.
Birringer, M.S., et al. Scapozza, L. (2005) Structure of a type II thymidine kinase with bound dTTP FEBS Lett. 579(6):1376-82.

3
An extract of a structure paperTABLE 1: Data collection and refinement statistics.
Data set dTTP:hTK1
Diffraction dataa X-ray source X06SA (SLS Villigen/CH) Unit cell dimensions (Å) a = 157.5; b = 122.9; c = 115.3;
α = γ = 90°; β=130.0° Resolution range (Å) 20.0-1.83 (1.95 -1.83) Completeness (%) 99.5 (99.8) Multiplicity 7.1 (7.1) Unique reflections 147503 (25536) Rsym-I (%) 8.4 (39.4) I/σ 17.1 (7.9) Space group C2 Protomers per ASU 8 Wavelength (Å) 0.97934 Refinement and final model: Rcryst / Rfree (%) 15.9 /18.9 Number of reflections in working set 140080 (10345) Number of reflections in test set 7423 (542) Number of non-H-atoms: Polypeptide 10106 dTTP atoms 232 Water molecules 774 Dithiothreitol atoms 8 Average B-factors (Å2): All atoms 29.0 Polypeptide atoms 27.9 Main chain 26.0 Side chain 29.9 dTTP molecules 43.5 Water molecules 39.5 Dithiothreitol molecule 53.1 Rmsd from ideal geometry: Bond lengths (Å) 0.016 Angles (°) 1.7 Ramachandran angles: Favored regions (%) 93.8 Allowed regions (%) 6.2
a The data were collected at 100 K. Values in parenthesis are for the outermost shell. Birringer, M.S., et al. Scapozza, L. (2005) FEBS Lett. 579(6):1376-82.

4
The majority of the structures is determined by X-ray
• X-ray crystallography (resolution at atomistic level)• NMR (resolution at atomistic level)• Electron microscopy (resolution at “molecular” level)
Why Crystallography ?
• The knowledge of accurate molecular structures is a prerequisite for rational drug design and for structure based functional studies.
• Crystallography can reliably provide the answer to many structure related questions, from global folds to atomic details of bonding.

5
Microscopy (λ = 400 to 800 nm) X-ray (λ = 100 to 0.1 Å)
The method’s Principle: The Limit of resolution (LR)
Depends on the wavelength you are using: LR λ/2.=~
• LR = 200 nm = Organelles structures within a cell• principle of lens/magnifying glass
λ < 2.4 Å• LR = 1.2 Å = distance
between two atoms• Pattern of diffraction are
interpreted via mathematics and geometry
• No lens
Visible light
X-rays
Wavelength (λ, nm)
Photon-Energy
• X-rays are formed by the collision of fast electrons with the matter
• The wavelength depend from the matter
• Example of monochromatic X-ray:
Fe: 1.93 ÅCu: 1.54 ÅMo: 0.71 Å

6
Why Crystallography ?Advantages
• High resolution• No protein mass limit
Disadvantages
• Crystals needed• Possible artifacts due to
crystal content and precipitation
• Structure is static “average”• Mostly no H seen
X-ray
• The price for the high accuracy of crystallographic structures is that a good crystal must be found.
Determination of 3D structures using X-ray
1. You need a unique crystal. The atoms within this crystal are all well ordered and the molecules have the same conformationsIf not a low resolution is expected.
2. Pattern of diffraction of the unique crystal are collected3. The 3D model is constructed in order to interpret the
diffraction pattern

7
The steps towards the 3D structure
What is a Crystal?
apoHSV1-TK
• Is a solid formed by ordered atoms and ions• Ordered means: the same pattern is repeated
along a regular lattice

8
Why Protein Crystals?• Crystals, which are three-dimensional arrays of
molecules, are required for X-ray diffraction experiments because scattering from individual molecules is far too weak to measure.
• Crystals act as amplifiers by increasing the scattering signal due to the multiple copies of molecules within them.
Strategy for getting crystals• Isolation of target protein
– Biological resources (plants, animals)– Recombinant protein (E. coli, yeast, cell lines, baculovirus)
• Purification– Affinity chromatography, Gel filtration ...
• Biochemical characterization– Activity, pI, stability, inhibition, pH, salt ...– Oligomeric state, secondary structure (CD)
• Crystallization

9
Crystallization
• A multiparametric process• Three classical steps
– Nucleation (formation of first ordered aggregates)
– Growth– Cessation of growth
Energy Diagram
• There is an energy barrier to crystallization– Proteins must overcome an energy barrier to crystallize.– The critical nucleus corresponds to the higher energy
intermediate. – The higher the energy barrier, the slower the rate of
nucleation.
Energy diagram for crystallization

10
Crystallization is...
• Macromolecular crystallization is no more (and no less) than forcing a protein to precipiate into a regularly ordered 3D-array... the crystal!
Parameters Affecting Crystallization• Intrinsic physico-chemical parameters
– Temperature– pH value (changes)– Time (rates of equilibration and of growth)– Ionic strength and purity of chemicals– Diffusion and convection– Volume and geometry of samples and set-ups– Dust and other impurities– Density and viscosity effects (differences between crystal and mother liquor)– Pressure, electric and magnetic field– Vibration and sound (acoustic waves)
• Biological parameters– Biological origin of the protein– Bacterial contaminants– Rarity of most biological macromolecules
• Biochemical and biophysical parameters– Sensitivity of the protein conformation relative to physical influences (temperature, pH,
ionic strength, oxidation,...)– Binding of ligands (substrates, co-substrates, inhibitors, metal ions)– Additives (reducing agents, non ionic detergents)– Ageing of samples (red-ox effects, denaturation, cleavage)

11
General Rules
• The more you know about your protein, the more likely you get it crystallized!
• Homogenious, compact and globular proteins are more likely to crystallize than heterogenious and floppy ones!
Vapor Diffusion Method 1
Hanging drop

12
Vapor Diffusion Method 2
Sitting drop
Vapor Diffusion Method 3
Sandwich drop

13
What happens whitin the drops: Phase Diagram
• Phase diagram for vapor diffusion experiment– In a vapor diffusion experiment where equal volumes of precipitant
and protein are added in the drop, both the precipitant and protein concentration will double during equilibration.
No crystals Crystals
The steps towards the 3D structure

14
1. Asymmetric unit is the smallest entity (molecule) of the crystal that has no symmetry
2. Applying symmetry operators and translation along the 3 axis (X,Y,Z) the unit cell is built
3. the side of the unit cells form the axis of the crystal (a, b, c, α, β, γ).
The single elements forming a crystal
http://www-structmed.cimr.cam.ac.uk/course.htmlLattice
Unit cellAsymmetric unit
From the paper: The asymmetric unit contains 8 monomers: What does it mean?
What does this sentence mean?
• The crystals belong to space group C2 with a= 157.5 Å, b= 122.9 Å, c= 115.3 Å, α = γ = 90°and β= 130°.

15
Crystals & Lattices: How to achieve the most favorable space filling
Symmetry (1)
16
Symmetry (2)
The combination of Bravais-lattice and symmetry lead to 230 space groups
• The combination of 14 Bravais lattices with 32 point groups and additional translational components such as screw axes and glide planes gives in total 230 space groups.
• Of these, only 65 space groups without mirror planes and inversion centers are possible for protein crystals.
• All space groups are described in the "International Tables for Crystallography, Vol. A".

17
Data collection: SLS at PSI
Data collection and diffraction patternGoniometer-Kopf= φ-Achse
Oscillation= ω-Achse
Röntgen-Strahl
χ-Kreis
2 θDetektor
KristallÄquatorebene

18
Bragg’s Law: nλ = 2d sinΘ
Diffraction of a lattice is visible only when both the von Laue conditions and Bragg‘s law are fulfilled. This results in
diffraction spots called reflections.
A
B B
C
nλ = AB + BC
Θ
dScattering plan
http://en.wikipedia.org/wiki/Bragg%27s_law
X-ray beam λ da AB = BCnλ = 2 AB
n: is an integer, λ: is the wavelength of x-rays, and moving electrons, protons and neutrons, d: is the spacing between the planes in the atomic lattice, and Θ: is the angle between the incident ray and the scattering planes
1) constructive Interference 2) destructive Interference
The X-ray diffraction pattern: Analogy with the waves formed in water
λ
1)
2)

19
X-ray beam (in Phase)
Reflected X-ray beam(in Phase,)
Θ Θ
. .
The crystal layers diffract the X-ray
d (distances between the layers (scattering plan))
The traveling distance is proportional to (x=1, 2, 3, 4 etc., integer number)the wavelength λ
constructive Interference
Lattice planes
IncidentScattered
The reflected X-ray beam is not in phase
ΘΘ
Destructive Interference
d (distances between the
layers)
d
X-ray beam(in Phase)
The traveling distance is not proportional to (x=1, 2, 3, 4 etc., integer number)the wavelength λ (d = x*λ with x not being an integer number)

20
Pattern of diffraction of Lysozyme(ca. 8500 Reflexes)
• Symmetrie of the crystal: tetragonal• Unit cell
• Space group P43212• Resolution 2Å
o
ab
c a = b = 79 Å, c = 38 Åα = β = γ = 90o
The pattern of difraction allowdirect determination of the unit cell and geometry (space group) :
Intensity F is the result of constructive interference.
Estimation of the resolution
21
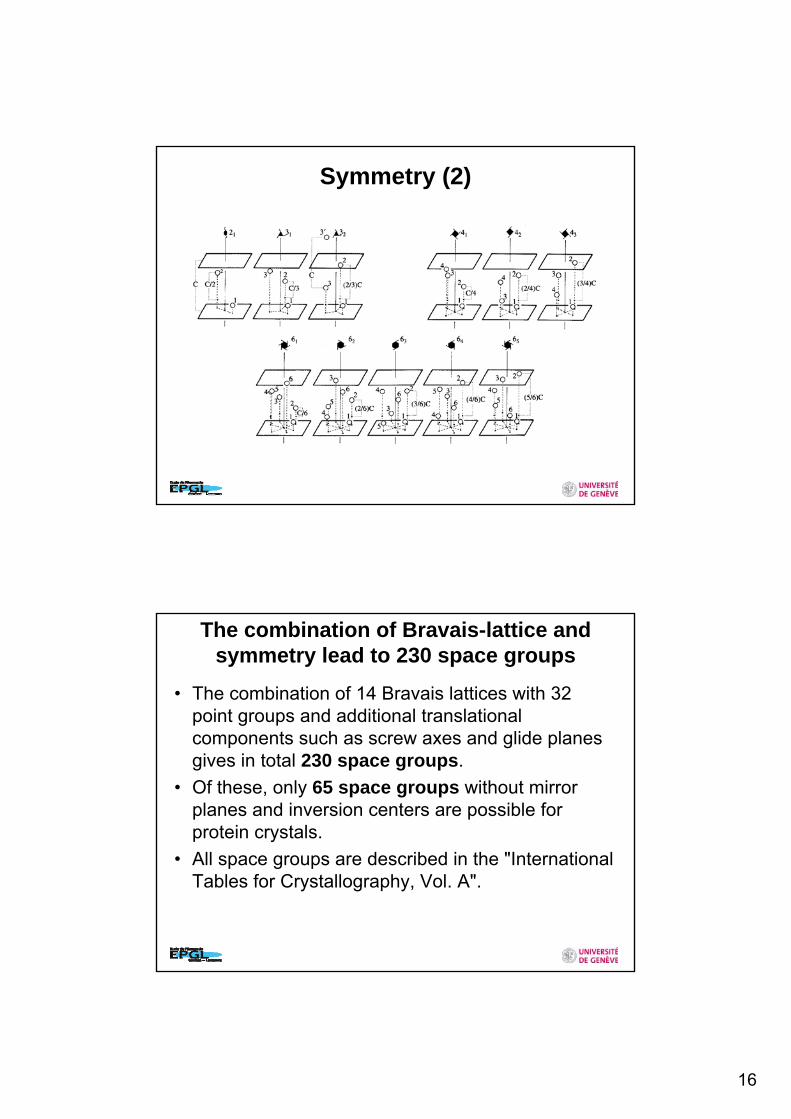
The Resolution
Resolution dmin = λ2sinΘmax
High resolution 1 - 2 ÅLow resolution 6 Å
Data Processing Flow
• Indexing• Integration• Scaling• Merging & Data Reduction• Quality Indicators

22
Statistical Quality indicators (in Table 1)
From Pattern of Diffraction to Electron Density
23
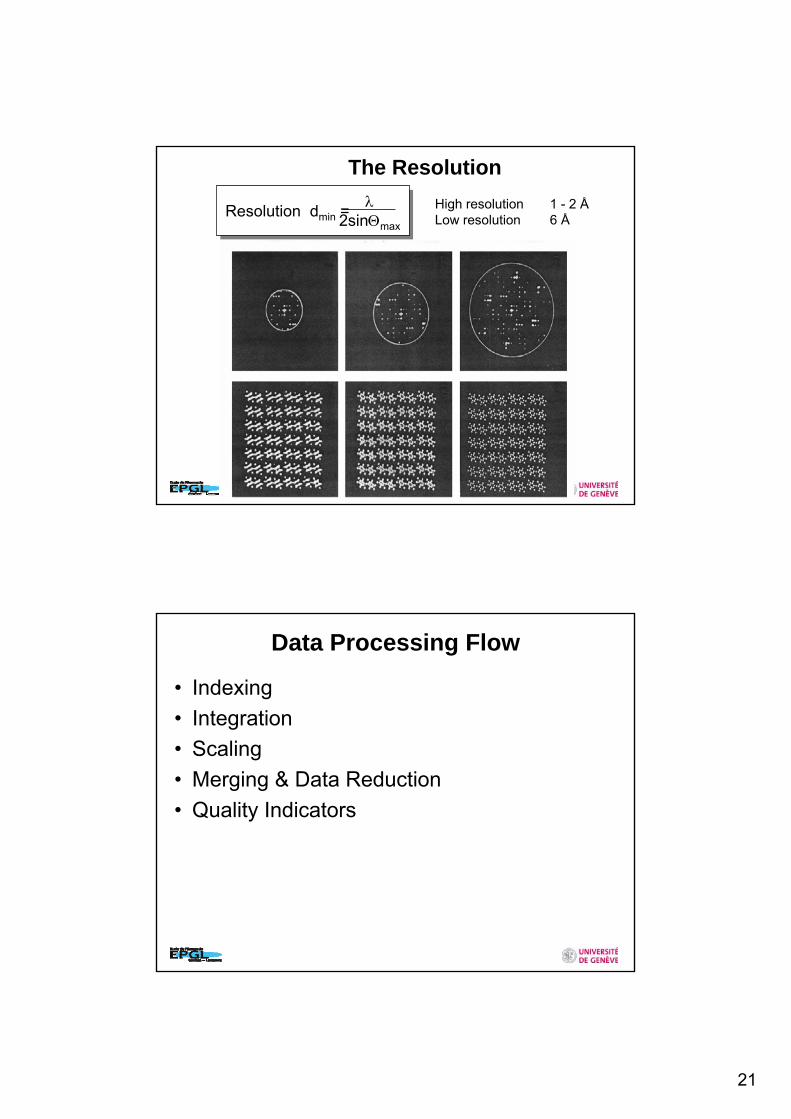
The Phase Problem: Analysis of the diffraction pattern
ρ (x,y,z) = Σ F(hkl) e1V
iΦ(hkl) - 2πi (hx + ky + lz) hkl
Electron density ρ (x,y,z) in the unit cell:
V: Volume of the unit cellF(hkl): Intensity with Index hklh,k,l: Index of diffraction (Miller indices): every combination
h,k,l (z. 3,7,1) corresponds to planes in the atomic lattice
i: Type of atomΦ(hkl): Phases (unknown from the data)
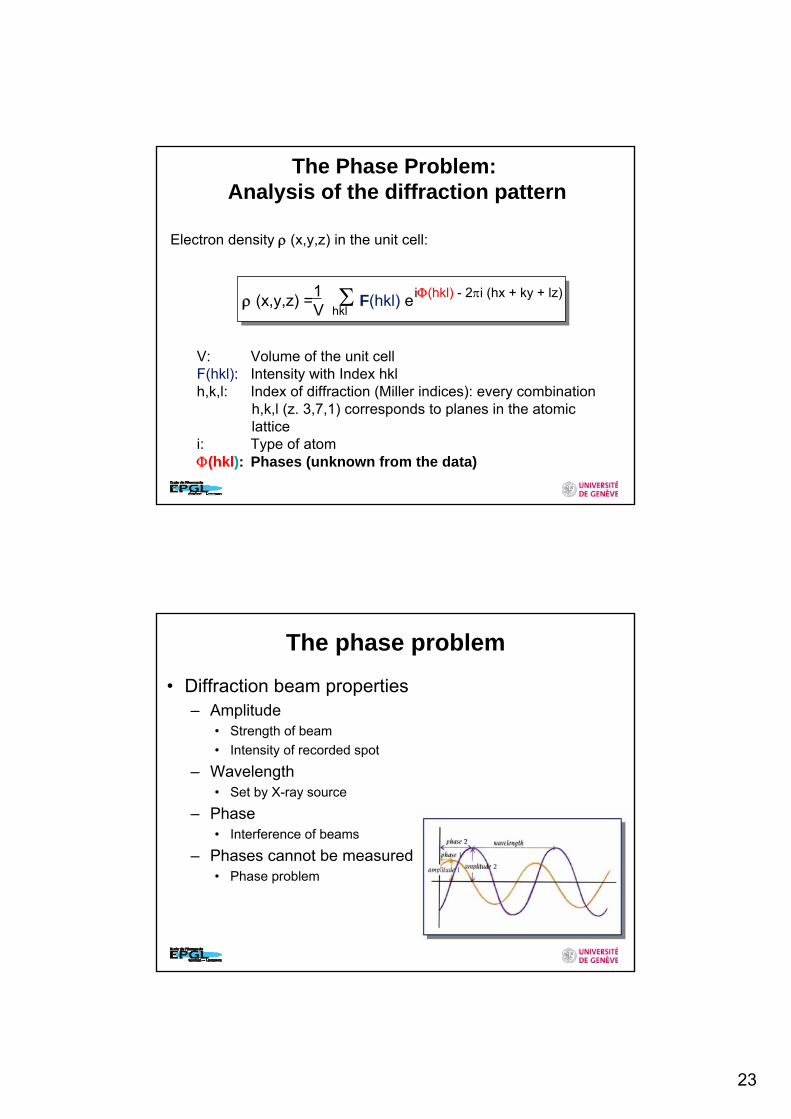
The phase problem
• Diffraction beam properties– Amplitude
• Strength of beam• Intensity of recorded spot
– Wavelength• Set by X-ray source
– Phase• Interference of beams
– Phases cannot be measured• Phase problem

24
Solving the phase problem• Molecular replacement (MR)
– Phases of a similar known protein structure (phasing model) used as estimate of phases of the unknown protein “Easy”
• Anomalous scattering (MAD; multiple wavelength anomalous diffraction)
• Multiple isomorphous replacement (MIR)– Introducing heavy metal ions as new X-ray scatters into crystal– Heavy atoms give strong signals and act as reference atoms– Should not change structure of protein thus Isomorphous structure– Cysteine groups (-SH) can bind metal– Replacing e.g. Zn by Hg– Heavy metals contain more electrons
• Stronger scattering• Diffracted beams more, less, equally intense depending on proximity to
heavy metal
MIR on Lysozyme
Lysozyme native Lysozyme p-chlormercuribenzenesulphonat

25
Solving the phase problem
• Multiple isomorphous replacement (MIR)– Diffractions calculated from these ions only– Intensity differences used to identify positions of heavy
atoms in unit cell– Mathematical calculations (Fourier transformation) lead
to atomic arrangement in space for heavy atoms– From positions of heavy atoms in unit cell calculation of
• Amplitude• Phase contribution to diffracted beam
Solving the phase problem• How can we use this information to solve the phase problem of the
protein?– Known
• Amplitude and phase of heavy atoms• Amplitude of protein• Amplitude of protein + heavy metal
– Unknown• Phase of protein
• Three amplitudes + one phase• Calculation of interference of scattering between protein and heavy
metal– Positive– Negative
• Estimation of protein phase• In practice many such complexes are built to identify correct phase
angle

26
Solution of the structure when phases have been determined
1. The first electron density map ρ (x,y,z) is calculated by means of the Fourier transformation
2. A first model (mostly Alanine model) is built. 3. The introduction of the model gives more information about the
phases α (hkl) and an iterative process of refinement in which a more and more complete model is built is started.
Lysozyme: From electron density to atoms coordinates

27
• Resolution• How well fit the built model into the
experimentally measured density?• Geometry
What are the parameters for assessing the quality of an X-ray structure?
Résolution 1Å
Résolution 4ÅRésolution 3Å
Résolution 2Å
High resolution = more accurate details

28
How well fit the built model into the experimentally measured density?
• R-factors: There are different aspects to validation. Some types of validation look at the fit to the diffraction data. The agreement of observed and calculated structure factors is often measured with the traditional R-factor, which is the average fractional disagreement:
R = Σ(|Fo-Fc|)/Σ(Fo)
• As we have noted several times, it is possible to overfit the data, especially at moderate resolutions. This problem can be circumvented if you use most of the data (working set, 95% of data) to refine the atomic model, and the remaining data (test set, 5% of data) to verify how well you really are doing. The test set data are used to compute R-free, which is computed in the same way as the conventional R-factor but using only that subset of data. If R-free drops, then the model must really have improved because there is (almost) no pressure to overfit R-free. (The word "almost" will be explained in the advanced series.) This idea, called cross-validation in the statistical community, was introduced into crystallography by Axel Brünger and it has made a great contribution to keeping our models honest.
http://www-structmed.cimr.cam.ac.uk/Course/Basic_refinement/Refinement.html
Geometry• Quality of geometry: Other types of validation are
completely model based. One of the first entries was the program Procheck, which evaluates structures on various criteria: are the torsion angles (main chain and side chain) typical of those seen in high resolution protein structures? are the bond lengths, bond angles and van der Waals contacts consistent with the databases? One example of Procheck output is a Ramachandran plot (plot of main-chain torsion angles).
http://www-structmed.cimr.cam.ac.uk/Course/Basic_refinement/Refinement.html
• ProCheck• What_Check• Rotamer• MolProbity

29
Geometry• Position of side chains: A further type of information that
can be used is residue environment preference. Some side chains (e.g. leucine, phenylalanine) are hydrophobic and tend to be buried in protein structures, surrounded by other hydrophobic side chains. Others (serine, asparagine) are hydrophilic and tend to be exposed on the surface or surrounded by other polar groups. If the sequence has become out of register, through an error in tracing the main chain, it can be detected by a series of amino acids being found in unfavourable environments. Such errors can be found by various threading programs, including the Profile program from Eisenberg's group.
http://www-structmed.cimr.cam.ac.uk/Course/Basic_refinement/Refinement.html
Quality indicators
• A well refined crystal structure should have:– R-factor < 0.20, Free-R < 0.27– RMSD bond lengths < 0.02 Å, bond angles < 2°– Only a few outliers in the Ramachandran plot– No large deviation from ideal stereochemistry without a
good reason – Water molecules with reasonable hydrogen bonds and
B-factor

30
Acknowledgement
• Dr. Remo Perozzo (Pharm. Biochemistry, Geneva)• Dr. Dirk Kostrewa (Structural Biology Group, PSI,
Villigen)