Embed Size (px)
Citation preview

宇宙X線観測と放射過程
JPS Meeting 12/09/2012
Kuni MASAIDept. Physics, Tokyo Metropolitan Univ.
宇宙X線観測の50年と物理学へのインパクト
X-ray Astrophysics and Radiation Processes

Non-dispersion Spectroscopy
1970s Hakucho PC Te
1980sTenma GSPC Te
ionizing: nt for given Te1980s
Ginga PC Te
1990s ASCA GSPCCCD
ionizing: nt-Tesynchrotron X
2000s Suzaku CCD recombining: Tz/Te
2010s ASTRO-H CCDCalorimeter
Ti, Vinon-equipartitionnon-Maxwellian

• Bremsstrahlung, Synchrotron Radiation, and Compton Scattering of High-Energy Electrons Traversing Dilute Gases Blumenthal & Gould (RMP, 1970)
• Mechanisms for production of X-rays in a cosmic setting Blumenthal & Tucker (in X-Ray Astronomy, Giacconi & Gursky, 1974)
Elementary processes

• Bremsstrahlung, Synchrotron Radiation, and Compton Scattering of High-Energy Electrons Traversing Dilute Gases Blumenthal & Gould (RMP, 1970)
• Mechanisms for production of X-rays in a cosmic setting Blumenthal & Tucker (in X-Ray Astronomy, Giacconi & Gursky, 1974)
Elementary processes
• Non-LTE level population
• Non-equilibrium Ionization (Tz ≠ Te)
• Non-Maxwellian distribution function
• Non-equipartition (Te ≠ Ti)
• QED processes: γ splitting, etc.

I�(x) � I�(0) + ⇥��
1 + �IP� x
� I�(0) +14⇥
h�nen1C12x
n2
n1� neC12
A21 + neC21� neC12
A21
I�(x) � j�
⇥�� �
1 + �IP� � IP
� (= B�)
n2
n1� C12
C21� B12cuP
�
A21 + B21cuP�
=g2
g1e�h�/kT
��x� 1
ne �A21
Cnn�(� � 1)
optically thick and high density
��x� 1
ne �A21
Cnn�(� � 1)
optically thin and low density
dI�
dx= ���I� + j�
n2
n1=
neC12 + B12cu�
A21 + neC21 + B21cu�Level Population
I⇥(x) = I⇥(0)e���x +j⇥
�⇥(1� e���x)
� =neC21
A21(1� e�h�/kT ) � Z�7 E1: A � Z4
non-E1: A � Z6�10cf.

cz = ��ionve�c�z = ��recve�
�n(net) = P�enet�z
�P�1�n0
Z�
z=0
nz = 1d�n
d(net)= C�n
=
�
���������
�c0 c�1 0 . . . . . . . . . 0c0 �(c1 + c�1) c�2 0 . . . . . . 0...
. . ....
0 . . . cz�1 �(cz + c�z) c�z+1 . . . 0...
. . ....
0 . . . . . . . . . 0 cZ�1 �c�Z
�
���������
�
���������
n0
n1...
nz...
nZ
�
���������
Ionization
det C = 0non-trivial sol. → Equilibrium (EQ)
Solution
EQ time-scale
Harmonic nature
netEQ ��
(cz + c�z)�1 � 1012 cm�3 s
cz � c�z � 1012 cm�3 s
1986ApJ...306..248T
1986ApJ...306..248T
1986ApJ...306..248T
Tenma
ionizingTz < Te
SupernovaRemnants
GSPC
1981ApJ...250..216G
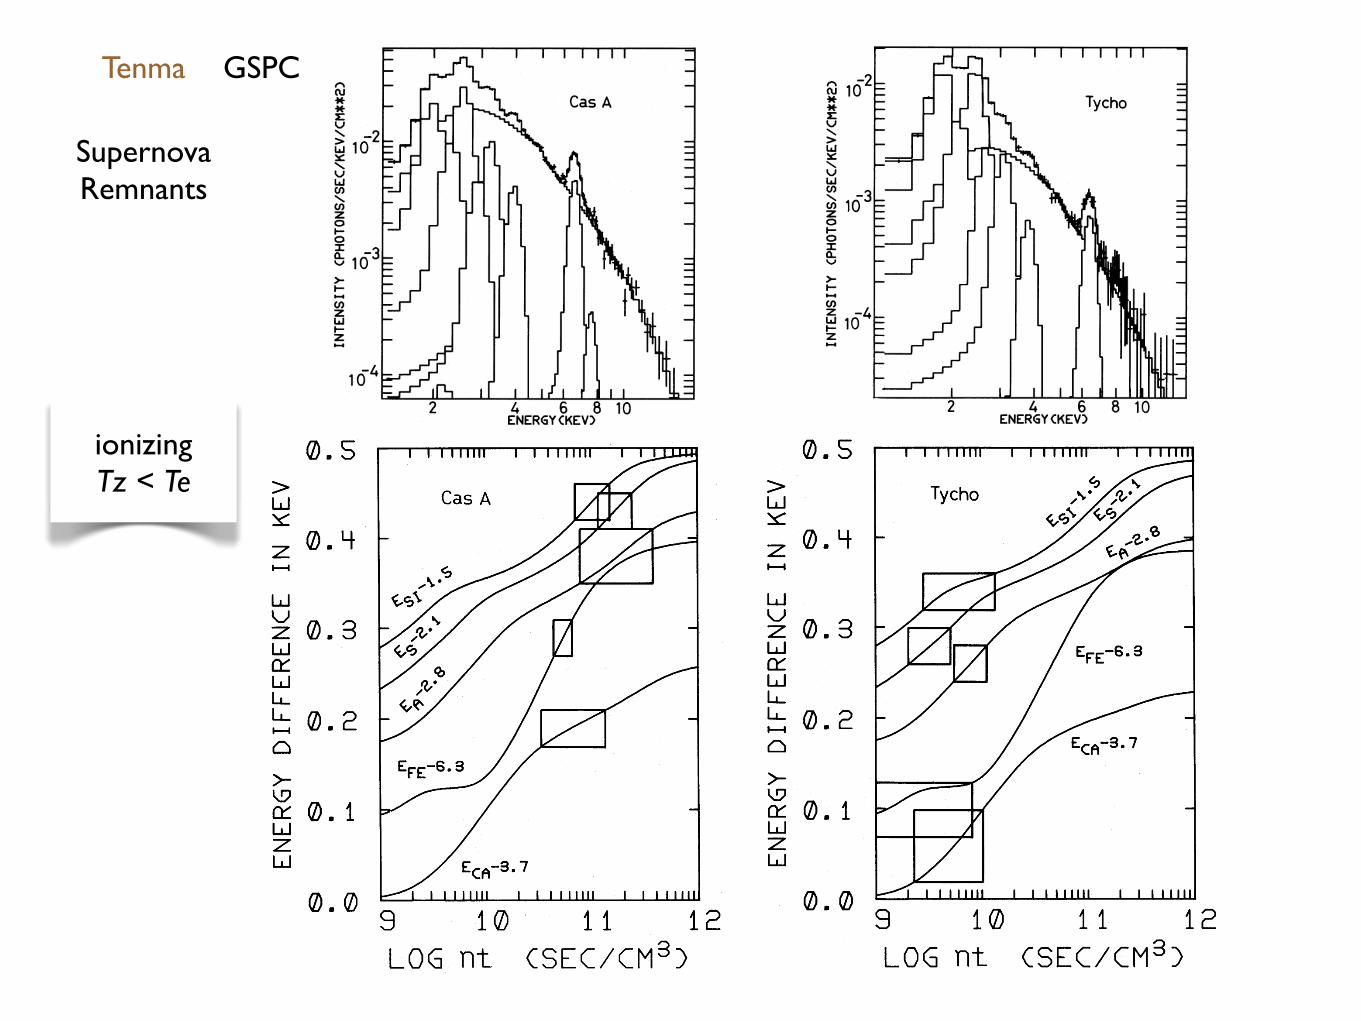
IC443Supernova Remnants
PC
emitted from an ‘‘ overionized ’’ 1.0 keV plasma (i.e., aplasma in which the degree of ionization is larger than thatexpected from the electron temperature assuming CIE).
4. DISCUSSION
4.1. The Plasma Structure of IC 443
ASCA observations have revealed the following new X-ray features of IC 443; (1) the X-ray softness-ratio map
shows a shell-like structure that correlates with the opticalfilaments, implying that the hard X-ray emission is morecentrally concentrated than the soft; (2) the spectra includetwo plasma components with temperatures of 0.2 and 1.0keV, and the intensity ratio of the former to the latter islarger in the outer region than in the inner region.
These results suggest that IC 443 has a plasma structurethat can be modeled by a central hot (1.0 keV) region sur-rounded by a cooler (0.2 keV) shell. The mean electron den-
TABLE 2
Best-Fit Parameters of the Two-PlasmaModel
North Region Center Region
Model Parameter Value 90%Confidence Range Value 90%Confidence Range
Wabsa ................................. NH(1021 cm!2) 7.3 6.7–7.9 7.5 6.9–8.4VGNEI (lowT ) .................. kT (keV) 0.17 015.–0.19 0.18 0.16–0.21
net (1011 cm!3 s) 1.0 0.7–1.5 1.0 0.7–1.5hkTi (keV) 0.44 0.39–0.53 0.51 0.46–0.59
Constant factorb 185 117.–287 48 24.–87VRAYMOND (highT ) ...... kT (keV) 1.09 1.01–1.19 1.06 1.01–1.11
Emissionmeasurec 0.038 0.030–0.046 0.056 0.048–0.064Abundance ......................... O 0.03 0.02–0.04 0.07 0.05–0.10
Ne 0.09 0.08–0.11 0.12 0.10–0.16Mg 0.11 0.09–0.14 0.25 0.19–0.35Si 0.42 0.34–0.52 0.38 0.32–0.47S 0.43 0.35–0.54 0.43 0.38–0.49Ar 0.64 0.39–0.89 0.57 0.41–0.72Fe 0.07 0.05–0.09 0.17 0.14–0.20
Ne xK! .............................. Observed energy (keV) 1.012 1.006–1.018 1.021 1.018–1.025Fluxd 21 18.–26 29 23.–39
Ne xK" .............................. Observed energy (keV) . . . . . . 1.223 1.215–1.231Fluxd . . . . . . 3.1 2.3–4.1
Si xivK! ............................ Observed energy (keV) 2.015 2.002–2.011 2.011 2.002–2.018Fluxd 1.1 0.8–1.4 1.3 1.1–1.6
S xviK! ............................. Observed energy (keV) 2.664 2.641–2.679 2.649 2.630–2.665Fluxd 0.31 0.20–0.42 0.53 0.43–0.64
N/A .................................... #2/dof 160/108 . . . 226/116 . . .
Note.—Each abundance is relative to the solar value and those of two plasma components linked together. The line width of each Gaus-sian profile is fixed to 0.
a Wabs is a model of a photoelectric absorption in XSPEC.b This constant factor is the ratio of the VGNEI emissionmeasure to the VRAYMOND emissionmeasure in XSPEC.c The unit is 4$d2 " 1014 cm!5, where d is the distance to IC 443.d The unit is 10!4 photons cm!2 s!1.
Fig. 7.—SIS spectra of the center (left) and north (right) regions with the best-fit model of Raymond-Smith (dashed line) and three narrowGaussian compo-nents (dotted lines) withNH # 7:4" 1021 cm!2 at energies of 2.2–6.0 keV. The bottom panels show the residuals of the fit, and the minimum values of reduced#2 are 85/70 and 53/59 in the center and north, respectively.
902 KAWASAKI ET AL. Vol. 572
ASCA CCD
Suzaku
2 Yamaguchi et al.
Fig. 1.— Vignetting-corrected XIS image of the northern partof IC 443 in the 1.75–3.0 keV band, shown on a linear intensityscale. The coordinates (R.A. and Dec.) refer to epoch J2000.0.The data from the three active XISs are combined and smoothedwith a Gaussian kernel of ! = 25!!. The yellow square and thewhite rectangle indicate the XIS field of view and the region usedin our spectral analysis, respectively. The optical Digitized SkySurvey image is overplotted in contour.
Fig. 2.— Full-band XIS-FI spectrum where the NXB is sub-tracted. The energies of prominent K" emission lines from specificelements are labeled in the panel.
background (NXB) constructed with the xisnxbgen soft-ware. The spectra were merged to improve the statistics,because the response functions are almost identical eachother. Figure 2 shows the resultant spectrum. We cansee several prominent lines of K! emission from He- andH-like ions (hereafter, He! and Ly!). The centroids ofthe Ly! lines were measured with a Gaussian line model,and compared with the canonical values of the Astro-physical Plasma Emission Database (APED: Smith et al.2001). The averaged center energy di!erence was +4 eV.Therefore, we added a 4 eV o!set in the FI spectrum.The BI spectrum was made with the same procedure asthe FIs, but an o!set of !10 eV was added to correct theenergy scale. In order to examine the ionization statesof Si and S, we hereafter focus on the spectrum in theenergy range above 1.75 keV (Fig. 3). Detailed studiesincluding the lower energies will be reported in a separate
Fig. 3.— (a) XIS spectrum in the 1.75–6.0 keV band. Black andred represent FI and BI, respectively. Individual components of thebest-fit model for the FI are shown with solid colored lines: blue,green, and gray are the VAPEC, Gaussians (Si-Ly", Si-Ly#, S-Ly", and Ar-Ly"), and CXB, respectively. The lower panel showsthe residual from the best-fit model. Two hump-like features areclearly found around the energies of !2.7 keV and !3.5 keV. (b)Same spectrum as (a), but for a fit with RRC components of H-like Mg, Si, and S (magenta lines). The residuals seen in (a) aredisappeared.
paper.We first fitted the spectrum with a model of a thin-
thermal plasma in CIE state (a VAPEC model). Theabundances (Anders & Grevesse 1989) of Si, S, and Arwere free parameters, while the Ca abundance was tiedto Ar. Interstellar extinction was fixed to a hydrogencolumn density of NH = 7"1021 cm!2 with the solar ele-mental abundances, following Kawasaki et al. (2002) andTroja et al. (2008). The cosmic X-ray background (CXB)spectrum was approximated by a power-law model withphoton index of " = 1.412 and the surface brightnessin the 2–10 keV band of 6.4 " 10!8 erg cm!2 s!1 sr!1
(Kushino et al. 2002). Since IC 443 is located in theanti-Galactic center direction, contribution of the Galac-tic ridge X-ray emission was ignored. In the initial fit, Wefound a significant inconsistency between the FI and BIdata around the energy of neutral Si K-edge (1.84 keV).This is due to the well-known calibration issue of theXIS. Since the calibration for the FI CCDs is currentlyfar better than the BI, we decided to ignore the energyband below 1.9 keV in the BI spectrum. This fit leavedfurther large residuals, in both spectra, at the energiesof S and Ar Ly! lines, and hence was rejected with the"2/dof of 935/270.
We, therefore, applied a model of one-temperature
CCD
Tz ~ Te
recombiningTz > Te
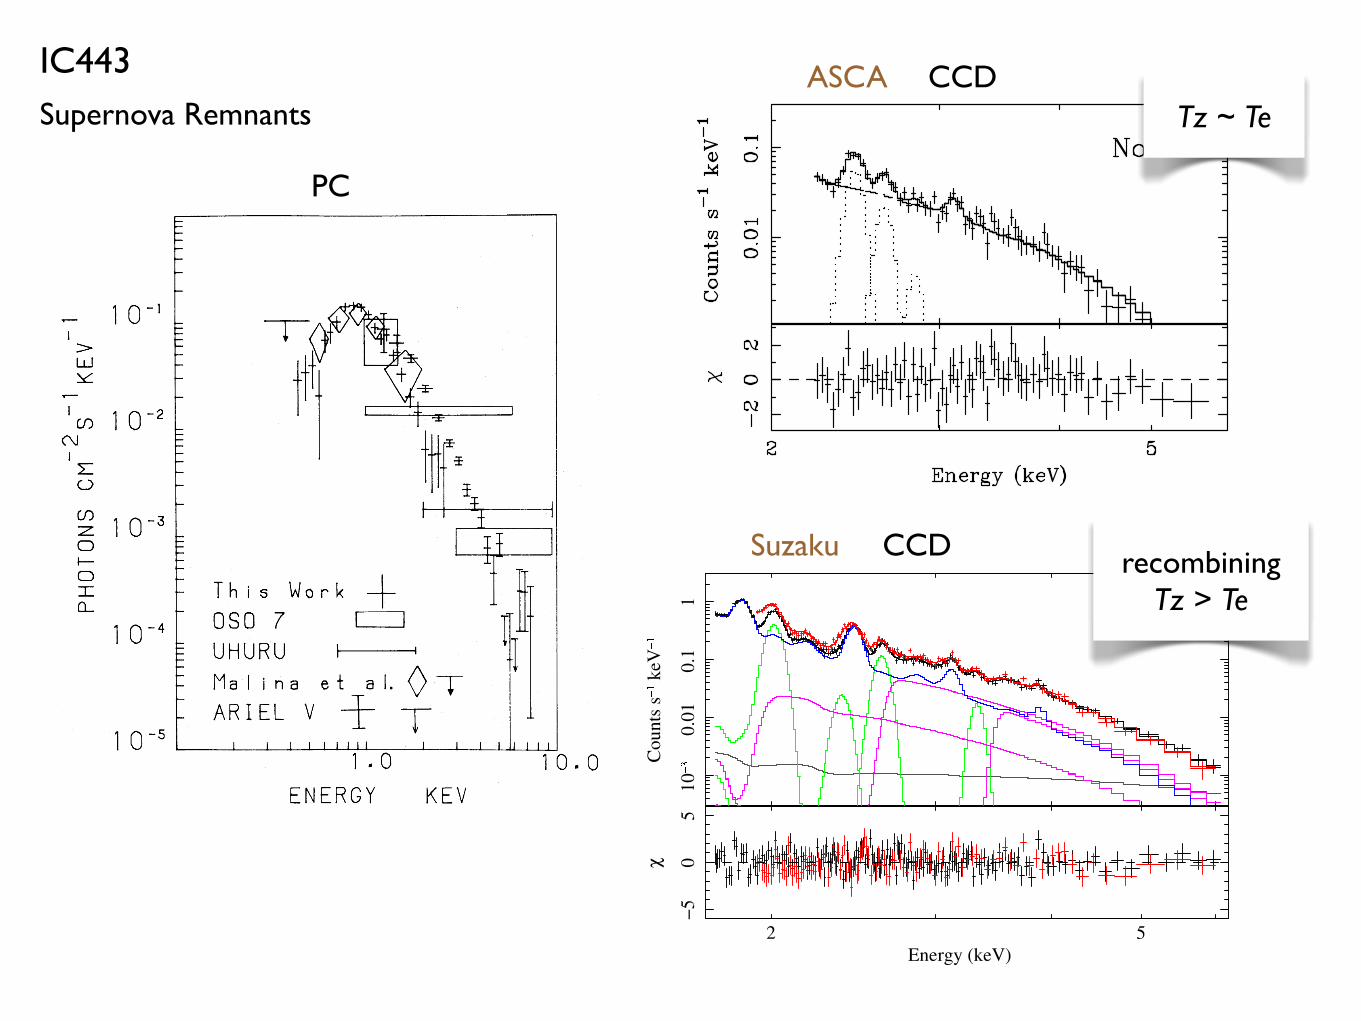
NEI radiationNEI: nonequilibrium ionization
10-23
10-22
10-21
10-20
Radia
tive C
oolin
g R
ate
!
(erg
cm
3 s
-1)
0.01 0.1 1 10
Electron Temperature kTe (keV)
EQI
Ionizing
Recombining
10-17
10-16
10-15
10-14
10-13
Spectr
al Em
issi
vit
y (p
hoto
ns
cm
3 s
-1 k
eV
-1)
1 10
Photon Energy (keV)
integrated emissivityionizing/recombining spectrum
10-23
10-22
10-21
10-20
Radia
tive C
oolin
g R
ate
!
(erg
cm
3 s
-1)
0.01 0.1 1 10
Electron Temperature kTe (keV)
EQI
Ionizing
Recombining
10-17
10-16
10-15
10-14
10-13
Spectr
al Em
issi
vit
y
(photo
ns
cm
3 s
-1 k
eV
-1)
1 10
Photon Energy (keV)
Ionizing
Recombining
EQI

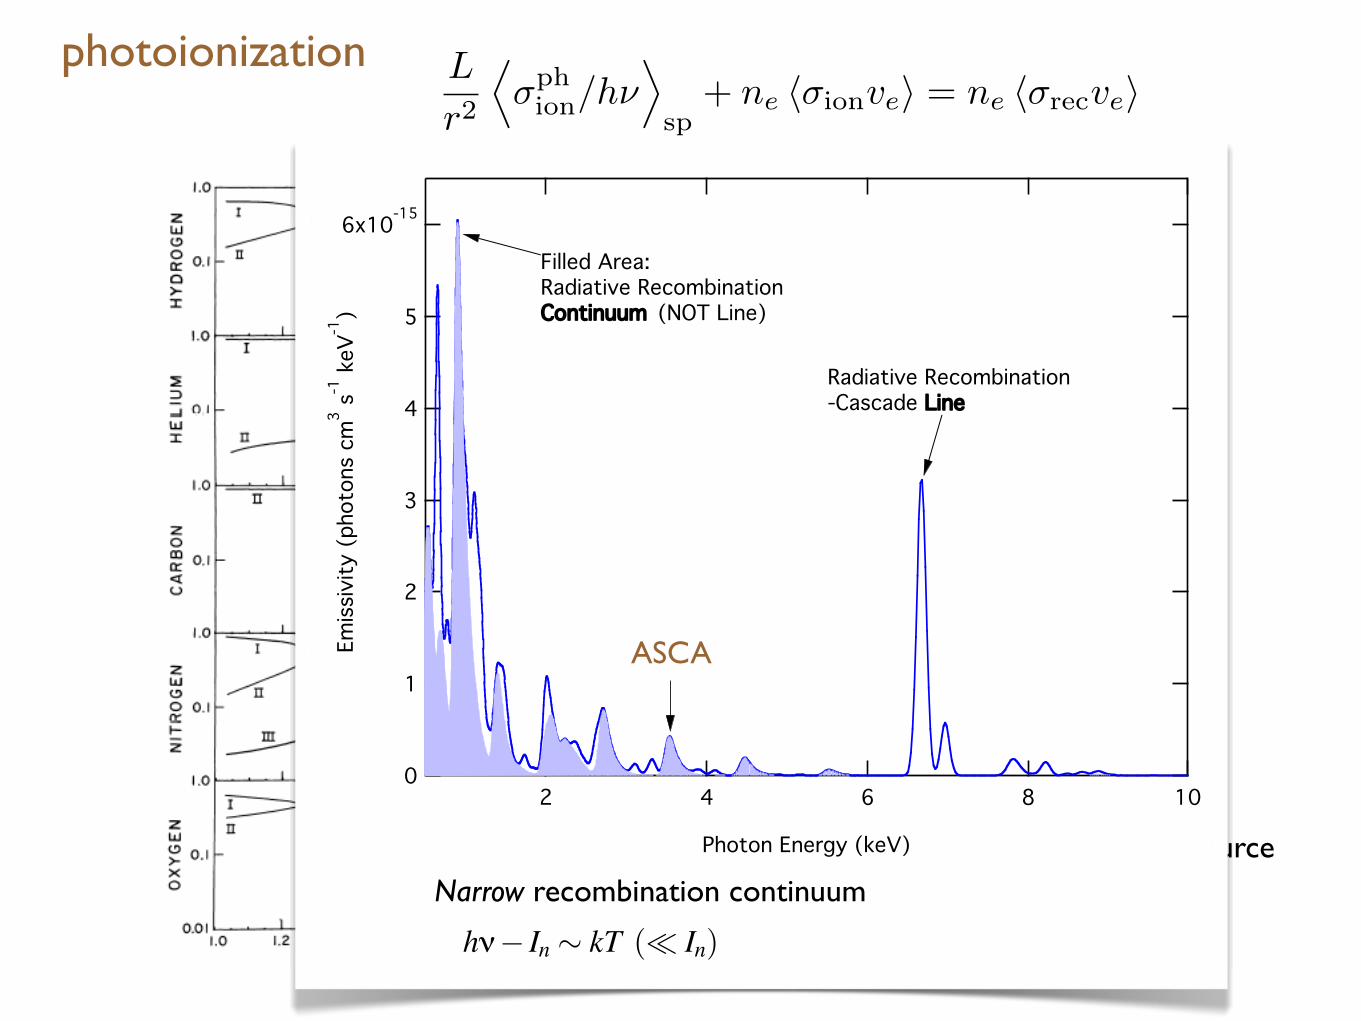
photoionization
→ radiation source� =L
nr2
ionization frontcf. Strömgren sphere
H He II
L
r2
�⇥ph
ion/h��
sp+ ne �⇥ionve� = ne �⇥recve�
photoionization
→ radiation source� =L
nr2
ionization frontcf. Strömgren sphere
H He II
L
r2
�⇥ph
ion/h��
sp+ ne �⇥ionve� = ne �⇥recve�
6x10-15
5
4
3
2
1
0
Em
issi
vit
y (
photo
ns
cm
3 s
-1 k
eV
-1)
108642
Photon Energy (keV)
Filled Area:Radiative RecombinationContinuum (NOT Line)
Radiative Recombination-Cascade Line
1.0
0.8
0.6
0.4
0.2
0.0
x1
0-1
5
5.04.54.03.53.02.52.0
ASCA detectedin Cyg X-3 spectrum
Radiation Spectrum
Narrow recombination continuum
hν� In ⇠ kT (⌧ In)
ASCA

non-EQ emission due to quasi-thermal electrons2nd-order Fermi acceleration
with a constant
A !Z 1
0
x dx
1" x5’ 0:66 ;
where ne is the electron density.It is readily seen from the general solution of equation (5)
that there are three energy ranges in which the distributionfunction has distinct spectra (see Paper I). At energiesE < !#2=5
e kT , the spectrum is described by the Maxwellianthermal distribution
dNth
dE’ ne
2!!!!E
p!!!!!!!!!!!!!!!" kT$ %3
q exp # E
kT
" #: $7%
In the intermediate energy range !#2=5e kT < E < !#2=3
e kT ,the spectrum of thermal particles is strongly distorted by therunaway flux. It has an exponential form that di!ers, how-ever, from the Maxwellian distribution Nth. This spectrumof quasi-thermal particles can be represented as
dNqth
dE’ ne
2!!!!E
p!!!!!!!!!!!!!!!" kT$ %3
q exp # A
!2=5e
!
exp1
3!e
!!!!!!!!!!!!!!!!kT
E
" #3s2
4
3
5 :
$8%
The nonthermal power-law spectrum, at energiesE > !#2=3
e kT , has the form
dNnth
dE’
!!!2
"
rne6
1
!eEexp # A
!2=5e
!
: $9%
Thus, the total spectrum di!ers from the simple sum ofMaxwellian thermal and power-law nonthermal spectrabecause of the component Nqth, which can be seen as anexcess above the equilibrium thermal distribution. As aresult, the spectrum below the energies of nonthermal par-ticles could be interpreted as a two-temperature distributionof electrons. This is, however, an artifact, as discussedbelow.
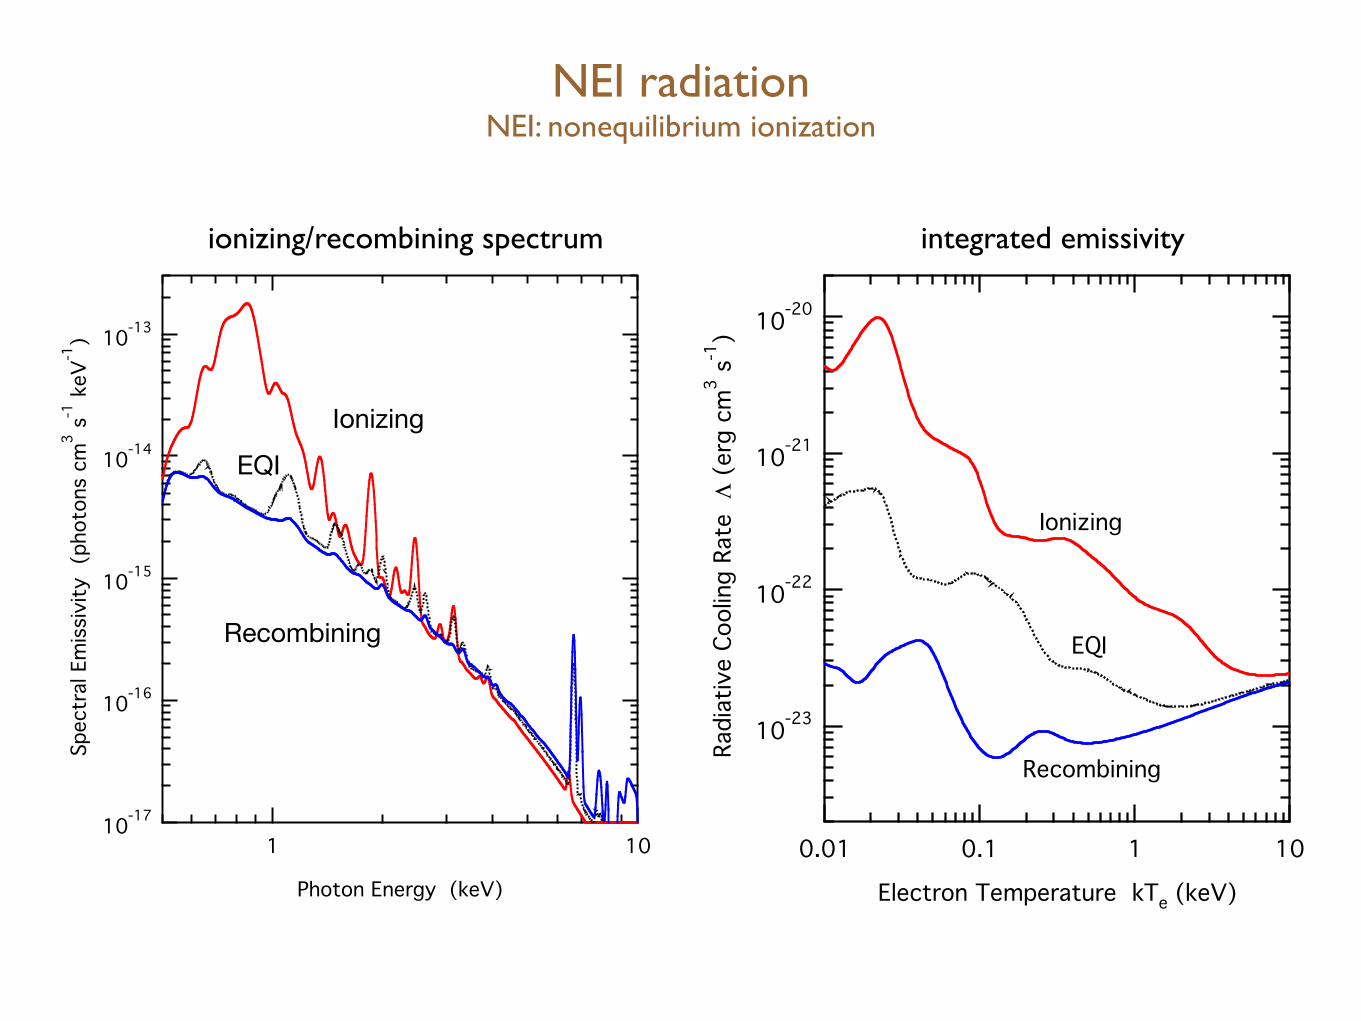
For the Galactic ridge, we consider particle accelerationfrom the equilibrium hot gas of temperature kT ! 0:3 keVand density ne ! 6:5& 10#3 cm#3. The plasma of 0.3 keV isgravitationally stable or bound, since the average escapevelocity from the Galaxy corresponds to the temperature ofabout 0.5 keV. The distribution of the gravitational poten-tial along the Galactic plane is not uniform (Breitschwerdt,McKenzie, & Volk 1991), and the upper limit temperature isa little higher toward the central part of the Galactic disk.The total spectrum of the background and accelerated elec-trons for the gas column density L ! 1020 cm#2 is shown bythe solid line in Figure 2. The distortion of the Maxwelliandistribution due to acceleration is visible as an excess abovethe thermal distribution.
From Figure 2, we see that the suprathermal electrons(excess above the thermal spectrum) cannot be representedby a power-law nonthermal distribution only. Some compo-nent, for example, as shown by the thin dashed line, isneeded to reproduce the spectrum. The missing part of thespectrum, the quasi-thermal component, can be roughlyrepresented by aMaxwellian distribution with e!ective tem-perature kT' ( 1:3 1:5 keV, which is 4–5 times higher thanthe real gas temperature kT ! 0:3 keV. It should, however,be emphasized that the quasi-thermal spectrum is never
Maxwellian. This implies that the thermal emission fromthe plasma could be mimicked with a two-temperatureplasma of T and T' ( $4 5%T , but such modeling leads to awrong interpretation for the plasma component of T'.
Using the solution of equation (5), we calculated brems-strahlung to compare with the observed hard X-ray flux andspectrum (Valinia et al. 2000a) and determined the charac-teristic time of stochastic acceleration for various values ofthe ridge gas column density (see Paper I). Thus, the elec-tron density is derived as a function of !e for the columndensity. For the medium at 0.3 keV, the quasi-thermal com-ponent is found to extend up to a few tens of keV, dependingon the density. Unlike nonthermal electrons, the quasi-thermal electrons interact e!ectively with the backgroundplasma through Coulomb collisions. Accordingly, theplasma is found to deviate from the equilibrium state oftemperature kT ! 0:3 keV. This situation is crucial forunderstanding the line emission from the Galactic ridge.
3.2. Nonequilibrium Emission due toQuasi-thermal Electrons
The contribution of quasi-thermal electrons could be rep-resented roughly by a thermal plasma of 4–5 times the bulktemperature. However, such an approximation is inad-equate to calculate the line spectra. Actually, in Figure 2one can see that a single Maxwellian never reproduces thelow- and/or high-energy parts of the quasi-thermal compo-nent. Therefore, in the following we employ the originalelectron spectrum (Fig. 2, solid line) to calculate the ioniza-
10-7
10-6
10-5
10-4
10-3
10-2
Ele
ctr
on
De
nsity (
cm
-3 k
eV
-1)
0.1 1 10 100
Electron Energy (keV)
Thermal 0.3 keV
1.4 keV Maxwellian
Nonthermal Power-law
Fig. 2.—Energy spectrum of electrons in situ accelerated in gas ofkT ! 0:3 keV with column density L ! 1020 cm#2. This spectrum (solidline) does not consist simply of the bulk thermal part of 0.3 keVMaxwellianand the nonthermal part of power law; their sum is represented by the thickdotted line. The power-law spectrum here is drawn through the low-energyend, but this does not mean that it really extends to such low energies. If wetry to reproduce the intermediate missing component with a Maxwelliandistribution, we have its temperature being 1.3–1.5 keV. The thick dashedline represents the sum of the above two and the mimic 1.4 keVMaxwellian.
No. 2, 2002 DIFFUSE GALACTIC RIDGE X-RAY EMISSION. II. 1075
distribution fn.
tion and radiation processes. Moreover, we take intoaccount the interaction between the thermal particles andthe quasi-thermal electrons. It should be noted that thespectrum shown in Figure 2 does not apply to the ions,which are not accelerated but have a Maxwellian distribu-tion of 0.3 keV.
The quasi-thermal component is generated from the elec-trons that are accelerated but a!ected by Coulomb colli-sions; otherwise, the electrons would continue to undergothe acceleration process to form a power-law spectrum.Note that the collision frequency depends on the particleenergy as E!1.5. Therefore, collisions are important for thequasi-thermal electrons, and their interaction with the bulkplasma naturally results in nonequilibrium emission. This isconsistent with the analysis of the Galactic ridge X-ray spec-trum by Kaneda et al. (1997), who noted that the plasmawas in ionizing nonequilibrium. Our calculations show thationizing nonequilibrium dominates overall, but also thatrecombining characteristics are found partly in the spec-trum, because a fraction of the bulk ions are ionized furtherby the quasi-thermal electrons and capture slow electrons inthe bulk plasma. Thus, the nonequilibrium spectra of theridge emission are a little di!erent from those of typicalyoung SNRs, which exhibit entirely ionizing characteristics.
As a result, the radiation spectrum is not represented bythe simple sum of thermal bulk and quasi-thermal compo-nents, as demonstrated in Figure 3. It is also seen that thespectrum of the quasi-thermal component, labeled ‘‘ Quasi-Thermal ’’ in Figure 3, di!ers from that of an equilibrium
plasma. This reflects the non-Maxwellian distribution ofquasi-thermal electrons. As seen from the figure, the interac-tion, or nonequilibrium, e!ect enhances the recombinationcontinua, as well as bremsstrahlung, and significantly altersthe line intensity ratio and the resultant line profile.
For instance, the iron line feature is expected to be broad-ened, compared to the simple sum. The quasi-thermal elec-trons, which have higher energies than bulk electrons,impact on iron ions of the bulk plasma and produce satellitelines by inner-shell excitation/ionization. This is a typicale!ect in an ionizing plasma and for iron results in lines at6.4–6.6 keV, where the lower bound depends on the bulkplasma temperature. Highly ionized iron produced by ion-ization due to suprathermal electrons emits K lines by com-mon processes in hot plasmas, such as (quasi-thermal)electron impact excitation. In addition, in the present casethe iron ions capture bulk electrons and emit K linesthrough a recombination cascade. Because of quasi-thermalelectrons, "0.2% of background iron is ionized to bee+25, i.e., H-like and bare nuclei that can emit K lines byelectron capture. Then a recombination continuum isaccompanied by the cascade K line in the spectrum, as seenin Figure 3. This is an e!ect of recombining nonequilibriumand results mainly in 6.6–7 keV lines, including He-like(6.70 keV) and H-like (6.97 keV) resonance lines, becausefree electrons are captured into nd#2IH=3kT$1=2z "4 / n!3, and e!ectively into n % 2 (see Masai 1994;Nakayama & Masai 2001). Since these nonequilibriume!ects enhance specific lines, the profile of lines becomesdi!erent from that of an equilibrium plasma.
It is important to note that the K lines of highly ionizediron and the hard continuum, which could not be expectedto be emitted by a thermal plasma with temperature 0.3keV, are produced by interaction of the iron ions with acomparatively small population of quasi-thermal electrons(Fig. 2). The above processes work on other heavy elementsas well. One can see many recombination edges on the none-quilibrium continuum spectrum in Figure 3. We applied anonequilibrium radiation code based on Masai (1994) tocalculate the ionization/recombination and emission proc-esses for the non-Maxwellian electron distribution. The 15major elements, H, He, C, N, O, F, Ne, Mg, Al, Si, S, Ar,Ca, Fe, and Ni, are taken into account for the process, withcosmic abundances (Allen 1973).
3.3. Soft X-Ray Spectrum of the Galactic Ridge Emission
The radiation from the nonequilibrium plasma is a!ectedfurther by the presence of nonthermal electrons. Although,unlike the quasi-thermal electrons, the nonthermal electronshardly interact with the background plasma, their incidenceon the plasma produces inner shell vacancies in the ions,and this results in fluorescence lines. This is the same processconsidered by Valinia et al. (2000a) for the 6.4 keV iron Kline due to low-energy cosmic-ray electrons. We take intoaccount the process by nonthermal electrons and obtain thespectrum expected from the in situ acceleration in theGalactic ridge.
In Figure 4a is shown the soft X-ray spectrum for aninterstellar medium of temperature 0.3 keV with gas columndensity L % 1020 cm!2 and density ne % 6:5& 10!3 cm!3. Itis predicted that the metal K lines are as intense as those ofhot plasmas of order of keV, much higher than the real gastemperature 0.3 keV. Also predicted is a broad line feature
10-26
10-25
10-24
10-23
10-22
10-21
10-20
10-19
10-18
10-17
10-16
Volu
me E
mis
siv
ity (
photo
ns c
m-3
s-1
keV
-1)
1 10
Photon Energy (keV)
Thermal 0.3 keV
Quasi-Thermal
simple sum interactive (NEQ)
Fig. 3.—Spectral volume emissivity due to the thermal and quasi-thermal electron components formed by in situ acceleration from thethermal plasma of 0.3 keV. The spectrum of the quasi-thermal component,labeled ‘‘ Quasi-Thermal,’’ means the spectrum of the emission from thefraction ionized by quasi-thermal electrons. Interactions of the quasi-thermal electrons with the bulk ions produce a spectrum di!erent from thesimple sum of those of the thermal and quasi-thermal components. Theinteractive emission spectrum exhibits features of nonequilibrium (NEQ)plasma.
1076 MASAI ET AL. Vol. 581
radiation
NOT thermal + nonthermal NOT simple superposition
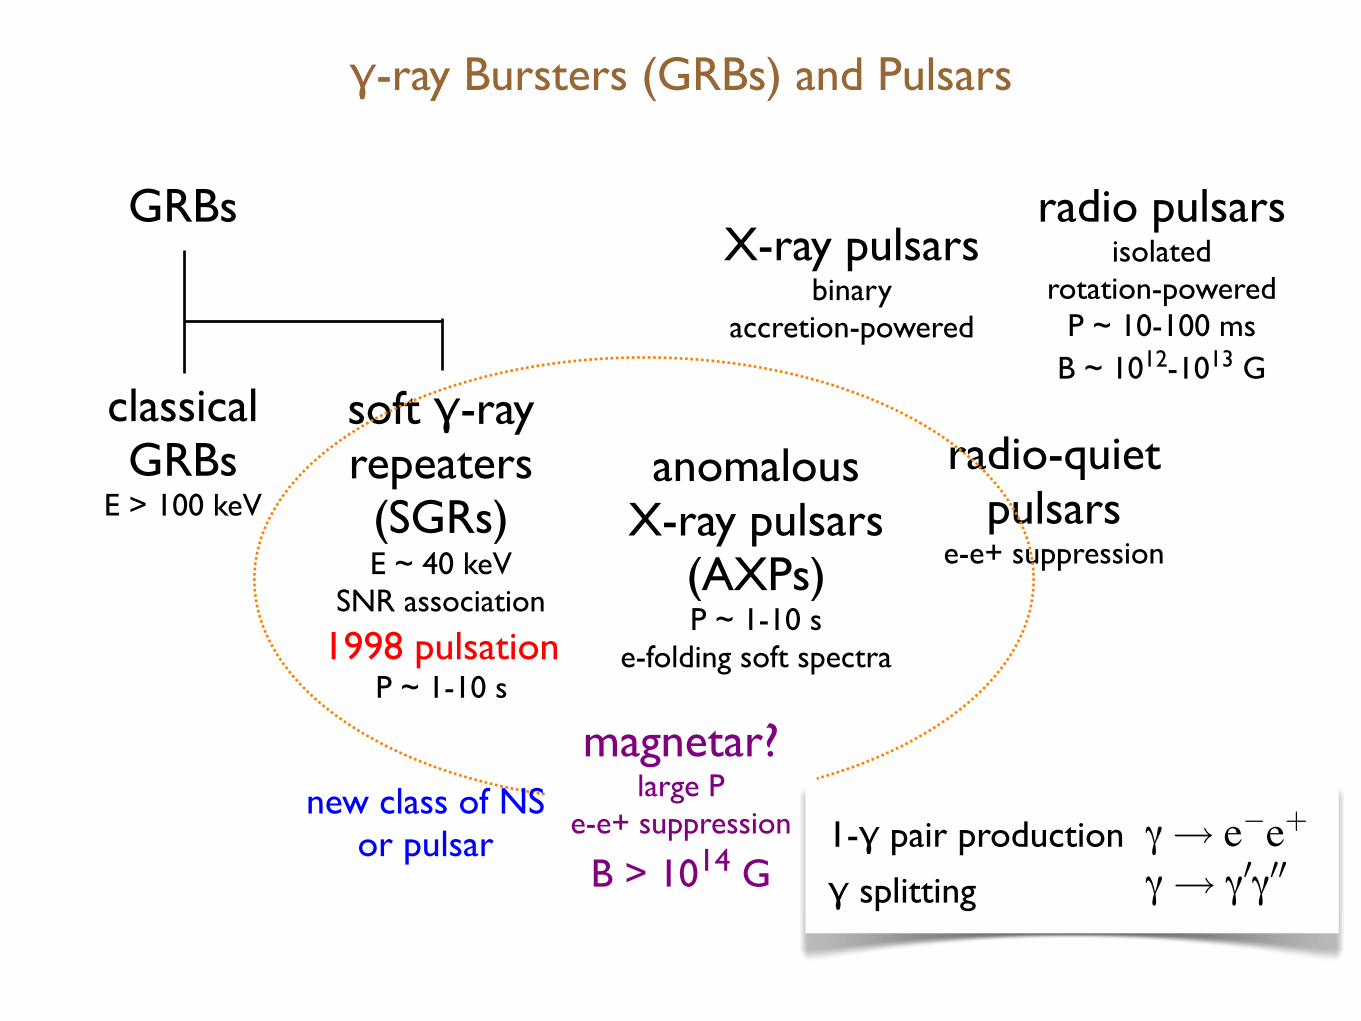
γ-ray Bursters (GRBs) and Pulsars
GRBs radio pulsarsisolated
rotation-poweredP ~ 10-100 ms
B ~ 1012-1013 G
X-ray pulsarsbinary
accretion-powered
radio-quietpulsars
e-e+ suppression
anomalousX-ray pulsars
(AXPs)P ~ 1-10 s
e-folding soft spectra1998 pulsationP ~ 1-10 s
classicalGRBs
E > 100 keV
soft γ-rayrepeaters(SGRs)E ~ 40 keV
SNR association
magnetar?large P
e-e+ suppression
B > 1014 G
new class of NSor pulsar 1-γ pair production
γ splitting
γ! e�e+γ! γ0γ00
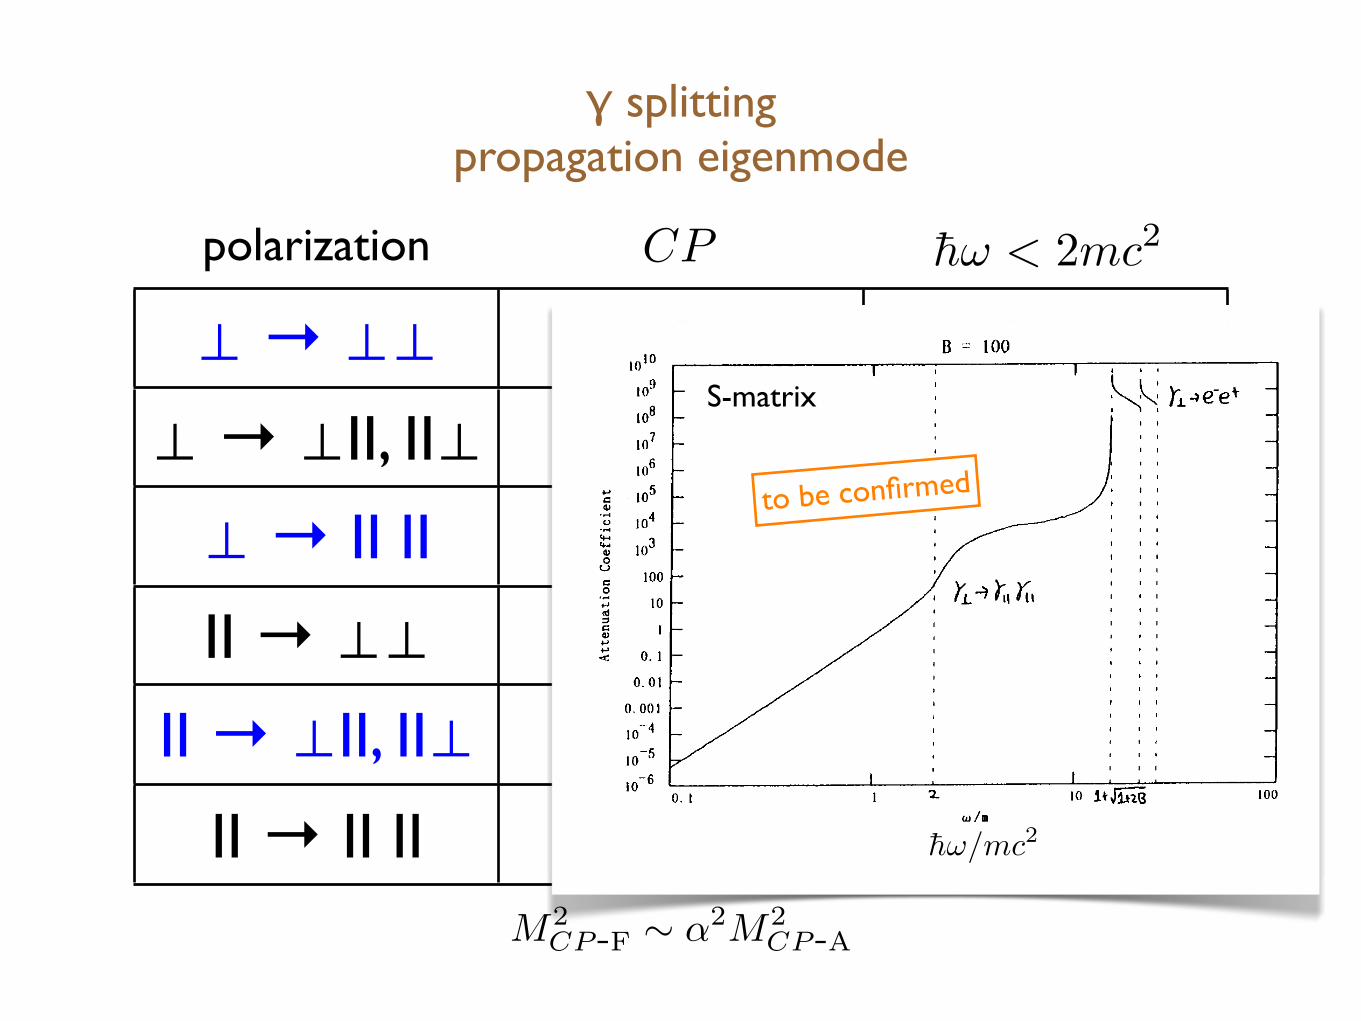
⊥ → II II propagation eigenmode:CP-allowed and dominates at h! < 2mc
2
virtual e-e+ in Landau state
γ splitting (cf. Furry’s theorem)
mean free path !! ! !"

γ splittingpropagation eigenmode
⊥ → ⊥⊥ A No
⊥ → ⊥II, II⊥ F Yes
⊥ → II II A Yes
II → ⊥⊥ F No
II → ⊥II, II⊥ A No
II → II II F No
CP h! < 2mc2
M2CP -F ! !
2M
2CP -A
polarization
γ splittingpropagation eigenmode
⊥ → ⊥⊥ A No
⊥ → ⊥II, II⊥ F Yes
⊥ → II II A Yes
II → ⊥⊥ F No
II → ⊥II, II⊥ A No
II → II II F No
CP h! < 2mc2
M2CP -F ! !
2M
2CP -A
polarization
h!/mc2
S-matrix
to be confirmed