Embed Size (px)
Citation preview

ED 312 827
AUTHORTITLE
INSTITUTION
SPONS AGENCY
PUB DATEGRANTNOTEPUB TYPE
EDRS PRICEDESCRIPTORS
IDENTIFIERS
ABSTRACT
DOCUMENT RESUME
EC 221 285
Rossi, Robert J.Project MAP: Model Accountih, Plan for SpecialEducation. Final Report.American Institutes for Research in the BehavioralSciences, Palo Alto, Calif.Special Education Programs (ED/OSERS), Washington,DC.
Apr 89G00853020553p.
Reports - Descriptive (141)
MF01/PC03 Plus Postage.Cost Estimates; Data Analysis; Data Collection;Demonstration Programs; *Disabilities; ElementarySecondary Education; *School Accounting; *SchoolDemography; *Special Education; Special Programs;Student Costs*Model Accounting Plan
The Model Accounting Plan (MAP) is a demographicaccounting system designed to meet three major goals related toimproving planning, evaluation, and monitoring of special educationprograms. First, MAP provides local-level data for administrators andparents to monitor the progress, tr,Asition patterns, expectedattainments, and associated costs Gf students in special education.Second, MAP facilitates the aggregation of local data to informdecisions about special education at the state and national levels.Finally, the project has encouraged positive change in the way thatdata for special education are reported and used. Two articlesarising from the project are appended. They are: "A DemographicAccounting System to Inform Educational Policy: Genesis,Dissemination, and Limited Acceptance" (Robert Rossi and PhyllisDuBois) and "Computer-Generated Educational Data: Nuisance orOpportunity?" (Phyllis DuBois and Robert Rossi). (PB)
******************************************************x****************Reproductions supplied by EDRS are the best that can be made
from the original document.**********************************************************************

American Institutesfor Research
42903
Project MAP: Model Accounting Planfor Special Education
Final Report
Robert J. RossiPrincipal Investigator
Phyllis A. DuBoisProject Director
April 1989
IU.S. DEPARTMENT OF EDUCATION
°lice of Educational Research and -nprovernent
EDUCATIONAL RESOURCES INFORMATIONCENTER (ERIC)
Cdnrs document has been reproduced asreceived from the person Or organizationoriginating it
O Minor changes have been made to improvereproduction OnablY
Points of new or opinions staled in this docu-meet do not necessarily represent officialOERI position or policy
P.O. Box 1113Palo Alto, CA 94302(415) 493.3550
BEST COPY AVAILABLE

....=. r %
42903
Project MAP: Model Accounting Planfor Special Education
Final Report
Robert J. RossiPrincipal Investigator
Phyllis A. DuBoisProject Director
April 1989
0
1

Table of Contents
Page
Executive Summary
Introduction 1
Goal One 1
Demographic Accounting System: An Overview 2Demographic Accounting System: Specifics 2The MAP Matrix 3Cost Estimates 6Illustration of MAP Sequences 9Summary: Goal One 13
Goal Two 13
Example of MIS Sequence 15Aggregation of Data 16Summary: Goal Two 17
Goal Three 18
Dissemination 18Perceived Problems in Dissemination and Implementation 19Summary: Goal Three 20
Recommendations 22
References 23
Appendix A: Article Submitted to the Journal of the AmericanStatistical Association: "A Demographic Accounting SystemTo Inform Educational Policy: Genesis, Dissemination,and Limited Acceptance"
Appendix B: Article Submitted to Educational Technology:"Computer-Generated Educational Data: Nuisance orOpportunity?"

Executive Summary
The American Institutes for Research (AIR) developed the Model Accounting Plan(MAP), a demographic accounting system to meet three important goals related toimproving planning, evaluation, and monitoring of special education programs:
1. MAP provides local-level data for administrators and parents to monitorthe progress, transition patterns, expected attainments, and associated costsof students in special education. MAP is based on a four-dimensional 9 x 9 x3 x 4 matrix that differentiates status by type of handicap, age, instructionalsetting assignment, and post-graduation attainment. It also includes costestimates based on national-level data.
2. MAP facilitates the aggregation of local data to inform decisions aboutspecial education at the state and national -levels. MAP includes amanagement information system to ensure that any school system can useMAP and that everyone collects the same data. Data in three widelydifferent forms were examined to determine the feasibility of aggregation ofdata in MAP. Aggregation is possible but, as is true with any aggregation, itcan be done only as finely as its poorest, or least descriptive, data source.
3. The project has encouraged positive change in the way that data for specialeducation are reported and used. Numerous meetings and conversationshave been held with administrators, special education teachers, and othereducators in California; descriptions of MAP have been appeared innewsletters; articles about MAP have been published in two journals. Twoother journal articles have been submitted for publication, one oninvitation. All requests for additional information have been answeredwith demonstration diskettes and MAP reports.
Our experience in developing MAP has led to the following recommendations:
Data quality can only be ensured at the local level, and so it is at this levelthat staff development resources to improve data systems must be allocated.
Efforts must be made to capture the imagination of local school personneland to motivate them to improve their skills in collecting and using data.
Data requirements need to be made more consistent at the national andstate levels.
The Model Accounting Plan demonstrates the feasibility and usefulness of a
demographic accounting system applied to special education. Acceptance andsupport from local-level educators is critical for such a system to realize its potential.
5
1
Introduction
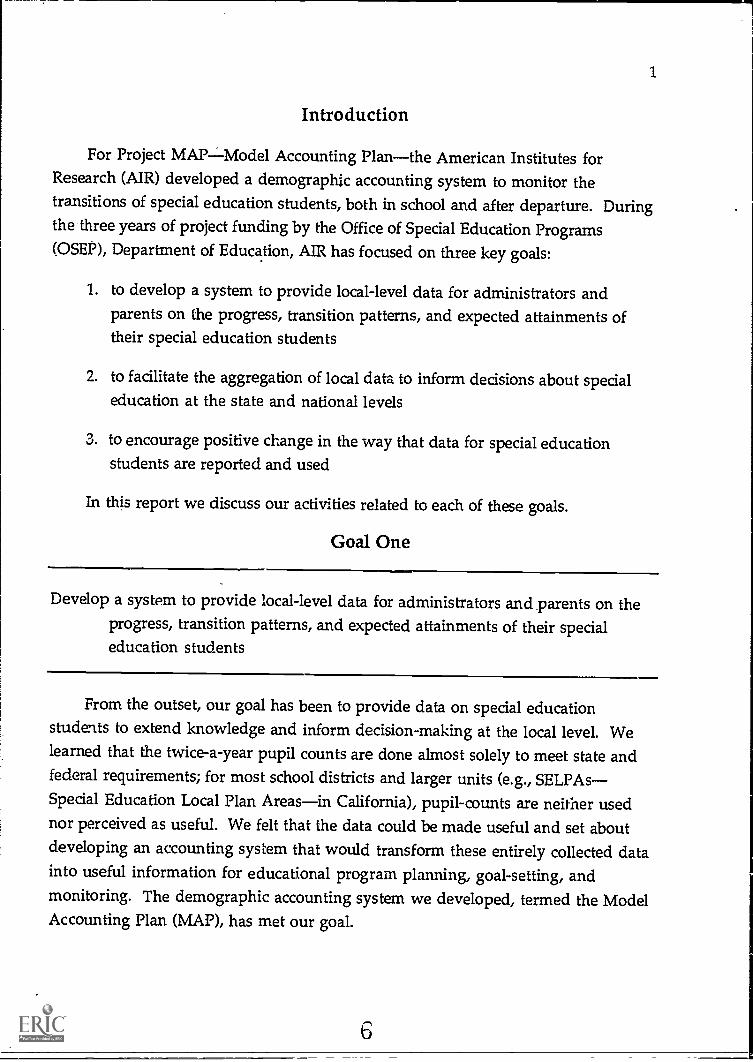
For Project MAPModel Accounting Planthe American Institutes forResearch (AIR) developed a demographic accounting system to monitor thetransitions of special education students, both in school and after departure. Duringthe three years of project funding by the Office of Special Education Programs(OSEP), Department of Education, AIR has focused on three key goals:
1. to develop a system to provide local-level data for administrators andparents on the progress, transition patterns, and expected attainments oftheir special education students
2. to facilitate the aggregation of local data to inform decisions about specialeducation at the state and national levels
3. to encourage positive change in the way that data for special educationstudents are reported and used
In this report we discuss our activities related to each of these goals.
Goal One
Develop a system to provide local-level data for administrators and parents on theprogress, transition patterns, and expected attainments of their specialeducation students
From the outset, our goal has been to provide data on special educationstudents to extend knowledge and inform decision-making at the local level. Welearned that the twice-a-year pupil counts are done almost solely to meet state andfederal requirements; for most school districts and larger units (e.g., SELPAsSpecial Education Local Plan Areasin California), pupil-counts are neither usednor perceived as useful. We felt that the data could be made useful and set aboutdeveloping an accounting system that would transform these entirely collected datainto useful information for educational program planning, goal-setting, andmonitoring. The demographic accounting system we developed, termed the ModelAccounting Plan (MAP), has met our goal.
6

2
Demographic Accounting System:. An Overview
A demographic accounting system minimally requires that the status of apopulation be measured twice: at the beginning and at the end of a standard period,such as a year. What is important is that the status of all members of the populationpresent at the beginning of the period be accounted for at the end of the period Incarrying out a series of these "accounts" (e.g., for successive years), the populationwhose status must be measured at the end of each period is comprised of twogroups: (1) those persons who were present at the initial time point and haveremained continuously in the population, and (2) any persons who entered thepopulation after the initial time point and were present at the start of one of theaccounting periods included in the series.
The MAP for special education is a demographic accounting system thatminimally requires two status-measurements of students enrolled in specialeducation programs (e.g.,.at the start of two successive school years). All studentspresent at the beginning of the period, in this case Year 1, must be accounted for atthe end of the period, in this case Year 2. The information gathered in this way (i.e.,at these two time points) on classroom assignments or levels of achievementdescribes the patterns of educational experience and educational performance thatwere followed by these students during the one school year.
If carried on over time, i.e., for several successive years, this system of accountscan describe the patterns of experience and performance followed by specialeducation students during their public school careers If extended beyond the schoolsetting, to the worlds of work and independent living, such a system can describethe relationships between in-school attainments and post-school experiences. MAPis thus a powerful tool for assessing the efficacy of special education programs interms of the transition process.
Demographic Accounting System: Specifics
The individuals included in a demographic accounting framework may bedivided into categories, or states, based on descriptive information, such as
instructional setting. A particular sample of these individuals may be representedby the proportions pi, where i describes the various categories or states of theframework. A row of pi's is a vector of proportions and may be denoted by V.
I '1

3
By accounting for the movements of students into, out of, and within specialeducation programs, and after graduation, one can establish transitionprobabilities: measures of the likelihood with which individuals move amongstates of the system within the specified period. For example, for students enrolledin Resource Programs (RPs), we can use the transition probability to estimate thelikelihood of their remaining in RPs, moving to Specific Instructional Services(SISs), or being mainstreamed the next year. Students moving from state i at thebeginning of the period to state j by the end of the period are described by theproportions pii. For instance, if 10 of 50 students in a Self-Contained Class (SCC)
move to an RP, the transition probability is .2, since 10/50 = .2. A matrix of all theNits, denoted by the symbol P, thus shows the transitions made by all students
included in the accounting during the period covered by the account.
Expected attainments are derived from transition probabilities by multiplyingthe matrices (Ps) developed each year for several years in a rowthe number ofyears for which matrices are available thus determines the period over whichexpectancies may be estimated. This limitation poses a serious constraint on anydemographic accounting system, however, namely that the power of the system isdependent on a potentially long-term data collection requirement. A solution to theproblem would be to determine through empirical test the stability of the transitionsfor any matrix P. If found to be stable from one year to the next, expectedattainments could be obtained through successive multiplications or powers of asingle transition probability matrix, with multiplication starting from a base yearand continuing for one or more years into the future. For example, to determinethe proportion of students described by vector V who will be in various states after nyears, one calculates VPn, the distribution at the start times the matrix of transitionprobabilities raised to the power n.
The MAP Matrix
After decidingdeciding to develop such a system, we had to decide
what sample to usewhat time periods to monitorwhat education-related states to includewhat tests to perform to establish the stability of transitions over time
C.)
4
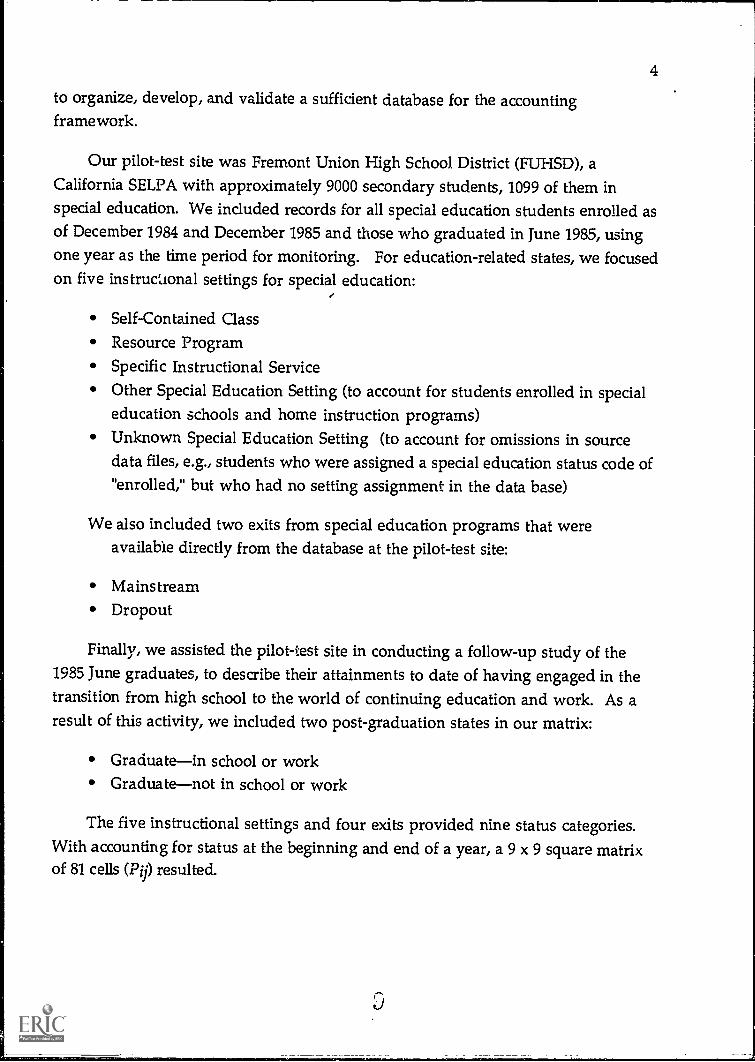
to organize, develop, and validate a sufficient database for the accountingframework.
Our pilot-test site was Fremont Union High School. District (FUHSD), a
California SELPA with approximately 9000 secondary students, 1099 of them inspecial education. We induded records for all special education students enrolled asof December 1984 and December 1985 and those who graduated in June 1985, usingone year as the time period for monitoring. For education-related states, we focusedon five instructional settings for special education:
Self-Contained ClassResource ProgramSpecific Instructional ServiceOther Special Education Setting (to account for students enrolled in specialeducation schools and home instruction programs)Unknown Special Education Setting (to account for omissions in sourcedata files, e.g., students who were assigned a special education status code of"enrolled," but who had no setting assignment in the data base)
We also included two exits from special education programs that wereavailable directly from the database at the pilot-test site:
MainstreamDropout
Finally, we assisted the pilot-test site in conducting a follow-up study of the1985 June graduates, to describe their attainments to date of having engaged in thetransition from high school to the world of continuing education and work. As aresult of this activity, we included two post-graduation states in our matrix:
Graduatein school or workGraduatenot in school or work
The five instructional settings and four exits provided nine status categories.With accounting for status at the beginning and end of a year, a 9 x 9 square matrixof 81 cells (PO resulted.

5
We then grouped handicapping conditions according to similarities of theirtransition probabilities, creating three categories:
Orthopedic Disabilityincluding orthopedically handicapped and otherhealth impaired
Learning Disabilityincluding specific learning disability, severe languagehandicap, and hard of hearing
Retardation or Severe Sensory Disabilityincluding educationally mentallyretarded, trainable mentally retarded, developmentally disabled, visuallyhandicapped, deaf-blind, deaf, speech impaired, seriously emotionallydisturbed, and autistic
Log-linear analyses were run to determine the (statistical) significance of takinginto account these handicapping conditions, age, gender, and ethnicity in derivingthe estimated transition probabilities. Age was found to be the only statisticallysignificant factor, so we examined the similarities of the transition paths forstudents of single-year ages in the range 12-21 years and established four agecategories:
12-15 years
16 years
17 years
18-22 years
Retaining handicap-group in our matrix on conceptual grounds, our original 9x 9 matrix (instructional setting or exit category at start and instructional setting orexit category at end) was now a 9 x 9 x 3 (handicapping condition) x 4 (age) matrix.For each cell of the matrix, we used observed frequencies (i.e., actual transition ratesderived from pilot-test data) when the total number of cases for that row was morethan 30 individualsa large enough number so that he derived probabilities wouldbe meaningful. The log-linear analysis provided estimated transition probabilitiesbased on a statistical model fitted to the observed data. In cases where the row totalsbased on observed pilot-test cases alone were too smalli.e., less than 30wefollowed special procedures. We used an average of observed and estimatedfrequencies when the row totals were between 10 and 30 actual cases, and we used

6
estimated frequencies based on the log-linear model when the row totals based onactual cases were less than 10.
by
The result was a four-dimensional 9 x 9 x 3 x 4 matrix that differentiates status
type of handicapage
instructional setting assignmentpost-graduation attainment
We developed an interactive computer program to generate educationalexpectancies, allowing educators and parents to look at different instructionalplacements to compare a student's prospects for graduation or dropout and to givean indication of how well programs are meeting specific needs.
As stated earlier, underlying our use of single-period transition probabilities toestimate the expected attainments was the assumption that the transition estimateswould remain constant from one year to the next. During our second year, wereplicated our work at the pilot-test site (including the follow-up study of recent-yeargraduates) and derived transition probabilities for a second year, December 1985 toDecember 1986. The results showed no statistically significant differences in thetransition patterns for the pairs of years studied, and so justified the use of a singlepair of years for determining transition patterns and expected attainments over alonger period than that observed.
Cost Estimates
One of the important aspects of special education at the local level is cost.Administrators need to know how many special education students they have andwhat their transition patterns and expected attainments are; they also need to knowthe cost implications of those patterns. To provide local-level information on costs,we added cost estimates for various handicaps and instructional settings. Becausethe cost estimates are a new feature since our Phase Two report, we describe them indetail below.
To incorporate these cost data into MAP, we used national-level data fromDecision Resources Corp (1988) to derive costs for each handicapping condition. We

7
multiplied the appropriate cost estimates times the p-values of the likely end-statesfor students in each year and took the sum: this is the estimated yearly cost. Wesummed over years to give interim and final total-cost estimates, so that, forexample, if a particular student has a fifty-fifty chance of being in an SCC or RP inthe next year, we multiplied the cost estimates for his or her handicap in each ofthese settings by .5 and took the total as the estimated yearly cost for that student.Although our cost estimates based on national data must be regarded as crudeestimates when applied to transition patterns in a community, they neverthelessprovide useful examples of the power of art accounting system s Ich as MAP. Forthe pilot-test site, the addition of these national cost data allows MAP to makeprojections of yearly and total costs for individuals and groups, as well as projectionsof likely progress through the different instructional settings and one year out ofhigh school.
To obtain the cost estimates, we used the following data:

8
Average Per-Pupil Cost of Special Education, 1985-86
The following chart shows average special instructional costs per student by disability and programtype. It excludes the cost of related services, support services, and the regular education the studentsreceive. Students in resource programs spend, on average, Itiours a week in regular education and sixhours in the resource room. Among those in self-contained programs, 15 percent spend no time in regulareducation; the rest spend an average of 8.5 hours per week in regular education.
Handicapping Self-Contained ResourceCondition Class Program
Speech impaired $ 7,140 $ 647Mentally retarded 4,754 2,290Orthopedically impaired 5,248 3,999Multihandicapped 6,674 No casesLearning disabled 3,083 1,643Seriously emotionally
disturbed 4,857 2,620Deaf 7,988 No casesDeaf-blind 20,416 No casesHard of hearing 6,058 3,372Other health impaired 4,782 No casesAutistic 7,582 No casesVisually impaired 6,181 3,395
Across all conditions
Source: Decision Resources Corp.
$ 4,233 $ 1,325
For the "no cases" entries under Resource Program (RP), we took one half ofthe value for Self-Contained Class (SCC), our rationale being that for many of theothers, the RP amounts are approximately half of the SCC estimates. (We could notpro-rate costs on an hourly basis because there are fixed costs evidently associatedwith, e.g., accommodating deaf-blind students at all.) For Specific InstructionalService (SIS) data, we made an hourly pro-rating, using RP data as a base. Forexample, if speech impaired students in an RP cost about $647 for six hours in theresource room, we estimated that SISs, which are usually one-hour "pull-outclasses" at the secondary level, should be about one third the amount, or about twohours per week. Pro-rating was appropriate for SIS because built-in costs are part ofthe RP estimates; e.g., pulling out a deaf student for six hours in a room will likelycost no more than pulling the same student for two hours. For "Other Special
9
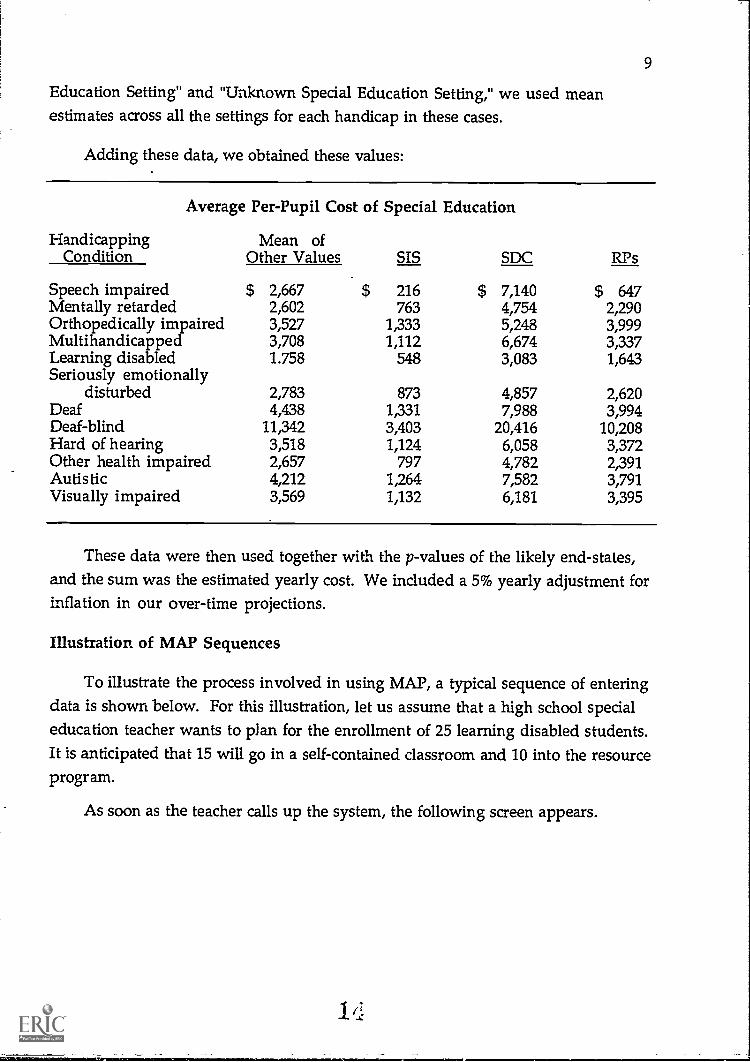
Education Setting" and "Unknown Special Education Setting," we used meanestimates across all the settings for each handicap in these cases.
Adding these data, we obtained these values:
Average Per-Pupil Cost of Special Education
HandicappingCondition
Mean ofOther Values SIS SDC RPs
Speech impaired $ 2,667 $ 216 $ 7,140 $ 647Mentally retarded 2,602 763 4,754 2,290Orthopedically impaired 3,527 1,333 5,248 3,999Multihandicapped 3,708 1,112 6,674 3,337Learning disabled 1.758 548 3,083 1,643Seriously emotionally
disturbed 2,783 873 4,857 2,620Deaf 4,438 1,331 7,988 3,994Deaf-blind 11,342 3,403 20,416 10,208Hard of hearing 3,518 1,124 6,058 3,372Other health impaired 2,657 797 4,782 2,391Autistic 4,212 1,264 7,582 3,791Visually impaired 3,569 1,132 6,181 3,395
These data were then used together with the p-values of the likely end-states,and the sum was the estimated yearly cost. We included a 5% yearly adjustment forinflation in our over-time projections.
Illustration of MAP Sequences
To illustrate the process involved in using MAP, a typical sequence of enteringdata is shown below. For this illustration, let us assume that a high school specialeducation teacher wants to plan for the enrollment of 25 learning disabled students.It is anticipated that 15 will go in a self-contained classroom and 10 into the resourceprogram.
As soon as the teacher calls up the system, the following screen appears.

10
*H = Help*
Age to start?
Because most of the students will be 14 years old, the special education teachertypes in 14 and presses Return.
*H = Help*
Individual (I) or Cohort (C) Analysis ?
The teacher types in C for Cohort and presses Return.
iv

(1) Autistic(2) Deaf(3) Deaf-Blind(4) Hard of Hearing(5) Learning Disabled(6) Mentally Retarded(7) Multihandicapped(8) Orthopedically impaired(9) Other Health Impaired
(10) Seriously Emotionally Disturbed(11) Speech Impaired(12) Visually Impaired
Which Disability to Consider?
NOM.
*H = Help*
11
The teacher types in 5, to indicate learning disabled, and presses Return.
Numbers of Students in the following Instructional Settings?(NOTE: Total students with this disability is 25 )
(1) Self-Contained Class (0)
(2) Resource Program (0)
(3) Specific Instructional Service (0)
(4) Other S. E. Setting (0)
(5) In S.E., Setting Unknown (0)
(6) Mainstream School Setting (0)
The teacher types 15 next to Self-Contained Class and 10 next to ResourceProgram. Note that the screen reminds the user that 25 students should beaccounted for. After the teacher presses Return, the system begins makingprojections based on the data collected from the pilot-test site. If the teacher wishesto halt? paper copies of any of these projections, pressing the Print key will producea copy of the information on the screen. Below is the projection for the 25 students
one year after enrollment (after their freshman year).

12
AT AGE 15 --1 Year(s) LaterDISABILITY = (5) Learning DisabledSTUDENTS (Ss) WITH THIS DISABILITY = 25
Proportion in a Self-Contained Class 40.3% (Ss =10)Proportion in a Resource Program 24.9% (Ss = 6)Proportion in a Specific Instructional Service 1.4% (Ss = 0) *Proportion in Some Other S. E. Setting 1.7% (Ss = 0) *Proportion in S.E., Setting Unknown 0.0% (Ss = 0)Proportion ht a Mainstream School Setting 26.1% (Ss = 7)Proportion Dropped Out of School 5.5% (Ss = 1)Propoirtion Graduated and at School or at Work 0.0% (Ss = 0)Propu:tion Graduated but Not at School or at Work 0.0% (Ss = 0)
Estimatid Yearly Costs-8 46,112.81Estimated TOTAL Costs to This Point --$ 46,112.81
*** Press Any Key to CONTINUE ***
* One student apportioned over more than one setting
The teacher can see that 10 students will probably remain in SCCs; six willremain in RPs; seven will be mains reamed, one ;5 likely to drop out of school, andthe remaining two are likely to be in some other special education setting.Estimated yearly costs for the 25 learning disabled students are $46,113. The teacherpresses any key to see the next screen, continues on for three screens, and stops tostudy the results in four years, after the students' senior year.
AT AGE 18 4 Year(s) LaterDISABILITY = (5) Learning DisabledSTUDENTS (Ss) WITH THIS DISABILITY = 25
Proportion in a Self-Contained Class 13.4% (Ss = 3)Proportion in a Resource Program 15.4% (Ss = 4)Proportion in a Specific Instructional Service 3.0% (Ss = 1)Proportion in Some Other S. E. Setting 1.6% (Ss = 0) *Proportion in S.E., Setting Unknown 0.3% (Ss = 0) *Proportion in a Mainstream School Setting 29.7% (Ss = 7)Proportion Dropped Out of School 13.2% (Ss = 3)Proportion Graduated and at School or at Work 20.5% (Ss = 5)Proportion Graduated but Not at School or at Work 3.0% (Ss = 1)
Estimated Yearly Costs --$ 22,627.41Estimated TOTAL Costs to This Point-8 147,593.80
*** Press Any Key to CONTINUE ***
* One student apportioned over more than one setting
11/

13
The teacher now sees that five will probably have graduated and gone on toschool or work; one will have graduated but not have gone. on to school or work;and three will have dropped out. Of the remainder, only three will remain in theself-contained class; seven will have been mainstreamed. Four will be in an RP, onein a SIS, and one in an unknown special education setting. At this point theestimated yearly costs are $22,627.
To look at costs for other students, for example, for three mentally retardedstudents, the special education teacher could begin the process again.
Summary: Goal One
Our Model Accounting Plan provides local-level data for administrators andparents: it can be used to monitor the progress, transition patterns, expectedattainments, and associated costs of special education students. MAP is future-oriented: it not only gives educators a history of their special education students butit provides a means for them to see where those students are headed and what theassociated costs and needs are. It helps parents understand the likelihood of theirspecial education students reaching certain goals or following certain patterns. Itdoes not predict with certainty, but it shows patterns for similar students and similarsituations, providing critical information and helping to inform decisions aboutstudents and programs.
Goal Two
Facilitate the aggregation of local data to inform decisions about special education atthe state and national levels.
Some school districts and SELPAs in California already have sophisticated datacollection systems; for them, it is relatively simple to transfer data into MAP toobtain transition patterns, expected attainments, and cost estimates. Other sites lackthe systems or the software to collect and retain special education data. To makeMAP accessible to such sites, we developed a turnkey management informationsystem (MIS) that we could distribute free to schools districts. The MIS is anapplication of Paradox, a data base manar -tent program for IBM or IBM-compatiblepersonal computers.
1 CJ

14
The MIS has a menu structure based or. seven tasks:
1. Create records for students in special y rograms. Data that can be collectedindude basic information about the student, e.g., name, ID, address,telephone, birthdate, ethnicity, language; and special education data, e.g.,instructional service, handicap, teacher, residence district, program status,and dates of IEP approval, annual review, previous evaluation, andtriannual evaluation. These fields can be customized for each site.
2. Update student records. Changes can be made to records already created.
3. Make back-up copies. Copies of information can be made for a hard disk, afloppy diskette, or tape.
4. Analyze student records. With the specification of two dates, transitionpatterns can be analyzed. (This task is in prototypic stage.)
5. Create reports of student records. Four major types of reports can begenerated: reports by SELPA (or intermediate educational unit); settingwithin a SELPA; district; and student reports: active students, dischargedstudents, history of changes to an individual record, status of an individualstudent, and status of students in a district. Within each type of report, datacan be organized by handicap and age; instructional setting and age;ethnicity; licensed care institutes (LCI) or foster homes and limited-Englishspeaking (LEP) or non-English speaking (NEP).
6. Transfer records. Data from files created with the MAP MIS system can betransferred into several formats for use with other software packages (e.g.,dBase, Lotus 1-2-3).
7. Leave. The user can exit from the MIS.
For the MIS, we developed pop-up help screens that make it easy to use and a"plain-English" manual with step-by-step instructions. The MIS is program-specific,so information for up to five programs can be kept for each special educationstudent. It enables sites to prepare all kinds of group and individual reports,including those needed for pupil-counts, and makes MAP accessible to any site thathas an IBM or IBM-compatible personal computer. For speed in data processir ; at
1

15
sites with several thousand special education students, we recommend IBM or IBM-compatible personal computers operating on an 80386 microprocessor.
Example of MIS Sequence
When users begin to use MAP's MIS, the first screen they see identifies ProjectMAP and includes information about the grant and funding agency. Next they aregiven a choice of the seven tasks described above (i.e., Create, Update, Backup,
Analyze, Report, Transfer, Leave). To illustrate the process involved in creating arecord, a typical sequence of entering data is shown below. For this illustration, letus assume that a high school aide is entering data for one student.
The aide chooses Create from the seven tasks, presses Enter, and sees themessage "Setting up tables." Then this data screen appears:
(F21 post records, [F3] previous student, [F4] next student,[F5] assign ID, Esc Cancel entries, Ctrl-U Undo last change
Student Data EntryStudent ID:
Last Name*First Name:Address:
City, State ZIP+4:Telephone:
Ethnicity:Birthdate: Sex:
LCl/Foster Home?
Language:Handicaps: NEP/LEP:
1 2 3 4Grade: Residence District:
Dates: (mm-dd-yy)IEP Approval:
Previous Evaluation:
Program Status:
Annual Review:Triannual Evaluation:
The aide types in all of the information that is available, presses Enter, and seesthe following screen.
20

16
[F2] post records, [F3] previous student, [F4] next student,[F5] assign ID, Esc Cancel entries, Ctrl-U Undo last change
Parent:Address:
City, State ZIP+4:Language:
Parent:Address:
City, State ZIP+4:Language:
Phone:
Phone:
Instr DIS DatesSet Sery Teacher School/Jurisdiction Start End
I I
I I
I I
I I
I I
The aide types in all of the information about the student's parents and thestudent's various instructional settings, teachers, schools, and dates involved. Thenthe aide can either create more records or go to one of the other tasks. The dataentered for each student is added to that for other students, enabling the aide to
produce reports on individual students or on groups, e.g., by handicap and age, byinstructic...al setting, by ethnicity, and by LCI and LEP categories. The aide can alsoorder analyses of the type described in the MAP sequence earlier.
Aggregation of Data
Having developed a means for sites to report data easily, we focused on ways toaggregate data from a variety of sources. We gathered data from three very differentdata sources: Fremont Union High School District, Yolo County, and MercedCounty in California, where data are kept in widely varying ways. For example, inMerced, each student has two or three programs with beginning and end dates, andcounts are made within students. One code is used for graduation, and drop-outsare recorded. In FUHSD, more exit codes are used, e.g., withdrawal for marriage or

17
withdrawal for pregnancy. Each student has a special education code describing thespecial education services he or she receives. When services are terminated, nonew code is added. The student record merely shows the discharge date. Weworked with the Merced data to make it compatible with the FUTISD data already inthe system, for instance collapsing FUHSD's exit categories.
Our work convinced us that aggregation is possible so long as it is clear (1)whether a student is in special education and (2) if in special education, whatinstructional setting the student is in. It is assumed that age and handicap areavailable for all students. The only "cost" of aggregation is that the degree ofspecificity in describing the accounting frameworkwhether it is a 9 x 9 x 3 x 4 or a20 x 20 x 20 x 20will always be no greater than is permitted by the "poorest" or leastdescriptive data source. If the poorest data have too few categories and are toogrossly combined, they probably should be exduded from attempts at aggregation.
States are required to aggregate data. There are pros and cons. On the "pro"side is the fact that in principle, the more data available, the finer the matrix so that,for example, single years of age or specific handicapping conditions can be examinedin detail. The resulting information can increase accountability and aid planningfor individual students, local programs, and national policies. On the "con" side isthe fact that any data collection requires time and effort, particularly if standards areset for all sites. Staff training may be needed. Aggregation requires that everyonecollect the same data in the same way.
Summary: Goal Two
To make MAP more accessible to schools that lack systems for collecting datasystematically, we developed a management information system based on theParadox software. Easy to use, it helps ensure that any school system can use MAPand that everyone collects the same data. We also examined data from three diverseSELPAs to determine the feasibility of aggregating data in MAP and found that itwas possible. As with any aggregation, it can be done only as finely as its poorest, orleast descriptive, data source.

18
Goal Three
Encourage positive change in the way that data for special education students arereported and used
During the course of this project, we have spent a considerable amount of time"out in the field," talking with teachers, special education directors, administrators.and others about data collection for special education students: what data arecurrently collected and how they are used; what data needs are not being met andhow we might address those needs. We visited or otherwise met with educators inSan Bernadino, San Diego, Simi Valley, Santa Clara County, Yo lo County, Merced,
El Dorado Countyin short, from northern California to its southern tip, in largecity districts and small rural ones. We attended their meetings, discussed theproblems associated with their data, and listened to their con erns.
We gained a thorough understanding of the problems, and we believe thatMAP addresses those problems. We have made our system available to schoolsystems at no cost; we have coffered assistance to districts that wish to implement it.We have disseminated information about MAP in many forms. We describe thosebelow.
Dissemination
Throughout the project, we have sought opportunities to tell people aboutMAP and to encourage them to try using the system. We have placed descriptionsof MAP in a variety of newsletters and have had two journal articles publishedabout MAP (in Social Indicators Research and The journal of Special Education). Allinformation has included instructions for obtaining the demonstration diskette andproject reports. In this last phase of MAP, we have continued to disseminateinformation about MAP and provided free copies of the demonstration diskette, themanual, and other information to interested persons. For example, we providedinformation on MAP for Summary of Literature and Outreach Findings on StudentFollow-Through Systems (Stern et al., 1988), a background report for the EducationTransition Center of the California State Department of Education. Supportingmaterials are in Materials for Outreach Activities on Student Follow-Through Systems.
23

19
We sent information to the Department of Educational Accountability,Montgomery County Public Schools in Rockville, Maryland, and we were listed intheir Level 4 Task Force Report. One person, having received our demonstrationdiskette and other materials, asked for permission to publicize the system to othersat a California special education conference, permission we were happy to grant.
At the request of the Social Science Research Council, we recently wrote anarticle about MAP for the Journal of the American Statistical Association. T' ?d "ADemographic Accounting System to Inform Educational Policy: Genesis,Dissemination, and Limited Acceptance," the article focuses on educational policyissues that are raised by an accounting system of this type. A copy of the article is inAppendix A. In addition to the JASA article, we have submitted an article on MAPto the journal Educational Technology; it is included as Appendix 13.
Perceived Problems in Dissemination and Implementation
The JASA article reflects our experience that MAP is difficult to implementbecause of two problems, which we believe other accounting systems for specialeducation will encounter. We describe those problems below.
Problem: difficulties in getting data. Our experience in enlisting thecooperation of educational decision-makers in developing and pilot-testing MAPhas been positive; top administrators have been supportive and enthusiastic.Resistance has come mainly from those who must collect the data and enter it intothe system: they are less helpful. They do not see the value of the Ita beingcollected; they resent the paper work already mandated for special educationIndividualized Educational Plans (IEPs), documentation of conferences andtelephone contacts with parents, and annual pupil-counts. Their resistance appliesnot only to MAP but to any similar system. MAP requires no additional data exceptfor the post-graduation follow-up, which is essential only if schools and policymakers want it. The other data required for MAP are or should be already collectedfor the pupil-counts.
This problem can be solved we believe, onl by helpin special educationteachers and other staff members realize the value of the data that MAP (or a similarsystem) can produce. With training in how to collect and use data, special education
2._

20
teachers and staff would be more cooperative, as they see the "why" and "how" fordata collection.
Problem: communication problems at the local level. In talking withnumerous California SELPAs to assess needs, we found that relationships betweendata processing staff and teaching and program administrative staff are often hostile.The data processing people see information as their top priority, and theysometimes fail to see the implications of those data needs on program activiti,.s.The teaching and administrative staff see instruction as their top priority, and theyoften underestimate the value of technology in general and computer-generatedinformation in particular. The mutual distrust between data processing staff andteaching and program administrative staff and, in many cases, the physical distancesseparating their workplaces, affects both communication and the quality of data.
We believe that this problem can also be ameliorated by staff training and otherefforts to develop collaboration and cooperation. As program implementers beginto see the value of information, they will be mvre willing to help gather accuratedata for the data processing staff and to use the resulting reports. As the dataprocessing staff gains a greater understanding of the programs and demands on thetime of the teaching and program administrative staff, they will find additionalways to make the information meaningful and useful.
Good communication and positive attitudes can make a difference. We foundthat at both Fremont Union High School District and Merced County Schools,communications were good and interest was high. The FUHSD local school boardwelcomed the data, staff cooperated willingly, and, at Merced, parents even becameinvolved, in gathering follow-up information on graduates.
Summary: Goal Three
We have undertaken a number of steps to encourage positive change in theway that special education data are reported and used. We met with specialeducators at widely varying sites across California; we attended meetings; we wrotearticles; we offered our demonstration diskette and other information free to anyinterested persons. We have recently submitted two more articles to journals, andwhen they are published, we expect to receive additional requests for information,

21
which we will honor. We will continue our efforts to promote positive changes indata collection and use.
26

22
Recommendations
We have three recommendations or observations, based on our experience indeveloping and disseminating MAP:
1. Data quality must begin and end at the local level. If those data are notgathered carefully and accurately, any aggregation at the state and national level willbe meaningless. If those data are ea.:Tate, valuable information can be gained forplanning programs, allocating resources, and helping special education students. Topromote attention to data at the local level, school personnel must be convincedthat the data are useful. MAP or a similar system can help analyze their data inmeaningful ways so that teachers, parents, administrators, and Boards of Educationcan see what it happening to their students, what their future achievements arelikely to be, and what resources are needed. If it is evident at the local level thatspecial education data are useful, data collection will be carried out with enthusiasmand care.
2. Efforts must be made to capture the imagination of local schoolpersonnel and to_motivate them to improve their skills in collecting and usingdata. They can be encouraged to use existing data for local benefits, such as inconferring with parents, preparing newsletters about school activities, and reportingto Boards of Education. Administrators need to be more comfortable with datainterpretation; local capabilities need to be cre-veloped.
3. Data requirements need to be made more consistent at the national andstate levels. Schools perceive the data requirements as changing and capricious,lacking continuity or solid rationales. A national conference could be held everyfive years or so to discuss data elements needed to inform policies and programs,with Congressional hearings or some other forum for public discussion and review.Local personnel could be invited to express their ideas, concerns, and needs so thatthey would feel a vested interested in obtaining meaningful information.
Our experience with MAP has made us confident that a demographicaccounting system is feasible and useful. We ecognize the critical importance ofacceptance and support from local-level educators for such a system, and weenvision an aggregation of data that could make vital contributions to specialeducation policies at the state and national level.
2'l
I

23
References
Decision Resources Corporation (1988). Average per-pupil cost of special education,1985-86. Report on Education Research, 2 (25), p. 5.
Department of Educational Accountability (1988). Report of the Level 4 Task Force.Rockville, MD: Montgomery County Public Schools.
DuBois, P.. _ az Rossi, RJ. (1989). Computer-generated educational data: Chore oropportunity? Submitted to Educational Technology.
Rossi, R.J. & DuBois, P.A. (1989). A demographic accounting system to informeducational policy: Genesis, dissemination, and limited acceptance. Journal of theAmerican Statistical As,rociation. (subr,Litted upon request)
Rossi, R.J. (1989). Demographic accounting for special education. Social IndicatorsResearch 21, 169-199.
Rossi, R.J. (1988). Project MAP: Model Accounting Plan for Special Education: Phase TwoFinal Report. Palo Alto, CA: American Institutes for Research.
Rossi, R.J. & Wolman, J.M. (Winter 1987-1988). A model accounting plan forspecial education. The Journal of Special Education. 21(4), 57-73.
Rossi, R.J. (1937). Project MAP: Year One Final Report. Palo Alto, CA: AmericanInstitutes for Research.
Stern, B , Best, F., & Hurley, M. (1988). Summary of Literature and Outreach Findings onStudent Follow-Through Systems: Background Report, Volume 1. Sacramento, CA:Pacific Management and Research Associates.
Stone, R. (1971). Demographic accounting and model-building. Paris: Organization forEconomic Cooperation and Development.

Appendix A
Article Submitted to the Journal of the American Statistical Association
"A Demographic Accounting System To Inform Educational Policy:
Genesis, Dissemination, and Limited Acceptance"
A Demographic Accounting System to Inform Educational Policy:, Genesis, Dissemination, and Limited Acceptance
Robert J. RossiPhyllis A. DuBois
American Institutes for ResearchPalo Alto, California 94302
April 7, 1989

2
Authors' Footnote
Robert J. Rossi is Principal Investigator for Project MAP and Principal ResearchScientist, American Institutes for Research, Palo Alto, CA 94302. Phyllis A. DuBoisis Project Director for Project MAP and Research Scientist, also at AmericanInstitutes for Research. This work was supported by the Office of Special EducationPrograms, U.S. Department of Education, Grant G008530205.
ABSTRACT
Federal programs are developed with an eye to overall goals and policies, andthey rarely include specifications for data that could illuminate the policy makers asto the success or failure of those goals and policies and provide programimplementers with data related to improving effectiveness. Our case study focusedon Project MAP: Model Accounting Plan for Special Education, a demographicsystem we developed which monitors the placements and transitions of specialeducation students and provides cost estimates for various handicaps andinstructional settings. MAP operates on IBM-compatible computers available inmost school districts, is simple to implement, and is most informative if a minimalamount of date is collected beyond that already mandated by the federalgovernment. Our efforts to disseminate it at no cost have had only limited success,and we suggest that the reasons are related to difficulties in getting data and poorcommunication. We believe that these issues need to be addressed beforeaccounting systems like MAP can be widely adopted and effectively used.
Key Words
accountability
spedal education
transitions
cost estimates
31

3
FEDERAL POLICY AND LOCAL IMPLEMENTATION
As funding for federal programs has increased into billions of dollars, thedemand for accurate accounting and accountability has also increased. Congressand taxpayerswant to know where the money is being spent and with whatresults. Specifically they are interested in: What works? What did it cost? Whatare its political benefits? Can it be implemented in my district? Unfortunately thelegislation for these programs seldom translates goals into data requirements thatcan meet accounting and accountability needs. As programs operate and additionalneeds are identified, reporting requirements are added, often without significantlyimproving the quality of the resulting data. At the local level, the implementers,busy with program activities, often fail to see any connection between reportingrequirements and program goals. They resent the time and energy required forgathering and reporting data, and they become increasingly frustrated as therequirements change. The Lational focus (where the money is appropriated) is ongoals; the local focus (where the money is spent) is on operations.
Consider the following example. Drug use is a national concern. Inresponding to the problem, Congress passes legislation to fund local programs toreduce drug use among high school students. A drop-in center is proposed for alocal community; the goal is to provide information about drugs and their harmfuleffects. An application is made and the program is funded. Tied to the funding is arequirement for evaluation data. Having appropriated the money, Congress wantsto know how well the center does in meeting its goals. The program is hard todescribe: the staff members can count the number of students who come in and addup the numbers of activities provided. They sense that they are nuking a differencein the students' behavior, but they cannot document it by merely counting thenumber of students served. What is needed is quality data for the decision-makers,so that they can tell if the program is effective.
In education, results are particularly difficult to measure. By contrast, programsin such areas as health and labor are easier to quantify. Education involves complexprocesses that may require several years to produce discernible effects.Socioeconomic factors and other background and contextual factors can havesignificant effects on program outcomes, making it difficult to disentangle theireffects from those due to the programs. Furthermore, many programs are unable to

4
provide hard data on whether they meet the broadly stated national goals that havebeen set for them.
PROBLEMS IN GATHERING DATA ON SPECIAL EDUCATION
The Department of Education program Education for the Handicapped nicelyillustrates the data problems that occur with many federal programs. Educationalprogramt, for handicapped students were given an appropriation of almost $2 billionin FY 1989: $1.8 billion in state grants and $0.2 billion in special purpose funds. Thestate grants were then given to local education agencies to piovide services forhandicapped students which were above and beyond those provided fornonhandicapped students. Funds were administered through the Office of SpecialEducation and Rehabilitation Services. The relevant questions for the specialeducation programs are:
What do the services cost and how they compare to the costs of programsfor nonhandicapped students?
What are the effects on students: Will they be able to move into regularclassrooms? Will they be able to get jobs they after graduate or leave thepublic school system?
Unfortunately, a means for answering these questions has not been established.To provide data about the services provided, Congress mandated "pupil counts," atwice-yearly report intended to inform administrators about the enrollments ofstudents in different types of programs (e.g., self-contained classes, resourceprograms, regular classroom), by type of handicap (e.g., speech impaired, mentallyretarded, orthopedically impaired, learning disabled), age, and ethnicity. Each localeducation agency (LEA) reports the counts for its programs to the state; each stateaggregates the data and provides a report to the federal government. In theory, thisform of program monitoring promotes program effectiveness. In practice, the typesand quality of data compiled have little value for assessing effectiveness for tworeasons:
1. The pupil-count system places little emphasis on keeping track of students'progress after they leave special education programs. In many jurisdictions, if astudent moves from a self-contained special class into a regular classroom, therecords for that student are deleted from the database. In other jurisdictions, when

5
changes are made in student records, they are simply written over the originalinformation, destroying the historical record on student performance.
2. The pupil-count system is not designed to relate information onenrollments from one year to the next. Each time a count is taken, the currentstatus of students is reported. Changes in student status over time, e.g., whether astudent is moved into the mainstream program or continues in a special educationassignment, are not required and not reported.
The pupil counts are difficult, time-consuming, and, at least according to thesmall sample of special education personnel we interviewed in California, oflimited value. The data requirements are interpreted in different ways in differentplaces, we were told, and the resulting counts are used for reporting requirementsand little else. Despite the limitations of the pupil-count, it is the only annual datareporting required for special education programs by the federal government.
The pupil-count system illustrates the situation found with other funding:those who fund programs fear that the appropriated money is not being spent forgood purposes. Those who implement those programs are annoyed that they musttake the time to gather data that they neither want nor use. Caught in between arethe bureaucrats who must carry out the federal mandate and who know how it isregarded at the local level.
A CASE STUDY: PROJECT MAP
Aware of the problems inherent in the pupil-count system for reporting dataon students receiving special education services and cognizant of the need foraccurate data for planning programs and monitoring progress, we at the AmericanInstitutes for Research decided to seek a solution. The senior author lead the effort.The solution developed by Dr. Rossi and his AIR colleagues was MAPModelAccounting Plan for Special Educationwhich was funded by a three-year grantfrom the Office of Special Education Projects (OSEP) of the Department of Educationand was based on a demographic accounting framework.
A Demographic Accounting Framework
First proposed by Sir Richard Stone (1971), the concept has been used in avariety of contexts, including studies of labor force participation and population

6
dynamics. McMillan and Land (1979) and Russ-Eft and her colleagues (1981)explored demographic accounting in relation to education. When applied toeducational systems, a demographic accounting framework estimates populationstocks and flows (e.g., enrollments, graduations, other withdrawals) throughvarious settings (e.g., grade levels, instructional programs) over time. It thenintegrates this information on population stocks and flows to describe patterns ofeducational performance and the ways in which these patterns change over time.The resulting data can inform school-level decisionmaking and can be aggregatedfor use at higher administrative levels.
To develop MAP, AIR staff constructed a large-scale computer databasecontaining in-school and post-graduation data on special education students andcreated a turn-key management information system for microcomputers thatproduces the data matrices suitable for transitional analysis. The MAP accountingframework consists of a four-dimensional matrix that differentiates transitionalstatus by type of handicap, age, instructional setting assignment, and post-graduationattainment. Powers of the transition probability matrix, starting with a base year andcontinuing for one or more years into the future, are used to derive expectededucational attainments by a particular age. The system was pilot-tested with datafor approximately 11,000 special education students at three California sites.
MAP operates on IBM-compatible PCs and was written in Paradoxl, a data basemanagement program. MAP can be customized at each site. Fields are alreadyestablished; schools can add teachers names, handicaps, grade, ethnicity, language,residence district, program status, instructional setting, designated instructionalservices, school, and jurisdiction. MAP is program-specific, storing information forup to five programs for each special education student. MAP's main menustructure is based on eight tasks (e.g., creating a record); it is easy to use, with pop-uphelp screens and a "plain-English" manual with step-by-step instructions. Theprogram provides support for one data collection effort beyond that needed forpupil-counts: a follow-up of recent-year graduates. MAP automatically performs allanalyses of the compiled data, whether transitional analyses or tabulations requiredby the pupil count system, in response to menu selections.
1 Paradox Relational Data Base, Rel. 3.0. Scotts Valley, CA: Borland International.
7
MAP: Basic Pupil Data, Estimates of Transitions Paths, and Per-Pupil Costs
MAP enables local school personnel to use their administrative data base forgenerating pupil-counts, preparing up-to-date class lists, and compiling accuratehistories of individual students over time and acre' s academic y -s, and as a meansfor estimating transitional paths. In addition, because MAP inclu_ as data on theaverage per-pupil cost of special education, it can project the costs for providingservices of each program type to students with each handicapping condition.
For example, a high school principal who knows that 25 learning disabledstudents will be entering from a feeder junior high school can compare thosestudents to current students with similar handicaps and determine what programsthey are likely to need and what the costs of those programs will be. Figure 1 showsthe MAP data for the 25 learning disabled students one year after entering.
(insert Figure 1: Projections for 25 Learning Disabled Students: 1 Year afterEnrollment)
MAP can continue to make projections for succeeding years, provindinginformation about probable placements and costs. Figure 2 shows the MAP data forthe same 25 learning disabled students four years after entering.
(insert Figure 2: Projections for 25 Learning Disabled Students: 4 Years afterEnrollment)
These data are valuable in monitoring and reporting current programactivities, allocating resources for future programs, and providing more accurateinformation to parents about the likely outcomes for their children in theseprograms.
RECEPTION TO PROJECT MAP
Having developed an inexpensive, easily implemented solution to acommonly recognized problem, we disseminated information about it in a varietyof ways: journal articlesl, reports2, newsletters, computer networks, conference
1 Rossi, R. J. (in press), "Demographic Accounting for Special Education," Social Indicators Research.

AT AGE 14 - -1 Year(s) LaterDISABILITY = (5) Learning DisabledSTUDENTS (Ss) WITH THIS DISABILITY = 25
Proportion in a Self-Contained Classroom 40.3% (Ss =10)Proportion in a Resource Program 24.9% (Ss = 6)Proportion in a Specific Instructional Service 1.4% (Ss = 0) *Proportion in Some Other S. E. Setting 1.7% (Ss = 0) *Proportion in S.E., Setting Unknown 0.0% (Ss = 0)Proportion in a Mainstream School Setting 26.1% (Ss = 7)Proportion Dropped Out of School 5.5% (Ss = 1)Proportion Graduated and at School or at Work 0.0% (Ss = 0)Proportion Graduated but Not at School or at Work '0.0% (Ss = 0)
Estimated Yearly Costs$ 46,112.81Estimated TOTAL Costs to This Point --$ 46,112.81
* One student apportioned over more than one setting
Figure 1: Projections for 25 Learning Disabled Students: 1 Year after Enrollment.Data are shown as they would appear on the computer screen. Estimated yearlycosts are based on "Annual Per-Pupil Cost of Special Education, 1985-86," fromDecision Resources Corporation.

AT AGE 17 -- 4 Year(s) LaterDISABILITY = (5) Learning DisabledSTUDENTS (Ss) WITH THIS DISABILITY = 25
Proportion in a Self-Contained Classroom 13.4% (Ss = 3)Proportion in a Resource Program 15.4% (Ss = 4)Proportion in a Specific Instructional Service 3.0% (Ss = 1)Proportion in Some Other S. E..Setting 1.6% (Ss = 0) *Proportion in S.E., Setting Unknown 0.3% (Ss = 0) *Proportion in a Mainstream School Setting 29.7% (Ss = 7)Proportion Dropped Out of School 13.2% (Ss = 3)Proportion Graduated and at School or at Work 20.5% (Ss = 5)Proportion Graduated but Not at School or at Work 3.0% (Ss = 1)
Estimated Yearly Costs$ 22,627.41Estimated TOTAL Costs to This Point $ 147,593.80
* One student apportioned over more than one setting
Figure 2: Projections for 25 Learning Disabled Students: 4 Years after Enrollment.Data are shown as they would appear on the computer screen. Estimated yearlycosts are based on "Annual Per-Pupil Cost of Special Education, 1985-86," fromDecision Resources Corporation.

8
contacts, and conversations with educators and state agency personnel. We sentdemonstration diskettes and manuals free to any interested person who requestedthem. The response has not been encouraging. We believe that the reasons for thisapparent resistance are two-fold and are instructive for others who wish to addresssimilar problems.
Difficulties in Getting Data
Decision makers recognize the potential value of MAP and have respondedenthusiastically to it. At sites where we have asked for data and cooperation intrying out the system, the top administrators have been enthusiastic and supportive.The resistance has come from those who have to implement the program, thosewho must collect the data and those who must enter it into the system. We hclVefound it difficult to convince these implementers that the system can be beneficial:they do not recognize its possible use, and they are skeptical of its results. They arereluctant to take on any data collection tasks not already required, even if, like thefollow-up of graduates, the tasks would produce useful information.
This reluctance is understandable in light of the paperwork and data collectionalready mandated for special education programs. In addition to their regular tasksof planning, providing, monitoring, and evaluating instruction, the specialeducation teacher and other staff involved (e.g., school psychologist, speechtherapist) must prepare an Individualized Educational Plan (IEP) for each studentwho receives services. The IEP details the students' needs and outlines aneducational program to meet those needs. The IEP is developed each school year,reviewed with the student's parents during an individual conference, and revisedas necessary. The special education teacher must also keep records of all contactswith parents, through both telephone calls and conferences. In addition to trackingthe IEPs, coordinating other special education services, and issuing the usual report
Rossi, R. J. and Wolman, J. M. (1988), "A Model Accounting Plan for Special Education," The Journal of
Special Education, 21(4), 57-73.
2 Rossi, R. J. (1987), Project MAP Year One Final Report: Pilot-test of the Model Accounting Plan and
Preliminary Results of Expectancy Analyses. Palo Alto, CA: American Institutes for Rer,:arch.
Rossi, R. J. (1988), Project MAP: Model Accounting Plan for Special Education: Phase Two Final Report,
Palo Alto, CA: American Institutes for Research.

9
cards, the teacher and school must also report the pupil-counts twice a year.Although some of the resulting data arc useful, this paperwork takes valuable timeaway from activities directly involving students. And even though the follow-up ofgraduates is a relatively trivial task, it too adds to the burden.
To solve this problem, special education teachers and other staff members mustbe convinced that it is worthwhile for them to collect the small amount ofadditional data that MAP requires. Staff time must be provided, either from thespecial education staff or from the LEA staff. Special education teachers and otherstaff must begin to see the value of the data they already collect and observe theconstructive use of the information. This change in attitudes will have to comefrom staff training and improved practices. Too often, federal and state datarequirements are changed for what seem to be capricious reasons, requiring minorchanges in reporting but resulting in an attitude of "What now?" at the local level.Consistency in requirements and dear rationales for each data request will increasecooperation.
Communication Problems at the Local Level
In many school settings, the computing staff is separate from the teaching andprogram administrative staff, often in buildings some distance from one another.We have noted that the teaching staff tends to be somewhat intImidated by the dataprocessing staff. Understandably, teachers put students first; information needs arefarther down on their list of priorities. Their computer knowledge is primarilyrelated to classroom applications; they are less familiar with data reporting systems.Teachers sometimes fail to understand how technology can help them; they oftendo not know how to specify what information they need and why. By contrast, thedata processing staff put information at the top of their list of priorities; they do notalways appreciate the impact that information needs can have on programs. Thedata processing staff are sometimes impatient with teachers' lack of technologicalexpertise and their perceived lack of appreciation for strict data collection practices.This hostility affPcts both communication and the quality of data.
To solve this problem, both teaching and data processing staffs need to developcollaborative attitudes. Teachers must become more appreciative o: the value ofcomputer-generated data, learning to use it to enhance their work. Data processingstaff must become more student-centered, developing data and systems that assist
10
teachers without making misunderstood or unreasonable demands. This solution,like that for the problem of gathering data, requires increased staff training,improved communication, and changed attitudes.
We have evidence that good communication and positive attitudes towarddata collection can make a difference. In developing MAP, we worked with twoCalifornia jurisdictions (Fremont Union High School District and Merced CountySchools), and there communications were good and interest was high. The localboard was eager for the data, the staff invested their time freely, and, in one case,parents volunteered to conduct the survey of recent-year graduates.
The two problemsdifficulties in getting data and poor communicationbetween the teaching and data processing staffs at the local levelmust be addressedbefore MAP or any other accounting system can be implemented successfully. Wewill continue to promote our system and to investigate ways to increase its use, butstaff development must be provided and communication must be improved_ Thiscommunication must start at the top, where federal policy makers need to articulatetheir data needs for policy decisions, and continue through the middle level, wherethose requirements can be communicated and monitored, to the local level, wherethey can be carried out and, more important, provide useful information toimprove programs and services.

11
References
Decision Resources Corporation (1988), "Average Per-Pupil Cost of SpecialEducation, 1985-86," Report on Education Research, 2 (25), p. 5.
McMillen, M. M., and Land, K. C. (1979), Methodological Considerations in theDemographic Approach to Social Accounting, Urbana, IL: University of Illinois.
Russ-Eft, D. (1981), "Measuring Educational Expectancies," Los Angeles: Paperpresented at the Annual Meeting of the American Educational ResearchAssociation.
Stone, R. (1971), Demographic Accounting and Model-Building, Paris: Organization forEconomic Cooperation and Development.

Appendix B
Article Submitted to Educational Technology
"Computer-Generated Educational Data:
Nuisance or Opportunity?"
40

,M,.,-,=a111Or
Computer-Generated Educational Data:
Nuisance or Opportunity?
Phyllis A. DuBoisRobert J. Rossi
4'.

1
Technology is a vital part of nearly every classroom in America today.Students use computers for simulations, data analysis, drill and practice, wordprocessing, and many other learning-based activities. In some classrooms, studentsuse interactic e videos and other sophisticated technological equipment. Teachersuse computers to develop lessons and maintain records. Outside the classroom, inthe principal's office or the superintendent's office, computers are used to prods cedocuments such as school bulletins and newsletters and to gather data such asattendance figures and budgets required by the "higher ups" at the district, county,state, or federal level. The data meet requirements, not needs, and are seldom usedfor analysis and projections.
Data for special education are a case in point. As part of the funding forspecial education initiated by the Education for All Handicapped Children Ad., P.L.94-142, the federal government mandated annual "pupil counts," tallies of studentsin special education each year. Most schools dutifully take the counts on schedule,report their numbers, and forget about them, considering it a time-consuming taskuseful only for obtaining funds.
At the .American Institutes for Research (AIR), we were interested in howtechnology might serve educators at the local level; how the computer might be ananalysis tool for local program management. Wouldn't it be helpful, we thought, tohave a way for educators to be able to see
the path that their students were most likely to follow through theireducational systemthe special services they would need and for how longthe likely outcomes for their studentshow many could be expected tograduate and how many would probably drop outthe estimated costs for educating their studentsnot just for this year butfour years from now, or six, or ten
We decided to try to develop such a system. Focusing on special education,we obtained a grant from the Office of Special Education Programs, Department ofEducation, and produced MAPModel Accounting Plana microcomputer-basedsystem that does chart the paths, likely outcomes, and estimated costs for specialeducation students in a school district. The resulting data can also be combined withthat from other sites to produce reports for counties, states, or the federalgovernment. Here's how it works.
46

2
Demographic Accounting System
MAP is a demographic accounting system to monitor special educationstudents: their placements in different instructional settings and their transitions asstudents in moving from one instructional setting to another or as graduates ordropouis from school. MAP is based on a demographic accounting framework firstproposed by Sir Richard Stone (1971). A demographic accounting system rec, Iresthat you measure the status of a population at least two times: at the beginning andend of a standard period, such as a year. What is important is that the status of allmembers of the population present at the beginning of the period be accounted forat the end of the period. In carrying out a series of these "accounts" with specialeducation students, this means at Year 2, you measure the status of all students whowere in special educae.on during Year 1 and are still in the program.
What information do you collect? You include all of the information youthink might be of interestwithout creating a burden. For special education, wherepupil-count data already must be maintained and reported, we used the following:
instructional settingwhere students receive special education services,for example, a Self-Contained Class or Resource Specialist Program
the exits from special educationwhere students go after leaving specialeducation, such as moving to a mainstreamed classroom, dropping out, andgraduating
the handicapping conditionwhat disabilities students have, such asorthopedically handicapped, learning disability, speech impaired
We also wanted basic data on students, such as language, age, gender,ethnicity. We worked with a nearby high school district, and because they alreadycollect all of th above information we needed, no additional data collection wasneeded.
The individuals to be included in a demographic accounting franvmork aredivided into categories based on the descriptive information, such as instructionalsetting. The categories are placed in a matrix, with values for Year 1 and Year 2. Forexample, for special education students in three types of instructional settings (Self-
46

3
Contained Class, Resource Program, and Specific Instructional Service), the matrixmight look like this:
[insert Figure 1. Structure of the MAP]
Suppose that of 30 students in a self-contained classroom in Year 1, 15remained there in Year 2. The 15 would go in the top left box. You would fill in theother boxes and then use these numbers to estimate transition probabilities, thelikelihood with which students move from one instructional setting to another.You obtain these by dividing the number of students in each instructional setting atYear 1 into the individual totals moving from there to another setting by Year 2.For example, if 15 of 30 students in a self-contained classroom move to a ResourceProgram, the transition probability for this transition is 15/30 or .5. .
The matrix we developed was a four-dimensional one, with categories forinstructional settings and exits at Year 1 and Year 2, handicapping conditions, andage. We designed a computer program that could calculate transition probabilitiesfor each of the cells in this 9 x 9 x 3 x 4 MAP matrix. We used the transitionprobabilities to measure expected attainment for particular ages up to 22, forexample, the likelihood that students will have graduated and be at work by age 21.The estimates resulted from the multiplication of the matrix for one or moresuccessive years. We designed and pilot-tested our system; we also determinedtransition rates for a second pair of years to see if the actual rates were stable overtime and supported our use of powers of a single-period matrix for projectingattainments. (They were.) We added cost estimates based on Decisions ResourceCorporation data (1988) for each handicapping condition, so that the system couldproject'costs.
We now had a system that could show the path that special educationstudents were likely to follow, their likely outcomes, and the costs associated withthose programs. We wanted school sites to use MAP, and schools that already hadmanagement information systems for special education could use it. However, wefound that many sites lacked an MIS to store and update student informationwithout destroying the historical record for each student, so we developed a systembased on Paradox software that runs on an IBM or IBM-compatible computer. It iseasy to use, has pop-up help screens, and enables the user to gather all of the dataneeded to maintain individual student records and to develop pupil counts for

SCC
Year 1 RP
SIS
Year 2
SCC RP SIS
Figure 1. Structure of the MAP
4
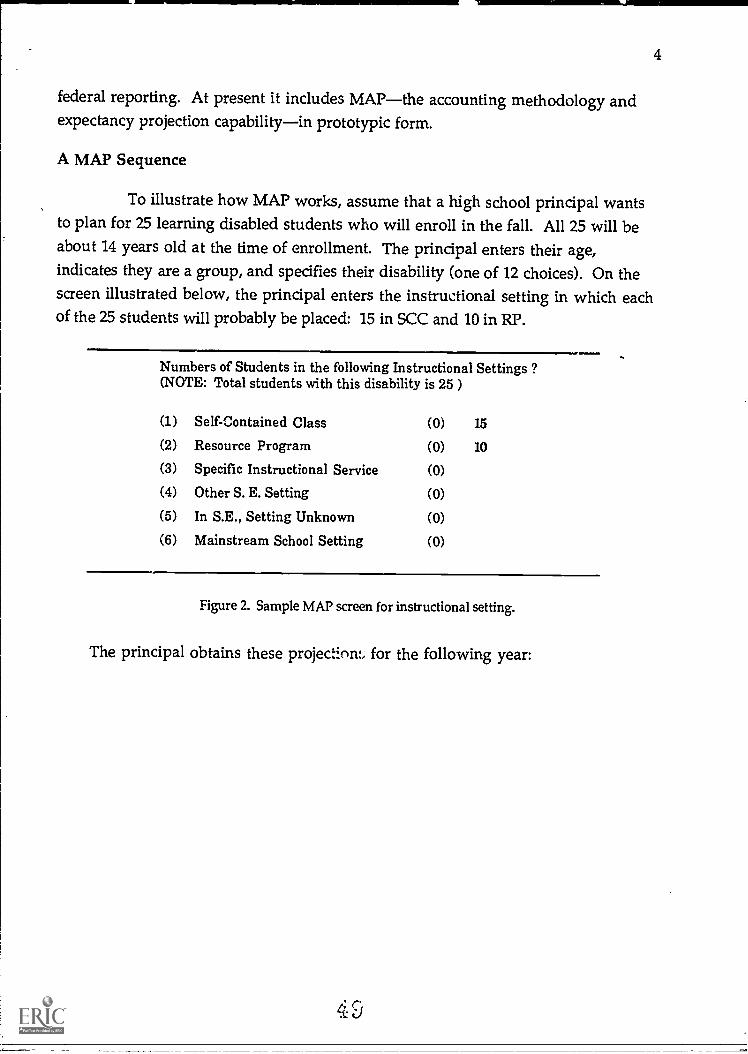
federal reporting. At present it includes MAPthe accounting methodology andexpectancy projection capabilityin prototypic form.
A MAP Sequence
To illustrate how MAP works, assume that a high school principal wantsto plan for 25 learning disabled students who will enroll in the fall. All 25 will beabout 14 years old at the time of enrollment. The principal enters their age,indicates they are a group, and specifies their disability (one of 12 choices). On thescreen illustrated below, the principal enters the instructional setting in which eachof the 25 students will probably be placed: 15 in SCC and 10 in RP.
Numbers of Students in the following Instructional Settings ?(NOTE: Total students with this disability is 25 )
(1) Self-Contained Class (0) 15
(2) Resource Program (0) 10
(3) Specific Instructional Service (0)
(4) Other S. E. Setting (0)
(5) In S.E., Setting Unknown (0)
(6) Mainstream School Setting (0)
Figure 2. Sample MAP screen for instructional setting.
The principal obtains these projection:, for the following year:
45

5
AT AGE 15 - -1 Year(s) LaterDISABILITY = (5) Learning DisabledSTUDENTS (Ss) WITH THIS DISABILITY = 25
Proportion in a Self-Contained Class 40.3% (Ss = 10)Proportion in a Resource Program 24.9% (Ss = 6)Proportion in a Specific Instructional Service 1.4% (Ss = 0) *Proportion in Some Other S. E. Setting 1.7% (Ss = 0) *Proportion in S.E., Setting Unknown 0.0% (Ss = 0)Proportion in a Mainstream School Setting 26.1% (Ss = 7)Proportion Dropped Out of School 5.5% (Ss = 1)Proportion Graduated and at School or at Work 0.0% (Ss = 0)Proportion Graduated but Not at School or at Work 0.0% (Ss = 0)
Estimated Yearly Costs$ 46,112.81Estimated TOTAL Costs to This Point$ 46,112.81
*** Press Any Key to CONTINUE ***
* One student apportioned over more than one setting
Figure 3. Sample MAP screen with projections.
At this point, the principal can see that 10 will probably stay in the self-contained class, six will be in the Resource Program, seven will be mainstreamed,one will probably have dropped out of school, and the remaining two are likely to bein some other special education settings. The estimated yearly costs for the 25learning disabled students are $46,113. The principal can continue to look atprojections for two, three, or four years later.
Uses of Data
Like any data analysis system, the quality of MAP data depends on the qualityof its raw data. If a school district has only three hearing impaired students and datafor only one year, for instance, the MAP projections for hearing impaired studentsare likely to be suspect. However, if the school district aggregates .ts data with thatfrom another similar district, the data become more reliable and useful. If it collectsdata for several years, it begins to get an accurate picture of its students, its programs,and its costs.
How might the principal described above use MAP data? Parents could begiven a better sense of their children's future: what other students with similardisabilities have done; how such students have performed in various instructional

settings. Boards of Education could gain information about special educationprograms: what results are most likely; what costs are involved. Teachers couldwork with the principal to consider the implications of the data: for example, whatmight be done to prevent special education students from dropping out.
Our experience with MAP has convinced us that educators can gain valuableinformation from a system that can chart paths, likely outcomes, and costs. It is ourhope that MAP is a harbinger of the increased use of technology for informeddecision making in education.
5i
6

7
References
Decision Resources Corporation (1988). Average per-pupil cost of special education,1985-86. Report on Education Research, 2 (25), p. 5.
Stone, R. (1971). Demographic accounting and model-building. Paris: Organization forEconomic Cooperation and Development.
0 Ad

Author Note
Phyllis A. DuBois is Project Director for Project MAP and Research Scientist,American Institutes for Research (AIR), Palo Alto, CA 94302. Robert J. Rossi isPrincipal Investigator for Project MAP and Principal Research Scientist, also at AIR.This work was supported by the Office of Special Education Programs, U.S.Department of Education, Grant G008530205. For more information about MAP,write to either Ms. DuBois or Dr. Rossi at American Institutes for Research, P.O. Box1113, Palo Alto, CA 94302.
53