Embed Size (px)
Citation preview
ENERGY W
ORKIN
G FOR BRITAIN
Horizon Internal DCRM Number: WN0902-JAC-PAC-REP-00012
PINS Reference Number: EN010007
Application Reference Number: 6.3.23
June 2018
Revision 1.0
Regulation Number: 5(2)(a)
Planning Act 2008 Infrastructure Planning (Applications: Prescribed Forms and Procedure) Regulations 2009
Wylfa Newydd Project 6.3.23 ES Volume C - Road traffic-related effects (project-wide) App C2-4 - DCO TA Appendix I - VISSIM Model Results

[This page is intentionally blank]
Page i
Contents Executive summary ......................................................................................... 1 Introduction ...................................................................................................... 1 Methodology .................................................................................................... 1 Model calibration and validation ...................................................................... 2 Future background traffic growth (without Project traffic) ................................ 3 Worker/construction traffic assessment (with Project traffic) .......................... 4 Conclusion ....................................................................................................... 4 1. Introduction ...................................................................................................... 6
Background ...................................................................................................... 6 Background to the study .................................................................................. 6 Purpose of the VISSIM model ......................................................................... 8
Consultation ..................................................................................................... 8 Baseline constraints ......................................................................................... 8 Report structure ............................................................................................... 9
2. Methodology .................................................................................................. 10 Introduction .................................................................................................... 10 VISSIM model specification ........................................................................... 10
Study area ...................................................................................................... 10 Model years and time periods ....................................................................... 11
Traffic surveys ............................................................................................... 13 Turning count data ......................................................................................... 13 ATC data ........................................................................................................ 15 Journey time data/routing data ...................................................................... 16 Video surveys ................................................................................................ 26 Conclusions/ key trends ................................................................................. 27
Matrix development ....................................................................................... 27 Matrix development ....................................................................................... 27 15 minute period matrices ............................................................................. 32 Resulting matrix totals ................................................................................... 33
Model operation ............................................................................................. 33 Validation criteria and modelling guidelines .................................................. 34
Link flow and turning movement calibration criteria ...................................... 34 Journey time validation criteria ...................................................................... 35 3. Model calibration and validation .................................................................... 36
Calibration process ........................................................................................ 36 Calibration results .......................................................................................... 36 Validation results ........................................................................................... 43
Journey times ................................................................................................ 43 Routing ........................................................................................................... 46 Queue lengths ............................................................................................... 47 Summary ........................................................................................................ 49
Journey time routes ....................................................................................... 50 4. Future background traffic growth ................................................................... 51
Page ii
Traffic growth ................................................................................................. 51 Future background traffic growth impacts ..................................................... 51
Summary ........................................................................................................ 51 General model performance .......................................................................... 51 Key locations.................................................................................................. 53 5. Worker/construction traffic and proposed mitigation ..................................... 59
Construction worker traffic ............................................................................. 59 Facilities management ................................................................................... 60 Construction vehicle traffic ............................................................................ 60 Mainland worker distribution .......................................................................... 60 Proposed mitigation – direct bus services ..................................................... 63 Total mitigated demand ................................................................................. 64
6. Worker/construction traffic assessment ........................................................ 66 Introduction .................................................................................................... 66 General model results .................................................................................... 66
Key locations.................................................................................................. 67 Summary ........................................................................................................ 74
7. August Sensitivity Test .................................................................................. 81 Introduction .................................................................................................... 81 Britannia Bridge ATC comparison ................................................................. 81 Matrix adjustment .......................................................................................... 82 August modelled traffic flow results ............................................................... 83 Future background traffic growth impacts ..................................................... 83
Key locations.................................................................................................. 83 Worker/construction traffic assessment (Direct Buses) ................................ 86
Key locations.................................................................................................. 86 Summary of August sensitivity test ................................................................ 90
8. Summary and conclusion .............................................................................. 92 Overview ........................................................................................................ 92 Calibration/validation ..................................................................................... 92 Future year tests ............................................................................................ 92
Trip generation ............................................................................................... 92 Conclusion ..................................................................................................... 93
9. References ..................................................................................................... 94
List of Appendices Appendix A. ATC/turning count data verification ................................................................................. 95 Appendix B. 15 minute matrix factors ................................................................................................. 98 Appendix C. Turning count calibration results ................................................................................... 100

Page iii
List of Figures Figure 1-1 Location Plan ....................................................................................................................... 7
Figure 2-1 Study Area/ VISSIM model network ................................................................................... 12
Figure 2-2: Turning count, ATC and merge survey locations .............................................................. 14
Figure 2-3 Observed ATC traffic volumes ........................................................................................... 18
Figure 2-4 Bluetooth locations ............................................................................................................ 19
Figure 2-5 Zone system ...................................................................................................................... 29
Figure 2-6 AM pre versus post trip length distribution ......................................................................... 32
Figure 2-7 PM pre versus post trip length distribution ......................................................................... 32
Figure 3-1 Base 2016 eastbound queues at 08:45, Junction 8/ 8a ..................................................... 48
Figure 3-2 Base 2016 westbound queues at 17:30, Junction 9 ........................................................... 49
Figure 4-1 AM 2023 network queues without Project traffic (08:45) .................................................... 52
Figure 4-2 PM 2023 network queues without Project traffic (17:30) .................................................... 53
Figure 4-3 2023 morning peak queuing eastbound towards Britannia Bridge without Project traffic (08:45), Junction 8a ............................................................................................................................ 54
Figure 4-4 2023 evening peak queuing westbound towards Britannia Bridge without Project (17:30), Junction 9 ........................................................................................................................................... 55
Figure 4-5 2023 morning peak queuing eastbound towards Menai Bridge without Project (08:45) ..... 57
Figure 4-6 2023 evening peak queuing westbound towards Menai Bridge without Project (17:30) ..... 58
Figure 5-1 Gravity model zone system/ward allocation ....................................................................... 62
Figure 5-2 Eastbound additional Wylfa Newydd Project traffic ............................................................ 65
Figure 5-3 Westbound additional Wylfa Newydd Project traffic ........................................................... 65
Figure 6-1 2023 AM general network queuing with Project (08:45) ..................................................... 66
Figure 6-2 2023 PM general network queuing with Project (17:30) ..................................................... 67
Figure 6-3 2023 morning peak queuing eastbound towards Britannia Bridge with Project (08:45) ...... 68
Figure 6-4 2023 evening peak queuing westbound towards Britannia Bridge with Project (17:30) ..... 70
Figure 6-5 2023 morning peak queuing eastbound towards Menai Bridge with Project (08:45) .......... 72
Figure 6-6 2023 evening peak queuing westbound towards Menai Bridge with Project (17:30) .......... 73
Figure 6-7 AM Britannia Bridge eastbound approach comparison of without project and with Project scenario queues at 08:45 .................................................................................................................... 75
Figure 6-8 AM Menai Bridge comparison of without Project and with Project scenario queues at 08:45 ........................................................................................................................................................... 76
Figure 6-9 PM Britannia Bridge westbound approach comparison of without Project and with Project scenario queues at 17:30 .................................................................................................................... 78
Figure 6-10 PM Menai Bridge comparison of without Project and with Project scenario queues at 17:30 .................................................................................................................................................. 79
Figure 7-1 March to August seasonality comparison by hour (percent change) .................................. 81
Figure 7-2 March to August seasonality comparison by hour (absolute change) ................................ 82

Wylfa Newydd Power Station App C2.04 - DCO TA Appendix I - VISSIM Model ResultsDevelopment Consent Order
Page iv
[This page is intentionally blank]

Wylfa Newydd Power Station App C2.04 - DCO TA Appendix I - VISSIM Model ResultsDevelopment Consent Order
Page 1
Executive summary
Introduction Jacobs was commissioned by Horizon Nuclear Power Wylfa Limited (Horizon) to develop a VISSIM microsimulation model of A55 Britannia Bridge and A5 Menai Bridge, which link Anglesey and the Welsh mainland across the Menai Strait. The purpose of the model is to assess the effects associated with peak construction of the Power Station and the subsequent requirement for any potential mitigation.
The model simulation area has been developed in consultation with the Welsh Government, Gwynedd Council and Isle of Anglesey County Council and includes both the Britannia and Menai Bridges. The model area covers the A55 Junctions 7 (A5152) to 11 (A5), allowing for potential rerouting impacts across the Menai Strait to be assessed. Coverage has also been defined by existing A55 traffic conditions and the anticipated impact of construction traffic associated with the Wylfa Newydd Project.
Methodology The Britannia Bridge microsimulation model has been developed in VISSIM 8.0 software. The model base year is 2016, using a pre-summer neutral month as the basis of assessment as this is time that count data was collected. All future year analysis has been undertaken for the forecast future year 2023, which is anticipated to be the peak construction year. Simulation periods are 06:00-09:00 and 15:00-18:00 with a 15 minute warm up period preceding each peak. Demand is disaggregated by car, Light Goods Vehicle (LGV) and Heavy Goods Vehicle (HGV) vehicle types. The current bus network (February 2017) has been coded as a series of fixed routes.
A major programme of traffic surveys has been undertaken including turning count, Automatic Traffic Count (ATC), journey time/routing and video analysis.
An initial programme of turning count surveys was undertaken in March 2016, focused on the A55. Additional surveys were undertaken in June 2016 targeted at collecting data elsewhere in the model area, including Menai Bridge. In total, surveys captured all major junctions on the A55 between Junctions 7 and 11, local junctions on the A5 including Menai Bridge and key junctions on the A4087/ B4547.
ATC data were collected by Gwynedd Council in order to enable validation of key turning counts.
A programme of Bluetooth surveys has been undertaken to capture journey time and routing data. Bluetooth units were placed by the roadside to create a cordon around the study area. In addition, units were placed on both Britannia and Menai Bridges. This ensured all traffic entering and leaving the cordoned area was captured, together with their routing across the Menai Strait. This routing data were used to help validate the model. Two-way sample rates were approximately 15% of total traffic on the A55 and 4% on the A5.

Wylfa Newydd Power Station App C2.04 - DCO TA Appendix I - VISSIM Model ResultsDevelopment Consent Order
Page 2
Video surveys were located at all turning counts; additional cameras were placed north and south of Britannia Bridge to enable queuing and merge behaviour on the approaches to be checked.
Generally, the data show a strong level of consistency across each survey. Data highlights the eastbound tidal flow from Anglesey to the mainland in the morning peak with the reverse flow in the evening peak. Morning peak eastbound queues towards Britannia Bridge commence around 08:00 and at their peak lie midway between Junctions 8 and 8a. Queuing continues until after 09:00. Westbound queuing commences around 17:15 and continues until after 18:00 extending to Junction 9.
To replicate travel demand within the model, a zone system has been developed. Each zone represents an origin or destination with a matrix of traffic assigned to or from each.
Matrix development has been undertaken in two stages.
1. A simple initial matrix has been created from turning count data using the traffic volumes and the percentage distribution passing through the entry and exit of each survey location along the model network.
2. A process of matrix estimation has then been applied, using the turning count data to adjust travel demands to better reflect observed values.
Matrices have been disaggregated into 15 minute periods in order to replicate the observed profile of demand. Within the peak hour, there may be significant variation of demand. Disaggregating by 15 minute period enables the effects of ‘peak within peak’ demand to be assessed.
Welsh Government Transport Appraisal Guidance (WelTAG) (RD1) requires the application of Web-based Transport Appraisal Guidance (WebTAG) standards in the development of transport models (RD2). Consequently, the adequacy of the Britannia Bridge VISSIM Model calibration and validation has been measured against guidance WebTAG (RD2).
Model calibration and validation The VISSIM model has been calibrated to represent existing (base) traffic conditions.
Network calibration has been an iterative process with minor adjustments made each time. The results have been reviewed with further minor changes made. The overall aim has been to achieve the best balance between:
turning count calibration;
journey times;
routing; and
queuing.
Initial model assignments have been improved through minor adjustments to the trip matrices. Routing has also been optimised to match Bluetooth data by adjusting link speeds and costs. Junction merge and give way parameters
Wylfa Newydd Power Station App C2.04 - DCO TA Appendix I - VISSIM Model ResultsDevelopment Consent Order
Page 3
have been reviewed for appropriateness; roundabout performance has also been checked and adjusted where necessary.
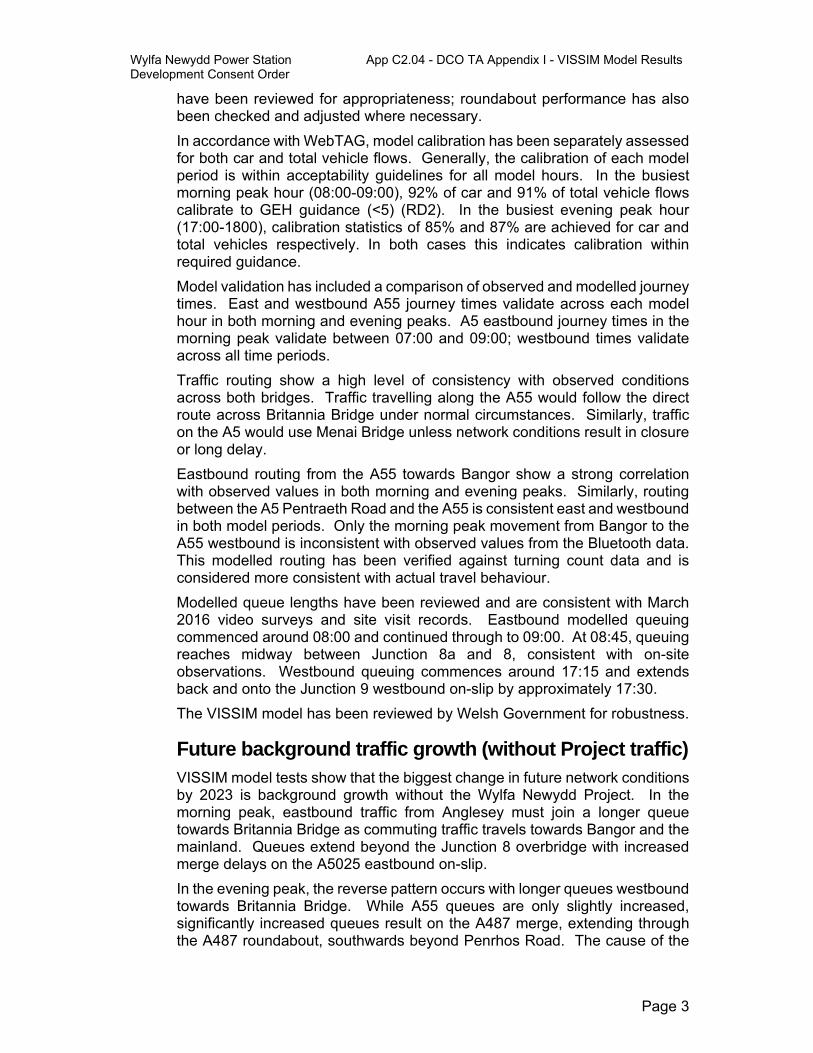
In accordance with WebTAG, model calibration has been separately assessed for both car and total vehicle flows. Generally, the calibration of each model period is within acceptability guidelines for all model hours. In the busiest morning peak hour (08:00-09:00), 92% of car and 91% of total vehicle flows calibrate to GEH guidance (<5) (RD2). In the busiest evening peak hour (17:00-1800), calibration statistics of 85% and 87% are achieved for car and total vehicles respectively. In both cases this indicates calibration within required guidance.
Model validation has included a comparison of observed and modelled journey times. East and westbound A55 journey times validate across each model hour in both morning and evening peaks. A5 eastbound journey times in the morning peak validate between 07:00 and 09:00; westbound times validate across all time periods.
Traffic routing show a high level of consistency with observed conditions across both bridges. Traffic travelling along the A55 would follow the direct route across Britannia Bridge under normal circumstances. Similarly, traffic on the A5 would use Menai Bridge unless network conditions result in closure or long delay.
Eastbound routing from the A55 towards Bangor show a strong correlation with observed values in both morning and evening peaks. Similarly, routing between the A5 Pentraeth Road and the A55 is consistent east and westbound in both model periods. Only the morning peak movement from Bangor to the A55 westbound is inconsistent with observed values from the Bluetooth data. This modelled routing has been verified against turning count data and is considered more consistent with actual travel behaviour.
Modelled queue lengths have been reviewed and are consistent with March 2016 video surveys and site visit records. Eastbound modelled queuing commenced around 08:00 and continued through to 09:00. At 08:45, queuing reaches midway between Junction 8a and 8, consistent with on-site observations. Westbound queuing commences around 17:15 and extends back and onto the Junction 9 westbound on-slip by approximately 17:30.
The VISSIM model has been reviewed by Welsh Government for robustness.
Future background traffic growth (without Project traffic) VISSIM model tests show that the biggest change in future network conditions by 2023 is background growth without the Wylfa Newydd Project. In the morning peak, eastbound traffic from Anglesey must join a longer queue towards Britannia Bridge as commuting traffic travels towards Bangor and the mainland. Queues extend beyond the Junction 8 overbridge with increased merge delays on the A5025 eastbound on-slip.
In the evening peak, the reverse pattern occurs with longer queues westbound towards Britannia Bridge. While A55 queues are only slightly increased, significantly increased queues result on the A487 merge, extending through the A487 roundabout, southwards beyond Penrhos Road. The cause of the
Wylfa Newydd Power Station App C2.04 - DCO TA Appendix I - VISSIM Model ResultsDevelopment Consent Order
Page 4
queues is the merge from two lanes to one on the approach to A55 Britannia Bridge, not the merge at J9 itself.
Worker/construction traffic assessment (with Project traffic) This scenario assumes that bus services would be provided from Caernarfon and Bangor across Britannia Bridge direct to the Wylfa Newydd Development Area for construction workers. This provides benefits by reducing the number of construction worker vehicle trips crossing between the mainland and Anglesey.
Eastbound construction worker trips cross Britannia Bridge before 06:00 and after 18:00. Mitigation targets these trips, and so the proposed measures have no eastbound impact in either the morning or evening peak periods. Forecast increased eastbound queues and delays towards Britannia Bridge are primarily as a result of background growth with a small amount of additional delay (+13 seconds) between 08:00 and 09:00 resulting from construction LGV and HGV traffic.
In the morning peak (06:00-09:00), construction worker traffic results in an additional 298 westbound vehicle trips as explained above there are no eastbound construction worker vehicle trips in the morning peak. None of this traffic occurs in the busiest hour of the model (08:00-09:00). Only LGV and HGV construction traffic crosses between 08:00 and 09:00, with a negligible impact on travel times.
In the evening peak (15:00-18:00), 129 westbound and 0 eastbound vehicle trips are generated by the construction worker traffic. None of this traffic occurs in the busiest hour of the model (17:00-18:00) with only LGV and HGV construction traffic crossing during the peak hour.
Direct buses would help remove a proportion of westbound construction worker trips during the early part of the evening peak. This provides benefit in helping slightly reduce queues and journey times in the peak within the peak period (17:00-18:00).
Traffic associated with the Wylfa Newydd Project would peak in 2023. The effects of the construction worker vehicle movements would be temporary.
A sensitivity test for August background traffic in 2023 indicates that the effects of project traffic would be negligible.
Conclusion In conclusion, the VISSIM modelling illustrates that:
the primary cause of increased queues and delays in 2023 is forecast background growth, not the additional construction traffic associated with the Wylfa Newydd Project.
eastbound, construction worker trips cross Britannia Bridge outside peak periods. LGV and HGV traffic slightly increases morning peak queue lengths and journey times between 08:00 and 09:00.

Wylfa Newydd Power Station App C2.04 - DCO TA Appendix I - VISSIM Model ResultsDevelopment Consent Order
Page 5
westbound, morning construction trips cross the bridge before 07:00; only night shift traffic has the potential to impact on the operational performance of Britannia Bridge.
the introduction of Direct buses reduces the effect of construction worker traffic in the early part of the evening peak.

Wylfa Newydd Power Station App C2.04 - DCO TA Appendix I - VISSIM Model ResultsDevelopment Consent Order
Page 6
1. Introduction
Background
Background to the study
Jacobs UK Limited (Jacobs) was commissioned by Horizon Nuclear Power Wylfa Limited (Horizon) to develop a VISSIM microsimulation model to assess the impact of the construction of the Wylfa Newydd Power Station (the Power Station) on the A55 Britannia Bridge.
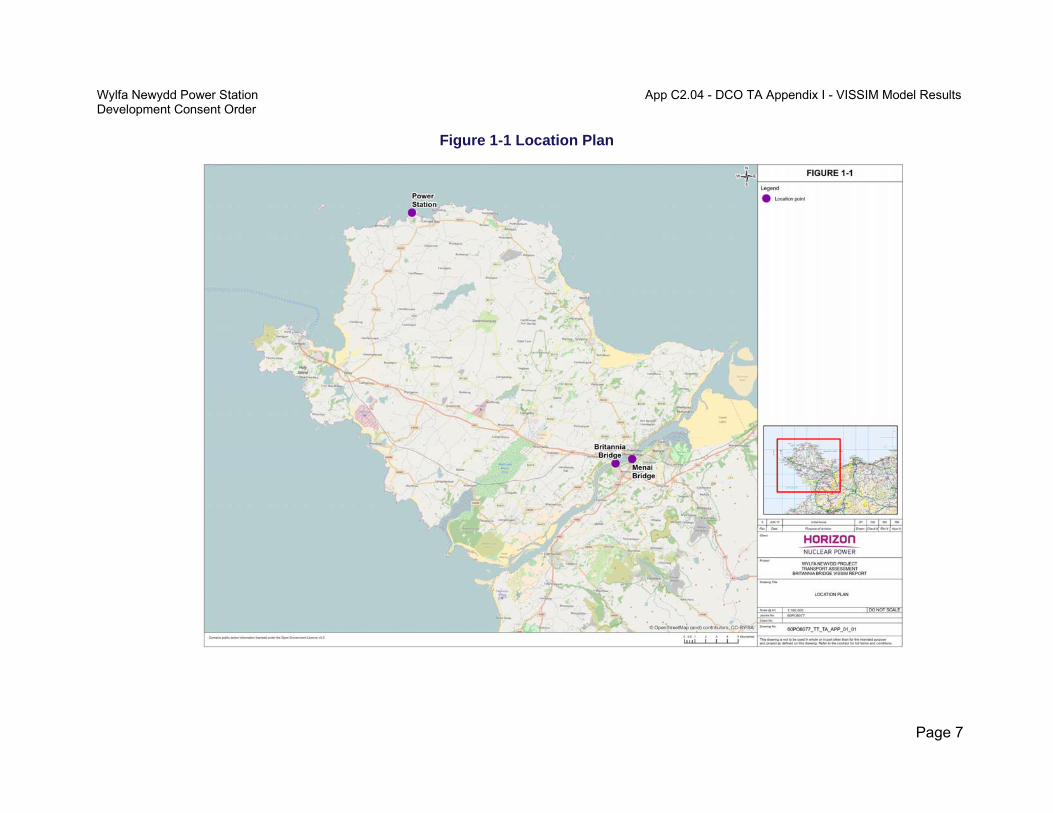
The model area includes both the A55 Britannia Bridge and A5 Menai Bridge. These crossings are the two road links between the Isle of Anglesey and the Welsh mainland, across the Menai Strait (figure 1-1).
Britannia Bridge lies on the A55 North Wales Expressway, which, apart from the bridge itself, is dual carriageway. The construction of the Power Station would result in an increase in traffic associated with both construction workers and materials movements, with construction workers predominantly travelling outside network peak hours.
The Menai Bridge has height and width restrictions and is not anticipated to be used by additional construction or material traffic. Nevertheless, general traffic may choose to reroute between the crossings depending on local network conditions. Including both Britannia and Menai Bridges within the model enables the potential impact of such changes to be explored.
Wylfa Newydd Power Station App C2.04 - DCO TA Appendix I - VISSIM Model ResultsDevelopment Consent Order
Page 7
Figure 1-1 Location Plan

Wylfa Newydd Power Station App C2.04 - DCO TA Appendix I - VISSIM Model ResultsDevelopment Consent Order
Page 8
Purpose of the VISSIM model
The purpose of the VISSIM model is to assess the traffic impacts associated with the increase in traffic generated during the construction of the Power Station.
This report details the process of calibrating and validating the A55 Britannia Bridge VISSIM Model.
The following demand and network mitigation measures have then been tested with findings discussed:
2023 future background traffic growth only;
2023 Wylfa Newydd Project traffic with mitigation - direct bus services
Consultation The general model specification, including extents and time periods, has been
developed in consultation with the Welsh Government, Gwynedd Council and Isle of Anglesey County Council. Survey specifications that form the basis of the neutral month assessment were provided to Welsh government for comment.
An initial Appraisal Specification Report was developed for review by stakeholders. Following its issue, a scoping meeting was held on 1 June 2016 to review the content and finalise the model specification.
A key decision was that the VISSIM model should include both Britannia Bridge and Menai Bridge in order that both strategic and local traffic impacts could be tested. Model time periods were also agreed with three-hour weekday morning and evening peak models being required.
The outcomes from the modelling were presented at a meeting on 22 December 2016 to Welsh Government; this included an overview of the calibration and validation and also the findings from the future year assessments. Following this, all model files and a draft of this report were provided to Welsh Government.
A review of the model has been undertaken by Welsh Government with a comments log received from Welsh Government. Horizon Nuclear Power provided responses to these comments in May 2017 and these, together with refined project assumptions, have been incorporated into the updated modelling upon which this report is based.
Baseline constraints Since they are the only two crossings of the Menai Strait, Britannia Bridge and
Menai Bridge are busy at peak periods. Congestion across Britannia Bridge occurs eastbound in the morning peak as traffic leaves Anglesey towards Bangor and other mainland destinations. Evening peak congestion occurs westbound across Britannia Bridge as traffic makes the reverse movement.
Forecast background growth will worsen existing conditions, increasing queues and delays at each crossing. Traffic associated with the Wylfa

Wylfa Newydd Power Station App C2.04 - DCO TA Appendix I - VISSIM Model ResultsDevelopment Consent Order
Page 9
Newydd Project would add to background traffic, peaking during the busiest construction year in 2023; these effects would be temporary with the greatest traffic volumes travelling outside of peak hours.
Report structure The structure of this report is given below. The model development
methodology and calibration/validation are summarised first.
Using the validated model, the impact of future background on network performance is then tested. Finally, the impact of additional Wylfa Newydd Project construction traffic (both workers, LGVs and HGVs) is considered with potential options to mitigate any traffic impact explored.
Section 2 Methodology;
Section 3 Model calibration and validation;
Section 4 Future background traffic growth;
Section 5 Worker/construction traffic and proposed mitigation;
Section 6 Worker/construction traffic assessment;
Section 7 August sensitivity test; and
Section 8 Summary and conclusions.

Wylfa Newydd Power Station App C2.04 - DCO TA Appendix I - VISSIM Model ResultsDevelopment Consent Order
Page 10
2. Methodology
Introduction The Britannia Bridge microsimulation model has been developed using
VISSIM 8.0 software. VISSIM is one of a number of microsimulation software packages with similar functionality. It has been selected based on its superior graphic output and ability to accurately model detailed junction and merge behaviour.
VISSIM is Transport for London’s preferred microsimulation tool and is also widely used by Highways England and local authorities across the UK. As a result, there is a large user and knowledge base across the UK. This enables easy auditing and review of the model by stakeholders compared with other less well known and used software.
The overarching project assumptions used in the production of the Britannia Bridge microsimulation model are located in App C2-4 - DCO TA Appendix G - Strategic Traffic Model – Overview (Application Reference Number: 6.3.21).
VISSIM model specification
Study area
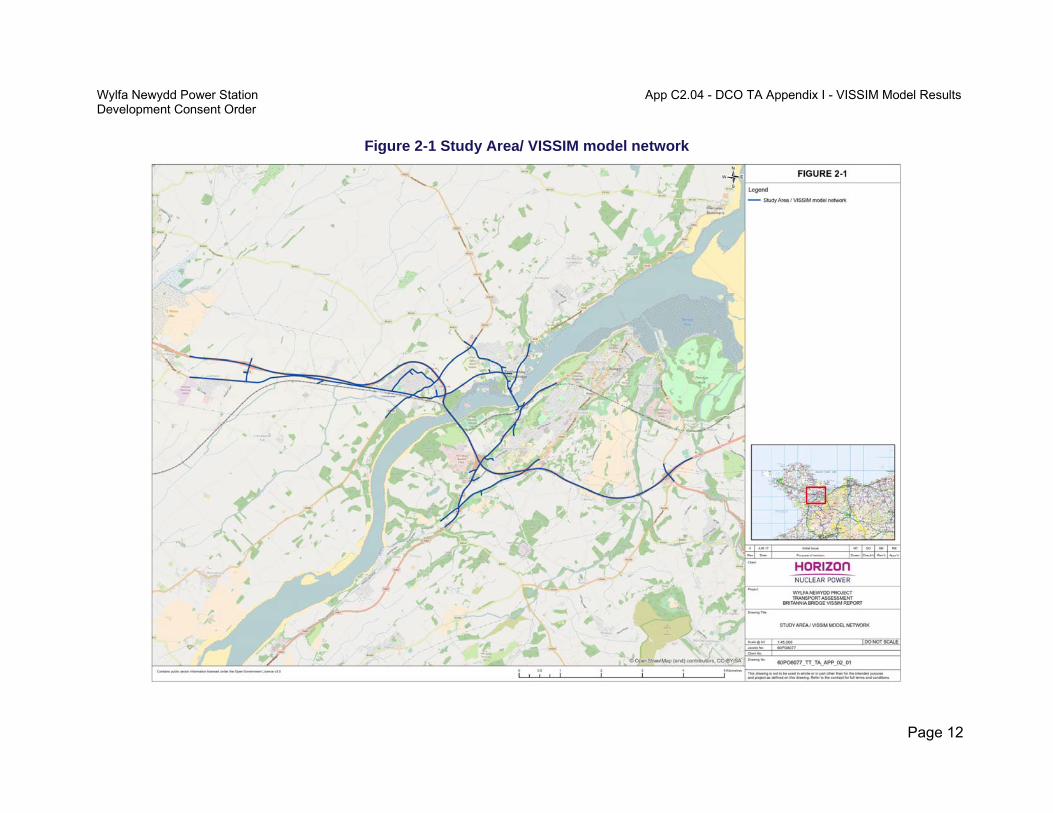
The model area has been determined based on the initial scoping meeting and stakeholder consultation described in Section 1.
The model includes both Britannia Bridge and Menai Bridge, as requested by Welsh Government, Gwynedd Council and Isle of Anglesey County Council. The modelling of both crossings enables route choice across the Menai Strait to be assessed with the impacts, in terms of queues and journey times, identified. There are no traffic signals within the modelled area with all junctions being either priority junctions or roundabouts.
The model includes:
the A55 between Junctions 7 and 11;
the A5 between the A5152 roundabout and Holyhead Road;
the A487 between Holyhead Road and the A4087 roundabout;
the A4087 between the A55 and the A487 roundabout;
the A5025 between the A55 and the B5420;
the A4080 immediately south of the A55;
Lon Graig; and
Pentraeth Road.
The study area and VISSIM model network extents are illustrated in figure 2-1.

Wylfa Newydd Power Station App C2.04 - DCO TA Appendix I - VISSIM Model ResultsDevelopment Consent Order
Page 11
Model years and time periods
The model base year is 2016; the forecast year is the peak construction year for the Wylfa Newydd Project, 2023.
Wylfa Newydd Power Station App C2.04 - DCO TA Appendix I - VISSIM Model ResultsDevelopment Consent Order
Page 12
Figure 2-1 Study Area/ VISSIM model network
Wylfa Newydd Power Station App C2.04 - DCO TA Appendix I - VISSIM Model ResultsDevelopment Consent Order
Page 13
Model time periods have been determined based on anticipated construction worker shift patterns. Day shifts are expected to start at the Wylfa Newydd Development Area between 07:00 and 08:00 and end between 17:00 and 18:00. Night shifts should start between 16:30 and 17:30 and end between 03:00 and 04:00. Worker traffic is expected to cross Britannia Bridge in excess of one hour before shift start westbound, and one hour after shift end eastbound.
A full explanation of construction demand and time periods is given in Section 5.1.
Model periods have been chosen to capture times when construction worker traffic has the potential to overlap with peak general traffic. Discussion with the Welsh Government and stakeholders also informed the final choice of model periods.
The finalised simulation periods are:
weekday AM peak 06:00-09:00; and
weekday PM peak 15:00-18:00.
A 15 minute warm up period precedes each peak to ensure that an adequate base level of traffic is assigned at the start of the simulation period.
Matrices have been disaggregated by Car, LGV and HGV vehicle types.
Traffic surveys Traffic surveys were initially conducted in March 2016 and then subsequently
in June 2016 to expand the scope of the model in response to comments from stakeholders. This defines the baseline as a 2016 pre-summer neutral month. A site visit was also completed recording key observations, including:
a review of general network performance;
the length and timing of morning and evening peak queues on the approach to Britannia Bridge; and
a qualitative review of merge behaviour.
Turning count data
Turning count data were collected in two separate surveys (figure 2-2). An initial survey was undertaken on Tuesday 22 March 2016 with data collection focused on the A55 corridor. Surveys were undertaken at the following locations:
Junction 8 A55;
Junction 8a A55;
Junction 9 North roundabout A55;
Junction 9 South roundabout A55;
Junction 10 A55; and
Junction 11 A55.

Wylfa Newydd Power Station App C2.04 - DCO TA Appendix I - VISSIM Model ResultsDevelopment Consent Order
Page 14
Figure 2-2: Turning count, ATC and merge survey locations N
Wylfa Newydd Power Station App C2.04 - DCO TA Appendix I - VISSIM Model ResultsDevelopment Consent Order
Page 15
Additional turning count data were collected on Thursday 30 June 2016. This programme of surveys was targeted at collecting data elsewhere in the model area, including Menai Bridge. This enabled a wider road network to be included within the VISSIM model, allowing wider queueing and route choice to be modelled. Surveys included the locations below:
Junction 7 A55;
A5/A5152 roundabout;
A5/A4080/Lon Graig junction;
A5025/B5420 roundabout;
A5/A545/Mona Road roundabout;
A5/A487 roundabout; and
A487/A4087/B4547 roundabout.
Data were collected in 15 minute time segments for the AM peak period and the PM peak period. Survey times were consistent with model simulation periods with data collected across the following periods:
AM peak 05:45 – 09:00; and
PM peak 14:45 – 18:00.
Counts were classified into car, LGV, HGV, Public Service Vehicle, motorcycle and pedal cycle. All count data were collated with counts tracked through the network to establish consistency. The process automatically highlighted where there was an inconsistency in a small number of cases. Where this was the case the higher traffic volume was assumed, representing a worst case scenario.
Note that, as count data were collected in neutral months March and June (defined as neutral by Department for Transport (RD3)), no adjustment for seasonality has been undertaken during data processing.
ATC data
ATC data were collected over a nine day period between 15 March 2016 and 23 March 2016 by the hour over the whole of each day. The locations of the ATCs are shown in figure 2-2. Final site selection and the full programme of surveys were undertaken by Gwynedd Council.
The ATC data were used to validate the turning count data described above. Tables A-1 and A-2 in Appendix A summarise the validation results for the morning and evening periods.
The majority of the ATC volumes corroborate the turning count data with one exception, as explained below.
The ATC values for Junction 10 North Arm, A4087 (Site 5 Arm A) for both the origin and destination data do not validate. This is due to the ATC counter and the turning count location being in different locations. (It was necessary to relocate the ATC counter for safety reasons). There is a large supermarket

Wylfa Newydd Power Station App C2.04 - DCO TA Appendix I - VISSIM Model ResultsDevelopment Consent Order
Page 16
on the roundabout between the ATC counter and the turning count location, so numbers from each survey cannot be directly compared. This meant that the ATC values for Site 5 Arm A could not be used but all other ATC data could.
Validated observed morning and evening peak traffic volumes, on key links, are summarised in figure 2-3.
Journey time data/routing data
A number of options were considered to best capture journey time and routing data. Conventional survey techniques were evaluated and discounted - the ‘floating car’ method being one option. With this approach, a driver and surveyor team travel backwards and forwards along predefined routes noting timings at key locations. Unfortunately, the ‘floating car’ method normally achieves very low sample rates. Data can also be skewed towards shorter journey times, as more return journeys are captured off peak than in the peak when congestion is higher.
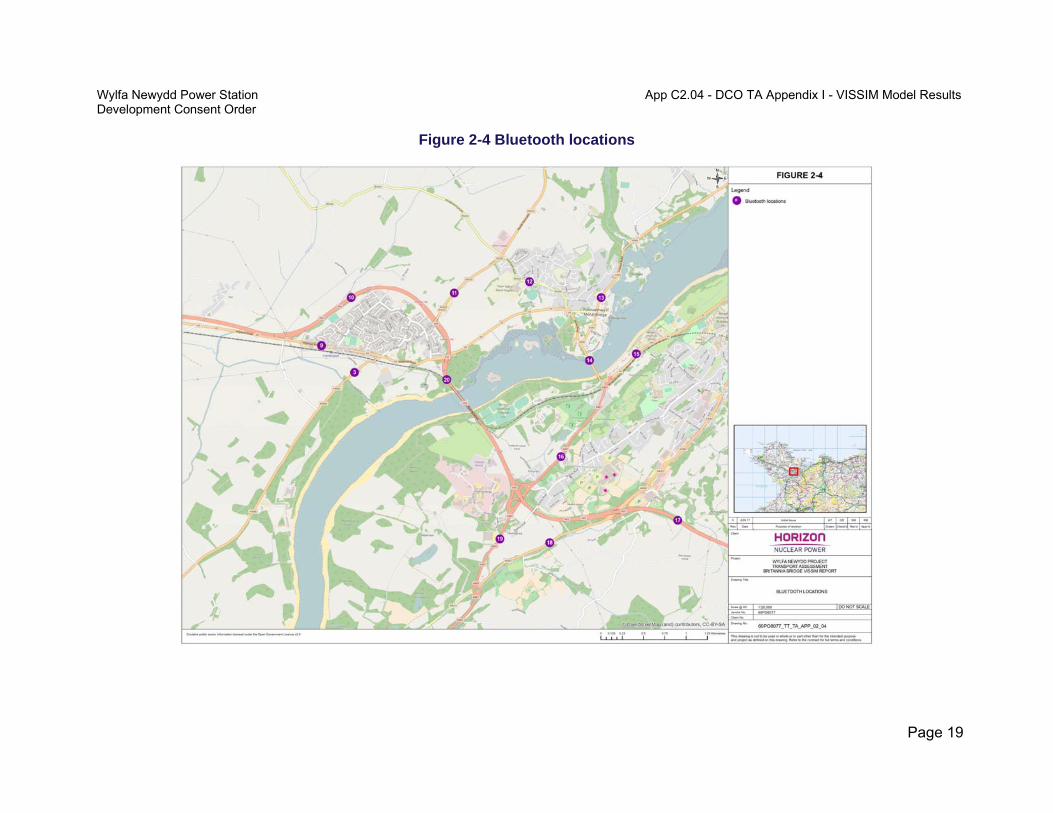
By comparison, Bluetooth was considered an effective method of capturing a relatively high and accurate data sample. Recording units were placed at strategic points on the road network as shown in figure 2-4. The Bluetooth identifier, from mobile phone and other electronic devices, passing each site, was recorded together with the time of observation. Records were then matched offline to give the journey time between each location.
Bluetooth data were collected in two separate months. An initial survey was undertaken along the A55 corridor in March 2016. Data were collected between 17 March and 23 March 2016 throughout the day at the sites identified in figure 2-4.
An expanded survey was undertaken in June 2016 to capture both the A55 Britannia Bridge and the A5 Menai Bridge. This survey had a dual purpose, with data required to inform both journey times and route choice across the Menai Strait. As the number of vehicles recorded in the original survey was lower than expected, the duration of the second survey was increased to two weeks. Data were collected between 30 June and 13 July at the sites shown in figure 2-4.
The number of vehicles recorded between Junctions 8a and 9 on the A55 in the March and June 2016 surveys is shown in table 2-1.
Table 2-1 Bluetooth records along A55 – March and June 2016 surveys Westbound
AM Eastbound
AM Total AM
Westbound PM
Eastbound PM
Total PM
A55 March
312 296 608 136 127 263
A55 June
1,067 1,709 2,776 935 935 1,870

Wylfa Newydd Power Station App C2.04 - DCO TA Appendix I - VISSIM Model ResultsDevelopment Consent Order
Page 17
The number of June records is substantially higher with a consequent improvement in the reliability of the data; as such, only the June records were used for analysis.
On first inspection of the Bluetooth data, it was found that some of the journey times recorded were extremely long compared with those experienced on the site visit. On further investigation, it was identified that these long journey times were as a result of vehicles making an intermediate stop on the network, potentially for school trips or for shopping.

Wylfa Newydd Power Station App C2.04 - DCO TA Appendix I - VISSIM Model ResultsDevelopment Consent Order
Page 18
Figure 2-3 Observed ATC traffic volumes
WB EB
30 50
94 197
318 773
599 415
780 465
882 344
SB NB
50 17
176 57
374 139
329 308
338 374
279 388
WB EB
36 37
96 121
194 349
357 297
369 257
366 268
WB EB
322 410
818 775
1092 844
979 579
1184 786
1115 710
WB EB
29 65
118 262
244 586
380 384
429 382
440 390
NB SB
182 156
761 398
1321 679
803 491
942 969
781 683
WB EB
350 628
978 1365
1331 1817
1380 1085
1662 1344
1659 1252
Hour Periods
06:00- 07:00
07:00-08:00
08:00-09:00
15:00-16:00
16:00-17:00
17:00-18:00
WB EB
360 532
1106 1010
1692 1205
1112 1131
1040 1442
1195 1174
WB EB
72 38
267 151
545 597
414 377
487 471
457 487
Wylfa Newydd Power Station App C2.04 - DCO TA Appendix I - VISSIM Model ResultsDevelopment Consent Order
Page 19
Figure 2-4 Bluetooth locations
Wylfa Newydd Power Station App C2.04 - DCO TA Appendix I - VISSIM Model ResultsDevelopment Consent Order
Page 20
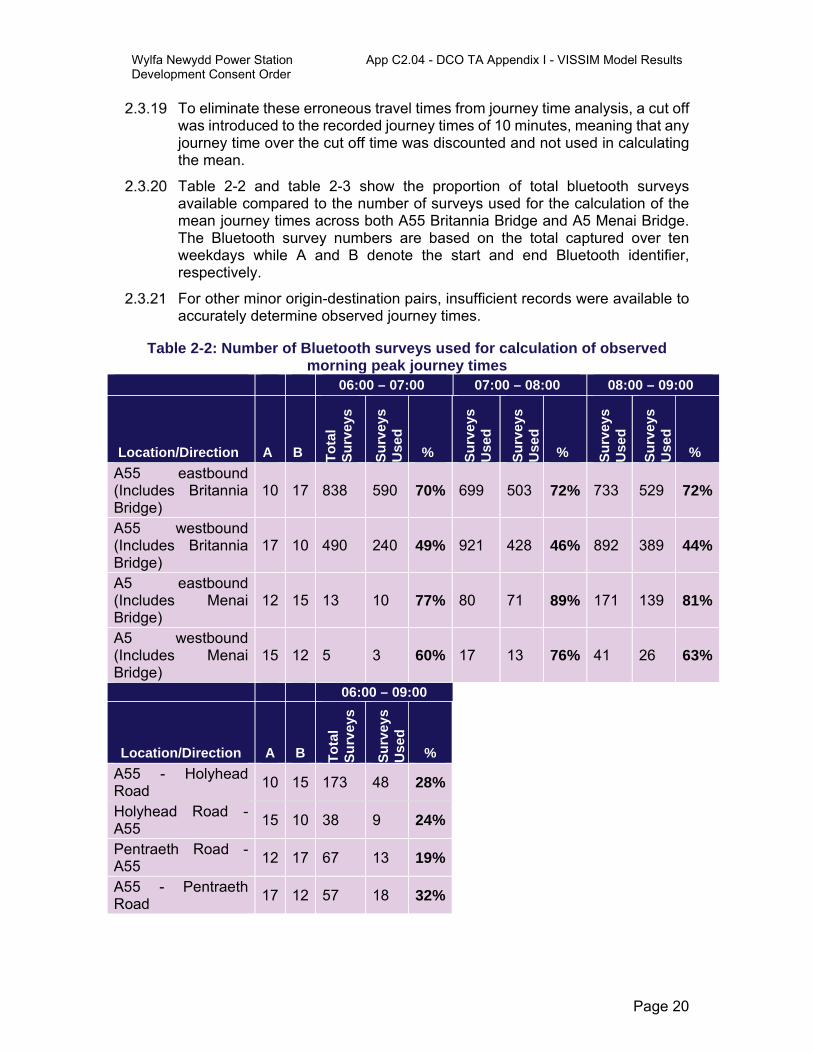
To eliminate these erroneous travel times from journey time analysis, a cut off was introduced to the recorded journey times of 10 minutes, meaning that any journey time over the cut off time was discounted and not used in calculating the mean.
Table 2-2 and table 2-3 show the proportion of total bluetooth surveys available compared to the number of surveys used for the calculation of the mean journey times across both A55 Britannia Bridge and A5 Menai Bridge. The Bluetooth survey numbers are based on the total captured over ten weekdays while A and B denote the start and end Bluetooth identifier, respectively.
For other minor origin-destination pairs, insufficient records were available to accurately determine observed journey times.
Table 2-2: Number of Bluetooth surveys used for calculation of observed morning peak journey times
06:00 – 07:00 07:00 – 08:00 08:00 – 09:00
Location/Direction A B To
tal
Su
rvey
s
Su
rvey
s U
sed
% Su
rvey
s U
sed
Su
rvey
s U
sed
% Su
rvey
s U
sed
Su
rvey
s U
sed
%
A55 eastbound (Includes Britannia Bridge)
10 17 838 590 70% 699 503 72% 733 529 72%
A55 westbound (Includes Britannia Bridge)
17 10 490 240 49% 921 428 46% 892 389 44%
A5 eastbound (Includes Menai Bridge)
12 15 13 10 77% 80 71 89% 171 139 81%
A5 westbound (Includes Menai Bridge)
15 12 5 3 60% 17 13 76% 41 26 63%
06:00 – 09:00
Location/Direction A B To
tal
Su
rvey
s
Su
rvey
s U
sed
%
A55 - Holyhead Road
10 15 173 48 28%
Holyhead Road - A55
15 10 38 9 24%
Pentraeth Road - A55
12 17 67 13 19%
A55 - Pentraeth Road
17 12 57 18 32%

Wylfa Newydd Power Station App C2.04 - DCO TA Appendix I - VISSIM Model ResultsDevelopment Consent Order
Page 21
Table 2-3 Number of Bluetooth surveys used for calculation of observed evening peak journey times
15:00 – 16:00 16:00 – 17:00 17:00 – 18:00
Location/Direction A B To
tal
Su
rvey
s
Su
rvey
s U
sed
% Su
rvey
s U
sed
Su
rvey
s U
sed
% Su
rvey
s U
sed
Su
rvey
s U
sed
%
A55 eastbound (Includes Britannia Bridge)
10 17 840 509 61% 859 533 62% 753 535 71%
A55 westbound (Includes Britannia Bridge)
17 10 925 399 43% 972 409 42% 857 357 42%
A5 eastbound (Includes Menai Bridge)
12 15 63 44 70% 55 40 73% 58 40 69%
A5 westbound (Includes Menai Bridge)
15 12 126 82 65% 181 138 76% 167 141 84%
15:00 – 18:00
Location/Direction A B To
tal
Su
rvey
s
Su
rvey
s U
sed
%
A55 - Holyhead Road
10 15 99 26 26%
Holyhead Road - A55
15 10 208 81 39%
Pentraeth Road - A55
12 17 78 24 31%
A55 - Pentraeth Road
17 12 116 20 17%
The sample rate for the westbound direction was lower than those for the eastbound direction because it was not possible to identify safe locations for bluetooth equipment to be installed that would have resulted in a higher sample rate. However, the sample rates for both directions meet WebTAG requirements (WebTAG M12 Data Sources and Surveys) that the 95% confidence level of the mean of the observations is ± 10% or less over the whole route (see table 2-4 and table 2-5).

Wylfa Newydd Power Station App C2.04 - DCO TA Appendix I - VISSIM Model ResultsDevelopment Consent Order
Page 22
Table 2-4 Eastbound calculation of journey time sample confidence interval across A55 Britannia Bridge
Hour Period 06:00-07:00
07:00-08:00
08:00-09:00
15:00-16:00
16:00-17:00
17:00-18:00
Total Bluetooth Surveys (number used)
590 503 529 509 533 535
Square root of Total Bluetooth Survey
24.29 22.43 23.00 22.56 23.09 23.13
t-score - scaling factor (p,n-1)
1.9640 1.9647 1.9645 1.9646 1.9644 1.9644
Average Journey Time (mm:ss)
03:27 03:41 05:00 03:36 03:33 04:13
Journey Time Standard deviation (mm:ss)
00:27 00:34 01:32 00:28 00:30 01:19
Confidence interval (mm:ss)
00:02 00:03 00:08 00:02 00:03 00:07
Accuracy 1.0% 1.3% 2.6% 1.2% 1.2% 2.7%
Table 2-5 Westbound calculation of journey time sample confidence interval across A55 Britannia Bridge
Hour Period 06:00-07:00
07:00-08:00
08:00-09:00
15:00-16:00
16:00-17:00
17:00-18:00
Total Bluetooth Surveys (number used)
240 428 389 399 409 357
Square root of Total Bluetooth Survey
15.49 20.69 19.72 19.97 20.22 18.89
t-score - scalling factor (p,n-1)
1.9699 1.9655 1.9661 1.9659 1.9658 1.9666
Average Journey Time (mm:ss)
03:27 03:29 03:33 04:21 05:09 05:47
Journey Time Standard deviation (mm:ss)
00:20 00:38 00:32 01:13 01:11 00:56
Confidence interval (mm:ss)
00:03 00:04 00:03 00:07 00:07 00:06
Accuracy 1.3% 1.7% 1.5% 2.7% 2.2% 1.7%
Wylfa Newydd Power Station App C2.04 - DCO TA Appendix I - VISSIM Model ResultsDevelopment Consent Order
Page 23
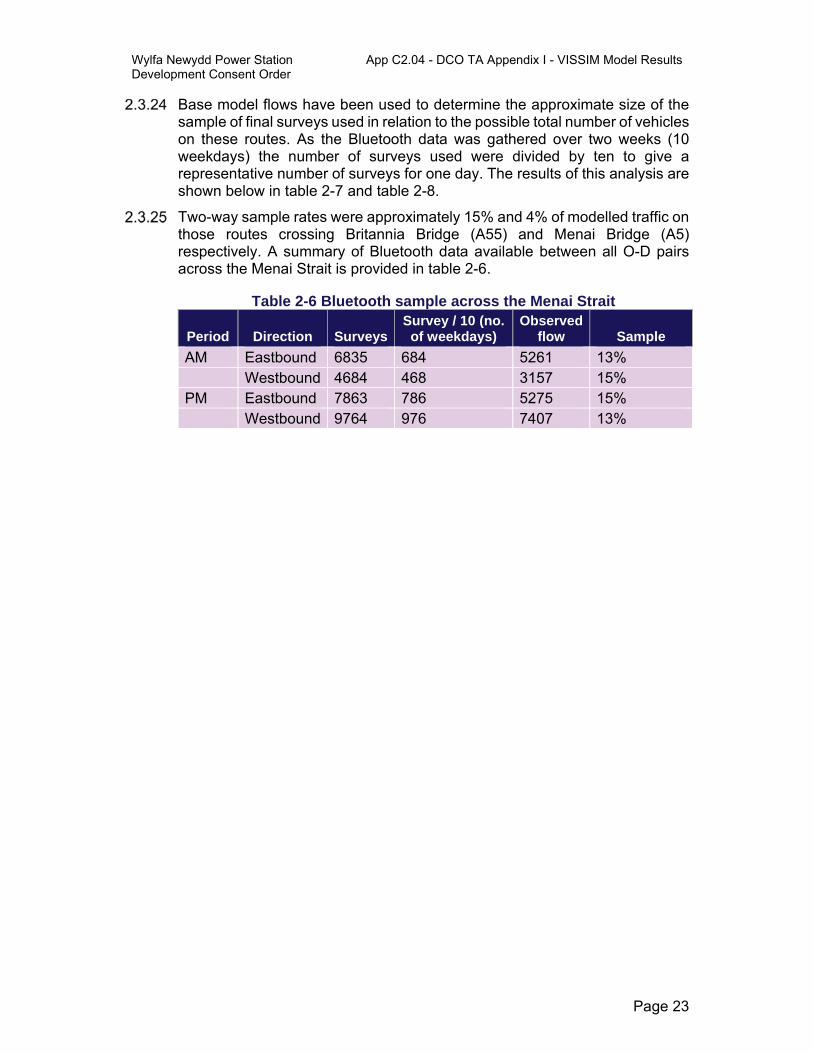
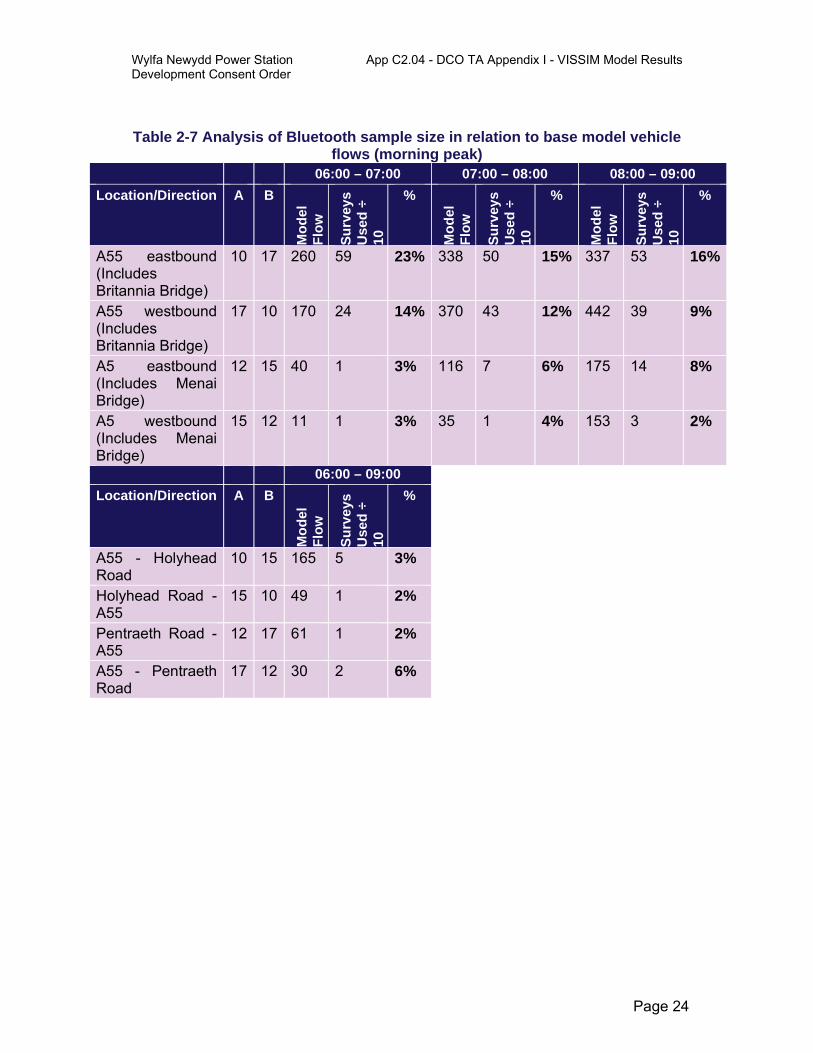
Base model flows have been used to determine the approximate size of the sample of final surveys used in relation to the possible total number of vehicles on these routes. As the Bluetooth data was gathered over two weeks (10 weekdays) the number of surveys used were divided by ten to give a representative number of surveys for one day. The results of this analysis are shown below in table 2-7 and table 2-8.
Two-way sample rates were approximately 15% and 4% of modelled traffic on those routes crossing Britannia Bridge (A55) and Menai Bridge (A5) respectively. A summary of Bluetooth data available between all O-D pairs across the Menai Strait is provided in table 2-6.
Table 2-6 Bluetooth sample across the Menai Strait
Period Direction SurveysSurvey / 10 (no.
of weekdays) Observed
flow Sample
AM Eastbound 6835 684 5261 13% Westbound 4684 468 3157 15% PM Eastbound 7863 786 5275 15% Westbound 9764 976 7407 13%
Wylfa Newydd Power Station App C2.04 - DCO TA Appendix I - VISSIM Model ResultsDevelopment Consent Order
Page 24
Table 2-7 Analysis of Bluetooth sample size in relation to base model vehicle flows (morning peak)
06:00 – 07:00 07:00 – 08:00 08:00 – 09:00
Location/Direction A B
Mo
del
F
low
Su
rvey
s U
sed
÷
10
%
Mo
del
F
low
Su
rvey
s U
sed
÷
10
%
Mo
del
F
low
Su
rvey
s U
sed
÷
10
%
A55 eastbound (Includes Britannia Bridge)
10 17 260 59 23% 338 50 15% 337 53 16%
A55 westbound (Includes Britannia Bridge)
17 10 170 24 14% 370 43 12% 442 39 9%
A5 eastbound (Includes Menai Bridge)
12 15 40 1 3% 116 7 6% 175 14 8%
A5 westbound (Includes Menai Bridge)
15 12 11 1 3% 35 1 4% 153 3 2%
06:00 – 09:00
Location/Direction A B
Mo
del
F
low
Su
rvey
s U
sed
÷
10
%
A55 - Holyhead Road
10 15 165 5 3%
Holyhead Road - A55
15 10 49 1 2%
Pentraeth Road - A55
12 17 61 1 2%
A55 - Pentraeth Road
17 12 30 2 6%

Wylfa Newydd Power Station App C2.04 - DCO TA Appendix I - VISSIM Model ResultsDevelopment Consent Order
Page 25
Table 2-8 Analysis of Bluetooth sample size in relation to base model vehicle flows (evening peak)
15:00 – 16:00 16:00 – 17:00 17:00 – 18:00
Location/Direction A B
Mo
del
F
low
Su
rvey
s U
sed
÷
10
%
Mo
del
F
low
Su
rvey
s U
sed
÷
10
%
Mo
del
F
low
Su
rvey
s U
sed
÷
10
%
A55 eastbound (Includes Britannia Bridge)
10 17 227 51 22%
327 53 16% 219 54 24%
A55 westbound (Includes Britannia Bridge)
17 10 243 40 16%
335 41 12% 434 36 8%
A5 eastbound (Includes Menai Bridge)
12 15 128 4 3% 153 4 3% 145 4 3%
A5 westbound (Includes Menai Bridge)
15 12 233 8 4% 406 14 3% 420 14 3%
15:00 – 18:00
Location/Direction A B
Mo
del
F
low
Su
rvey
s U
sed
÷
10
%
A55 - Holyhead Road
10 15 163 3 2%
Holyhead Road - A55
15 10 170 8 5%
Pentraeth Road - A55
12 17 84 2 3%
A55 - Pentraeth Road
17 12 68 2 3%
The mean journey times across the two bridges were calculated from the Bluetooth data and as shown in table 2-9 and table 2-10, where A and B denote the start and end Bluetooth identifier, respectively.
Journey times are dissagregated by hour for major movements across the Britannia and Menai Bridges. Journey time data by model period are available between the A55 and Holyhead Road and the A55 and Pentraeth Road.

Wylfa Newydd Power Station App C2.04 - DCO TA Appendix I - VISSIM Model ResultsDevelopment Consent Order
Page 26
Table 2-9 Bluetooth AM journey times across the bridges 06:00
(seconds) 07:00
(seconds) 08:00
(seconds)
Location/Direction A B Observed Observed Observed
A55 eastbound (Includes Britannia Bridge)
10 17 207 221 300
A55 westbound (Includes Britannia Bridge)
17 10 207 209 213
A5 eastbound (Includes Menai Bridge)
12 15 146 174 234
A5 westbound (Includes Menai Bridge)
15 12 156 168 203
06:00-09:00 (seconds)
Location/Direction A B Observed
A55 - Holyhead Road 10 15 357 Holyhead Road - A55 15 10 332 Pentraeth Road - A55 12 17 339 A55 - Pentraeth Road 17 12 322
Table 2-10 Bluetooth PM journey times across the bridges 15:00
(seconds) 16:00
(seconds) 17:00
(seconds)
Location/Direction A B Observed Observed Observed
A55 eastbound (Includes Britannia Bridge)
10 17 216 213 253
A55 westbound (Includes Britannia Bridge)
17 10 221 259 307
A5 eastbound (Includes Menai Bridge)
12 15 210 205 205
A5 westbound (Includes Menai Bridge)
15 12 214 227 241
15:00-18:00 (seconds)
Location/Direction A B Observed
A55 - Holyhead Road 10 15 306 Holyhead Road - A55 15 10 385 Pentraeth Road - A55 12 17 388 A55 - Pentraeth Road 17 12 454
Video surveys
A video survey was undertaken at all the locations of the turning counts during the March 2016 counts (figure 2-2):
Junction 8 A55;

Wylfa Newydd Power Station App C2.04 - DCO TA Appendix I - VISSIM Model ResultsDevelopment Consent Order
Page 27
Junction 8a A55;
Junction 9 north roundabout A55;
Junction 9 south roundabout A55;
Junction 10 A55;
Junction 11 A55;
A55 north of Britannia Bridge; and
A55 south of Britannia Bridge.
Cameras were placed on each arm of the junctions to capture all turning movements. The location of these surveys ensured counts were available for all of the junctions on the A55 that are included in the model area. The two camera locations north and south of Britannia Bridge enabled queuing on the approaches to be reviewed.
Video surveys are consistent with conditions experienced during the site visit. Eastbound queuing commenced around 08:00 and continued through to 09:00. Westbound queuing commenced around 17:15.
Video footage show that the short merge lengths at Junction 8a and 9 can make it difficult for traffic to join the A55. For short periods, the resulting difference in speed between main line and merging traffic prevents safe entry, causing queues to form.
Conclusions/ key trends
Generally, the data show a strong level of consistency across each survey. Turning count data is consistent with supporting ATC data. Bluetooth journey times are consistent with on-site observations, with the expanded June sample providing greater accuracy across a wider number of movements. Video surveys are consistent with both journey time data and site visit conditions.
Generally, the survey data highlight an eastbound tidal flow from Anglesey to the mainland in the morning peak with the reverse tidal flow in the evening peak. Morning peak queuing commences eastbound around 08:00 and continues until after 09:00. At its peak, queuing extends to midway between Junctions 8a and 8. Evening peak westbound queuing commences around 17:15 (with short period queuing after 16:30) and continues until 18:00. At their maximum, these extend to Junction 9 on the A55 with further queuing on the A487 on-slip back towards and occasionally onto the roundabout.
Matrix development
Matrix development
To replicate travel demand, a model zone system was developed. Each zone represents an origin or destination with a matrix of traffic assigned to or from each, as shown in figure 2-5.

Wylfa Newydd Power Station App C2.04 - DCO TA Appendix I - VISSIM Model ResultsDevelopment Consent Order
Page 28
The majority of zones represent either the edge of the model (external demand) or local roads within the modelled area. A small number of zones represent simplified centres of population, for example along the A5. Table 2-11 show which roads the zone number corresponds to.

Wylfa Newydd Power Station App C2.04 - DCO TA Appendix I - VISSIM Model ResultsDevelopment Consent Order
Page 29
Figure 2-5 Zone system

Wylfa Newydd Power Station App C2.04 - DCO TA Appendix I - VISSIM Model ResultsDevelopment Consent Order
Page 30
Table 2-11 Zone names Zone Number
Zone Name Zone Number
Zone Name Zone Number
Zone Name
1 A55 west 11 New Street 21 Off A4087 2 A5152 12 Unclassified
Road 22 A487 (Y
Felinheli Bypass)
3 A5025 (Pentraeth Road)
13 Unclassified Road
23 B4547
4 Lon Refail (Local)
14 A5 (Holyhead Road
24 Off A487
5 B5420 (Ffordd Penmynydd
15 Off A487 25 Unclassified Road
6 Off A5025 16 Unclassified Road
26 Off A5 west
7 Off B5420 (Pentraeth Road)
17 A4087 (Caernarfon Road)
27 A4080 (Ffordd Brynsiencyn)
8 Dale Street 18 A5 north 28 Off A5 west 9 Off Mona
Road 19 A55 east 29 A5 west
10 A545 (Cadnant Road)
20 A5 south 30 Off A5152
Matrix development has been undertaken in two stages. A simple initial matrix has been created from turning count data using the traffic volumes and the percentage distribution passing through the entry and exit of each survey location along the model network.
These preliminary matrices have been assigned to a simple VISUM network that reflects the VISSIM model study area. The reason for using VISUM software is explained below. A process of matrix estimation has then been applied, using the turning count data to adjust travel demands to better reflect observed values. As part of the procedure, the GEH of the turning count data were compared with the VISUM values in order to confirm the calibration of the matrices and be certain that the resulting demands were accurate. The resulting matrices have then been imported into the VISSIM model following the completion of the matrix estimation process in VISUM.
Wylfa Newydd Power Station App C2.04 - DCO TA Appendix I - VISSIM Model ResultsDevelopment Consent Order
Page 31
It is important that matrix estimation does not significantly change the shape of the matrix; otherwise, observed data can be lost. Pre- and post-matrix estimation trip lengths have been checked to ensure that matrix changes are minimised.
The matrix estimation process was carried on all hour periods in the modelled morning peak (06:00-07:00, 07:00-08:00 and 08:00-09:00) and modelled evening peak (15:00-16:00, 16:00-17:00 and 17:00-18:00). The change in trip length distribution as a result of the estimation process is given in figure 2-6 and figure 2-7 for the morning (08:00-09:00) and evening peak (17:00-18:00) respectively.
Matrix estimation
Matrix estimation tries to improve the fit between observed and modelled flows by factoring individual cells of the input matrix. In many modelling packages, the matrix estimation methods employed rely on multiple factoring of a matrix until a solution is derived. Factoring is undertaken in series, and because many of the values in the matrix are affected by multiple control counts, the process has to be repeated iteratively until a suitable correlation is found for all the counts. Inevitably, this means that those trips that are affected by fewer control counts (usually the shorter trips) are subject to more extreme aggregate factors and this can distort the trip distribution.
The matrix estimation process in VISUM is more complex and hence is less prone to such distortions; it attempts to find suitable factors by considering all control counts simultaneously. The most noticeable advantage of this is that the trip distribution is maintained, whilst still producing a good correlation between the count data and predicted flows.

Wylfa Newydd Power Station App C2.04 - DCO TA Appendix I - VISSIM Model ResultsDevelopment Consent Order
Page 32
Figure 2-6 AM pre versus post trip length distribution
Figure 2-7 PM pre versus post trip length distribution
15 minute period matrices
Matrices have been disaggregated by 15 minute periods to replicate the observed profile of demand. This approach was adopted because within a peak hour, the peak 15 minutes of demand may be significantly higher than the remainder of the period. Disaggregating matrices by 15 minute periods enables the effects of ‘peak-within-peak’ demand to be replicated.
Factors to derive each 15 minute matrix were calculated based on the
0.0%
2.0%
4.0%
6.0%
8.0%
10.0%
12.0%
14.0%
0.5 1
1.5 2 3 4 5 6 7 8 9 10 11 12 13 14 15 16 17 18 19 20 21 22 23 24 25
Pe
rcen
tag
e o
f T
rip
s
Trip Length (km)
Post
Pre
0.0%
2.0%
4.0%
6.0%
8.0%
10.0%
12.0%
14.0%
0.5 1
1.5 2 3 4 5 6 7 8 9 10 11 12 13 14 15 16 17 18 19 20 21 22 23 24 25
Pe
rcen
tag
e o
f T
rip
s
Trip Length (km)
Post
Pre
Wylfa Newydd Power Station App C2.04 - DCO TA Appendix I - VISSIM Model ResultsDevelopment Consent Order
Page 33
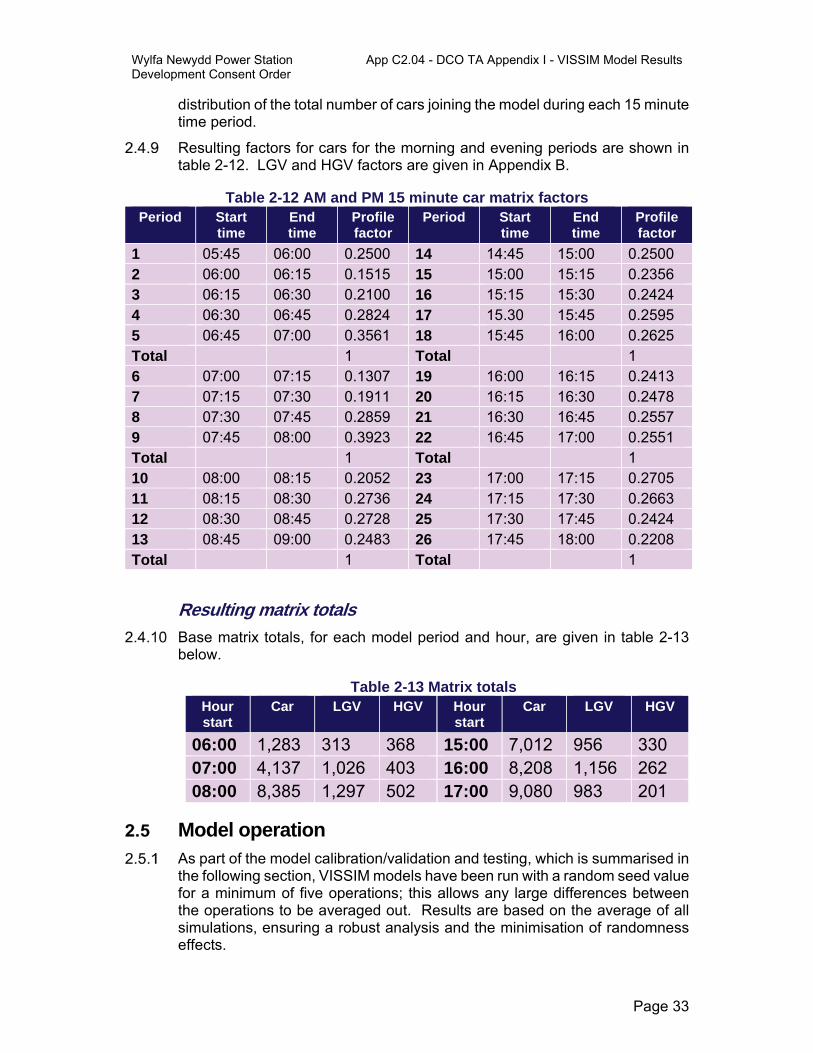
distribution of the total number of cars joining the model during each 15 minute time period.
Resulting factors for cars for the morning and evening periods are shown in table 2-12. LGV and HGV factors are given in Appendix B.
Table 2-12 AM and PM 15 minute car matrix factors Period Start
time End time
Profile factor
Period Start time
End time
Profile factor
1 05:45 06:00 0.2500 14 14:45 15:00 0.2500 2 06:00 06:15 0.1515 15 15:00 15:15 0.2356 3 06:15 06:30 0.2100 16 15:15 15:30 0.2424 4 06:30 06:45 0.2824 17 15.30 15:45 0.2595 5 06:45 07:00 0.3561 18 15:45 16:00 0.2625 Total 1 Total 1 6 07:00 07:15 0.1307 19 16:00 16:15 0.2413 7 07:15 07:30 0.1911 20 16:15 16:30 0.2478 8 07:30 07:45 0.2859 21 16:30 16:45 0.2557 9 07:45 08:00 0.3923 22 16:45 17:00 0.2551 Total 1 Total 1 10 08:00 08:15 0.2052 23 17:00 17:15 0.2705 11 08:15 08:30 0.2736 24 17:15 17:30 0.2663 12 08:30 08:45 0.2728 25 17:30 17:45 0.2424 13 08:45 09:00 0.2483 26 17:45 18:00 0.2208 Total 1 Total 1
Resulting matrix totals
Base matrix totals, for each model period and hour, are given in table 2-13 below.
Table 2-13 Matrix totals Hour start
Car LGV HGV Hour start
Car LGV HGV
06:00 1,283 313 368 15:00 7,012 956 330 07:00 4,137 1,026 403 16:00 8,208 1,156 262 08:00 8,385 1,297 502 17:00 9,080 983 201
Model operation As part of the model calibration/validation and testing, which is summarised in
the following section, VISSIM models have been run with a random seed value for a minimum of five operations; this allows any large differences between the operations to be averaged out. Results are based on the average of all simulations, ensuring a robust analysis and the minimisation of randomness effects.
Wylfa Newydd Power Station App C2.04 - DCO TA Appendix I - VISSIM Model ResultsDevelopment Consent Order
Page 34
Validation criteria and modelling guidelines Welsh Government Transport Appraisal Guidance (WelTAG) (RD1) requires
the application of UK Department for Transport WebTAG standards in the development of transport models (RD2). Consequently, the adequacy of the Britannia Bridge VISSIM Model calibration and validation was measured against WebTAG, (RD2).
The appraisal guidance sets out measures to compare the base year model against observed independent data to quantify the level of fit. Primary model calibration/ validation measures are:
assigned flows and count comparison on individual links and turning movements at junctions, as a check on the quality of the assignment; and
modelled and observed journey time comparison along routes, as a check on the quality of the network and the assignment.
Guidance criteria are strictly for model validation; however, they are typically used to assess the quality of both the model calibration and validation.
Link flow and turning movement calibration criteria
Two model calibration measures are used:
the GEH statistic, which is useful in comparing two different values of flow on a link. The GEH statistic is defined as:
GEH = √ [ (Modelled-Observed) 2 / { (Observed + Modelled)/ 2 } ].
the absolute and percentage differences between modelled flows and counts.
Both measures are broadly consistent, and link and turning flows that meet either criterion should be regarded as satisfactory.
Confirmation of calibration criteria is given in table 2-14 below. WebTAG requires that results are presented for both car and total vehicles.
Calibration/validation
Model calibration data are used directly in the development of the model network and/ or matrices. It is used to help refinement of the model and optimise performance.
Calibration data typically include link and turning volumes.
Model validation data are not used directly in the model development process. Instead, outputs from the model are compared with these independent data sets to authenticate performance.
Validation data include journey time and routing data.

Wylfa Newydd Power Station App C2.04 - DCO TA Appendix I - VISSIM Model ResultsDevelopment Consent Order
Page 35
Table 2-14 Link flow and turning movement calibration criteria Description of criteria Acceptability
guideline
Individual flows within 100 veh/hr of counts for flows less than 700 veh/hr
>85% of cases
Individual flows within 15% of counts for flows from 700 veh/hr to 2,700 veh/hr
>85% of cases
Individual flows within 400 veh/hr of counts for flows more than 2,700 veh/hr
>85% of cases
GEH <5 for individual flows >85% of cases
Journey time validation criteria
Morning and evening base VISSIM model journey times have been validated against observed survey data. WebTAG guidance has been used to validate the journey time data as specified in table 2-15.
Table 2-15 Journey time validation criteria Description of criteria Acceptability guideline
Modelled times along routes should be within 15% of surveyed time, or within one minute if higher
>85% of routes
Wylfa Newydd Power Station App C2.04 - DCO TA Appendix I - VISSIM Model ResultsDevelopment Consent Order
Page 36
3. Model calibration and validation
Calibration process The VISSIM model has been calibrated to accurately model existing (base)
traffic conditions. Initial model assignments have been improved through minor adjustments to the trip matrices.
Routing has been optimised by adjusting link speeds and costs. Link speeds are based on sign-posted values, although local speed reductions apply at junction movements. The application of link costs helps specify major and minor roads within the network. The major A55 route has zero cost factors, local road cost factors are typically six and slip roads are generally set to 20 to avoid illogical local routing. In a small number of locations, a surcharge has also been applied to reflect actual routing patterns from the Bluetooth data.
Merge and give way parameters have been reviewed for appropriateness. Generally, locations which act as zone centroids have been coded without restriction. This improves model stability as, otherwise, traffic may queue unrealistically to enter the network.
Roundabout performance has also been reviewed and adjusted where necessary. Key parameters are ‘avoid blocking back’ and ‘anticipate routing’. The former helps reduce the potential for roundabouts to lock up in busy traffic conditions. The latter can help increase capacity as vehicles approaching the give way line anticipate the routing of circulating traffic.
Network calibration has been an iterative process with minor adjustments made each time. The results have been reviewed with further minor changes made. The overall aim has been to achieve the best balance between turning count calibration, journey times, routing and queuing
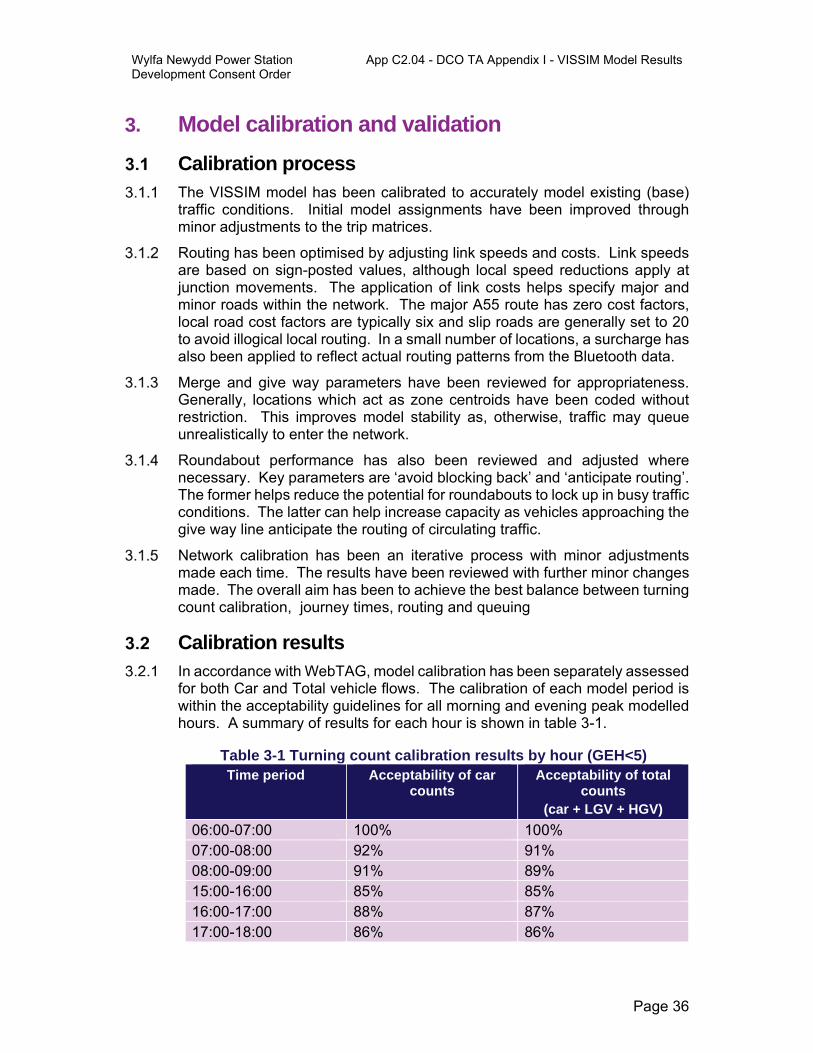
Calibration results In accordance with WebTAG, model calibration has been separately assessed
for both Car and Total vehicle flows. The calibration of each model period is within the acceptability guidelines for all morning and evening peak modelled hours. A summary of results for each hour is shown in table 3-1.
Table 3-1 Turning count calibration results by hour (GEH<5) Time period Acceptability of car
counts Acceptability of total
counts (car + LGV + HGV)
06:00-07:00 100% 100% 07:00-08:00 92% 91% 08:00-09:00 91% 89% 15:00-16:00 85% 85% 16:00-17:00 88% 87% 17:00-18:00 86% 86%

Wylfa Newydd Power Station App C2.04 - DCO TA Appendix I - VISSIM Model ResultsDevelopment Consent Order
Page 37
Note that the 15 minute warm up period in each model has been excluded from the calibration.
Generally, there is a high level of calibration across both the morning and evening peak periods. During the busiest times of the model 08:00-09:00 and 17:00-18:00, 91% and 86% of modelled car flows pass WebTAG GEH standards. Similarly, 89% and 86% of Total vehicle flow locations calibrate to observed values in the same morning and evening period hours, passing WebTAG GEH standards.
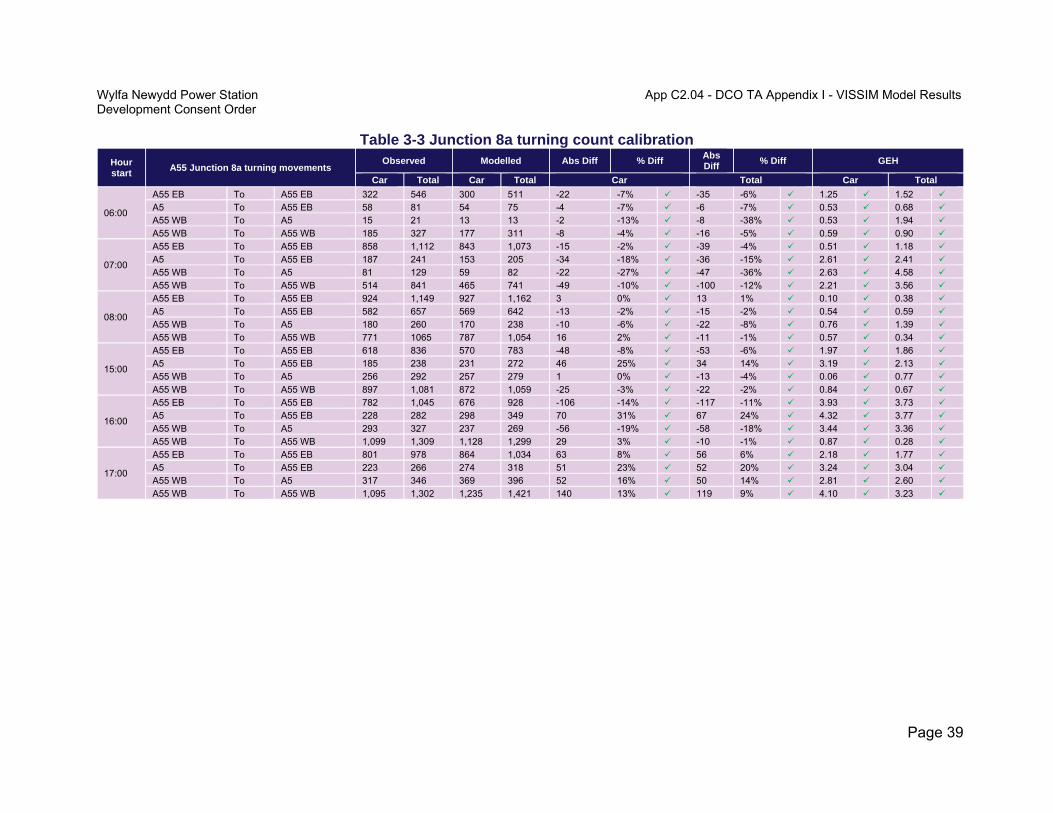
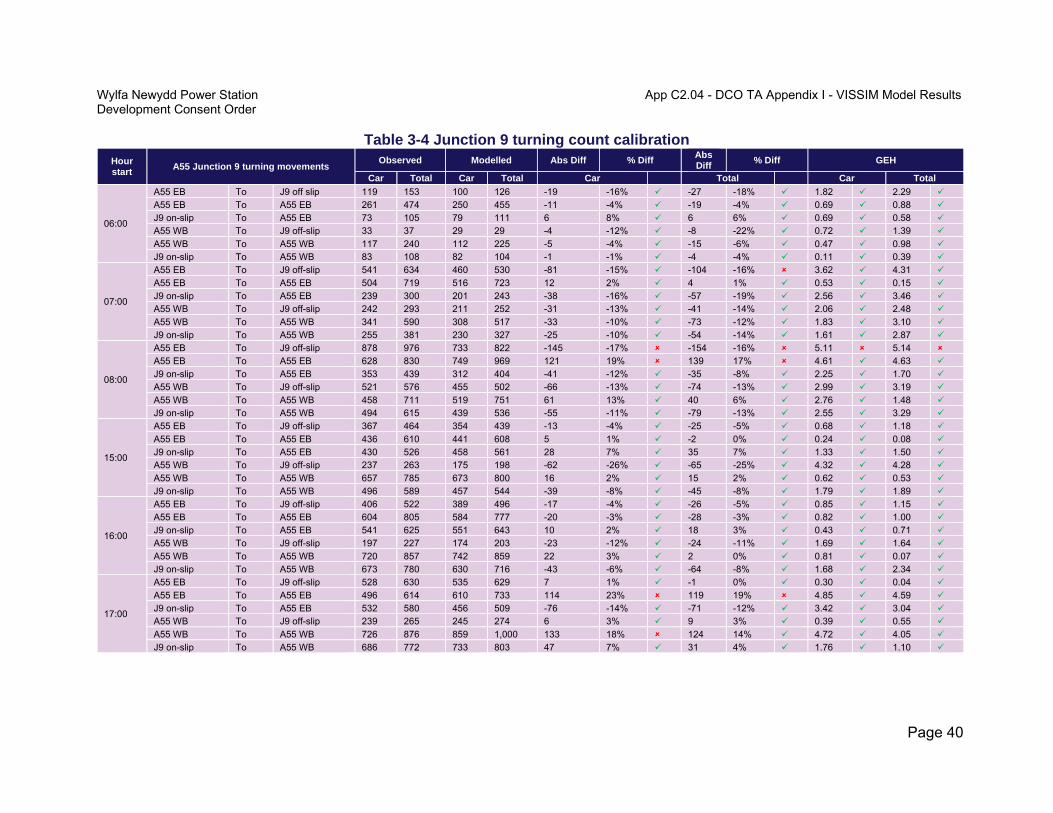
Table 3-2 to table 3-6, summarise observed and modelled turning flow calibration eastbound (EB), westbound (WB), northbound (NB) and southbound (SB) for key network junctions including A55 Junctions 8, 8a and 9 and Menai Bridge approaches.
Full calibration results by model hour, for each model period, are provided in Appendix C.

Wylfa Newydd Power Station App C2.04 - DCO TA Appendix I - VISSIM Model ResultsDevelopment Consent Order
Page 38
Table 3-2 Junction 8 turning count calibration Hour start
A55 Junction 8 turning movements Observed Modelled
Abs Diff
% Diff Abs Diff
% Diff GEH
Car Total Car Total Car Total Car Total
06:00
A55 EB To A5025 14 22 34 45 20 143% 23 105% 4.08 3.97 A55 EB To A55 EB 224 410 208 405 -16 -7% -5 -1% 1.09 0.25 A5025 To A55 EB 98 136 93 129 -5 -5% -7 -5% 0.51 0.61 A55 WB To A5025 30 43 15 18 -15 -50% -25 -58% 3.16 4.53 A55 WB To A55 WB 155 284 160 293 5 3% 9 3% 0.40 0.53 A5025 To A55 WB 31 38 31 43 0 0% 5 13% 0.00 0.79
07:00
A55 EB To A5025 99 128 125 173 26 26% 45 35% 2.46 3.67 A55 EB To A55 EB 575 773 584 769 9 2% -4 -1% 0.37 0.14 A5025 To A55 EB 283 339 297 351 14 5% 12 4% 0.82 0.65 A55 WB To A5025 95 159 36 50 -59 -62% -109 -69% 7.29 10.66 A55 WB To A55 WB 419 682 426 685 7 2% 3 0% 0.34 0.11 A5025 To A55 WB 105 133 91 115 -14 -13% -18 -14% 1.41 1.62
08:00
A55 EB To A5025 233 288 245 308 12 5% 20 7% 0.78 1.16 A55 EB To A55 EB 665 842 660 830 -5 -1% -12 -1% 0.19 0.42 A5025 To A55 EB 259 307 245 307 -14 -5% 0 0% 0.88 0.00 A55 WB To A5025 163 235 120 145 -43 -26% -90 -38% 3.61 6.53 A55 WB To A55 WB 608 830 667 912 59 10% 82 10% 2.34 2.78 A5025 To A55 WB 196 251 151 187 -45 -23% -64 -25% 3.42 4.32
15:00
A55 EB To A5025 129 165 204 244 75 58% 79 48% 5.81 5.52 A55 EB To A55 EB 418 579 425 588 7 2% 9 2% 0.34 0.37 A5025 To A55 EB 200 257 144 193 -56 -28% -64 -25% 4.27 4.27 A55 WB To A5025 279 315 258 286 -21 -8% -29 -9% 1.28 1.67 A55 WB To A55 WB 618 766 613 773 -5 -1% 7 1% 0.20 0.25 A5025 To A55 WB 177 210 227 260 50 28% 50 24% 3.52 3.26
16:00
A55 EB To A5025 168 203 231 277 63 38% 74 36% 4.46 4.78 A55 EB To A55 EB 574 780 554 743 -20 -3% -37 -5% 0.84 1.34 A5025 To A55 EB 208 265 124 176 -84 -40% -89 -34% 6.52 5.99 A55 WB To A5025 349 392 273 305 -76 -22% -87 -22% 4.31 4.66 A55 WB To A55 WB 750 917 852 990 102 14% 73 8% 3.60 2.36 A5025 To A55 WB 202 247 161 216 -41 -20% -31 -13% 3.04 2.04
17:00
A55 EB To A5025 165 200 254 298 89 54% 98 49% 6.15 6.21 A55 EB To A55 EB 583 707 592 708 9 2% 1 0% 0.37 0.04 A5025 To A55 EB 218 271 272 322 54 25% 51 19% 3.45 2.96 A55 WB To A5025 386 447 274 308 -112 -29% -139 -31% 6.17 7.15 A55 WB To A55 WB 709 855 964 1,113 255 36% 258 30% 8.82 8.22 A5025 To A55 WB 232 256 155 185 -77 -33% -71 -28% 5.54 4.78
Wylfa Newydd Power Station App C2.04 - DCO TA Appendix I - VISSIM Model ResultsDevelopment Consent Order
Page 39
Table 3-3 Junction 8a turning count calibration Hour start
A55 Junction 8a turning movements Observed Modelled Abs Diff % Diff
Abs Diff
% Diff GEH
Car Total Car Total Car Total Car Total
06:00
A55 EB To A55 EB 322 546 300 511 -22 -7% -35 -6% 1.25 1.52 A5 To A55 EB 58 81 54 75 -4 -7% -6 -7% 0.53 0.68 A55 WB To A5 15 21 13 13 -2 -13% -8 -38% 0.53 1.94 A55 WB To A55 WB 185 327 177 311 -8 -4% -16 -5% 0.59 0.90
07:00
A55 EB To A55 EB 858 1,112 843 1,073 -15 -2% -39 -4% 0.51 1.18 A5 To A55 EB 187 241 153 205 -34 -18% -36 -15% 2.61 2.41 A55 WB To A5 81 129 59 82 -22 -27% -47 -36% 2.63 4.58 A55 WB To A55 WB 514 841 465 741 -49 -10% -100 -12% 2.21 3.56
08:00
A55 EB To A55 EB 924 1,149 927 1,162 3 0% 13 1% 0.10 0.38 A5 To A55 EB 582 657 569 642 -13 -2% -15 -2% 0.54 0.59 A55 WB To A5 180 260 170 238 -10 -6% -22 -8% 0.76 1.39 A55 WB To A55 WB 771 1065 787 1,054 16 2% -11 -1% 0.57 0.34
15:00
A55 EB To A55 EB 618 836 570 783 -48 -8% -53 -6% 1.97 1.86 A5 To A55 EB 185 238 231 272 46 25% 34 14% 3.19 2.13 A55 WB To A5 256 292 257 279 1 0% -13 -4% 0.06 0.77 A55 WB To A55 WB 897 1,081 872 1,059 -25 -3% -22 -2% 0.84 0.67
16:00
A55 EB To A55 EB 782 1,045 676 928 -106 -14% -117 -11% 3.93 3.73 A5 To A55 EB 228 282 298 349 70 31% 67 24% 4.32 3.77 A55 WB To A5 293 327 237 269 -56 -19% -58 -18% 3.44 3.36 A55 WB To A55 WB 1,099 1,309 1,128 1,299 29 3% -10 -1% 0.87 0.28
17:00
A55 EB To A55 EB 801 978 864 1,034 63 8% 56 6% 2.18 1.77 A5 To A55 EB 223 266 274 318 51 23% 52 20% 3.24 3.04 A55 WB To A5 317 346 369 396 52 16% 50 14% 2.81 2.60 A55 WB To A55 WB 1,095 1,302 1,235 1,421 140 13% 119 9% 4.10 3.23
Wylfa Newydd Power Station App C2.04 - DCO TA Appendix I - VISSIM Model ResultsDevelopment Consent Order
Page 40
Table 3-4 Junction 9 turning count calibration Hour start
A55 Junction 9 turning movements Observed Modelled Abs Diff % Diff
Abs Diff
% Diff GEH
Car Total Car Total Car Total Car Total
06:00
A55 EB To J9 off slip 119 153 100 126 -19 -16% -27 -18% 1.82 2.29 A55 EB To A55 EB 261 474 250 455 -11 -4% -19 -4% 0.69 0.88 J9 on-slip To A55 EB 73 105 79 111 6 8% 6 6% 0.69 0.58 A55 WB To J9 off-slip 33 37 29 29 -4 -12% -8 -22% 0.72 1.39 A55 WB To A55 WB 117 240 112 225 -5 -4% -15 -6% 0.47 0.98 J9 on-slip To A55 WB 83 108 82 104 -1 -1% -4 -4% 0.11 0.39
07:00
A55 EB To J9 off-slip 541 634 460 530 -81 -15% -104 -16% 3.62 4.31 A55 EB To A55 EB 504 719 516 723 12 2% 4 1% 0.53 0.15 J9 on-slip To A55 EB 239 300 201 243 -38 -16% -57 -19% 2.56 3.46 A55 WB To J9 off-slip 242 293 211 252 -31 -13% -41 -14% 2.06 2.48 A55 WB To A55 WB 341 590 308 517 -33 -10% -73 -12% 1.83 3.10 J9 on-slip To A55 WB 255 381 230 327 -25 -10% -54 -14% 1.61 2.87
08:00
A55 EB To J9 off-slip 878 976 733 822 -145 -17% -154 -16% 5.11 5.14 A55 EB To A55 EB 628 830 749 969 121 19% 139 17% 4.61 4.63 J9 on-slip To A55 EB 353 439 312 404 -41 -12% -35 -8% 2.25 1.70 A55 WB To J9 off-slip 521 576 455 502 -66 -13% -74 -13% 2.99 3.19 A55 WB To A55 WB 458 711 519 751 61 13% 40 6% 2.76 1.48 J9 on-slip To A55 WB 494 615 439 536 -55 -11% -79 -13% 2.55 3.29
15:00
A55 EB To J9 off-slip 367 464 354 439 -13 -4% -25 -5% 0.68 1.18 A55 EB To A55 EB 436 610 441 608 5 1% -2 0% 0.24 0.08 J9 on-slip To A55 EB 430 526 458 561 28 7% 35 7% 1.33 1.50 A55 WB To J9 off-slip 237 263 175 198 -62 -26% -65 -25% 4.32 4.28 A55 WB To A55 WB 657 785 673 800 16 2% 15 2% 0.62 0.53 J9 on-slip To A55 WB 496 589 457 544 -39 -8% -45 -8% 1.79 1.89
16:00
A55 EB To J9 off-slip 406 522 389 496 -17 -4% -26 -5% 0.85 1.15 A55 EB To A55 EB 604 805 584 777 -20 -3% -28 -3% 0.82 1.00 J9 on-slip To A55 EB 541 625 551 643 10 2% 18 3% 0.43 0.71 A55 WB To J9 off-slip 197 227 174 203 -23 -12% -24 -11% 1.69 1.64 A55 WB To A55 WB 720 857 742 859 22 3% 2 0% 0.81 0.07 J9 on-slip To A55 WB 673 780 630 716 -43 -6% -64 -8% 1.68 2.34
17:00
A55 EB To J9 off-slip 528 630 535 629 7 1% -1 0% 0.30 0.04 A55 EB To A55 EB 496 614 610 733 114 23% 119 19% 4.85 4.59 J9 on-slip To A55 EB 532 580 456 509 -76 -14% -71 -12% 3.42 3.04 A55 WB To J9 off-slip 239 265 245 274 6 3% 9 3% 0.39 0.55 A55 WB To A55 WB 726 876 859 1,000 133 18% 124 14% 4.72 4.05 J9 on-slip To A55 WB 686 772 733 803 47 7% 31 4% 1.76 1.10

Wylfa Newydd Power Station App C2.04 - DCO TA Appendix I - VISSIM Model ResultsDevelopment Consent Order
Page 41
Table 3-5 Menai Bridge northern approach roundabout turning count calibration Hour start
Menai Bridge north approach turning movements Observed Modelled Abs Diff % Diff
Abs Diff
% Diff GEH
Car Total Car Total Car Total Car Total
06:00
A5 Mona Road EB To A5 Menai Bridge EB 53 60 62 66 9 17% 6 10% 1.19 0.76 A545 SB To A5 Menai Bridge EB 42 45 38 40 -4 -10% -5 -11% 0.63 0.77 A5 Menai Bridge WB To A5 Mona Road WB 14 19 19 21 5 36% 2 11% 1.23 0.45 A5 Menai Bridge WB To A545 NB 8 10 5 5 -3 -38% -5 -50% 1.18 1.83
07:00
A5 Mona Road EB To A5 Menai Bridge EB 224 251 233 263 9 4% 12 5% 0.60 0.75 A545 SB To A5 Menai Bridge EB 136 152 117 134 -19 -14% -18 -12% 1.69 1.51 A5 Menai Bridge WB To A5 Mona Road WB 50 67 53 82 3 6% 15 22% 0.42 1.74 A5 Menai Bridge WB To A545 NB 33 44 66 73 33 100% 29 66% 4.69 3.79
08:00
A5 Mona Road EB To A5 Menai Bridge EB 619 664 569 611 -50 -8% -53 -8% 2.05 2.10 A545 SB To A5 Menai Bridge EB 295 322 344 368 49 17% 46 14% 2.74 2.48 A5 Menai Bridge WB To A5 Mona Road WB 215 236 276 314 61 28% 78 33% 3.89 4.70 A5 Menai Bridge WB To A545 NB 88 112 56 70 -32 -36% -42 -38% 3.77 4.40
15:00
A5 Mona Road EB To A5 Menai Bridge EB 294 327 241 267 -53 -18% -60 -18% 3.24 3.48 A545 SB To A5 Menai Bridge EB 188 210 176 194 -12 -6% -16 -8% 0.89 1.13 A5 Menai Bridge WB To A5 Mona Road WB 406 435 326 358 -80 -20% -77 -18% 4.18 3.87 A5 Menai Bridge WB To A545 NB 192 218 174 188 -18 -9% -30 -14% 1.33 2.11
16:00
A5 Mona Road EB To A5 Menai Bridge EB 316 347 303 335 -13 -4% -12 -3% 0.74 0.65 A545 SB To A5 Menai Bridge EB 195 228 191 222 -4 -2% -6 -3% 0.29 0.40 A5 Menai Bridge WB To A5 Mona Road WB 600 654 709 772 109 18% 118 18% 4.26 4.42 A5 Menai Bridge WB To A545 NB 241 266 196 213 -45 -19% -53 -20% 3.04 3.42
17:00
A5 Mona Road EB To A5 Menai Bridge EB 271 303 281 303 10 4% 0 0% 0.60 0.00 A545 SB To A5 Menai Bridge EB 172 196 163 184 -9 -5% -12 -6% 0.70 0.87 A5 Menai Bridge WB To A5 Mona Road WB 778 842 874 958 96 12% 116 14% 3.34 3.87 A5 Menai Bridge WB To A545 NB 281 305 295 314 14 5% 9 3% 0.82 0.51

Wylfa Newydd Power Station App C2.04 - DCO TA Appendix I - VISSIM Model ResultsDevelopment Consent Order
Page 42
Table 3-6 Menai Bridge southern approach roundabout turning counts calibration Hour start
Menai Bridge south approach turning movements Observed Modelled Abs Diff % Diff
Abs Diff
% Diff GEH
Car Total Car Total Car Total Car Total
06:00
A5 Menai Bridge EB To A5 EB 42 46 41 41 -1 -2% -5 -11% 0.16 0.76 A5 Menai Bridge EB To A487 SB 56 61 58 64 2 4% 3 5% 0.26 0.38 A5 WB To A5 Menai Bridge WB 9 17 10 11 1 11% -6 -35% 0.32 1.60 A487 NB To A5 Menai Bridge WB 12 14 14 15 2 17% 1 7% 0.55 0.26
07:00
A5 Menai Bridge EB To A5 EB 132 155 135 157 3 2% 2 1% 0.26 0.16 A5 Menai Bridge EB To A487 SB 214 238 196 221 -18 -8% -17 -7% 1.26 1.12 A5 WB To A5 Menai Bridge WB 47 60 58 72 11 23% 12 20% 1.52 1.48 A487 NB To A5 Menai Bridge WB 51 67 74 95 23 45% 28 42% 2.91 3.11
08:00
A5 Menai Bridge EB To A5 EB 504 546 706 738 202 40% 192 35% 8.21 7.58 A5 Menai Bridge EB To A487 SB 402 428 278 310 -124 -31% -118 -28% 6.72 6.14 A5 WB To A5 Menai Bridge WB 181 205 188 206 7 4% 1 0% 0.52 0.07 A487 NB To A5 Menai Bridge WB 127 149 155 187 28 22% 38 26% 2.36 2.93
15:00
A5 Menai Bridge EB To A5 EB 247 274 213 230 -34 -14% -44 -16% 2.24 2.77 A5 Menai Bridge EB To A487 SB 239 264 195 225 -44 -18% -39 -15% 2.99 2.49 A5 WB To A5 Menai Bridge WB 396 435 388 414 -8 -2% -21 -5% 0.40 1.02 A487 NB To A5 Menai Bridge WB 207 222 115 136 -92 -44% -86 -39% 7.25 6.43
16:00
A5 Menai Bridge EB To A5 EB 246 280 217 243 -29 -12% -37 -13% 1.91 2.29 A5 Menai Bridge EB To A487 SB 274 305 268 303 -6 -2% -2 -1% 0.36 0.11 A5 WB To A5 Menai Bridge WB 500 541 506 544 6 1% 3 1% 0.27 0.13 A487 NB To A5 Menai Bridge WB 350 388 408 450 58 17% 62 16% 2.98 3.03
17:00
A5 Menai Bridge EB To A5 EB 206 228 188 203 -18 -9% -25 -11% 1.28 1.70 A5 Menai Bridge EB To A487 SB 232 268 245 277 13 6% 9 3% 0.84 0.55 A5 WB To A5 Menai Bridge WB 594 639 600 645 6 1% 6 1% 0.25 0.24 A487 NB To A5 Menai Bridge WB 473 515 569 628 96 20% 113 22% 4.21 4.73
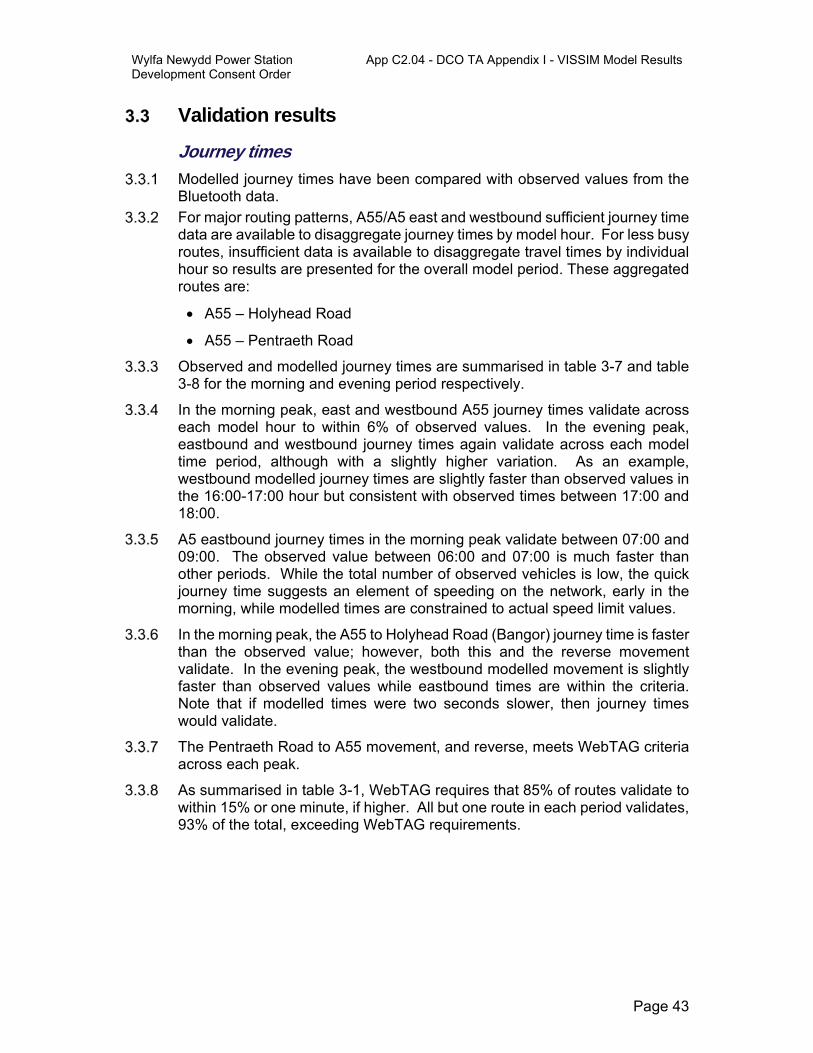
Wylfa Newydd Power Station App C2.04 - DCO TA Appendix I - VISSIM Model ResultsDevelopment Consent Order
Page 43
Validation results
Journey times
Modelled journey times have been compared with observed values from the Bluetooth data.
For major routing patterns, A55/A5 east and westbound sufficient journey time data are available to disaggregate journey times by model hour. For less busy routes, insufficient data is available to disaggregate travel times by individual hour so results are presented for the overall model period. These aggregated routes are:
A55 – Holyhead Road
A55 – Pentraeth Road
Observed and modelled journey times are summarised in table 3-7 and table 3-8 for the morning and evening period respectively.
In the morning peak, east and westbound A55 journey times validate across each model hour to within 6% of observed values. In the evening peak, eastbound and westbound journey times again validate across each model time period, although with a slightly higher variation. As an example, westbound modelled journey times are slightly faster than observed values in the 16:00-17:00 hour but consistent with observed times between 17:00 and 18:00.
A5 eastbound journey times in the morning peak validate between 07:00 and 09:00. The observed value between 06:00 and 07:00 is much faster than other periods. While the total number of observed vehicles is low, the quick journey time suggests an element of speeding on the network, early in the morning, while modelled times are constrained to actual speed limit values.
In the morning peak, the A55 to Holyhead Road (Bangor) journey time is faster than the observed value; however, both this and the reverse movement validate. In the evening peak, the westbound modelled movement is slightly faster than observed values while eastbound times are within the criteria. Note that if modelled times were two seconds slower, then journey times would validate.
The Pentraeth Road to A55 movement, and reverse, meets WebTAG criteria across each peak.
As summarised in table 3-1, WebTAG requires that 85% of routes validate to within 15% or one minute, if higher. All but one route in each period validates, 93% of the total, exceeding WebTAG requirements.
N

Wylfa Newydd Power Station App C2.04 - DCO TA Appendix I - VISSIM Model ResultsDevelopment Consent Order
Page 44
Table 3-7 AM journey time comparison
Location/Direction
06:00 (seconds) 07:00 (seconds) 08:00 (seconds)
A B
Ob
se
rve
d
Mo
de
lled
% d
iffe
ren
ce
Dif
fere
nc
e
(sec
on
ds
)
Pa
ss
Ob
se
rve
d
Mo
de
lled
% d
iffe
ren
ce
Dif
fere
nc
e
(sec
on
ds
)
Pa
ss
Ob
se
rve
d
Mo
de
lled
% d
iffe
ren
ce
Dif
fere
nc
e
(sec
on
ds
)
Pa
ss
A55 eastbound (includes Britannia Bridge) 10 17 207 208 0% 221 216 -2% 300 301 0%
A55 westbound (includes Britannia Bridge)
17 10 207 200 -3% 209 204 -3% 213 20 -2%
A5 eastbound (includes Menai Bridge) 12 15 146 220 51% 74.3 174 223 28% 49.2 234 254 9%
A5 westbound (includes Menai Bridge) 15 12 156 168 8% 168 171 2% 203 181 -11%
06:00-09:00 (seconds)
A55 - Holyhead Road 10 15 357 303 -15% 54.3
Holyhead Road - A55 15 10 332 296 -11%
Pentraeth Road - A55 12 17 339 349 3%
A55 - Pentraeth Road 17 12 322 361 12%

Wylfa Newydd Power Station App C2.04 - DCO TA Appendix I - VISSIM Model ResultsDevelopment Consent Order
Page 45
Table 3-8 PM journey time comparison
Location/direction
15:00 (seconds) 16:00 (seconds) 17:00 (seconds)
A B
Ob
se
rve
d
Mo
de
lled
%
dif
fere
nce
Dif
fere
nc
e (s
eco
nd
s)
Pa
ss
Ob
se
rve
d
Mo
de
lled
%
dif
fere
nce
Dif
fere
nc
e (s
eco
nd
s)
Pa
ss
Ob
se
rve
d
Mo
de
lled
%
dif
fere
nce
Dif
fere
nc
e (s
eco
nd
s)
Pa
ss
A55 eastbound (includes Britannia Bridge)
10 17 216 209 -3% 213 213 -0% 253 212 -16% 41
A55 westbound (includes Britannia Bridge)
17 10 221 206 -7% 259 206 -21% 53.5 307 274 -11%
A5 eastbound (includes Menai Bridge) 12 15 210 225 7% 205 229 12% 205 240.2 17% 35.2
A5 westbound (includes Menai Bridge)
15 12 214 182 -15% 32.2 227 189 -17% 38 241 201 -17% 40.2
15:00-18:00 (seconds)
A55 - Holyhead Road 10 15 306 281 -8%
Holyhead Road - A55 15 10 385 324 -16% 61.4
Pentraeth Road - A55 12 17 388 338 -13%
A55 - Pentraeth Road 17 12 424 381 -10%
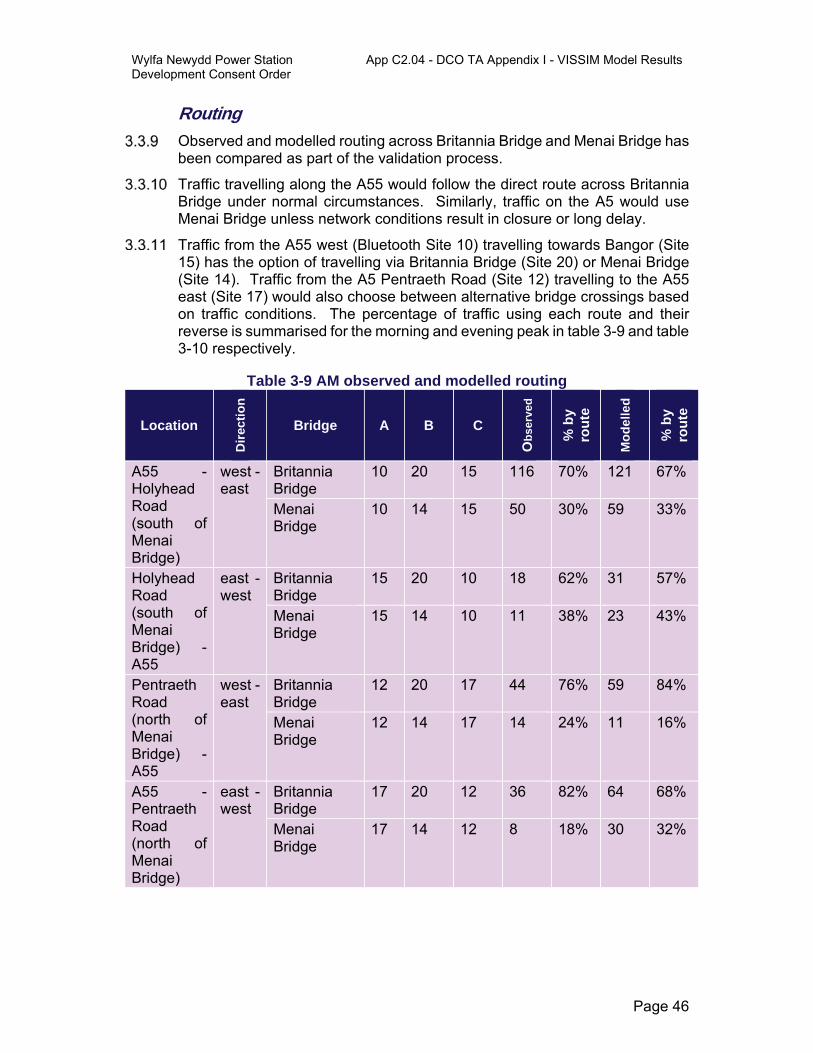
Wylfa Newydd Power Station App C2.04 - DCO TA Appendix I - VISSIM Model ResultsDevelopment Consent Order
Page 46
Routing
Observed and modelled routing across Britannia Bridge and Menai Bridge has been compared as part of the validation process.
Traffic travelling along the A55 would follow the direct route across Britannia Bridge under normal circumstances. Similarly, traffic on the A5 would use Menai Bridge unless network conditions result in closure or long delay.
Traffic from the A55 west (Bluetooth Site 10) travelling towards Bangor (Site 15) has the option of travelling via Britannia Bridge (Site 20) or Menai Bridge (Site 14). Traffic from the A5 Pentraeth Road (Site 12) travelling to the A55 east (Site 17) would also choose between alternative bridge crossings based on traffic conditions. The percentage of traffic using each route and their reverse is summarised for the morning and evening peak in table 3-9 and table 3-10 respectively.
Table 3-9 AM observed and modelled routing
Location
Dir
ecti
on
Bridge A B C
Ob
se
rve
d
% b
y ro
ute
Mo
del
led
% b
y ro
ute
A55 - Holyhead Road (south of Menai Bridge)
west - east
Britannia Bridge
10 20 15 116 70% 121 67%
Menai Bridge
10 14 15 50 30% 59 33%
Holyhead Road (south of Menai Bridge) - A55
east - west
Britannia Bridge
15 20 10 18 62% 31 57%
Menai Bridge
15 14 10 11 38% 23 43%
Pentraeth Road (north of Menai Bridge) - A55
west - east
Britannia Bridge
12 20 17 44 76% 59 84%
Menai Bridge
12 14 17 14 24% 11 16%
A55 - Pentraeth Road (north of Menai Bridge)
east - west
Britannia Bridge
17 20 12 36 82% 64 68%
Menai Bridge
17 14 12 8 18% 30 32%

Wylfa Newydd Power Station App C2.04 - DCO TA Appendix I - VISSIM Model ResultsDevelopment Consent Order
Page 47
Table 3-10: PM observed and modelled routing
Location
Dir
ecti
on
Bridge A B C
Ob
serv
ed
% b
y ro
ute
Mo
del
led
% b
y ro
ute
A55 - Holyhead Road (south of Menai Bridge)
west - east
Britannia Bridge
10 20 15 60 76% 141 80%
Menai Bridge
10 14 15 19 24% 36 20%
Holyhead Road (south of Menai Bridge) - A55
east - west
Britannia Bridge
15 20 10 28 22% 100 58%
Menai Bridge
15 14 10 98 78% 71 42%
Pentraeth Road (north of Menai Bridge) - A55
west - east
Britannia Bridge
12 20 17 30 53% 80 73%
Menai Bridge
12 14 17 27 47% 29 27%
A55 - Pentraeth Road (north of Menai Bridge)
east - west
Britannia Bridge
17 20 12 34 52% 77 50%
Menai Bridge
17 14 12 31 48% 78 50%
Routing show a strong level of consistency across both bridges. Morning and evening peak modelled eastbound routing from the A55 towards Bangor show a strong correlation with observed values. Routing between the A5 Pentraeth Road and the A55 is consistent east and westbound in both model periods. Only the morning peak movement from Bangor to the A55 westbound is inconsistent with observed values (82% observed / 68% modelled); however, actual sample sizes are low.
Modelled routing has been verified against turning counts and has shown to be more consistent with observed travel behaviour (in terms of both calibration count and journey time results).
Queue lengths
Validation against queue lengths is not included in WebTAG. The reason is that in congested networks, minor variations in network performance can result in a large variation in queue lengths. In such circumstances, it can be hard to quantify normal conditions. In addition, different software calculates queueing differently. ‘Blocking back’ and other capacity constraint methodologies (demand/actual flows) further complicate queue calculations.

Wylfa Newydd Power Station App C2.04 - DCO TA Appendix I - VISSIM Model ResultsDevelopment Consent Order
Page 48
Nevertheless, in the context of Britannia Bridge, reporting queue lengths is useful as they are one of the most recognisable indicators of model performance available to stakeholders - and an effective way to assess low level congestion.
Modelled queue lengths have been reviewed and are consistent with March 2016 video survey and site visit records.
Eastbound modelled queuing commenced around 08:00 and continued through to 09:00. At 08:45, queuing reaches midway between Junction 8a and 8, as shown in figure 3-1, consistent with on-site observations. Westbound queuing commenced around 17:15 and reaches back and onto the Junction 9 westbound on-slip at approximately 17:30 (see figure 3-2).
Figure 3-1 Base 2016 eastbound queues at 08:45, Junction 8/ 8a
N

Wylfa Newydd Power Station App C2.04 - DCO TA Appendix I - VISSIM Model ResultsDevelopment Consent Order
Page 49
Figure 3-2 Base 2016 westbound queues at 17:30, Junction 9
Modelled merge behaviour is also consistent with video footage. As observed, the short merge lengths at Junction 8a and 9 can make it difficult for traffic to join the A55, and these conditions are reflected in the base model.
Summary
Overall, the model validates to a high standard. Three parameters have been considered: journey times, routing and queue lengths. As summarised in table 3-7 and table 3-8, the majority of journey times across the AM and PM peak times validate within WebTAG guidelines.
In the morning peak, the A5 eastbound 06:00-07:00 modelled journey time is slower than observed. While the number of observations at this time is small, the quick journey time, compared with later periods, may indicate that some vehicles are travelling faster than the speed limit in the early morning. Modelled journey times are constrained to actual speed limit values at all times.
In the evening peak, the Holyhead Road (Bangor) to A55 journey time is faster than the observed value; however, this is only marginally outside WebTAG criteria (by less than two seconds).
Model routing is consistent with the Bluetooth analysis.
Modelled queue lengths, although not directly used for validation, have been checked and match observed lengths from the video survey and on-site observations.
The VISSIM model has been reviewed by Welsh Government for robustness.
N

Wylfa Newydd Power Station App C2.04 - DCO TA Appendix I - VISSIM Model ResultsDevelopment Consent Order
Page 50
Journey time routes In subsequent Chapters 4 to 6, a number of tables summarise journey times.
These tables represent journey times for the primary movements eastbound and westbound across both Britannia Bridge and Menai Bridge. The values reported are based on the combined weighted average journey times from a number of approach routes as outlined below.
Britannia Bridge eastbound to Junction 9 diverge from the following locations:
- Ffordd Penmynydd overbridge before Junction 8 to (3.05km);
- A5025 west of Junction 8 at Lon Refail (2.26km);
- A5025 500m east of Junction 8 (2.63km);
- A5 west of Junction 8a at Lon Graig (2.46km); and
- A5 east of Junction 8a at Menai Bridge Viewpoint (2.21km).
Britannia Bridge westbound to Junction 8a diverge from the following locations:
- A55 west of Junction 10 merge (2.37km);
- A4087 west of Tesco roundabout (3.4km);
- A487/B4547 roundabout (2.92km); and
- A487 Treborth Rd at driving range (3.2km).
Menai Bridge eastbound to southern Menai Bridge roundabout from the following locations:
- A545 Cadnant Rd at Askew Street (1.12km);
- B5420 Pentraeth Rd at Y Glyn (1.42km); and
- A5 Holyhead Rd at Lon Germant (1.34km).
Menai Bridge westbound to northern Menai Bridge roundabout from the following locations:
- A5 Holyhead Road at Belmont Road (1.16km); and
- A487 Treborth Rd at Sunnybank Bus Stop.

Wylfa Newydd Power Station App C2.04 - DCO TA Appendix I - VISSIM Model ResultsDevelopment Consent Order
Page 51
4. Future background traffic growth
Traffic growth It is anticipated that 2023 would be the peak construction year with project
traffic at its highest level during this time. Consequently, a model forecast year of 2023 has been chosen, representing a worst case demand scenario. The basis for model years is explained in Introduction to the topics B3 - Traffic and transport (Application Reference Number: 6.2.3).
Base calibrated car demand has been factored to 2023 using TEMPro Version 7.2 March 2017 (RD4) growth factors. LGV and HGV traffic has been factored to the forecast year using values taken from Department for Transport Regional Traffic Forecasts (RD5 and RD4). All factors are consistent with the strategic model; values are summarised in table 4-1.
Table 4-1 TEMPro / Regional Traffic Forecast growth figures
Year Cars LGV Rigid Artic HGV (average of rigid
and artic)
2023 AM 1.0736 1.1930 1.0315 1.0915 1.0513 2023 PM 1.0680 1.1930 1.0315 1.0915 1.0513
Resulting one hour travel demands, assigned to the model, are given by vehicle type in table 4-2.
Table 4-2 Future year travel demand Hour Car LGV HGV Hour Car LGV HGV
2016 2023 2016 2023 2016 2023 2016 2023 2016 2023 2016 2023
06:00 1,283 1,377 313 373 368 380 15:00 6,990 7,465 956 1,141 330 34707:00 4,187 4,495 1,026 1,224 403 416 16:00 8,158 8,713 1,156 1,379 262 27508:00 8,417 9,036 1,297 1,547 502 518 17:00 9,010 9,623 983 1,173 201 225
Future demand has then been disaggregated by the 15 minute matrix factors, given in Section 2.4 to reflect peak within peak demand. As a result, it is assumed that travellers do not respond to potentially increased journey times and delay by adjusting their journey start (known as peak spreading).
Future background traffic growth impacts
Summary
General model performance VISSIM model results illustrate that future background traffic growth will
worsen traffic conditions at existing network constraint locations.
In the morning peak, traffic queues and delays increase eastbound from Anglesey towards the mainland. Queuing on Britannia Bridge starts to form before 08:00 and continues through to the model end at 09:00.

Wylfa Newydd Power Station App C2.04 - DCO TA Appendix I - VISSIM Model ResultsDevelopment Consent Order
Page 52
Traffic volumes also increase across the Menai Bridge towards Bangor, although potential queues are moderated by the roundabouts at the A5/Pentraeth Road/Dale Street and A5025/B5420 to the north. Localised queuing occurs northbound on the A487 at Faenol Hill where the carriageway reduces from two lanes to one. Elsewhere, the model show no major queuing or delay throughout the simulation period.
Evening peak congestion locations are also the same as existing congestion locations, with increased queues and delays westbound on the A55 towards Britannia Bridge, the A487 northbound and the A5 leaving Bangor.
Overall morning and evening peak network simulation traffic conditions are illustrated in figure 4-1 and figure 4-2 at 08:45 and 17:30 respectively.
Figure 4-1 AM 2023 network queues without Project traffic (08:45)
N
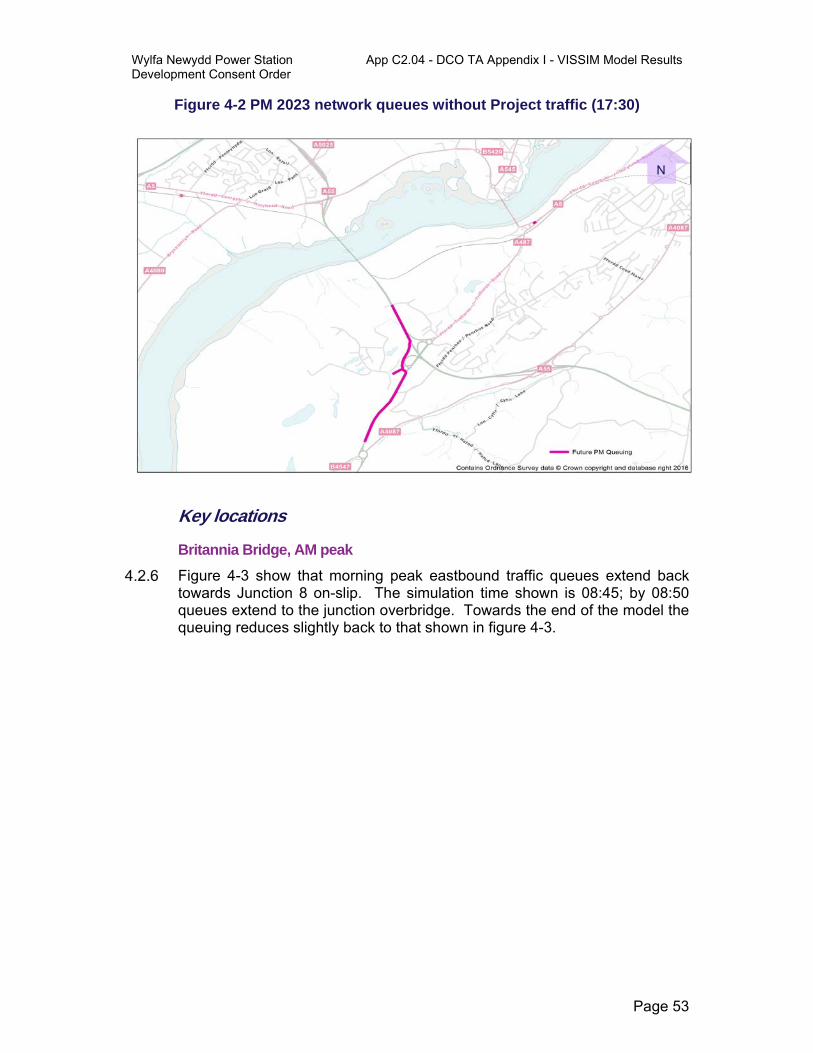
Wylfa Newydd Power Station App C2.04 - DCO TA Appendix I - VISSIM Model ResultsDevelopment Consent Order
Page 53
Figure 4-2 PM 2023 network queues without Project traffic (17:30)
Key locations
Britannia Bridge, AM peak
Figure 4-3 show that morning peak eastbound traffic queues extend back towards Junction 8 on-slip. The simulation time shown is 08:45; by 08:50 queues extend to the junction overbridge. Towards the end of the model the queuing reduces slightly back to that shown in figure 4-3.
N
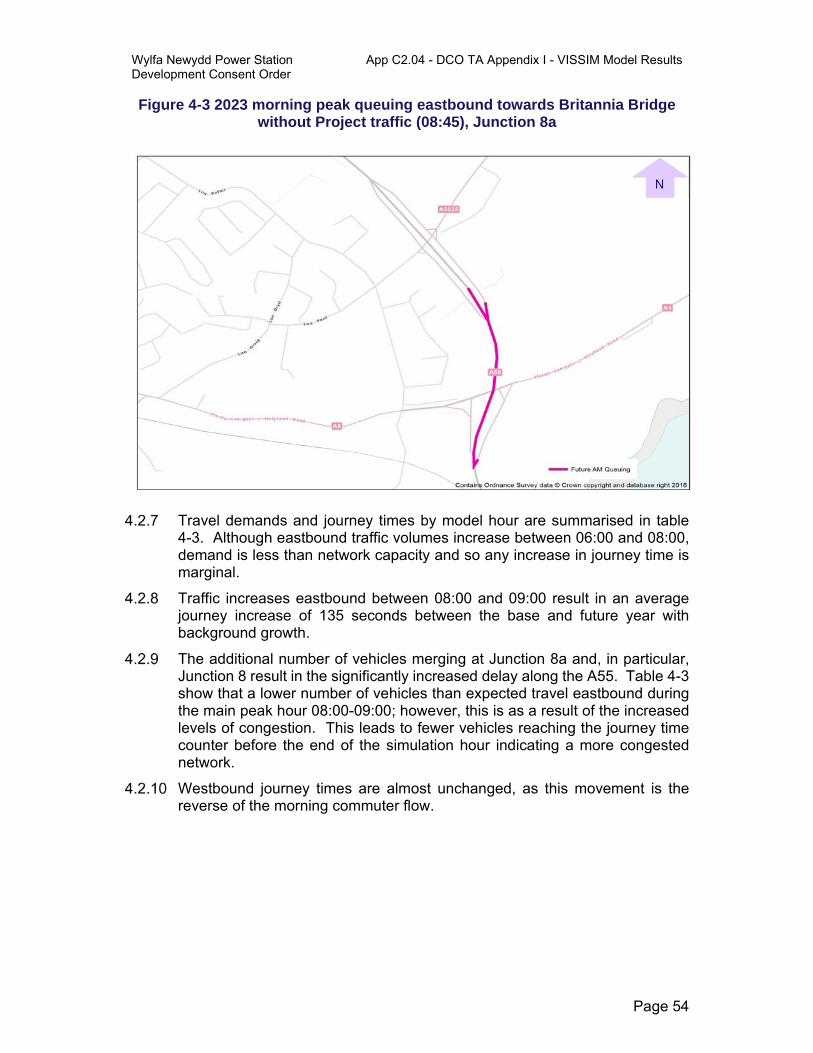
Wylfa Newydd Power Station App C2.04 - DCO TA Appendix I - VISSIM Model ResultsDevelopment Consent Order
Page 54
Figure 4-3 2023 morning peak queuing eastbound towards Britannia Bridge without Project traffic (08:45), Junction 8a
Travel demands and journey times by model hour are summarised in table 4-3. Although eastbound traffic volumes increase between 06:00 and 08:00, demand is less than network capacity and so any increase in journey time is marginal.
Traffic increases eastbound between 08:00 and 09:00 result in an average journey increase of 135 seconds between the base and future year with background growth.
The additional number of vehicles merging at Junction 8a and, in particular, Junction 8 result in the significantly increased delay along the A55. Table 4-3 show that a lower number of vehicles than expected travel eastbound during the main peak hour 08:00-09:00; however, this is as a result of the increased levels of congestion. This leads to fewer vehicles reaching the journey time counter before the end of the simulation hour indicating a more congested network.
Westbound journey times are almost unchanged, as this movement is the reverse of the morning commuter flow.
N
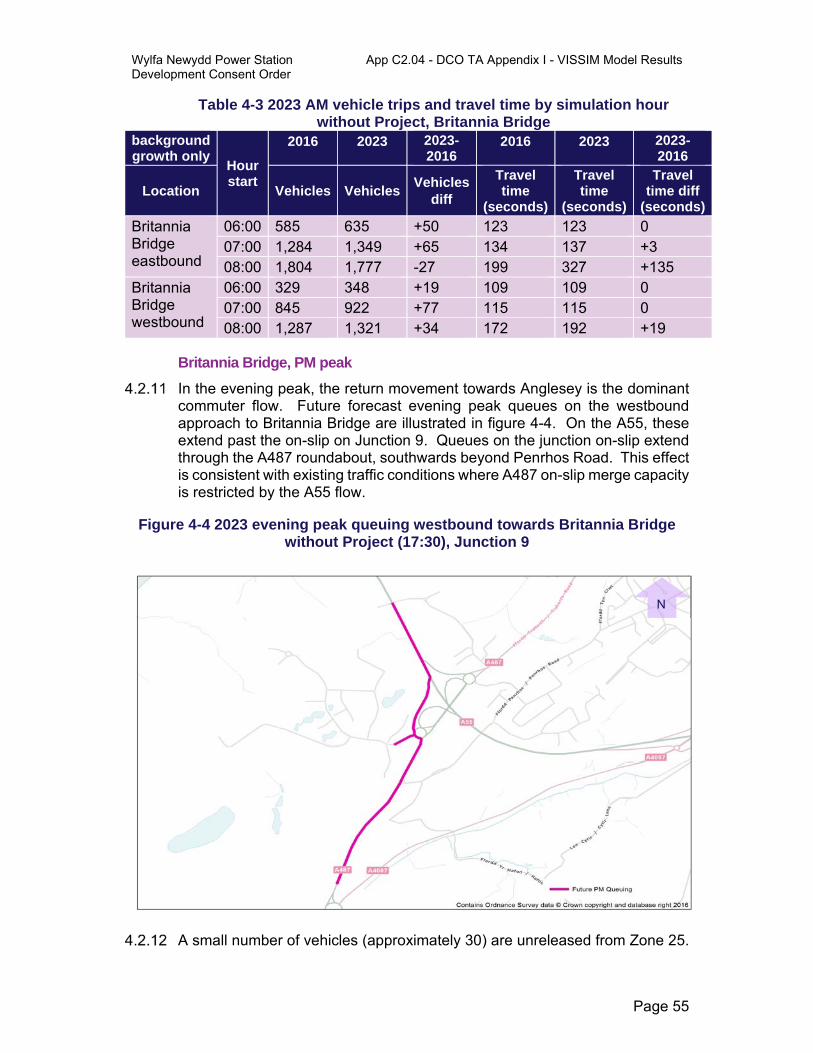
Wylfa Newydd Power Station App C2.04 - DCO TA Appendix I - VISSIM Model ResultsDevelopment Consent Order
Page 55
Table 4-3 2023 AM vehicle trips and travel time by simulation hour without Project, Britannia Bridge
background growth only
Hour start
2016 2023 2023-2016
2016 2023 2023-2016
Location Vehicles VehiclesVehicles
diff
Travel time
(seconds)
Travel time
(seconds)
Travel time diff
(seconds)
Britannia Bridge eastbound
06:00 585 635 +50 123 123 0 07:00 1,284 1,349 +65 134 137 +3 08:00 1,804 1,777 -27 199 327 +135
Britannia Bridge westbound
06:00 329 348 +19 109 109 0 07:00 845 922 +77 115 115 0 08:00 1,287 1,321 +34 172 192 +19
Britannia Bridge, PM peak
In the evening peak, the return movement towards Anglesey is the dominant commuter flow. Future forecast evening peak queues on the westbound approach to Britannia Bridge are illustrated in figure 4-4. On the A55, these extend past the on-slip on Junction 9. Queues on the junction on-slip extend through the A487 roundabout, southwards beyond Penrhos Road. This effect is consistent with existing traffic conditions where A487 on-slip merge capacity is restricted by the A55 flow.
Figure 4-4 2023 evening peak queuing westbound towards Britannia Bridge without Project (17:30), Junction 9
A small number of vehicles (approximately 30) are unreleased from Zone 25.
N
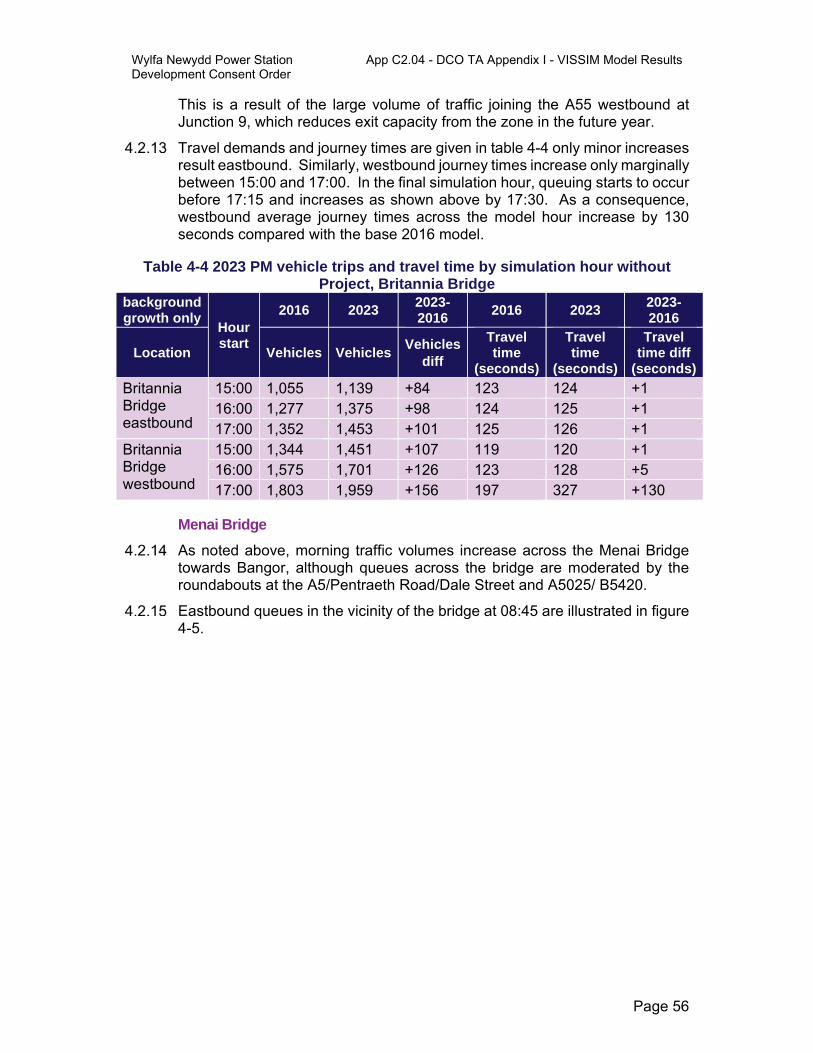
Wylfa Newydd Power Station App C2.04 - DCO TA Appendix I - VISSIM Model ResultsDevelopment Consent Order
Page 56
This is a result of the large volume of traffic joining the A55 westbound at Junction 9, which reduces exit capacity from the zone in the future year.
Travel demands and journey times are given in table 4-4 only minor increases result eastbound. Similarly, westbound journey times increase only marginally between 15:00 and 17:00. In the final simulation hour, queuing starts to occur before 17:15 and increases as shown above by 17:30. As a consequence, westbound average journey times across the model hour increase by 130 seconds compared with the base 2016 model.
Table 4-4 2023 PM vehicle trips and travel time by simulation hour without Project, Britannia Bridge
background growth only
Hour start
2016 2023 2023-2016
2016 2023 2023-2016
Location Vehicles VehiclesVehicles
diff
Travel time
(seconds)
Travel time
(seconds)
Travel time diff
(seconds)
Britannia Bridge eastbound
15:00 1,055 1,139 +84 123 124 +1 16:00 1,277 1,375 +98 124 125 +1 17:00 1,352 1,453 +101 125 126 +1
Britannia Bridge westbound
15:00 1,344 1,451 +107 119 120 +1 16:00 1,575 1,701 +126 123 128 +5 17:00 1,803 1,959 +156 197 327 +130
Menai Bridge
As noted above, morning traffic volumes increase across the Menai Bridge towards Bangor, although queues across the bridge are moderated by the roundabouts at the A5/Pentraeth Road/Dale Street and A5025/ B5420.
Eastbound queues in the vicinity of the bridge at 08:45 are illustrated in figure 4-5.

Wylfa Newydd Power Station App C2.04 - DCO TA Appendix I - VISSIM Model ResultsDevelopment Consent Order
Page 57
Figure 4-5 2023 morning peak queuing eastbound towards Menai Bridge without Project (08:45)
East and westbound travel demands and journey times by morning model hour are summarised in table 4-5. At Menai Bridge, eastbound journey times increase by 90 seconds between 08:00-09:00. Apart from this increase journey times elsewhere are largely unaffected, with only small increases throughout the morning peak despite an increase in traffic volumes.
Table 4-5 2023 AM vehicle trips and travel time by simulation hour without Project, Menai Bridge
background growth only
Hour start
2016 2023 2023-2016
2016 2023 2023-2016
Location Vehicles VehiclesVehicles
diff
Travel time
(seconds)
Travel time
(seconds)
Travel time diff
(seconds)
Menai Bridge eastbound
06:00 106 117 +11 108 107 -1 07:00 393 455 +62 109 111 +1 08:00 1,077 1,174 +97 134 224 +90
Menai Bridge westbound
06:00 26 30 +4 82 82 0 07:00 167 186 +19 80 80 0 08:00 393 420 +27 84 86 +2
Evening peak travel demand is again higher westbound as traffic leaves Bangor towards Anglesey. Queues occur on the Holyhead Road approach to the A5/A487 junction although, as a result, Menai Bridge operates without significant issue.
N

Wylfa Newydd Power Station App C2.04 - DCO TA Appendix I - VISSIM Model ResultsDevelopment Consent Order
Page 58
Further northwest, conflicting traffic movements result in localised queuing at the A5/ Pentraeth Road/Dale Street and A5025/B5420 roundabouts, as shown in figure 4-6.
Figure 4-6 2023 evening peak queuing westbound towards Menai Bridge without Project (17:30)
Existing and 2023 future background traffic volumes and travel times are given in table 4-6. Travel times show a consistent pattern with other model locations; only modest increases occur between 15:00 and 17:00 in each direction. After 17:00, journey time variances are similar, indicating that background growth has limited effect on Menai Bridge during the evening peak.
Table 4-6 2023 PM vehicle trips and travel time by simulation hour without Project, Menai Bridge
background growth only
Hour start
2016 2023 2023-2016
2016 2023 2023-2016
Location Vehicles VehiclesVehicles
diff
Travel time
(seconds)
Travel time
(seconds)
Travel time diff
(seconds)
Menai Bridge eastbound
15:00 461 507 +46 109 108 -1 16:00 557 619 +62 113 115 +2 17:00 487 547 +60 127 119 -8
Menai Bridge westbound
15:00 550 582 +32 87 87 0 16:00 994 1,065 +71 89 92 +4 17:00 1,273 1,286 +13 95 100 +5
N

Wylfa Newydd Power Station App C2.04 - DCO TA Appendix I - VISSIM Model ResultsDevelopment Consent Order
Page 59
5. Worker/construction traffic and proposed mitigation
Construction worker traffic The VISSIM models summarised in the remainder of the report assume that
the Wylfa Newydd Project goes ahead and so includes construction worker traffic. An estimated 1,036 workers are anticipated to live on the mainland and commute to site.
The most likely shift pattern has previously been defined, and this is summarised in table 5-1 for eastbound traffic and table 5-2 for westbound traffic. Depending on the final destination of the construction traffic the vehicle occupancy varies resulting in 668 construction worker cars crossing the bridge per day. Of these, 70% are assumed to travel to and from site during the day shift, the remaining 30% travel to and from the Wylfa Newydd Development Area during the night shift.
Table 5-1 Total eastbound construction worker traffic
Shift Shift end Earliest time at Britannia
Bridge
Time allocated to Britannia
Bridge
Worker cars
Workers
Day 17:00 18:00 18:00-18:30 133 242 17:30 18:30 18:30-19:00 133 242 18:00 19:00 19:00-19:30 133 242
Night 03:00 04:00 04:00-04:30 57 104 03:30 04:30 04:30-05:00 57 103 04:00 05:00 05:00-05:30 57 103
Total 570 1,036
Table 5-2 Total westbound construction worker traffic
Shift Shift start Latest time at
Britannia Bridge
Time allocated to Britannia
Bridge
Worker cars
Workers
Day 07:00 06:00 05:30-06:00 133 242 07:30 06:30 06:00-06:30 133 242 08:00 07:00 06:30-07:00 133 242
Night 16:30 15:30 15:00-15:30 57 104 17:00 16:00 15:30-16:00 57 103 17:30 16:30 16:00-16:30 57 103
Total 570 1,036
The shifts highlighted in bold are those that coincide with the model time periods and are therefore included within the analysis.

Wylfa Newydd Power Station App C2.04 - DCO TA Appendix I - VISSIM Model ResultsDevelopment Consent Order
Page 60
Facilities management There are expected to be 147 facilities management workers living on the
mainland and travelling across A55 Britannia Bridge each day. These employees would start work at 08:00 and finish at 17:00. An average car occupancy of 1.5 has been assumed based on the figures set out in App C2-4 - DCO TA Appendix F - Integrated Traffic and Transport Strategy (Application Reference Number: 6.3.20) and the expected time of their crossing Britannia Bridge is given in table 5-3 and table 5-4.
Table 5-3 Total eastbound facilities management construction worker traffic
Shift Shift end Latest time at
Britannia Bridge
Time allocated to Britannia
Bridge
Worker cars
Workers
Day 17:00 18:00 18:00-18:30 98 147
Table 5-4 Total westbound facilities management construction worker traffic
Shift Shift start Latest time at
Britannia Bridge
Time allocated to Britannia
Bridge
Worker cars
Workers
Day 08:00 07:00 06:30-07:00 98 147
Construction vehicle traffic Construction and other material traffic has been calculated to be 14 LGVs and
18 HGVs per hour in each direction at periods of peak construction activity. This traffic has been included in all model scenarios that include Wylfa Newydd Project traffic.
The number of daily HGVs was averaged over the 12 hour delivery window, in practice HGVs may be likely to cross A55 Britannia Bridge in a more dispersed profile. This is different from the pattern of traffic on the A5025 where HGVs would be controlled by the Logistics centre to a maximum of 40 HGVs per hour one-way.
Mainland worker distribution The distribution of mainland worker traffic has been derived from the existing
Worker Gravity Model developed by the socio-economic team. GIS has been used to assign census ward areas to each VISSIM zone, as shown in figure 5-1. From this information, a gravity model to VISSIM zone correspondence has been derived.
Where wards cover more than one zone, demand has been further disaggregated by base model link traffic flows. The resulting distribution of the 1,183 construction worker and facilities management staff is given in table 5-5 and table 5-6 below.
The distribution of trips from Bangor and Caernarfon has been considered separately to those from the rest of Wales and the UK to aid further analysis during option testing.

Wylfa Newydd Power Station App C2.04 - DCO TA Appendix I - VISSIM Model ResultsDevelopment Consent Order
Page 61
Table 5-5 VISSIM gravity model distribution from Bangor and Caernarfon
AM from/ PM to zone AM to/ PM from zone % Distribution
13 1 0% 14 1 32% 17 1 26% 22 1 28% 23 1 15%
Table 5-6 VISSIM gravity model distribution from rest of mainland AM from/ PM to zone AM to/ PM from zone % Distribution
16 1 4% 18 1 14% 19 1 64% 20 1 1% 22 1 9% 23 1 5% 25 1 4%
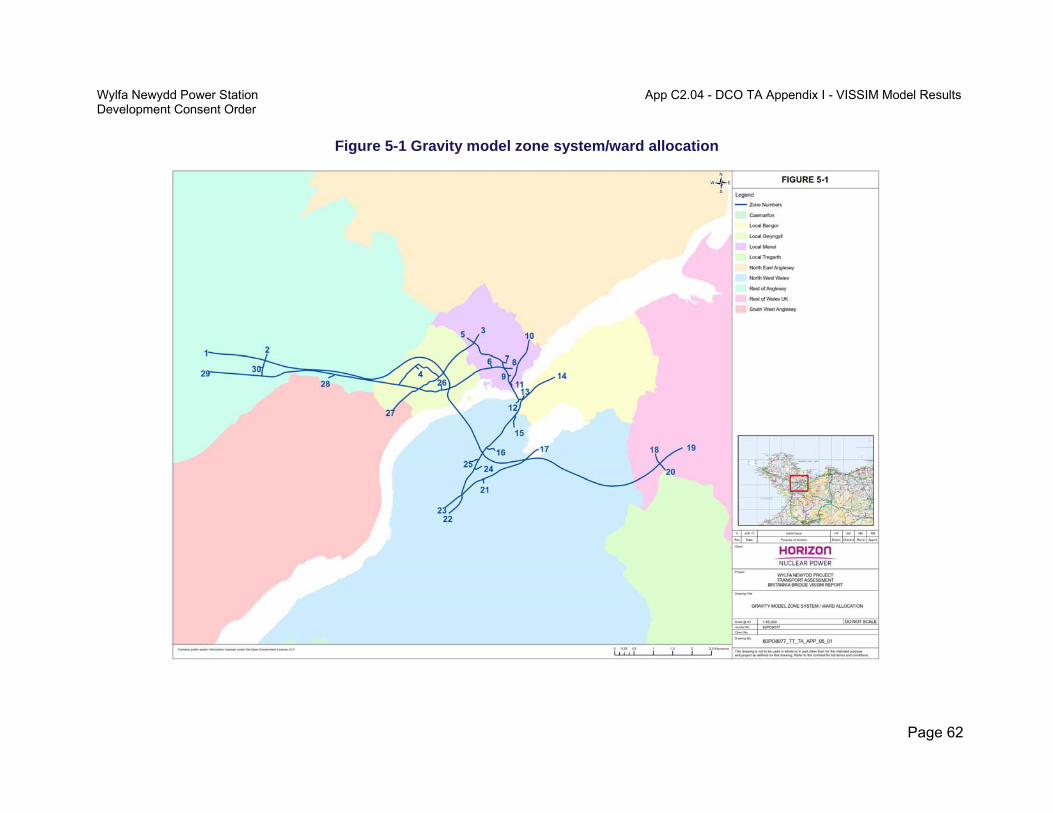
Wylfa Newydd Power Station App C2.04 - DCO TA Appendix I - VISSIM Model ResultsDevelopment Consent Order
Page 62
Figure 5-1 Gravity model zone system/ward allocation

Wylfa Newydd Power Station App C2.04 - DCO TA Appendix I - VISSIM Model ResultsDevelopment Consent Order
Page 63
Proposed mitigation – direct bus services In order to reduce the level of construction worker traffic crossing Britannia
Bridge, it is proposed to provide bus services from Caernarfon and Bangor across Britannia Bridge direct to the Wylfa Newydd Development Area.
During peak of construction direct bus services in place 216 workers would use these services (table 5-7) every weekday with the remaining 820 workers travelling by car (as driver or passenger) across Britannia Bridge.
Table 5-7 Direct buses Location Gravity model
distribution No of workers
Bangor (Zone 17) 58% 125 Caernarfon (Zone 22) 42% 91 Total 100% 216
Construction workers have been split equally over the three day and three night shifts based on a 70%/30% distribution between day and night.
Construction workers travelling by car would either drive to the Park and Ride on Anglesey or the Wylfa Newydd Development Area itself. The car occupancy of construction workers travelling to the Park and Ride site has been assumed to be 1.5; for those travelling directly to the Wylfa Newydd Development Area car occupancy has been assumed to be three.
Based on the above mitigation, east and westbound construction traffic is summarised in table 5-8 and table 5-9.
Table 5-8 Eastbound construction worker traffic with mitigation
Shift Shift end
Latest time at
Britannia Bridge
Time allocated to
Britannia Bridge
Worker Cars
Workers Workers on buses
Day 17:00 18:00 18:00-18:30 100 192 38 17:30 18:30 18:30-19:00 100 191 38 18:00 19:00 19:00-19:30 100 191 38
Night 03:00 04:00 04:00-04:30 43 82 22 03:30 04:30 04:30-05:00 43 82 22 04:00 05:00 05:00-05:30 43 82 21
Total 429 820 216

Wylfa Newydd Power Station App C2.04 - DCO TA Appendix I - VISSIM Model ResultsDevelopment Consent Order
Page 64
Table 5-9 Westbound construction worker traffic with mitigation
Shift Shift start
Latest time at
Britannia Bridge
Time allocated to
Britannia Bridge
Worker Cars
Workers Workers on buses
Day 07:00 06:00 05:30-06:00 100 192 38 07:30 06:30 06:00-06:30 100 191 38 08:00 07:00 06:30-07:00 100 191 38
Night 16:30 15:30 15:00-15:30 43 82 22 17:00 16:00 15:30-16:00 43 82 22 17:30 16:30 16:00-16:30 43 82 21
Total 429 820 216
The facilities management employees would not be affected by the proposed mitigation. As before these employees with start work at 08:00 and finish at 17:00. An average car occupancy of 1.5 has been assumed and the expected time of their crossing Britannia Bridge is given in table 5-10 and table 5-11 with travel demand during peak construction.
Table 5-10 Total eastbound facilities management construction worker traffic Shift Shift end Latest time at
Britannia Bridge
Time allocated to Britannia
Bridge
Worker cars
Workers
Day 17:00 18:00 18:00-18:30 98 147
Table 5-11 Total westbound facilities management construction worker traffic Shift Shift start Latest time at
Britannia Bridge
Time allocated to Britannia
Bridge
Worker cars
Workers
Day 08:00 07:00 06:30-07:00 98 147
Construction worker matrices have been adjusted to the values above. 527 worker vehicles cross Britannia Bridge with the direct buses scenario.
Construction and other material traffic are unaffected with 14 LGVs and 18 HGVs travelling in each direction and each model hour.
Total mitigated demand Figure 5-2 and figure 5-3 highlight the impact of additional mitigated
construction worker and construction traffic throughout the day. Eastbound, construction worker trips crossing Britannia Bridge occur outside peak periods (04:00-06:00 and 18:00-20:00). Westbound, the morning peak shift crosses the bridge before 07:00; however, night shift traffic coincides with evening peak traffic.
LGV and HGV construction traffic crosses the bridge throughout the day.

Wylfa Newydd Power Station App C2.04 - DCO TA Appendix I - VISSIM Model ResultsDevelopment Consent Order
Page 65
Figure 5-2 Eastbound additional Wylfa Newydd Project traffic
Figure 5-3 Westbound additional Wylfa Newydd Project traffic
0
200
400
600
800
1,000
1,200
1,400
1,600
1,800
2,000
2,200
00:0
0 –
01:0
0
01:0
0 –
02:0
0
02:0
0 –
03:0
0
03:0
0 –
04:0
0
04:0
0 –
05:0
0
05:0
0 –
06:0
0
06:0
0 –
07:0
0
07:0
0 –
08:0
0
08:0
0 –
09:0
0
09:0
0 –
10:0
0
10:0
0 –
11:0
0
11:0
0 –
12:0
0
12:0
0 –
13:0
0
13:0
0 –
14:0
0
14:0
0 –
15:0
0
15:0
0 –
16:0
0
16:0
0 –
17:0
0
17:0
0 –
18:0
0
18:0
0 –
19:0
0
19:0
0 –
20:0
0
20:0
0 –
21:0
0
21:0
0 –
22:0
0
22:0
0 –
23:0
0
23:0
0 –
24:0
0
Construction worker traffic
Construction LGV and HGVs
2016-2023 future growth
2016 baseline
0
200
400
600
800
1,000
1,200
1,400
1,600
1,800
2,000
2,200
00:0
0 –
01:0
0
01:0
0 –
02:0
0
02:0
0 –
03:0
0
03:0
0 –
04:0
0
04:0
0 –
05:0
0
05:0
0 –
06:0
0
06:0
0 –
07:0
0
07:0
0 –
08:0
0
08:0
0 –
09:0
0
09:0
0 –
10:0
0
10:0
0 –
11:0
0
11:0
0 –
12:0
0
12:0
0 –
13:0
0
13:0
0 –
14:0
0
14:0
0 –
15:0
0
15:0
0 –
16:0
0
16:0
0 –
17:0
0
17:0
0 –
18:0
0
18:0
0 –
19:0
0
19:0
0 –
20:0
0
20:0
0 –
21:0
0
21:0
0 –
22:0
0
22:0
0 –
23:0
0
23:0
0 –
24:0
0
Construction worker traffic
Construction LGV and HGVs
2016-2023 future growth
2016 baseline

Wylfa Newydd Power Station App C2.04 - DCO TA Appendix I - VISSIM Model ResultsDevelopment Consent Order
Page 66
6. Worker/construction traffic assessment
Introduction Mitigated construction worker and facilities management traffic and LGV and
HGVs have been added to the background growth test. The results of the VISSIM modelling are discussed below.
General model results The majority of worker/construction traffic crosses the Menai Strait outside the
morning and evening peak hours 08:00-09:00 and 17:00-18:00 respectively. Although buses help reduce vehicle trips during the earlier hours of each peak, general traffic conditions at key network constraint locations are unchanged during the main peak hours.
In the AM period, there is an increase in trips westbound during each hour of the simulation; however the journey times remain broadly unchanged with slight increases between 08:00-09:00.
In the evening period, there is a slight benefit from the direct buses mitigation as it removes westbound worker vehicles across Britannia Bridge in the period before the main 17:00 peak. The average journey times remain very similar between the with and without Project assessments. Morning and evening peak network simulation traffic conditions are illustrated in figure 6-1 and figure 6-2 at 08:45 and 17:30 respectively.
Figure 6-1 2023 AM general network queuing with Project (08:45)
N
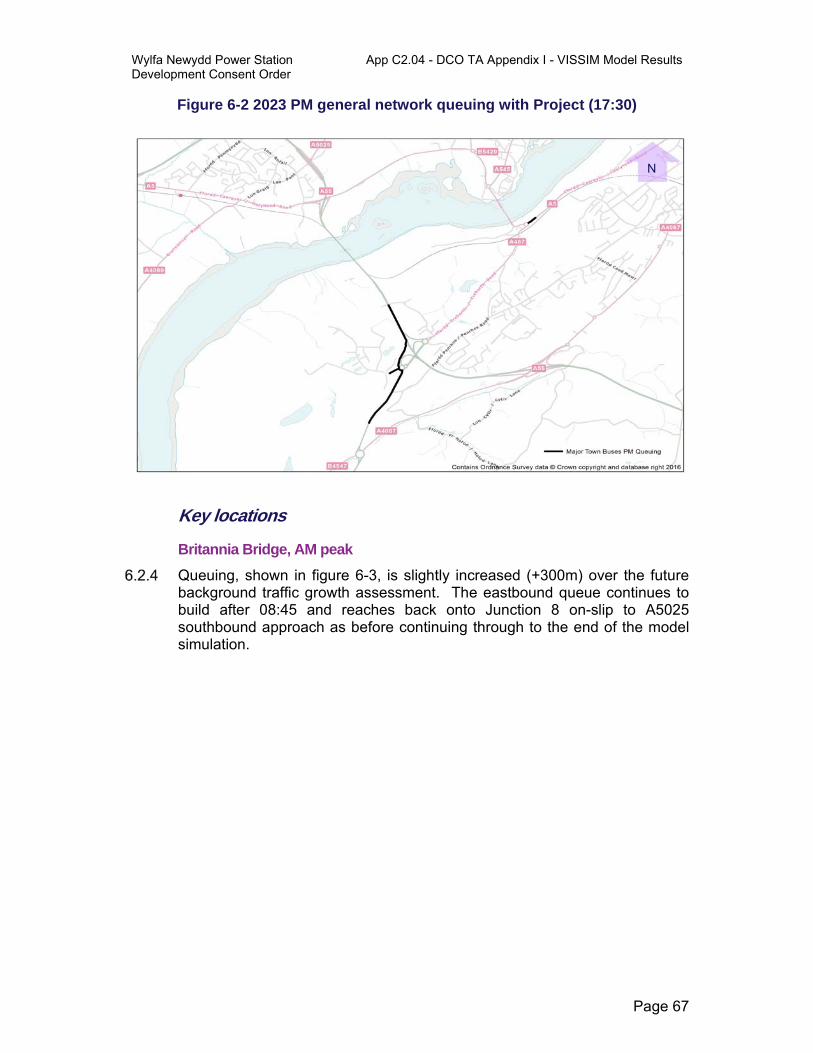
Wylfa Newydd Power Station App C2.04 - DCO TA Appendix I - VISSIM Model ResultsDevelopment Consent Order
Page 67
Figure 6-2 2023 PM general network queuing with Project (17:30)
Key locations
Britannia Bridge, AM peak
Queuing, shown in figure 6-3, is slightly increased (+300m) over the future background traffic growth assessment. The eastbound queue continues to build after 08:45 and reaches back onto Junction 8 on-slip to A5025 southbound approach as before continuing through to the end of the model simulation.
N
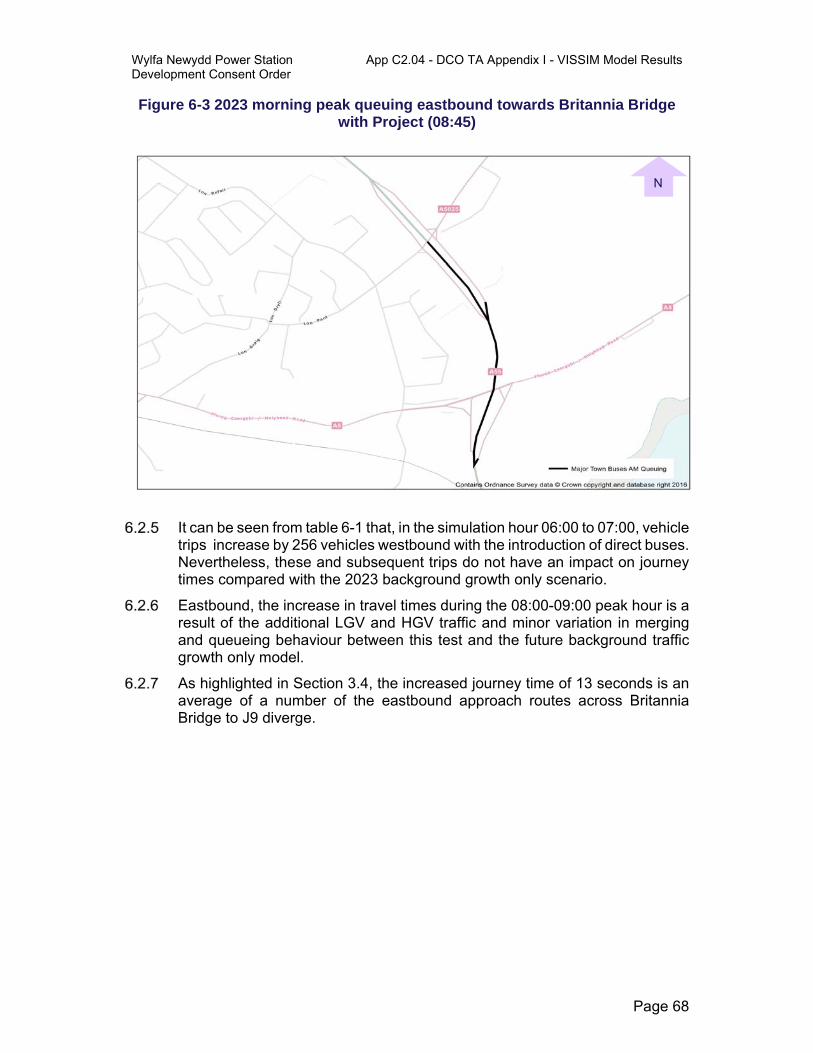
Wylfa Newydd Power Station App C2.04 - DCO TA Appendix I - VISSIM Model ResultsDevelopment Consent Order
Page 68
Figure 6-3 2023 morning peak queuing eastbound towards Britannia Bridge with Project (08:45)
It can be seen from table 6-1 that, in the simulation hour 06:00 to 07:00, vehicle trips increase by 256 vehicles westbound with the introduction of direct buses. Nevertheless, these and subsequent trips do not have an impact on journey times compared with the 2023 background growth only scenario.
Eastbound, the increase in travel times during the 08:00-09:00 peak hour is a result of the additional LGV and HGV traffic and minor variation in merging and queueing behaviour between this test and the future background traffic growth only model.
As highlighted in Section 3.4, the increased journey time of 13 seconds is an average of a number of the eastbound approach routes across Britannia Bridge to J9 diverge.
N

Wylfa Newydd Power Station App C2.04 - DCO TA Appendix I - VISSIM Model ResultsDevelopment Consent Order
Page 69
Table 6-1 2023 AM vehicle trips and travel time by simulation hour with Project, Britannia Bridge
Location Hour start
2023
Wyl
fa N
ewyd
d
Pro
ject
dir
ect
bu
ses
2023
bac
kgro
un
d
gro
wth
2023
Wyl
fa N
ewyd
d
Pro
ject
dir
ect
bu
ses
- b
ackg
rou
nd
gro
wth
2023
Wyl
fa N
ewyd
d
Pro
ject
dir
ect
bu
ses
2023
bac
kgro
un
d
gro
wth
2023
Wyl
fa N
ewyd
d
Pro
ject
dir
ect
bu
ses
- b
ackg
rou
nd
gro
wth
Vehicles VehiclesVehicles
difference
Travel time
(seconds)
Travel time
(seconds)
Travel time diff (second
s)
Britannia Bridge eastbound
06:00 667 635 +32 124 123 +1 07:00 1,379 1,349 +30 139 137 +2 08:00 1,764 1,777 -13 339 327 +13
Britannia Bridge westbound
06:00 708 348 +360 108 109 -1 07:00 982 922 +60 114 115 -1 08:00 1,359 1,321 +38 191 192 -1
Britannia Bridge, PM Peak
PM peak queuing conditions remain similar to the background growth only model, as illustrated in figure 6-4Westbound traffic queues are established before 17:15 on the approach to Britannia Bridge and by 17:30 this extends beyond Junction 9. As a result, it is difficult for slip road traffic to safely merge with faster moving A55 vehicles. This is consistent with both background growth model and observed behaviour.

Wylfa Newydd Power Station App C2.04 - DCO TA Appendix I - VISSIM Model ResultsDevelopment Consent Order
Page 70
Figure 6-4 2023 evening peak queuing westbound towards Britannia Bridge with Project (17:30)
The direct buses option help remove a proportion of construction worker
vehicle trips westbound across Britannia Bridge during the early part of the PM peak. As a result average journey times are only slightly higher than with background growth only demand as shown in table 6-2.
N
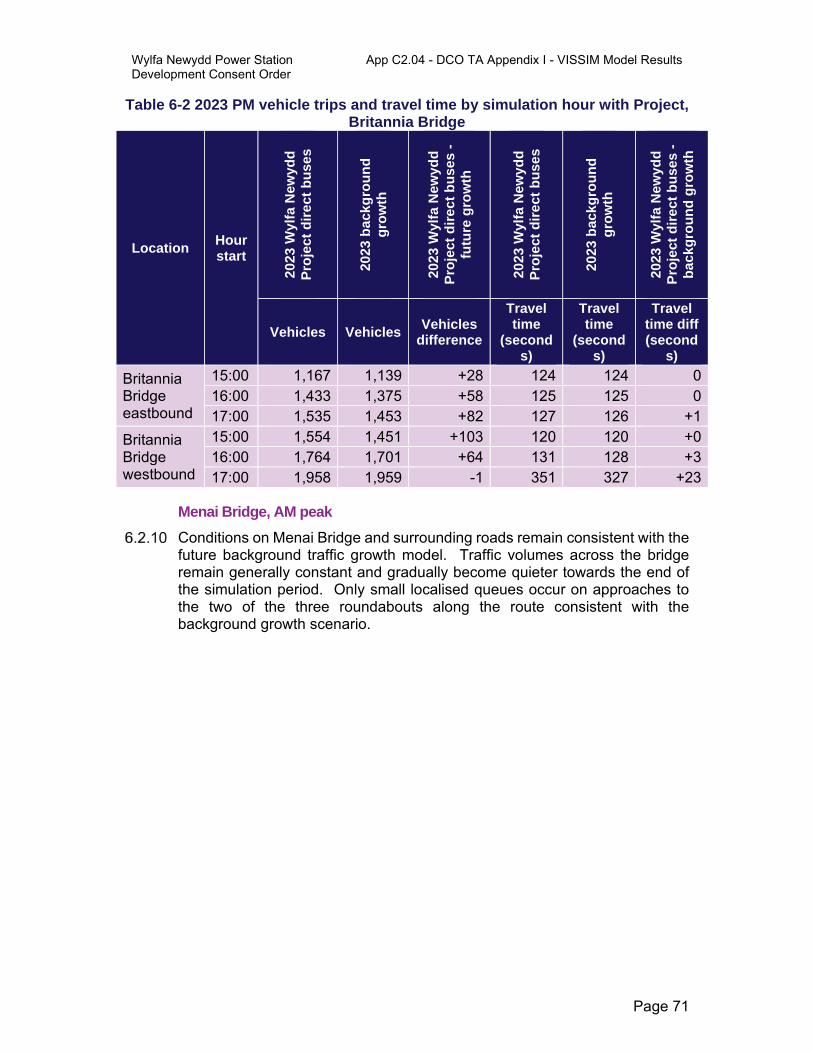
Wylfa Newydd Power Station App C2.04 - DCO TA Appendix I - VISSIM Model ResultsDevelopment Consent Order
Page 71
Table 6-2 2023 PM vehicle trips and travel time by simulation hour with Project, Britannia Bridge
Location Hour start
2023
Wyl
fa N
ewyd
d
Pro
ject
dir
ect
bu
ses
2023
bac
kgro
un
d
gro
wth
2023
Wyl
fa N
ewyd
d
Pro
ject
dir
ect
bu
ses
- fu
ture
gro
wth
2023
Wyl
fa N
ewyd
d
Pro
ject
dir
ect
bu
ses
2023
bac
kgro
un
d
gro
wth
2023
Wyl
fa N
ewyd
d
Pro
ject
dir
ect
bu
ses
- b
ackg
rou
nd
gro
wth
Vehicles VehiclesVehicles
difference
Travel time
(seconds)
Travel time
(seconds)
Travel time diff (second
s)
Britannia Bridge eastbound
15:00 1,167 1,139 +28 124 124 016:00 1,433 1,375 +58 125 125 017:00 1,535 1,453 +82 127 126 +1
Britannia Bridge westbound
15:00 1,554 1,451 +103 120 120 +016:00 1,764 1,701 +64 131 128 +317:00 1,958 1,959 -1 351 327 +23
Menai Bridge, AM peak
Conditions on Menai Bridge and surrounding roads remain consistent with the future background traffic growth model. Traffic volumes across the bridge remain generally constant and gradually become quieter towards the end of the simulation period. Only small localised queues occur on approaches to the two of the three roundabouts along the route consistent with the background growth scenario.
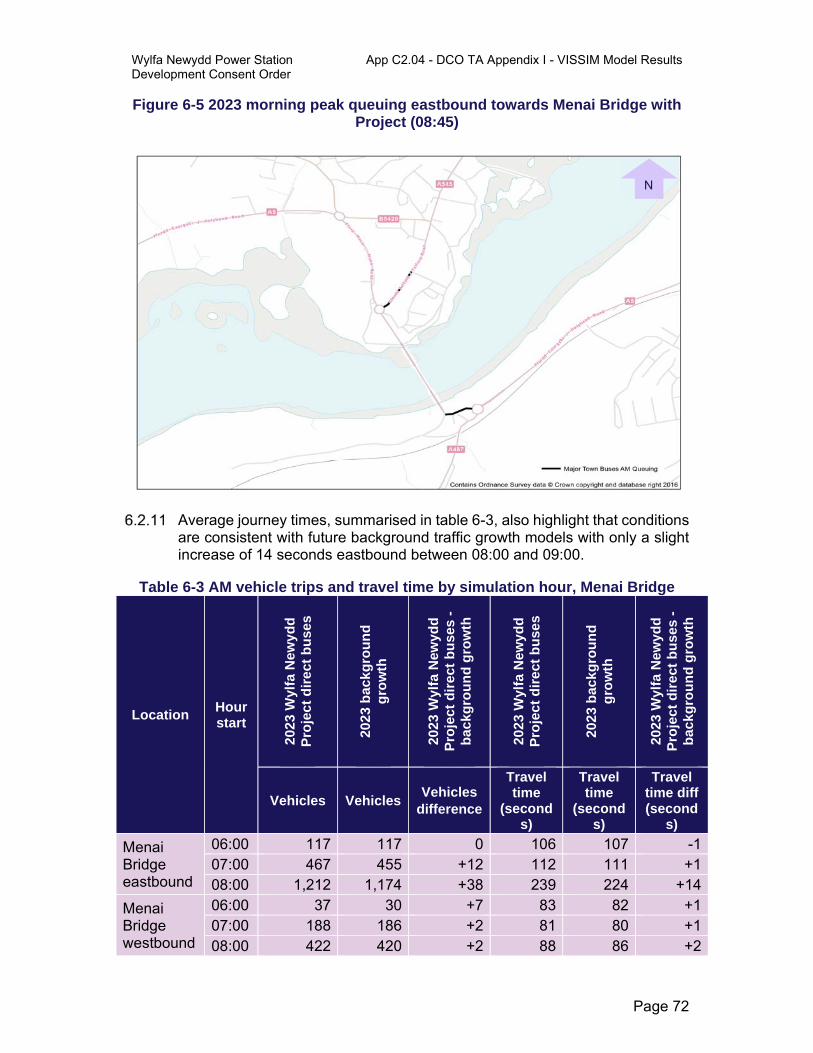
Wylfa Newydd Power Station App C2.04 - DCO TA Appendix I - VISSIM Model ResultsDevelopment Consent Order
Page 72
Figure 6-5 2023 morning peak queuing eastbound towards Menai Bridge with Project (08:45)
Average journey times, summarised in table 6-3, also highlight that conditions
are consistent with future background traffic growth models with only a slight increase of 14 seconds eastbound between 08:00 and 09:00.
Table 6-3 AM vehicle trips and travel time by simulation hour, Menai Bridge
Location Hour start
2023
Wyl
fa N
ewyd
d
Pro
ject
dir
ect
bu
ses
2023
bac
kgro
un
d
gro
wth
2023
Wyl
fa N
ewyd
d
Pro
ject
dir
ect
bu
ses
-b
ackg
rou
nd
gro
wth
2023
Wyl
fa N
ewyd
d
Pro
ject
dir
ect
bu
ses
2023
bac
kgro
un
d
gro
wth
2023
Wyl
fa N
ewyd
d
Pro
ject
dir
ect
bu
ses
-b
ackg
rou
nd
gro
wth
Vehicles VehiclesVehicles
difference
Travel time
(seconds)
Travel time
(seconds)
Travel time diff (second
s)
Menai Bridge eastbound
06:00 117 117 0 106 107 -107:00 467 455 +12 112 111 +108:00 1,212 1,174 +38 239 224 +14
Menai Bridge westbound
06:00 37 30 +7 83 82 +107:00 188 186 +2 81 80 +108:00 422 420 +2 88 86 +2
N
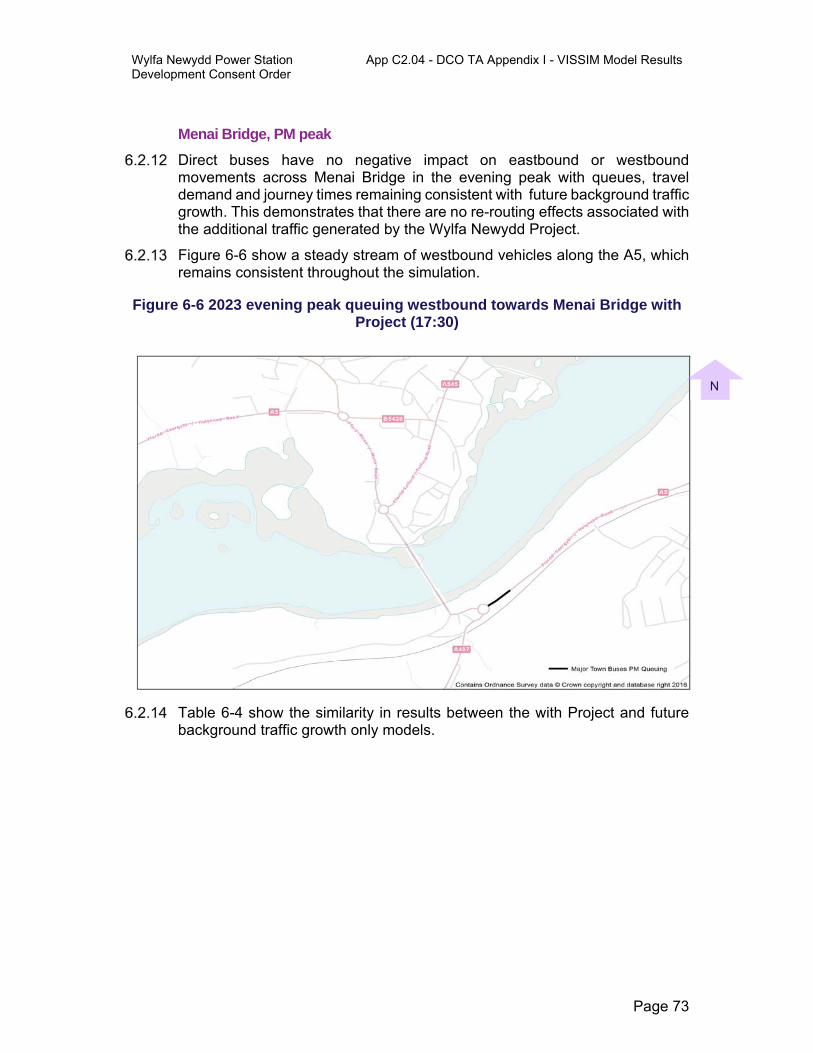
Wylfa Newydd Power Station App C2.04 - DCO TA Appendix I - VISSIM Model ResultsDevelopment Consent Order
Page 73
Menai Bridge, PM peak
Direct buses have no negative impact on eastbound or westbound movements across Menai Bridge in the evening peak with queues, travel demand and journey times remaining consistent with future background traffic growth. This demonstrates that there are no re-routing effects associated with the additional traffic generated by the Wylfa Newydd Project.
Figure 6-6 show a steady stream of westbound vehicles along the A5, which remains consistent throughout the simulation.
Figure 6-6 2023 evening peak queuing westbound towards Menai Bridge with Project (17:30)
Table 6-4 show the similarity in results between the with Project and future
background traffic growth only models.
N

Wylfa Newydd Power Station App C2.04 - DCO TA Appendix I - VISSIM Model ResultsDevelopment Consent Order
Page 74
Table 6-4 2023 PM vehicle trips and travel time by simulation hour with Project, Menai Bridge
Location Hour start
2023
Wyl
fa N
ewyd
d
Pro
ject
dir
ect
bu
ses
2023
bac
kgro
un
d
gro
wth
2023
Wyl
fa N
ewyd
d
Pro
ject
dir
ect
bu
ses
-bac
kgro
un
d g
row
th
2023
Wyl
fa N
ewyd
d
Pro
ject
dir
ect
bu
ses
2023
bac
kgro
un
d
gro
wth
2023
Wyl
fa N
ewyd
d
Pro
ject
dir
ect
bu
ses
-bac
kgro
un
d g
row
th
Vehicles VehiclesVehicles
difference
Travel time
(seconds)
Travel time
(seconds)
Travel time diff (second
s)
Menai Bridge eastbound
15:00 511 507 +4 109 108 +1 16:00 609 619 -10 117 115 +2 17:00 499 547 -48 119 119 0
Menai Bridge westbound
15:00 593 582 +11 87 87 0 16:00 1,102 1,065 +37 94 92 +2 17:00 1,214 1,286 -72 98 100 -2
Summary
AM peak
Figure 6-7 and figure 6-8 show a comparison of queuing conditions at 08:45 (when modelled queues are at their longest) for the future background traffic growth and direct buses models on Britannia Bridge and Menai Bridge approaches respectively. All eastbound construction worker traffic is clear of the network by 07:00 with only LGV and HGV construction traffic present during the main peak period.
Construction traffic increases maximum traffic queues by approximately 300m. Average delay increases by 13 seconds across the modelled peak hour.
Table 6-5 and table 6-6 summarise the traffic volumes and average journey times across both Britannia and Menai Bridges in the base, background growth and direct buses scenarios.
The greatest impact on journey times is as a result of future background traffic growth with all average 2023 future model journey times being similar.
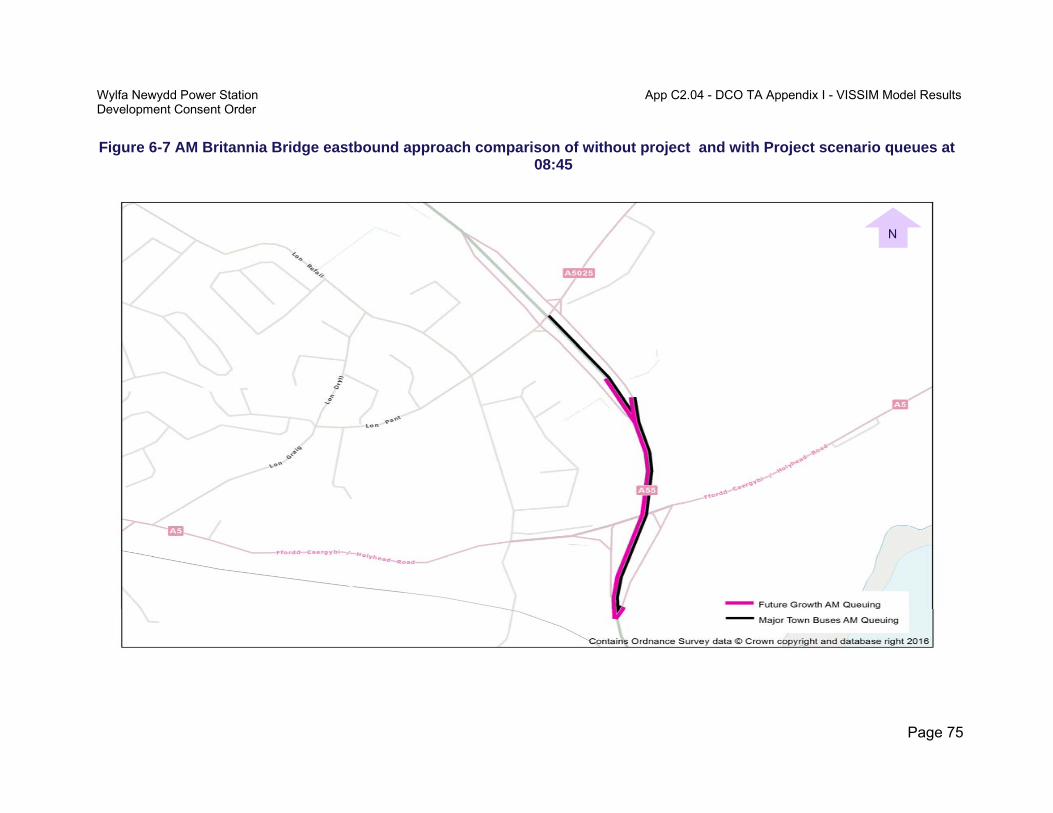
Wylfa Newydd Power Station App C2.04 - DCO TA Appendix I - VISSIM Model ResultsDevelopment Consent Order
Page 75
Figure 6-7 AM Britannia Bridge eastbound approach comparison of without project and with Project scenario queues at 08:45
N

Wylfa Newydd Power Station App C2.04 - DCO TA Appendix I - VISSIM Model ResultsDevelopment Consent Order
Page 76
Figure 6-8 AM Menai Bridge comparison of without Project and with Project scenario queues at 08:45
N

Wylfa Newydd Power Station App C2.04 - DCO TA Appendix I - VISSIM Model ResultsDevelopment Consent Order
Page 77
Table 6-5 AM summary comparison of total traffic volumes by option (06:00-09:00)
Movement base without Project with Project
Britannia Bridge eastbound 3,673 3,761 3,810 Britannia Bridge westbound 2,461 2,591 3,049 Menai Bridge eastbound 1,576 1,746 1,796 Menai Bridge westbound 586 636 647
Table 6-6 AM summary comparison of average journey times (seconds) by option (06:00-09:00)
Movement base without Project with Project
Britannia Bridge eastbound 150 196 201 Britannia Bridge westbound 132 138 138 Menai Bridge eastbound 117 147 152 Menai Bridge westbound 82 83 84
PM peak
A comparison of queuing conditions at 17:30 at the westbound approach to Britannia Bridge and Menai Bridge is given in figure 6-9 and figure 6-10.
As a result of construction worker traffic being clear of Britannia Bridge by 16:30, with only LGV and HGV traffic continuing, there is no further impact on network performance after 17:00 compared to the future background traffic growth test.
Menai Bridge is unaffected with a steady flow of vehicles crossing westbound in each model.
Table 6-7 and table 6-8 highlight the similarities between the without Project and with Project options with the main difference being the increase in A55 westbound traffic volumes. The impact on journey times of additional construction worker traffic is limited with the largest change in journey time being 5 seconds.
As in the morning peak, increased journey times are primarily a result of background traffic growth.

Wylfa Newydd Power Station App C2.04 - DCO TA Appendix I - VISSIM Model ResultsDevelopment Consent Order
Page 78
Figure 6-9 PM Britannia Bridge westbound approach comparison of without Project and with Project scenario queues at 17:30
N
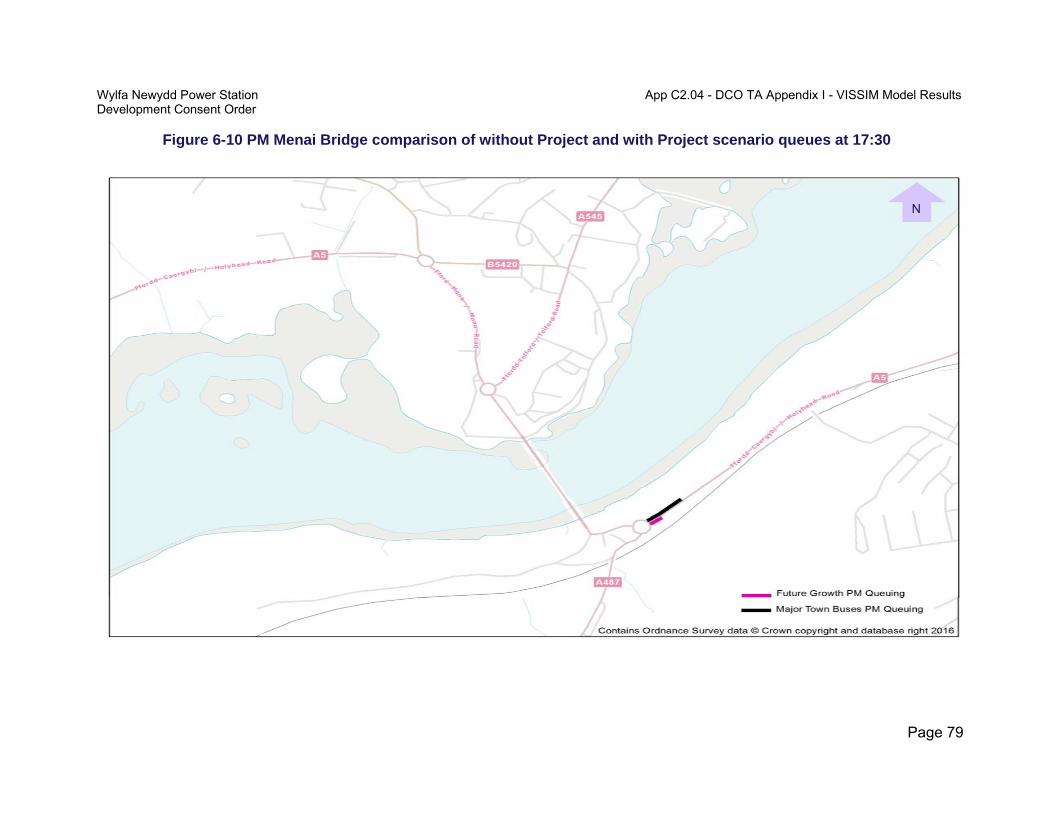
Wylfa Newydd Power Station App C2.04 - DCO TA Appendix I - VISSIM Model ResultsDevelopment Consent Order
Page 79
Figure 6-10 PM Menai Bridge comparison of without Project and with Project scenario queues at 17:30
N

Wylfa Newydd Power Station App C2.04 - DCO TA Appendix I - VISSIM Model ResultsDevelopment Consent Order
Page 80
Table 6-7 PM summary comparison of total traffic volumes by option (15:00-18:00)
Movement base without Project
with Project
Britannia Bridge eastbound
3,684 3,967 4,135
Britannia Bridge westbound
4,722 5,111 5,276
Menai Bridge eastbound
1,505 1,673 1,619
Menai Bridge westbound
2,817 2,933 2,909
Table 6-8 PM summary comparison of average journey times (seconds) by option (15:00-18:00)
Movement base without Project
with Project
Britannia Bridge eastbound
124 125 125
Britannia Bridge westbound
146 192 201
Menai Bridge eastbound
116 114 115
Menai Bridge westbound
90 93 93
In conclusion, the VISSIM modelling illustrates that:
the primary cause of increased queues and delays in 2023 is background growth.
eastbound, construction worker trips cross Britannia Bridge outside peak periods with only a small number of LGV and HGV trips continuing.
westbound, morning construction trips cross the Menai Strait before 07:00; only night shift traffic has the potential to significantly impact on the operational performance of Britannia Bridge.
direct buses reduce construction worker traffic in the early part of the evening peak.

Wylfa Newydd Power Station App C2.04 - DCO TA Appendix I - VISSIM Model ResultsDevelopment Consent Order
Page 81
7. August Sensitivity Test
Introduction To determine the possible effects of seasonal variation in baseline traffic flows
on A55 Britannia Bridge, origin-destination pairs crossing the Menai Strait have been adjusted based on differences in ATC data between March and August. The results of the VISSIM modelling are discussed in this chapter.
Britannia Bridge ATC comparison A comparison of ATC data has been undertaken to calculate the variation in
traffic flows on the A55 crossing Britannia Bridge between 15-23 March 2016 and 1-31 August 2016. Hourly March ATC data collected by Jacobs was compared with hourly August ATC data provided by Welsh Government to determine the seasonality adjustment required for each hour and direction. The comparison is based upon the variation in average traffic flows from Monday to Thursday inclusive, with Friday and weekend days excluded to provide a more accurate comparison with the assessment presented in section 6.
August seasonality adjustment factors have been calculated as a percentage increase or decrease from March flows. A comparison by hour is given in figure 7-1 and actual change shown in figure 7-2. The comparison shows that in the network peak hours beginning 08:00 and 17:00 there is a reduction in total traffic compared with March. In addition peak traffic flows in August in any single hour were not observed to exceed the maximum peak traffic flows in March (see table 7-1 and table 7-2).
Figure 7-1 March to August seasonality comparison by hour (percent change)

Wylfa Newydd Power Station App C2.04 - DCO TA Appendix I - VISSIM Model ResultsDevelopment Consent Order
Page 82
Figure 7-2 March to August seasonality comparison by hour (absolute change)
Model factors by hour and direction are given in table 7-1 and table 7-2.
Table 7-1 A55 Britannia Bridge eastbound ATC flows and seasonality factors 06:00–
07:00 07:00-08:00
08:00-09:00
15:00-16:00
16:00-17:00
17:00-18:00
A55 August Flow
670 1313 1565 1282 1437 1476
A55 March Flow
583 1340 1832 1123 1342 1285
Diff = Aug – Mar
+87 -27 -267 +159 +95 +191
Factors (%) +15% -2% -15% +14% +7% +15%
Table 7-2 A55 Britannia Bridge westbound ATC flows and seasonality factors 06:00–
07:00 07:00-08:00
08:00-09:00
15:00-16:00
16:00-17:00
17:00-18:00
A55 August Flow
392 908 1124 1523 1622 1657
A55 March Flow
327 904 1325 1362 1694 1699
Diff = Aug – Mar
+66 +5 -202 +161 -72 -42
Factors (%) +20% +1% -15% +12% -4% -2%
Matrix adjustment Initially, the seasonality factor has been applied to the base model matrices
for all origin-destination (OD) pairs crossing the Menai Strait. OD pairs not crossing the Menai Strait remain unchanged.
As vehicles can travel via either A55 Britannia Bridge or Menai Bridge to reach their destination, the change in modelled vehicle flows may vary slightly
Wylfa Newydd Power Station App C2.04 - DCO TA Appendix I - VISSIM Model ResultsDevelopment Consent Order
Page 83
compared with the seasonality factor. To ensure growth on Britannia Bridge exactly equals to the seasonality factor, where necessary, a further minor adjustment has been added to the mainline A55 movement (Zones 1-19) in both directions. The maximum adjustment that has been made is 60 vehicles removed westbound in the morning peak, which is 25 percent of the 237 vehicles travelling between those zones.
August modelled traffic flow results In the morning peak there is an increase in vehicles travelling in both
directions between 06:00-07:00 in the August model compared to the neutral month model however it has no additional impact as vehicle volumes on the network are low during this period. There is a decrease in vehicles travelling in both directions across the Menai Strait between 08:00-09:00 (likely to be a function of reduced commuting) resulting in lower queues and improved journey times eastbound. Traffic volumes remain relatively unchanged between 07:00-08:00.
In the evening peak there is an increase in vehicle flows eastbound during each hour period in the August model compared to the neutral month model. There is an increase in westbound traffic flows between 15:00-16:00 while there is a small reduction in vehicle numbers travelling in the direction in both of the hour periods between 16:00-18:00 (again likely to reflect reduced homebound commuting flows).
Future background traffic growth impacts
Key locations
The basis for journey time calculations is as outlined in table 7-3 and described in detail in paragraph 3.4.1. This approach was adopted throughout the assessment of seasonality for compatibility with the assessment of a neutral month.
Table 7-3 Journey Time Calculations Route Basis of calculation
A55 Britannia Bridge eastbound
Weighted average of the A55 mainline route and the four approach routes to J8 and J8a crossing A55 Britannia Bridge as far as A55 junction 9 diverge.
A55 Britannia Bridge westbound
Weighted average of the A55 mainline route and the three approach routes to J9 crossing A55 Britannia Bridge as far as A55 junction 8a diverge.
Menai Bridge eastbound
Weighted average of the A5, A545 and B5420 approaches crossing Menai Bridge as far as the roundabout directly to the south of the Bridge.
Menai Bridge westbound
Weighted average of the A5 and A487 approaches crossing Menai Bridge as far as the roundabout directly to the north of the Bridge.
Britannia Bridge, AM peak
Unlike in the neutral month model, where morning peak eastbound queues

Wylfa Newydd Power Station App C2.04 - DCO TA Appendix I - VISSIM Model ResultsDevelopment Consent Order
Page 84
reach back towards J8 by 08:45, reduced traffic volumes in August result in less congestion across A55 Britannia Bridge. Although the merge at J8a causes vehicles on the A55 to slow, significant queueing does not occur throughout the main peak hour (08:00-09:00).
Table 7-4 highlights the improved journey times in both directions across Britannia Bridge in the 2023 background growth August model. The lack of congestion throughout the main peak hour (08:00-09:00) results in an improvement in eastbound journey time of 180 seconds compared to the neutral month model. Westbound journey times also improved by 20 seconds in the 2023 background growth August model compared to 2023 neutral conditions.
Table 7-4 2016 Base and 2023 background growth, comparison of August model and neutral model AM travel time by simulation hour, Britannia Bridge
Location Hour start
2016 base 2023 background growth
August model
Neutral model
August model - neutral model
August model
Neutral model
August model - neutral model
Travel time
(seconds)
Travel time
(seconds)
Travel time diff (second
s)
Travel time
(seconds)
Travel time
(seconds)
Travel time diff (second
s)
Britannia Bridge eastbound
06:00 124 123 +1 124 123 +1 07:00 132 134 -2 134 137 -3 08:00 138 191 -53 147 327 -180
Britannia Bridge westbound
06:00 109 109 0 109 109 0 07:00 115 115 0 115 115 0 08:00 147 172 -25 172 192 -20
Britannia Bridge, PM peak
In the evening peak there is generally an increase in vehicle numbers eastbound and a slight decrease in vehicle flows westbound across Britannia Bridge. August queueing on the westbound A55 approach to Britannia Bridge remains between 17:00-18:00; however, August traffic conditions are improved on the A487 northbound approach to the A55 at Junction 9.
Although traffic volumes increase eastbound across Britannia Bridge, the increase is not significant enough to generate queues.
The journey time changes between models, shown in table 7-5, highlight the traffic changes above. Eastbound there are slight increases in journey time in both the 2016 August base and 2023 August background growth models between 16:00-18:00 compared to the neutral models. The maximum increase is +7 seconds in 2016, between 17:00-18:00.
Westbound journey times, crossing Britannia Bridge, decrease between 17:00-18:00 reflecting the improved conditions on the A487 approach to the A55.

Wylfa Newydd Power Station App C2.04 - DCO TA Appendix I - VISSIM Model ResultsDevelopment Consent Order
Page 85
Table 7-5 2016 Base and 2023 background growth, comparison of August model and neutral model PM travel time by simulation hour, Britannia Bridge
Location Hour start
2016 base 2023 background growth August model
Neutral model
August model - neutral model
August model
Neutral model
August model - neutral model
Travel time
(seconds)
Travel time
(seconds)
Travel time diff (second
s)
Travel time
(seconds)
Travel time
(seconds)
Travel time diff (second
s)
Britannia Bridge eastbound
15:00 123 123 0 124 124 0 16:00 125 124 +1 126 125 +1 17:00 132 125 +7 131 126 +5
Britannia Bridge westbound
15:00 120 119 +1 122 120 +2 16:00 123 123 0 124 128 -4 17:00 180 197 -17 290 327 -37
Menai Bridge, AM peak
Reduced vehicle flows eastbound across Menai Bridge result in a significant improvement in journey time of 88 seconds between 08:00-09:00 in the 2023 August background growth model compared with neutral values. Elsewhere there is little change in journey time between models as shown in table 7-6.
Table 7-6 2016 Base and 2023 background growth, comparison of August model and neutral model AM travel time by simulation hour, Menai Bridge
Location Hour start
2016 base 2023 background growth August model
Neutral model
August model - neutral model
August model
Neutral model
August model - neutral model
Travel time
(seconds)
Travel time
(seconds)
Travel time diff (second
s)
Travel time
(seconds)
Travel time
(seconds)
Travel time diff (second
s)
Menai Bridge eastbound
06:00 106 108 -2 106 107 -1 07:00 110 109 +1 111 111 0 08:00 123 134 -11 136 224 -88
Menai Bridge westbound
06:00 82 82 0 82 82 0 07:00 81 80 +1 81 80 +1 08:00 83 84 -1 84 86 -2
Menai Bridge, PM peak
Additional vehicles travelling eastbound across Menai Bridge between 17:00-18:00 do not have any further impact on queuing conditions on approach to
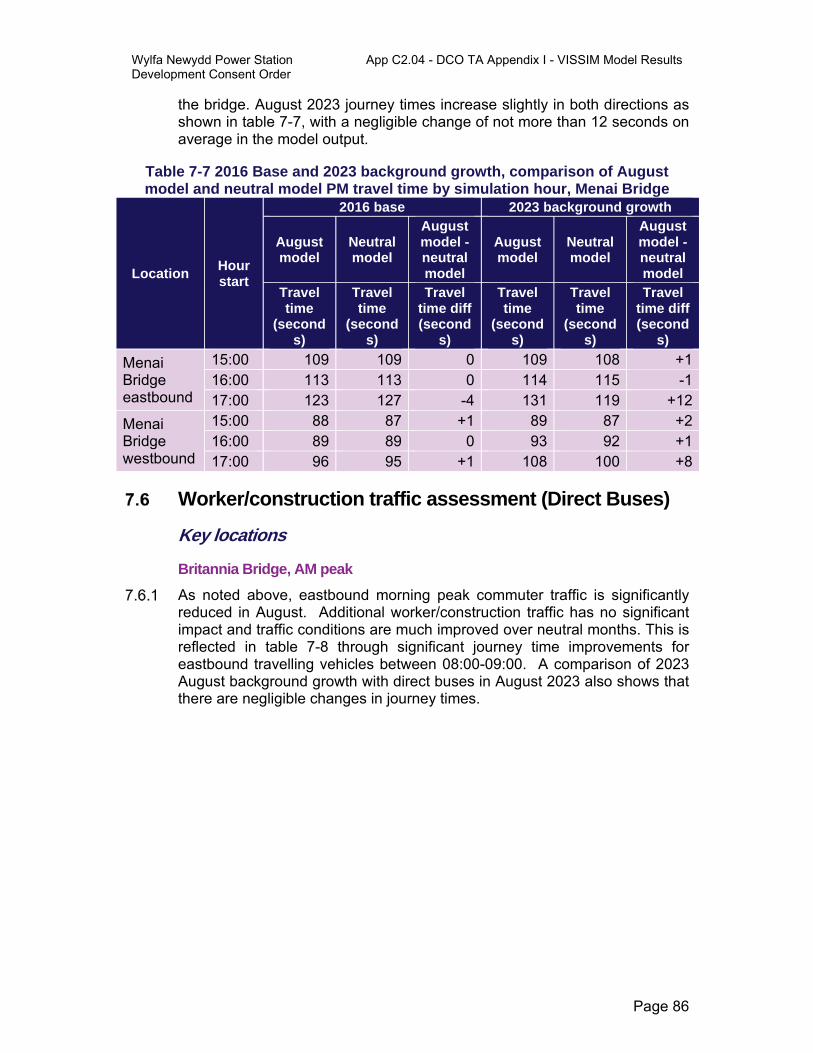
Wylfa Newydd Power Station App C2.04 - DCO TA Appendix I - VISSIM Model ResultsDevelopment Consent Order
Page 86
the bridge. August 2023 journey times increase slightly in both directions as shown in table 7-7, with a negligible change of not more than 12 seconds on average in the model output.
Table 7-7 2016 Base and 2023 background growth, comparison of August model and neutral model PM travel time by simulation hour, Menai Bridge
Location Hour start
2016 base 2023 background growth
August model
Neutral model
August model - neutral model
August model
Neutral model
August model - neutral model
Travel time
(seconds)
Travel time
(seconds)
Travel time diff (second
s)
Travel time
(seconds)
Travel time
(seconds)
Travel time diff (second
s)
Menai Bridge eastbound
15:00 109 109 0 109 108 +116:00 113 113 0 114 115 -117:00 123 127 -4 131 119 +12
Menai Bridge westbound
15:00 88 87 +1 89 87 +216:00 89 89 0 93 92 +117:00 96 95 +1 108 100 +8
Worker/construction traffic assessment (Direct Buses)
Key locations
Britannia Bridge, AM peak
As noted above, eastbound morning peak commuter traffic is significantly reduced in August. Additional worker/construction traffic has no significant impact and traffic conditions are much improved over neutral months. This is reflected in table 7-8 through significant journey time improvements for eastbound travelling vehicles between 08:00-09:00. A comparison of 2023 August background growth with direct buses in August 2023 also shows that there are negligible changes in journey times.

Wylfa Newydd Power Station App C2.04 - DCO TA Appendix I - VISSIM Model ResultsDevelopment Consent Order
Page 87
Table 7-8 2023 background growth and 2023 with project, comparison of August model and neutral model AM travel time by simulation hour, Britannia
Bridge
Location Hour start
2023 Wylfa Newydd Project direct buses
2023 background growth
August model
Neutral model
August model - neutral model
August model
Neutral model
August model - neutral model
Travel time
(seconds)
Travel time
(seconds)
Travel time diff (second
s)
Travel time
(seconds)
Travel time
(seconds)
Travel time diff (second
s)
Britannia Bridge eastbound
06:00 124 124 0 124 123 +107:00 134 139 -5 134 137 -308:00 150 339 -189 147 327 -180
Britannia Bridge westbound
06:00 108 108 0 109 109 007:00 114 114 0 115 115 008:00 183 191 -8 172 192 -20
Location Hour start
2023 August Comparison
Background
growth
Wylfa Newydd Project direct buses
Background
growth – direct buses
Travel time
(seconds)
Travel time
(seconds)
Travel time diff (second
s)
Britannia Bridge eastbound
06:00 124 124 007:00 134 134 008:00 147 150 -3
Britannia Bridge westbound
06:00 109 108 107:00 115 114 108:00 172 183 -11
Britannia Bridge, PM peak
In the evening peak on the westbound A55 approach to Britannia Bridge queues are similar in the 2023 direct buses test with those in the 2023 background growth test. Again, August conditions are improved on the A487 northbound approach to the A55. table 7-9 highlights the similarities between journey times in the 2023 direct buses test and the 2023 background growth test. A comparison of 2023 August background growth with direct buses in August 2023 also shows that there are negligible changes in journey times, a reduction in all cases.

Wylfa Newydd Power Station App C2.04 - DCO TA Appendix I - VISSIM Model ResultsDevelopment Consent Order
Page 88
Table 7-9 2023 background growth and 2023 with project, comparison of August model and neutral model PM travel time by simulation hour, Britannia
Bridge
Location Hour start
2023 Wylfa Newydd Project direct buses
2023 background growth
August model
Neutral model
August model - neutral model
August model
Neutral model
August model - neutral model
Travel time
(seconds)
Travel time
(seconds)
Travel time diff (second
s)
Travel time
(seconds)
Travel time
(seconds)
Travel time diff (second
s)
Britannia Bridge eastbound
15:00 125 124 +1 124 124 0 16:00 126 125 +1 126 125 +1 17:00 145 127 +18 131 126 +5
Britannia Bridge westbound
15:00 125 120 +5 122 120 +2 16:00 125 131 -6 124 128 -4 17:00 325 351 -26 290 327 -37
Location Hour start
2023 August Comparison
Background
growth
Wylfa Newydd Project direct buses
Background
growth – direct buses
Travel time
(seconds)
Travel time
(seconds)
Travel time diff (second
s)
Britannia Bridge eastbound
15:00 124 125 0 16:00 126 126 0 17:00 131 145 -3
Britannia Bridge westbound
15:00 122 125 -3 16:00 124 125 -1 17:00 290 325 -35
Menai Bridge, AM peak
Similar to the 2023 background growth test the reduced vehicle flows eastbound between 08:00-09:00 result in a significant improvement in journey time of -103 seconds during this hour. Elsewhere there is little difference between the August model and neutral model as shown in table 7-10. A comparison of 2023 August background growth with direct buses in August 2023 also shows that there are negligible changes in journey times.
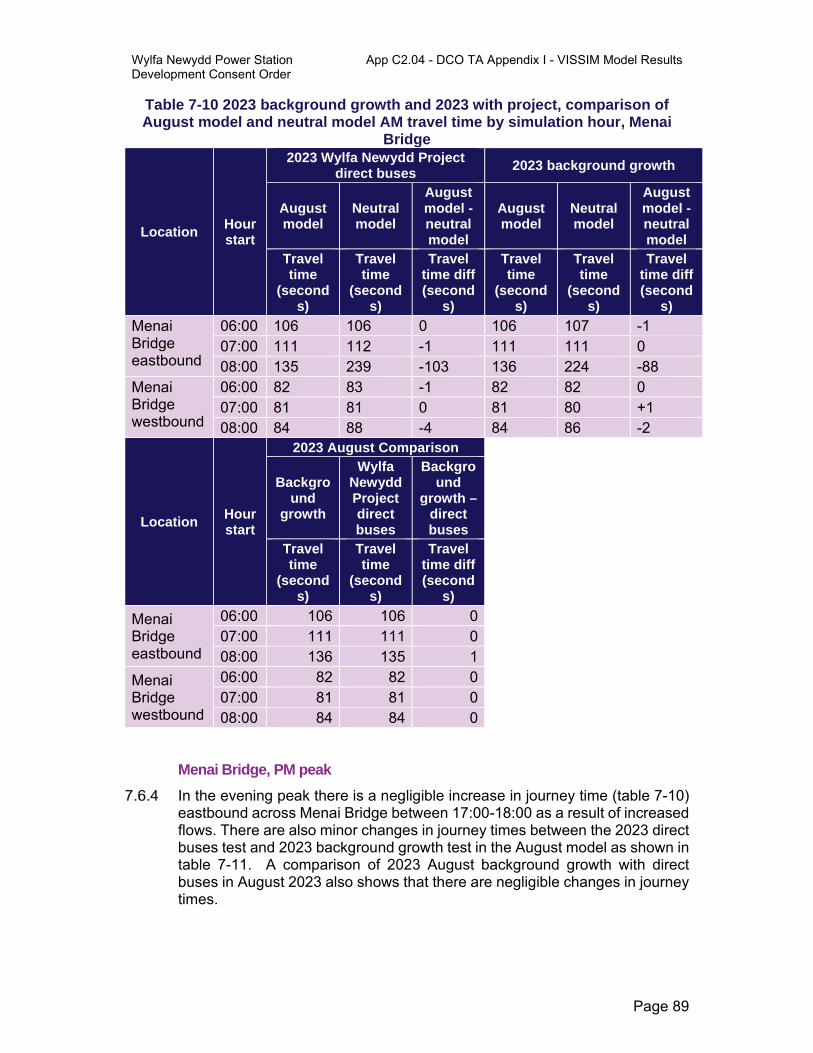
Wylfa Newydd Power Station App C2.04 - DCO TA Appendix I - VISSIM Model ResultsDevelopment Consent Order
Page 89
Table 7-10 2023 background growth and 2023 with project, comparison of August model and neutral model AM travel time by simulation hour, Menai
Bridge
Location Hour start
2023 Wylfa Newydd Project direct buses
2023 background growth
August model
Neutral model
August model - neutral model
August model
Neutral model
August model - neutral model
Travel time
(seconds)
Travel time
(seconds)
Travel time diff (second
s)
Travel time
(seconds)
Travel time
(seconds)
Travel time diff (second
s)
Menai Bridge eastbound
06:00 106 106 0 106 107 -1 07:00 111 112 -1 111 111 0 08:00 135 239 -103 136 224 -88
Menai Bridge westbound
06:00 82 83 -1 82 82 0 07:00 81 81 0 81 80 +1 08:00 84 88 -4 84 86 -2
Location Hour start
2023 August Comparison
Background
growth
Wylfa Newydd Project direct buses
Background
growth – direct buses
Travel time
(seconds)
Travel time
(seconds)
Travel time diff (second
s)
Menai Bridge eastbound
06:00 106 106 007:00 111 111 008:00 136 135 1
Menai Bridge westbound
06:00 82 82 007:00 81 81 008:00 84 84 0
Menai Bridge, PM peak
In the evening peak there is a negligible increase in journey time (table 7-10) eastbound across Menai Bridge between 17:00-18:00 as a result of increased flows. There are also minor changes in journey times between the 2023 direct buses test and 2023 background growth test in the August model as shown in table 7-11. A comparison of 2023 August background growth with direct buses in August 2023 also shows that there are negligible changes in journey times.

Wylfa Newydd Power Station App C2.04 - DCO TA Appendix I - VISSIM Model ResultsDevelopment Consent Order
Page 90
Table 7-11 2023 background growth and 2023 with project, comparison of August model and neutral model PM travel time by simulation hour, Menai
Bridge
Location Hour start
2023 Wylfa Newydd Project direct buses
2023 background growth
August model
Neutral model
August model - neutral model
August model
Neutral model
August model - neutral model
Travel time
(seconds)
Travel time
(seconds)
Travel time diff (second
s)
Travel time
(seconds)
Travel time
(seconds)
Travel time diff (second
s)
Menai Bridge eastbound
15:00 109 109 0 109 108 +1 16:00 117 117 0 114 115 -1 17:00 126 119 +7 131 119 +12
Menai Bridge westbound
15:00 88 87 +1 89 87 +2 16:00 93 94 -1 93 92 +1 17:00 101 98 +3 108 100 +8
Location Hour start
2023 August Comparison
Background
growth
Wylfa Newydd Project direct buses
Background
growth – direct buses
Travel time
(seconds)
Travel time
(seconds)
Travel time diff (second
s)
Menai Bridge eastbound
15:00 109 109 0 16:00 114 117 -3 17:00 131 126 5
Menai Bridge westbound
15:00 89 88 1 16:00 93 93 0 17:00 108 101 7
Summary of August sensitivity test The August sensitivity testing indicates that on an hour by hour basis traffic
flows in August are generally greater than in March. However, the peak hour traffic flow in March is not exceeded in any hour in August.
In addition, traffic flows during the AM peak between 08:00 and 09:00 decrease in both directions across Britannia Bridge. This results in reduced queues and much improved journey times eastbound on the A55.
There is also a slight decrease in vehicle flows westbound between 17:00 and 18:00 that results in improved conditions on the A487 approach to junction 9 on the A55 approach to Britannia Bridge. This is also reflected by improved

Wylfa Newydd Power Station App C2.04 - DCO TA Appendix I - VISSIM Model ResultsDevelopment Consent Order
Page 91
journey times. Although there is an increased flow eastbound during this hour the effects on journey time are minimal.
The impact on journey times of the Wylfa Newydd Project in August, compared with the August 2023 future background is negligible.
Wylfa Newydd Power Station App C2.04 - DCO TA Appendix I - VISSIM Model ResultsDevelopment Consent Order
Page 92
8. Summary and conclusion
Overview Jacobs has been commissioned by Horizon to develop a VISSIM
microsimulation model of Britannia Bridge, which links Anglesey and the Welsh mainland across the Menai Strait.
The model simulation area has been developed in consultation with stakeholders and includes both Britannia Bridge and Menai Bridge. The road network covers the A55 Junctions 7 to 11, allowing for potential rerouting impacts across the Menai Strait to be assessed. Coverage has also been defined by existing A55 traffic conditions and the anticipated impact of main construction worker traffic. All future year analysis has been undertaken for the forecast future year 2023, which is anticipated to be the peak construction year. The model has undergone a technical review by Welsh Government.
Calibration/validation Welsh Government Transport Appraisal Guidance requires the application of
WebTAG standards in the development of transport models. The Britannia Bridge VISSIM model has been calibrated to an appropriate standard following the principles outlined in WebTAG (RD2). The calibration of each model period is within the acceptability guidelines for all morning and evening peak modelled hours.
Future year tests A series of future year tests have been undertaken to assess the impact of
background growth and construction worker traffic. Alternative demand management options for mitigation have then been considered.
Trip generation
Future background traffic growth only
VISSIM modelling show that the biggest driver in changing network conditions by 2023 is background growth. In the morning peak, eastbound traffic from Anglesey must join a longer queue towards Britannia Bridge as commuting traffic travels towards Bangor and the mainland. Queues extend back towards the Junction 8 overbridge with increased merge delays on the A5025 eastbound on-slip.
In the evening peak, the reverse pattern occurs with longer eastbound queues westbound towards Britannia Bridge. While A55 queues are only slightly increased, queues on the A487 merge are forecast to increase significantly, extending through the A487 roundabout, southwards beyond Penrhos Road.
August seasonality adjustment factors have been applied to the matrices to assess the effects of seasonal variation in baseline traffic flows on A55 Britannia Bridge. The adjustment factors have been calculated as a percentage increase or decrease based on March ATC data and August ATC

Wylfa Newydd Power Station App C2.04 - DCO TA Appendix I - VISSIM Model ResultsDevelopment Consent Order
Page 93
data crossing Britannia Bridge in both directions.
Construction traffic and direct buses mitigation
Eastbound, the majority of construction worker trips crossing Britannia Bridge occur outside peak periods (04:00-06:00 and 18:00-20:00). Westbound, the morning construction worker shift crosses the bridge before 07:00; however, night shift traffic coincides with evening peak traffic. It is this night shift traffic which has the greatest potential to impact on the operational performance of Britannia Bridge.
Direct buses provide benefits by reducing the number of construction worker vehicle trips crossing between the mainland and Anglesey. This mitigation provides the greatest benefit westbound in the early part of the evening peak.
Approximately 14 LGVs and 18 HGVs cross Britannia Bridge in each direction in each modelled hour period. These vehicles result in a slight increase in eastbound queues and journey times between 08:00 and 09:00.
Conclusion In conclusion, the VISSIM modelling illustrates that:
the primary cause of increased queues and delays in 2023 is forecast growth;
eastbound, construction worker trips cross Britannia Bridge outside peak periods. The small number of LGV and HGV trips result in a slight increase in journey times and queues eastbound between 08:00 and 09:00;
westbound, morning construction worker trips cross the bridge before 07:00 avoiding the peak hour. Night shift traffic does coincide with the early part of the evening peak traffic; however, traffic crosses Britannia Bridge before 17:00;
direct buses reduce construction worker traffic in the early part of the evening peak helping to negate any negative impact these trips have on network performance;
sensitivity testing indicates that future background traffic in August would generally increase outside the network peak and decrease during network peaks, but that this would not lead to perceptible changes in journey times when compared with the March future background. The exception to this is the A55 Britannia Bridge eastbound, when a significant reduction in journey times is forecast between 08:00-09:00;
Overall, including in the assessment of August sensitivity, direct buses ensure that the impact on the highway network is negligible compared with the future background traffic growth scenario.
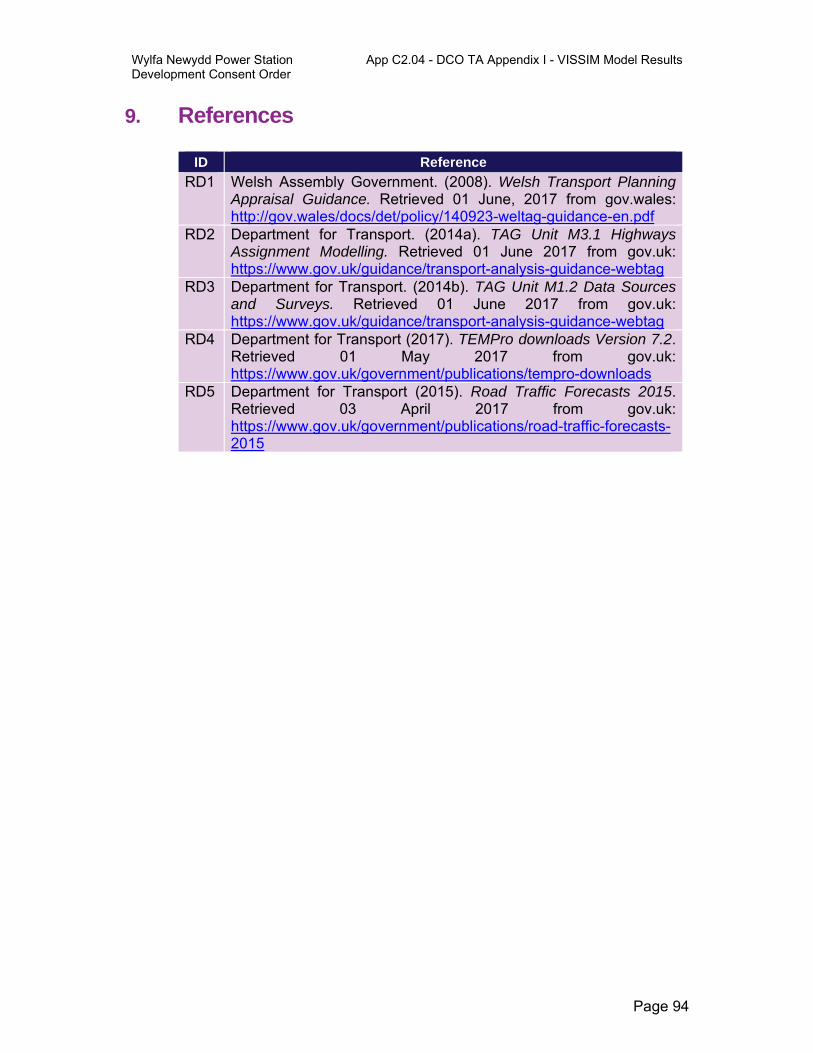
Wylfa Newydd Power Station App C2.04 - DCO TA Appendix I - VISSIM Model ResultsDevelopment Consent Order
Page 94
9. References
ID Reference
RD1 Welsh Assembly Government. (2008). Welsh Transport Planning Appraisal Guidance. Retrieved 01 June, 2017 from gov.wales: http://gov.wales/docs/det/policy/140923-weltag-guidance-en.pdf
RD2 Department for Transport. (2014a). TAG Unit M3.1 Highways Assignment Modelling. Retrieved 01 June 2017 from gov.uk: https://www.gov.uk/guidance/transport-analysis-guidance-webtag
RD3 Department for Transport. (2014b). TAG Unit M1.2 Data Sources and Surveys. Retrieved 01 June 2017 from gov.uk: https://www.gov.uk/guidance/transport-analysis-guidance-webtag
RD4 Department for Transport (2017). TEMPro downloads Version 7.2. Retrieved 01 May 2017 from gov.uk: https://www.gov.uk/government/publications/tempro-downloads
RD5 Department for Transport (2015). Road Traffic Forecasts 2015. Retrieved 03 April 2017 from gov.uk: https://www.gov.uk/government/publications/road-traffic-forecasts-2015

Wylfa Newydd Power Station App C2.04 - DCO TA Appendix I - VISSIM Model ResultsDevelopment Consent Order
Page 95
Appendix A. ATC/turning count data verification

Wylfa Newydd Power Station App C2.04 - DCO TA Appendix I - VISSIM Model ResultsDevelopment Consent Order
Page 96
Table A-1 ATC Origin Data Validation
Site Arm Time period Turning
count survey data
Average Tuesday 15 and 22 2016
ATC
Difference % difference GEH GEH less
than 5
Flow within 100veh/h of counts for flows less
than 700veh/h
Flow within 15% of
counts for flows from
700 to 2,700 veh/h
1 B 08:00-09:00 597 583.5 -13.5 -2% 0.6 Yes N/A
1 B 17:00-18:00 528 512 -16 -3% 0.7 Yes N/A
1 D 08:00-09:00 226 216 -10 -5% 0.7 Yes N/A
1 D 17:00-18:00 208 198.5 -9.5 -5% 0.7 Yes N/A
2 A 08:00-09:00 200 210 10 5% 0.7 Yes N/A
2 A 17:00-18:00 287 274 -13 -5% 0.8 Yes N/A
2 C 08:00-09:00 789 843 54 6% 1.9 N/A Yes
2 C 17:00-18:00 327 331 4 1% 0.2 Yes N/A
4a C 08:00-09:00 995 1001.5 6.5 1% 0.2 N/A Yes
4a C 17:00-18:00 749 707 -42 -6% 1.6 N/A Yes
4b A 08:00-09:00 299 295.5 -3.5 -1% 0.2 Yes N/A
4b A 17:00-18:00 278 276 -2 -1% 0.1 Yes N/A
5 A 08:00-09:00 607 452.5 -154.5 -34% 6.7 No N/A
5 A 17:00-18:00 1165 932.5 -232.5 -25% 7.2 No No
5 C 08:00-09:00 470 437.5 -32.5 -7% 1.5 Yes N/A
5 C 17:00-18:00 339 331 -8 -2% 0.4 Yes N/A
6 B 08:00-09:00 1245 1246.5 1.5 0% 0.0 N/A Yes
6 B 17:00-18:00 620 605 -15 -2% 0.6 Yes N/A
6 D 08:00-09:00 320 333 13 4% 0.7 Yes N/A
6 D 17:00-18:00 664 676.5 12.5 2% 0.5 Yes N/A

Wylfa Newydd Power Station App C2.04 - DCO TA Appendix I - VISSIM Model ResultsDevelopment Consent Order
Page 97
Table A-2 Destination ATC Validation
Site Arm Time period Turning
count survey data
Average Tuesday 15 and 22 2016
ATC
Difference % difference GEH GEH less
than 5
Flow within 100veh/h of counts for flows less
than 700veh/h
Flow within 15% of
counts for flows from
700 to 2,700 veh/h
1 B 08:00-09:00 545 548 3 1% 0.1 Yes N/A
1 B 17:00-18:00 616 613 -3 0% 0.1 Yes N/A
1 D 08:00-09:00 233 278 45 16% 2.8 Yes N/A
1 D 17:00-18:00 241 238 -3 -1% 0.2 Yes N/A
2 A 08:00-09:00 349 358 9 3% 0.5 Yes N/A
2 A 17:00-18:00 268 270 2 1% 0.1 Yes N/A
2 C 08:00-09:00 239 241.5 2.5 1% 0.2 Yes N/A
2 C 17:00-18:00 427 424 -3 -1% 0.1 Yes N/A
4a C 08:00-09:00 563 556.5 -6.5 -1% 0.3 Yes N/A
4a C 17:00-18:00 683 689 6 1% 0.2 Yes N/A
4b A 08:00-09:00 597 616 19 3% 0.8 Yes N/A
4b A 17:00-18:00 487 491.5 4.5 1% 0.2 Yes N/A
5 A 08:00-09:00 1074 770.5 -303.5 -39% 10.0 N/A No
5 A 17:00-18:00 895 677.5 -217.5 -32% 7.8 N/A No
5 C 08:00-09:00 477 456 -21 -5% 1.0 Yes N/A
5 C 17:00-18:00 680 676.5 -3.5 -1% 0.1 Yes N/A
6 B 08:00-09:00 536 531 -5 -1% 0.2 Yes N/A
6 B 17:00-18:00 1083 1026.5 -56.5 -6% 1.7 N/A Yes
6 D 08:00-09:00 684 734 50 7% 1.9 Yes Yes
6 D 17:00-18:00 297 306 9 3% 0.5 Yes N/A

Wylfa Newydd Power Station App C2.04 - DCO TA Appendix I - VISSIM Model ResultsDevelopment Consent Order
Page 98
Appendix B. 15 minute matrix factors
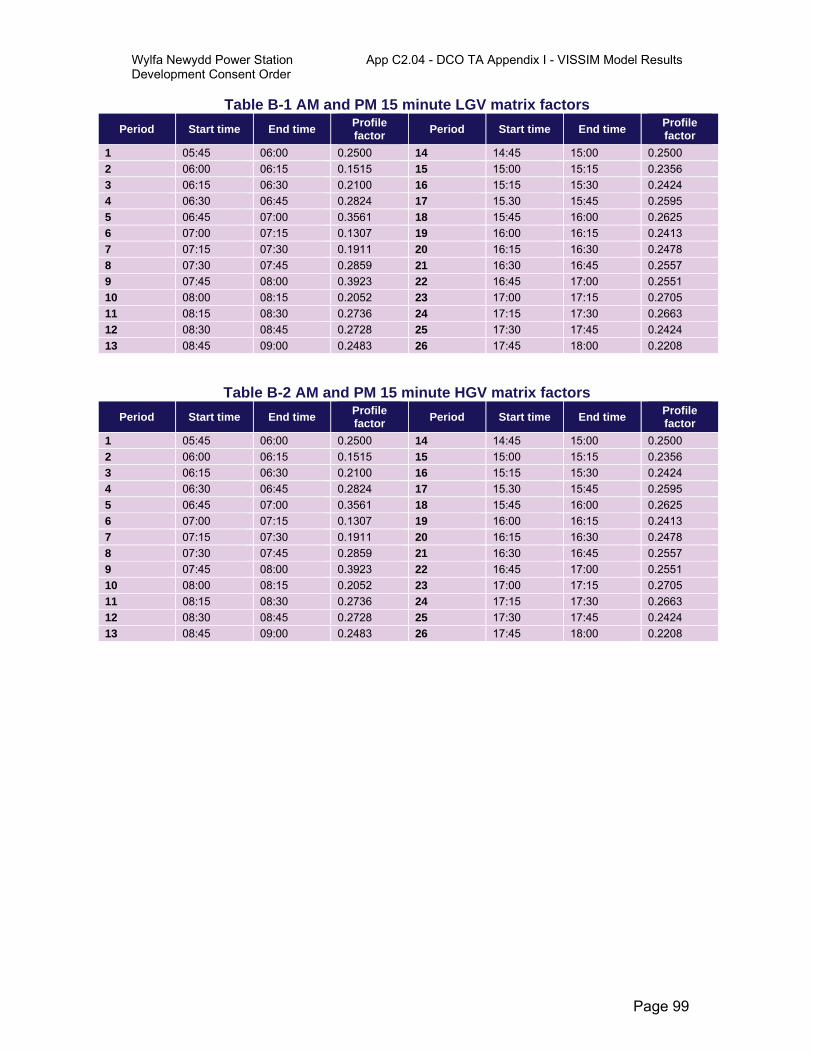
Wylfa Newydd Power Station App C2.04 - DCO TA Appendix I - VISSIM Model ResultsDevelopment Consent Order
Page 99
Table B-1 AM and PM 15 minute LGV matrix factors
Period Start time End time Profile factor
Period Start time End time Profile factor
1 05:45 06:00 0.2500 14 14:45 15:00 0.2500
2 06:00 06:15 0.1515 15 15:00 15:15 0.2356
3 06:15 06:30 0.2100 16 15:15 15:30 0.2424
4 06:30 06:45 0.2824 17 15.30 15:45 0.2595
5 06:45 07:00 0.3561 18 15:45 16:00 0.2625
6 07:00 07:15 0.1307 19 16:00 16:15 0.2413
7 07:15 07:30 0.1911 20 16:15 16:30 0.2478
8 07:30 07:45 0.2859 21 16:30 16:45 0.2557
9 07:45 08:00 0.3923 22 16:45 17:00 0.2551
10 08:00 08:15 0.2052 23 17:00 17:15 0.2705
11 08:15 08:30 0.2736 24 17:15 17:30 0.2663
12 08:30 08:45 0.2728 25 17:30 17:45 0.2424
13 08:45 09:00 0.2483 26 17:45 18:00 0.2208
Table B-2 AM and PM 15 minute HGV matrix factors
Period Start time End time Profile factor
Period Start time End time Profile factor
1 05:45 06:00 0.2500 14 14:45 15:00 0.2500
2 06:00 06:15 0.1515 15 15:00 15:15 0.2356
3 06:15 06:30 0.2100 16 15:15 15:30 0.2424
4 06:30 06:45 0.2824 17 15.30 15:45 0.2595
5 06:45 07:00 0.3561 18 15:45 16:00 0.2625
6 07:00 07:15 0.1307 19 16:00 16:15 0.2413
7 07:15 07:30 0.1911 20 16:15 16:30 0.2478
8 07:30 07:45 0.2859 21 16:30 16:45 0.2557
9 07:45 08:00 0.3923 22 16:45 17:00 0.2551
10 08:00 08:15 0.2052 23 17:00 17:15 0.2705
11 08:15 08:30 0.2736 24 17:15 17:30 0.2663
12 08:30 08:45 0.2728 25 17:30 17:45 0.2424
13 08:45 09:00 0.2483 26 17:45 18:00 0.2208

Wylfa Newydd Power Station App C2.04 - DCO TA Appendix I - VISSIM Model ResultsDevelopment Consent Order
Page 100
Appendix C. Turning count calibration results

Wylfa Newydd Power Station App C2.04 - DCO TA Appendix I - VISSIM Model ResultsDevelopment Consent Order
Page 101
Table C-1 Turning count calibration results for AM hour 06:00-07:00
Location Observed Modelled Diff % Difference Diff % Difference GEH
Car Total Car Total Car Car Total Total Car Total
A55 EB To A5025 14 22 34 45 20 143% 23 105% 4.08 3.97
A55 EB To A55 EB 224 410 208 405 -16 -7% -5 -1% 1.09 0.25
A5 To A55 EB 66 114 66 121 0 0% 7 6% 0.00 0.65
A55 WB To A5 32 66 31 69 -1 -3% 3 5% 0.18 0.37
A55 WB To A55 WB 112 258 106 259 -6 -5% 1 0% 0.57 0.06
A55 WB To A5 WB 10 18 10 18 0 0% 0 0% 0.00 0.00
A55 WB To A5 WB 0 0 0 0 0 0% 0 0% 0.00 0.00
A55 WB To A5 EB 22 48 21 45 -1 -5% -3 -6% 0.22 0.44
A5 EB To A55 EB 6 8 6 8 0 0% 0 0% 0.00 0.00
A5 EB To A5 EB 29 44 29 43 0 0% -1 -2% 0.00 0.15
A55 EB To A55 EB 1 1 0 0 -1 -100% -1 -100% 1.41 1.41
A55 EB To A5 WB 20 26 17 23 -3 -15% -3 -12% 0.70 0.61
A55 EB To A5 EB 31 63 32 63 1 3% 0 0% 0.18 0.00
A5 WB To A5 WB 101 158 103 168 2 2% 10 6% 0.20 0.78
A5 WB To A55 WB 70 89 68 86 -2 -3% -3 -3% 0.24 0.32
A5 To A55 WB 80 102 78 99 -2 -3% -3 -3% 0.23 0.30
A55 EB To A5 52 90 50 86 -2 -4% -4 -4% 0.28 0.43
A55 EB To A55 EB 233 441 216 413 -17 -7% -28 -6% 1.13 1.36
A4087 SB To A55 EB 28 44 18 30 -10 -36% -14 -32% 2.09 2.30
A55 EB To A55 EB 257 487 255 477 -2 -1% -10 -2% 0.13 0.46
A55 WB To A4087 65 118 61 107 -4 -6% -11 -9% 0.50 1.04
A55 WB To A55 WB 127 242 120 225 -7 -6% -17 -7% 0.63 1.11
A55 EB To A4087 NB 77 92 73 88 -4 -5% -4 -4% 0.46 0.42
A4087 NB To A4087 NB 104 139 90 117 -14 -13% -22 -16% 1.42 1.94
A4087 SB To A55 EB 28 44 18 30 -10 -36% -14 -32% 2.09 2.30
A4087 SB To A4087 SB 45 68 43 65 -2 -4% -3 -4% 0.30 0.37
A55 WB To A55 WB (off/on) 0 0 0 0 0 0% 0 0% 0.00 0.00
A55 WB To A4087 NB 38 56 36 50 -2 -5% -6 -11% 0.33 0.82
A55 WB To A4087 SB 27 62 26 57 -1 -4% -5 -8% 0.19 0.65
A4087 SB To A55 WB 23 34 19 29 -4 -17% -5 -15% 0.87 0.89
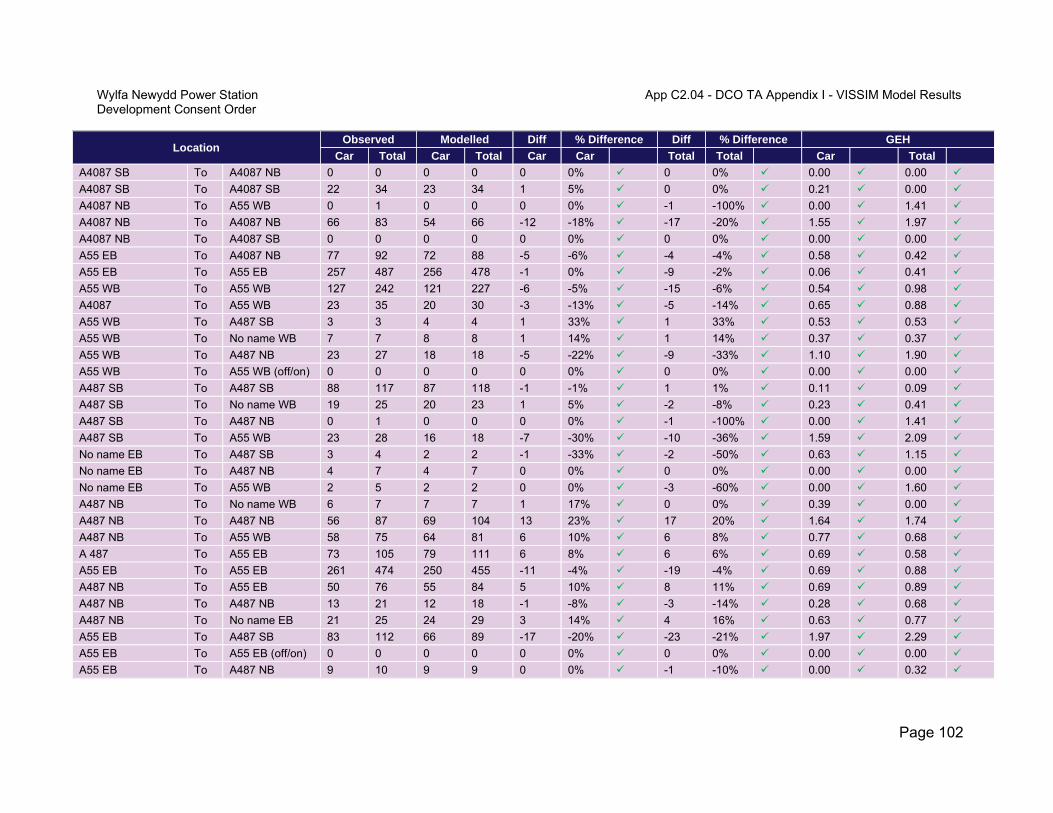
Wylfa Newydd Power Station App C2.04 - DCO TA Appendix I - VISSIM Model ResultsDevelopment Consent Order
Page 102
Location Observed Modelled Diff % Difference Diff % Difference GEH
Car Total Car Total Car Car Total Total Car Total
A4087 SB To A4087 NB 0 0 0 0 0 0% 0 0% 0.00 0.00
A4087 SB To A4087 SB 22 34 23 34 1 5% 0 0% 0.21 0.00
A4087 NB To A55 WB 0 1 0 0 0 0% -1 -100% 0.00 1.41
A4087 NB To A4087 NB 66 83 54 66 -12 -18% -17 -20% 1.55 1.97
A4087 NB To A4087 SB 0 0 0 0 0 0% 0 0% 0.00 0.00
A55 EB To A4087 NB 77 92 72 88 -5 -6% -4 -4% 0.58 0.42
A55 EB To A55 EB 257 487 256 478 -1 0% -9 -2% 0.06 0.41
A55 WB To A55 WB 127 242 121 227 -6 -5% -15 -6% 0.54 0.98
A4087 To A55 WB 23 35 20 30 -3 -13% -5 -14% 0.65 0.88
A55 WB To A487 SB 3 3 4 4 1 33% 1 33% 0.53 0.53
A55 WB To No name WB 7 7 8 8 1 14% 1 14% 0.37 0.37
A55 WB To A487 NB 23 27 18 18 -5 -22% -9 -33% 1.10 1.90
A55 WB To A55 WB (off/on) 0 0 0 0 0 0% 0 0% 0.00 0.00
A487 SB To A487 SB 88 117 87 118 -1 -1% 1 1% 0.11 0.09
A487 SB To No name WB 19 25 20 23 1 5% -2 -8% 0.23 0.41
A487 SB To A487 NB 0 1 0 0 0 0% -1 -100% 0.00 1.41
A487 SB To A55 WB 23 28 16 18 -7 -30% -10 -36% 1.59 2.09
No name EB To A487 SB 3 4 2 2 -1 -33% -2 -50% 0.63 1.15
No name EB To A487 NB 4 7 4 7 0 0% 0 0% 0.00 0.00
No name EB To A55 WB 2 5 2 2 0 0% -3 -60% 0.00 1.60
A487 NB To No name WB 6 7 7 7 1 17% 0 0% 0.39 0.00
A487 NB To A487 NB 56 87 69 104 13 23% 17 20% 1.64 1.74
A487 NB To A55 WB 58 75 64 81 6 10% 6 8% 0.77 0.68
A 487 To A55 EB 73 105 79 111 6 8% 6 6% 0.69 0.58
A55 EB To A55 EB 261 474 250 455 -11 -4% -19 -4% 0.69 0.88
A487 NB To A55 EB 50 76 55 84 5 10% 8 11% 0.69 0.89
A487 NB To A487 NB 13 21 12 18 -1 -8% -3 -14% 0.28 0.68
A487 NB To No name EB 21 25 24 29 3 14% 4 16% 0.63 0.77
A55 EB To A487 SB 83 112 66 89 -17 -20% -23 -21% 1.97 2.29
A55 EB To A55 EB (off/on) 0 0 0 0 0 0% 0 0% 0.00 0.00
A55 EB To A487 NB 9 10 9 9 0 0% -1 -10% 0.00 0.32

Wylfa Newydd Power Station App C2.04 - DCO TA Appendix I - VISSIM Model ResultsDevelopment Consent Order
Page 103
Location Observed Modelled Diff % Difference Diff % Difference GEH
Car Total Car Total Car Car Total Total Car Total
A55 EB To No name EB 27 31 27 31 0 0% 0 0% 0.00 0.00
A487 SB To A487 SB 27 32 37 44 10 37% 12 38% 1.77 1.95
A487 SB To A55 EB 10 14 11 11 1 10% -3 -21% 0.31 0.85
A487 SB To A487 NB 0 0 0 0 0 0% 0 0% 0.00 0.00
A487 SB To No name EB 2 2 4 4 2 100% 2 100% 1.15 1.15
No name WB To A487 SB 23 30 20 27 -3 -13% -3 -10% 0.65 0.56
No name WB To A55 EB 13 15 14 16 1 8% 1 7% 0.27 0.25
No name WB To A487 NB 6 6 8 8 2 33% 2 33% 0.76 0.76
A55 WB To A55 WB 117 240 112 225 -5 -4% -15 -6% 0.47 0.98
A487 To A55 WB 83 108 82 104 -1 -1% -4 -4% 0.11 0.39
A55 EB To A487 119 153 100 126 -19 -16% -27 -18% 1.82 2.29
A55 EB To A55 EB 261 474 250 455 -11 -4% -19 -4% 0.69 0.88
A55 WB To A5 EB 6 8 11 11 5 83% 3 38% 1.71 0.97
A55 WB To A5 WB 9 13 2 2 -7 -78% -11 -85% 2.98 4.02
A5 WB To A55 EB 17 26 19 27 2 12% 1 4% 0.47 0.19
A5 WB To A5 WB 14 17 13 15 -1 -7% -2 -12% 0.27 0.50
A5 EB To A55 EB 25 26 13 13 -12 -48% -13 -50% 2.75 2.94
A55 WB To A5 15 21 13 13 -2 -13% -8 -38% 0.53 1.94
A55 WB To A55 WB 185 327 177 311 -8 -4% -16 -5% 0.59 0.90
A55 WB To A5025 30 43 15 18 -15 -50% -25 -58% 3.16 4.53
A55 WB To A55 WB 155 284 161 293 6 4% 9 3% 0.48 0.53
A55 WB To A5025 NB 23 35 13 16 -10 -43% -19 -54% 2.36 3.76
A55 WB To A5025 SB 5 5 3 3 -2 -40% -2 -40% 1.00 1.00
A55 WB To A55 WB (off/on) 1 1 0 0 -1 -100% -1 -100% 1.41 1.41
A5025 NB To A5025 NB 20 24 13 16 -7 -35% -8 -33% 1.72 1.79
A5025 NB To A55 WB 9 10 0 0 -9 -100% -10 -100% 4.24 4.47
A5025 SB To A5025 SB 3 5 5 5 2 67% 0 0% 1.00 0.00
A5025 SB To A55 EB 84 120 80 111 -4 -5% -9 -8% 0.44 0.84
A5025 SB To A55 WB 21 27 31 43 10 48% 16 59% 1.96 2.70
A55 EB To A5025 NB 13 21 28 37 15 115% 16 76% 3.31 2.97
A55 EB To A5025 SB 1 1 4 4 3 300% 3 300% 1.90 1.90

Wylfa Newydd Power Station App C2.04 - DCO TA Appendix I - VISSIM Model ResultsDevelopment Consent Order
Page 104
Location Observed Modelled Diff % Difference Diff % Difference GEH
Car Total Car Total Car Car Total Total Car Total
A55 EB To A55 EB (off/on) 0 0 0 0 0 0% 0 0% 0.00 0.00
A55 WB To A55 WB 117 240 112 225 -5 -4% -15 -6% 0.47 0.98
A55 WB To A487 33 37 29 29 -4 -12% -8 -22% 0.72 1.39
A55 EB To A55 EB 224 410 206 381 -18 -8% -29 -7% 1.23 1.46
A 5025 To A55 EB 98 136 93 129 -5 -5% -7 -5% 0.51 0.61
A55 EB To A55 EB 322 546 300 511 -22 -7% -35 -6% 1.25 1.52
A5 To A55 EB 58 81 54 75 -4 -7% -6 -7% 0.53 0.68
A55 WB To A55 WB 155 284 160 293 5 3% 9 3% 0.40 0.53
A5025 To A55 WB 31 38 31 43 0 0% 5 13% 0.00 0.79
A55 EB To A55 EB (off/on) 1 2 0 0 -1 -100% -2 -100% 1.41 2.00
A55 EB To A5152 NB 0 1 0 0 0 0% -1 -100% 0.00 1.41
A55 EB To A5152 SB 15 18 17 20 2 13% 2 11% 0.50 0.46
A5152 NB To A55 WB 14 19 15 19 1 7% 0 0% 0.26 0.00
A5152 NB To A55 EB 26 49 44 67 18 69% 18 37% 3.04 2.36
A5152 NB To A5152 NB 0 1 0 0 0 0% -1 -100% 0.00 1.41
A5152 SB To A55 WB 0 0 0 0 0 0% 0 0% 0.00 0.00
A5152 SB To A55 EB 0 1 0 0 0 0% -1 -100% 0.00 1.41
A5152 SB To A5152 SB 100 100 17 20 -83 -83% -80 -80% 10.85 10.33
A55 WB To A55 WB (off/on) 0 0 0 0 0 0% 0 0% 0.00 0.00
A55 WB To A5152 NB 0 0 0 0 0 0% 0 0% 0.00 0.00
A55 WB To A5152 SB 29 50 30 39 1 3% -11 -22% 0.18 1.65
A55 EB To A55 EB 197 358 207 374 10 5% 16 4% 0.70 0.84
A55 EB To A5152 16 21 17 21 1 6% 0 0% 0.25 0.00
A5152 To A55 WB 14 19 15 18 1 7% -1 -5% 0.26 0.23
A55 WB To A55 WB 157 272 152 280 -5 -3% 8 3% 0.40 0.48
A55 EB To A55 EB 197 358 206 371 9 5% 13 4% 0.63 0.68
A5152 To A55 EB 27 52 44 67 17 63% 15 29% 2.85 1.94
A55 WB To A55 WB 157 272 152 280 -5 -3% 8 3% 0.40 0.48
A55 WB To A5152 29 50 32 41 3 10% -9 -18% 0.54 1.33
A5 EB To A5 WB 0 0 0 0 0 0% 0 0% 0.00 0.00
A5 EB To B5420 WB 1 1 3 3 2 200% 2 200% 1.41 1.41

Wylfa Newydd Power Station App C2.04 - DCO TA Appendix I - VISSIM Model ResultsDevelopment Consent Order
Page 105
Location Observed Modelled Diff % Difference Diff % Difference GEH
Car Total Car Total Car Car Total Total Car Total
A5 EB To A5 EB 15 19 10 10 -5 -33% -9 -47% 1.41 2.36
A5 EB To B5420 EB 5 6 6 6 1 20% 0 0% 0.43 0.00
B5420 EB To A5 WB 1 6 5 5 4 400% -1 -17% 2.31 0.43
B5420 EB To B5420 WB 0 0 0 0 0 0% 0 0% 0.00 0.00
B5420 EB To A5 EB 50 60 67 73 17 34% 13 22% 2.22 1.59
B5420 EB To B5420 EB 6 9 7 7 1 17% -2 -22% 0.39 0.71
A5 WB To A5 WB 9 13 6 9 -3 -33% -4 -31% 1.10 1.21
A5 WB To B5420 WB 19 25 22 22 3 16% -3 -12% 0.66 0.62
A5 WB To A5 EB 0 0 0 0 0 0% 0 0% 0.00 0.00
A5 WB To B5420 EB 2 2 4 4 2 100% 2 100% 1.15 1.15
B5420 WB To A5 WB 13 15 13 13 0 0% -2 -13% 0.00 0.53
B5420 WB To B5420 WB 3 7 5 6 2 67% -1 -14% 1.00 0.39
B5420 WB To A5 EB 7 8 2 2 -5 -71% -6 -75% 2.36 2.68
B5420 WB To B5420 EB 0 0 0 0 0 0% 0 0% 0.00 0.00
A5 EB To A5 EB 53 60 62 66 9 17% 6 10% 1.19 0.76
A5 EB To A5 WB 0 0 0 0 0 0% 0 0% 0.00 0.00
A5 EB To A545 NB 3 3 7 7 4 133% 4 133% 1.79 1.79
A5 EB To New Street SB 0 0 0 0 0 0% 0 0% 0.00 0.00
A545 SB To A5 EB 42 45 38 40 -4 -10% -5 -11% 0.63 0.77
A545 SB To A5 WB 2 3 3 3 1 50% 0 0% 0.63 0.00
A545 SB To A545 NB 0 0 0 0 0 0% 0 0% 0.00 0.00
A545 SB To New Street SB 0 0 0 0 0 0% 0 0% 0.00 0.00
A5 WB To A5 EB 0 0 0 0 0 0% 0 0% 0.00 0.00
A5 WB To A5 WB 14 19 19 21 5 36% 2 11% 1.23 0.45
A5 WB To A545 NB 8 10 5 5 -3 -38% -5 -50% 1.18 1.83
A5 WB To New Street SB 0 0 0 0 0 0% 0 0% 0.00 0.00
New Street NB To A5 EB 0 0 0 0 0 0% 0 0% 0.00 0.00
New Street NB To A5 WB 0 0 0 0 0 0% 0 0% 0.00 0.00
New Street NB To A545 NB 0 0 0 0 0 0% 0 0% 0.00 0.00
New Street NB To New Street SB 0 0 0 0 0 0% 0 0% 0.00 0.00
A487 NB To A487 SB 0 0 0 0 0 0% 0 0% 0.00 0.00

Wylfa Newydd Power Station App C2.04 - DCO TA Appendix I - VISSIM Model ResultsDevelopment Consent Order
Page 106
Location Observed Modelled Diff % Difference Diff % Difference GEH
Car Total Car Total Car Car Total Total Car Total
A487 NB To A5 EB 8 12 7 8 -1 -13% -4 -33% 0.37 1.26
A487 NB To A5 WB 12 14 14 15 2 17% 1 7% 0.55 0.26
A487 NB To No name NB 0 0 0 0 0 0% 0 0% 0.00 0.00
A5 EB To A487 SB 56 61 58 64 2 4% 3 5% 0.26 0.38
A5 EB To A5 EB 42 46 41 41 -1 -2% -5 -11% 0.16 0.76
A5 EB To A5 WB 0 0 0 0 0 0% 0 0% 0.00 0.00
A5 EB To No name NB 0 0 0 0 0 0% 0 0% 0.00 0.00
A5 WB To A487 SB 7 10 2 3 -5 -71% -7 -70% 2.36 2.75
A5 WB To A5 EB 0 0 0 0 0 0% 0 0% 0.00 0.00
A5 WB To A5 WB 9 17 10 11 1 11% -6 -35% 0.32 1.60
A5 WB To No name NB 0 0 0 0 0 0% 0 0% 0.00 0.00
No name SB To A487 SB 0 0 0 0 0 0% 0 0% 0.00 0.00
No name SB To A5 EB 0 0 0 0 0 0% 0 0% 0.00 0.00
No name SB To A5 WB 0 0 0 0 0 0% 0 0% 0.00 0.00
No name SB To No name NB 0 0 0 0 0 0% 0 0% 0.00 0.00
A4087 WB To A487 NB 0 3 0 0 0 0% -3 -100% 0.00 2.45
A4087 WB To A487 SB 42 74 43 77 1 2% 3 4% 0.15 0.35
A4087 WB To B4547 WB 6 9 6 7 0 0% -2 -22% 0.00 0.71
A487 SB To A4087 EB 2 4 0 0 -2 -100% -4 -100% 2.00 2.83
A487 SB To A487 SB 93 132 81 108 -12 -13% -24 -18% 1.29 2.19
A487 SB To B4547 WB 10 19 6 10 -4 -40% -9 -47% 1.41 2.36
B4547 EB To A4087 EB 28 31 24 26 -4 -14% -5 -16% 0.78 0.94
B4547 EB To A487 NB 36 52 32 39 -4 -11% -13 -25% 0.69 1.93
B4547 EB To A487 SB 0 0 0 0 0 0% 0 0% 0.00 0.00
A487 NB To A4087 EB 34 38 30 30 -4 -12% -8 -21% 0.71 1.37
A487 NB To A487 NB 79 124 67 90 -12 -15% -34 -27% 1.40 3.29
A487 NB To B4547 WB 0 0 0 0 0 0% 0 0% 0.00 0.00
A5 WB To A5 WB 11 19 5 6 -6 -55% -13 -68% 2.12 3.68
A5 WB To A4081 5 8 7 9 2 40% 1 13% 0.82 0.34
A4080 To A5 WB 3 8 4 8 1 33% 0 0% 0.53 0.00
A4081 To A5 EB 24 27 23 25 -1 -4% -2 -7% 0.21 0.39

Wylfa Newydd Power Station App C2.04 - DCO TA Appendix I - VISSIM Model ResultsDevelopment Consent Order
Page 107
Location Observed Modelled Diff % Difference Diff % Difference GEH
Car Total Car Total Car Car Total Total Car Total
A5 EB To A4080 3 5 0 0 -3 -100% -5 -100% 2.45 3.16
A5 EB To A5 EB 29 39 17 21 -12 -41% -18 -46% 2.50 3.29
Lon Graig SB To A5 WB 0 2 4 5 4 0% 3 150% 2.83 1.60
Lon Graig SB To A5 EB 0 0 0 0 0 0% 0 0% 0.00 0.00
A5 WB To Lon Graig NB 0 0 0 0 0 0% 0 0% 0.00 0.00
A5 WB To A5 WB 16 25 7 8 -9 -56% -17 -68% 2.65 4.19
A5 EB To Lon Graig NB 2 3 7 8 5 250% 5 167% 2.36 2.13
A5 EB To A5 EB 51 63 32 39 -19 -37% -24 -38% 2.95 3.36
A5 EB To A5 EB 8 9 0 0 -8 -100% -9 -100% 4.00 4.24
A5 EB To A5 WB 0 0 0 0 0 0% 0 0% 0.00 0.00
A5 EB To A5152 NB 32 55 41 62 9 28% 7 13% 1.49 0.92
A5 WB To A5 EB 0 0 0 0 0 0% 0 0% 0.00 0.00
A5 WB To A5 WB 16 19 9 10 -7 -44% -9 -47% 1.98 2.36
A5 WB To A5152 NB 11 18 10 14 -1 -9% -4 -22% 0.31 1.00
A5152 SB To A5 EB 12 15 3 3 -9 -75% -12 -80% 3.29 4.00
A5152 SB To A5 WB 33 55 41 62 8 24% 7 13% 1.32 0.92
A5152 SB To A5152 NB 0 0 0 0 0 0% 0 0% 0.00 0.00
A55 EB To A55 EB 233 441 216 439 -17 -7% -2 0% 1.13 0.10
A55 WB To A55 WB 112 258 108 239 -4 -4% -19 -7% 0.38 1.21
A5 EB To A55 EB 41 56 35 48 -6 -15% -8 -14% 1.00 1.11
100% 100% 100% 100%
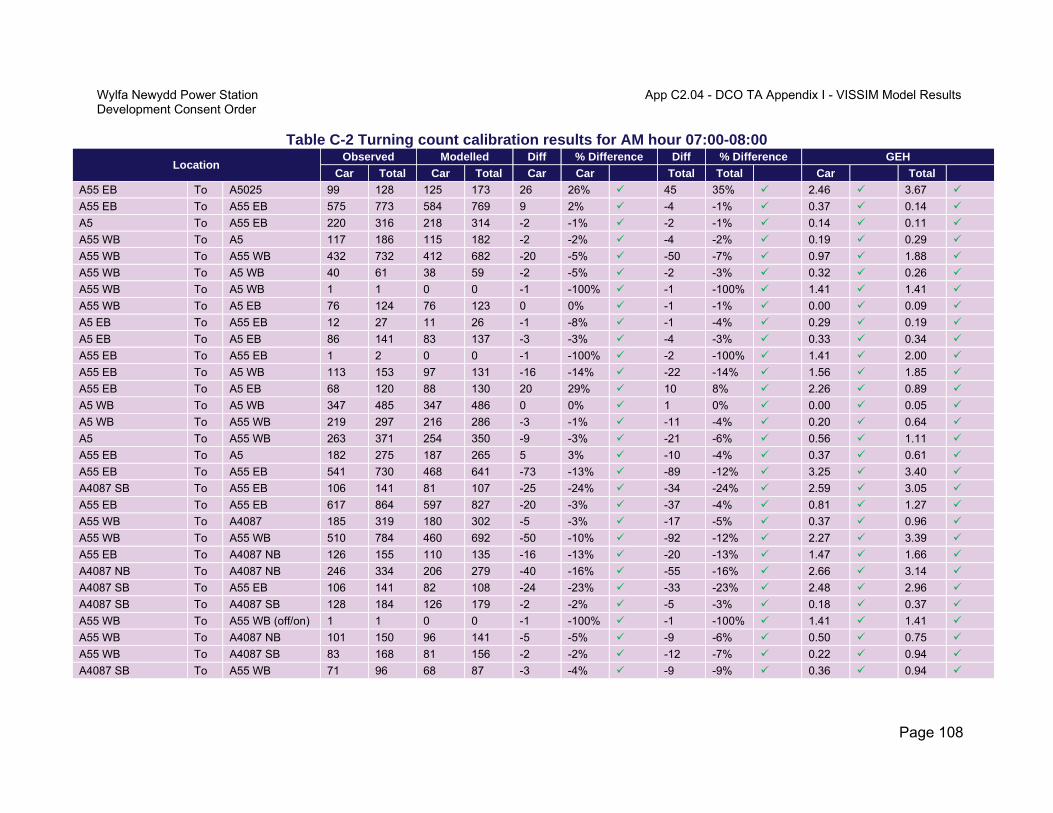
Wylfa Newydd Power Station App C2.04 - DCO TA Appendix I - VISSIM Model ResultsDevelopment Consent Order
Page 108
Table C-2 Turning count calibration results for AM hour 07:00-08:00
Location Observed Modelled Diff % Difference Diff % Difference GEH
Car Total Car Total Car Car Total Total Car Total
A55 EB To A5025 99 128 125 173 26 26% 45 35% 2.46 3.67
A55 EB To A55 EB 575 773 584 769 9 2% -4 -1% 0.37 0.14
A5 To A55 EB 220 316 218 314 -2 -1% -2 -1% 0.14 0.11
A55 WB To A5 117 186 115 182 -2 -2% -4 -2% 0.19 0.29
A55 WB To A55 WB 432 732 412 682 -20 -5% -50 -7% 0.97 1.88
A55 WB To A5 WB 40 61 38 59 -2 -5% -2 -3% 0.32 0.26
A55 WB To A5 WB 1 1 0 0 -1 -100% -1 -100% 1.41 1.41
A55 WB To A5 EB 76 124 76 123 0 0% -1 -1% 0.00 0.09
A5 EB To A55 EB 12 27 11 26 -1 -8% -1 -4% 0.29 0.19
A5 EB To A5 EB 86 141 83 137 -3 -3% -4 -3% 0.33 0.34
A55 EB To A55 EB 1 2 0 0 -1 -100% -2 -100% 1.41 2.00
A55 EB To A5 WB 113 153 97 131 -16 -14% -22 -14% 1.56 1.85
A55 EB To A5 EB 68 120 88 130 20 29% 10 8% 2.26 0.89
A5 WB To A5 WB 347 485 347 486 0 0% 1 0% 0.00 0.05
A5 WB To A55 WB 219 297 216 286 -3 -1% -11 -4% 0.20 0.64
A5 To A55 WB 263 371 254 350 -9 -3% -21 -6% 0.56 1.11
A55 EB To A5 182 275 187 265 5 3% -10 -4% 0.37 0.61
A55 EB To A55 EB 541 730 468 641 -73 -13% -89 -12% 3.25 3.40
A4087 SB To A55 EB 106 141 81 107 -25 -24% -34 -24% 2.59 3.05
A55 EB To A55 EB 617 864 597 827 -20 -3% -37 -4% 0.81 1.27
A55 WB To A4087 185 319 180 302 -5 -3% -17 -5% 0.37 0.96
A55 WB To A55 WB 510 784 460 692 -50 -10% -92 -12% 2.27 3.39
A55 EB To A4087 NB 126 155 110 135 -16 -13% -20 -13% 1.47 1.66
A4087 NB To A4087 NB 246 334 206 279 -40 -16% -55 -16% 2.66 3.14
A4087 SB To A55 EB 106 141 82 108 -24 -23% -33 -23% 2.48 2.96
A4087 SB To A4087 SB 128 184 126 179 -2 -2% -5 -3% 0.18 0.37
A55 WB To A55 WB (off/on) 1 1 0 0 -1 -100% -1 -100% 1.41 1.41
A55 WB To A4087 NB 101 150 96 141 -5 -5% -9 -6% 0.50 0.75
A55 WB To A4087 SB 83 168 81 156 -2 -2% -12 -7% 0.22 0.94
A4087 SB To A55 WB 71 96 68 87 -3 -4% -9 -9% 0.36 0.94
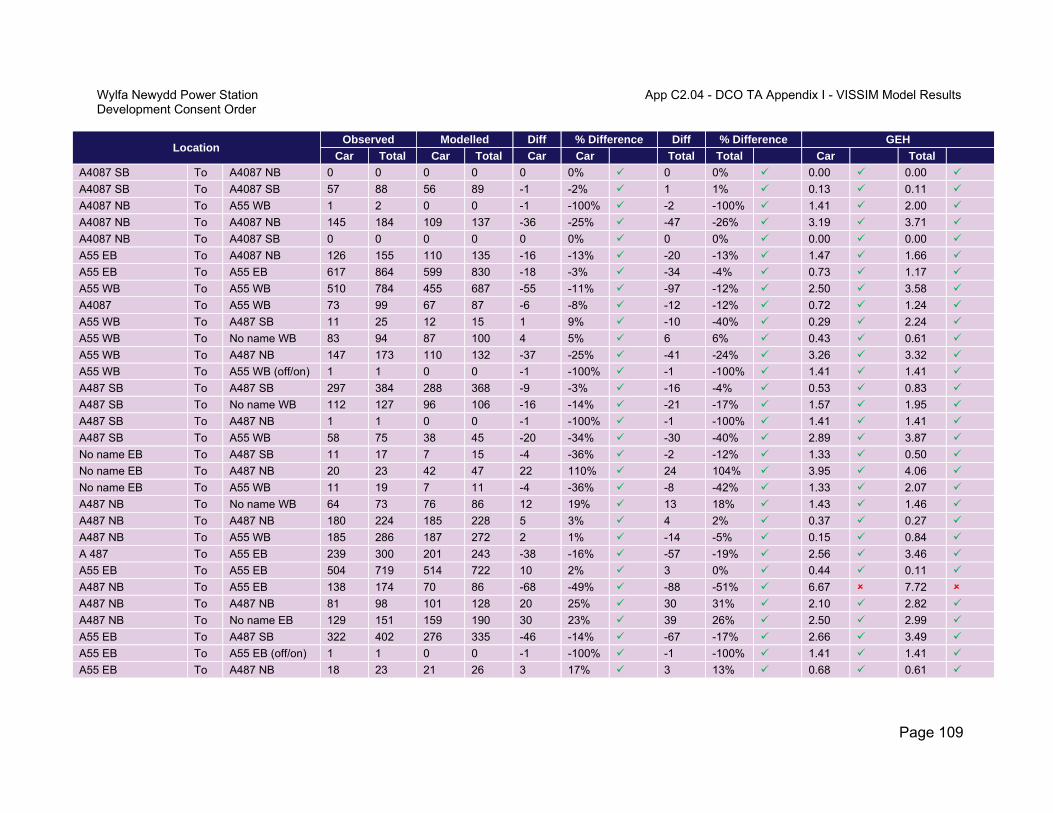
Wylfa Newydd Power Station App C2.04 - DCO TA Appendix I - VISSIM Model ResultsDevelopment Consent Order
Page 109
Location Observed Modelled Diff % Difference Diff % Difference GEH
Car Total Car Total Car Car Total Total Car Total
A4087 SB To A4087 NB 0 0 0 0 0 0% 0 0% 0.00 0.00
A4087 SB To A4087 SB 57 88 56 89 -1 -2% 1 1% 0.13 0.11
A4087 NB To A55 WB 1 2 0 0 -1 -100% -2 -100% 1.41 2.00
A4087 NB To A4087 NB 145 184 109 137 -36 -25% -47 -26% 3.19 3.71
A4087 NB To A4087 SB 0 0 0 0 0 0% 0 0% 0.00 0.00
A55 EB To A4087 NB 126 155 110 135 -16 -13% -20 -13% 1.47 1.66
A55 EB To A55 EB 617 864 599 830 -18 -3% -34 -4% 0.73 1.17
A55 WB To A55 WB 510 784 455 687 -55 -11% -97 -12% 2.50 3.58
A4087 To A55 WB 73 99 67 87 -6 -8% -12 -12% 0.72 1.24
A55 WB To A487 SB 11 25 12 15 1 9% -10 -40% 0.29 2.24
A55 WB To No name WB 83 94 87 100 4 5% 6 6% 0.43 0.61
A55 WB To A487 NB 147 173 110 132 -37 -25% -41 -24% 3.26 3.32
A55 WB To A55 WB (off/on) 1 1 0 0 -1 -100% -1 -100% 1.41 1.41
A487 SB To A487 SB 297 384 288 368 -9 -3% -16 -4% 0.53 0.83
A487 SB To No name WB 112 127 96 106 -16 -14% -21 -17% 1.57 1.95
A487 SB To A487 NB 1 1 0 0 -1 -100% -1 -100% 1.41 1.41
A487 SB To A55 WB 58 75 38 45 -20 -34% -30 -40% 2.89 3.87
No name EB To A487 SB 11 17 7 15 -4 -36% -2 -12% 1.33 0.50
No name EB To A487 NB 20 23 42 47 22 110% 24 104% 3.95 4.06
No name EB To A55 WB 11 19 7 11 -4 -36% -8 -42% 1.33 2.07
A487 NB To No name WB 64 73 76 86 12 19% 13 18% 1.43 1.46
A487 NB To A487 NB 180 224 185 228 5 3% 4 2% 0.37 0.27
A487 NB To A55 WB 185 286 187 272 2 1% -14 -5% 0.15 0.84
A 487 To A55 EB 239 300 201 243 -38 -16% -57 -19% 2.56 3.46
A55 EB To A55 EB 504 719 514 722 10 2% 3 0% 0.44 0.11
A487 NB To A55 EB 138 174 70 86 -68 -49% -88 -51% 6.67 7.72
A487 NB To A487 NB 81 98 101 128 20 25% 30 31% 2.10 2.82
A487 NB To No name EB 129 151 159 190 30 23% 39 26% 2.50 2.99
A55 EB To A487 SB 322 402 276 335 -46 -14% -67 -17% 2.66 3.49
A55 EB To A55 EB (off/on) 1 1 0 0 -1 -100% -1 -100% 1.41 1.41
A55 EB To A487 NB 18 23 21 26 3 17% 3 13% 0.68 0.61

Wylfa Newydd Power Station App C2.04 - DCO TA Appendix I - VISSIM Model ResultsDevelopment Consent Order
Page 110
Location Observed Modelled Diff % Difference Diff % Difference GEH
Car Total Car Total Car Car Total Total Car Total
A55 EB To No name EB 200 208 159 164 -41 -21% -44 -21% 3.06 3.23
A487 SB To A487 SB 74 94 84 105 10 14% 11 12% 1.13 1.10
A487 SB To A55 EB 38 50 46 56 8 21% 6 12% 1.23 0.82
A487 SB To A487 NB 0 0 0 0 0 0% 0 0% 0.00 0.00
A487 SB To No name EB 11 14 11 13 0 0% -1 -7% 0.00 0.27
No name WB To A487 SB 71 86 67 82 -4 -6% -4 -5% 0.48 0.44
No name WB To A55 EB 62 75 84 102 22 35% 27 36% 2.57 2.87
No name WB To A487 NB 16 24 17 24 1 6% 0 0% 0.25 0.00
A55 WB To A55 WB 341 590 308 517 -33 -10% -73 -12% 1.83 3.10
A487 To A55 WB 255 381 230 327 -25 -10% -54 -14% 1.61 2.87
A55 EB To A487 541 634 460 530 -81 -15% -104 -16% 3.62 4.31
A55 EB To A55 EB 504 719 516 723 12 2% 4 1% 0.53 0.15
A55 WB To A5 EB 33 52 40 59 7 21% 7 13% 1.16 0.94
A55 WB To A5 WB 48 77 20 24 -28 -58% -53 -69% 4.80 7.46
A5 WB To A55 EB 34 56 22 34 -12 -35% -22 -39% 2.27 3.28
A5 WB To A5 WB 32 37 21 23 -11 -34% -14 -38% 2.14 2.56
A5 EB To A55 EB 53 63 38 38 -15 -28% -25 -40% 2.22 3.52
A55 WB To A5 81 129 59 82 -22 -27% -47 -36% 2.63 4.58
A55 WB To A55 WB 514 841 465 741 -49 -10% -100 -12% 2.21 3.56
A55 WB To A5025 95 159 36 50 -59 -62% -109 -69% 7.29 10.66
A55 WB To A55 WB 419 682 427 689 8 2% 7 1% 0.39 0.27
A55 WB To A5025 NB 85 148 34 48 -51 -60% -100 -68% 6.61 10.10
A55 WB To A5025 SB 9 10 2 2 -7 -78% -8 -80% 2.98 3.27
A55 WB To A55 WB (off/on) 0 0 0 0 0 0% 0 0% 0.00 0.00
A5025 NB To A5025 NB 104 122 45 59 -59 -57% -63 -52% 6.84 6.62
A5025 NB To A55 WB 35 39 0 0 -35 -100% -39 -100% 8.37 8.83
A5025 SB To A5025 SB 24 24 29 44 5 21% 20 83% 0.97 3.43
A5025 SB To A55 EB 218 268 240 289 22 10% 21 8% 1.45 1.26
A5025 SB To A55 WB 70 94 92 116 22 31% 22 23% 2.44 2.15
A55 EB To A5025 NB 85 113 110 143 25 29% 30 27% 2.53 2.65
A55 EB To A5025 SB 13 14 15 30 2 15% 16 114% 0.53 3.41
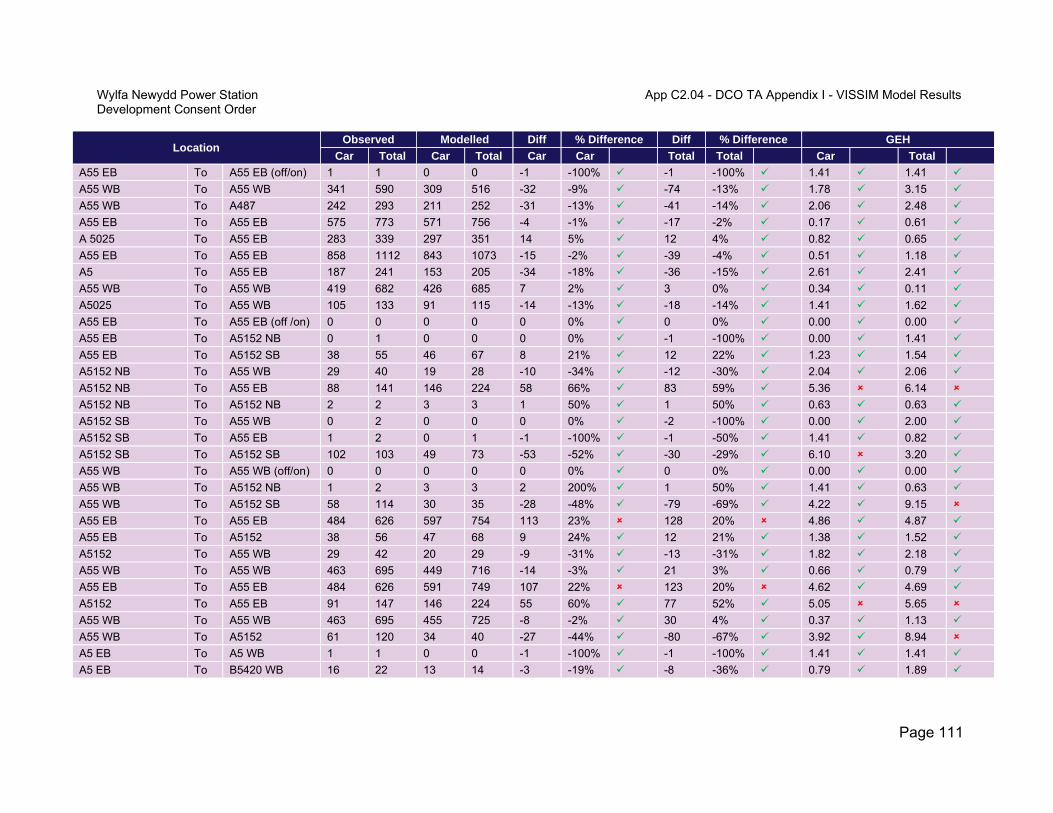
Wylfa Newydd Power Station App C2.04 - DCO TA Appendix I - VISSIM Model ResultsDevelopment Consent Order
Page 111
Location Observed Modelled Diff % Difference Diff % Difference GEH
Car Total Car Total Car Car Total Total Car Total
A55 EB To A55 EB (off/on) 1 1 0 0 -1 -100% -1 -100% 1.41 1.41
A55 WB To A55 WB 341 590 309 516 -32 -9% -74 -13% 1.78 3.15
A55 WB To A487 242 293 211 252 -31 -13% -41 -14% 2.06 2.48
A55 EB To A55 EB 575 773 571 756 -4 -1% -17 -2% 0.17 0.61
A 5025 To A55 EB 283 339 297 351 14 5% 12 4% 0.82 0.65
A55 EB To A55 EB 858 1112 843 1073 -15 -2% -39 -4% 0.51 1.18
A5 To A55 EB 187 241 153 205 -34 -18% -36 -15% 2.61 2.41
A55 WB To A55 WB 419 682 426 685 7 2% 3 0% 0.34 0.11
A5025 To A55 WB 105 133 91 115 -14 -13% -18 -14% 1.41 1.62
A55 EB To A55 EB (off /on) 0 0 0 0 0 0% 0 0% 0.00 0.00
A55 EB To A5152 NB 0 1 0 0 0 0% -1 -100% 0.00 1.41
A55 EB To A5152 SB 38 55 46 67 8 21% 12 22% 1.23 1.54
A5152 NB To A55 WB 29 40 19 28 -10 -34% -12 -30% 2.04 2.06
A5152 NB To A55 EB 88 141 146 224 58 66% 83 59% 5.36 6.14
A5152 NB To A5152 NB 2 2 3 3 1 50% 1 50% 0.63 0.63
A5152 SB To A55 WB 0 2 0 0 0 0% -2 -100% 0.00 2.00
A5152 SB To A55 EB 1 2 0 1 -1 -100% -1 -50% 1.41 0.82
A5152 SB To A5152 SB 102 103 49 73 -53 -52% -30 -29% 6.10 3.20
A55 WB To A55 WB (off/on) 0 0 0 0 0 0% 0 0% 0.00 0.00
A55 WB To A5152 NB 1 2 3 3 2 200% 1 50% 1.41 0.63
A55 WB To A5152 SB 58 114 30 35 -28 -48% -79 -69% 4.22 9.15
A55 EB To A55 EB 484 626 597 754 113 23% 128 20% 4.86 4.87
A55 EB To A5152 38 56 47 68 9 24% 12 21% 1.38 1.52
A5152 To A55 WB 29 42 20 29 -9 -31% -13 -31% 1.82 2.18
A55 WB To A55 WB 463 695 449 716 -14 -3% 21 3% 0.66 0.79
A55 EB To A55 EB 484 626 591 749 107 22% 123 20% 4.62 4.69
A5152 To A55 EB 91 147 146 224 55 60% 77 52% 5.05 5.65
A55 WB To A55 WB 463 695 455 725 -8 -2% 30 4% 0.37 1.13
A55 WB To A5152 61 120 34 40 -27 -44% -80 -67% 3.92 8.94
A5 EB To A5 WB 1 1 0 0 -1 -100% -1 -100% 1.41 1.41
A5 EB To B5420 WB 16 22 13 14 -3 -19% -8 -36% 0.79 1.89
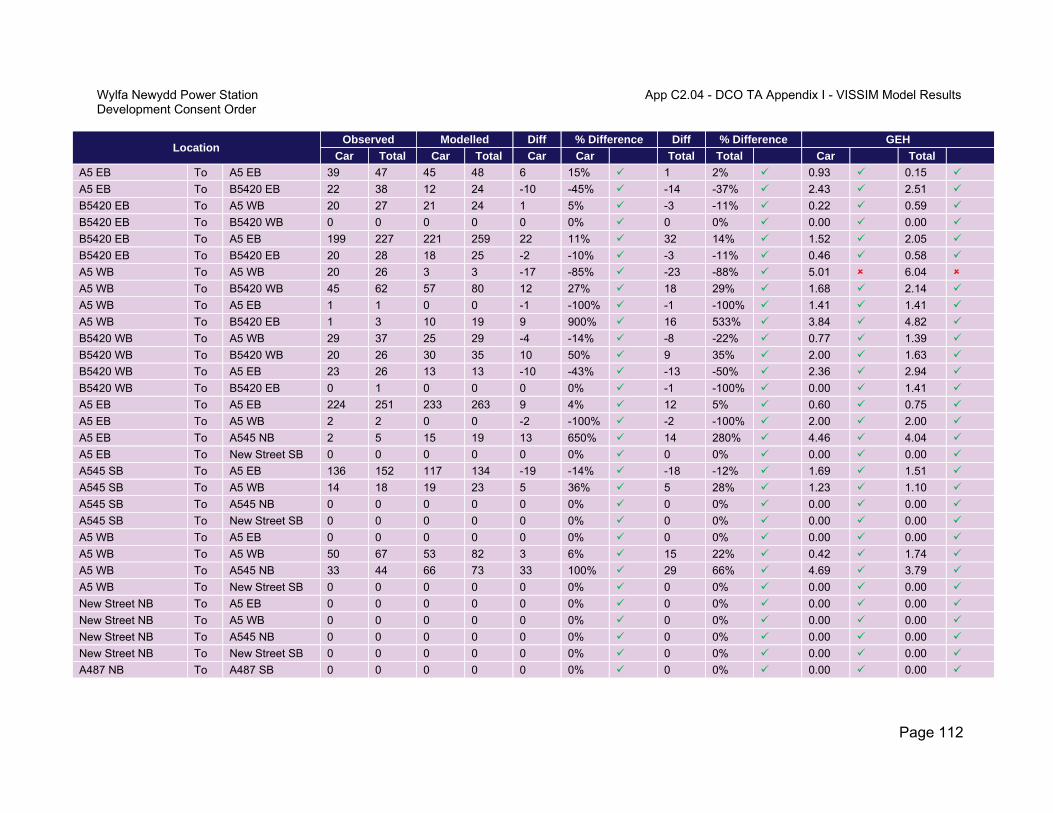
Wylfa Newydd Power Station App C2.04 - DCO TA Appendix I - VISSIM Model ResultsDevelopment Consent Order
Page 112
Location Observed Modelled Diff % Difference Diff % Difference GEH
Car Total Car Total Car Car Total Total Car Total
A5 EB To A5 EB 39 47 45 48 6 15% 1 2% 0.93 0.15
A5 EB To B5420 EB 22 38 12 24 -10 -45% -14 -37% 2.43 2.51
B5420 EB To A5 WB 20 27 21 24 1 5% -3 -11% 0.22 0.59
B5420 EB To B5420 WB 0 0 0 0 0 0% 0 0% 0.00 0.00
B5420 EB To A5 EB 199 227 221 259 22 11% 32 14% 1.52 2.05
B5420 EB To B5420 EB 20 28 18 25 -2 -10% -3 -11% 0.46 0.58
A5 WB To A5 WB 20 26 3 3 -17 -85% -23 -88% 5.01 6.04
A5 WB To B5420 WB 45 62 57 80 12 27% 18 29% 1.68 2.14
A5 WB To A5 EB 1 1 0 0 -1 -100% -1 -100% 1.41 1.41
A5 WB To B5420 EB 1 3 10 19 9 900% 16 533% 3.84 4.82
B5420 WB To A5 WB 29 37 25 29 -4 -14% -8 -22% 0.77 1.39
B5420 WB To B5420 WB 20 26 30 35 10 50% 9 35% 2.00 1.63
B5420 WB To A5 EB 23 26 13 13 -10 -43% -13 -50% 2.36 2.94
B5420 WB To B5420 EB 0 1 0 0 0 0% -1 -100% 0.00 1.41
A5 EB To A5 EB 224 251 233 263 9 4% 12 5% 0.60 0.75
A5 EB To A5 WB 2 2 0 0 -2 -100% -2 -100% 2.00 2.00
A5 EB To A545 NB 2 5 15 19 13 650% 14 280% 4.46 4.04
A5 EB To New Street SB 0 0 0 0 0 0% 0 0% 0.00 0.00
A545 SB To A5 EB 136 152 117 134 -19 -14% -18 -12% 1.69 1.51
A545 SB To A5 WB 14 18 19 23 5 36% 5 28% 1.23 1.10
A545 SB To A545 NB 0 0 0 0 0 0% 0 0% 0.00 0.00
A545 SB To New Street SB 0 0 0 0 0 0% 0 0% 0.00 0.00
A5 WB To A5 EB 0 0 0 0 0 0% 0 0% 0.00 0.00
A5 WB To A5 WB 50 67 53 82 3 6% 15 22% 0.42 1.74
A5 WB To A545 NB 33 44 66 73 33 100% 29 66% 4.69 3.79
A5 WB To New Street SB 0 0 0 0 0 0% 0 0% 0.00 0.00
New Street NB To A5 EB 0 0 0 0 0 0% 0 0% 0.00 0.00
New Street NB To A5 WB 0 0 0 0 0 0% 0 0% 0.00 0.00
New Street NB To A545 NB 0 0 0 0 0 0% 0 0% 0.00 0.00
New Street NB To New Street SB 0 0 0 0 0 0% 0 0% 0.00 0.00
A487 NB To A487 SB 0 0 0 0 0 0% 0 0% 0.00 0.00

Wylfa Newydd Power Station App C2.04 - DCO TA Appendix I - VISSIM Model ResultsDevelopment Consent Order
Page 113
Location Observed Modelled Diff % Difference Diff % Difference GEH
Car Total Car Total Car Car Total Total Car Total
A487 NB To A5 EB 65 78 60 74 -5 -8% -4 -5% 0.63 0.46
A487 NB To A5 WB 51 67 74 95 23 45% 28 42% 2.91 3.11
A487 NB To No name NB 0 0 0 0 0 0% 0 0% 0.00 0.00
A5 EB To A487 SB 214 238 196 221 -18 -8% -17 -7% 1.26 1.12
A5 EB To A5 EB 132 155 135 157 3 2% 2 1% 0.26 0.16
A5 EB To A5 WB 0 0 0 0 0 0% 0 0% 0.00 0.00
A5 EB To No name NB 1 1 0 0 -1 -100% -1 -100% 1.41 1.41
A5 WB To A487 SB 23 25 18 18 -5 -22% -7 -28% 1.10 1.51
A5 WB To A5 EB 0 0 0 0 0 0% 0 0% 0.00 0.00
A5 WB To A5 WB 47 60 58 72 11 23% 12 20% 1.52 1.48
A5 WB To No name NB 0 0 0 0 0 0% 0 0% 0.00 0.00
No name SB To A487 SB 0 0 0 0 0 0% 0 0% 0.00 0.00
No name SB To A5 EB 1 1 1 1 0 0% 0 0% 0.00 0.00
No name SB To A5 WB 0 0 0 0 0 0% 0 0% 0.00 0.00
No name SB To No name NB 0 0 0 0 0 0% 0 0% 0.00 0.00
A4087 WB To A487 NB 2 3 0 0 -2 -100% -3 -100% 2.00 2.45
A4087 WB To A487 SB 102 206 99 194 -3 -3% -12 -6% 0.30 0.85
A4087 WB To B4547 WB 26 33 26 31 0 0% -2 -6% 0.00 0.35
A487 SB To A4087 EB 3 5 0 0 -3 -100% -5 -100% 2.45 3.16
A487 SB To A487 SB 189 274 192 260 3 2% -14 -5% 0.22 0.86
A487 SB To B4547 WB 87 109 73 88 -14 -16% -21 -19% 1.57 2.12
B4547 EB To A4087 EB 50 67 39 50 -11 -22% -17 -25% 1.65 2.22
B4547 EB To A487 NB 247 296 194 231 -53 -21% -65 -22% 3.57 4.00
B4547 EB To A487 SB 0 0 0 0 0 0% 0 0% 0.00 0.00
A487 NB To A4087 EB 82 96 63 73 -19 -23% -23 -24% 2.23 2.50
A487 NB To A487 NB 327 454 259 360 -68 -21% -94 -21% 3.97 4.66
A487 NB To B4547 WB 1 1 0 0 -1 -100% -1 -100% 1.41 1.41
A5 WB To A5 WB 52 73 9 9 -43 -83% -64 -88% 7.79 10.00
A5 WB To A4081 40 60 45 47 5 13% -13 -22% 0.77 1.78
A4080 To A5 WB 13 15 13 16 0 0% 1 7% 0.00 0.25
A4081 To A5 EB 96 108 101 109 5 5% 1 1% 0.50 0.10

Wylfa Newydd Power Station App C2.04 - DCO TA Appendix I - VISSIM Model ResultsDevelopment Consent Order
Page 114
Location Observed Modelled Diff % Difference Diff % Difference GEH
Car Total Car Total Car Car Total Total Car Total
A5 EB To A4080 10 13 0 0 -10 -100% -13 -100% 4.47 5.10
A5 EB To A5 EB 131 178 112 124 -19 -15% -54 -30% 1.72 4.39
Lon Graig SB To A5 WB 19 21 22 24 3 16% 3 14% 0.66 0.63
Lon Graig SB To A5 EB 60 61 0 10 -60 -100% -51 -84% 10.95 8.56
A5 WB To Lon Graig NB 0 0 0 0 0 0% 0 0% 0.00 0.00
A5 WB To A5 WB 73 112 32 32 -41 -56% -80 -71% 5.66 9.43
A5 EB To Lon Graig NB 30 33 48 52 18 60% 19 58% 2.88 2.91
A5 EB To A5 EB 197 253 163 180 -34 -17% -73 -29% 2.53 4.96
A5 EB To A5 EB 46 71 0 0 -46 -100% -71 -100% 9.59 11.92
A5 EB To A5 WB 0 0 0 0 0 0% 0 0% 0.00 0.00
A5 EB To A5152 NB 101 156 158 240 57 56% 84 54% 5.01 5.97
A5 WB To A5 EB 0 0 0 0 0 0% 0 0% 0.00 0.00
A5 WB To A5 WB 33 51 8 9 -25 -76% -42 -82% 5.52 7.67
A5 WB To A5152 NB 21 28 10 12 -11 -52% -16 -57% 2.79 3.58
A5152 SB To A5 EB 29 44 0 0 -29 -100% -44 -100% 7.62 9.38
A5152 SB To A5 WB 65 123 66 92 1 2% -31 -25% 0.12 2.99
A5152 SB To A5152 NB 0 0 0 0 0 0% 0 0% 0.00 0.00
A55 EB To A55 EB 541 730 465 637 -76 -14% -93 -13% 3.39 3.56
A55 WB To A55 WB 432 732 408 676 -24 -6% -56 -8% 1.17 2.11
99% 98% 92% 91%

Wylfa Newydd Power Station App C2.04 - DCO TA Appendix I - VISSIM Model ResultsDevelopment Consent Order
Page 115
Table C-3 Turning count calibration results for AM hour 08:00-09:00
Location Observed Modelled Diff % Difference Diff % Difference GEH
Car Total Car Total Car Car Total Total Car Total
A55 EB To A5025 233 288 245 308 12 5% 20 7% 0.78 1.16
A55 EB To A55 EB 665 842 660 830 -5 -1% -12 -1% 0.19 0.42
A5 To A55 EB 299 382 298 379 -1 0% -3 -1% 0.06 0.15
A55 WB To A5 210 320 211 320 1 0% 0 0% 0.07 0.00
A55 WB To A55 WB 767 1,050 715 1,001 -52 -7% -49 -5% 1.91 1.53
A55 WB To A5 WB 74 125 75 124 1 1% -1 -1% 0.12 0.09
A55 WB To A5 WB 0 0 0 0 0 0% 0 0% 0.00 0.00
A55 WB To A5 EB 137 196 139 199 2 1% 3 2% 0.17 0.21
A5 EB To A55 EB 25 43 25 42 0 0% -1 -2% 0.00 0.15
A5 EB To A5 EB 188 274 190 276 2 1% 2 1% 0.15 0.12
A55 EB To A55 EB 0 0 0 0 0 0% 0 0% 0.00 0.00
A55 EB To A5 WB 102 155 109 160 7 7% 5 3% 0.68 0.40
A55 EB To A5 EB 147 199 148 202 1 1% 3 2% 0.08 0.21
A5 WB To A5 WB 604 733 603 730 -1 0% -3 0% 0.04 0.11
A5 WB To A55 WB 423 501 419 500 -4 -1% -1 0% 0.19 0.04
A5 To A55 WB 517 637 516 638 -1 0% 1 0% 0.04 0.04
A55 EB To A5 249 354 257 366 8 3% 12 3% 0.50 0.63
A55 EB To A55 EB 639 842 756 974 117 18% 132 16% 4.43 4.38
A4087 SB To A55 EB 160 227 126 181 -34 -21% -46 -20% 2.84 3.22
A55 EB To A55 EB 728 969 884 1150 156 21% 181 19% 5.49 5.56
A55 WB To A4087 448 597 444 592 -4 -1% -5 -1% 0.19 0.21
A55 WB To A55 WB 836 1,090 789 1,051 -47 -6% -39 -4% 1.65 1.19
A55 EB To A4087 NB 253 300 182 227 -71 -28% -73 -24% 4.81 4.50
A4087 NB To A4087 NB 657 768 591 689 -66 -10% -79 -10% 2.64 2.93
A4087 SB To A55 EB 160 227 125 182 -35 -22% -45 -20% 2.93 3.15
A4087 SB To A4087 SB 281 376 281 344 0 0% -32 -9% 0.00 1.69
A55 WB To A55 WB (off/on) 2 2 0 0 -2 -100% -2 -100% 2.00 2.00
A55 WB To A4087 NB 254 306 253 306 -1 0% 0 0% 0.06 0.00
A55 WB To A4087 SB 192 289 187 282 -5 -3% -7 -2% 0.36 0.41
A4087 SB To A55 WB 139 193 141 153 2 1% -40 -21% 0.17 3.04
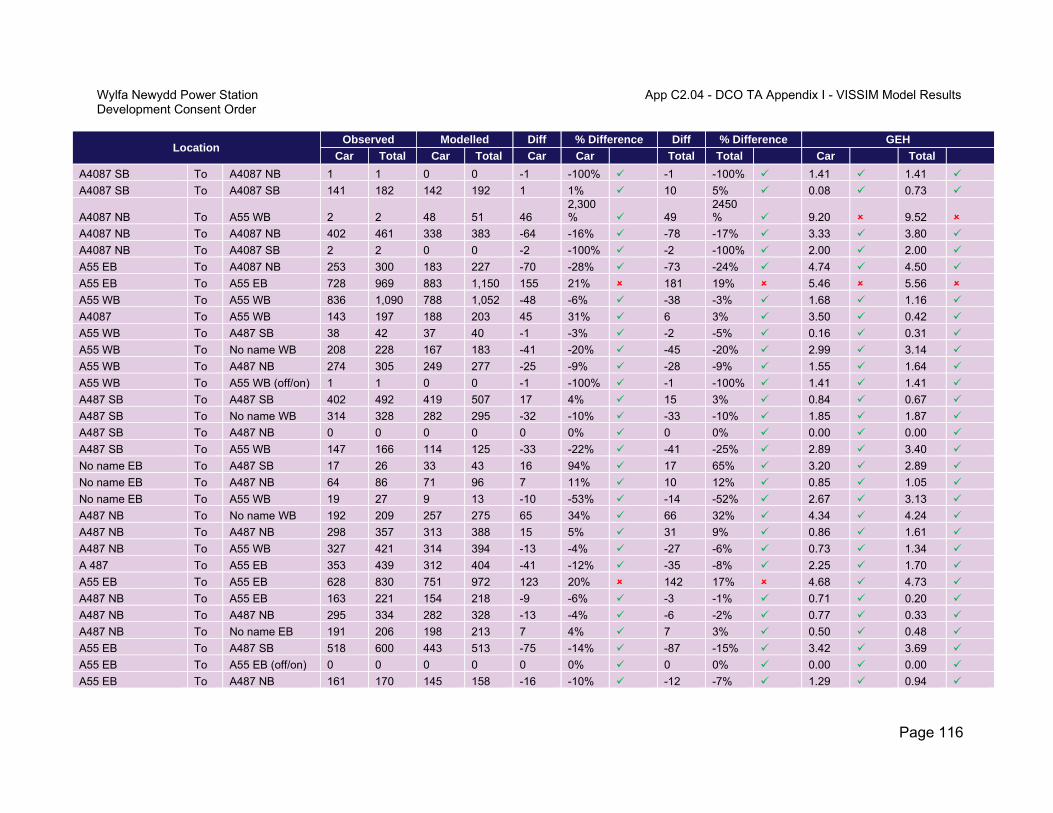
Wylfa Newydd Power Station App C2.04 - DCO TA Appendix I - VISSIM Model ResultsDevelopment Consent Order
Page 116
Location Observed Modelled Diff % Difference Diff % Difference GEH
Car Total Car Total Car Car Total Total Car Total
A4087 SB To A4087 NB 1 1 0 0 -1 -100% -1 -100% 1.41 1.41
A4087 SB To A4087 SB 141 182 142 192 1 1% 10 5% 0.08 0.73
A4087 NB To A55 WB 2 2 48 51 46 2,300% 49
2450% 9.20 9.52
A4087 NB To A4087 NB 402 461 338 383 -64 -16% -78 -17% 3.33 3.80
A4087 NB To A4087 SB 2 2 0 0 -2 -100% -2 -100% 2.00 2.00
A55 EB To A4087 NB 253 300 183 227 -70 -28% -73 -24% 4.74 4.50
A55 EB To A55 EB 728 969 883 1,150 155 21% 181 19% 5.46 5.56
A55 WB To A55 WB 836 1,090 788 1,052 -48 -6% -38 -3% 1.68 1.16
A4087 To A55 WB 143 197 188 203 45 31% 6 3% 3.50 0.42
A55 WB To A487 SB 38 42 37 40 -1 -3% -2 -5% 0.16 0.31
A55 WB To No name WB 208 228 167 183 -41 -20% -45 -20% 2.99 3.14
A55 WB To A487 NB 274 305 249 277 -25 -9% -28 -9% 1.55 1.64
A55 WB To A55 WB (off/on) 1 1 0 0 -1 -100% -1 -100% 1.41 1.41
A487 SB To A487 SB 402 492 419 507 17 4% 15 3% 0.84 0.67
A487 SB To No name WB 314 328 282 295 -32 -10% -33 -10% 1.85 1.87
A487 SB To A487 NB 0 0 0 0 0 0% 0 0% 0.00 0.00
A487 SB To A55 WB 147 166 114 125 -33 -22% -41 -25% 2.89 3.40
No name EB To A487 SB 17 26 33 43 16 94% 17 65% 3.20 2.89
No name EB To A487 NB 64 86 71 96 7 11% 10 12% 0.85 1.05
No name EB To A55 WB 19 27 9 13 -10 -53% -14 -52% 2.67 3.13
A487 NB To No name WB 192 209 257 275 65 34% 66 32% 4.34 4.24
A487 NB To A487 NB 298 357 313 388 15 5% 31 9% 0.86 1.61
A487 NB To A55 WB 327 421 314 394 -13 -4% -27 -6% 0.73 1.34
A 487 To A55 EB 353 439 312 404 -41 -12% -35 -8% 2.25 1.70
A55 EB To A55 EB 628 830 751 972 123 20% 142 17% 4.68 4.73
A487 NB To A55 EB 163 221 154 218 -9 -6% -3 -1% 0.71 0.20
A487 NB To A487 NB 295 334 282 328 -13 -4% -6 -2% 0.77 0.33
A487 NB To No name EB 191 206 198 213 7 4% 7 3% 0.50 0.48
A55 EB To A487 SB 518 600 443 513 -75 -14% -87 -15% 3.42 3.69
A55 EB To A55 EB (off/on) 0 0 0 0 0 0% 0 0% 0.00 0.00
A55 EB To A487 NB 161 170 145 158 -16 -10% -12 -7% 1.29 0.94

Wylfa Newydd Power Station App C2.04 - DCO TA Appendix I - VISSIM Model ResultsDevelopment Consent Order
Page 117
Location Observed Modelled Diff % Difference Diff % Difference GEH
Car Total Car Total Car Car Total Total Car Total
A55 EB To No name EB 199 206 140 147 -59 -30% -59 -29% 4.53 4.44
A487 SB To A487 SB 164 190 194 225 30 18% 35 18% 2.24 2.43
A487 SB To A55 EB 79 90 83 93 4 5% 3 3% 0.44 0.31
A487 SB To A487 NB 0 0 0 0 0 0% 0 0% 0.00 0.00
A487 SB To No name EB 11 12 17 17 6 55% 5 42% 1.60 1.31
No name WB To A487 SB 187 202 176 189 -11 -6% -13 -6% 0.82 0.93
No name WB To A55 EB 111 128 74 91 -37 -33% -37 -29% 3.85 3.54
No name WB To A487 NB 74 84 91 102 17 23% 18 21% 1.87 1.87
A55 WB To A55 WB 458 711 519 751 61 13% 40 6% 2.76 1.48
A487 To A55 WB 494 615 439 536 -55 -11% -79 -13% 2.55 3.29
A55 EB To A487 878 976 733 822 -145 -17% -154 -16% 5.11 5.14
A55 EB To A55 EB 628 830 749 969 121 19% 139 17% 4.61 4.63
A55 WB To A5 EB 78 113 117 153 39 50% 40 35% 3.95 3.47
A55 WB To A5 WB 102 147 53 82 -49 -48% -65 -44% 5.57 6.07
A5 WB To A55 EB 92 108 142 161 50 54% 53 49% 4.62 4.57
A5 WB To A5 WB 72 87 50 63 -22 -31% -24 -28% 2.82 2.77
A5 EB To A5 EB 198 230 226 243 28 14% 13 6% 1.92 0.85
A55 WB To A5 180 260 170 238 -10 -6% -22 -8% 0.76 1.39
A55 WB To A55 WB 771 1,065 787 1,054 16 2% -11 -1% 0.57 0.34
A55 WB To A5025 163 235 120 145 -43 -26% -90 -38% 3.61 6.53
A55 WB To A55 WB 608 830 669 912 61 10% 82 10% 2.41 2.78
A55 WB To A5025 NB 135 198 105 127 -30 -22% -71 -36% 2.74 5.57
A55 WB To A5025 SB 28 37 15 17 -13 -46% -20 -54% 2.80 3.85
A55 WB To A55 WB (off/on) 0 0 0 0 0 0% 0 0% 0.00 0.00
A5025 NB To A5025 NB 126 150 109 131 -17 -13% -19 -13% 1.57 1.60
A5025 NB To A55 WB 60 71 15 15 -45 -75% -56 -79% 7.35 8.54
A5025 SB To A5025 SB 132 142 95 115 -37 -28% -27 -19% 3.47 2.38
A5025 SB To A55 EB 220 262 163 216 -57 -26% -46 -18% 4.12 2.98
A5025 SB To A55 WB 136 180 138 174 2 1% -6 -3% 0.17 0.45
A55 EB To A5025 NB 188 232 176 225 -12 -6% -7 -3% 0.89 0.46
A55 EB To A5025 SB 43 52 70 85 27 63% 33 63% 3.59 3.99

Wylfa Newydd Power Station App C2.04 - DCO TA Appendix I - VISSIM Model ResultsDevelopment Consent Order
Page 118
Location Observed Modelled Diff % Difference Diff % Difference GEH
Car Total Car Total Car Car Total Total Car Total
A55 EB To A55 EB (off/on) 2 4 0 0 -2 -100% -4 -100% 2.00 2.83
A55 WB To A55 WB 458 711 519 751 61 13% 40 6% 2.76 1.48
A55 WB To A487 521 576 455 502 -66 -13% -74 -13% 2.99 3.19
A55 EB To A55 EB 665 842 673 843 8 1% 1 0% 0.31 0.03
A 5025 To A55 EB 259 307 245 307 -14 -5% 0 0% 0.88 0.00
A55 EB To A55 EB 924 1,149 927 1,162 3 0% 13 1% 0.10 0.38
A5 To A55 EB 582 657 569 642 -13 -2% -15 -2% 0.54 0.59
A55 WB To A55 WB 608 830 667 912 59 10% 82 10% 2.34 2.78
A5025 To A55 WB 196 251 151 187 -45 -23% -64 -25% 3.42 4.32
A55 EB To A55 EB (off/on) 2 2 0 0 -2 -100% -2 -100% 2.00 2.00
A55 EB To A5152 NB 2 3 2 5 0 0% 2 67% 0.00 1.00
A55 EB To A5152 SB 97 118 97 127 0 0% 9 8% 0.00 0.81
A5152 NB To A55 WB 70 79 46 54 -24 -34% -25 -32% 3.15 3.07
A5152 NB To A55 EB 83 137 232 323 149 180% 186 136% 11.87 12.26
A5152 NB To A5152 NB 3 3 1 1 -2 -67% -2 -67% 1.41 1.41
A5152 SB To A55 WB 0 1 0 0 0 0% -1 -100% 0.00 1.41
A5152 SB To A55 EB 6 9 7 7 1 17% -2 -22% 0.39 0.71
A5152 SB To A5152 SB 107 108 104 133 -3 -3% 25 23% 0.29 2.28
A55 WB To A55 WB (off/on) 0 1 0 0 0 0% -1 -100% 0.00 1.41
A55 WB To A5152 NB 0 1 1 1 1 0% 0 0% 1.41 0.00
A55 WB To A5152 SB 88 160 65 104 -23 -26% -56 -35% 2.63 4.87
A55 EB To A55 EB 574 693 651 788 77 13% 95 14% 3.11 3.49
A55 EB To A5152 101 123 100 132 -1 -1% 9 7% 0.10 0.80
A5152 To A55 WB 70 81 47 56 -23 -33% -25 -31% 3.01 3.02
A55 WB To A55 WB 716 918 712 950 -4 -1% 32 3% 0.15 1.05
A55 EB To A55 EB 574 693 653 791 79 14% 98 14% 3.19 3.60
A5152 To A55 EB 91 149 239 331 148 163% 182 122% 11.52 11.75
A55 WB To A55 WB 716 918 712 949 -4 -1% 31 3% 0.15 1.01
A55 WB To A5152 88 163 68 107 -20 -23% -56 -34% 2.26 4.82
A5 EB To A5 WB 1 2 0 0 -1 -100% -2 -100% 1.41 2.00
A5 EB To B5420 WB 78 90 117 120 39 50% 30 33% 3.95 2.93
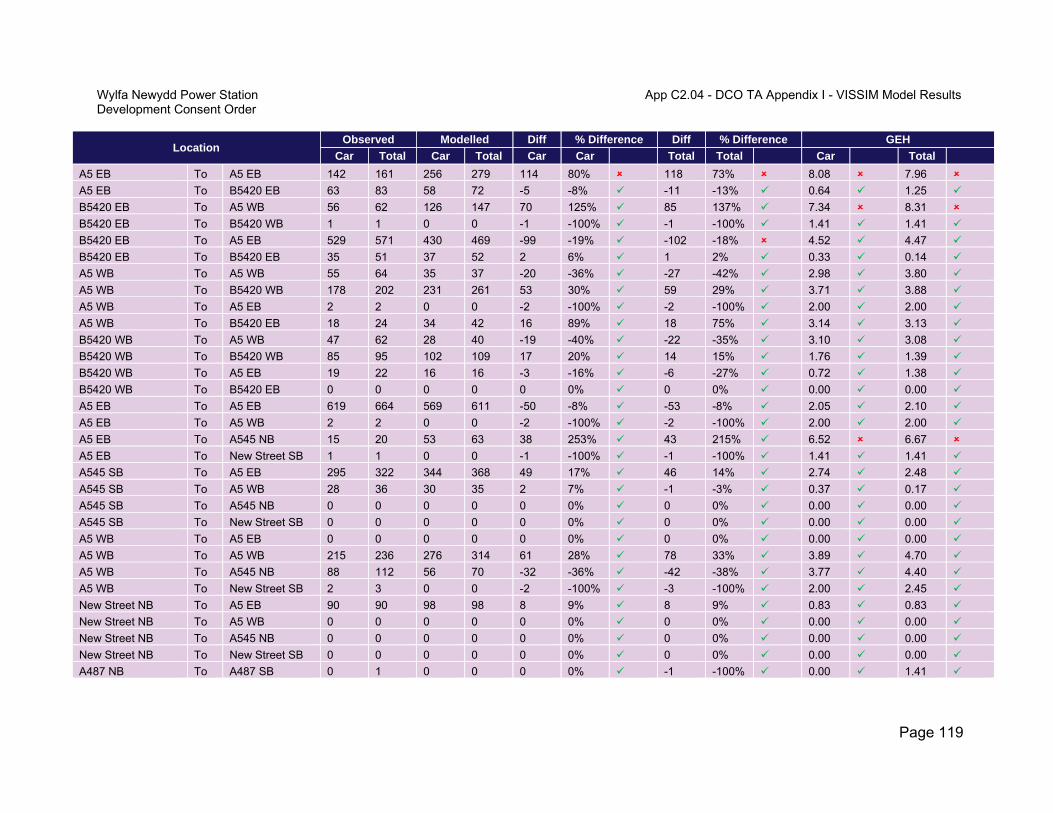
Wylfa Newydd Power Station App C2.04 - DCO TA Appendix I - VISSIM Model ResultsDevelopment Consent Order
Page 119
Location Observed Modelled Diff % Difference Diff % Difference GEH
Car Total Car Total Car Car Total Total Car Total
A5 EB To A5 EB 142 161 256 279 114 80% 118 73% 8.08 7.96
A5 EB To B5420 EB 63 83 58 72 -5 -8% -11 -13% 0.64 1.25
B5420 EB To A5 WB 56 62 126 147 70 125% 85 137% 7.34 8.31
B5420 EB To B5420 WB 1 1 0 0 -1 -100% -1 -100% 1.41 1.41
B5420 EB To A5 EB 529 571 430 469 -99 -19% -102 -18% 4.52 4.47
B5420 EB To B5420 EB 35 51 37 52 2 6% 1 2% 0.33 0.14
A5 WB To A5 WB 55 64 35 37 -20 -36% -27 -42% 2.98 3.80
A5 WB To B5420 WB 178 202 231 261 53 30% 59 29% 3.71 3.88
A5 WB To A5 EB 2 2 0 0 -2 -100% -2 -100% 2.00 2.00
A5 WB To B5420 EB 18 24 34 42 16 89% 18 75% 3.14 3.13
B5420 WB To A5 WB 47 62 28 40 -19 -40% -22 -35% 3.10 3.08
B5420 WB To B5420 WB 85 95 102 109 17 20% 14 15% 1.76 1.39
B5420 WB To A5 EB 19 22 16 16 -3 -16% -6 -27% 0.72 1.38
B5420 WB To B5420 EB 0 0 0 0 0 0% 0 0% 0.00 0.00
A5 EB To A5 EB 619 664 569 611 -50 -8% -53 -8% 2.05 2.10
A5 EB To A5 WB 2 2 0 0 -2 -100% -2 -100% 2.00 2.00
A5 EB To A545 NB 15 20 53 63 38 253% 43 215% 6.52 6.67
A5 EB To New Street SB 1 1 0 0 -1 -100% -1 -100% 1.41 1.41
A545 SB To A5 EB 295 322 344 368 49 17% 46 14% 2.74 2.48
A545 SB To A5 WB 28 36 30 35 2 7% -1 -3% 0.37 0.17
A545 SB To A545 NB 0 0 0 0 0 0% 0 0% 0.00 0.00
A545 SB To New Street SB 0 0 0 0 0 0% 0 0% 0.00 0.00
A5 WB To A5 EB 0 0 0 0 0 0% 0 0% 0.00 0.00
A5 WB To A5 WB 215 236 276 314 61 28% 78 33% 3.89 4.70
A5 WB To A545 NB 88 112 56 70 -32 -36% -42 -38% 3.77 4.40
A5 WB To New Street SB 2 3 0 0 -2 -100% -3 -100% 2.00 2.45
New Street NB To A5 EB 90 90 98 98 8 9% 8 9% 0.83 0.83
New Street NB To A5 WB 0 0 0 0 0 0% 0 0% 0.00 0.00
New Street NB To A545 NB 0 0 0 0 0 0% 0 0% 0.00 0.00
New Street NB To New Street SB 0 0 0 0 0 0% 0 0% 0.00 0.00
A487 NB To A487 SB 0 1 0 0 0 0% -1 -100% 0.00 1.41
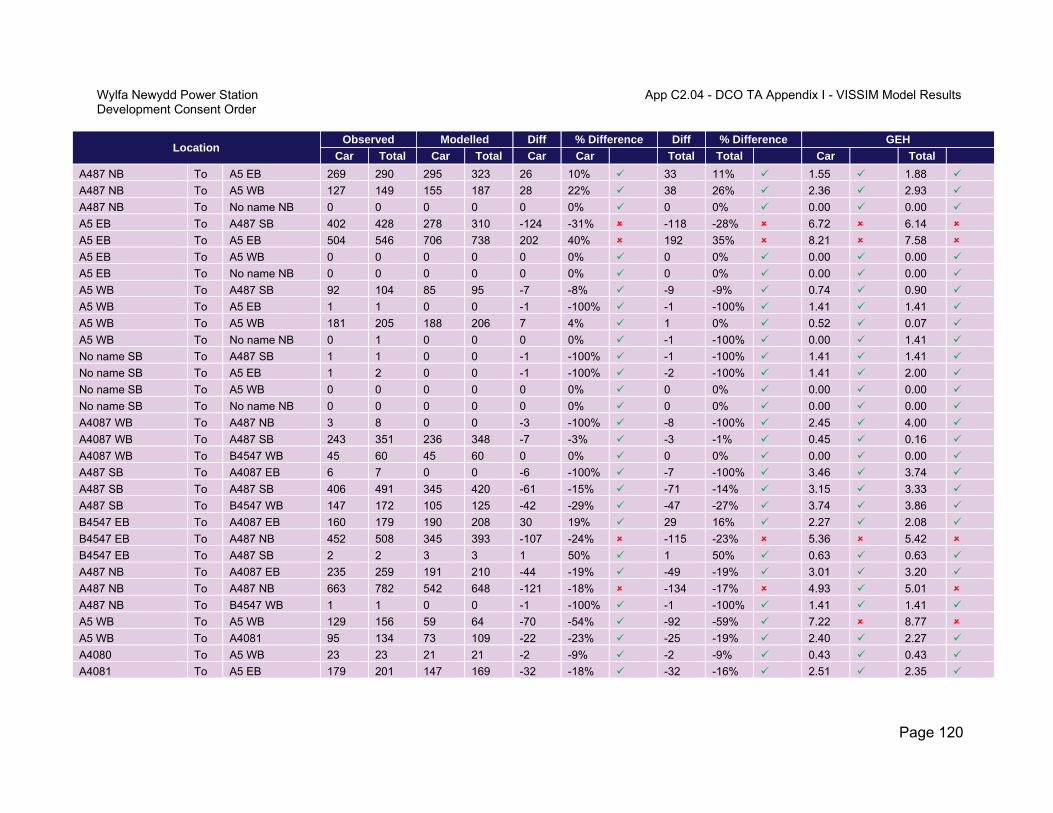
Wylfa Newydd Power Station App C2.04 - DCO TA Appendix I - VISSIM Model ResultsDevelopment Consent Order
Page 120
Location Observed Modelled Diff % Difference Diff % Difference GEH
Car Total Car Total Car Car Total Total Car Total
A487 NB To A5 EB 269 290 295 323 26 10% 33 11% 1.55 1.88
A487 NB To A5 WB 127 149 155 187 28 22% 38 26% 2.36 2.93
A487 NB To No name NB 0 0 0 0 0 0% 0 0% 0.00 0.00
A5 EB To A487 SB 402 428 278 310 -124 -31% -118 -28% 6.72 6.14
A5 EB To A5 EB 504 546 706 738 202 40% 192 35% 8.21 7.58
A5 EB To A5 WB 0 0 0 0 0 0% 0 0% 0.00 0.00
A5 EB To No name NB 0 0 0 0 0 0% 0 0% 0.00 0.00
A5 WB To A487 SB 92 104 85 95 -7 -8% -9 -9% 0.74 0.90
A5 WB To A5 EB 1 1 0 0 -1 -100% -1 -100% 1.41 1.41
A5 WB To A5 WB 181 205 188 206 7 4% 1 0% 0.52 0.07
A5 WB To No name NB 0 1 0 0 0 0% -1 -100% 0.00 1.41
No name SB To A487 SB 1 1 0 0 -1 -100% -1 -100% 1.41 1.41
No name SB To A5 EB 1 2 0 0 -1 -100% -2 -100% 1.41 2.00
No name SB To A5 WB 0 0 0 0 0 0% 0 0% 0.00 0.00
No name SB To No name NB 0 0 0 0 0 0% 0 0% 0.00 0.00
A4087 WB To A487 NB 3 8 0 0 -3 -100% -8 -100% 2.45 4.00
A4087 WB To A487 SB 243 351 236 348 -7 -3% -3 -1% 0.45 0.16
A4087 WB To B4547 WB 45 60 45 60 0 0% 0 0% 0.00 0.00
A487 SB To A4087 EB 6 7 0 0 -6 -100% -7 -100% 3.46 3.74
A487 SB To A487 SB 406 491 345 420 -61 -15% -71 -14% 3.15 3.33
A487 SB To B4547 WB 147 172 105 125 -42 -29% -47 -27% 3.74 3.86
B4547 EB To A4087 EB 160 179 190 208 30 19% 29 16% 2.27 2.08
B4547 EB To A487 NB 452 508 345 393 -107 -24% -115 -23% 5.36 5.42
B4547 EB To A487 SB 2 2 3 3 1 50% 1 50% 0.63 0.63
A487 NB To A4087 EB 235 259 191 210 -44 -19% -49 -19% 3.01 3.20
A487 NB To A487 NB 663 782 542 648 -121 -18% -134 -17% 4.93 5.01
A487 NB To B4547 WB 1 1 0 0 -1 -100% -1 -100% 1.41 1.41
A5 WB To A5 WB 129 156 59 64 -70 -54% -92 -59% 7.22 8.77
A5 WB To A4081 95 134 73 109 -22 -23% -25 -19% 2.40 2.27
A4080 To A5 WB 23 23 21 21 -2 -9% -2 -9% 0.43 0.43
A4081 To A5 EB 179 201 147 169 -32 -18% -32 -16% 2.51 2.35

Wylfa Newydd Power Station App C2.04 - DCO TA Appendix I - VISSIM Model ResultsDevelopment Consent Order
Page 121
Location Observed Modelled Diff % Difference Diff % Difference GEH
Car Total Car Total Car Car Total Total Car Total
A5 EB To A4080 9 11 0 0 -9 -100% -11 -100% 4.24 4.69
A5 EB To A5 EB 365 421 379 404 14 4% -17 -4% 0.73 0.84
Lon Graig SB To A5 WB 50 57 28 36 -22 -44% -21 -37% 3.52 3.08
Lon Graig SB To A5 EB 50 52 35 42 -15 -30% -10 -19% 2.30 1.46
A5 WB To Lon Graig NB 20 20 14 14 -6 -30% -6 -30% 1.46 1.46
A5 WB To A5 WB 174 233 104 138 -70 -40% -95 -41% 5.94 6.98
A5 EB To Lon Graig NB 39 52 54 60 15 38% 8 15% 2.20 1.07
A5 EB To A5 EB 505 570 474 513 -31 -6% -57 -10% 1.40 2.45
A5 EB To A5 EB 158 196 60 64 -98 -62% -132 -67% 9.39 11.58
A5 EB To A5 WB 0 1 0 0 0 0% -1 -100% 0.00 1.41
A5 EB To A5152 NB 109 166 193 278 84 77% 112 67% 6.84 7.52
A5 WB To A5 EB 0 0 0 0 0 0% 0 0% 0.00 0.00
A5 WB To A5 WB 55 77 49 55 -6 -11% -22 -29% 0.83 2.71
A5 WB To A5152 NB 48 52 18 18 -30 -63% -34 -65% 5.22 5.75
A5152 SB To A5 EB 85 100 63 72 -22 -26% -28 -28% 2.56 3.02
A5152 SB To A5 WB 112 188 149 241 37 33% 53 28% 3.24 3.62
A5152 SB To A5152 NB 0 1 0 0 0 0% -1 -100% 0.00 1.41
A55 EB To A55 EB 639 842 757 977 118 18% 135 16% 4.47 4.48
A55 WB To A55 WB 767 1,050 715 1,002 -52 -7% -48 -5% 1.91 1.50 93% 92% 91% 89%
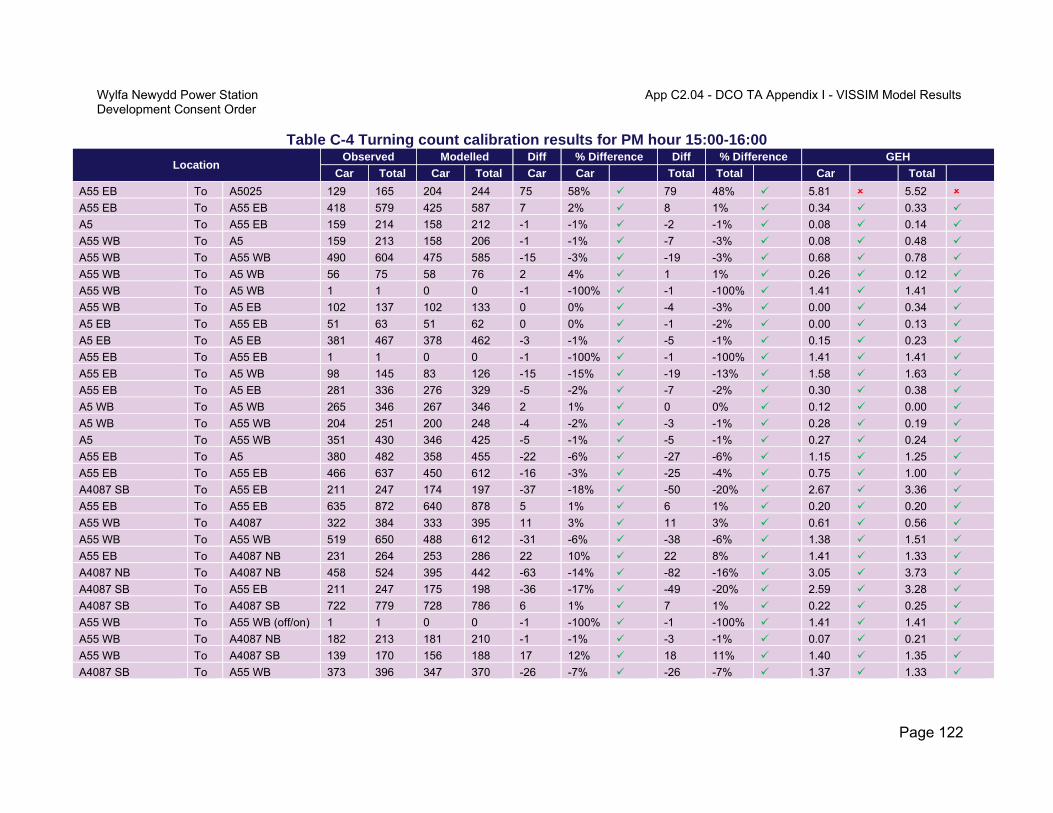
Wylfa Newydd Power Station App C2.04 - DCO TA Appendix I - VISSIM Model ResultsDevelopment Consent Order
Page 122
Table C-4 Turning count calibration results for PM hour 15:00-16:00
Location Observed Modelled Diff % Difference Diff % Difference GEH
Car Total Car Total Car Car Total Total Car Total
A55 EB To A5025 129 165 204 244 75 58% 79 48% 5.81 5.52
A55 EB To A55 EB 418 579 425 587 7 2% 8 1% 0.34 0.33
A5 To A55 EB 159 214 158 212 -1 -1% -2 -1% 0.08 0.14
A55 WB To A5 159 213 158 206 -1 -1% -7 -3% 0.08 0.48
A55 WB To A55 WB 490 604 475 585 -15 -3% -19 -3% 0.68 0.78
A55 WB To A5 WB 56 75 58 76 2 4% 1 1% 0.26 0.12
A55 WB To A5 WB 1 1 0 0 -1 -100% -1 -100% 1.41 1.41
A55 WB To A5 EB 102 137 102 133 0 0% -4 -3% 0.00 0.34
A5 EB To A55 EB 51 63 51 62 0 0% -1 -2% 0.00 0.13
A5 EB To A5 EB 381 467 378 462 -3 -1% -5 -1% 0.15 0.23
A55 EB To A55 EB 1 1 0 0 -1 -100% -1 -100% 1.41 1.41
A55 EB To A5 WB 98 145 83 126 -15 -15% -19 -13% 1.58 1.63
A55 EB To A5 EB 281 336 276 329 -5 -2% -7 -2% 0.30 0.38
A5 WB To A5 WB 265 346 267 346 2 1% 0 0% 0.12 0.00
A5 WB To A55 WB 204 251 200 248 -4 -2% -3 -1% 0.28 0.19
A5 To A55 WB 351 430 346 425 -5 -1% -5 -1% 0.27 0.24
A55 EB To A5 380 482 358 455 -22 -6% -27 -6% 1.15 1.25
A55 EB To A55 EB 466 637 450 612 -16 -3% -25 -4% 0.75 1.00
A4087 SB To A55 EB 211 247 174 197 -37 -18% -50 -20% 2.67 3.36
A55 EB To A55 EB 635 872 640 878 5 1% 6 1% 0.20 0.20
A55 WB To A4087 322 384 333 395 11 3% 11 3% 0.61 0.56
A55 WB To A55 WB 519 650 488 612 -31 -6% -38 -6% 1.38 1.51
A55 EB To A4087 NB 231 264 253 286 22 10% 22 8% 1.41 1.33
A4087 NB To A4087 NB 458 524 395 442 -63 -14% -82 -16% 3.05 3.73
A4087 SB To A55 EB 211 247 175 198 -36 -17% -49 -20% 2.59 3.28
A4087 SB To A4087 SB 722 779 728 786 6 1% 7 1% 0.22 0.25
A55 WB To A55 WB (off/on) 1 1 0 0 -1 -100% -1 -100% 1.41 1.41
A55 WB To A4087 NB 182 213 181 210 -1 -1% -3 -1% 0.07 0.21
A55 WB To A4087 SB 139 170 156 188 17 12% 18 11% 1.40 1.35
A4087 SB To A55 WB 373 396 347 370 -26 -7% -26 -7% 1.37 1.33

Wylfa Newydd Power Station App C2.04 - DCO TA Appendix I - VISSIM Model ResultsDevelopment Consent Order
Page 123
Location Observed Modelled Diff % Difference Diff % Difference GEH
Car Total Car Total Car Car Total Total Car Total
A4087 SB To A4087 NB 0 1 0 0 0 0% -1 -100% 0.00 1.41
A4087 SB To A4087 SB 349 382 380 414 31 9% 32 8% 1.62 1.60
A4087 NB To A55 WB 1 1 0 0 -1 -100% -1 -100% 1.41 1.41
A4087 NB To A4087 NB 276 311 213 230 -63 -23% -81 -26% 4.03 4.92
A4087 NB To A4087 SB 0 0 0 0 0 0% 0 0% 0.00 0.00
A55 EB To A4087 NB 231 264 251 285 20 9% 21 8% 1.29 1.27
A55 EB To A55 EB 635 872 642 880 7 1% 8 1% 0.28 0.27
A55 WB To A55 WB 519 650 490 614 -29 -6% -36 -6% 1.29 1.43
A4087 To A55 WB 375 398 347 369 -28 -7% -29 -7% 1.47 1.48
A55 WB To A487 SB 25 27 30 32 5 20% 5 19% 0.95 0.92
A55 WB To No name WB 35 46 41 52 6 17% 6 13% 0.97 0.86
A55 WB To A487 NB 177 189 95 104 -82 -46% -85 -45% 7.03 7.02
A55 WB To A55 WB (off/on) 0 1 0 0 0 0% -1 -100% 0.00 1.41
A487 SB To A487 SB 294 386 370 460 76 26% 74 19% 4.17 3.60
A487 SB To No name WB 59 69 57 63 -2 -3% -6 -9% 0.26 0.74
A487 SB To A487 NB 2 2 0 0 -2 -100% -2 -100% 2.00 2.00
A487 SB To A55 WB 211 236 176 195 -35 -17% -41 -17% 2.52 2.79
No name EB To A487 SB 67 77 83 92 16 24% 15 19% 1.85 1.63
No name EB To A487 NB 111 126 135 150 24 22% 24 19% 2.16 2.04
No name EB To A55 WB 56 63 35 39 -21 -38% -24 -38% 3.11 3.36
A487 NB To No name WB 18 26 23 34 5 28% 8 31% 1.10 1.46
A487 NB To A487 NB 196 273 283 383 87 44% 110 40% 5.62 6.07
A487 NB To A55 WB 229 289 246 307 17 7% 18 6% 1.10 1.04
A 487 To A55 EB 430 526 458 561 28 7% 35 7% 1.33 1.50
A55 EB To A55 EB 436 610 441 610 5 1% 0 0% 0.24 0.00
A487 NB To A55 EB 186 257 231 317 45 24% 60 23% 3.12 3.54
A487 NB To A487 NB 173 198 133 161 -40 -23% -37 -19% 3.23 2.76
A487 NB To No name EB 131 142 150 162 19 15% 20 14% 1.60 1.62
A55 EB To A487 SB 202 280 176 237 -26 -13% -43 -15% 1.89 2.67
A55 EB To A55 EB (off/on) 0 0 0 0 0 0% 0 0% 0.00 0.00
A55 EB To A487 NB 71 77 93 103 22 31% 26 34% 2.43 2.74
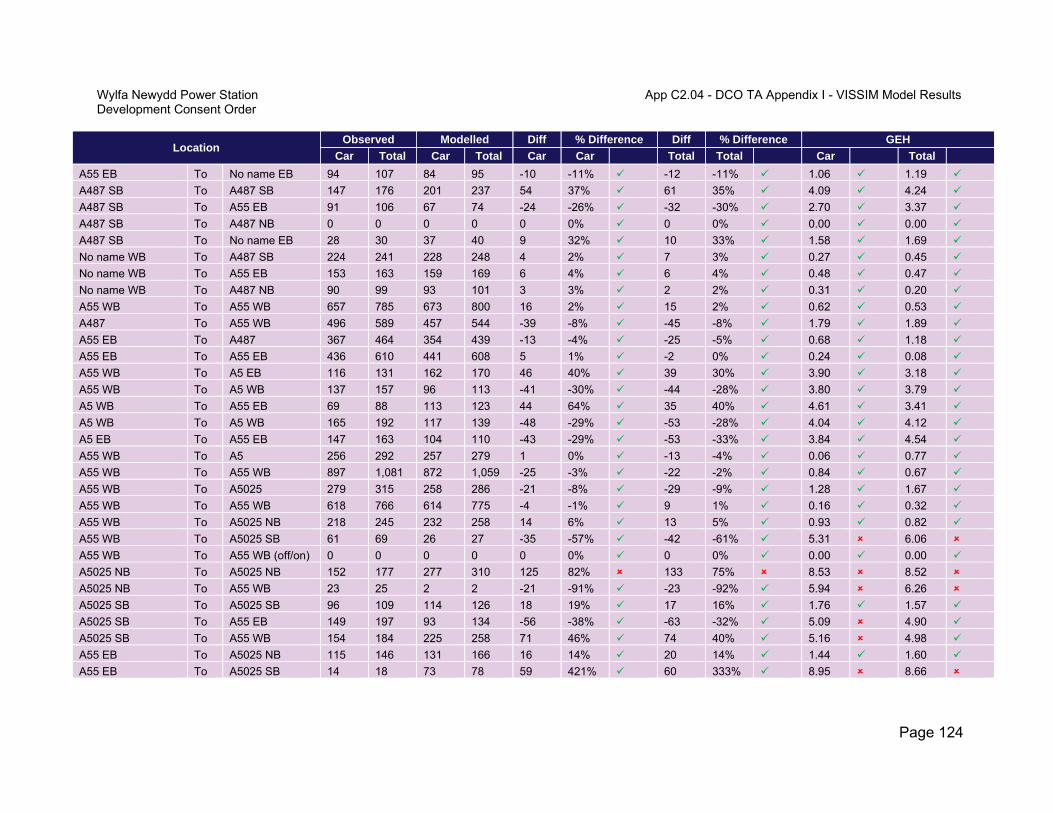
Wylfa Newydd Power Station App C2.04 - DCO TA Appendix I - VISSIM Model ResultsDevelopment Consent Order
Page 124
Location Observed Modelled Diff % Difference Diff % Difference GEH
Car Total Car Total Car Car Total Total Car Total
A55 EB To No name EB 94 107 84 95 -10 -11% -12 -11% 1.06 1.19
A487 SB To A487 SB 147 176 201 237 54 37% 61 35% 4.09 4.24
A487 SB To A55 EB 91 106 67 74 -24 -26% -32 -30% 2.70 3.37
A487 SB To A487 NB 0 0 0 0 0 0% 0 0% 0.00 0.00
A487 SB To No name EB 28 30 37 40 9 32% 10 33% 1.58 1.69
No name WB To A487 SB 224 241 228 248 4 2% 7 3% 0.27 0.45
No name WB To A55 EB 153 163 159 169 6 4% 6 4% 0.48 0.47
No name WB To A487 NB 90 99 93 101 3 3% 2 2% 0.31 0.20
A55 WB To A55 WB 657 785 673 800 16 2% 15 2% 0.62 0.53
A487 To A55 WB 496 589 457 544 -39 -8% -45 -8% 1.79 1.89
A55 EB To A487 367 464 354 439 -13 -4% -25 -5% 0.68 1.18
A55 EB To A55 EB 436 610 441 608 5 1% -2 0% 0.24 0.08
A55 WB To A5 EB 116 131 162 170 46 40% 39 30% 3.90 3.18
A55 WB To A5 WB 137 157 96 113 -41 -30% -44 -28% 3.80 3.79
A5 WB To A55 EB 69 88 113 123 44 64% 35 40% 4.61 3.41
A5 WB To A5 WB 165 192 117 139 -48 -29% -53 -28% 4.04 4.12
A5 EB To A55 EB 147 163 104 110 -43 -29% -53 -33% 3.84 4.54
A55 WB To A5 256 292 257 279 1 0% -13 -4% 0.06 0.77
A55 WB To A55 WB 897 1,081 872 1,059 -25 -3% -22 -2% 0.84 0.67
A55 WB To A5025 279 315 258 286 -21 -8% -29 -9% 1.28 1.67
A55 WB To A55 WB 618 766 614 775 -4 -1% 9 1% 0.16 0.32
A55 WB To A5025 NB 218 245 232 258 14 6% 13 5% 0.93 0.82
A55 WB To A5025 SB 61 69 26 27 -35 -57% -42 -61% 5.31 6.06
A55 WB To A55 WB (off/on) 0 0 0 0 0 0% 0 0% 0.00 0.00
A5025 NB To A5025 NB 152 177 277 310 125 82% 133 75% 8.53 8.52
A5025 NB To A55 WB 23 25 2 2 -21 -91% -23 -92% 5.94 6.26
A5025 SB To A5025 SB 96 109 114 126 18 19% 17 16% 1.76 1.57
A5025 SB To A55 EB 149 197 93 134 -56 -38% -63 -32% 5.09 4.90
A5025 SB To A55 WB 154 184 225 258 71 46% 74 40% 5.16 4.98
A55 EB To A5025 NB 115 146 131 166 16 14% 20 14% 1.44 1.60
A55 EB To A5025 SB 14 18 73 78 59 421% 60 333% 8.95 8.66
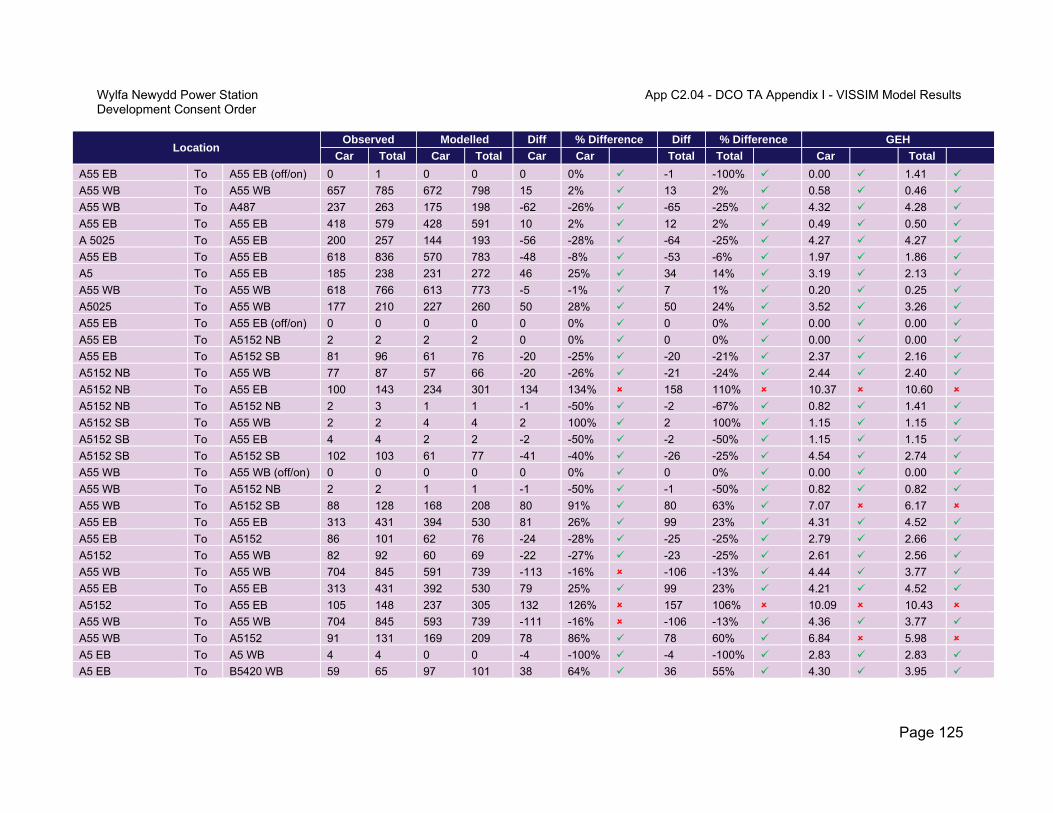
Wylfa Newydd Power Station App C2.04 - DCO TA Appendix I - VISSIM Model ResultsDevelopment Consent Order
Page 125
Location Observed Modelled Diff % Difference Diff % Difference GEH
Car Total Car Total Car Car Total Total Car Total
A55 EB To A55 EB (off/on) 0 1 0 0 0 0% -1 -100% 0.00 1.41
A55 WB To A55 WB 657 785 672 798 15 2% 13 2% 0.58 0.46
A55 WB To A487 237 263 175 198 -62 -26% -65 -25% 4.32 4.28
A55 EB To A55 EB 418 579 428 591 10 2% 12 2% 0.49 0.50
A 5025 To A55 EB 200 257 144 193 -56 -28% -64 -25% 4.27 4.27
A55 EB To A55 EB 618 836 570 783 -48 -8% -53 -6% 1.97 1.86
A5 To A55 EB 185 238 231 272 46 25% 34 14% 3.19 2.13
A55 WB To A55 WB 618 766 613 773 -5 -1% 7 1% 0.20 0.25
A5025 To A55 WB 177 210 227 260 50 28% 50 24% 3.52 3.26
A55 EB To A55 EB (off/on) 0 0 0 0 0 0% 0 0% 0.00 0.00
A55 EB To A5152 NB 2 2 2 2 0 0% 0 0% 0.00 0.00
A55 EB To A5152 SB 81 96 61 76 -20 -25% -20 -21% 2.37 2.16
A5152 NB To A55 WB 77 87 57 66 -20 -26% -21 -24% 2.44 2.40
A5152 NB To A55 EB 100 143 234 301 134 134% 158 110% 10.37 10.60
A5152 NB To A5152 NB 2 3 1 1 -1 -50% -2 -67% 0.82 1.41
A5152 SB To A55 WB 2 2 4 4 2 100% 2 100% 1.15 1.15
A5152 SB To A55 EB 4 4 2 2 -2 -50% -2 -50% 1.15 1.15
A5152 SB To A5152 SB 102 103 61 77 -41 -40% -26 -25% 4.54 2.74
A55 WB To A55 WB (off/on) 0 0 0 0 0 0% 0 0% 0.00 0.00
A55 WB To A5152 NB 2 2 1 1 -1 -50% -1 -50% 0.82 0.82
A55 WB To A5152 SB 88 128 168 208 80 91% 80 63% 7.07 6.17
A55 EB To A55 EB 313 431 394 530 81 26% 99 23% 4.31 4.52
A55 EB To A5152 86 101 62 76 -24 -28% -25 -25% 2.79 2.66
A5152 To A55 WB 82 92 60 69 -22 -27% -23 -25% 2.61 2.56
A55 WB To A55 WB 704 845 591 739 -113 -16% -106 -13% 4.44 3.77
A55 EB To A55 EB 313 431 392 530 79 25% 99 23% 4.21 4.52
A5152 To A55 EB 105 148 237 305 132 126% 157 106% 10.09 10.43
A55 WB To A55 WB 704 845 593 739 -111 -16% -106 -13% 4.36 3.77
A55 WB To A5152 91 131 169 209 78 86% 78 60% 6.84 5.98
A5 EB To A5 WB 4 4 0 0 -4 -100% -4 -100% 2.83 2.83
A5 EB To B5420 WB 59 65 97 101 38 64% 36 55% 4.30 3.95

Wylfa Newydd Power Station App C2.04 - DCO TA Appendix I - VISSIM Model ResultsDevelopment Consent Order
Page 126
Location Observed Modelled Diff % Difference Diff % Difference GEH
Car Total Car Total Car Car Total Total Car Total
A5 EB To A5 EB 117 126 43 48 -74 -63% -78 -62% 8.27 8.36
A5 EB To B5420 EB 108 118 77 77 -31 -29% -41 -35% 3.22 4.15
B5420 EB To A5 WB 49 56 124 130 75 153% 74 132% 8.06 7.67
B5420 EB To B5420 WB 2 2 0 0 -2 -100% -2 -100% 2.00 2.00
B5420 EB To A5 EB 257 287 280 312 23 9% 25 9% 1.40 1.44
B5420 EB To B5420 EB 56 67 96 114 40 71% 47 70% 4.59 4.94
A5 WB To A5 WB 171 186 46 53 -125 -73% -133 -72% 12.00 12.17
A5 WB To B5420 WB 326 353 368 401 42 13% 48 14% 2.25 2.47
A5 WB To A5 EB 9 10 0 0 -9 -100% -10 -100% 4.24 4.47
A5 WB To B5420 EB 23 23 12 12 -11 -48% -11 -48% 2.63 2.63
B5420 WB To A5 WB 79 97 56 68 -23 -29% -29 -30% 2.80 3.19
B5420 WB To B5420 WB 88 105 116 134 28 32% 29 28% 2.77 2.65
B5420 WB To A5 EB 20 24 18 19 -2 -10% -5 -21% 0.46 1.08
B5420 WB To B5420 EB 1 1 0 0 -1 -100% -1 -100% 1.41 1.41
A5 EB To A5 EB 294 327 241 267 -53 -18% -60 -18% 3.24 3.48
A5 EB To A5 WB 9 11 0 0 -9 -100% -11 -100% 4.24 4.69
A5 EB To A545 NB 71 78 81 89 10 14% 11 14% 1.15 1.20
A5 EB To New Street SB 2 2 0 0 -2 -100% -2 -100% 2.00 2.00
A545 SB To A5 EB 188 210 176 194 -12 -6% -16 -8% 0.89 1.13
A545 SB To A5 WB 93 99 93 99 0 0% 0 0% 0.00 0.00
A545 SB To A545 NB 3 3 0 0 -3 -100% -3 -100% 2.45 2.45
A545 SB To New Street SB 4 4 0 0 -4 -100% -4 -100% 2.83 2.83
A5 WB To A5 EB 0 0 0 0 0 0% 0 0% 0.00 0.00
A5 WB To A5 WB 406 435 326 358 -80 -20% -77 -18% 4.18 3.87
A5 WB To A545 NB 192 218 174 188 -18 -9% -30 -14% 1.33 2.11
A5 WB To New Street SB 7 7 0 0 -7 -100% -7 -100% 3.74 3.74
New Street NB To A5 EB 0 0 0 0 0 0% 0 0% 0.00 0.00
New Street NB To A5 WB 0 0 0 0 0 0% 0 0% 0.00 0.00
New Street NB To A545 NB 1 1 0 0 -1 -100% -1 -100% 1.41 1.41
New Street NB To New Street SB 0 0 0 0 0 0% 0 0% 0.00 0.00
A487 NB To A487 SB 3 4 0 0 -3 -100% -4 -100% 2.45 2.83
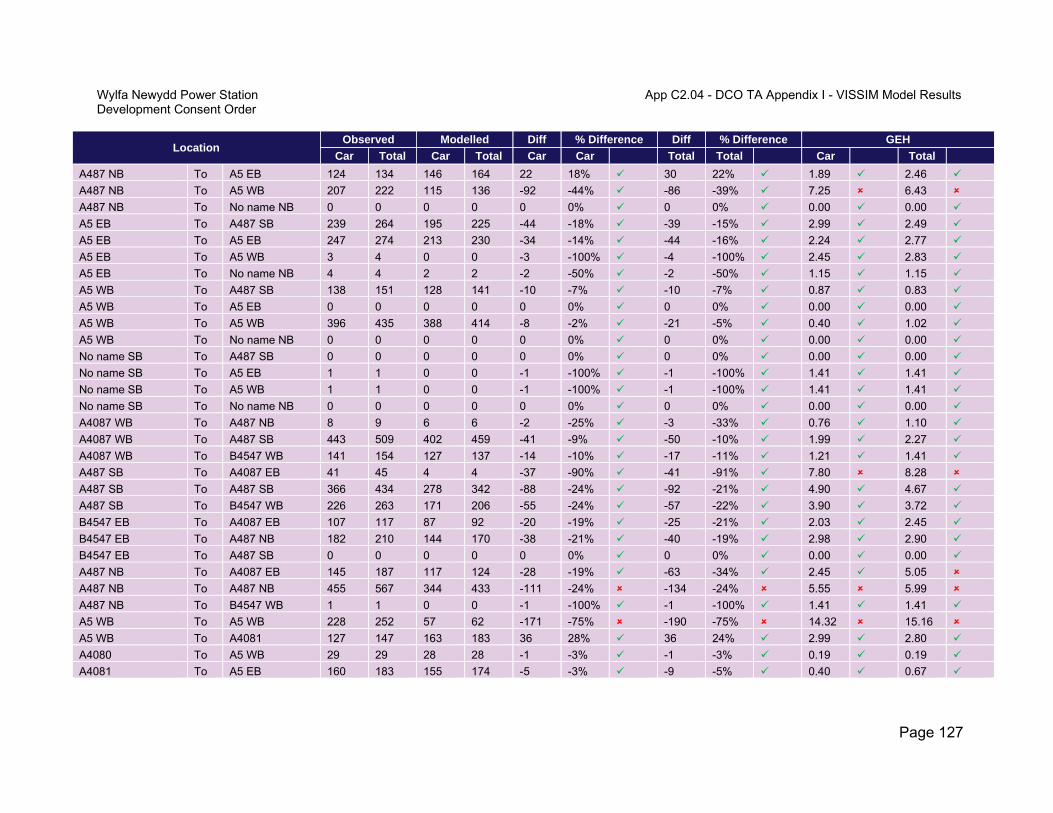
Wylfa Newydd Power Station App C2.04 - DCO TA Appendix I - VISSIM Model ResultsDevelopment Consent Order
Page 127
Location Observed Modelled Diff % Difference Diff % Difference GEH
Car Total Car Total Car Car Total Total Car Total
A487 NB To A5 EB 124 134 146 164 22 18% 30 22% 1.89 2.46
A487 NB To A5 WB 207 222 115 136 -92 -44% -86 -39% 7.25 6.43
A487 NB To No name NB 0 0 0 0 0 0% 0 0% 0.00 0.00
A5 EB To A487 SB 239 264 195 225 -44 -18% -39 -15% 2.99 2.49
A5 EB To A5 EB 247 274 213 230 -34 -14% -44 -16% 2.24 2.77
A5 EB To A5 WB 3 4 0 0 -3 -100% -4 -100% 2.45 2.83
A5 EB To No name NB 4 4 2 2 -2 -50% -2 -50% 1.15 1.15
A5 WB To A487 SB 138 151 128 141 -10 -7% -10 -7% 0.87 0.83
A5 WB To A5 EB 0 0 0 0 0 0% 0 0% 0.00 0.00
A5 WB To A5 WB 396 435 388 414 -8 -2% -21 -5% 0.40 1.02
A5 WB To No name NB 0 0 0 0 0 0% 0 0% 0.00 0.00
No name SB To A487 SB 0 0 0 0 0 0% 0 0% 0.00 0.00
No name SB To A5 EB 1 1 0 0 -1 -100% -1 -100% 1.41 1.41
No name SB To A5 WB 1 1 0 0 -1 -100% -1 -100% 1.41 1.41
No name SB To No name NB 0 0 0 0 0 0% 0 0% 0.00 0.00
A4087 WB To A487 NB 8 9 6 6 -2 -25% -3 -33% 0.76 1.10
A4087 WB To A487 SB 443 509 402 459 -41 -9% -50 -10% 1.99 2.27
A4087 WB To B4547 WB 141 154 127 137 -14 -10% -17 -11% 1.21 1.41
A487 SB To A4087 EB 41 45 4 4 -37 -90% -41 -91% 7.80 8.28
A487 SB To A487 SB 366 434 278 342 -88 -24% -92 -21% 4.90 4.67
A487 SB To B4547 WB 226 263 171 206 -55 -24% -57 -22% 3.90 3.72
B4547 EB To A4087 EB 107 117 87 92 -20 -19% -25 -21% 2.03 2.45
B4547 EB To A487 NB 182 210 144 170 -38 -21% -40 -19% 2.98 2.90
B4547 EB To A487 SB 0 0 0 0 0 0% 0 0% 0.00 0.00
A487 NB To A4087 EB 145 187 117 124 -28 -19% -63 -34% 2.45 5.05
A487 NB To A487 NB 455 567 344 433 -111 -24% -134 -24% 5.55 5.99
A487 NB To B4547 WB 1 1 0 0 -1 -100% -1 -100% 1.41 1.41
A5 WB To A5 WB 228 252 57 62 -171 -75% -190 -75% 14.32 15.16
A5 WB To A4081 127 147 163 183 36 28% 36 24% 2.99 2.80
A4080 To A5 WB 29 29 28 28 -1 -3% -1 -3% 0.19 0.19
A4081 To A5 EB 160 183 155 174 -5 -3% -9 -5% 0.40 0.67

Wylfa Newydd Power Station App C2.04 - DCO TA Appendix I - VISSIM Model ResultsDevelopment Consent Order
Page 128
Location Observed Modelled Diff % Difference Diff % Difference GEH
Car Total Car Total Car Car Total Total Car Total
A5 EB To A4080 37 39 0 0 -37 -100% -39 -100% 8.60 8.83
A5 EB To A5 EB 230 257 111 115 -119 -52% -142 -55% 9.11 10.41
Lon Graig SB To A5 WB 34 38 59 63 25 74% 25 66% 3.67 3.52
Lon Graig SB To A5 EB 1 1 29 30 28 2,800% 29
2900% 7.23 7.37
A5 WB To Lon Graig NB 3 3 1 1 -2 -67% -2 -67% 1.41 1.41
A5 WB To A5 WB 321 361 162 184 -159 -50% -177 -49% 10.23 10.72
A5 EB To Lon Graig NB 66 75 58 65 -8 -12% -10 -13% 1.02 1.20
A5 EB To A5 EB 324 365 208 223 -116 -36% -142 -39% 7.11 8.28
A5 EB To A5 EB 81 101 0 3 -81 -100% -98 -97% 12.73 13.59
A5 EB To A5 WB 0 0 0 0 0 0% 0 0% 0.00 0.00
A5 EB To A5152 NB 120 163 208 268 88 73% 105 64% 6.87 7.15
A5 WB To A5 EB 0 0 0 0 0 0% 0 0% 0.00 0.00
A5 WB To A5 WB 104 124 30 36 -74 -71% -88 -71% 9.04 9.84
A5 WB To A5152 NB 69 76 22 22 -47 -68% -54 -71% 6.97 7.71
A5152 SB To A5 EB 68 76 4 8 -64 -94% -68 -89% 10.67 10.49
A5152 SB To A5 WB 107 156 178 239 71 66% 83 53% 5.95 5.91
A5152 SB To A5152 NB 0 0 0 0 0 0% 0 0% 0.00 0.00
A55 EB To A55 EB 466 637 449 610 -17 -4% -27 -4% 0.79 1.08
A55 WB To A55 WB 490 604 473 584 -17 -3% -20 -3% 0.77 0.82 95% 95% 85% 85%
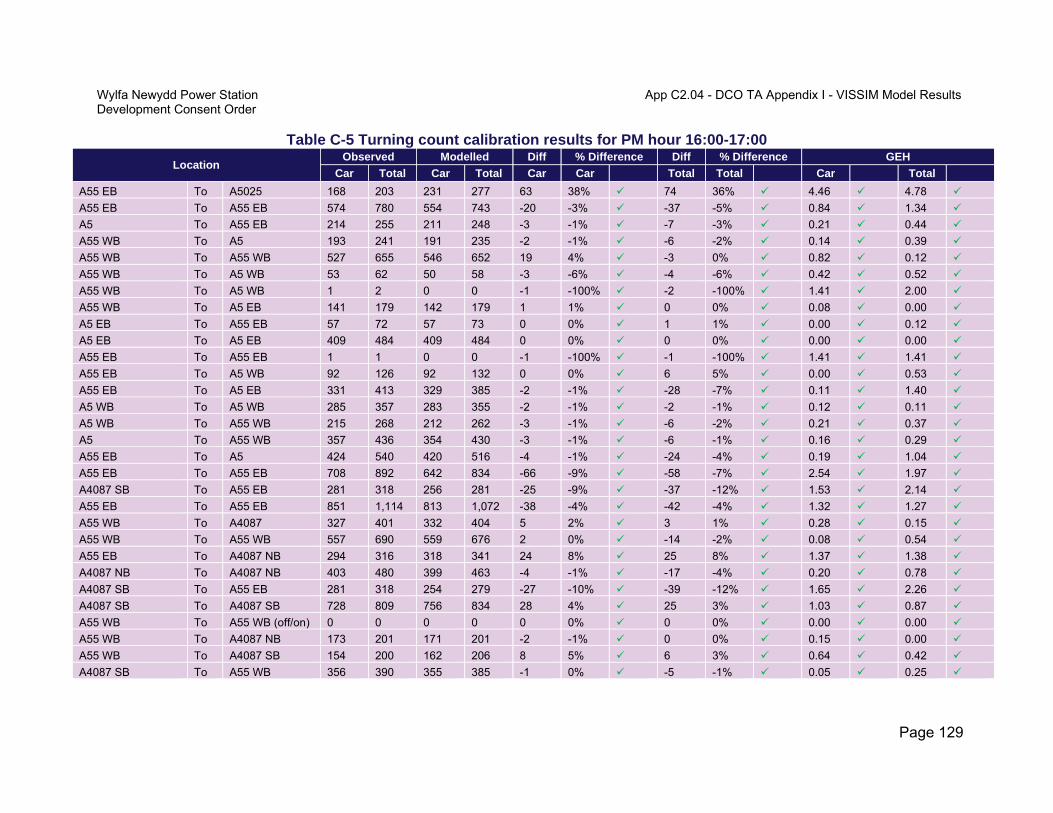
Wylfa Newydd Power Station App C2.04 - DCO TA Appendix I - VISSIM Model ResultsDevelopment Consent Order
Page 129
Table C-5 Turning count calibration results for PM hour 16:00-17:00
Location Observed Modelled Diff % Difference Diff % Difference GEH
Car Total Car Total Car Car Total Total Car Total
A55 EB To A5025 168 203 231 277 63 38% 74 36% 4.46 4.78
A55 EB To A55 EB 574 780 554 743 -20 -3% -37 -5% 0.84 1.34
A5 To A55 EB 214 255 211 248 -3 -1% -7 -3% 0.21 0.44
A55 WB To A5 193 241 191 235 -2 -1% -6 -2% 0.14 0.39
A55 WB To A55 WB 527 655 546 652 19 4% -3 0% 0.82 0.12
A55 WB To A5 WB 53 62 50 58 -3 -6% -4 -6% 0.42 0.52
A55 WB To A5 WB 1 2 0 0 -1 -100% -2 -100% 1.41 2.00
A55 WB To A5 EB 141 179 142 179 1 1% 0 0% 0.08 0.00
A5 EB To A55 EB 57 72 57 73 0 0% 1 1% 0.00 0.12
A5 EB To A5 EB 409 484 409 484 0 0% 0 0% 0.00 0.00
A55 EB To A55 EB 1 1 0 0 -1 -100% -1 -100% 1.41 1.41
A55 EB To A5 WB 92 126 92 132 0 0% 6 5% 0.00 0.53
A55 EB To A5 EB 331 413 329 385 -2 -1% -28 -7% 0.11 1.40
A5 WB To A5 WB 285 357 283 355 -2 -1% -2 -1% 0.12 0.11
A5 WB To A55 WB 215 268 212 262 -3 -1% -6 -2% 0.21 0.37
A5 To A55 WB 357 436 354 430 -3 -1% -6 -1% 0.16 0.29
A55 EB To A5 424 540 420 516 -4 -1% -24 -4% 0.19 1.04
A55 EB To A55 EB 708 892 642 834 -66 -9% -58 -7% 2.54 1.97
A4087 SB To A55 EB 281 318 256 281 -25 -9% -37 -12% 1.53 2.14
A55 EB To A55 EB 851 1,114 813 1,072 -38 -4% -42 -4% 1.32 1.27
A55 WB To A4087 327 401 332 404 5 2% 3 1% 0.28 0.15
A55 WB To A55 WB 557 690 559 676 2 0% -14 -2% 0.08 0.54
A55 EB To A4087 NB 294 316 318 341 24 8% 25 8% 1.37 1.38
A4087 NB To A4087 NB 403 480 399 463 -4 -1% -17 -4% 0.20 0.78
A4087 SB To A55 EB 281 318 254 279 -27 -10% -39 -12% 1.65 2.26
A4087 SB To A4087 SB 728 809 756 834 28 4% 25 3% 1.03 0.87
A55 WB To A55 WB (off/on) 0 0 0 0 0 0% 0 0% 0.00 0.00
A55 WB To A4087 NB 173 201 171 201 -2 -1% 0 0% 0.15 0.00
A55 WB To A4087 SB 154 200 162 206 8 5% 6 3% 0.64 0.42
A4087 SB To A55 WB 356 390 355 385 -1 0% -5 -1% 0.05 0.25

Wylfa Newydd Power Station App C2.04 - DCO TA Appendix I - VISSIM Model ResultsDevelopment Consent Order
Page 130
Location Observed Modelled Diff % Difference Diff % Difference GEH
Car Total Car Total Car Car Total Total Car Total
A4087 SB To A4087 NB 0 0 0 0 0 0% 0 0% 0.00 0.00
A4087 SB To A4087 SB 372 419 400 449 28 8% 30 7% 1.43 1.44
A4087 NB To A55 WB 4 4 3 3 -1 -25% -1 -25% 0.53 0.53
A4087 NB To A4087 NB 230 279 228 264 -2 -1% -15 -5% 0.13 0.91
A4087 NB To A4087 SB 0 0 0 0 0 0% 0 0% 0.00 0.00
A55 EB To A4087 NB 294 316 318 340 24 8% 24 8% 1.37 1.33
A55 EB To A55 EB 851 1,114 814 1,072 -37 -4% -42 -4% 1.28 1.27
A55 WB To A55 WB 557 690 557 674 0 0% -16 -2% 0.00 0.61
A4087 To A55 WB 360 394 357 388 -3 -1% -6 -2% 0.16 0.30
A55 WB To A487 SB 16 24 17 27 1 6% 3 13% 0.25 0.59
A55 WB To No name WB 37 41 38 44 1 3% 3 7% 0.16 0.46
A55 WB To A487 NB 143 161 119 134 -24 -17% -27 -17% 2.10 2.22
A55 WB To A55 WB (off/on) 1 1 0 0 -1 -100% -1 -100% 1.41 1.41
A487 SB To A487 SB 400 511 464 574 64 16% 63 12% 3.08 2.70
A487 SB To No name WB 52 63 50 61 -2 -4% -2 -3% 0.28 0.25
A487 SB To A487 NB 3 5 0 0 -3 -100% -5 -100% 2.45 3.16
A487 SB To A55 WB 224 245 180 196 -44 -20% -49 -20% 3.10 3.30
No name EB To A487 SB 114 122 132 139 18 16% 17 14% 1.62 1.49
No name EB To A487 NB 218 231 201 218 -17 -8% -13 -6% 1.17 0.87
No name EB To A55 WB 106 117 84 93 -22 -21% -24 -21% 2.26 2.34
A487 NB To No name WB 24 30 26 36 2 8% 6 20% 0.40 1.04
A487 NB To A487 NB 231 289 364 448 133 58% 159 55% 7.71 8.28
A487 NB To A55 WB 332 407 364 427 32 10% 20 5% 1.72 0.98
A 487 To A55 EB 541 625 551 643 10 2% 18 3% 0.43 0.71
A55 EB To A55 EB 604 805 583 774 -21 -3% -31 -4% 0.86 1.10
A487 NB To A55 EB 246 295 247 305 1 0% 10 3% 0.06 0.58
A487 NB To A487 NB 253 278 329 369 76 30% 91 33% 4.46 5.06
A487 NB To No name EB 98 113 106 122 8 8% 9 8% 0.79 0.83
A55 EB To A487 SB 270 364 228 306 -42 -16% -58 -16% 2.66 3.17
A55 EB To A55 EB (off/on) 0 0 0 0 0 0% 0 0% 0.00 0.00
A55 EB To A487 NB 54 64 84 100 30 56% 36 56% 3.61 3.98

Wylfa Newydd Power Station App C2.04 - DCO TA Appendix I - VISSIM Model ResultsDevelopment Consent Order
Page 131
Location Observed Modelled Diff % Difference Diff % Difference GEH
Car Total Car Total Car Car Total Total Car Total
A55 EB To No name EB 82 94 74 87 -8 -10% -7 -7% 0.91 0.74
A487 SB To A487 SB 183 216 248 290 65 36% 74 34% 4.43 4.65
A487 SB To A55 EB 104 114 107 118 3 3% 4 4% 0.29 0.37
A487 SB To A487 NB 1 1 0 0 -1 -100% -1 -100% 1.41 1.41
A487 SB To No name EB 18 20 22 25 4 22% 5 25% 0.89 1.05
No name WB To A487 SB 232 252 216 233 -16 -7% -19 -8% 1.07 1.22
No name WB To A55 EB 191 216 196 218 5 3% 2 1% 0.36 0.14
No name WB To A487 NB 113 119 150 159 37 33% 40 34% 3.23 3.39
A55 WB To A55 WB 720 857 742 859 22 3% 2 0% 0.81 0.07
A487 To A55 WB 673 780 630 716 -43 -6% -64 -8% 1.68 2.34
A55 EB To A487 406 522 389 496 -17 -4% -26 -5% 0.85 1.15
A55 EB To A55 EB 604 805 584 777 -20 -3% -28 -3% 0.82 1.00
A55 WB To A5 EB 101 114 145 161 44 44% 47 41% 3.97 4.01
A55 WB To A5 WB 188 208 93 110 -95 -51% -98 -47% 8.01 7.77
A5 WB To A55 EB 71 93 150 176 79 111% 83 89% 7.52 7.16
A5 WB To A5 WB 167 188 120 136 -47 -28% -52 -28% 3.92 4.09
A5 EB To A55 EB 119 137 104 109 -15 -13% -28 -20% 1.42 2.52
A55 WB To A5 293 327 237 269 -56 -19% -58 -18% 3.44 3.36
A55 WB To A55 WB 1,099 1,309 1,128 1,299 29 3% -10 -1% 0.87 0.28
A55 WB To A5025 349 392 273 305 -76 -22% -87 -22% 4.31 4.66
A55 WB To A55 WB 750 917 854 991 104 14% 74 8% 3.67 2.40
A55 WB To A5025 NB 263 302 243 275 -20 -8% -27 -9% 1.26 1.59
A55 WB To A5025 SB 86 90 28 28 -58 -67% -62 -69% 7.68 8.07
A55 WB To A55 WB (off/on) 0 0 0 0 0 0% 0 0% 0.00 0.00
A5025 NB To A5025 NB 126 138 292 328 166 132% 190 138% 11.48 12.45
A5025 NB To A55 WB 26 30 2 6 -24 -92% -24 -80% 6.41 5.66
A5025 SB To A5025 SB 80 94 151 169 71 89% 75 80% 6.61 6.54
A5025 SB To A55 EB 164 216 85 129 -79 -48% -87 -40% 7.08 6.62
A5025 SB To A55 WB 175 215 159 211 -16 -9% -4 -2% 1.24 0.27
A55 EB To A5025 NB 139 170 120 154 -19 -14% -16 -9% 1.67 1.26
A55 EB To A5025 SB 26 28 110 122 84 323% 94 336% 10.19 10.85

Wylfa Newydd Power Station App C2.04 - DCO TA Appendix I - VISSIM Model ResultsDevelopment Consent Order
Page 132
Location Observed Modelled Diff % Difference Diff % Difference GEH
Car Total Car Total Car Car Total Total Car Total
A55 EB To A55 EB (off/on) 2 4 0 0 -2 -100% -4 -100% 2.00 2.83
A55 WB To A55 WB 720 857 740 857 20 3% 0 0% 0.74 0.00
A55 WB To A487 197 227 174 203 -23 -12% -24 -11% 1.69 1.64
A55 EB To A55 EB 574 780 552 750 -22 -4% -30 -4% 0.93 1.08
A 5025 To A55 EB 208 265 124 176 -84 -40% -89 -34% 6.52 5.99
A55 EB To A55 EB 782 1,045 676 928 -106 -14% -117 -11% 3.93 3.73
A5 To A55 EB 228 282 298 349 70 31% 67 24% 4.32 3.77
A55 WB To A55 WB 750 917 852 990 102 14% 73 8% 3.60 2.36
A5025 To A55 WB 202 247 161 216 -41 -20% -31 -13% 3.04 2.04
A55 EB To A55 EB (off/on) 4 4 0 0 -4 -100% -4 -100% 2.83 2.83
A55 EB To A5152 NB 2 2 1 1 -1 -50% -1 -50% 0.82 0.82
A55 EB To A5152 SB 103 126 105 127 2 2% 1 1% 0.20 0.09
A5152 NB To A55 WB 70 83 56 64 -14 -20% -19 -23% 1.76 2.22
A5152 NB To A55 EB 110 136 256 307 146 133% 171 126% 10.79 11.49
A5152 NB To A5152 NB 5 6 3 3 -2 -40% -3 -50% 1.00 1.41
A5152 SB To A55 WB 1 1 4 4 3 300% 3 300% 1.90 1.90
A5152 SB To A55 EB 0 0 0 0 0 0% 0 0% 0.00 0.00
A5152 SB To A5152 SB 104 104 107 129 3 3% 25 24% 0.29 2.32
A55 WB To A55 WB (off/on) 0 0 0 0 0 0% 0 0% 0.00 0.00
A55 WB To A5152 NB 2 3 1 1 -1 -50% -2 -67% 0.82 1.41
A55 WB To A5152 SB 144 189 127 179 -17 -12% -10 -5% 1.46 0.74
A55 EB To A55 EB 460 640 535 734 75 16% 94 15% 3.36 3.59
A55 EB To A5152 111 134 107 128 -4 -4% -6 -4% 0.38 0.52
A5152 To A55 WB 73 86 59 67 -14 -19% -19 -22% 1.72 2.17
A55 WB To A55 WB 806 972 794 933 -12 -1% -39 -4% 0.42 1.26
A55 EB To A55 EB 460 640 534 731 74 16% 91 14% 3.32 3.48
A5152 To A55 EB 114 140 255 307 141 124% 167 119% 10.38 11.17
A55 WB To A55 WB 806 972 792 931 -14 -2% -41 -4% 0.50 1.33
A55 WB To A5152 146 192 127 178 -19 -13% -14 -7% 1.63 1.03
A5 EB To A5 WB 1 1 0 0 -1 -100% -1 -100% 1.41 1.41
A5 EB To B5420 WB 28 33 80 92 52 186% 59 179% 7.08 7.46

Wylfa Newydd Power Station App C2.04 - DCO TA Appendix I - VISSIM Model ResultsDevelopment Consent Order
Page 133
Location Observed Modelled Diff % Difference Diff % Difference GEH
Car Total Car Total Car Car Total Total Car Total
A5 EB To A5 EB 104 113 124 131 20 19% 18 16% 1.87 1.63
A5 EB To B5420 EB 92 105 60 68 -32 -35% -37 -35% 3.67 3.98
B5420 EB To A5 WB 24 31 115 126 91 379% 95 306% 10.92 10.72
B5420 EB To B5420 WB 1 1 0 0 -1 -100% -1 -100% 1.41 1.41
B5420 EB To A5 EB 250 275 272 299 22 9% 24 9% 1.36 1.42
B5420 EB To B5420 EB 55 69 64 76 9 16% 7 10% 1.17 0.82
A5 WB To A5 WB 191 209 129 136 -62 -32% -73 -35% 4.90 5.56
A5 WB To B5420 WB 491 538 593 647 102 21% 109 20% 4.38 4.48
A5 WB To A5 EB 10 10 0 0 -10 -100% -10 -100% 4.47 4.47
A5 WB To B5420 EB 41 45 66 72 25 61% 27 60% 3.42 3.53
B5420 WB To A5 WB 100 118 75 84 -25 -25% -34 -29% 2.67 3.38
B5420 WB To B5420 WB 61 83 91 113 30 49% 30 36% 3.44 3.03
B5420 WB To A5 EB 31 32 17 17 -14 -45% -15 -47% 2.86 3.03
B5420 WB To B5420 EB 1 1 0 0 -1 -100% -1 -100% 1.41 1.41
A5 EB To A5 EB 316 347 303 335 -13 -4% -12 -3% 0.74 0.65
A5 EB To A5 WB 6 7 0 0 -6 -100% -7 -100% 3.46 3.74
A5 EB To A545 NB 76 80 102 105 26 34% 25 31% 2.76 2.60
A5 EB To New Street SB 9 9 0 0 -9 -100% -9 -100% 4.24 4.24
A545 SB To A5 EB 195 228 191 222 -4 -2% -6 -3% 0.29 0.40
A545 SB To A5 WB 78 85 80 84 2 3% -1 -1% 0.23 0.11
A545 SB To A545 NB 4 4 0 0 -4 -100% -4 -100% 2.83 2.83
A545 SB To New Street SB 3 3 0 0 -3 -100% -3 -100% 2.45 2.45
A5 WB To A5 EB 0 0 0 0 0 0% 0 0% 0.00 0.00
A5 WB To A5 WB 600 654 709 772 109 18% 118 18% 4.26 4.42
A5 WB To A545 NB 241 266 196 213 -45 -19% -53 -20% 3.04 3.42
A5 WB To New Street SB 2 4 0 0 -2 -100% -4 -100% 2.00 2.83
New Street NB To A5 EB 0 0 0 0 0 0% 0 0% 0.00 0.00
New Street NB To A5 WB 0 0 0 0 0 0% 0 0% 0.00 0.00
New Street NB To A545 NB 0 0 0 0 0 0% 0 0% 0.00 0.00
New Street NB To New Street SB 0 0 0 0 0 0% 0 0% 0.00 0.00
A487 NB To A487 SB 0 0 0 0 0 0% 0 0% 0.00 0.00

Wylfa Newydd Power Station App C2.04 - DCO TA Appendix I - VISSIM Model ResultsDevelopment Consent Order
Page 134
Location Observed Modelled Diff % Difference Diff % Difference GEH
Car Total Car Total Car Car Total Total Car Total
A487 NB To A5 EB 148 166 164 182 16 11% 16 10% 1.28 1.21
A487 NB To A5 WB 350 388 408 450 58 17% 62 16% 2.98 3.03
A487 NB To No name NB 0 0 0 0 0 0% 0 0% 0.00 0.00
A5 EB To A487 SB 274 305 268 303 -6 -2% -2 -1% 0.36 0.11
A5 EB To A5 EB 246 280 217 243 -29 -12% -37 -13% 1.91 2.29
A5 EB To A5 WB 2 2 0 0 -2 -100% -2 -100% 2.00 2.00
A5 EB To No name NB 0 0 0 0 0 0% 0 0% 0.00 0.00
A5 WB To A487 SB 152 175 128 149 -24 -16% -26 -15% 2.03 2.04
A5 WB To A5 EB 0 0 0 0 0 0% 0 0% 0.00 0.00
A5 WB To A5 WB 500 541 506 544 6 1% 3 1% 0.27 0.13
A5 WB To No name NB 0 0 0 0 0 0% 0 0% 0.00 0.00
No name SB To A487 SB 0 0 0 0 0 0% 0 0% 0.00 0.00
No name SB To A5 EB 0 0 0 0 0 0% 0 0% 0.00 0.00
No name SB To A5 WB 0 0 0 0 0 0% 0 0% 0.00 0.00
No name SB To No name NB 0 0 0 0 0 0% 0 0% 0.00 0.00
A4087 WB To A487 NB 13 13 10 10 -3 -23% -3 -23% 0.88 0.88
A4087 WB To A487 SB 438 502 397 460 -41 -9% -42 -8% 2.01 1.92
A4087 WB To B4547 WB 193 213 171 189 -22 -11% -24 -11% 1.63 1.69
A487 SB To A4087 EB 39 43 0 2 -39 -100% -41 -95% 8.83 8.64
A487 SB To A487 SB 439 519 340 414 -99 -23% -105 -20% 5.02 4.86
A487 SB To B4547 WB 337 385 252 293 -85 -25% -92 -24% 4.95 5.00
B4547 EB To A4087 EB 111 129 69 81 -42 -38% -48 -37% 4.43 4.68
B4547 EB To A487 NB 190 220 160 185 -30 -16% -35 -16% 2.27 2.46
B4547 EB To A487 SB 1 3 0 0 -1 -100% -3 -100% 1.41 2.45
A487 NB To A4087 EB 166 190 98 117 -68 -41% -73 -38% 5.92 5.89
A487 NB To A487 NB 550 692 546 646 -4 -1% -46 -7% 0.17 1.78
A487 NB To B4547 WB 4 4 0 0 -4 -100% -4 -100% 2.83 2.83
A5 WB To A5 WB 241 276 71 80 -170 -71% -196 -71% 13.61 14.69
A5 WB To A4081 152 176 158 182 6 4% 6 3% 0.48 0.45
A4080 To A5 WB 32 34 32 35 0 0% 1 3% 0.00 0.17
A4081 To A5 EB 149 177 147 173 -2 -1% -4 -2% 0.16 0.30
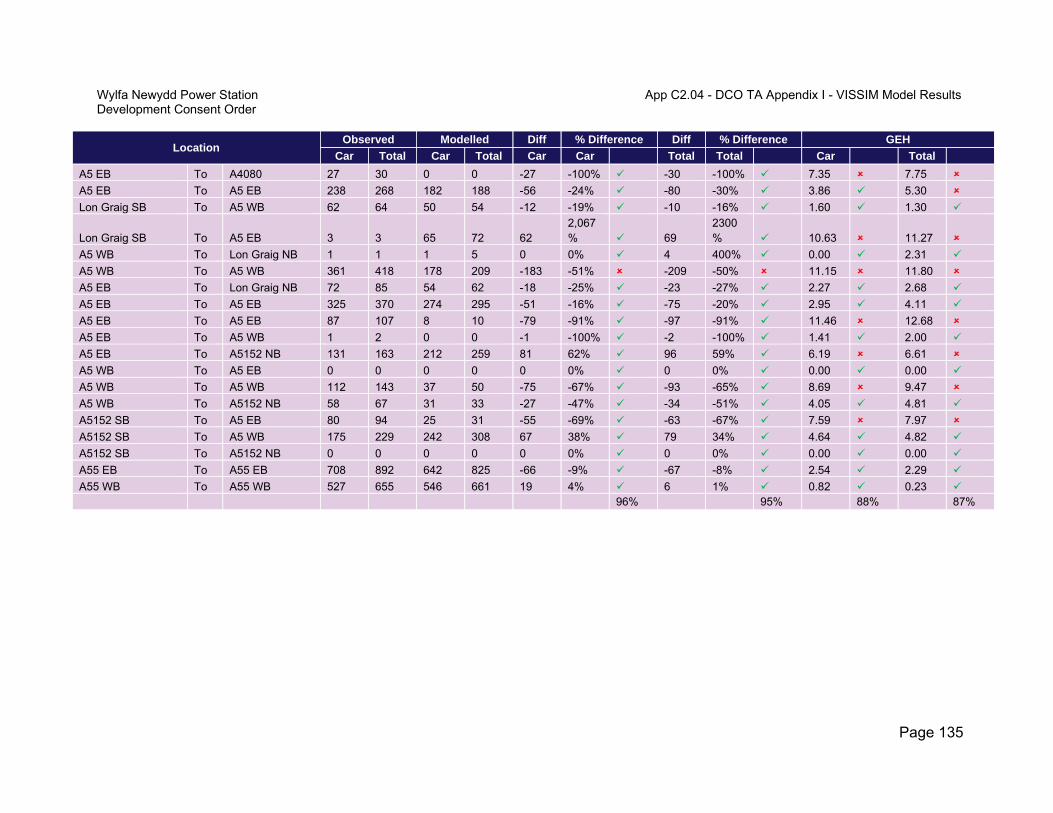
Wylfa Newydd Power Station App C2.04 - DCO TA Appendix I - VISSIM Model ResultsDevelopment Consent Order
Page 135
Location Observed Modelled Diff % Difference Diff % Difference GEH
Car Total Car Total Car Car Total Total Car Total
A5 EB To A4080 27 30 0 0 -27 -100% -30 -100% 7.35 7.75
A5 EB To A5 EB 238 268 182 188 -56 -24% -80 -30% 3.86 5.30
Lon Graig SB To A5 WB 62 64 50 54 -12 -19% -10 -16% 1.60 1.30
Lon Graig SB To A5 EB 3 3 65 72 62 2,067% 69
2300% 10.63 11.27
A5 WB To Lon Graig NB 1 1 1 5 0 0% 4 400% 0.00 2.31
A5 WB To A5 WB 361 418 178 209 -183 -51% -209 -50% 11.15 11.80
A5 EB To Lon Graig NB 72 85 54 62 -18 -25% -23 -27% 2.27 2.68
A5 EB To A5 EB 325 370 274 295 -51 -16% -75 -20% 2.95 4.11
A5 EB To A5 EB 87 107 8 10 -79 -91% -97 -91% 11.46 12.68
A5 EB To A5 WB 1 2 0 0 -1 -100% -2 -100% 1.41 2.00
A5 EB To A5152 NB 131 163 212 259 81 62% 96 59% 6.19 6.61
A5 WB To A5 EB 0 0 0 0 0 0% 0 0% 0.00 0.00
A5 WB To A5 WB 112 143 37 50 -75 -67% -93 -65% 8.69 9.47
A5 WB To A5152 NB 58 67 31 33 -27 -47% -34 -51% 4.05 4.81
A5152 SB To A5 EB 80 94 25 31 -55 -69% -63 -67% 7.59 7.97
A5152 SB To A5 WB 175 229 242 308 67 38% 79 34% 4.64 4.82
A5152 SB To A5152 NB 0 0 0 0 0 0% 0 0% 0.00 0.00
A55 EB To A55 EB 708 892 642 825 -66 -9% -67 -8% 2.54 2.29
A55 WB To A55 WB 527 655 546 661 19 4% 6 1% 0.82 0.23 96% 95% 88% 87%

Wylfa Newydd Power Station App C2.04 - DCO TA Appendix I - VISSIM Model ResultsDevelopment Consent Order
Page 136
Table C-6 Turning count calibration results for PM hour 17:00-18:00
Location Observed Modelled Diff % Difference Diff % Difference GEH
Car Total Car Total Car Car Total Total Car Total
A55 EB To A5025 165 200 254 298 89 54% 98 49% 6.15 6.21
A55 EB To A55 EB 583 707 592 708 9 2% 1 0% 0.37 0.04
A5 To A55 EB 222 255 220 252 -2 -1% -3 -1% 0.13 0.19
A55 WB To A5 222 271 221 270 -1 0% -1 0% 0.07 0.06
A55 WB To A55 WB 551 681 654 785 103 19% 104 15% 4.20 3.84
A55 WB To A5 WB 44 46 43 43 -1 -2% -3 -7% 0.15 0.45
A55 WB To A5 WB 1 1 0 0 -1 -100% -1 -100% 1.41 1.41
A55 WB To A5 EB 177 224 180 227 3 2% 3 1% 0.22 0.20
A5 EB To A55 EB 77 82 75 82 -2 -3% 0 0% 0.23 0.00
A5 EB To A5 EB 505 576 506 575 1 0% -1 0% 0.04 0.04
A55 EB To A55 EB 1 1 0 0 -1 -100% -1 -100% 1.41 1.41
A55 EB To A5 WB 75 98 79 102 4 5% 4 4% 0.46 0.40
A55 EB To A5 EB 413 487 364 434 -49 -12% -53 -11% 2.49 2.47
A5 WB To A5 WB 271 318 271 318 0 0% 0 0% 0.00 0.00
A5 WB To A55 WB 243 294 266 316 23 9% 22 7% 1.44 1.26
A5 To A55 WB 427 504 451 525 24 6% 21 4% 1.15 0.93
A55 EB To A5 489 586 443 535 -46 -9% -51 -9% 2.13 2.15
A55 EB To A55 EB 499 582 510 604 11 2% 22 4% 0.49 0.90
A4087 SB To A55 EB 256 303 220 260 -36 -14% -43 -14% 2.33 2.56
A55 EB To A55 EB 732 865 726 874 -6 -1% 9 1% 0.22 0.31
A55 WB To A4087 364 427 369 433 5 1% 6 1% 0.26 0.29
A55 WB To A55 WB 614 758 744 885 130 21% 127 17% 4.99 4.43
A55 EB To A4087 NB 296 329 346 376 50 17% 47 14% 2.79 2.50
A4087 NB To A4087 NB 494 563 452 513 -42 -9% -50 -9% 1.93 2.16
A4087 SB To A55 EB 256 303 220 260 -36 -14% -43 -14% 2.33 2.56
A4087 SB To A4087 SB 772 857 796 879 24 3% 22 3% 0.86 0.75
A55 WB To A55 WB (off/on) 1 1 0 0 -1 -100% -1 -100% 1.41 1.41
A55 WB To A4087 NB 206 237 197 228 -9 -4% -9 -4% 0.63 0.59
A55 WB To A4087 SB 157 189 171 205 14 9% 16 8% 1.09 1.14
A4087 SB To A55 WB 341 368 351 376 10 3% 8 2% 0.54 0.41

Wylfa Newydd Power Station App C2.04 - DCO TA Appendix I - VISSIM Model ResultsDevelopment Consent Order
Page 137
Location Observed Modelled Diff % Difference Diff % Difference GEH
Car Total Car Total Car Car Total Total Car Total
A4087 SB To A4087 NB 1 2 0 0 -1 -100% -2 -100% 1.41 2.00
A4087 SB To A4087 SB 430 487 449 504 19 4% 17 3% 0.91 0.76
A4087 NB To A55 WB 9 14 5 5 -4 -44% -9 -64% 1.51 2.92
A4087 NB To A4087 NB 287 324 256 288 -31 -11% -36 -11% 1.88 2.06
A4087 NB To A4087 SB 0 0 0 0 0 0% 0 0% 0.00 0.00
A55 EB To A4087 NB 296 329 345 375 49 17% 46 14% 2.74 2.45
A55 EB To A55 EB 732 865 727 875 -5 -1% 10 1% 0.19 0.34
A55 WB To A55 WB 614 758 745 886 131 21% 128 17% 5.03 4.46
A4087 To A55 WB 351 383 357 384 6 2% 1 0% 0.32 0.05
A55 WB To A487 SB 21 26 21 25 0 0% -1 -4% 0.00 0.20
A55 WB To No name WB 35 41 29 34 -6 -17% -7 -17% 1.06 1.14
A55 WB To A487 NB 183 198 196 213 13 7% 15 8% 0.94 1.05
A55 WB To A55 WB (off/on) 0 0 0 0 0 0% 0 0% 0.00 0.00
A487 SB To A487 SB 444 516 544 626 100 23% 110 21% 4.50 4.60
A487 SB To No name WB 91 105 80 91 -11 -12% -14 -13% 1.19 1.41
A487 SB To A487 NB 2 4 0 0 -2 -100% -4 -100% 2.00 2.83
A487 SB To A55 WB 182 198 143 151 -39 -21% -47 -24% 3.06 3.56
No name EB To A487 SB 133 137 159 165 26 20% 28 20% 2.15 2.28
No name EB To A487 NB 255 269 212 228 -43 -17% -41 -15% 2.81 2.60
No name EB To A55 WB 131 137 95 100 -36 -27% -37 -27% 3.39 3.40
A487 NB To No name WB 36 44 38 46 2 6% 2 5% 0.33 0.30
A487 NB To A487 NB 223 264 346 402 123 55% 138 52% 7.29 7.56
A487 NB To A55 WB 373 437 497 555 124 33% 118 27% 5.95 5.30
A 487 To A55 EB 532 580 456 509 -76 -14% -71 -12% 3.42 3.04
A55 EB To A55 EB 496 614 610 733 114 23% 119 19% 4.85 4.59
A487 NB To A55 EB 292 327 234 275 -58 -20% -52 -16% 3.58 3.00
A487 NB To A487 NB 262 283 394 433 132 50% 150 53% 7.29 7.93
A487 NB To No name EB 130 143 130 141 0 0% -2 -1% 0.00 0.17
A55 EB To A487 SB 359 436 346 411 -13 -4% -25 -6% 0.69 1.21
A55 EB To A55 EB (off/on) 1 1 0 0 -1 -100% -1 -100% 1.41 1.41
A55 EB To A487 NB 55 63 78 90 23 42% 27 43% 2.82 3.09
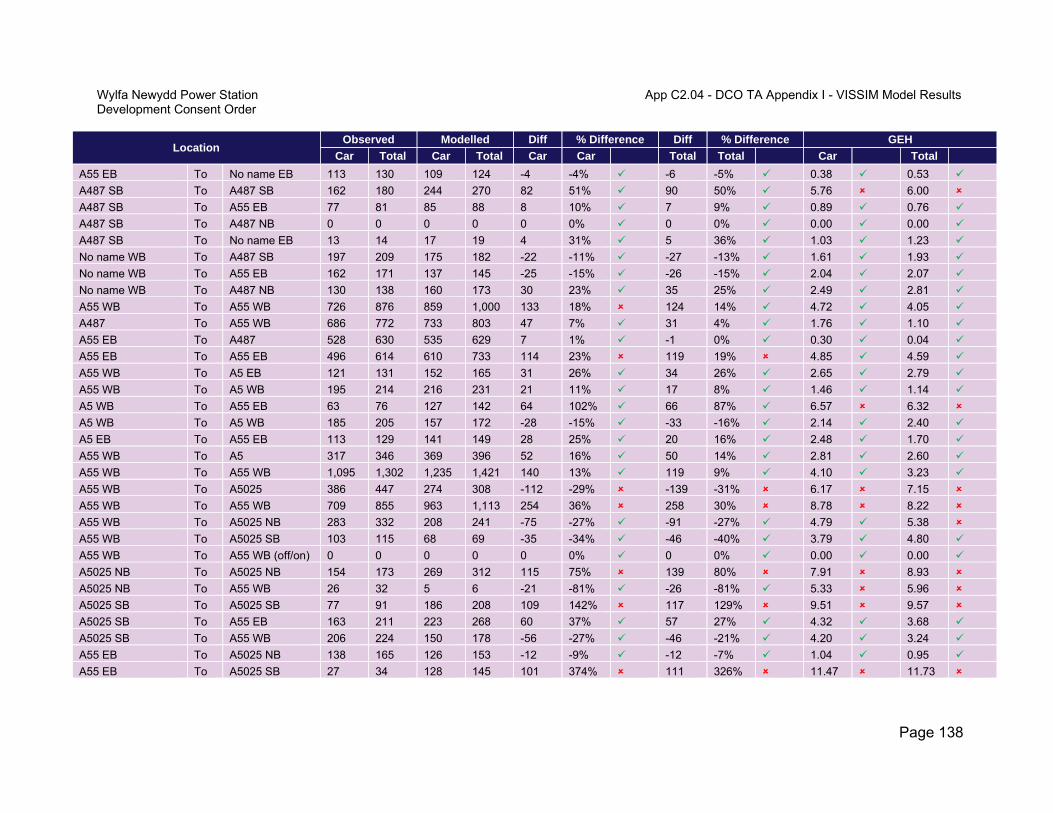
Wylfa Newydd Power Station App C2.04 - DCO TA Appendix I - VISSIM Model ResultsDevelopment Consent Order
Page 138
Location Observed Modelled Diff % Difference Diff % Difference GEH
Car Total Car Total Car Car Total Total Car Total
A55 EB To No name EB 113 130 109 124 -4 -4% -6 -5% 0.38 0.53
A487 SB To A487 SB 162 180 244 270 82 51% 90 50% 5.76 6.00
A487 SB To A55 EB 77 81 85 88 8 10% 7 9% 0.89 0.76
A487 SB To A487 NB 0 0 0 0 0 0% 0 0% 0.00 0.00
A487 SB To No name EB 13 14 17 19 4 31% 5 36% 1.03 1.23
No name WB To A487 SB 197 209 175 182 -22 -11% -27 -13% 1.61 1.93
No name WB To A55 EB 162 171 137 145 -25 -15% -26 -15% 2.04 2.07
No name WB To A487 NB 130 138 160 173 30 23% 35 25% 2.49 2.81
A55 WB To A55 WB 726 876 859 1,000 133 18% 124 14% 4.72 4.05
A487 To A55 WB 686 772 733 803 47 7% 31 4% 1.76 1.10
A55 EB To A487 528 630 535 629 7 1% -1 0% 0.30 0.04
A55 EB To A55 EB 496 614 610 733 114 23% 119 19% 4.85 4.59
A55 WB To A5 EB 121 131 152 165 31 26% 34 26% 2.65 2.79
A55 WB To A5 WB 195 214 216 231 21 11% 17 8% 1.46 1.14
A5 WB To A55 EB 63 76 127 142 64 102% 66 87% 6.57 6.32
A5 WB To A5 WB 185 205 157 172 -28 -15% -33 -16% 2.14 2.40
A5 EB To A55 EB 113 129 141 149 28 25% 20 16% 2.48 1.70
A55 WB To A5 317 346 369 396 52 16% 50 14% 2.81 2.60
A55 WB To A55 WB 1,095 1,302 1,235 1,421 140 13% 119 9% 4.10 3.23
A55 WB To A5025 386 447 274 308 -112 -29% -139 -31% 6.17 7.15
A55 WB To A55 WB 709 855 963 1,113 254 36% 258 30% 8.78 8.22
A55 WB To A5025 NB 283 332 208 241 -75 -27% -91 -27% 4.79 5.38
A55 WB To A5025 SB 103 115 68 69 -35 -34% -46 -40% 3.79 4.80
A55 WB To A55 WB (off/on) 0 0 0 0 0 0% 0 0% 0.00 0.00
A5025 NB To A5025 NB 154 173 269 312 115 75% 139 80% 7.91 8.93
A5025 NB To A55 WB 26 32 5 6 -21 -81% -26 -81% 5.33 5.96
A5025 SB To A5025 SB 77 91 186 208 109 142% 117 129% 9.51 9.57
A5025 SB To A55 EB 163 211 223 268 60 37% 57 27% 4.32 3.68
A5025 SB To A55 WB 206 224 150 178 -56 -27% -46 -21% 4.20 3.24
A55 EB To A5025 NB 138 165 126 153 -12 -9% -12 -7% 1.04 0.95
A55 EB To A5025 SB 27 34 128 145 101 374% 111 326% 11.47 11.73
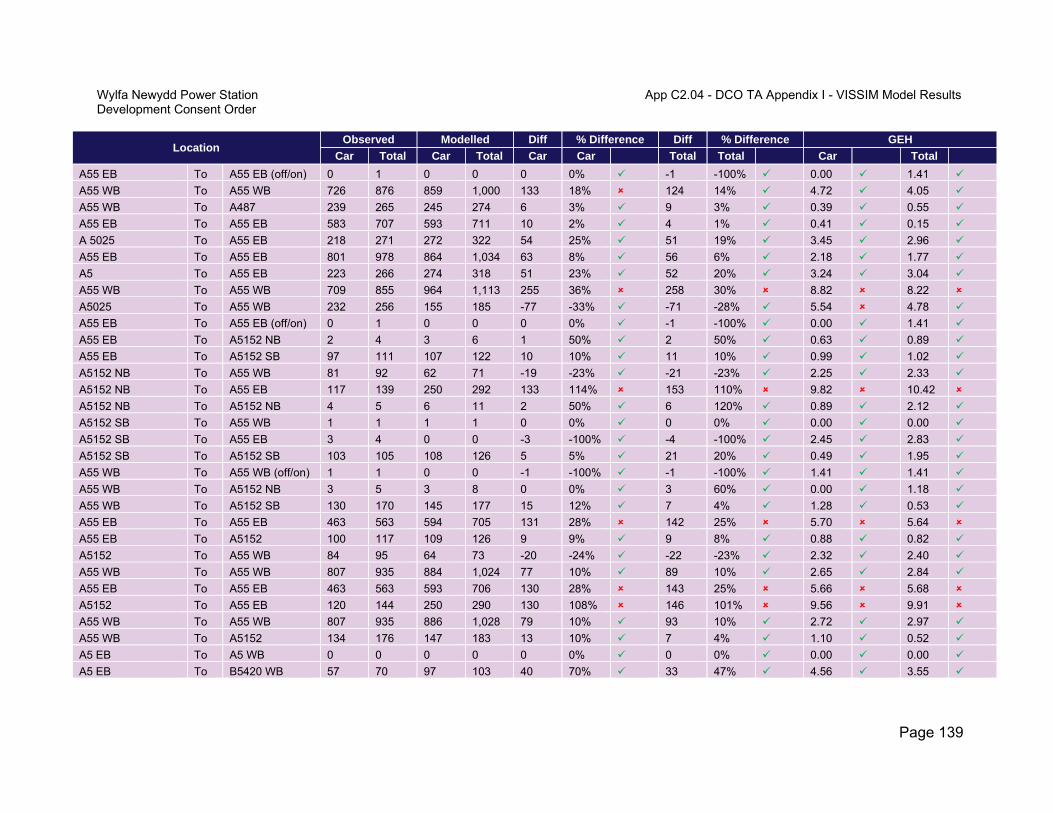
Wylfa Newydd Power Station App C2.04 - DCO TA Appendix I - VISSIM Model ResultsDevelopment Consent Order
Page 139
Location Observed Modelled Diff % Difference Diff % Difference GEH
Car Total Car Total Car Car Total Total Car Total
A55 EB To A55 EB (off/on) 0 1 0 0 0 0% -1 -100% 0.00 1.41
A55 WB To A55 WB 726 876 859 1,000 133 18% 124 14% 4.72 4.05
A55 WB To A487 239 265 245 274 6 3% 9 3% 0.39 0.55
A55 EB To A55 EB 583 707 593 711 10 2% 4 1% 0.41 0.15
A 5025 To A55 EB 218 271 272 322 54 25% 51 19% 3.45 2.96
A55 EB To A55 EB 801 978 864 1,034 63 8% 56 6% 2.18 1.77
A5 To A55 EB 223 266 274 318 51 23% 52 20% 3.24 3.04
A55 WB To A55 WB 709 855 964 1,113 255 36% 258 30% 8.82 8.22
A5025 To A55 WB 232 256 155 185 -77 -33% -71 -28% 5.54 4.78
A55 EB To A55 EB (off/on) 0 1 0 0 0 0% -1 -100% 0.00 1.41
A55 EB To A5152 NB 2 4 3 6 1 50% 2 50% 0.63 0.89
A55 EB To A5152 SB 97 111 107 122 10 10% 11 10% 0.99 1.02
A5152 NB To A55 WB 81 92 62 71 -19 -23% -21 -23% 2.25 2.33
A5152 NB To A55 EB 117 139 250 292 133 114% 153 110% 9.82 10.42
A5152 NB To A5152 NB 4 5 6 11 2 50% 6 120% 0.89 2.12
A5152 SB To A55 WB 1 1 1 1 0 0% 0 0% 0.00 0.00
A5152 SB To A55 EB 3 4 0 0 -3 -100% -4 -100% 2.45 2.83
A5152 SB To A5152 SB 103 105 108 126 5 5% 21 20% 0.49 1.95
A55 WB To A55 WB (off/on) 1 1 0 0 -1 -100% -1 -100% 1.41 1.41
A55 WB To A5152 NB 3 5 3 8 0 0% 3 60% 0.00 1.18
A55 WB To A5152 SB 130 170 145 177 15 12% 7 4% 1.28 0.53
A55 EB To A55 EB 463 563 594 705 131 28% 142 25% 5.70 5.64
A55 EB To A5152 100 117 109 126 9 9% 9 8% 0.88 0.82
A5152 To A55 WB 84 95 64 73 -20 -24% -22 -23% 2.32 2.40
A55 WB To A55 WB 807 935 884 1,024 77 10% 89 10% 2.65 2.84
A55 EB To A55 EB 463 563 593 706 130 28% 143 25% 5.66 5.68
A5152 To A55 EB 120 144 250 290 130 108% 146 101% 9.56 9.91
A55 WB To A55 WB 807 935 886 1,028 79 10% 93 10% 2.72 2.97
A55 WB To A5152 134 176 147 183 13 10% 7 4% 1.10 0.52
A5 EB To A5 WB 0 0 0 0 0 0% 0 0% 0.00 0.00
A5 EB To B5420 WB 57 70 97 103 40 70% 33 47% 4.56 3.55

Wylfa Newydd Power Station App C2.04 - DCO TA Appendix I - VISSIM Model ResultsDevelopment Consent Order
Page 140
Location Observed Modelled Diff % Difference Diff % Difference GEH
Car Total Car Total Car Car Total Total Car Total
A5 EB To A5 EB 116 124 144 153 28 24% 29 23% 2.46 2.46
A5 EB To B5420 EB 103 115 100 108 -3 -3% -7 -6% 0.30 0.66
B5420 EB To A5 WB 34 39 119 124 85 250% 85 218% 9.72 9.42
B5420 EB To B5420 WB 2 2 0 0 -2 -100% -2 -100% 2.00 2.00
B5420 EB To A5 EB 214 238 249 269 35 16% 31 13% 2.30 1.95
B5420 EB To B5420 EB 85 92 81 88 -4 -5% -4 -4% 0.44 0.42
A5 WB To A5 WB 207 218 174 182 -33 -16% -36 -17% 2.39 2.55
A5 WB To B5420 WB 623 676 685 766 62 10% 90 13% 2.42 3.35
A5 WB To A5 EB 11 11 0 0 -11 -100% -11 -100% 4.69 4.69
A5 WB To B5420 EB 38 39 74 80 36 95% 41 105% 4.81 5.32
B5420 WB To A5 WB 90 105 60 70 -30 -33% -35 -33% 3.46 3.74
B5420 WB To B5420 WB 87 99 117 132 30 34% 33 33% 2.97 3.07
B5420 WB To A5 EB 21 26 12 14 -9 -43% -12 -46% 2.22 2.68
B5420 WB To B5420 EB 0 0 0 0 0 0% 0 0% 0.00 0.00
A5 EB To A5 EB 271 303 281 303 10 4% 0 0% 0.60 0.00
A5 EB To A5 WB 11 11 0 0 -11 -100% -11 -100% 4.69 4.69
A5 EB To A545 NB 65 71 94 99 29 45% 28 39% 3.25 3.04
A5 EB To New Street SB 9 10 0 0 -9 -100% -10 -100% 4.24 4.47
A545 SB To A5 EB 172 196 163 184 -9 -5% -12 -6% 0.70 0.87
A545 SB To A5 WB 58 66 59 67 1 2% 1 2% 0.13 0.12
A545 SB To A545 NB 3 3 0 0 -3 -100% -3 -100% 2.45 2.45
A545 SB To New Street SB 3 3 0 0 -3 -100% -3 -100% 2.45 2.45
A5 WB To A5 EB 1 1 0 0 -1 -100% -1 -100% 1.41 1.41
A5 WB To A5 WB 778 842 874 958 96 12% 116 14% 3.34 3.87
A5 WB To A545 NB 281 305 295 314 14 5% 9 3% 0.82 0.51
A5 WB To New Street SB 8 8 0 0 -8 -100% -8 -100% 4.00 4.00
New Street NB To A5 EB 0 0 0 0 0 0% 0 0% 0.00 0.00
New Street NB To A5 WB 0 0 0 0 0 0% 0 0% 0.00 0.00
New Street NB To A545 NB 0 0 0 0 0 0% 0 0% 0.00 0.00
New Street NB To New Street SB 0 0 0 0 0 0% 0 0% 0.00 0.00
A487 NB To A487 SB 3 3 0 0 -3 -100% -3 -100% 2.45 2.45
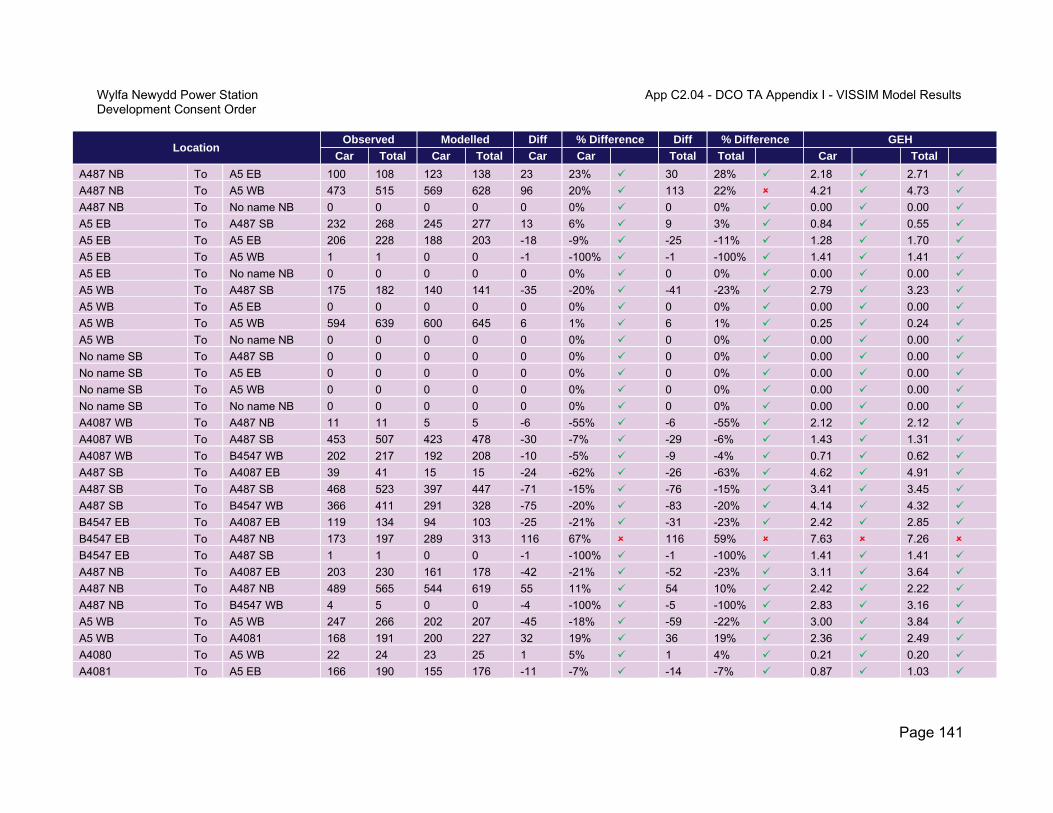
Wylfa Newydd Power Station App C2.04 - DCO TA Appendix I - VISSIM Model ResultsDevelopment Consent Order
Page 141
Location Observed Modelled Diff % Difference Diff % Difference GEH
Car Total Car Total Car Car Total Total Car Total
A487 NB To A5 EB 100 108 123 138 23 23% 30 28% 2.18 2.71
A487 NB To A5 WB 473 515 569 628 96 20% 113 22% 4.21 4.73
A487 NB To No name NB 0 0 0 0 0 0% 0 0% 0.00 0.00
A5 EB To A487 SB 232 268 245 277 13 6% 9 3% 0.84 0.55
A5 EB To A5 EB 206 228 188 203 -18 -9% -25 -11% 1.28 1.70
A5 EB To A5 WB 1 1 0 0 -1 -100% -1 -100% 1.41 1.41
A5 EB To No name NB 0 0 0 0 0 0% 0 0% 0.00 0.00
A5 WB To A487 SB 175 182 140 141 -35 -20% -41 -23% 2.79 3.23
A5 WB To A5 EB 0 0 0 0 0 0% 0 0% 0.00 0.00
A5 WB To A5 WB 594 639 600 645 6 1% 6 1% 0.25 0.24
A5 WB To No name NB 0 0 0 0 0 0% 0 0% 0.00 0.00
No name SB To A487 SB 0 0 0 0 0 0% 0 0% 0.00 0.00
No name SB To A5 EB 0 0 0 0 0 0% 0 0% 0.00 0.00
No name SB To A5 WB 0 0 0 0 0 0% 0 0% 0.00 0.00
No name SB To No name NB 0 0 0 0 0 0% 0 0% 0.00 0.00
A4087 WB To A487 NB 11 11 5 5 -6 -55% -6 -55% 2.12 2.12
A4087 WB To A487 SB 453 507 423 478 -30 -7% -29 -6% 1.43 1.31
A4087 WB To B4547 WB 202 217 192 208 -10 -5% -9 -4% 0.71 0.62
A487 SB To A4087 EB 39 41 15 15 -24 -62% -26 -63% 4.62 4.91
A487 SB To A487 SB 468 523 397 447 -71 -15% -76 -15% 3.41 3.45
A487 SB To B4547 WB 366 411 291 328 -75 -20% -83 -20% 4.14 4.32
B4547 EB To A4087 EB 119 134 94 103 -25 -21% -31 -23% 2.42 2.85
B4547 EB To A487 NB 173 197 289 313 116 67% 116 59% 7.63 7.26
B4547 EB To A487 SB 1 1 0 0 -1 -100% -1 -100% 1.41 1.41
A487 NB To A4087 EB 203 230 161 178 -42 -21% -52 -23% 3.11 3.64
A487 NB To A487 NB 489 565 544 619 55 11% 54 10% 2.42 2.22
A487 NB To B4547 WB 4 5 0 0 -4 -100% -5 -100% 2.83 3.16
A5 WB To A5 WB 247 266 202 207 -45 -18% -59 -22% 3.00 3.84
A5 WB To A4081 168 191 200 227 32 19% 36 19% 2.36 2.49
A4080 To A5 WB 22 24 23 25 1 5% 1 4% 0.21 0.20
A4081 To A5 EB 166 190 155 176 -11 -7% -14 -7% 0.87 1.03

Wylfa Newydd Power Station App C2.04 - DCO TA Appendix I - VISSIM Model ResultsDevelopment Consent Order
Page 142
Location Observed Modelled Diff % Difference Diff % Difference GEH
Car Total Car Total Car Car Total Total Car Total
A5 EB To A4080 33 38 0 0 -33 -100% -38 -100% 8.12 8.72
A5 EB To A5 EB 235 271 180 198 -55 -23% -73 -27% 3.82 4.77
Lon Graig SB To A5 WB 23 25 55 61 32 139% 36 144% 5.12 5.49
Lon Graig SB To A5 EB 120 120 76 84 -44 -37% -36 -30% 4.44 3.56
A5 WB To Lon Graig NB 30 30 6 7 -24 -80% -23 -77% 5.66 5.35
A5 WB To A5 WB 392 432 347 374 -45 -11% -58 -13% 2.34 2.89
A5 EB To Lon Graig NB 73 90 65 75 -8 -11% -15 -17% 0.96 1.65
A5 EB To A5 EB 338 381 269 296 -69 -20% -85 -22% 3.96 4.62
A5 EB To A5 EB 96 108 7 7 -89 -93% -101 -94% 12.40 13.32
A5 EB To A5 WB 0 0 0 0 0 0% 0 0% 0.00 0.00
A5 EB To A5152 NB 139 163 223 258 84 60% 95 58% 6.24 6.55
A5 WB To A5 EB 0 0 0 0 0 0% 0 0% 0.00 0.00
A5 WB To A5 WB 116 128 56 62 -60 -52% -66 -52% 6.47 6.77
A5 WB To A5152 NB 60 70 29 34 -31 -52% -36 -51% 4.65 4.99
A5152 SB To A5 EB 65 76 43 47 -22 -34% -29 -38% 2.99 3.70
A5152 SB To A5 WB 175 217 250 302 75 43% 85 39% 5.14 5.28
A5152 SB To A5152 NB 0 0 0 0 0 0% 0 0% 0.00 0.00
A55 EB To A55 EB 499 582 512 607 13 3% 25 4% 0.58 1.03
A55 WB To A55 WB 551 681 656 787 105 19% 106 16% 4.27 3.91 89% 89% 86% 86%


![Wylfa Newydd Project · Revision: 1.0 Disposal Site Characterisation Report Document Reference Number: ML-OTH-01-DSC Revision: 1.0 [This page is intentionally blank] Page i Contents](https://img.dokumen.tips/doc/110x75/5f59862048c0bc4a6b49d722/wylfa-newydd-project-revision-10-disposal-site-characterisation-report-document.jpg)