Embed Size (px)
Citation preview

www.noc.ac.uk
Past and ongoing changes in the North Sea and its interface regions
John Huthnance, Ralf Weisse and NOSCCA team
NOSCCATemperature, salinity, stratification; circulationSea level, surges, wavesCarbon/pH, oxygenSPM, morphology, Wadden Sea; iceSummary conclusions

Part of NOSCCA Chapter 2
Ch 2 - Past and current climate change - includesAtmosphere; North Sea; Hydrology and Vegetation
North Sea teamJohn Huthnance, Ralf Weisse;Thomas Wahl, Helmuth Thomas, Julie Pietrzak, Alex Souza,
Sytze van Heteren, Natalija Schmelzer, Justus van Beusekom;Franciscus Colijn, Ivan Haigh, Solfrid Hjøllo, Jürgen Holfort, Liz Kent,
Wilfried Kühn, Peter Loewe, Ina Lorkowski, Kjell-Arne Mork, Johannes Pätsch, Markus Quante, Lesley Salt, John Siddorn,
Tim Smyth, Andreas Sterl, Philip Woodworth

North Sea past and ongoing - Scope
OSPAR greater North Sea to 5°W, 61°N
temperature, salinity and stratification;
currents and circulation;
mean sea level, extreme sea levels (contributions from wind generated waves and storm surges);
CO2, pH and nutrients; oxygen;
suspended matter and turbidity;
sedimentation, morphology and coastal erosion
sea ice; Wadden Sea.
“past and ongoing”: 200 years up to the present.

Temperature trend
North Sea averaged SST annual anomalies, 1870-2013 c.f. 1971-2000 (Elizabeth Kent)
Annual and seasonal mean North Sea heat content / 107J/m3 1950-2007 (Meyer et al. 2011)

Temperature linear trend distributions
SST trends (°C/decade) 1983‑2012 from HadISST1 (Dye et al. 2013)
(L to R) 1985–2004 model near-bed temperature, satellite SST, 2 m ERA40 air temperature (Holt et al. 2012)

SalinityLinear trend / decade, winter bottom salinity, from IBTS Q1 1971-2012 (Dye et al. 2013)
Winter bottom salinity from IBTS at Viking Bank, Dogger Bank and German Bight, & annual mean salinity, Helgoland Roads (Holliday et al. 2010)
Stratification
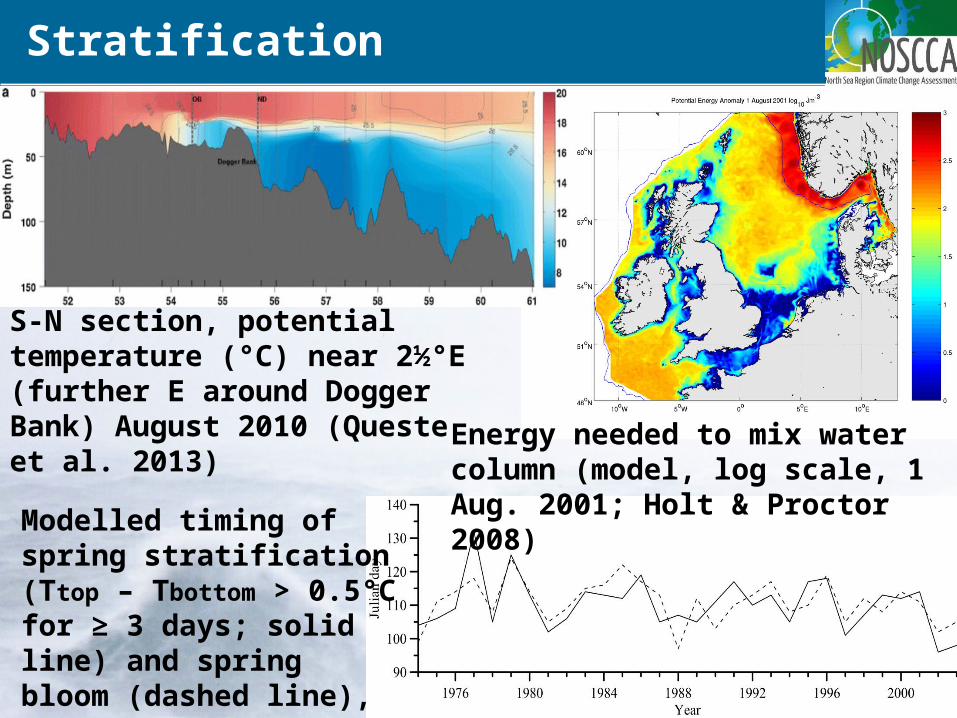
Energy needed to mix water column (model, log scale, 1 Aug. 2001; Holt & Proctor 2008)
S-N section, potential temperature (°C) near 2½°E (further E around Dogger Bank) August 2010 (Queste et al. 2013)
Modelled timing of spring stratification (Ttop – Tbottom > 0.5°C for ≥ 3 days; solid line) and spring bloom (dashed line), 1974-2003 in 60 m water near 1.4°W 56.2°N (Sharples et al. 2006)

Currents / Circulation
Multiple forcings → various time & space scalesMeasurements sparse c.f. short scales→ trends less significant, hard to discern or diagnose causesReliance on modelsImprovements wanted (models & observations) (√ tides, surges)
L: transport EOF1 (75.8% of variability) from 1962-2004 simulation (Emeis et al. 2014).
R: EOF1 time series (red), NAO index (blue; Hurrell et al. 2013)

Mean and high sea levelsConsiderable inter-annual and decadal variability in waves
(Upper inset) MSL index for Inner North Sea (black) & non-linear SSA smoothed (red); (lower inset) MSL index for the Channel (black) & non-linear SSA smoothed (red); Wahl et al. (2013); (colour) Standard deviation from de-trended annual MSL time series;
(Bottom) Cuxhaven annual mean high water and linear trend (m), 1843-2012; (Top) annual 99-percentile of high-tide levels at Cuxhaven after subtracting linear trend in annual mean; 11-year running mean is shown (red). After von Storch and Reichardt (1997).

carbon, oxygen
Surface DIC, August / September 2001, 2005, 2008 (Salt et al. 2013); anomalies relative to the average (bottom right). (Helmuth Thomas)
Simulations show enhanced CO2 uptake as atmospheric pCO2 increases, acidifying the North Sea (Lorkowski et al. 2012).
August 2010 bottom 3 m oxygen saturation (%) & 70 % saturation contour (Queste et al. 2013)
-50 0 50
DIC anomaly (2001) [mmol kg-1 ]
a)
5šW
5šW
0š
0š
5šE
5šE
10šE
10šE
50šN 50šN
55šN 55šN
60šN 60šN
-50 0 50
DIC anomaly (2005) [mmol kg-1 ]
b)
5šW
5šW
0š
0š
5šE
5šE
10šE
10šE
50šN 50šN
55šN 55šN
60šN 60šN
-50 0 50
DIC anomaly (2008) [mmol kg-1 ]
c)
5šW
5šW
0š
0š
5šE
5šE
10šE
10šE
50šN 50šN
55šN 55šN
60šN 60šN
2100 2200
average DIC (2001/5/8) [mmol kg-1 ]
d)
5šW
5šW
0š
0š
5šE
5šE
10šE
10šE
50šN 50šN
55šN 55šN
60šN 60šN

Suspended Particulate Matter Varies with
SPM monthly averages from SeaWiFs, 1998 (Pietrzak et al. 2011) Inset pixel value colour bars (x-axis) & histograms (white, y-axis)
Tides
Waves
Stratified river flow season

Coastal erosion, sedimentation, morphology
Cliff-top retreat rates at Holderness calculated in three approximate-50-year periods. Areas defended in 2005 are in grey. Retreat rates vary within each zone. (Brown 2008)

Ice
German North Sea coast for 1897 to 2012: annual accumulated areal ice volume V(AΣ) = ∫(fractional area × thickness)dt (days). Update from http://www.bsh.de/de/Meeresdaten/Beobachtungen/Eis/Eiswinter2010_11.pdf
Wadden Sea
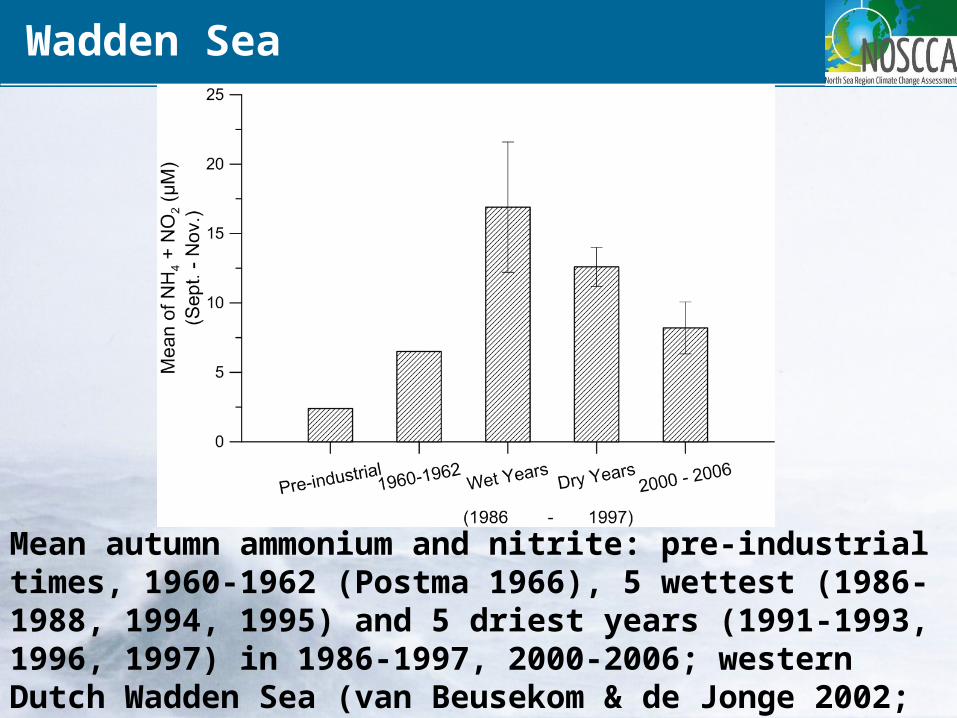
Mean autumn ammonium and nitrite: pre-industrial times, 1960-1962 (Postma 1966), 5 wettest (1986-1988, 1994, 1995) and 5 driest years (1991-1993, 1996, 1997) in 1986-1997, 2000-2006; western Dutch Wadden Sea (van Beusekom & de Jonge 2002; van Beusekom et al. 2009). Latter three with standard deviation.
Summary conclusions – no surprises! - strong evidence of warming, especially since the 1980s, despite temperature variability on all time-scales
- shorter-term variations in salinity > climate-related changes
- absolute mean sea level in the North Sea rose ~ 1.6 mm/year over the past 100-120 years
- extreme levels rose primarily because mean sea level rose
- net CO2 uptake from atmosphere
- North Sea is net nitrogen sink for the Atlantic
- suspended matter and turbidity are very variable
- coastal erosion is extensive but irregular.

www.noc.ac.uk
Thank you for your attention
National Oceanography CentreJoseph Proudman Building
6 Brownlow Street, Liverpool, L3 5DA.
Tel: +44 (0)151 795 4800
National Oceanography CentreUniversity of Southampton Waterfront Campus
European Way, Southampton, SO14 3ZH.
Tel: +44 (0)23 8059 6666