Embed Size (px)
Citation preview

1
InfoVis Evaluation
CS 7450 - Information Visualization
November 23, 2015
John Stasko
Area Focus
• Most of the research in InfoVis that we’ve learned about this semester has been the introduction of a new visualization technique or tool
Fisheyes, cone trees, hyperbolic displays, tilebars, themescapes, sunburst, jazz, …
“Isn’t my new visualization cool?…”
2Fall 2015 CS 7450

2
Evaluation – Why?
• Reasons?
3Fall 2015 CS 7450
Evaluation – Why?
• Want to learn what aspects of visualizations or systems “works”
• Want to ensure that methods are improving
• Want to insure that technique actually helps people and isn’t just “cool”
• NOT: Because I need that section in my paper to get it accepted … sigh
4Fall 2015 CS 7450

3
Evaluation – How?
• What do we measure?
What data do we gather?
What metrics do we use?
• What evaluation techniques should we use?
• (Channel your HCI knowledge)
5Fall 2015 CS 7450
Evaluation in HCI
• Takes many different forms
Qualitative, quantitative, objective, subjective, controlled experiments, interpretive observations, …
• So, which ones are best for evaluating InfoVis systems?
6Fall 2015 CS 7450
4
Controlled Experiments
• Good for measuring performance or comparing multiple techniques
• Often quantitative in nature
• What do we measure?
Performance, time, errors, …
• Strengths, weaknesses?
7Fall 2015 CS 7450
Subjective Assessments
• Often observational with interview
• Learn people’s subjective views on tool
Was it enjoyable, confusing, fun, difficult, …?
• This kind of personal judgment strongly influence use and adoption, sometimes even overcoming performance deficits
• Strengths, weaknesses?
8Fall 2015 CS 7450
5
Running Studies
• Beyond our scope here
• You should learn more about this in CS 6750 or 6455
9Fall 2015 CS 7450
Evaluating UI vs. InfoVis
• Seems comparable but…
• What are some differences?
10Fall 2015 CS 7450

6
Usability vs. Utility
• Big difference
• Usability is not the same as utility, which seems to be a key factor for InfoVis
• Can think of visualizations that are very usable but not useful or helpful
• More difficult to measure success of an infovis because more domain knowledge and situated use is required
11Fall 2015 CS 7450
Evaluating InfoVis in General
• Very difficult in InfoVis to compare “apples to apples”
Hard to compare System A to System B
Different tools were built to address different user tasks
• UI can heavily influence utility and value of visualization technique
12Fall 2015 CS 7450

7
Exercise
• Evaluate your project system
Fall 2015 CS 7450 13
BELIV
Workshop focused on this topic
Nicelocations!
14Fall 2015 CS 7450

8
Evaluating InfoVis
• Three nice overview papers
Plaisant, AVI ‘04
Carpendale, book chapter ‘08
Lam, et al, TVCG ‘12
Fall 2015 CS 7450 15
Plaisant ‘04
• Discusses challenges,possible next steps,and gives examplesfrom work atMaryland
16Fall 2015 CS 7450
9
Evaluation Challenges
• Matching tools with users, tasks, and real problems
• Improving user testing
Looking at the same data from different perspectives, over a long time
Answering questions you didn’t know you had
Factoring in the chances of discovery and the benefits of awareness
• Addressing universal usability
Fall 2015 CS 7450 17
Possible Next Steps
• Repositories of data and tasks
• Case studies and success stories
• The role of toolkits and development tools
Fall 2015 CS 7450 18

10
Carpendale ‘08
• Challenges in infovisevaluation
• Choosing an evaluationapproach
Fall 2015 CS 7450 19
Evaluation Approaches
• Desirable features
Generalizability
Precision
Realism
Fall 2015 CS 7450 20

11
Fall 2015 CS 7450 21
Quantitative Methods
• Laboratory experiments & studies
• Traditional empirical scientific experimental approach
• Steps
Fall 2015 CS 7450 22

12
Quantitative Challenges
• Conclusion Validity Is there a relationship?
• Internal Validity Is the relationship causal?
• Construct Validity Can we generalize to the constructs (ideas) the study
is based on?
• External Validity Can we generalize the study results to other
people/places/times?
• Ecological Validity Does the experimental situation reflect the type of
environment in which the results will be applied?
Fall 2015 CS 7450 23
Qualitative Methods
• Types
Nested methods
Experimenter observation, think-aloud protocol, collecting participant opinions
Inspection evaluation methods
Heuristics to judge
• Observational context
In situ, laboratory, participatory
Contextual interviews important
Fall 2015 CS 7450 24

13
Qualitative Challenges
• Sample sizes
• Subjectivity
• Analyzing qualitative data
Fall 2015 CS 7450 25
Lam, et al ‘12
• Meta-review: analysisof 850 infovis papers(361 with evaluation)
• Focus on evaluationscenarios
Fall 2015 CS 7450 26

14
Evaluation Taxonomies
Fall 2015 CS 7450 27
Evaluation Scenarios
• Understanding data analysis
Understanding environments and work practices (UWP)
Evaluating visual data analysis and reasoning (VDAR)
Evaluating communication through visualization (CTV)
Evaluating collaborative data analysis (CDA)
Fall 2015 CS 7450 28

15
Evaluation Scenarios
• Understanding visualizations
Evaluating user performance (UP)
Evaluating user experience (UE)
Evaluating visualization algorithms (VA)
Fall 2015 CS 7450 29
Methods
• Coded each paper with tags
Fall 2015 CS 7450 30
16
Methods
• For each category the authors describe
Goals and outputs
Evaluation questions
Methods and examples
Fall 2015 CS 7450 31
Example
• UWP - Understanding Environments and Work Practices
Elicit formal requirements for design
Study people for which a tool is being designed and the context of use
Very few infovis papers on this topic
Fall 2015 CS 7450 32

17
UWP 1
• Goals and Outputs
Goals: Understand the work, analysis, or info processing practices by a given group of people with or without software in use
Outputs: Design implications based on a more holistic understanding of current workflows and work practices, the conditions of the working environment, and potentially current tools in use
Fall 2015 CS 7450 33
UWP 2
• Evaluation questions What is the context of use of visualizations?
In which daily activities should the visualization tool be integrated?
What types of analyses should the visualization tool support?
What are the characteristics of the identified user group and work environments?
What data is currently used and what tasks are performed on it?
What klinds of visualizations are currently in use? How do they help to solve current tasks?
What challenges and usage barriers can we see for a visualization tool?
Fall 2015 CS 7450 34
18
UWP 3
• Methods and Examples
Field observation
Interviews
Laboratory observation
(with example projects cited)
Fall 2015 CS 7450 35
Examples
• Let’s examine example studies utilizing different goals and styles
36Fall 2015 CS 7450
19
Fall 2015 CS 7450
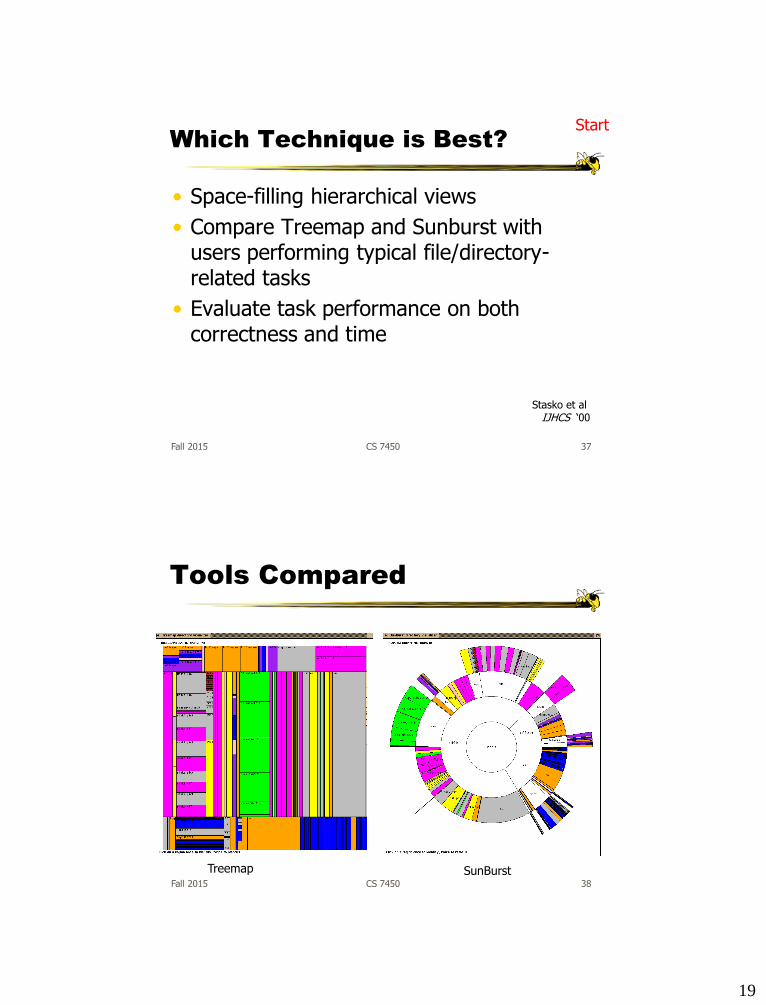
Which Technique is Best?
• Space-filling hierarchical views
• Compare Treemap and Sunburst with users performing typical file/directory-related tasks
• Evaluate task performance on both correctness and time
Stasko et al IJHCS ‘00
Start
37
Fall 2015 CS 7450
Tools Compared
Treemap SunBurst38
20
Fall 2015 CS 7450
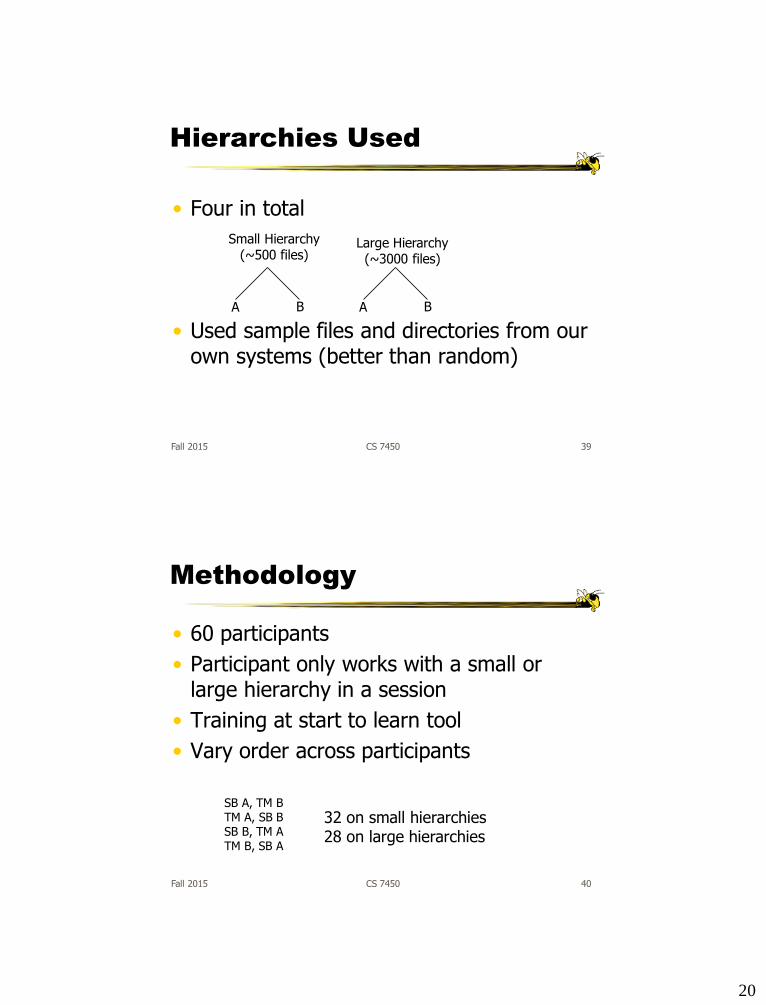
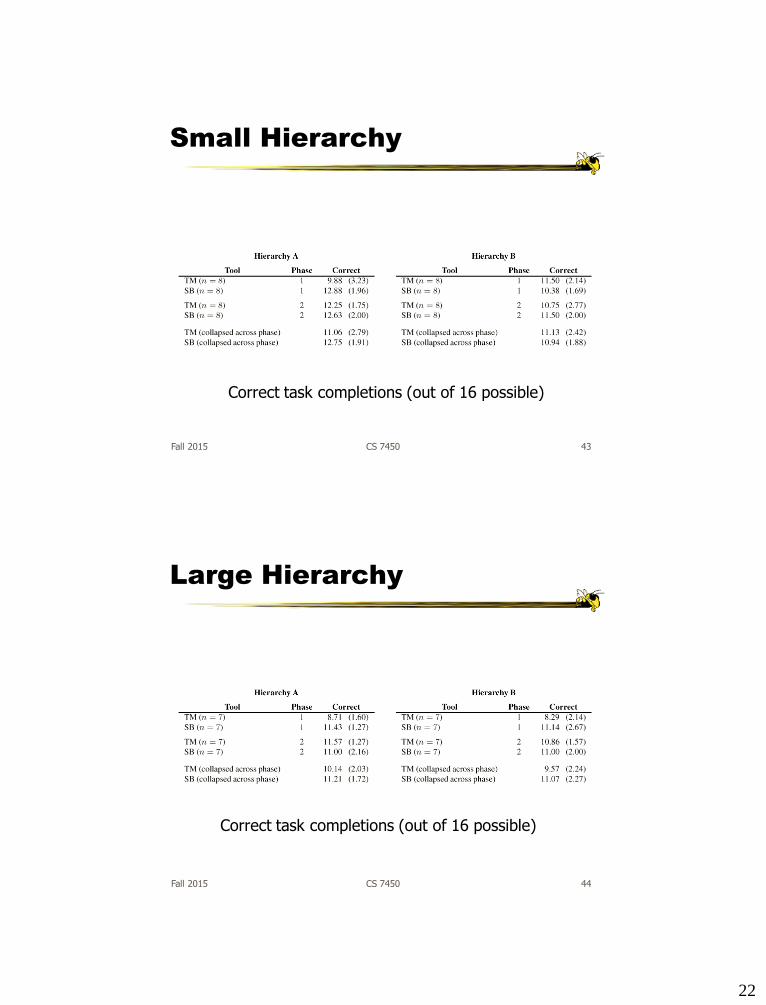
Hierarchies Used
• Four in total
• Used sample files and directories from our own systems (better than random)
Small Hierarchy(~500 files)
Large Hierarchy(~3000 files)
A B A B
39
Fall 2015 CS 7450
Methodology
• 60 participants
• Participant only works with a small or large hierarchy in a session
• Training at start to learn tool
• Vary order across participants
SB A, TM BTM A, SB BSB B, TM ATM B, SB A
32 on small hierarchies28 on large hierarchies
40
21
Fall 2015 CS 7450
Tasks
• Identification (naming or pointing out) of a file based on size, specifically, the largest and second largest files (Questions 1-2)
• Identification of a directory based on size, specifically, the largest (Q3) • Location (pointing out) of a file, given the entire path and name (Q4-7) • Location of a file, given only the file name (Q8-9)• Identification of the deepest subdirectory (Q10)• Identification of a directory containing files of a particular type (Q11) • Identification of a file based on type and size, specifically, the largest
file of a particular type (Q12)• Comparison of two files by size (Q13)• Location of two duplicated directory structures (Q14)• Comparison of two directories by size (Q15)• Comparison of two directories by number of files contained (Q16)
41
Fall 2015 CS 7450
Hypothesis
• Treemap will be better for comparing file sizes
Uses more of the area
• Sunburst would be better for searching files and understanding the structure
More explicit depiction of structure
• Sunburst would be preferred overall
42
22
Small Hierarchy
Correct task completions (out of 16 possible)
43Fall 2015 CS 7450
Large Hierarchy
Correct task completions (out of 16 possible)
44Fall 2015 CS 7450
23
Fall 2015 CS 7450
Performance Results
• Ordering effect for Treemap on large hierarchies
Participants did better after seeing SB first
• Performance was relatively mixed, trends favored Sunburst, but not clear-cut
Oodles of data!
45
Fall 2015 CS 7450
Subjective Preferences
• Subjective preference:SB (51), TM (9), unsure (1)
• People felt that TM was better for size tasks (not borne out by data)
• People felt that SB better for determining which directories inside others
Identified it as being better for structure
46

24
Fall 2015 CS 7450
Strategies
• How a person searched for files etc. mattered
Jump out to total view, start looking
Go level by level
47
Animation Helpful?
• Examine whether animated bubble charts (a la Rosling and GapMinder) are beneficial for analysis and presentation
• Run an experiment to evaluate the effects of animation
Fall 2015 CS 7450
Robertson et alTVCG (InfoVis) ‘08
Start
48
25
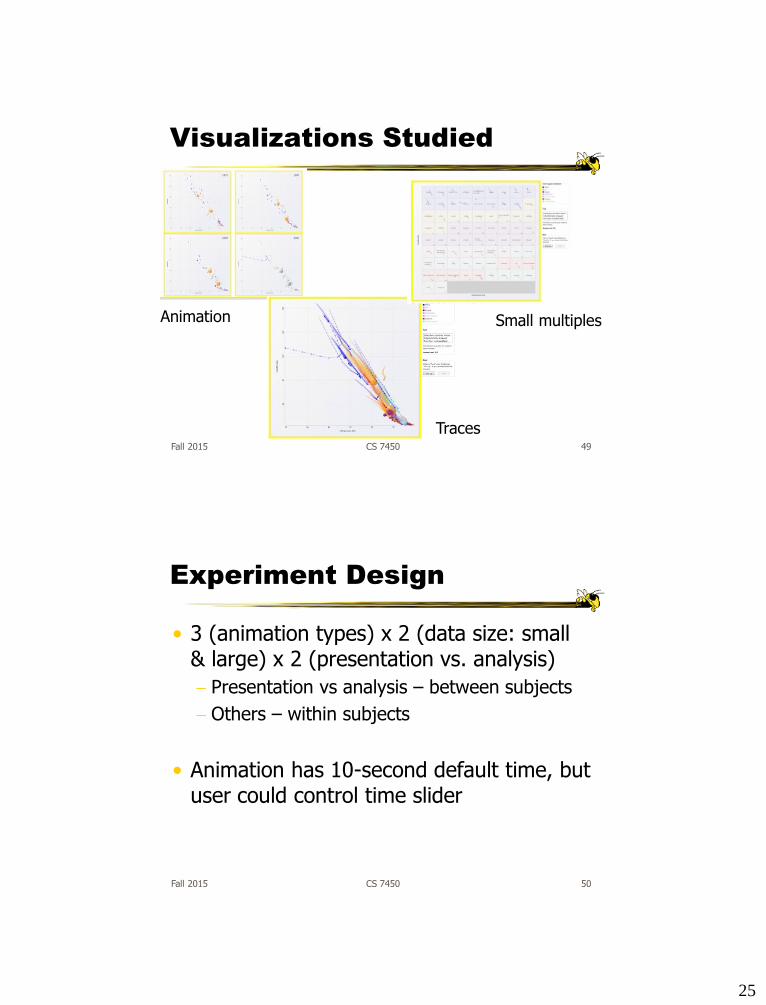
Visualizations Studied
Fall 2015 CS 7450
Animation
Traces
Small multiples
49
Experiment Design
• 3 (animation types) x 2 (data size: small & large) x 2 (presentation vs. analysis)
Presentation vs analysis – between subjects
Others – within subjects
• Animation has 10-second default time, but user could control time slider
Fall 2015 CS 7450 50

26
Experiment Design
• Data
UN data about countries
• Tasks
24 tasks, 1-3 requires answers per
Select 3 countries whose rate of energy consumption was faster than their rate of GDP per capita growth
Select 2 countries with significant decreases in energy consumption
Which continent had the least changes in GDP per capita
Fall 2015 CS 7450 51
Conditions
• Analysis – straightforward, interactive
• Presentation
6 participants at a time
Presenter described a trend relevant to task, but different
No interaction with system
In animation condition, participants saw last frame of animation (no interaction)
Fall 2015 CS 7450 52

27
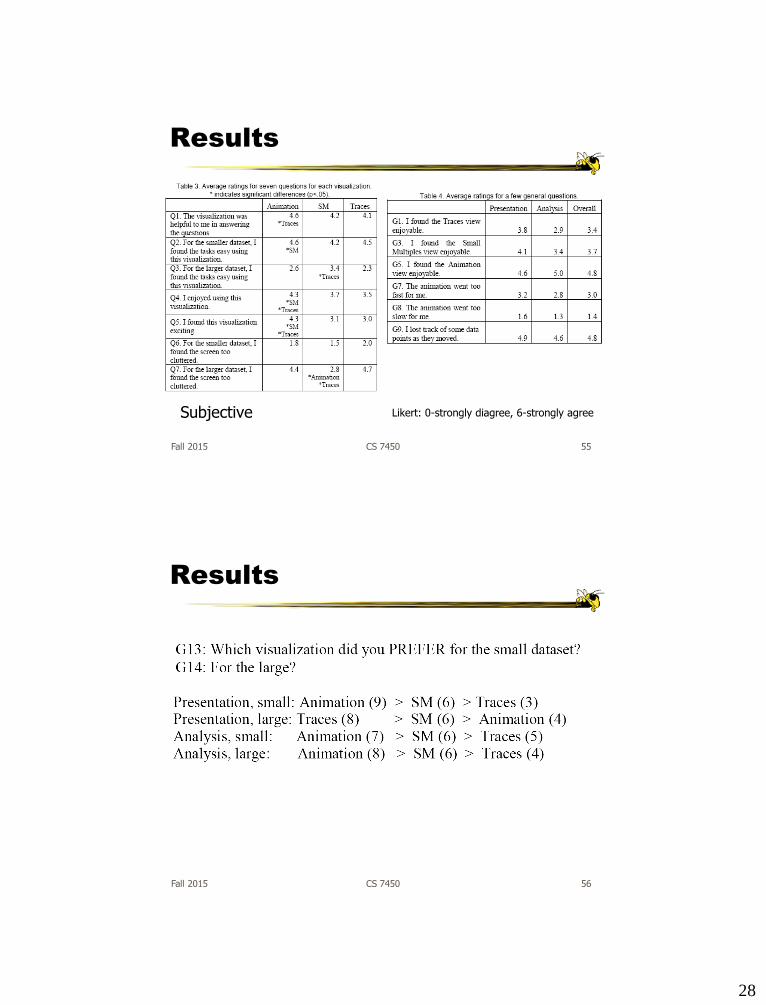
Results
• Accuracy
Fall 2015 CS 7450
Measured as percentage correct65% overall (pretty tough)
Significant:SM better than animationSmall data size more accurate than large
53
Results
• Speed
Presentation
Animation faster than small multiples & traces
15.8 secs vs. 25.3 secs vs. 27.8 secs.
Analysis
Animation slower than small multiples & traces
83.1 secs. vs. 45.69 secs. vs. 55.0 secs.
Fall 2015 CS 7450 54
28
Results
Fall 2015 CS 7450 55
Likert: 0-strongly diagree, 6-strongly agreeSubjective
Results
Fall 2015 CS 7450 56
29
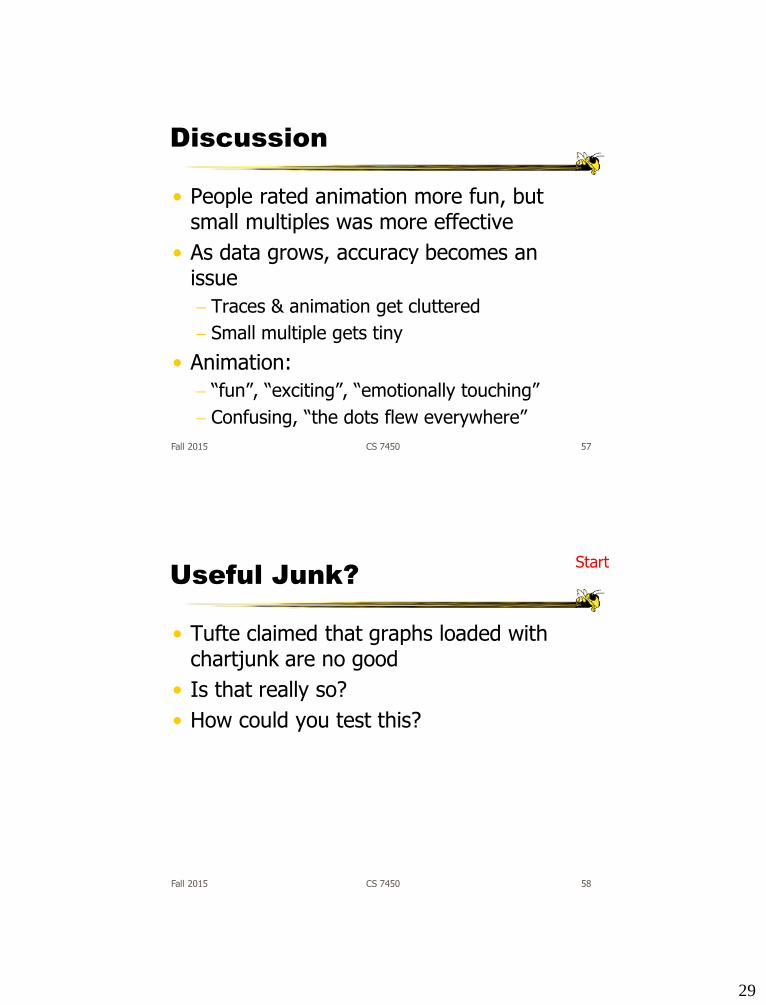
Discussion
• People rated animation more fun, but small multiples was more effective
• As data grows, accuracy becomes an issue
Traces & animation get cluttered
Small multiple gets tiny
• Animation:
“fun”, “exciting”, “emotionally touching”
Confusing, “the dots flew everywhere”
Fall 2015 CS 7450 57
Useful Junk?
• Tufte claimed that graphs loaded with chartjunk are no good
• Is that really so?
• How could you test this?
Fall 2015 CS 7450
Start
58

30
Comparing
Fall 2015 CS 7450
Bateman et alCHI ‘10
VS.
59
Methodology
• Two versions of each chart
• Participant sees one
Asked immediate interpretation accuracy questions
Asked similar questions again 5 minutes or 2-3 weeks later
Fall 2015 CS 7450
VS.
60
31
Results
• No significant difference in immediate interpretation accuracy, or after 5 minute gap
• After 2-3 week gap, recall of chart topic and details was significantly better for chartjunkgraphs
• Participants found the chartjunk graphs more attractive, enjoyed them more, and found them easiest and fastest to remember
Fall 2015 CS 7450 61
Caveats
• Small datasets
• “Normal” charts were really plain
• No interaction
• How about other added interpretations from the flowery visuals?
• Be careful reading too much into this
Fall 2015 CS 7450 62
32
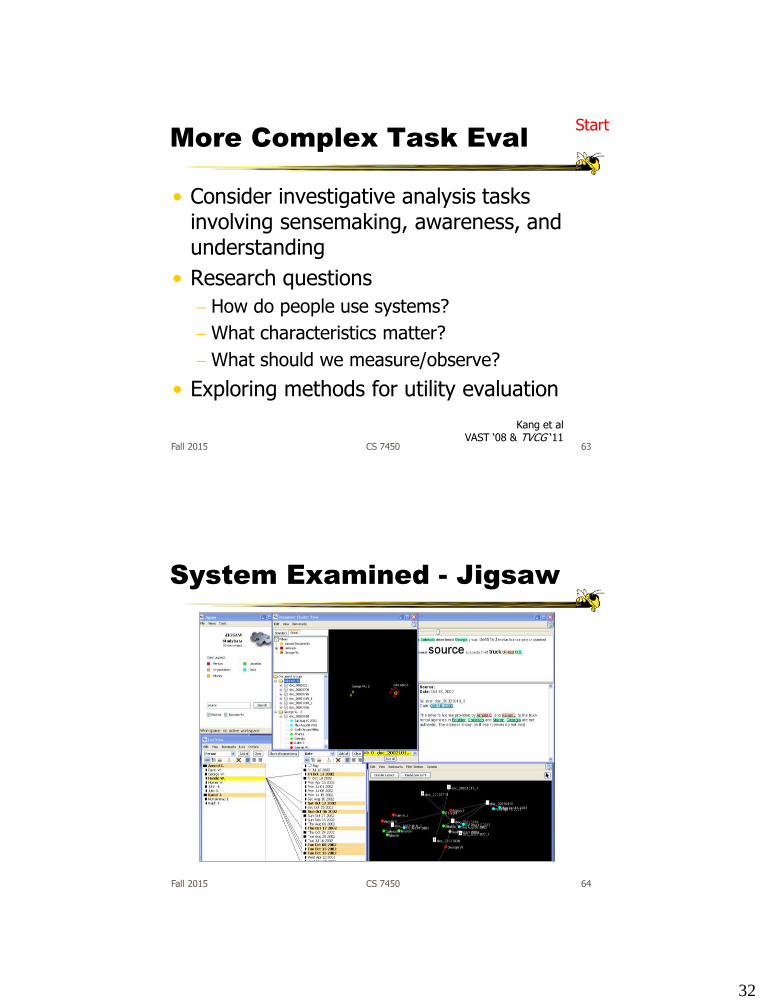
More Complex Task Eval
• Consider investigative analysis tasks involving sensemaking, awareness, and understanding
• Research questions
How do people use systems?
What characteristics matter?
What should we measure/observe?
• Exploring methods for utility evaluation
Kang et alVAST ‘08 & TVCG ‘11
Fall 2015 CS 7450 63
Start
System Examined - Jigsaw
Jigsaw’s Document View, Graph View, and List View.
Fall 2015 CS 7450 64

33
Study Design
• Task and dataset
50 simulated intelligence case reports
Each a few sentences long
23 were relevant to plot
Identify the threat & describe it in 90 minutes
Source: doc017Date: Oct 22, 2002
Abu H., who was released from custody after the September 11 incidents and whose fingerprints were found in the U-Haul truck rented by Arnold C. [see doc033] holds an Egyptian passport. He is now known to have spent six months in Afghanistan in the summer of 1999.
Fall 2015 CS 7450 65
Study Design - Settings
1: Paper
2: Desktop
3: Entity
4: Jigsaw
Fall 2015 CS 7450 66

34
Paper Desktop
Entity Jigsaw
Fall 2015 CS 7450 67
Performance Measures
• Task sheets (like VAST Contest) Three components (relevant people, events,
locations) +1 for correct items, -1 for a misidentified items
• Summary narrative Subjective grading from 1 (low) to 7 (high)
• Two external raters• Normalized, each part equal, mapped to 100-
point scale
Fall 2015 CS 7450 68

35
Results
Paper Desktop Entity Jigsaw
P1 P2 P3 P4 P5 P6 P7 P8 P9 P10 P11 P12 P13 P14 P15 P16
Final Score 22.87 65.00 24.26 87.08 62.08 67.13 42.13 29.41 52.23 15.00 29.26 81.19 95.05 58.07 75.20 90.00
Performance Fair Very
good
Fair Excel-
lent
Very
good
Very
good
Good Fair Good Poor Fair Excel-
lent
Excel-
lent
Good Very
good
Excel-
lent
Average
Score 49.80 50.19 44.42 79.59
Documents
Viewed
50 50 50 50 50 50 50 50 49 31 45 50 31 50 46 23
# of Queries 19 18 48 8 23 61 59 91 44 4 26 8
First Query 40:49 19:55 2:47 12:41 1:31 0:29 0:59 3:12 0:18 5:35 25:37 4:18
Amount of
Notes
Many None Many Some Many Some Few Some Some None None Few Some Few Few Few
First
Note Taking
0:07 0:05 0:16 1:53 19:57 2:47 8:20 2:37 3:14 0:48 0:32 5:15 78:45
First
Task Sheet
43:20 32:53 70:13 3:25 61:35 20:26 7:33 64:11 28:09 0:52 2:55 7:20 48:26 41:48 43:00 5:33
Fall 2015 CS 7450 69
Results
Paper Desktop Entity Jigsaw
P1 P2 P3 P4 P5 P6 P7 P8 P9 P10 P11 P12 P13 P14 P15 P16
Final Score 22.87 65.00 24.26 87.08 62.08 67.13 42.13 29.41 52.23 15.00 29.26 81.19 95.05 58.07 75.20 90.00
Performance Fair Very good
Fair Excel-lent
Very good
Very good
Good Fair Good Poor Fair Excel-lent
Excel-lent
Good Very good
Excel-lent
Average
Score 49.80 50.19 44.42 79.59
Documents
Viewed
50 50 50 50 50 50 50 50 49 31 45 50 31 50 46 23
# of Queries 19 18 48 8 23 61 59 91 44 4 26 8
First Query 40:49 19:55 2:47 12:41 1:31 0:29 0:59 3:12 0:18 5:35 25:37 4:18
Amount of
Notes
Many None Many Some Many Some Few Some Some None None Few Some Few Few Few
First
Note Taking
0:07 0:05 0:16 1:53 19:57 2:47 8:20 2:37 3:14 0:48 0:32 5:15 78:45
First
Task Sheet
43:20 32:53 70:13 3:25 61:35 20:26 7:33 64:11 28:09 0:52 2:55 7:20 48:26 41:48 43:00 5:33
Fall 2015 CS 7450 70
36
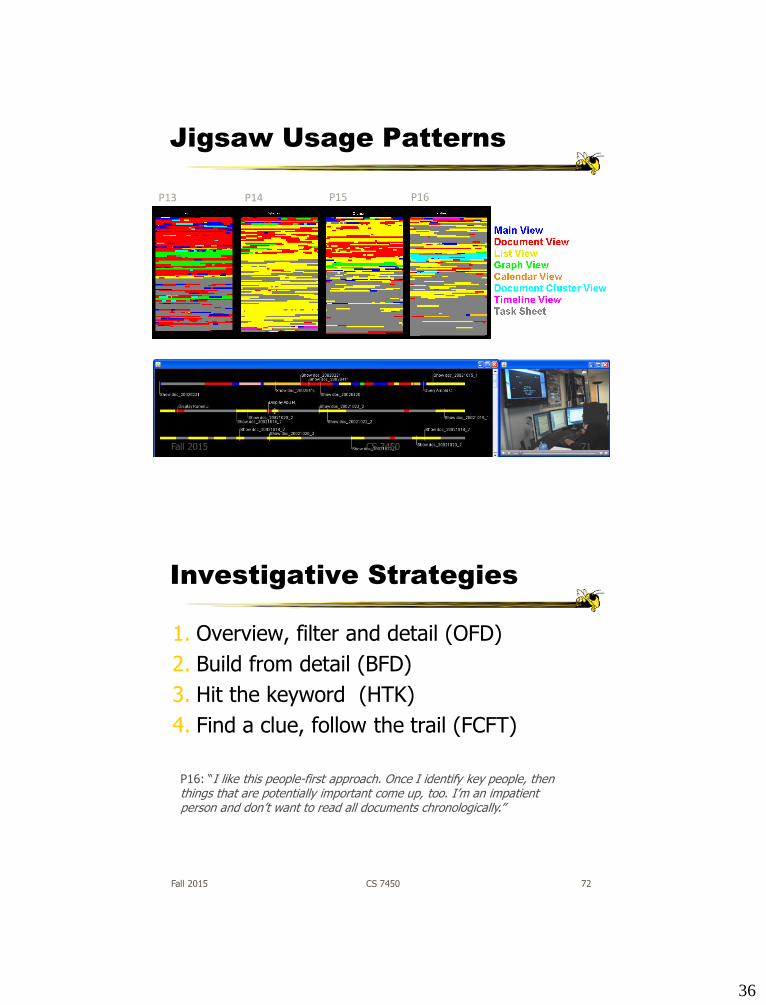
Jigsaw Usage Patterns
P13 P14 P16P15
Fall 2015 CS 7450 71
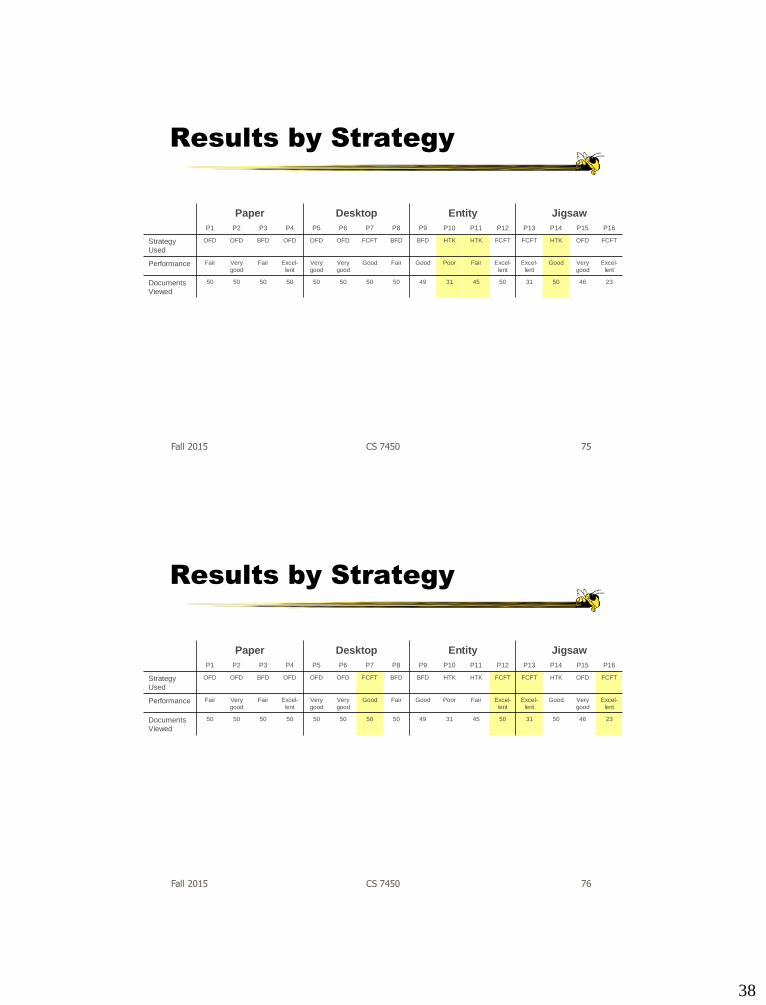
Investigative Strategies
1. Overview, filter and detail (OFD)
2. Build from detail (BFD)
3. Hit the keyword (HTK)
4. Find a clue, follow the trail (FCFT)
P16: “I like this people-first approach. Once I identify key people, then things that are potentially important come up, too. I’m an impatient person and don’t want to read all documents chronologically.”
Fall 2015 CS 7450 72

37
Results by Strategy
Paper Desktop Entity Jigsaw
P1 P2 P3 P4 P5 P6 P7 P8 P9 P10 P11 P12 P13 P14 P15 P16
Strategy
Used
OFD OFD BFD OFD OFD OFD FCFT BFD BFD HTK HTK FCFT FCFT HTK OFD FCFT
Performance Fair Very
good
Fair Excel-
lent
Very
good
Very
good
Good Fair Good Poor Fair Excel-
lent
Excel-
lent
Good Very
good
Excel-
lent
Documents
Viewed
50 50 50 50 50 50 50 50 49 31 45 50 31 50 46 23
Fall 2015 CS 7450 73
Results by Strategy
Paper Desktop Entity Jigsaw
P1 P2 P3 P4 P5 P6 P7 P8 P9 P10 P11 P12 P13 P14 P15 P16
Strategy
Used
OFD OFD BFD OFD OFD OFD FCFT BFD BFD HTK HTK FCFT FCFT HTK OFD FCFT
Performance Fair Very
good
Fair Excel-
lent
Very
good
Very
good
Good Fair Good Poor Fair Excel-
lent
Excel-
lent
Good Very
good
Excel-
lent
Documents
Viewed
50 50 50 50 50 50 50 50 49 31 45 50 31 50 46 23
Fall 2015 CS 7450 74
38
Results by Strategy
Paper Desktop Entity Jigsaw
P1 P2 P3 P4 P5 P6 P7 P8 P9 P10 P11 P12 P13 P14 P15 P16
Strategy
Used
OFD OFD BFD OFD OFD OFD FCFT BFD BFD HTK HTK FCFT FCFT HTK OFD FCFT
Performance Fair Very
good
Fair Excel-
lent
Very
good
Very
good
Good Fair Good Poor Fair Excel-
lent
Excel-
lent
Good Very
good
Excel-
lent
Documents
Viewed
50 50 50 50 50 50 50 50 49 31 45 50 31 50 46 23
Fall 2015 CS 7450 75
Results by Strategy
Paper Desktop Entity Jigsaw
P1 P2 P3 P4 P5 P6 P7 P8 P9 P10 P11 P12 P13 P14 P15 P16
Strategy
Used
OFD OFD BFD OFD OFD OFD FCFT BFD BFD HTK HTK FCFT FCFT HTK OFD FCFT
Performance Fair Very
good
Fair Excel-
lent
Very
good
Very
good
Good Fair Good Poor Fair Excel-
lent
Excel-
lent
Good Very
good
Excel-
lent
Documents
Viewed
50 50 50 50 50 50 50 50 49 31 45 50 31 50 46 23
Fall 2015 CS 7450 76
39
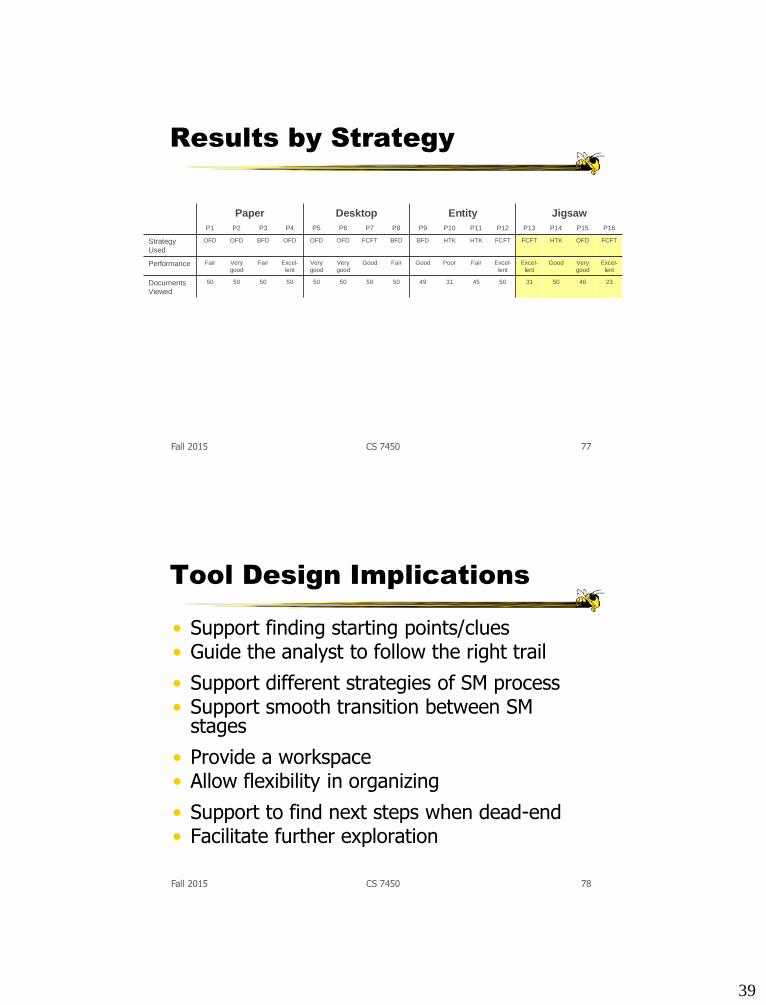
Results by Strategy
Paper Desktop Entity Jigsaw
P1 P2 P3 P4 P5 P6 P7 P8 P9 P10 P11 P12 P13 P14 P15 P16
Strategy
Used
OFD OFD BFD OFD OFD OFD FCFT BFD BFD HTK HTK FCFT FCFT HTK OFD FCFT
Performance Fair Very
good
Fair Excel-
lent
Very
good
Very
good
Good Fair Good Poor Fair Excel-
lent
Excel-
lent
Good Very
good
Excel-
lent
Documents
Viewed
50 50 50 50 50 50 50 50 49 31 45 50 31 50 46 23
Fall 2015 CS 7450 77
Tool Design Implications
• Support finding starting points/clues • Guide the analyst to follow the right trail
• Support different strategies of SM process• Support smooth transition between SM
stages
• Provide a workspace• Allow flexibility in organizing
• Support to find next steps when dead-end• Facilitate further exploration
Fall 2015 CS 7450 78
40
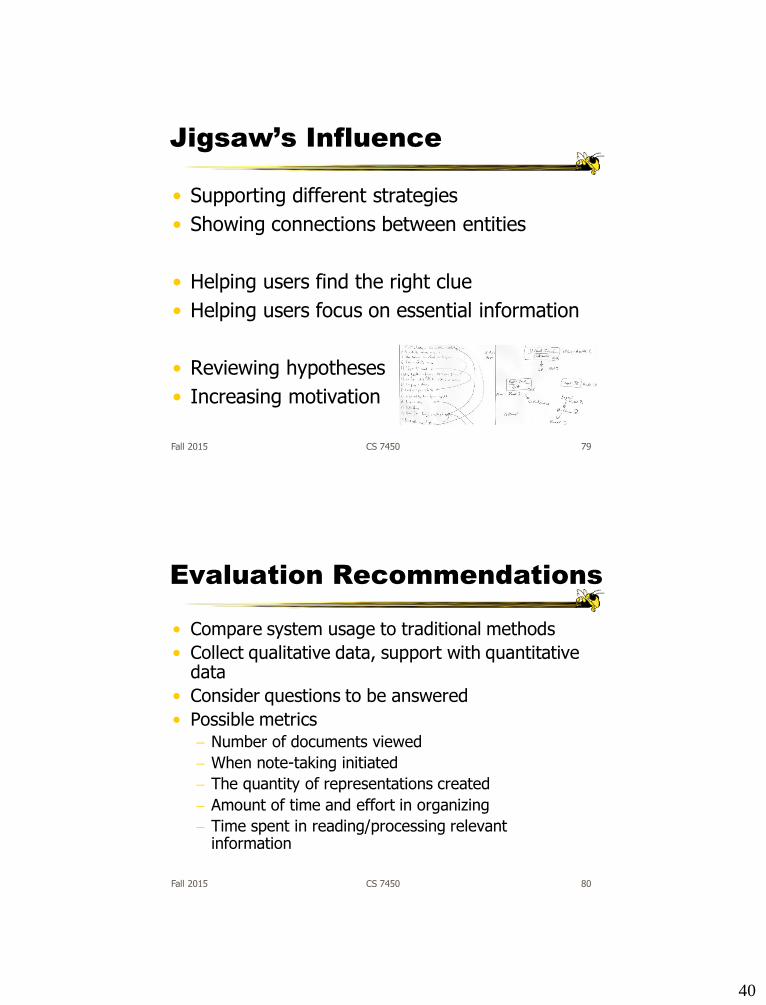
Jigsaw’s Influence
• Supporting different strategies
• Showing connections between entities
• Helping users find the right clue
• Helping users focus on essential information
• Reviewing hypotheses
• Increasing motivation
Fall 2015 CS 7450 79
Evaluation Recommendations
• Compare system usage to traditional methods
• Collect qualitative data, support with quantitative data
• Consider questions to be answered
• Possible metrics Number of documents viewed
When note-taking initiated
The quantity of representations created
Amount of time and effort in organizing
Time spent in reading/processing relevant information
Fall 2015 CS 7450 80
41
How to Evaluate Many Eyes?
• Two main evaluation papers written about system
• Studied use of system, visualizations being created, discussions about system, etc.
81Fall 2015 CS 7450
Start
Paper 1
• Case study of early use
• System uses
Visual analytics
Sociability
Generating personal and collective mirrors
Sending a message
Viégas et alHICSS ‘08
82Fall 2015 CS 7450

42
Use Characteristics
Data Topic/Area Percentage
Society 14.0
Economics 12.7
Obscured/Anon 12.4
Art & culture 10.8
Web & new media 10.3
Science 10.0
Test data 9.5
Politics 7.4
Technology 6.6
…
Comment Type Percentage
Observation 46.3
Question 15.8
Affirmation 13.7
Hypothesis 11.6
Socializing 11.6
System design 11.6
Data integrity 9.5
Testing 4.2
Tips 4.2
To do 4.2
83Fall 2015 CS 7450
Paper 2
• Interview-based study
• Individual phone interviews with 20 users
Lots of quotes in paper
• Bloggers vs. regular users
• Also includes stats from usage logs 3069 users
1472 users who uploaded data
5347 datasets
972 users who created visualizations
3449 visualizations
222 users who commented
1268 comments
Danis et alCHI ‘08
84Fall 2015 CS 7450

43
Findings
• User motivations
Analyzing data
Broadening the audience, sharing data
• Lots of collaborative discussion
Much off the ManyEyes site
• Concerns about data and other eyes
85Fall 2015 CS 7450
Specific to Infovis?
• How about evaluation techniques specifically focused on infovis?
Fall 2015 CS 7450 86
44
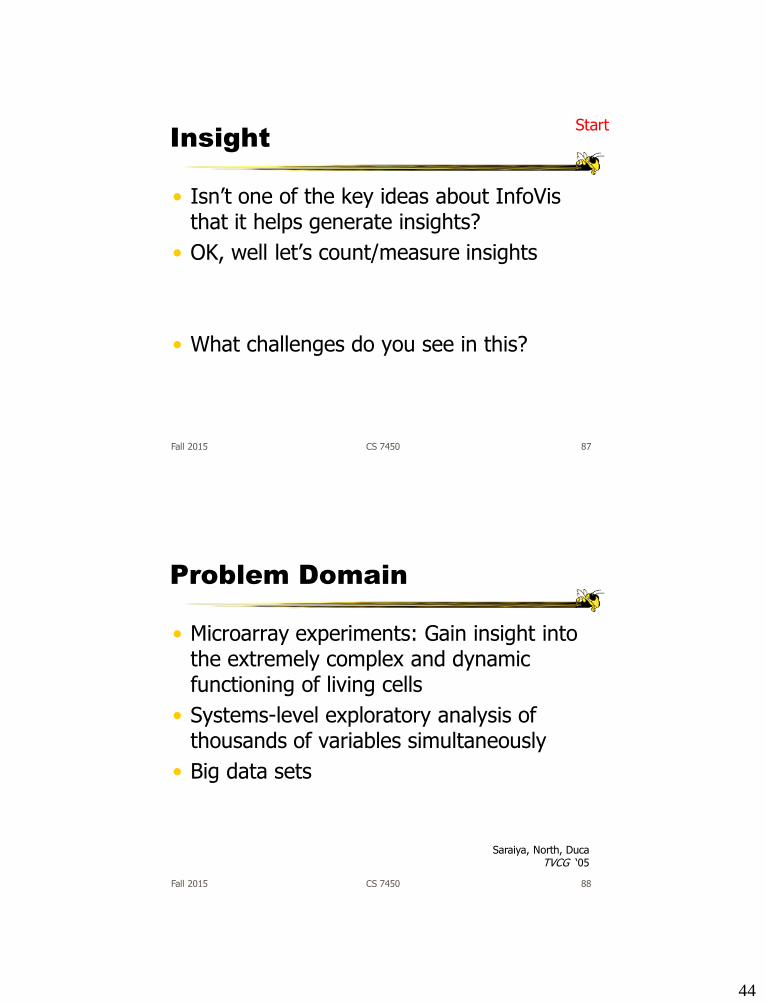
Insight
• Isn’t one of the key ideas about InfoVis that it helps generate insights?
• OK, well let’s count/measure insights
• What challenges do you see in this?
87Fall 2015 CS 7450
Start
Problem Domain
• Microarray experiments: Gain insight into the extremely complex and dynamic functioning of living cells
• Systems-level exploratory analysis of thousands of variables simultaneously
• Big data sets
88Fall 2015 CS 7450
Saraiya, North, DucaTVCG ‘05

45
Insight
• Insight: An individual observation about the data by the participant, a unit of discovery
• Characteristics
Observation
Time
Domain Value
Hypotheses
Directed vs Unexpected
Category
89Fall 2015 CS 7450
Insight Characteristics
• Complex Involving large amounts of data in a synergistic way
• Deep Builds over time, generates further questions
• Qualitative Can be uncertain and subjective
• Unexpected Often unpredictable, serendipitous
• Relevant Deeply embedded in data domain, connecting to
existing domain knowledge
Fall 2015 CS 7450 90
NorthCG&A ‘06
46
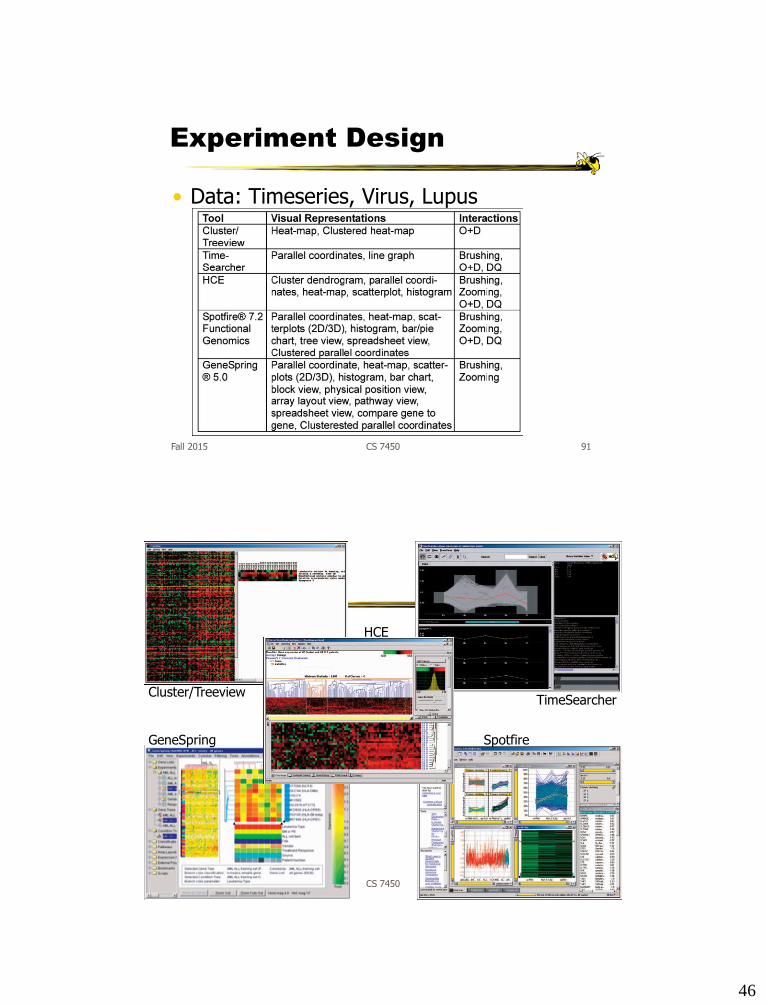
Experiment Design
• Data: Timeseries, Virus, Lupus
91Fall 2015 CS 7450
Fall 2015 CS 7450 9292
Spotfire
HCE
Cluster/Treeview
GeneSpring
TimeSearcher
47
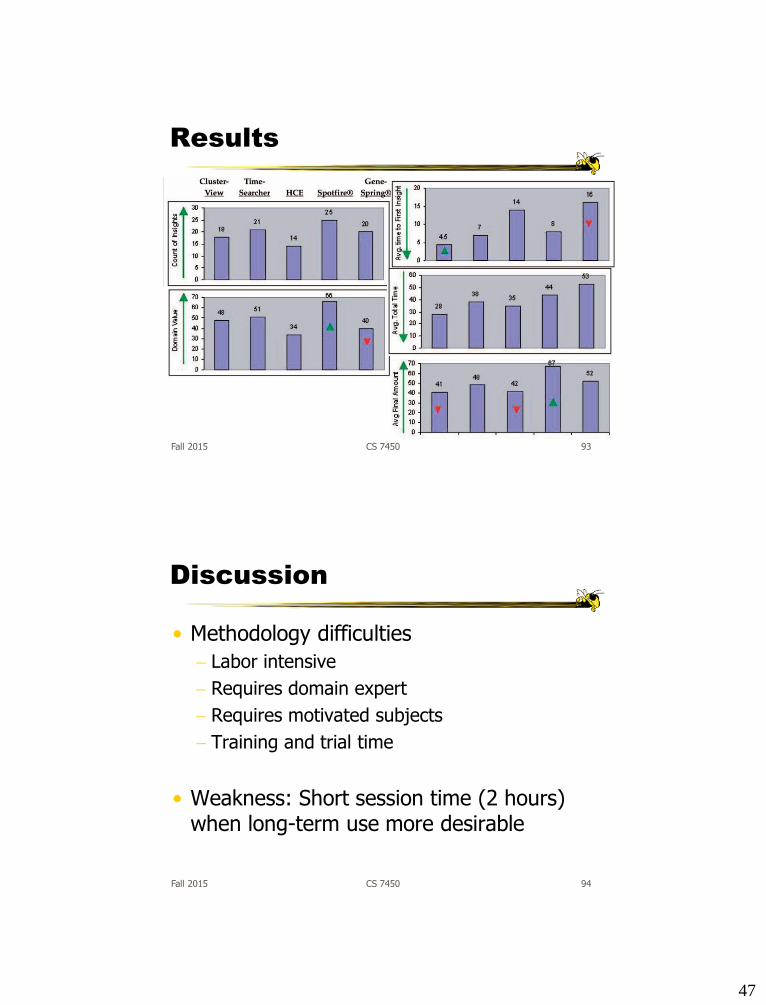
Results
93Fall 2015 CS 7450
Discussion
• Methodology difficulties
Labor intensive
Requires domain expert
Requires motivated subjects
Training and trial time
• Weakness: Short session time (2 hours) when long-term use more desirable
Fall 2015 CS 7450 94

48
Reconsidering Insight
• Insight with visualization
Is not spontaneous “aha!” moments (eg, in cognitive science)
Is knowledge-building and model-confirmation
Like a substance that people acquire with the aid of systems
Fall 2015 CS 7450 95
Chang et alCG&A ‘09
Start
Rethinking Methodology
• Do controlled lab experiments really tell us very much in information visualization?
Fall 2015 CS 7450 96

49
MILC Technique
• Multi-dimensional observations, interviews, surveys, logging
• In-depth intense engagement of researchers with domain
experts so as to almost become a partner
• Long-term longitudinal use leading to strategy changes
• Case Study detailed reporting about small number of people
working on their own problems in their own domain
Shneiderman & PlaisantBELIV ‘06
97Fall 2015 CS 7450
Start
Influences
• Ethnography
Preparation
Field study
Analysis
Reporting
98Fall 2015 CS 7450

50
Guidelines
• Specify focused research questions & goals
• Identify 3-5 users
• Document current method/tool
• Determine what would constitute professional success for users
• Establish schedule of observation & interviews
• Instrument tool to record usage data
• Provide attractive log book for comments, problems, and insights
• Provide training
• Conduct visits & interviews
• Encourage users to continue using best tool for task
• Modify tool as needed
• Document successes and failures
99Fall 2015 CS 7450
SocialAction
• Evaluation inspired byMILC ideas goals
Interview (1 hour)
Training (2 hours)
Early use (2-4 weeks)
Mature use (2-4 weeks)
Outcome (1 hour)
Perer & ShneidermanCHI ‘08
100Fall 2015 CS 7450
Start

51
Methodology
• Four case studies
Senatorial voting patterns
Medical research knowledge discovery
Hospital trustee networks
Group dynamics in terrorist networks
• Named names
I like it!
• Tell what they did with system
101Fall 2015 CS 7450
My Reflections
• Nice paper
• Stark contrast to comparative, controlled experiments
• We likely need more of this in InfoVis
102Fall 2015 CS 7450

52
Value & Evaluation
• Many small, controlled experiment user studies don’t adequately assess true utility of a visualization
• Alternative: Detailed usage scenarios with identification of system’s value along four dimensions
Fall 2015 CS 7450 103
StaskoBELIV ‘14
Start
Value Definition
104
Value = T E+ CI + +
Fall 2015 CS 7450

53
Value Definition
105
Value = T E+ CI + +
Ability to minimize the total time needed toanswer a wide variety of questions about the data
(Without formal queries, Interaction really helps)
Fall 2015 CS 7450
Value Definition
106
Value = T E+ CI + +Ability to spur and discover insights or insightful questions about the data
(Would be very difficult with only the data)
Fall 2015 CS 7450
54
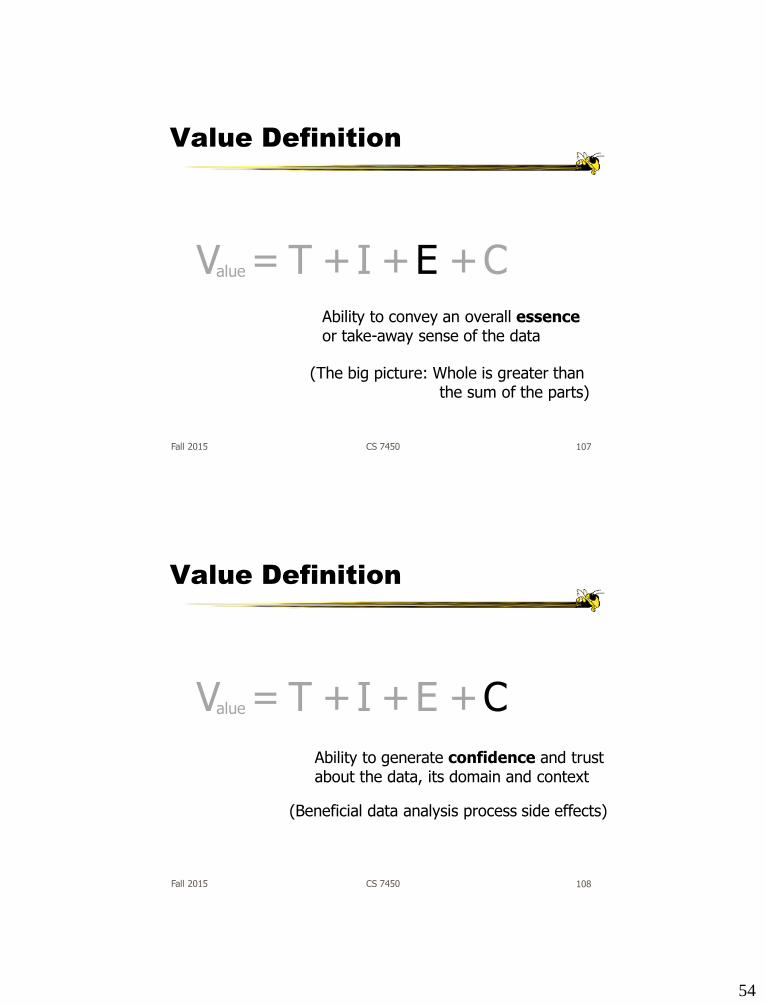
Value Definition
107
Value = T E+ CI + +Ability to convey an overall essenceor take-away sense of the data
(The big picture: Whole is greater thanthe sum of the parts)
Fall 2015 CS 7450
Value Definition
108
Value = T E+ CI + +
Ability to generate confidence and trustabout the data, its domain and context
(Beneficial data analysis process side effects)
Fall 2015 CS 7450
55
Recommendation
• Provide one or more case studies that illustrate how a system/technique contributes along each of these four dimensions
• Explain how the system will provide value and utility in data analysis situations
Fall 2015 CS 7450 109
Summary
• Why do evaluation of InfoVis systems?
We need to be sure that new techniques are really better than old ones
We need to know the strengths and weaknesses of each tool; know when to use which tool
110Fall 2015 CS 7450

56
Challenges
• There are no standard benchmark tests or methodologies to help guide researchers
Moreover, there’s simply no one correct way to evaluate
• Defining the tasks is crucial
Would be nice to have a good task taxonomy
Data sets used might influence results
• What about individual differences?
Can you measure abilities (cognitive, visual, etc.) of participants?
111Fall 2015 CS 7450
Challenges
• Insight is important
Great idea, but difficult to measure
• Utility is a real key
Usability matters, but some powerful systems may be difficult to learn and use
• Exploration
InfoVis most useful in exploratory scenarios when you don’t know what task or goal is
So how to measure that?!
112Fall 2015 CS 7450

57
Exam Preview
• Course concepts
Class, readings, assignments
• Short answer questions
Define x
Explain y
Critique a vis
Design a vis
Fall 2015 CS 7450 113
Fall 2015 CS 7450
Upcoming
• Review & recap
Reading
Few chapter 13
Heer et al ’10
114