Embed Size (px)
Citation preview

REPORT
IND
2013
LOW CARBON GROWTH POLICY TRACKER
FOR INDIAN STATES
A
B
C
D
E
F
G
Technical Partner
EXECUTIVE SUMMARY
An initiative supported by

© WWF-India 2013
Published by WWF-India
Any reproduction in full or part of this publication must mention the title and credit the above mentioned publisher as the copyright owner.
Acknowledgments
WWF-India expresses its gratitude and acknowledges the effort put in by several teams and individuals in the production of this report. We are extremely grateful to all the stakeholders from different organizations who provided useful suggestions and inputs during the various meetings and interactions held during the course of the study. The authors express their grateful thanks to the team of Ernst & Young LLP, India for providing their services related to technical assistance in research, analysis and preparation of the report. Special thanks are due to Kunal Sharma and Sriya Mohanti from Shakti Sustainable Energy Foundation, and Murli Dhar, Sumit Roy, Abhishek Nath, Shilpa Naryal and other colleagues from WWF-India for their feedback and support. We would also like to convey our gratitude to Mr. Ravi Singh and Dr. Sejal Worah for their overall support and encouragement.
Project Team
WWF-India: T.S. Panwar, Kadambari Yadav
Copy Editor
Pallavi Shah
Disclaimer
This report has been prepared by WWF-India with inputs, based on publicly available information only, from Ernst & Young LLP, India. Ernst & Young LLP, India has not independently verifi ed the information gathered or contained in this report and, accordingly expressed no opinions or makes any representations concerning its accuracy or complete reliability or suffi ciency. The recipients should carry out their own due diligence in respect of Ernst & Young LLP, India inputs in the report. WWF-India, Shakti Sustainable Energy Foundation and Ernst & Young LLP, India disclaims any and all liability for, or based on or relating to any such information and/or contained in, or errors in or omissions from, their inputs or information in this report.

© G
LOB
AL
WA
RM
ING
IMA
GE
S /
WW
F-C
AN
ON
"India will reduce the emissions intensity of its GDP by
20-25 percent over the 2005 levels by
the year 2020" Source: Government of India

2
EXECUTIVE SUMMARY
India’s resolve to reduce its emission intensity by 20-25 per cent by 2020 as compared to the levels in 2005 is enthusiastic as well as challenging. In order to ensure that the Indian economy, while meeting its development objectives, also pursues a sustainable development pathway, it is important to analyze the effectiveness of low-carbon growth policies and track their development.
This study has been undertaken with the objective of developing a Low-Carbon Growth Policy Tracker that will assess the impact of state-level low-carbon policies in Indian states. For this purpose, a sample of 10 selected states has been analyzed, and a tracker has been developed to map the performance and progress of state policies that directly or indirectly affect the low-carbon growth of these states. The specific objectives of the study are as follows:
Develop a methodology and mechanism to track each state’s progress in designing and implementing policies that enhance low-carbon transformation
Stimulate positive action by comparing and encouraging leading practices
Encourage policies that promote overall low-carbon transformation and development at the state level
The Low-Carbon Growth Policy Tracker provides an overview of the assessment of different policies across economic sectors: power, industry, transport, buildings, waste, forestry and agriculture. The assessment presents the current status of low-carbon growth of the 10 sample states and aims to provide direction for the development of a low-carbon growth pathway based on inter-state learning and the identification of best practices in the sectors. This provides a flexible mechanism to the states for assessing their developmental priorities and for designing their policies in terms of coverage, implementation and the overall impact on all sectors. The result of the tracker highlights that there is scope for improvement in each state, including those that are rated by the tracker as top performers on account of their current policy practices. Facilitating inter-state learning from leading practices is a key feature of the study, which will help in the movement towards overall low-carbon growth.
Methodology
While developing this report a comprehensive review of various policies/initiatives that affect emissions of greenhouse gases in the selected 10 states1 was undertaken. The review has been done to provide an overview of the policy scenario in each state; the overview has been further classified into sub-sectors and policy enablers. Stakeholder consultations were carried out at various stages of the study to finalize the methodology. Interim consultation workshops were also held with some of the key stakeholders to discuss the initial findings.
1 The methodology for state selection has been developed based on sector relevance for low-carbon growth in the select representative states and the overarching criteria for low-carbon development, such as adminis-trative and policy support, geographical representation, and proactive climate change policies.

3
The framework for the study covers eight sectors and three policy enabler areas, as presented below.
The policies that influence low-carbon growth across the above sectors and are available in the public domain have been analyzed for the selected states.
The tracker has provisioned for a ‘General’ sector under which the overarching and proactive support from the states towards low-carbon policy initiatives has been captured.
The three main policy enabler areas have been covered under the heads of ‘Renewables’, ‘Energy efficiency’ and ‘Overarching’. The Overarching policy enabler head includes all measures aimed at other emission-reduction options apart from renewable and energy-efficiency initiatives, such as a modal shift in transport, green tax, budget allocation for clean energy, subsidies, etc.
GENERAL
POWER
INDUSTRY
BUILDINGS
TRANSPORT
WASTE
AGRICULTURE
FORESTRY
OV
ER
AR
CH
ING
EN
ER
GY
EF
FIC
IEN
CY
RE
NE
WA
BL
ES

4
A list of specific indicators (both quantitative and qualitative) has been developed for each sector. These indicators are used to assess the state’s policies and provide a score to the state with respect to the developed benchmarks. This provides an index of the state’s progress toward low-carbon policy development across each of the study sectors. These benchmarks have been developed by assessing the status of the indicator at the national level and comparing the progress of the states against these national benchmark values. Each of the developed sectoral indicators has been distributed among the policy enabler areas. The sectoral scores for each state is then aggregated and an overall state-level rating assigned2.
A snapshot of the approach adopted for assessing the progress in low-carbon policies across the states is depicted as follows:
2 This approach can be further refi ned if state-specifi c GHG emission contributions are available for the sec-tors. In such a case, the state-specifi c sectoral GHG contribution can be directly used to provide weightage to sectoral scores of the particular state. Sector weightage based on emission share has not been assigned in the current methodology.
STEP 1Stating the low carbon growth vision for India across different study sectors
STEP 2Review of policy & regulatory documentation at central & state level to develop sector level policy package that shall become the benchmark against which state policies get assessed
STEP 3Development of comprehensive list of sector indicators and their scoring methodology for each indicator
STEP 4Evaluation of each state’s policies against the developed indicators and their respective benchmarks; aggregation of indicator scores to arrive at consolidated sectoral score
STEP 5Sectoral trends mapped across states to provide low carbon development ratings to states per sector; aggregation of state's sectoral ratings to derive overall state rating

5
The rating criteria used in the tracker are depicted in the following figure:
Rating Band and Colour Code
A B C D E F G
Normalized score on a scale of 0 to 100
90 <= 100 75 <= 90 60 <= 75 45 <= 60 30 <= 45 15 <= 30 0 <= 15
Key aspects the methodology takes into account:
Overall assessment of a state’s actions towards low-carbon policies Sector-wise assessment of the state’s low-carbon policies Overall set of leading practices adopted by various states across sectors, in the
respective policy enabler areas
Main Findings
Using the methodology described in the section above, scores were assigned to the states for their performance on policies related to low-carbon transformation. The overall assessment of the states’ actions towards low-carbon policies across all sectors, is presented below:
Overall tracker scorecard
A
B
C
D
E
F
G
Delhi
Himachal Pradesh
Rajasthan
Gujarat Madhya Pradesh
Arunachal Pradesh
Maharashtra
Tamil Nadu
Andhra Pradesh
Karnataka
A B C D E F G

6
Sect
or-w
ise
Scor
e of
the
Stat
es
Rat
ing
Pow
erIn
dust
ryB
uild
ings
Tran
spor
t Fo
rest
ryW
aste
Agr
icul
ture
Gen
eral
Tam
il N
adu
A
ndhr
a Pr
ades
hM
adhy
a Pr
ades
h
Raj
asth
an
Mad
hya
Prad
esh,
A
ndhr
a Pr
ades
h,
Him
acha
l Pra
desh
, M
ahar
asht
ra
H
imac
hal
Prad
esh,
Tam
il N
adu
Raj
asth
an,
Aru
nach
al
Prad
esh
And
hra
Prad
esh,
M
ahar
asht
ra,
Kar
nata
ka
Mah
aras
htra
, Ta
mil
Nad
uG
ujar
at, A
ndhr
a Pr
ades
h, T
amil
Nad
u
And
hra
Prad
esh,
M
ahar
asht
ra,
Tam
il N
adu,
K
arna
taka
, Del
hi,
A
ndhr
a Pr
ades
h,
Mah
aras
htra
, K
arna
taka
, Tam
il N
adu,
Guj
arat
Kar
nata
kaK
arna
taka
Raj
asth
an,
Guj
arat
, Tam
il N
adu
Him
acha
l Pra
desh
, R
ajas
than
, K
arna
taka
Mah
aras
htra
, K
arna
taka
Guj
arat
, M
adhy
a Pr
ades
h,
Raj
asth
an
Del
hi, R
ajas
than
Mad
hya
Prad
esh
Mad
hya
Prad
esh,
M
ahar
asht
ra,
Guj
arat
, Del
hi,
Aru
nach
al
Prad
esh
And
hra
Prad
esh,
D
elhi
Him
acha
l Pra
desh
Mad
hya
Prad
esh,
G
ujar
at, A
ndhr
a Pr
ades
h,
Aru
nach
al
Prad
esh
Mad
hya
Prad
esh,
D
elhi
, Him
acha
l Pr
ades
h
G
ujar
at,
Kar
nata
ka,
Aru
nach
al
Prad
esh
Del
hi, H
imac
hal
Prad
esh,
R
ajas
than
, A
runa
chal
Pr
ades
h
Raj
asth
anH
imac
hal
Prad
esh,
Guj
arat
, M
ahar
asht
ra
Aru
nach
al
Prad
esh,
Del
hi,
Mad
hya
Prad
esh
Del
hi
Him
acha
l Pra
desh
, A
runa
chal
Pr
ades
h
Ta
mil
Nad
u
Aru
nach
al
Prad
esh
A B C D E F G

7
Leading Practices Across Sectors
The section below summarizes the leading practices across sectors that have yielded positive results for the states in the analysis conducted in the study. This will help states identify key initiatives, which have resulted in low-carbon transformation in the other states, and offer a sector-specific approach to help achieve enhanced results. This section also recognizes some of the leading national-level policies, which are indirectly significant in assessing the sectors on the basis of the developed indicators.
SECTORS
POWER
3 http://planningcommission.nic.in/data/datatable/1705/fi nal_84.pdf
Setting judicious renewable energy tariffs: An effective way of reaching the grid parity for different renewable energy technologies is by basing renewable energy tariffs on the Average Power Purchase Cost (APPC) and technology viability cost. The Central Electricity Regulatory Commission (CERC) comparison of the APPC for renewable energy among the states has shown that Maharashtra, Andhra Pradesh, Tamil Nadu and Himachal Pradesh have the most feasible tariff structure for renewable energy.
Enforcing RPOs: The enforcement of Renewable Energy Purchase Obligations (RPO) would ensure the tradability of Renewable Energy Certificates (RECs) generated under the scheme. The regulatory framework for the RPO mechanism was designed to support renewable energy in India. There have been very few states, such as Rajasthan and Maharashtra, which have submitted a compliance report to the state regulator.
Adopting renovation and modernization techniques for plant operations: State-owned power plants that were performing poorly have been able to scale up power generation after the Renovation and Modernization (R&M) programme. The deviation from Station Heat Rate (SHR) has reduced considerably and specific emissions from these units have also come down. Andhra Pradesh, Gujarat, Karnataka, Maharashtra and Tamil Nadu have benefitted from the R&M programme.
Improving transmission and distribution systems in the power sector: The poor performance of power utilities, commercial losses and the use of old equipment resulted in losses up to 40%. This was a major concern. After the improvement of the transmission and distribution (T&D) systems, losses have come down to below 10% in states such as Andhra Pradesh. Other states like Rajasthan, Maharashtra and Karnataka have shown reduction in the T&D losses, higher than the national average.3
Renewables
Energy Effi ciency

8
BUILDINGS
4 Floor area ratio (FAR) is the ratio of a building's total fl oor area to the size of the land upon which it is built.
Incentivizing and promoting solar photovoltaic rooftops: States like Andhra Pradesh, Gujarat, Karnataka and Maharashtra provide incentives, such as generation-based incentives, rebates and subsidies for promoting SPV rooftops. Other states like Madhya Pradesh, Rajasthan and Tamil Nadu have planned or proposed to do the same.
Setting high FAR4 for green buildings: The Delhi Urban Art Commission has made a recommendation to the Ministry of Urban Development that the fl oor area ratio (FAR) for green buildings be increased by 1%. This suggestion may be added to Delhi Master Plan 2021.
Promoting eco-buildings: The Pune Municipal Corporation’s (PMC) Eco-housing programme promotes the adoption of environment-friendly houses. The Pune Municipality offers a concession of 10-50% on the total premium on building certification fees to developers, depending on the project rating achieved under the certification of this programme.
Mandating the notification of the ECBC: Rajasthan is the only state among the selected states under study to notify and mandate the Energy Conservation Building Code (ECBC).
Mandating energy efficiency norms for public procurement: Minimum energy-efficiency standards – based on mandatory or voluntary star rating norms for electrical appliances listed under BEE’s Standards and Labelling Programme – have been mandated for all public procurements in Rajasthan.
Notifying Green SEZs: The notification of special economic zones (SEZ) as ‘green’ areas for attracting investment in clean energy has driven project developers to invest in eco-friendly projects in India. Under Green SEZs, the government provides various support mechanisms, such as single-window clearance and financial incentives, to private developers investing in these regions. Some of the leading states to have notified Green SEZs are Gujarat and Maharashtra.
Renewables
Energy Effi ciency
Overarching
Overarching

9
INDUSTRY
TRANSPORT
Increasing the share of renewable energy mix in industrial energy demand: This can be achieved through policy interventions or making existing policies more inclusive such as:i) Including separate solar RPOs on captive and open access
consumersii) Including captive consumers as obligated entities in all
states (currently few states don’t have captive consumers as obligated entities) and specifying the minimum capacity for captive consumers for RPOs to be applicable.
Promoting biofuels for transportation: The Cabinet Committee on Economic Affairs (CCEA) has approved the pricing for bio-ethanol procurement by oil marketing companies (OMCs) under the Ethanol Blended Petrol (EBP) Programme. As decided by the CCEA, it is now mandated that petrol blended with 5% ethanol will be sold across the country.
Levying Carbon tax/Green cess: Carbon tax on coal consumption (Rs 50/metric tonne)5 in all states provides a corpus for the National Clean Energy Fund (NCEF). A green cess has been levied on power consumption in energy-intensive industries in states such as Karnataka (5 paise/kWh), Gujarat (2 paise/kWh), Maharashtra (5 paise/kWh), Tamil Nadu (5 paise/kWh).6
Promoting effective public transportation: An increase in the fleet of state-run buses and the expansion of Bus Rapid Transit (BRT) and Mass Rapid Transit System (MRTS) systems provides a more effective public transport system. Bus fleets have been ramped up above the average figure for India in Himachal Pradesh, Karnataka, Tamil Nadu and
Decreasing the SEC: A decrease in the Specific Energy Consumption (SEC) by the industry sectors in Madhya Pradesh, Andhra Pradesh, Rajasthan and Maharashtra has reduced GHG emission levels attributable to industrial processes emissions. Cap and trade policies at the national level provide incentives to industries to reduce the SEC levels in India. Perform, Achieve and Trade (PAT) is one such leading national-level practice.
Enforcing fuel efficiency standards: The upcoming Corporate Average Fuel Economy (CAFE) standards need to be enforced effectively and the already active Auto Fuel Policy, which introduced strict emission norms for vehicles, needs to be implemented.
Renewables
Renewables
Energy Effi ciency
Energy Effi ciency
Overarching
Overarching
5 http://moef.nic.in/downloads/public-information/India%20Taking%20on%20Climate%20Change.pdf
6 http://newindianexpress.com/cities/chennai/article1293883.ece

10
7 Forestry Sector Report India 2010, Indian Council of Forestry Research and Education, Dehradun, MoEF, Government of India
FORESTRY
Not Applicable
Not Applicable
Augmenting carbon stock: Increasing carbon stock through effective preservation, restoration and enhancement in the quality of forest and tree cover, leading to more carbon sequestration, was observed in states like Himachal Pradesh, Andhra Pradesh, Tamil Nadu and Maharashtra. Arunachal Pradesh has the highest forest cover (with respect to geographical area) in the country but has seen a minor decline in growth rate over the period from 2002 to 2009.
Enhancing funding for forestry: The allocation for forests in the state budget need to be increased for activities related to afforestation, and forest conservation. Depending on the forest cover and the need of the state, several state-level forestry projects have been taken up through external fundings7 in Gujarat, Himachal Pradesh, Karnataka, Rajasthan and Tamil Nadu.
Andhra Pradesh between 2007 and 2009. Delhi has, by far, the maximum number of buses per lakh of population. The expansion of the Delhi Metro is also noteworthy.
Levying green cess on vehicles: Green cess should be levied on the use of vehicles to discourage inefficient plying. For example, a green tax is imposed on old vehicles in states like Tamil Nadu, Maharashtra, Karnataka, Rajasthan and Andhra Pradesh; a green cess is levied on vehicles from outside the state in Himachal Pradesh; and an environment cess of 40 paise per litre of diesel sold is levied in Delhi to create an Air Ambience Fund for financing pollution control measures.
Incentivizing cleaner fuel: The use of cleaner fuels should be promoted, such as CNG usage in eight states under the CNG programme, which is in effect in India since 2011.States like Madhya Pradesh, Andhra Pradesh, Delhi, Rajasthan and Maharashtra offer capital subsidy or tax exemptions on Electric Hybrid Vehicles (EHV).
Renewables
Energy Effi ciency
Overarching
11
AGRICULTURE
GENERAL
WASTE
Not Applicable
Not Applicable
Not Applicable
Not Applicable
Not Applicable
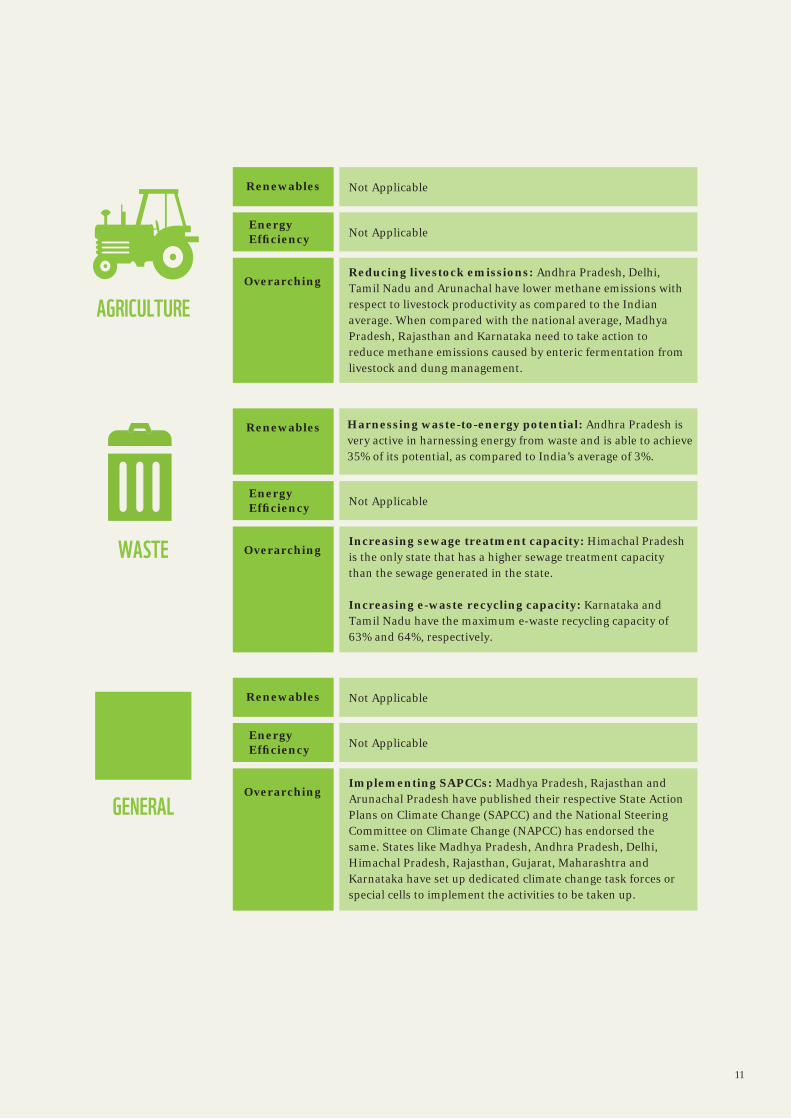
Reducing livestock emissions: Andhra Pradesh, Delhi, Tamil Nadu and Arunachal have lower methane emissions with respect to livestock productivity as compared to the Indian average. When compared with the national average, Madhya Pradesh, Rajasthan and Karnataka need to take action to reduce methane emissions caused by enteric fermentation from livestock and dung management.
Implementing SAPCCs: Madhya Pradesh, Rajasthan and Arunachal Pradesh have published their respective State Action Plans on Climate Change (SAPCC) and the National Steering Committee on Climate Change (NAPCC) has endorsed the same. States like Madhya Pradesh, Andhra Pradesh, Delhi, Himachal Pradesh, Rajasthan, Gujarat, Maharashtra and Karnataka have set up dedicated climate change task forces or special cells to implement the activities to be taken up.
Harnessing waste-to-energy potential: Andhra Pradesh is very active in harnessing energy from waste and is able to achieve 35% of its potential, as compared to India’s average of 3%.
Increasing sewage treatment capacity: Himachal Pradesh is the only state that has a higher sewage treatment capacity than the sewage generated in the state.
Increasing e-waste recycling capacity: Karnataka and Tamil Nadu have the maximum e-waste recycling capacity of 63% and 64%, respectively.
Renewables
Renewables
Renewables
Energy Effi ciency
Energy Effi ciency
Energy Effi ciency
Overarching
Overarching
Overarching

12
The current study involved developing a pilot framework for assessing the progress of each selected state in developing and implementing low-carbon policies across key economic sectors. It is expected that this exercise can be further strengthened and the coverage increased, both in terms of the number of states as well as the technical parameters/indicators considered. While the current study has relied, to
a large extent, on published or publically available sources of information, it is also recognized that further interactions with stakeholders, including state governments, would add value to the assessment.
It is expected that with release of the final report of the Planning Commission, which is likely to chalk out the pathway for India’s low-carbon growth across the sectors analyzed in this report, and the finalization of the SAPCCs across all the 28 states in India, the indicators can be further fine-tuned. Additions or modifications can be made to the indicators to address the changes, as they occur. In addition, the availability of state-level GHG emission profiles can be utilized to add relevance to the study results in the future, especially with respect to assigning weightages across sectors for each of the states considered.
Given that the implementation of the NAPCC and the formulation and adoption of SAPCCs is still an ongoing process, the results of this project in the first year should be considered only indicative of the development of state-wide policies directed towards low-carbon growth. The current work adds to the knowledge base on good policies and practices that promote low-carbon development. It is intended to stimulate positive action among states and encourage best practices as well as to raise the level of ambition among them. Thus, the rating across the states should be analyzed taking the above into consideration.
In the future, the project can act as a barometer for measuring the progress of state and central policies designed to achieve low-carbon growth. As more quantitative data becomes publicly available, the indicators can be further refined and the progress across sectors can be mapped better in terms of the impact of the policies. Not only the existence of a particular policy but also its effectiveness, in terms of implementation on the ground, will make a difference to the overall long-term progress toward low carbon development.
THE WAYFORWARD

13
WWF-India is one of the largest conservation organizations in the country dealing with nature conservation, environment protection and development-related issues. Established as a Charitable Trust in 1969, it has an experience of over four decades in the field. Its mission is to stop the degradation of the planet’s natural environment, which it addresses through its work in biodiversity
conservation and reduction of humanity’s ecological footprint.
WWF-India works across different geographical regions in the country to implement focused conservation strategies on issues like conservation of key wildlife species, protection of habitats, management of rivers, wetlands and their ecosystems, climate change mitigation, enhancing energy access, sustainable livelihood alternatives for local communities, water and carbon footprint reduction in industries, and combating illegal wildlife trade. WWF-India is actively engaged in promoting renewable energy uptake, enabling energy access, demonstrating renewable energy projects in critical landscapes, and overall promoting clean energy solutions.
Shakti Sustainable Energy Foundation works to strengthen the energy security of India by aiding the design and implementation of policies that support energy efficiency and renewable energy.
ABOUT WWF-INDIA
ABOUT SHAKTI SUSTAINABLE ENERGY FOUNDATION
Ernst & Young is a global leader in assurance, tax, transaction and advisory services. Worldwide, our 167,000 people are united by our shared values and an unwavering commitment to quality. We make a difference by helping our people, our clients and our wider communities achieve their potential.
Ernst & Young refers to the global organization of member fi rms of Ernst & Young Global Limited, each of which is a separate legal entity. Ernst & Young Global
Limited, a UK company limited by guarantee, does not provide services to clients. For more information about our organization, please visit "http://www.ey.com". Ernst & Young LLP is one of the Indian client serving member fi rms of EYGM Limited. For more information about our organization, please visit "http://www.ey.com/in". Ernst & Young LLP is a Limited Liability Partnership, registered under the Limited Liability Partnership Act, 2008 in India, having its registered offi ce at 22 Camac Street, 3rd Floor, Block C, Kolkata - 700016
ABOUT ERNST & YOUNG LLP
ASSURANCE | TAX |
TRANSACTIONS | ADVISORY

© 1986 Panda Symbol WWF-World Wide Fund For Nature (Formerly World Wildlife Fund)
WWF-India Secretariat172-B Lodi EstateNew Delhi - 110003Tel: 011 4150 4814, Fax: 011 4150 4779


![arXiv:2007.08436v2 [hep-th] 6 Aug 2020 for Physics in August ...LCPT-20-17 E-mail: elvang@umich.edu Abstract. This article is an introduction to two currently very active research](https://img.dokumen.tips/doc/110x75/601a8d53a56df141d759f4bb/arxiv200708436v2-hep-th-6-aug-2020-for-physics-in-august-lcpt-20-17-e-mail.jpg)


