Embed Size (px)
Citation preview
Australian animals lost to bulldozers in Queensland 2013 -15
REPORT
2017
Australian animals lost to bulldozers in Queensland2015 –16 updateShortly after the release of the recent WWF report Australian animals lost to bulldozers in Queensland 2013-151, new tree clearing data and maps have been released by the Queensland Government showing a 33% increase in areas cleared relative to the prior year 2014-15.
We have re-estimated the numbers of mammals, birds and reptiles losing their habitat and killed as a result of bulldozing of bushland in 2015-16.
Approximately half the total area cleared in 2015-16 (395,000ha) according to the Queensland Government SLATS report, we estimated to comprise remnant and advanced regrowth forest or woodland (199,273 ha) (Table 1). We only estimated animals killed on the basis of this area, not on total area cleared.
We conservatively estimate 44.7 million individuals were killed due to bulldozing of bushland in 2015-16, composed of 1.1 million mammals, 3.7 million birds and 39.9 million reptiles.
This represents a 30% increase in numbers killed annually relative to the previous two years.
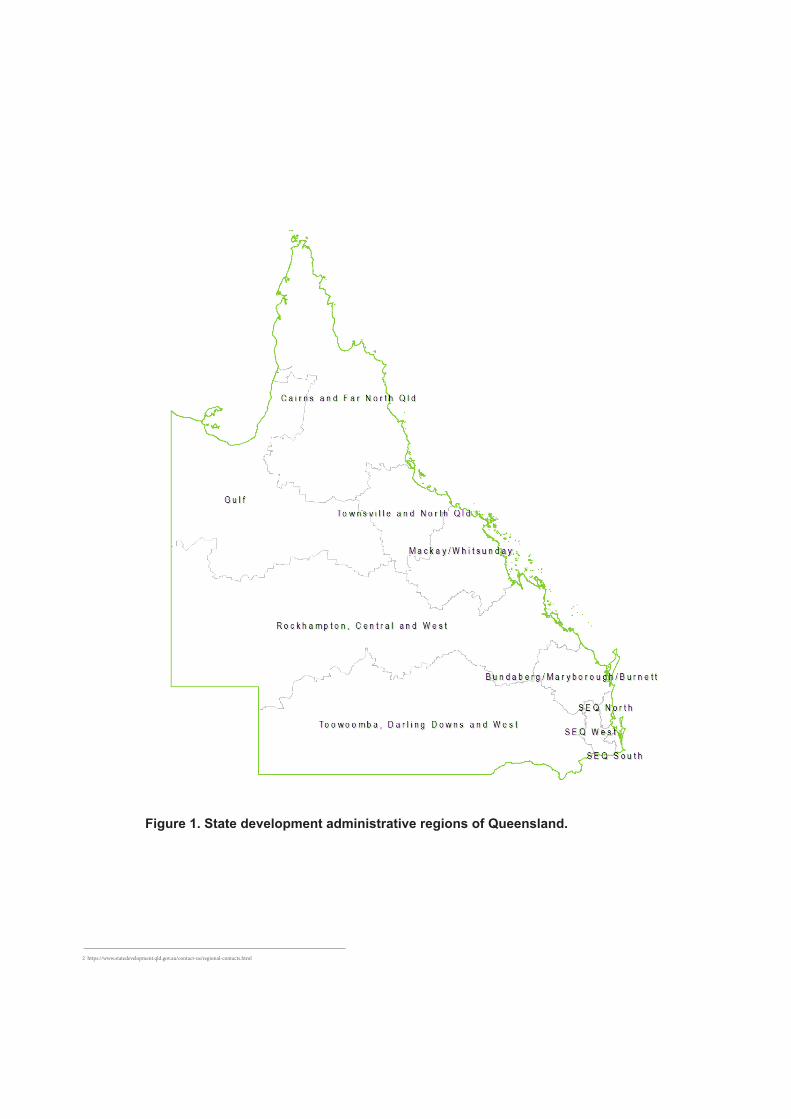
A comparison of these new estimates with the earlier 2013-15 estimates, broken down by state development regions is shown in table 1 below. A map of regions is shown as Figure 1.
Dr Hal Cogger, John Evans Memorial Fellow, the Australian Museum,
Prof. Chris Dickman, University of Sydney
Prof. Emeritus Hugh Ford, University of New England,
Prof. Chris Johnson, University of Tasmania,
Dr Martin Taylor, WWF-Australia
23 Oct 2017
1 Cogger H, Dickman C, Ford H, Johnson C and Taylor MFJ, 2017. Australian animals lost to bulldozers in Queensland 2013-15. WWF-Australia technical report.

1. 2
013-
15 d
ata
as fo
und
in th
e Ap
pend
ix in
the
repo
rt C
ogge
r et a
l (20
17) c
ited
abov
e. Fo
r reg
ions
see
Figu
re 1
.
2. R
emna
nt a
s map
ped
in Q
ueen
sland
Gov
ernm
ent’s
Reg
iona
l Eco
syst
ems v
9 (2
013)
and
det
ecte
d as
clea
red
in S
LATS
20
13-1
5 as
wel
l as n
on-r
emna
nt th
at h
ad n
ot b
een
dete
cted
as c
lear
ed in
the
entir
e SL
ATS
reco
rd fr
om 1
988,
and
was
al
so 1
1% o
r gre
ater
Fol
iage
Pro
ject
ive
Cov
er in
201
3 (w
oodl
and
or fo
rest
).
3. R
emna
nt a
s map
ped
in Q
ueen
sland
Gov
ernm
ent’s
Reg
iona
l Eco
syst
ems v
10 (2
015)
and
det
ecte
d as
clea
red
in S
LATS
20
15-1
6 as
wel
l as n
on-r
emna
nt th
at h
ad n
ot b
een
dete
cted
as c
lear
ed in
the
entir
e SL
ATS
reco
rd fr
om 1
988,
and
was
also
11
% o
r gre
ater
Fol
iage
Pro
ject
ive
Cov
er in
201
4 (w
oodl
and
or fo
rest
). N
ote
that
the
2015
FPC
laye
r not
avai
labl
e ye
t.
Tabl
e 1:
. U
pdat
ed e
stim
ates
of a
reas
of h
abita
t cle
ared
and
num
bers
of a
nim
als
kille
d in
201
5-16
, rel
ativ
e to
est
imat
es fo
r 201
3-15
, by
sta
te d
evel
opm
ent r
egio
n.
1. 2
013-
15 d
ata
as fo
und
in th
e Ap
pend
ix in
the
repo
rt C
ogge
r et a
l (20
17) c
ited
abov
e. Fo
r reg
ions
see
Figu
re 1
.
2. R
emna
nt a
s map
ped
in Q
ueen
sland
Gov
ernm
ent’s
Reg
iona
l Eco
syst
ems v
9 (2
013)
and
det
ecte
d as
clea
red
in S
LATS
20
13-1
5 as
wel
l as n
on-r
emna
nt th
at h
ad n
ot b
een
dete
cted
as c
lear
ed in
the
entir
e SL
ATS
reco
rd fr
om 1
988,
and
was
al
so 1
1% o
r gre
ater
Fol
iage
Pro
ject
ive
Cov
er in
201
3 (w
oodl
and
or fo
rest
).
3. R
emna
nt a
s map
ped
in Q
ueen
sland
Gov
ernm
ent’s
Reg
iona
l Eco
syst
ems v
10 (2
015)
and
det
ecte
d as
clea
red
in S
LATS
20
15-1
6 as
wel
l as n
on-r
emna
nt th
at h
ad n
ot b
een
dete
cted
as c
lear
ed in
the
entir
e SL
ATS
reco
rd fr
om 1
988,
and
was
also
11
% o
r gre
ater
Fol
iage
Pro
ject
ive
Cov
er in
201
4 (w
oodl
and
or fo
rest
). N
ote
that
the
2015
FPC
laye
r not
avai
labl
e ye
t.
Figure 1. State development administrative regions of Queensland.
2 https://www.statedevelopment.qld.gov.au/contact-us/regional-contacts.html

Go
lde
n-ta
iled
Ge
ck
o ©
nath
an
BiG
ne
ll
WWF-Australia report 2017: Australian animals lost to bulldozers in Queensland 2013-15 3
ExEcutivE summAry
In 2003, leading zoologists estimated the numbers of Australian animals losing habitat to, and killed by, tree-clearing in Queensland in the late 1990s. For a reported 446,000 ha of remnant, mature or intact bushland being
cleared annually, an estimated 100 million native vertebrates died, including over two million mammals (such as koalas, gliders, possums, bandicoots and native rodents), 8.5 million forest and woodland birds and 89 million reptiles (such as goannas, geckos and skinks).Following this 2003 report much stronger protections, including a ban on large-scale clearing of remnant bushland, were legislated in Queensland and tree-clearing rates declined sharply.
These protections were greatly weakened in 2012-13 by the former Newman-LNP state government. Tree-clearing rates in Queensland have since resurged to almost 300,000 ha per annum. 1
In this update, we apply the same methods employed in the 2003 report to clearing data for 2013-15, the most recent available. These updated estimates include the effects on wildlife of clearing not just of remnant but also advanced age regrowth bushland. We estimate that about 34 million vertebrates are losing their habitats to bulldozers every year and presumed killed, including 0.9 million mammals, 2.6 million birds and 30.6 million reptiles.
These estimates are likely to be underestimates because they do not account for clearing of younger forests, or aquatic and marine animals killed as a result of clearing and resulting water pollution in the catchment. Nor do they account for the ongoing higher mortality rates of wildlife due to the delayed effects of habitat fragmentation and degradation that follow from clearing.
1 taylor, M., 2015. Bushland destruction rapidly increasing in Queensland. WWF-Australia briefing. http://awsassets.wwf.org.au/downloads/fl024_bushland_destruction_rapidly_increasing_in_queensland_16sep15.pdf
Australian animals lost to bulldozers in Queensland 2013-15 3
4 WWF-Australia report 2017: Australian animals lost to bulldozers in Queensland 2013-15
FRONT COveR: koala (Phascolarctos cinereus) paw restinG on a tree trunk. return to the wild inc. toowooMBa, Queensland. april 2017 © douG GiMesy / wwF-aus
The report is an update of the earlier WWF report: Cogger HJ, Ford H, Johnson C, Holman J & Butler D, 2003, Impacts of Land Clearing on Australian Wildlife in Queensland. Report for WWF-Australia, Sydney.
Suggested citation
Cogger H, Dickman C, Ford H, Johnson C and Taylor MFJ, 2017. Australian animals lost to bulldozers in Queensland 2013-15. WWF-Australia technical report.
Authors
Dr Hal Cogger AM, Herpetologist, John Evans Memorial Fellow, Australian Museum.
Professor Chris Dickman, Mammalogist, University of Sydney.
Emeritus Professor Hugh Ford, Ornithologist, University of New England.
Professor Chris Johnson, Mammalogist, University of Tasmania.
Dr Martin Taylor, Conservation Scientist, WWF-Australia.
Author contributions
Authors are listed alphabetically.
Martin Taylor was the principal analyst and author for this update to the earlier Cogger et al, 2003 report.
Acknowledgements
WWF-Australia also gratefully acknowledges Don Butler, Carol Booth and Jon Hanger for their contributions.
PublicAtion dEtAils

WWF-Australia report 2017: Australian animals lost to bulldozers in Queensland 2013-15 5
contEntsExEcutivE summAry 3introduction 6 The importance of considering all animals affected by clearing 7
Animals lost to tree-clearing prior to effective controls 8
Resurgence of tree-clearing in Queensland 9
Updated estimates of animals lost to clearing in Queensland 11
Patterns of clearing and animal losses 13
How good ArE tHE EstimAtEs? 19Overestimation sources 19
Sources of either over- or underestimation 20
Underestimation sources 21
Currency of density estimates 23
mEtHods 25APPEndix 26

6 WWF-Australia report 2017: Australian animals lost to bulldozers in Queensland 2013-15
de
ad
koa
la Fou
nd
in c
ollin
Gw
oo
d pa
rk
. Qu
ee
ns
lan
d, Ja
nu
ar
y 2017 © M
itch
& JiM
do
dr
ill
introduction Habitat destruction is the greatest threat to native wildlife in Australia and worldwide, resulting in mass loss of life for animals and plants,
ecosystem and food chain disruption, and if carried far enough, population or species extinctions. Rates of forest and woodland destruction were alarmingly high in Queensland last century until laws were enacted over a decade ago to regulate what was largely unrestricted bulldozing of natural bushland.
Legislation limiting the destruction of natural bushland was weakened recently. This has led to an increase in clearing rates. In this report, we update earlier estimates from 2003 of the numbers of Australian land vertebrates - mammals, birds and reptiles - killed as a result of the destruction of their forest, woodland or bushland habitat, also known as deforestation, land clearing or tree-clearing.

WWF-Australia report 2017: Australian animals lost to bulldozers in Queensland 2013-15 7
tHE imPortAncE of considEring All AnimAls AffEctEd by clEAring
Conservation is not only concerned with saving endangered species. Common species dominate resource flows in food webs and are vital to the maintenance of ecosystem complexity and resilience. As such, they too are an important issue for conservation. 2 Large-scale killing of forest and woodland-dependent native animals through destruction of their habitats, whether they are common species or not, cannot fail to have adverse conservation consequences. These include disrupting natural food chains and natural ecosystems’ services and bringing species and ecosystems closer to depletion, dysfunction or extinction.
Although this report estimates the numbers of animals lost from the footprint of areas destroyed, wild animals continue to suffer elevated mortalities in the remaining islands of forest by virtue of the legacy effects of fragmentation and degradation of their habitat. Fragmentation of once continuous habitat creates archipelagos of islands surrounded by a landscape hostile to the movement of forest-dependent wildlife while their edges may be invaded by weeds and aggressive or predatory animals. 3
This habitat degradation effect can continue to result in excessive deaths of wild animals over many decades, ultimately resulting in loss or local extinctions of entire populations, and if enough populations are affected, the loss of entire species.
The phenomenon of ongoing decline in degraded habitats due to elevated mortalities (or reduced reproduction) leading to extinction is called the ‘extinction debt’. Populations and species are at increased risk of extinction due to the legacy effects of clearing in the past, even if clearing has been halted for some time. 4
This appears to be happening now to the koala in southeast Queensland. Recent analysis shows that koalas have been in continuous decline in the Brisbane outer suburbs for decades. Over the period 1996-2015, koala populations declined 80% in the Koala Coast (Redlands) area and 54% in the Pine Rivers area, although most clearing for urban or commercial/industrial development happened decades ago. 5 Continuous, substantial population decline led to the koala populations of NSW, ACT and Queensland being listed as vulnerable to extinction in 2012. 6 The plight of the koala illustrates what can happen to a species, once considered widespread, common and safe, that suffers extensive habitat loss and fragmentation.
2 Gaston KJ, 2010, Valuing common species. science, 327, 154-155; Dickman CR & Steeves TE, 2004, Use of habitat by mammals in eastern Australian forests: are common species important in forest management. pp.761-73 in D Lunney (ed) the conservation of australia’s Forest Fauna (2nd edition) 2004, Royal Zoological Society of New South Wales, Australia.
3 Saunders DA, Hobbs RJ & Margules CR, 1991, Biological consequences of ecosystem fragmentation: a review. conservation Biology, 5, 18-32.4 Kuussaari M et al, 2009, Extinction debt: a challenge for biodiversity conservation. trends in ecology & evolution, 24, 564-571.5 Rhodes J et al,. 2015, south east Queensland Koala Population Modelling study. UniQuest, Brisbane, Australia.6 http://www.environment.gov.au/cgi-bin/sprat/public/publicspecies.pl?taxon_id=85104
8 WWF-Australia report 2017: Australian animals lost to bulldozers in Queensland 2013-15
The conservation impacts of habitat destruction on animal populations are likely to be greater now than they were in the late 1990s because of the cumulative effect of past habitat loss and fragmentation. For Australian mammals in particular, there has been a general decline in health and resilience of many populations over the intervening period from the late 1990s to the present. A recent comprehensive review of the conservation status of mammals shows that over the last 20 years, 52 species and subspecies of land mammals on mainland Australia have undergone a worsening of conservation status, and only 15 have improved. 7
There are also significant animal welfare concerns about the injury, suffering and death of Australian animals that are an inevitable result of so much habitat destruction. 8
AnimAls lost to trEE-clEAring Prior to EffEctivE controls
In the late 1990s, about 100 million individual vertebrate animals died annually, based on an estimated 446,000 ha clearing of remnant 9 bushland (including both forests and woodlands). These numbers were primarily composed of 89 million reptiles (such as goannas, skinks and geckos), 8.5 million woodland birds and 2.1 million mammals (including monotremes, marsupials and placentals like rodents and bats) (Cogger et al, 2003, referred to as ‘the 2003 report’ below). 10
The 2003 report assumed that all, or virtually all, animals die when their habitat is destroyed. Animals do not necessarily die during the bulldozing itself. Those that survive the bulldozing may be unable to escape, often because they are too small to travel the distances needed to reach new habitat, or because of high attachment to their homes and nest sites, or because they are trapped, die on site from starvation or exposure, or die hiding in woodpiles that are burned.
For the larger, more mobile animals like birds and macropods that may escape to remnants of habitat, death still awaits, because of over-crowding in those remnants, which are most likely already occupied with no excess capacity to absorb immigrants. Immigrants end up in conflict with residents over resources, territories and mates, and are pushed out to poorer marginal habitat, or may even push residents out.
With increased displacement comes increased exposure to predation and pathogens or collisions with cars, fences and powerlines in developed areas. Increased injuries and stress from conflict and displacement may also lead to disease. 11
7 Woinarski JCZ, Burbidge AA & Harrison PL, 2014, the action plan for australian mammals 2012. CSIRO Publishing, Collingwood, Vic.8 Finn HC & Stephens NS, 2017, The invisible harm: tree-clearing is an issue of animal welfare. Wildlife research doi: 10.1071/wr170189 Meaning intact, primary or never cleared, or if cleared has since grown back to maturity.10 Cogger HJ, Ford H, Johnson C, Holman J & Butler D, 2003, impacts of land clearing on australian Wildlife in Queensland. report for wwF-australia,
Sydney.11 Ibid.

WWF-Australia report 2017: Australian animals lost to bulldozers in Queensland 2013-15 9
rEsurgEncE of trEE-clEAring in QuEEnslAnd
12 taylor MFJ, 2015, Bushland destruction rapidly increasing in Queensland. WWF-Australia briefing. http://awsassets.wwf.org.au/downloads/fl024_bushland_destruction_rapidly_increasing_in_queensland_16sep15.pdf
13 WWF analysis of register of self-assessable code notifications, corrected for apparently duplicated notifications on the same property. https://data.qld.gov.au/dataset/vegetation-management-register-of-self-assessable-code-notifications
Prior to 20 July 2016, no areas were provided for notifications.14 http://wwf.panda.org/about_our_earth/deforestation/deforestation_fronts/
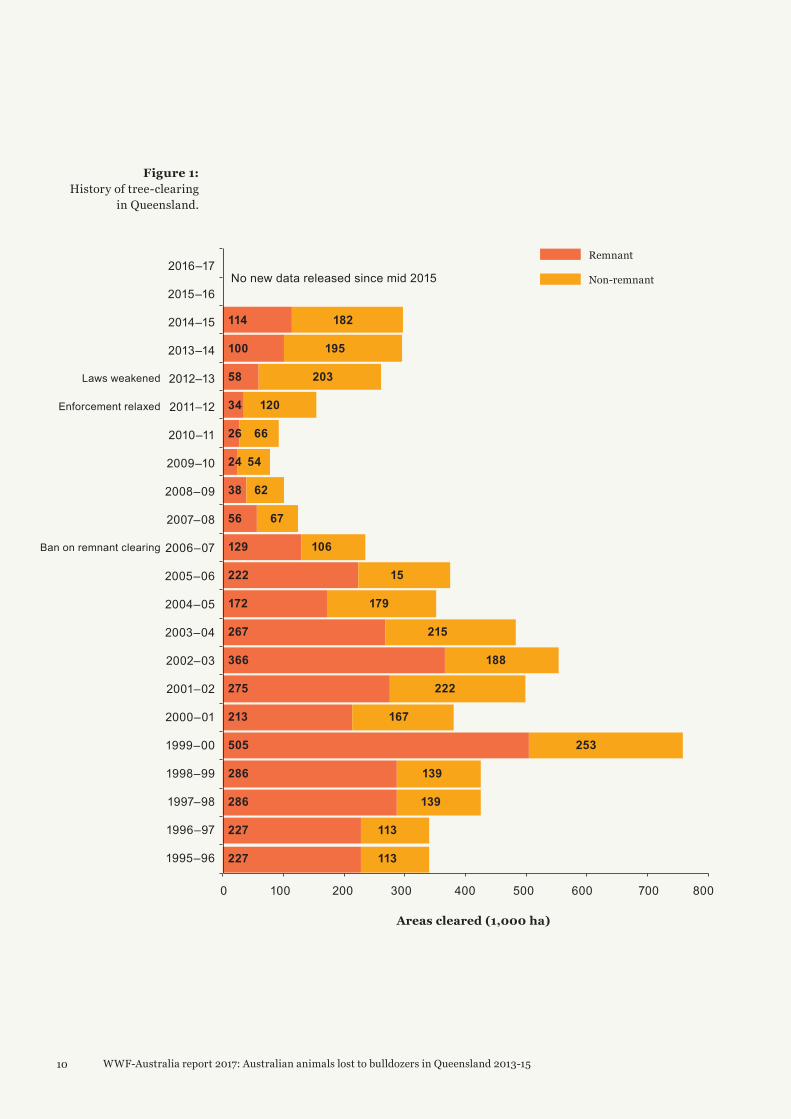
Following the 2003 report, significant protections against excessive tree-clearing were legislated in Queensland in 2004 and 2009, and tree-clearing rates declined sharply as a result (Fig 1).
These protections were drastically weakened in 2012-13 by the former Newman-LNP state government, firstly by relaxing enforcement and then by changing the laws and codes governing tree-clearing. Tree-clearing rates in Queensland have since more than tripled to almost 300,000 ha per annum in 2014-15 from the historic low point of 78,000 ha in 2009-10. Clearing of remnant bushland has also quadrupled from 24,000 ha to 114,000 ha over the same period (Fig 1). 12
The present government attempted to restore tree-clearing controls in 2016, but unfortunately were blocked in the state parliament. The weakened laws and codes introduced by the previous government continue to apply.
The trend in recent remnant clearing is increasing sharply upward (Fig 1). In addition, notifications of nearly 400,000 ha for clearing of remnant bushland under self-assessable codes (for which no permit is required) have been made from 20 July 2016 to 2 July 2017. 13 Therefore, when they are released, the 2015/16 estimates of clearing and consequently numbers of animals killed, are expected to significantly exceed those in 2014/15.
The resurgence of tree-clearing in Queensland, along with recent repeal of the Native Vegetation Act in NSW, has led to the listing of Eastern Australia as one of 11 ‘global deforestation fronts’ by WWF International. Australia is the only developed country on this ignominious list. 14
BU
LLDO
ZING
OF C
yP
RES
S/ EU
CA
LyP
T FOR
EST IN
PR
OG
RES
S
un
de
r th
e “thin
nin
G” c
od
e, w
este
rn
da
rlin
G d
ow
ns
, Q
ue
en
sla
nd
, May 2017 ©
ww
F-au
str
alia
10 WWF-Australia report 2017: Australian animals lost to bulldozers in Queensland 2013-15
Figure 1: History of tree-clearing
in Queensland.
2016–17
2015–16
2014–15
2013–14
2012–13
2011–12
2010–11
2009–10
2008–09
2007–08
2006–07
2005–06
2004–05
2003–04
2002–03
2001–02
2000–01
1999–00
1998–99
1997–98
1996–97
1995–96
114 182
100 195
58 203
34 120
26 66
24 54
38 62
56 67
129 106
222 15
172 179
267 215
366 188
275 222
213 167
505 253
286 139
286 139
227 113
227 113
0 100 200 300 400 500 600 700 800
No new data released since mid 2015
Laws weakened
Enforcement relaxed
Ban on remnant clearing
Areas cleared (1,000 ha)
Remnant
Non-remnant
WWF-Australia report 2017: Australian animals lost to bulldozers in Queensland 2013-15 11
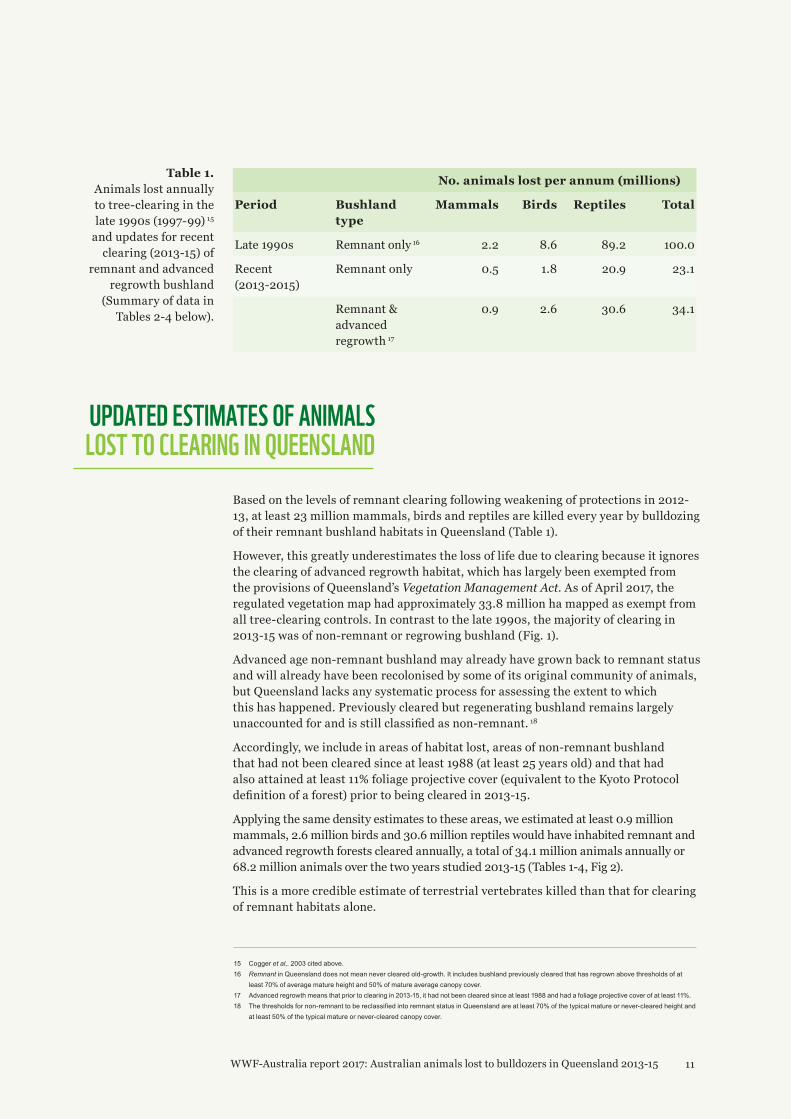
Table 1. Animals lost annually to tree-clearing in the late 1990s (1997-99) 15
and updates for recent clearing (2013-15) of
remnant and advanced regrowth bushland
(Summary of data in Tables 2-4 below).
No. animals lost per annum (millions)
Period Bushland type
Mammals Birds Reptiles Total
Late 1990s Remnant only 16 2.2 8.6 89.2 100.0
Recent (2013-2015)
Remnant only 0.5 1.8 20.9 23.1
Remnant & advanced regrowth 17
0.9 2.6 30.6 34.1
uPdAtEd EstimAtEs of AnimAls lost to clEAring in QuEEnslAnd
Based on the levels of remnant clearing following weakening of protections in 2012-13, at least 23 million mammals, birds and reptiles are killed every year by bulldozing of their remnant bushland habitats in Queensland (Table 1).
However, this greatly underestimates the loss of life due to clearing because it ignores the clearing of advanced regrowth habitat, which has largely been exempted from the provisions of Queensland’s Vegetation Management Act. As of April 2017, the regulated vegetation map had approximately 33.8 million ha mapped as exempt from all tree-clearing controls. In contrast to the late 1990s, the majority of clearing in 2013-15 was of non-remnant or regrowing bushland (Fig. 1).
Advanced age non-remnant bushland may already have grown back to remnant status and will already have been recolonised by some of its original community of animals, but Queensland lacks any systematic process for assessing the extent to which this has happened. Previously cleared but regenerating bushland remains largely unaccounted for and is still classified as non-remnant. 18
Accordingly, we include in areas of habitat lost, areas of non-remnant bushland that had not been cleared since at least 1988 (at least 25 years old) and that had also attained at least 11% foliage projective cover (equivalent to the Kyoto Protocol definition of a forest) prior to being cleared in 2013-15.
Applying the same density estimates to these areas, we estimated at least 0.9 million mammals, 2.6 million birds and 30.6 million reptiles would have inhabited remnant and advanced regrowth forests cleared annually, a total of 34.1 million animals annually or 68.2 million animals over the two years studied 2013-15 (Tables 1-4, Fig 2).
This is a more credible estimate of terrestrial vertebrates killed than that for clearing of remnant habitats alone.
15 Cogger et al,. 2003 cited above.16 remnant in Queensland does not mean never cleared old-growth. It includes bushland previously cleared that has regrown above thresholds of at
least 70% of average mature height and 50% of mature average canopy cover.17 Advanced regrowth means that prior to clearing in 2013-15, it had not been cleared since at least 1988 and had a foliage projective cover of at least 11%. 18 The thresholds for non-remnant to be reclassified into remnant status in Queensland are at least 70% of the typical mature or never-cleared height and
at least 50% of the typical mature or never-cleared canopy cover.
12 WWF-Australia report 2017: Australian animals lost to bulldozers in Queensland 2013-15
19 Cogger et al, 2003 cited above.20 Finn HC & Stephens NS, 2017,The invisible harm: tree-clearing is an issue of animal welfare. Wildlife research doi: 10.1071/wr1701821 Cogger et al, 2003 cited above; Johnson C, Cogger H, Dickman C & Ford H, 2007, impacts of land clearing; the impacts of approved clearing of
native Vegetation on australian Wildlife in new south Wales. WWF-Australia Report, WWF-Australia, Sydney
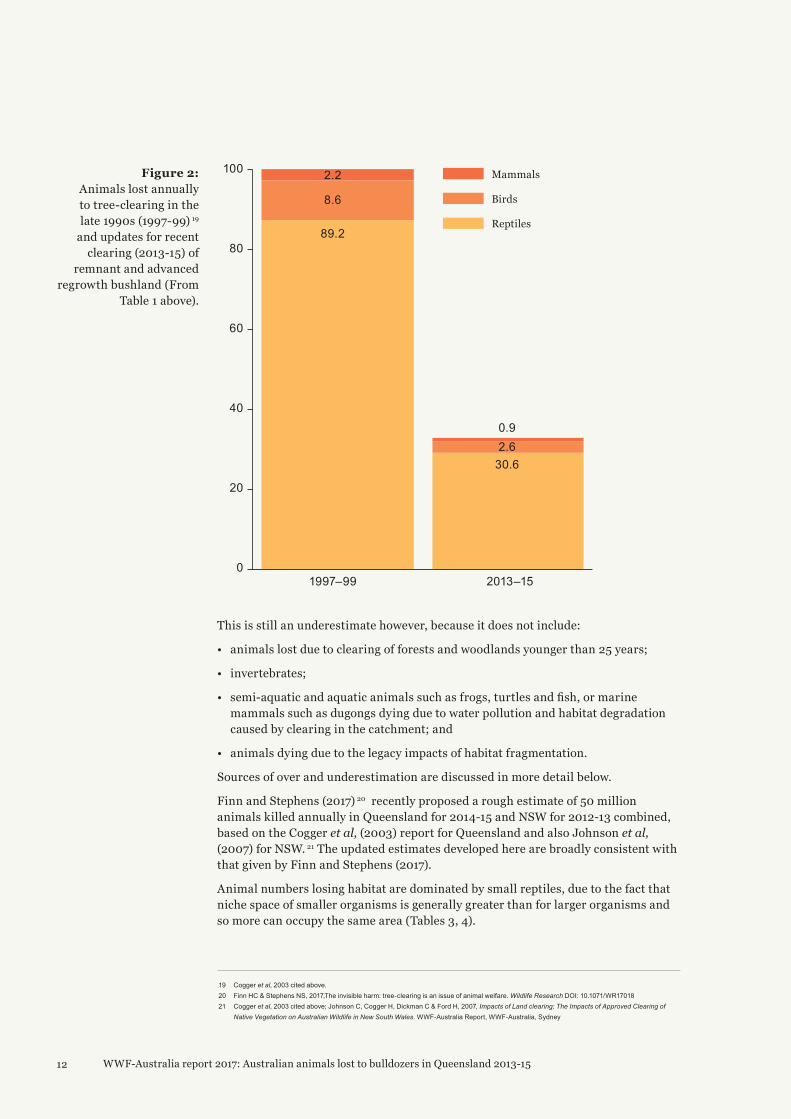
Figure 2: Animals lost annually to tree-clearing in the late 1990s (1997-99) 19
and updates for recent clearing (2013-15) of
remnant and advanced regrowth bushland (From
Table 1 above).
This is still an underestimate however, because it does not include:
• animals lost due to clearing of forests and woodlands younger than 25 years;
• invertebrates;
• semi-aquatic and aquatic animals such as frogs, turtles and fish, or marine mammals such as dugongs dying due to water pollution and habitat degradation caused by clearing in the catchment; and
• animals dying due to the legacy impacts of habitat fragmentation.
Sources of over and underestimation are discussed in more detail below.
Finn and Stephens (2017) 20 recently proposed a rough estimate of 50 million animals killed annually in Queensland for 2014-15 and NSW for 2012-13 combined, based on the Cogger et al, (2003) report for Queensland and also Johnson et al, (2007) for NSW. 21 The updated estimates developed here are broadly consistent with that given by Finn and Stephens (2017).
Animal numbers losing habitat are dominated by small reptiles, due to the fact that niche space of smaller organisms is generally greater than for larger organisms and so more can occupy the same area (Tables 3, 4).
100
80
60
40
20
01997–99
89.2
8.6
30.62.60.9
2.2
2013–15
Mammals
Birds
Reptiles

WWF-Australia report 2017: Australian animals lost to bulldozers in Queensland 2013-15 13
The current pattern of clearing, and losses due to clearing, has changed since the late 1990s.
In the late 1990s, the four top ranked bioregions for remnant clearing were in order: Brigalow Belt, Mulga Lands, Desert Uplands and Mitchell Grass Downs (Table 2, Fig 3). This order has changed somewhat to: Brigalow Belt, Mulga Lands, Mitchell Grass Downs and Gulf Plains respectively, when also including advanced regrowth (Table 2, Fig 3).
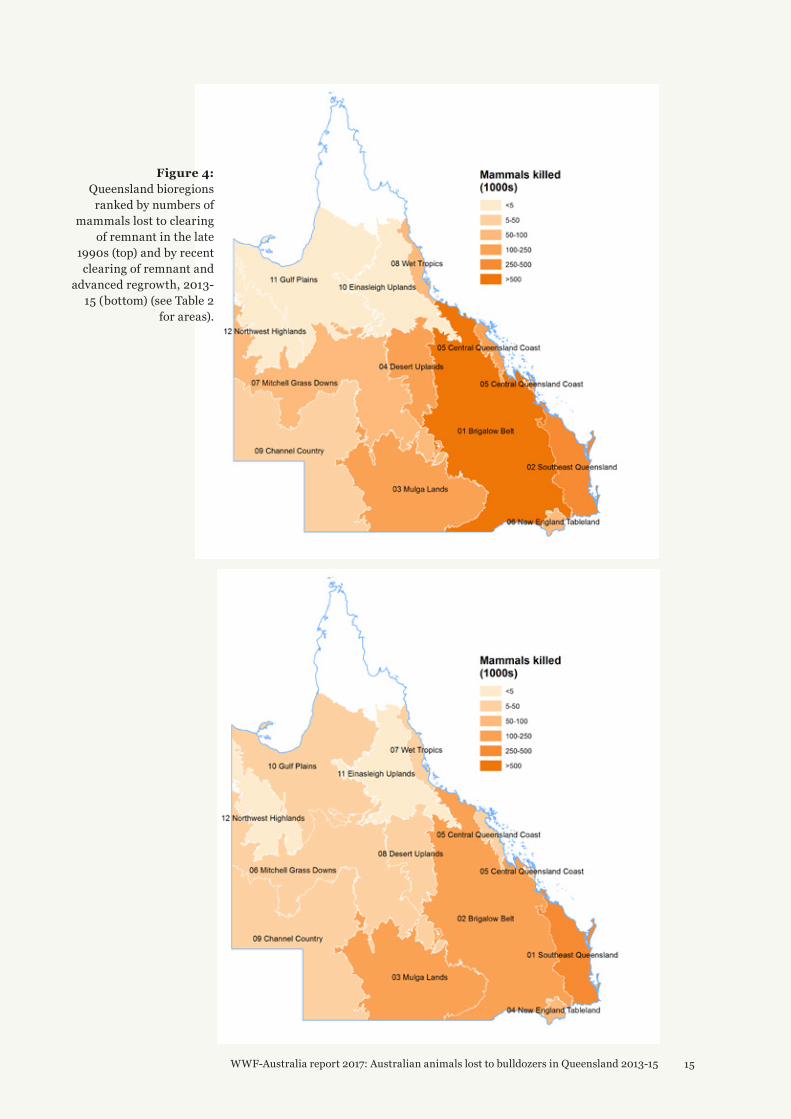
In the late 1990s, the four top ranked bioregions for mammals losing habitat to clearing were in order: Brigalow Belt, Southeast Queensland, Mulga Lands and Desert Uplands (Table 2, Fig 4). Now this order has changed significantly to: southeast Queensland, Brigalow Belt, Mulga Lands and New England Tableland respectively (Table 2, Fig 4).
It may seem paradoxical that southeast Queensland ranks so highly for mammal losses, but not for areas cleared (Figs 3-4), considering that roughly ten times more clearing by area happens in the Brigalow Belt than in southeast Queensland (Table 2). However, southeast Queensland still features as the hot spot for mammals losing habitat to clearing because mammal densities are so much higher there at 51.24 per hectare of native vegetation, compared with an estimated 3.93 mammals per hectare in the Brigalow Belt, due to the higher rainfall and productivity of the environment (Table 2).
PAttErns of clEAring And AnimAl lossEs
ae
ria
l iMaG
e oF c
lea
rin
G tr
ees Fo
r a
n u
rB
an
ex
pan
sio
n n
ea
r ip
sw
ich
, so
uth
ea
st
Qu
ee
ns
lan
d, a
pr
il 2017 © w
wF-a
us
tra
lia

14 WWF-Australia report 2017: Australian animals lost to bulldozers in Queensland 2013-15
Figure 3: Queensland bioregions
ranked by clearing of remnant in 1997-99 (top) and by recent clearing of
remnant and advanced regrowth 2013-15
(bottom) (see Table 2 for areas)
WWF-Australia report 2017: Australian animals lost to bulldozers in Queensland 2013-15 15
Figure 4: Queensland bioregions
ranked by numbers of mammals lost to clearing
of remnant in the late 1990s (top) and by recent
clearing of remnant and advanced regrowth, 2013-
15 (bottom) (see Table 2 for areas).

16 WWF-Australia report 2017: Australian animals lost to bulldozers in Queensland 2013-15
22 taylor MFJ, 2017, Pervasive inaction on national conservation law over tree-clearing in Queensland. WWF-Australia briefing paper.23 Rhodes JR, Beyer HL, Preece HJ & McAlpine CA, 2015, south east Queensland Koala Population Modelling study. UniQuest, Brisbane, Australia.24 Tables 3 and 5 in Cogger et al, 2003, Impacts of Tree-clearing on Australian Wildlife in Queensland. Report for WWF-Australia, Sydney.
In the late 1990s, there was no significant clearing of Cape York savannahs. Hence, in the 2003 report, no effort was made to estimate animal numbers affected on Cape York.
Areas cleared have since risen considerably on Cape York and on the neighbouring Gulf Plains due in large part to just three very large High Value Agriculture clearing permits for Strathmore (Gulf Plains), Kingvale and Olive Vale stations (Cape York). 22
This explains the changes in ranks of these two bioregions between the late 1990s and the present in regard to areas cleared (Fig 3).
The animals lost due to recent clearing on Cape York are not estimated in this update report, following the methods of the 2003 report. However, this only adds to the already considerable underestimation of actual losses as discussed below.
In this report, we did not attempt to update estimates of koalas, possums and gliders and bandicoots lost due to tree-clearing (Table 2). We recently estimated koalas lost in southeast Queensland at approx. 90 per annum, based on density estimates recently developed by University of Queensland researchers for the Queensland Government. 23 Statewide estimates of densities and losses of koalas due to tree-clearing are still in development.
Ma
Jor
Mitc
he
ll’s co
ck
atoo
(lop
ho
ch
ro
a lea
dB
eate
ri). ©
Mo
lly Gr
ace p
ho
toG
ra
ph
y
WWF-Australia report 2017: Australian animals lost to bulldozers in Queensland 2013-15 17
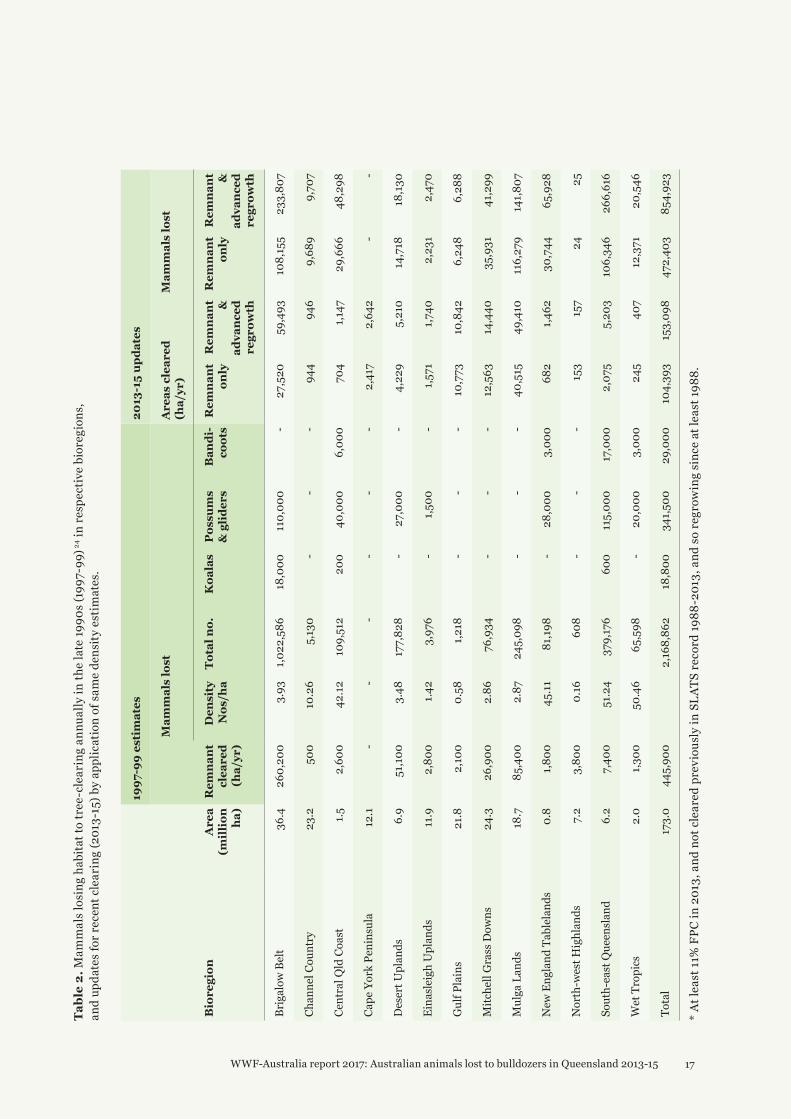
Tabl
e 2.
Mam
mal
s lo
sing
hab
itat t
o tr
ee-c
lear
ing
annu
ally
in th
e la
te 19
90s
(199
7-99
) 24 i
n re
spec
tive
bior
egio
ns,
and
upda
tes
for r
ecen
t cle
arin
g (2
013-
15) b
y ap
plic
atio
n of
sam
e de
nsit
y es
tim
ates
.
1997
-99
esti
mat
es20
13-1
5 up
date
s
Mam
mal
s lo
stA
reas
cle
ared
(h
a/yr
)M
amm
als
lost
Bio
regi
onA
rea
(mil
lion
ha
)
Rem
nant
cl
eare
d (h
a/yr
)
Den
sity
N
os/h
aTo
tal n
o.K
oala
sP
ossu
ms
& g
lide
rsB
andi
-co
ots
Rem
nant
on
lyR
emna
nt
&
adva
nced
re
grow
th
Rem
nant
on
lyR
emna
nt
&
adva
nced
re
grow
th
Brig
alow
Bel
t 3
6.4
260
,200
3
.93
1,02
2,58
6 18
,000
11
0,00
0 -
27,
520
59,
493
108,
155
233
,807
Chan
nel C
ount
ry 2
3.2
500
10
.26
5,1
30
- -
- 9
44
946
9
,689
9
,707
Cent
ral Q
ld C
oast
1.5
2,6
00
42.
12
109,
512
200
4
0,00
0 6
,000
7
04
1,14
7 2
9,66
6 4
8,29
8
Cape
Yor
k Pe
nins
ula
12.1
-
- -
- -
- 2
,417
2
,642
-
-
Des
ert U
plan
ds 6
.9
51,
100
3.4
8 17
7,82
8 -
27,
000
- 4
,229
5
,210
14
,718
18
,130
Eina
slei
gh U
plan
ds 11
.9
2,8
00
1.42
3
,976
-
1,50
0 -
1,57
1 1,
740
2,2
31
2,4
70
Gul
f Pla
ins
21.
8 2
,100
0
.58
1,21
8 -
- -
10,7
73
10,8
42
6,2
48
6,2
88
Mitc
hell
Gra
ss D
owns
24.
3 2
6,90
0 2
.86
76,
934
- -
- 12
,563
14
,440
3
5,93
1 4
1,29
9
Mul
ga L
ands
18.7
8
5,40
0 2
.87
245
,098
-
- -
40,
515
49,
410
116,
279
141,
807
New
Eng
land
Tab
lela
nds
0.8
1,
800
45.
11
81,
198
- 2
8,00
0 3
,000
6
82
1,46
2 3
0,74
4 6
5,92
8
Nor
th-w
est H
ighl
ands
7.2
3
,800
0
.16
608
-
- -
153
157
24
25
Sout
h-ea
st Q
ueen
slan
d 6
.2
7,4
00
51.
24
379
,176
6
00
115,
000
17,0
00
2,0
75
5,2
03
106,
346
266
,616
Wet
Tro
pics
2.0
1,
300
50.
46
65,
598
- 2
0,00
0 3
,000
2
45
407
12
,371
2
0,54
6
Tota
l 17
3.0
445
,900
2
,168
,862
18
,800
3
41,5
00
29,
000
104,
393
153,
098
472
,403
8
54,9
23
* A
t lea
st 1
1% F
PC in
201
3, a
nd n
ot c
lear
ed p
revi
ousl
y in
SLA
TS re
cord
1988
-201
3, a
nd s
o re
grow
ing
sinc
e at
leas
t 198
8.
18 WWF-Australia report 2017: Australian animals lost to bulldozers in Queensland 2013-15
1997-99 estimates 2013-15 updates
Birds lost Areas cleared (ha/yr) Birds lost
General vegetation type
Broad Veg. Types
Remnant cleared (ha/yr)
Densities Nos/ha
Total no. Remnant only
Remnant &
advanced regrowth
Remnant only
Remnant & advanced regrowth
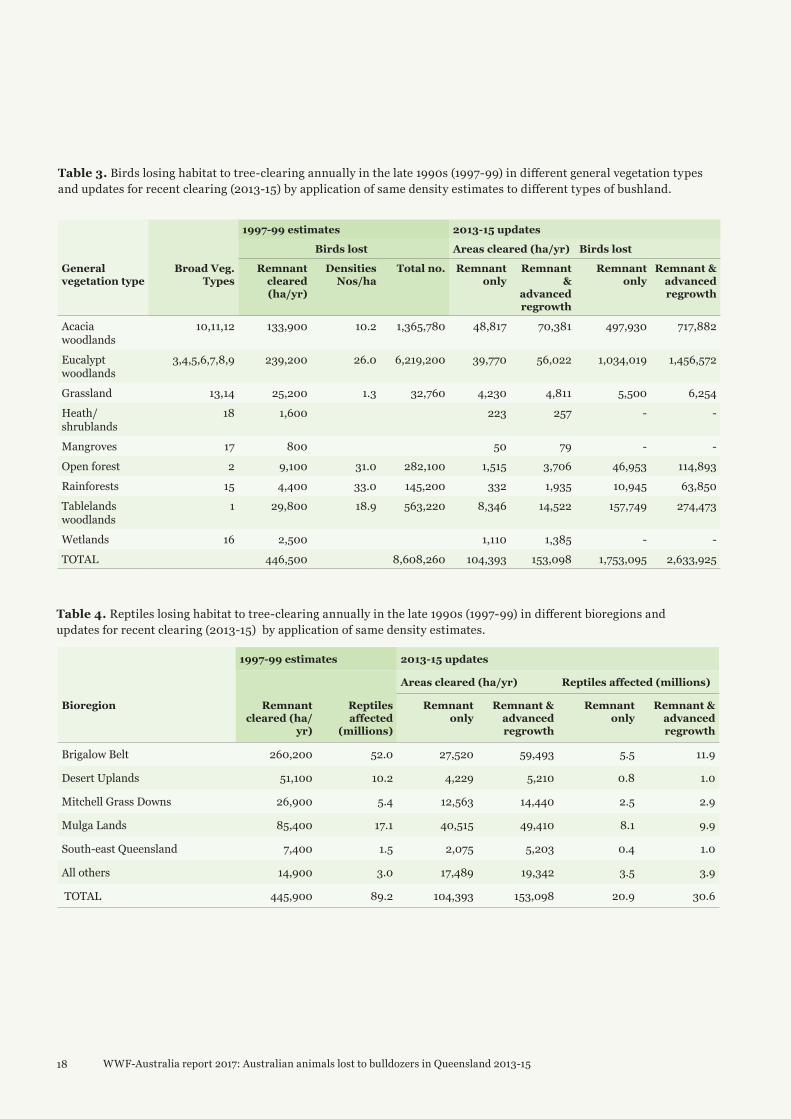
Acacia woodlands
10,11,12 133,900 10.2 1,365,780 48,817 70,381 497,930 717,882
Eucalypt woodlands
3,4,5,6,7,8,9 239,200 26.0 6,219,200 39,770 56,022 1,034,019 1,456,572
Grassland 13,14 25,200 1.3 32,760 4,230 4,811 5,500 6,254
Heath/ shrublands
18 1,600 223 257 - -
Mangroves 17 800 50 79 - -
Open forest 2 9,100 31.0 282,100 1,515 3,706 46,953 114,893
Rainforests 15 4,400 33.0 145,200 332 1,935 10,945 63,850
Tablelands woodlands
1 29,800 18.9 563,220 8,346 14,522 157,749 274,473
Wetlands 16 2,500 1,110 1,385 - -
TOTAL 446,500 8,608,260 104,393 153,098 1,753,095 2,633,925
1997-99 estimates 2013-15 updates
Areas cleared (ha/yr) Reptiles affected (millions)
Bioregion Remnant cleared (ha/
yr)
Reptiles affected
(millions)
Remnant only
Remnant & advanced regrowth
Remnant only
Remnant & advanced regrowth
Brigalow Belt 260,200 52.0 27,520 59,493 5.5 11.9
Desert Uplands 51,100 10.2 4,229 5,210 0.8 1.0
Mitchell Grass Downs 26,900 5.4 12,563 14,440 2.5 2.9
Mulga Lands 85,400 17.1 40,515 49,410 8.1 9.9
South-east Queensland 7,400 1.5 2,075 5,203 0.4 1.0
All others 14,900 3.0 17,489 19,342 3.5 3.9
TOTAL 445,900 89.2 104,393 153,098 20.9 30.6
Table 3. Birds losing habitat to tree-clearing annually in the late 1990s (1997-99) in different general vegetation types and updates for recent clearing (2013-15) by application of same density estimates to different types of bushland.
Table 4. Reptiles losing habitat to tree-clearing annually in the late 1990s (1997-99) in different bioregions and updates for recent clearing (2013-15) by application of same density estimates.
WWF-Australia report 2017: Australian animals lost to bulldozers in Queensland 2013-15 19
How good ArE tHE EstimAtEs?
Some assumptions of these analyses lead to overestimation while others lead to underestimation. We consider however, that the assumptions leading to underestimation greatly outweigh those leading to overestimation, with the net effect of a substantial underestimate of actual animal deaths.
ovErEstimAtion sourcEsThe main assumption leading to overestimation is that death rates following clearing are 100%. They may not be 100% in practice if remaining habitats into which some animals may escape happen to be below carrying capacity. Habitats are thought to be generally at carrying capacity for most species and therefore cannot accommodate any significant influx of new immigrants. In the classic study of rainforest deforestation in the Amazon, bird densities increased rapidly in the remaining islands of forest following clearing of surrounding forest, but then progressively ‘self-thinned’ back down to previous densities as animals died or were displaced further afield. 25
In the case of koalas however, chlamydial disease has greatly reduced koala numbers even in largely untouched habitats. 26 Therefore, active translocations of koalas to large forest tracts have been unexpectedly successful. 27 However, koalas are likely to be an atypical case due to the history of disease in reducing populations below capacity.
Even in close-to-ideal conditions where vertebrates are actively translocated (rather than having to make their own way) into habitat known to be unoccupied or below capacity, the success rate is still only about 50% on average over time frames of three to five years typically. 28 Success rate varies greatly depending on type of translocation. 29
As a group, most reptiles are substantially much less motile than mammals and especially birds and so their ability to escape the impacts of land clearing by migrating to adjacent or nearby blocks of suitable habitat is greatly limited.
For almost all bulldozing of habitat in Queensland there is no active effort required or made to assist animals in relocating to habitats known to have excess capacity to receive them. Hence, this source of overestimation can in most cases be considered minor and greatly outweighed by the underestimation sources discussed below.
25 Lovejoy TE et al, 1986, Edge and other effects of isolation on Amazon forest fragments. pp 257-285 in Soule ME (ed.) conservation Biology: the science of scarcity and diversity. Sinauer Associates, Sunderland Mass.
26 Polkinghorne A, Hanger J & Timms P, 2013. Recent advances in understanding the biology, epidemiology and control of chlamydial infections in koalas. Veterinary microbiology, 165, 214-223.
27 Nottidge B, Tribe A, Hanger J, Green L, & Parkway D, 2003. Monitoring rehabilitated koalas at two release sites on the Gold Coast. In national conference on Wildlife rehabilitation Victoria 2003 (pp. 26-26). Victoria University.
28 In some cases, persistence was assessed over longer time frames and “at least 16 of 77 translocations (21%) where species persisted for greater than five years have subsequently failed”: Short J. 2009, the characteristics and success of Vertebrate translocations within australia. Department of Agriculture, Fisheries and Forestry.
29 Ibid.
20 WWF-Australia report 2017: Australian animals lost to bulldozers in Queensland 2013-15
An additional problem arises if there is long-term decline in population densities. In which case density estimates taken in the past will be overestimates of current actual densities. For example, bird abundances were greatly reduced by a decadal drought in Victoria from about 2006 to 2011, and did not recover during subsequent normal periods to the extent expected.30 Similarly, koala densities were greatly reduced by drought in the mulga country of southwest Queensland, although no study has yet determined if numbers have since recovered. 31 There has been long-term decline in koala populations in southeast Queensland, perhaps due to the legacy effects of past tree-clearing, forest fragmentation and development as discussed above. 32 However, we lack the evidence with which to evaluate the extent to which densities may have declined across many taxa since they were collated and used in the 2003 report. We assume that while some taxa may have suffered density declines, this is not a general phenomenon.
30 Bennett JM et al, 2014, Resistance and resilience: can the abrupt end of extreme drought reverse avifaunal collapse? Diversity and Distributions, 20, 1321-1332.
Mac Nally R et al, 2009, Collapse of an avifauna: climate change appears to exacerbate habitat loss and degradation. Diversity and Distributions, 15, 720-730.
Selwood KE et al, 2015, A bust but no boom: responses of floodplain bird assemblages during and after prolonged drought. Journal of animal ecology, 84, 1700-1710.
31 Seabrook L et al, 2011, Drought-driven change in wildlife distribution and numbers: a case study of koalas in south west Queensland. Wildlife research, 38, 509-524.
32 Rhodes et al, 2015 cited above.
sourcEs of EitHEr ovEr- or undErEstimAtion
Mean estimates of density are necessarily subject to a high level of natural variability. For example, estimates of bird densities used in the 2003 report for broad vegetation group 1, ranged from 9.7 to 32.7 per hectare with an average of 18.9 (Table 3, and Table 6 in the 2003 report). Densities naturally vary in space and time depending on local conditions (whether data are gathered from large and continuous or already fragmented habitats, whether on fertile or infertile soil) and on climate (whether data are gathered from higher rainfall places or during higher rainfall periods, or from lower rainfall environments or during drought).
A key assumption is that density estimates taken in the past will remain applicable now. If the density estimates were taken from periods of abundance, but the current period is one of drought, then losses will be overestimated, as discussed above.
However, this potential source of overestimation is cancelled out and indeed turned to one of underestimation to the extent that the losses due to the population decline itself represent the legacy effects of past clearing, as discussed further below, effects that are not quantified in this or in the 2003 report.
Conversely, if density estimates were derived from periods of drought, but the current period is one of abundance, then losses will be underestimated. Likewise, if density estimates were taken from less fertile habitats, whereas current clearing tended toward more fertile habitats, losses may be underestimated.
To the extent possible, this concern has been minimised by averaging out a number of density estimates taken from different periods for a given habitat type, as described in the 2003 report.
WWF-Australia report 2017: Australian animals lost to bulldozers in Queensland 2013-15 21
undErEstimAtion sourcEsThe estimation methods of the 2003 report do not include other population segments that are also impacted by tree-clearing. These are expected to be very sizeable, and hence overall losses are very likely to be underestimated.
a) Non-remnant bushland: Only the clearing of remnant (also known as intact, mature or primary) forest or bushland was considered in the 2003 report. Excluded from that analysis were the large areas of regrowing forest and bushland that are also cleared. While mature forests are expected to retain the highest natural densities of wildlife, 33 regrowth habitats are also important for woodland birds 34 and reptiles 35, and this is particularly true the more advanced the age of forest. Forest age brings more structure in the form of furrowed bark, knotholes and hollows, fallen timber and foliage debris, as well as a richer resource base of foliage, nectar, pollen, exudates, and invertebrate prey that can support a higher density of vertebrates. 36 Areas of active replanting improve most in value for birds when they are large, wide, structurally complex, old and located near remnant vegetation. 37 Nonetheless, there is little difference between regrowth and remnant brigalow in reptile species richness, diversity, dominance and community composition. 38
In this updated analysis, we extend the methods of the 2003 report by also including clearing of advanced (25 years or older) regrowth bushland, bushland that is likely to have re-attained but has not been formally assessed for remnant status.
Based on the studies above, we believe that the same densities can be applied to advanced regrowth forests as can be applied to remnant. This may overestimate losses to the extent that advanced regrowth cannot support the same animal densities as remnant forests. However, this is likely to be more than offset by the underestimation caused by continuing to exclude from the estimates animals killed during the much larger scale of clearing of younger regrowth. It can also be further offset by differences in species composition rather than a decline in number of individuals.
b) Off-site, indirect deaths. Aquatic wildlife such as fish, turtles and frogs in streams and wetlands downstream of, or adjacent to, areas cleared may also die due to increased runoff and erosion, 39 and water pollution due to agrichemicals or sediments, or increased exposure due to loss of streambank shading. 40
33 Gibson L et al, 2011, Primary forests are irreplaceable for sustaining tropical biodiversity. nature, 478, 378-381.34 Bowen MR et al, 2009, The age and amount of regrowth forest in fragmented brigalow landscapes are both important for woodland dependent birds.
Biological conservation 142, 3051-3059.35 Bruton MJ et al, 2013, Regrowth woodlands are valuable habitat for reptile communities. Biological conservation, 165, 95-103.36 McElhinny C et al, 2006, Fauna-habitat relationships: a basis for identifying key stand structural attributes in temperate Australian eucalypt forests and
woodlands. Pacific Conservation Biology 12, 89-110.37 Monro NT et al, 2007, Faunal response to revegetation in agricultural areas of Australia: A review. ecological Management & restoration 8, 199-207.38 Bruton MJ et al, 2013, cited above.39 Siriwardena l et al, 2006, The impact of land use change on catchment hydrology in large catchments: The Comet River, Central Queensland,
australia. Journal of hydrology 326, 199-214.40 Sweeney BW & Newbold JD, 2014, Streamside forest buffer width needed to protect stream water quality, habitat, and organisms: a literature review.
Journal of the american Water resources association, 50, 560-584.

22 WWF-Australia report 2017: Australian animals lost to bulldozers in Queensland 2013-15
Tree-clearing in the catchments is also recognised as a major threat to the Great Barrier Reef and the marine animals that live there such as dugongs and marine turtles, due primarily to increased runoff, erosion and sediment pollution. 41
Tree-clearing also generates carbon pollution contributing to global warming which may adversely affect many more individual animals on longer time scales. In 2013-14, there were 35.8 million tonnes of CO2 emissions from tree-clearing in Queensland, representing 6.7% of Australia’s greenhouse gas emissions in that year. 42 The impact of climate change on native vertebrates is still poorly understood, but it is predicted that many native species will be adversely affected. 43 Mass deaths of flying foxes in heatwaves are a reminder that tree-clearing also makes a contribution, albeit small, to the rising risk of animal suffering and death due to global warming. 44
c) Legacy deaths. Ongoing losses due to the legacy effects of fragmentation 45 and degradation of the habitat remaining after clearing, are also not included. Losses of animals are not confined just to the sum of all areas of habitat bulldozed. Losses are elevated in the remaining habitats due to edge effects and fragmentation. The type of fragmentation is also very important, depending on the animal species involved. For instance, it is critically important for animals that move along the ground like wallabies, bandicoots or koalas, whether tree-clearing is for a firebreak or a busy road. 46 However, even a firebreak or little used road removes protective cover for native animals and provides avenues for incursions of exotic weeds and feral predators such as cats and foxes. We are unable at this stage to quantify this potentially large segment of wildlife loss due to clearing.
d) Undetected animals: Density estimates in the literature are necessarily underestimates of actual animal densities since they are derived from field surveys which can never detect all animals actually present. There is always an undetected and undetectable fraction of animals that are not observed and counted in field surveys. 47 Even large animals can go undetected in surveys. A recent study of radio tagged koalas found that even trained koala experts only detected 50-74% of koalas known to be present, and detectability depended greatly on forest density. We are unable at this stage to quantify this segment of wildlife loss due to clearing. 48
41 “In addition, the Queensland Government will: • strengthen vegetation management laws to protect remnant and high value regrowth native vegetation (including in riparian zones)” from Great Barrier reef 2050 long-term sustainability Plan http://www.environment.gov.au/marine/gbr/publications/reef-2050-long-term-sustainability-plan
42 Queensland Department of Natural Resources and Mines, 2015, Vegetation clearing rates in Queensland: Supplementary report to the Statewide Landcover and Trees Study Report 2012–14, November 2015. National total emissions of 530.7 million tonnes in 2014, were taken from the National Greenhouse Gas Inventory http://ageis.climatechange.gov.au/.
43 Garnett S & Franklin D (eds) 2014, climate change adaptation plan for australian birds. CSIRO publishing; Lee JR et al, 2015, Mapping the drivers of climate change vulnerability for Australia’s threatened species. PloS one, 10, p.e0124766.
44 http://theconversation.com/killer-climate-tens-of-thousands-of-flying-foxes-dead-in-a-day-2322745 Haddad NM et al, 2015, Habitat fragmentation and its lasting impact on Earth’s ecosystems. science advances, 1, p.e1500052.46 Polak T et al, 2014, Optimal planning for mitigating the impacts of roads on wildlife. Journal of applied ecology, 51, 726-734.47 Wintle BA et al, 2004, Precision and bias of methods for estimating point survey detection probabilities. ecological applications, 14, 703-712.48 Endeavour Veterinary Ecology 2017, Final technical report, Moreton Bay rail Koala Management Program.

WWF-Australia report 2017: Australian animals lost to bulldozers in Queensland 2013-15 23
currEncy of dEnsity EstimAtEs
The density estimates used in the 2003 report were based on a suite of studies which are summarised in that report. Little new information has come to hand in the past decade which would alter those earlier estimates. Reptile density estimates in particular are conservative underestimates, particularly considering they include all reptiles of any size in the soil, on the ground, in bark and in the foliage.
NO
RTH
ER
N B
ETTO
NG
(BE
TTON
GIA TR
OPIC
A) AT A WILD
LIFE CA
RE H
OU
SE IN
RAV
EN
SH
OE
, QU
EE
NS
LAN
D - JU
NE 2016 ©
ste
ph
an
ie to
dd
/ Jcu
/ ww
F-au
s
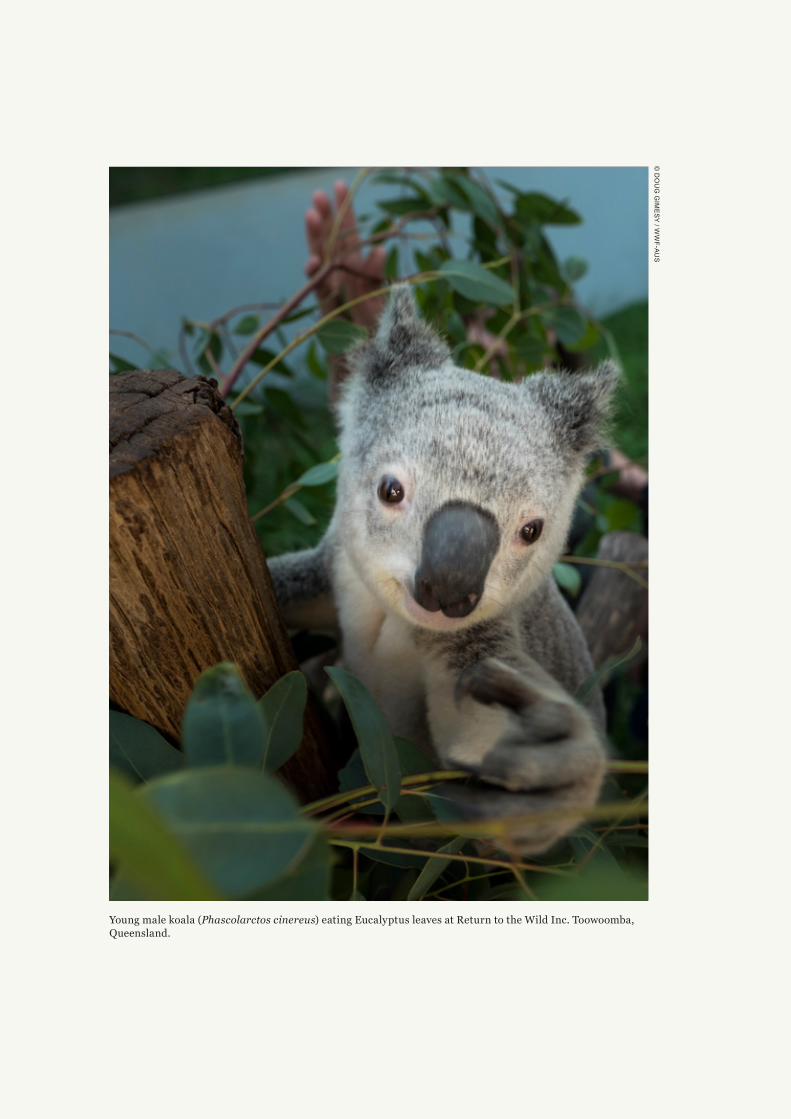
Young male koala (Phascolarctos cinereus) eating Eucalyptus leaves at Return to the Wild Inc. Toowoomba, Queensland.
© d
ou
G G
iMe
sy
/ ww
F-au
s

WWF-Australia report 2017: Australian animals lost to bulldozers in Queensland 2013-15 25
mEtHodsSpatial Data Sources:
● Statewide Land and Tree Study (SLATS) woody cover loss (Queensland Government, 2013-14 and 2014-15 releases)
● Foliage Projective Cover (Queensland Government, 2013 release)
● Regional Ecosystems of Queensland (Queensland Government, version 9, current for 2013)
● Bioregions of Queensland (Queensland Government, 2012)
● Look up table of broad vegetation groups in the above regional ecosystems version 9, matched to the broad vegetation types used in Cogger et al, (2003) (Queensland Herbarium Don Butler pers. comm.)
SLATS tree-clearing layers were combined into one layer for 2013-15. Woody cover loss due natural causes or of non-native vegetation was excluded where indicated as such (plantation harvest, storm damage, drought death).
Tree-clearing polygons were clipped to two different masks:
a) remnant vegetation in 2013 on the basis of the version 9 regional ecosystems layers current for that year; or
b) remnant as above, but also including non-remnant that showed no earlier evidence of clearing in the entire SLATS record since 1988 (that is, had not be cleared in at least 25 years), and which also had 11% or greater foliage projective cover in 2013, the level considered by Queensland to be equivalent to the Kyoto definition of a forest. 49 This advanced regrowth was filtered further to remove small isolated fragments of 0.75ha or less with doubtful value as wildlife habitat.
These two masked extents of areas cleared were then intersected with bioregions and with regional ecosystems respectively and areas cleared within each bioregion or broad vegetation type (as used by Cogger et al, 2003) were calculated using the Albers Equal Area Projection on the GDA94 datum.
Areas so calculated were then multiplied by the density estimates as shown in Tables 3, 5 and 8 of Cogger et al, (2003) to update the estimates of animals lost due to tree-clearing.
49 Scarth P, Armston J & Danaher T, 2008, On the Relationship between Crown Cover, Foliage Cover and Leaf Area Index. Proceedings of the 14th australasian remote sensing and Photogrammetry conference, Darwin, australia, october 2008.

26 WWF-Australia report 2017: Australian animals lost to bulldozers in Queensland 2013-15
Breakdown of recent areas cleared and animal losses by Queensland Department of State Development regions
Remnant and advanced regrowth
Nearest 1000 killed
State Dev. Regions* Cleared (ha) Mammals Birds Reptiles Total
Bundaberg/Maryborough/Burnett 5,997 138 148 1,199 1,486
Rockhampton, Central and West 38,426 174 680 7,685 8,539
Toowoomba, Darling Downs and West 75,525 312 1,106 15,105 16,523
Cairns and Far North Qld 13,351 19 314 2,670 3,003
Gulf 2,715 4 41 543 588
Mackay/Whitsunday 12,823 93 241 2,565 2,898
Townsville and North Qld 2,317 15 46 463 525
SEQ Brisbane 168 9 3 34 45
SEQ North 429 22 12 86 119
SEQ South 552 28 18 110 157
SEQ West 796 41 24 159 224
TOTAL 153,098 855 2,634 30,620 34,108
* https://www.statedevelopment.qld.gov.au/resources/map/dsd-regions-offices-map.pdf
APPEndix

WWF-Australia report 2017: Australian animals lost to bulldozers in Queensland 2013-15 27

28 WWF-Australia report 2017: Australian animals lost to bulldozers in Queensland 2013-15
wwf.org.AuAustrAliAn AnimAls lost to bulldozErs in QuEEnslAnd 2013-15
Why we are here
wwf.org.au
To stop the degradation of the planet’s natural environment andto build a future in which humans live in harmony with nature.
©1986 Panda symbol WWF ® WWF is a registered trademark
Level 1/1 Smail Street,Ultimo NSW 2007GPO Box 528Sydney NSW 2001
Tel:+1800 032 [email protected]@WWF_Australiawwf.org.au
WWF-Australia National Office
wwf advancing environmental protection in Australia since 1978
trEE-clEAring
low-cArbon futurE
ProtEct our mArinE lifE
sPEciEs
foodWWF-Australia campaigns alongside farmers,
industry and local and state governments to help see excessive tree-clearing in Queensland and
New South Wales significantly reduced.
We promote innovative, low-carbon and zero carbon solutions to achieve a more
climate-resilient future before 2050.
We work with partners, governments, Indigenous communities and corporate partners to protect the marine migratory pathways of our turtles, whales, penguins and other marine species.
WWF focuses on bringing some of our most-loved Aussie wildlife species, including the black-flanked rock-wallaby, green turtle, quokka, and koala, back from the brink of extinction.
WWF works towards having sustainable food more widely available than ever before while striving for deeper reductions in food wastage.
© n
as
a