Embed Size (px)
Citation preview

Page 1 International Trade Centre
WTO NAMA Negotiations
Challenges and opportunities for Pakistan
September 2007
WTO NAMA Negotiations
Challenges and opportunities for Pakistan
September 2007

This publication has been produced with the assistance of the European Union (EU) as part of an EU-funded Trade Related Technical Assistance (TRTA) programme with the Government of Pakistan. The International Trade Centre (ITC) is implementing the programme. The designations employed and the presentation of material in this publication do not imply the expression of any opinion whatsoever on the part of the EC, ITC, UNCTAD or WTO concerning the legal status of any country, territory, city or area or of its authorities, or concerning the limitation of its frontiers or boundaries. ITC has not formally edited this report.
Written by: Prof. Sam Laird, International trade and public policy expert, Geneva, Switzerland With initial inputs by: Ms. Huma Fakhar, Chairperson, MAP Services Group and Partner, Fakhar Law International, Lahore, Pakistan
© International Trade Centre (UNCTAD/WTO) Palais des Nations, 1211 Geneva 10, Switzerland Email: [email protected] http://www.intracen.org Publication No. BAS/TS/PAK/E/07/02/rev.1 Distribution: Unrestricted September 2007
ITC: Your Partner in Trade Development The International Trade Centre is the joint technical cooperation agency of the United Nations Conference on Trade and Development (UNCTAD) and the World Trade Organization (WTO) for business aspects of trade development. ITC’s mission is to contribute to sustainable development through technical assistance in export promotion and international business development. ITC’s strategic objectives are:
Enterprises – Strengthen the international competitiveness of enterprises.
Trade support institutions – Develop the capacity of trade service providers to support businesses.
Policymakers – Support policymakers in integrating the business sector into the global economy

Acknowledgements
This publication was originally prepared as a discussion draft for the seminar on the ‘WTO NAMA Negotiations: Challenges and opportunities for Pakistan’ held in Karachi on 3 & 4 November 2006. The seminar was organized as part of the European Union (EU) Trade-related Technical Assistance (TRTA) programme for Pakistan. The TRTA programme aims to enhance awareness among government officials, the business sector and civil society about the implications of WTO Agreements on the economy of the country, and to assist Pakistan in building the necessary capacity to address issues resulting from its participation in the WTO.
The seminar was designed to deepen the understanding of the commercial and economic implications of the WTO Non-Agricultural Market Access (NAMA) negotiations, and of the emerging multilateral trading system. Discussion was designed to bring out the new market access opportunities and threats for business through discussion with international and national experts, business leaders, academicians and trade policy analysts and negotiators.
The seminar allowed public and private sector decision-makers to anticipate changes that the Doha Development Agenda (DDA) will bring about and to position themselves within the new multilateral trading environment. The enhanced knowledge is expected to equip business leaders to play a more meaningful advocacy role with the Government, with a view to contributing to the completion of the DDA negotiations.
The report was finalised and published following the seminar, and revised and updated following the release of the modalities text by the Chair of the NAMA Negotiating Group in July 2007.
The report focuses on four of Pakistan’s major non-agricultural export sectors – namely textiles and clothing, leather goods, chemicals and electrical goods and appliances – in light of the WTO NAMA negotiations.

Abbreviations
ABI Argentina, Brazil & India [tariff cut formula] AOA Agreement on Agriculture DDA Doha Development Agenda DVD Digital video disc EPB Export Promotion Bureau EU European Union FTA Free Trade Agreement GATS General Agreement on Trade in Services GATT General Agreement on Tariffs and Trade GDP Gross Domestic Product GSP Generalised System of Tariff Preferences GSTP Global System of Trade Preferences among Developing Countries ITC International Trade Centre LDCs Least Developed Countries MFN Most-favoured-nation [status] MINFAL Ministry of Food, Agriculture & Livestock NAMA Non-Agricultural Market Access NTBs Non-tariff barriers NWFP North West Frontier Province PC Personal computer PKR Pakistan Rupees PRSP Poverty Reduction Strategy Paper R&D Research & development REGS Rapid Export Growth Strategy T&C Textiles & clothing TDAP Trade Development Authority of Pakistan TRTA Trade Related Technical Assistance TV Television UAE United Arab Emirates UK United Kingdom UNCTAD United Nations Committee on Trade and Development US United States WTO World Trade Organization

Table of contents
Executive summary .. . . . . . . . . . . . . . . . . . . . . . . . . . . . . . . . . . . . . . . . . . . . . . . . . . . . . . . . . . . . . . . . . . . .1
I . Pakistan’s economic and polit ical situation, and prospects .. . . . . . . . . .5 Traditional low value-added industries ............................................................6
Textiles and clothing................................................................................................6 Leather goods...........................................................................................................8 Chemicals...............................................................................................................10 Electrical goods and appliances .............................................................................12
I I. Pakistan’s export and import regimes ... . . . . . . . . . . . . . . . . . . . . . . . . . . . . . . . . . . . 13 Exports..........................................................................................................13
The renaissance of export development.................................................................13 The non-diversified export basket..........................................................................14 Strategic elements in export development .............................................................15
Imports ......................................................................................................1617 Policy support for economic development.....................................................17
Rapid Export Growth Strategy...........................................................................1718 Trade Development Authority of Pakistan ............................................................18
I II . Analysis of Pakistan’s export and imports .. . . . . . . . . . . . . . . . . . . . . . . . . . . . . . 19 Textiles and clothing .....................................................................................19
The importance of the EU’s GSP...........................................................................20 Will the EU’s regional cumulation for SAARC countries help Pakistan’s exports? ..................................................................................................................26
Leather and leather goods ............................................................................26 Chemicals .....................................................................................................27 Electrical goods and appliances....................................................................28 Other sectors of note.....................................................................................28
IV. NAMA negotiations – substantive issues and process ... . . . . . . . . . . . . 29 The state of play of the negotiations – Doha to Hong Kong ...........................29
The Doha mandate .................................................................................................29 Background to the negotiations..............................................................................30 Hong Kong Declaration .........................................................................................32
Formulae for tariff reduction ..........................................................................34 Tariff rationalization of industrial goods in South Asia ...................................38
Bangladesh .............................................................................................................39 India .......................................................................................................................39 Nepal ......................................................................................................................39
Sri Lanka................................................................................................................ 39 Pakistan.................................................................................................................. 40
V. Pakistan’s preferential trade pockets .. . . . . . . . . . . . . . . . . . . . . . . . . . . . . . . . . . . . . . 41 Agreement on South Asian Free Trade Area................................................ 41 FTA with Sri Lanka ....................................................................................... 42 FTA with China............................................................................................. 42
Early Harvest Programme...................................................................................... 43
VI. Conclusions and recommendations .. . . . . . . . . . . . . . . . . . . . . . . . . . . . . . . . . . . . . . . 44
Annex 1 – Pakistan’s top 20 exported products .. . . . . . . . . . . . . . . . . . . . . . . . . . . . 49
Annex 2 – Pakistan’s top 20 imported products .. . . . . . . . . . . . . . . . . . . . . . . . . . . . 50
Annex 3 – Pakistan’s NAMA proposal . . . . . . . . . . . . . . . . . . . . . . . . . . . . . . . . . . . . . . . . . . . 51
References ... . . . . . . . . . . . . . . . . . . . . . . . . . . . . . . . . . . . . . . . . . . . . . . . . . . . . . . . . . . . . . . . . . . . . . . . . . . . 56
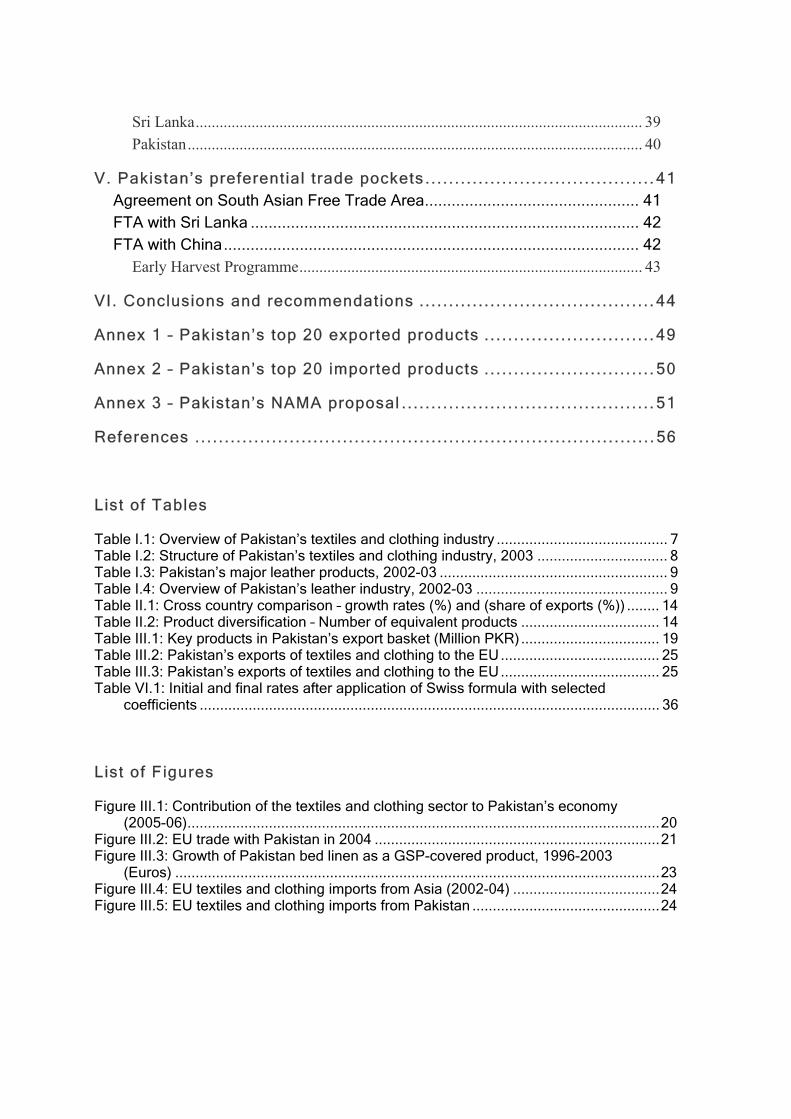
List of Tables Table I.1: Overview of Pakistan’s textiles and clothing industry .......................................... 7 Table I.2: Structure of Pakistan’s textiles and clothing industry, 2003 ................................ 8 Table I.3: Pakistan’s major leather products, 2002-03 ........................................................ 9 Table I.4: Overview of Pakistan’s leather industry, 2002-03 ............................................... 9 Table II.1: Cross country comparison – growth rates (%) and (share of exports (%)) ........ 14 Table II.2: Product diversification – Number of equivalent products .................................. 14 Table III.1: Key products in Pakistan’s export basket (Million PKR).................................. 19 Table III.2: Pakistan’s exports of textiles and clothing to the EU....................................... 25 Table III.3: Pakistan’s exports of textiles and clothing to the EU....................................... 25 Table VI.1: Initial and final rates after application of Swiss formula with selected
coefficients ................................................................................................................. 36
List of Figures Figure III.1: Contribution of the textiles and clothing sector to Pakistan’s economy
(2005-06)....................................................................................................................20 Figure III.2: EU trade with Pakistan in 2004 ......................................................................21 Figure III.3: Growth of Pakistan bed linen as a GSP-covered product, 1996-2003
(Euros) .......................................................................................................................23 Figure III.4: EU textiles and clothing imports from Asia (2002-04) ....................................24 Figure III.5: EU textiles and clothing imports from Pakistan ..............................................24


International Trade Centre Page 1
Executive summary
Pakistan is a developing economy with a population of 156 million, the world’s sixth largest. Pakistan’s Gross Domestic Product (GDP) in 2006 was estimated at approximately US$404.6 billion. Pakistan ranks 55th worldwide in factory output. Pakistan’s industrial sector (non-agricultural goods) accounts for about 24% of GDP. The manufacturing sector grew at an average rate of 8% from the 1960s to the 1980s, but growth fell to 3.9% during the 1990s. The manufacturing sector has shown impressive recovery in recent years, growing at a compound rate of 10.9% per annum during 2001 and 2005, with large-scale manufacturing growing even faster.
The food, textiles and clothing (T&C), and leather industries heavily dominate (over 50%) Pakistan’s manufacturing sector. Cotton-based textiles alone contributed 46% of total manufacturing, 60% of total exports and employed 38% of all industrial workers.1 The textile industry’s share of the economy, along with its contribution to exports, employment, foreign exchange earnings, investment and value added, makes it Pakistan’s single largest manufacturing sector. The leather industry is the second largest foreign exchange earner after textiles. It is one of the established indigenous manufacturing sectors to have developed reasonably well. Leather exports have increased at an average rate of 11% per annum. At present, the industry contributes at least 5% to manufacturing GDP, 7% to total exports and provides direct employment for more than 200,000 people.
The chemical processing industry contributes 21% to value added of Pakistan’s manufacturing sector. It is capital-intensive, and its share in employment is 9%. Pakistan’s electronics industry has grown rapidly in recent years, with nearly 1 million television (TV) sets, 300,000 personal computers (PCs), and 250,000 digital video disc (DVD) units produced in the country in 2004. As an indication of this growth, only 60,000 TV sets were produced in 2000. Several local brand names have also appeared.
Exports from Pakistan increased at an annual compound rate of 5.6% during the 1990s. However, from 2000-01 these started to increase at a faster pace, with annual compound growth of almost 16% between 2002 and 2006. Exports were expected to reach US$18.6 billion in 2007, an increase of 12.9%.2 Pakistan’s exports are highly concentrated in a few items, namely, cotton, leather, synthetic textiles and sports goods. Despite the overall fast growth of exports, exports of textile manufactures only grew by 6.2% – a disappointing performance. Prominent among these exports are knitwear (growing at 13.9%), readymade garments (6.8%), made up articles (8.9%), cotton yarn (4.6%), and towels (2.6%). Exports of other textile materials registered a high double-digit growth of 17.2%. Export of raw cotton, cotton cloth and bed wear on the other hand registered a decline. Pakistan’s exports are also highly concentrated in a few countries.
The World Trade Organization (WTO) Non-Agricultural Market Access (NAMA) negotiations aim at binding and reducing tariffs not just on industrial products, but also on products like fish and fishery products, which also fall outside the purview of the Agreement on Agriculture (AOA). This agreement is important for developing countries, because the products and sectors
1 Ministry of Finance Economic Survey 2006-07, available at
http://www.finance.gov.pk/survey/survey.htm. 2 Ministry of Finance Economic Survey 2006-07 (op. cit.).

Page 2 International Trade Centre
that fall under its ambit are of vital importance to the industrial development of these countries and to the livelihoods of their people.
Since the Hong Kong Ministerial Conference in December 2005, attention has focused on variations of the so-called Swiss formula by which higher tariff rates are reduced to a proportionately greater extent than lower rates, and the maximum rate for a country’s rates is set at a level determined by the “a” coefficient. Pakistan’s proposal is for a Swiss formula with two “a” coefficients of 6 and 30 – in effect setting future maximum rates – to be applied by developed and developing countries, respectively. These coefficients are similar to the existing unweighted averages of bound tariff lines for these groups of countries. This approach would also have the effect of compressing or “harmonising'” tariff levels within each of the two groups of countries, bringing down high tariffs that prevail in some other key developing country markets. The idea of having two Swiss coefficients, one for developed and another for developing countries, is also favoured by Canada, the European Union (EU) and the United States (US) but with coefficients of 10 and 15 for developed and developing countries, respectively. These proposals for dual Swiss coefficients, by Pakistan, Canada, the EU and the US, would lead to greater harmonisation of rates within the developed and developing country groups, respectively.
In a draft text put forward by the Chairman of the NAMA Group in July 2007, it is stated that there is “an almost unanimous view that a simple Swiss formula with two coefficients should be adopted”.3 The Chairman then suggests a compromise in which the rates coefficient for developed countries would lie in the range of 8-9, while that for developing countries would be in the range 19-23. In either case, the agreed approach would be supplemented by the possibility of the elimination of tariffs (on a voluntary basis by developing countries) in some sectors, said to be of export interest to developing countries. There would also be the flexibility of keeping a certain percentage of tariff lines unbound or of applying no or less than formula cuts.
However, the Chairman’s July 2007 text is not yet an agreed position, and no other proposal has been formally withdrawn. For example, Argentina, Brazil and India (ABI) made a proposal, largely based on an earlier proposal by the first Chairman of the NAMA Negotiating Group, Ambassador Girard of Switzerland, by which the “a” coefficient for each country would essentially be based on its existing average bound rates, so that with the application of the formula the average rate would become the maximum rate.4 A group of developing countries, the so-called NAMA 11,5 further suggested in June 2007 that consideration might even be given to returning to another early proposal in which linear or straight percentage cuts were the key element. A number of other proposals by individual countries and groups have largely been overtaken by subsequent proposals from the same countries or groups in which they participate.
The application of the formulae, supplementary modalities and flexibilities makes the outcome difficult to evaluate, and the impact would also vary across sectors depending on the initial levels of tariffs. In the major developed country markets, the formula itself is critical but the possibility of the elimination of tariffs in sectors of interest to developing countries could be 3 WTO document JOB(07)/126 of 17 July 2007. 4 Under this proposal the “a” coefficient could be multiplied by a second, “b”, coefficient which, if greater
than unity, would lessen the tariff-cutting effect. 5 The NAMA 11 consists of Argentina, Bolivarian Republic of Venezuela, Brazil, Egypt, India, Indonesia,
Namibia, Philippines, South Africa and Tunisia.

International Trade Centre Page 3
very important. Whichever formula is used, the effects on Pakistan’s exports to other developing country markets would depend on the extent to which Pakistan’s key exports were excluded from the tariff reductions by use of the “flexibilities” available to such countries. There is some concern that other forms of protection, such as anti-dumping, could replace tariffs, negating the effects of the formulae cuts. Pakistan has every reason to be concerned about this possibility, having been subject to such actions in developed countries in the past.
The Doha Ministerial Declaration requires “less than full reciprocity” in tariff reduction commitments for least developed and developing countries, but this is not defined. Some (mostly developed) countries argue that establishing a higher “a” coefficient for developing countries under the Swiss formula meets this requirement. However, in previous rounds of negotiations, “less than full reciprocity” (a term taken from GATT Article XXVIII bis) has been manifest in a lesser percentage cut in tariffs by developing countries. On the basis of the full range of coefficients currently under consideration, there would be a higher percentage cut in bound rates by developing countries.
In the work carried out under this project,6 tariff cut simulations for Pakistan’s four major non-agricultural export sectors (T&C, leather, chemicals and electrical goods) show that the various formulae under consideration would provide improved market access opportunities for Pakistani exports. These simulations of tariff cuts cover 33 major industrial export products (15 top export products from T&C, 4 from leather, 10 from chemicals and 4 from electrical goods).
This analysis suggest that an objective for Pakistan in the NAMA negotiations should be to eliminate the tariff peaks of developed countries as they are hurting its exports, especially in the T&C sector which constitutes about 70% of its exports, and all of the formulae being considered should largely achieve this objective, with varying degrees of success. Some previously privileged T&C exporters with greater preferences than Pakistan are also seeking special provisions that would reduce the value of formula cuts or extend the implementation periods in this area, and, while this has been successfully resisted till now, no doubt such proposals would be welcomed in competing industries in major markets. This is obviously an area where Pakistan needs to be particularly attentive.
At the same time, Pakistan needs to consider how best to pursue a defensive approach that provides an adequate cushion against the potential negative impact of rapid adjustment to external shocks. For example, Pakistan may avail itself of the flexibilities to exclude certain sectors from tariff reductions or protect them from the full depth of formula cuts. The dual Swiss formula with coefficients of 10 and 15 (or 8-9 and 19-23, as now proposed by the Chairman of the NAMA Group) could prove difficult for some areas within Pakistan’s industrial sector. Therefore, the main question for Pakistan will be to decide on which variation of the flexibilities to adopt. Here it has the choice of excluding up to 5% of tariff lines from any formula reduction (provided that does not exceed 5% of imports), or applying half of the formula cuts to 10% of tariff lines (not exceeding 10% of imports). The ultimate choice
6 See WTO NAMA Negotiations: Challenges and opportunities for Pakistan – NAMA formulas – Tariff cut
scenarios, ITC, February 2007. However, it should be noted that the main work for the simulation study was carried out on the basis of 2005 tariff structures, when Pakistan’s unweighted bound average MFN rate was some 35% (the corresponding applied MFN rate was 14%). However, early in the negotiations, Pakistan extended its binding coverage to close to 99% of tariff lines, raising the overall unweighted average MFN rate to 55% in 2006. This means that the Pakistan coefficient in the ABI formula would rise from 35 to 55, implying even less cuts of bound tariff rates for Pakistan than those shown in that study.

Page 4 International Trade Centre
depends on how many sensitive sectors would be affected under the alternatives, but given the width of Pakistan’s industrial base, it may be tempting to adopt the second of these two approaches.
This same choice of flexibilities is also being faced by other developing countries and this could have implications for Pakistan’s prospects for increasing its exports to other developing countries. This seems to be less of a problem in the Gulf States where rates are quite modest but could be important in other developing markets. In those cases, Pakistan may wish to consider deepening its ties within Asia to take advantage of the high growth of some markets in the region.
Overall, the alternative formulae options, the possibility of elimination of tariffs in some key sectors (with voluntary participation by Pakistan), and the flexibilities for exclusions or less than formula cuts all raise some difficult questions for Pakistani policy-makers in relation to the pace and depth of its ongoing reforms, as well as in relation to the policies to be pursued in promoting nascent industries to diversify and expand Pakistan’s production and trade base. Too deep cuts and too rapid reforms could have negative effects on sensitive sectors in the short term, including for employment and tariff revenues. On the other hand, maintaining high levels of industrial protection may involve longer-term welfare costs and could have negative effects on the export drive by raising the costs of material inputs.
In conclusion, Pakistan should continue its active participation in the NAMA negotiations and keep pressing for better market access in developed countries through steep reductions in their tariff levels. Pakistan needs to work together with other developing countries to maintain solidarity in the NAMA negotiations and better press its position. It should also seek to deepen regional ties with fast growing markets in the Asian region.
International Trade Centre Page 5
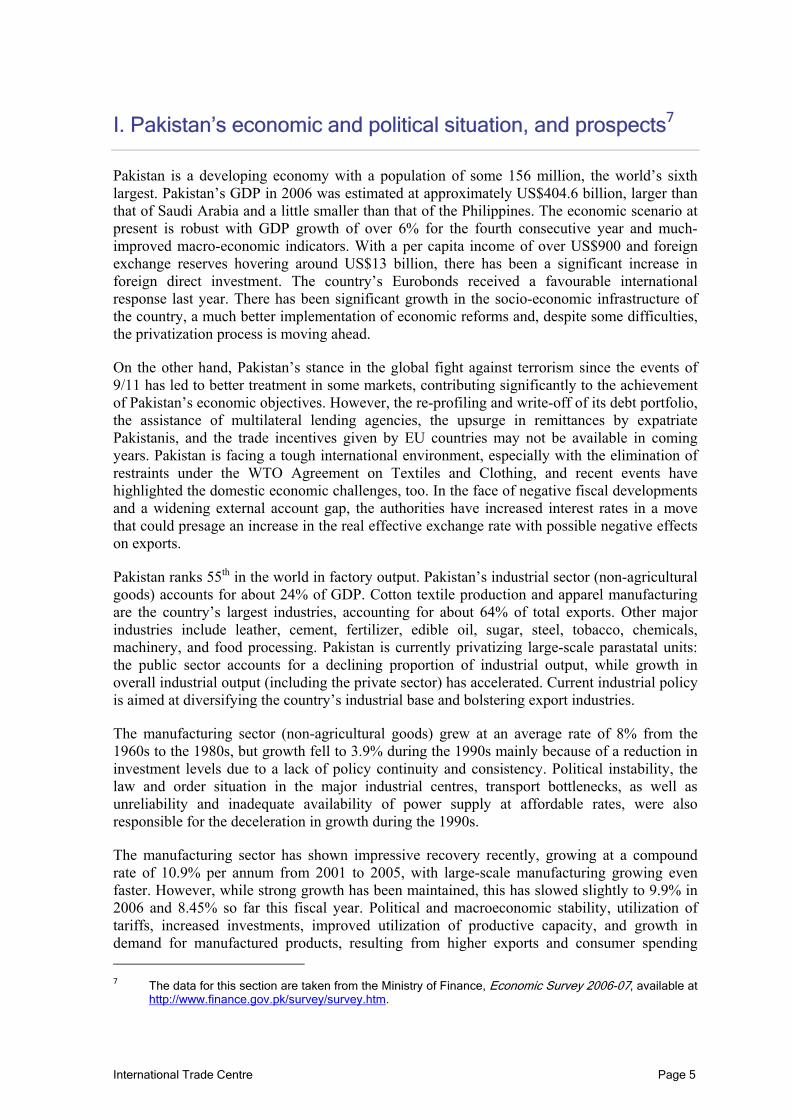
I. Pakistan’s economic and political situation, and prospects7
Pakistan is a developing economy with a population of some 156 million, the world’s sixth largest. Pakistan’s GDP in 2006 was estimated at approximately US$404.6 billion, larger than that of Saudi Arabia and a little smaller than that of the Philippines. The economic scenario at present is robust with GDP growth of over 6% for the fourth consecutive year and much-improved macro-economic indicators. With a per capita income of over US$900 and foreign exchange reserves hovering around US$13 billion, there has been a significant increase in foreign direct investment. The country’s Eurobonds received a favourable international response last year. There has been significant growth in the socio-economic infrastructure of the country, a much better implementation of economic reforms and, despite some difficulties, the privatization process is moving ahead.
On the other hand, Pakistan’s stance in the global fight against terrorism since the events of 9/11 has led to better treatment in some markets, contributing significantly to the achievement of Pakistan’s economic objectives. However, the re-profiling and write-off of its debt portfolio, the assistance of multilateral lending agencies, the upsurge in remittances by expatriate Pakistanis, and the trade incentives given by EU countries may not be available in coming years. Pakistan is facing a tough international environment, especially with the elimination of restraints under the WTO Agreement on Textiles and Clothing, and recent events have highlighted the domestic economic challenges, too. In the face of negative fiscal developments and a widening external account gap, the authorities have increased interest rates in a move that could presage an increase in the real effective exchange rate with possible negative effects on exports.
Pakistan ranks 55th in the world in factory output. Pakistan’s industrial sector (non-agricultural goods) accounts for about 24% of GDP. Cotton textile production and apparel manufacturing are the country’s largest industries, accounting for about 64% of total exports. Other major industries include leather, cement, fertilizer, edible oil, sugar, steel, tobacco, chemicals, machinery, and food processing. Pakistan is currently privatizing large-scale parastatal units: the public sector accounts for a declining proportion of industrial output, while growth in overall industrial output (including the private sector) has accelerated. Current industrial policy is aimed at diversifying the country’s industrial base and bolstering export industries.
The manufacturing sector (non-agricultural goods) grew at an average rate of 8% from the 1960s to the 1980s, but growth fell to 3.9% during the 1990s mainly because of a reduction in investment levels due to a lack of policy continuity and consistency. Political instability, the law and order situation in the major industrial centres, transport bottlenecks, as well as unreliability and inadequate availability of power supply at affordable rates, were also responsible for the deceleration in growth during the 1990s.
The manufacturing sector has shown impressive recovery recently, growing at a compound rate of 10.9% per annum from 2001 to 2005, with large-scale manufacturing growing even faster. However, while strong growth has been maintained, this has slowed slightly to 9.9% in 2006 and 8.45% so far this fiscal year. Political and macroeconomic stability, utilization of tariffs, increased investments, improved utilization of productive capacity, and growth in demand for manufactured products, resulting from higher exports and consumer spending 7 The data for this section are taken from the Ministry of Finance, Economic Survey 2006-07, available at
http://www.finance.gov.pk/survey/survey.htm.

Page 6 International Trade Centre
(fuelled by increased remittances), have been the major factors leading to this growth. The share of manufacturing in Pakistan’s GDP is currently 18.2%, and production costs have come down because of higher production volumes and economies of scale. The Government has made important efforts to reduce the costs of production in Pakistan. In this regard, it has reduced tariffs on raw materials in order to ensure low cost inputs in most sectors for cost effective production. The positive effects of these changes have been most marked in the electronics and heavy engineering sectors.
The food, T&C, and leather industries heavily dominate (over 50%) Pakistan’s manufacturing industry. The share of textiles and its derivatives in exports was as large as 67% in 2003-04. Other major segments in manufacturing include chemicals and pharmaceuticals (15.2%), basic metal industry (7.7%), non-metallic mineral products (5.1%), machinery (4.6%), cement (4.4%), and automobiles (4.4%). Automobiles, electronics, cement, fertilizers and textiles have all showed cumulative double-digit growth during the last three years. The share of high technology goods in Pakistan’s export basket is less than 1%, whereas engineering goods made up 63% of world trade in 2003, with electronics contributing nearly half of this value. Thus, Pakistan appears to be underperforming in this sector.
Tradit ional low value-added industries
Pakistan’s manufacturing sector still revolves around traditional low value-added industries, whose share in world trade is either declining (resource based and low technology goods) or nearly constant (medium technology goods). An efficient, world standard supply chain, which is critical for local industry to develop, is missing, partly due to insufficient scale economies and partly to bundling of raw material, parts and modules by multinationals in their assembly-oriented companies, which discourage a local vendor industry.
Textiles and clothing
T&C holds the biggest share of Pakistan’s manufacturing sector as well as its exports, contributing 10.5% to GDP, 68% to exports and employing 38% of all industrial workers in 2003/04. The T&C industry – with its share of the economy, and its contribution to exports, employment, foreign exchange earnings, investment and value added – is Pakistan’s single largest manufacturing sector.
With exports reaching about US$8.6 billion in 2004-05, Pakistan is one of the world’s largest textile exporters. T&C trade is classified into two broad categories, i.e. textiles, which includes yarn, fabric and made-ups; and clothing, which represents ready-made garments. The variety of products ranges from cotton yarn to knitwear. Made-up garments and bed wear are the most important export products, with an export value of about US$1.35 billion each. Knitwear, ready-made garments and cotton yarn also have important shares in total exports.
Overall, the US and EU are Pakistan’s largest trading partners accounting for a 25% and 20% share of Pakistani exports, respectively. Other major importers include China (yarn), the Untied Arab Emirates (UAE) and Saudi Arabia.
Table I.1 gives an overview of Pakistan’s textile industry.

International Trade Centre Page 7
Table I.1: Overview of Pakistan’s textiles and clothing industry
Total number of units (2005)
Ginning 1,221
Spinning 445
Weaving Large 140 Small 425 Power looms 20,600
Finishing Large 106 Small 625
Garments Large 600 Knitwear 700 Towels 400
Total capacity
Ginning More than 10 million bales
Spinning 1,900 million kilograms yarn
Weaving 5,600 million square metres of fabric
Finishing 3,500 million square metres
Garments 650 million pieces
Knitwear 350 million pieces
Towels 55 million kilograms
Major economic contribution by textile sector during 2002-03
Exports 68% of total exports (US$7.4 billion)
Manufacturing 46% of total manufacturing
Employment 38% of total industrial workers
GDP 10.5% of total GDP
Investment 31% of total investment
Taxes PKR 101 billion per annum
Interest PKR 44 billion per annum
Salaries & wages PKR 4.5 billions per annum
Contribution to R&D PKR 148 billion per annum
Bank financing US$1 billion during 2002 and 2003
Investment in last 4 years US$4 billion
Source: Digest of Industrial Sectors in Pakistan & Pakistan Investment Guide
At present, the T&C sector consists of a large-scale organized sector and a highly fragmented, cottage/small-scale sector. The organized sector comprises integrated textile mills, i.e. spinning units with shuttle-less looms. The downstream industry (weaving, finishing, garments, towels and hosiery), with great export potential, is mostly in the unorganized sector.
Table I.2 depicts the structure of Pakistan’s T&C industry.

Page 8 International Trade Centre
Table I.2: Structure of Pakistan’s textiles and clothing industry, 2003
Sector Sub-sector No. of units
Size Production
Spinning 403 9.2 million spindles 147,852 rotors
1,500 million kgs
Composite units 50 9,876 looms 384 million m2
Total 453
Independent weaving units
124 23,600 shuttle-less looms
Finishing units 10
Large-scale mill sector
Garment units 50 5,000 sewing machines
Independent weaving units
453 50,000 looms 3,600 million m2
Power looms 20,600 175,200 looms
Total 21,053 225,200 looms
Finishing 625 Cotton Synthetic
2,700 million m2 760 million m2
Terry towels 400 7,602 looms 53 million kgs
Garments 2,500 300,000 sewing machines
600 million pieces
Cottage/small-scale sector
Knitwear 600 12,000 knitting machines
400 million pieces
Source: Pakistan Investment Guide (Experts Advisory Cell)
Pakistan’s T&C sector is suffering due to high costs of production and Pakistan’s negative image relating to terrorism. The way forward is to concentrate on competitiveness and niche products. Concentration on high-end yarns, woven fabrics, and home textiles (including towels) should be a priority. At the same time, investments should not saturate a particular product line: denim fabric is a good example. In light of reduced numbers of key players in this sector globally, a level of regional co-ordination in South Asia and China remains of prime importance.
Preferential market access is important for this sector. However, for countries like Pakistan with few preferential pockets, the multilateral NAMA negotiations are the sole solution. Tariff reduction at the multilateral level will surely increase trade in this sector and Pakistan should encourage consensus with other developing countries to pursue this aim. The fact that the T&C sector engages 38% of the total workforce of the country and accounts for 68% of its total exports makes this an important goal for the Government.
Leather goods
Pakistan’s leather industry also contributes substantially to GDP: it is the second largest foreign exchange earner after T&C. Leather exports have increased at an average of 11% per annum. At present, the industry contributes around 6% to manufacturing GDP and 7% to total exports, and provides direct employment for around 250,000 people. There are more than 2,500 tanneries and footwear-manufacturing units, mainly located in Karachi, Lahore, Sialkot and Kasur.

International Trade Centre Page 9
Pakistan is well known internationally for very high quality, and a wide-range, of finished leather garments (sports jackets) and gloves (working and industrial). However, Pakistan’s contribution of leather goods (handbags, purses, suitcases, key chains, belts, etc) and footwear is very small. The major leather products manufactured by the sector include footwear, leather garments, leather gloves, handbags, purses, key chains, wallets, etc.
The comparative position of value addition in leather and leather made-ups is given in Table I.3.
Table I.3: Pakistan’s major leather products, 2002-03
Item Quantity Value
(US$ million)Conversion
rates Quantity
(million ft2) US$ / ft2 of
leather
Finished leather 12.61 million m2 177 10.76 135.58 1.31
Leather garments 7.1 million pieces 295 45 ft2 / piece
35 ft2 / piece
30 ft2 / piece
25 ft2 / piece
322.20
250.60
214.80
179.00
0.92
1.18
1.37
1.68
Leather gloves 19.38 million pieces 26 1.0 ft2 / piece
1.5 ft2 / piece
2.0 ft2 / piece
19.38
29.07
38.76
1.34
0.89
0.67
Leather footwear 2.75 million pieces 23 1.75 ft2 / pair
2.0 ft2 / pair
2.5 ft2 / pair
4.13
5.50
6.88
5.57
4.18
3.34
Source: Ministry of Food, Agriculture & Livestock (MINFAL)
Around 80% of leather production is exported. The share of leather products in total exports declined from 9.1% in 1990-91 to 5.3% in 2003-04. Leather products – like jackets, shoes and gloves – account for more than two-thirds of leather exports with tanned unfinished leather accounting for the remaining third. Exports of leather from Pakistan are normally finished leather, mostly used in footwear, goods and upholstery. Of total leather exports from Pakistan, 53% is of skin leather. This is opposite to the world trend where skin leather constitutes only 11% of total leather exports.
Table I.4 below provides an overview of Pakistan’s leather industry.
Table I.4: Overview of Pakistan’s leather industry, 2002-03
Total number of units
Tanneries 725
Leather garments/apparel 461
Leather footwear 524
Leather gloves 384
Leather goods 142
Leather sports goods 160

Page 10 International Trade Centre
Total capacity
Tanned leather 90 million m2
Leather garments/apparel 7 million pieces
Leather gloves 10 million pieces
Leather footwear 200 million pieces
Export growth (1991 to 2001) 1.11%
Contribution to total growth 7%
Source: Pakistan Tanneries Association (PTA)
More than 80% of the leather industry’s units are located in Karachi and Lahore. There are numerous tannery units in the unorganized sector, producing leather on a cottage basis with negligible use of machinery and present day technology. The industry is also flourishing in Hyderabad, Multan, Sahiwal, Kasur, Sheikhupura, Gujranwala, Sialkot and Peshawar. The growing capacity for tanning in the country has given a fillip to the development of the footwear and leather goods manufacturing industries, which produce gloves, garments bags and other products.
The leather sector is facing similar problems to those of the T&C sector, in terms of high production costs and Pakistan’s brand image problems. In addition, a main problem is that the majority of Pakistan’s exports are of skin leather rather than products, which is opposite to world trends.
There is a need to encourage and improve the production and export of leather gloves and leather footwear, rather than exporting the skin leather to be used by importing countries themselves to make footwear and other leather goods. Pakistan’s footwear exports are currently minimal compared to its finished leather exports. Footwear production and export should be encouraged in order to capitalize on available raw material and to promote downstream value-added goods. Leather product manufacturers should also begin developing local brand loyalty of their products. Venturing into the local market and creating a consumer base at home is a good start before moving gradually into high-end goods for export.
Chemicals
The chemical processing industry contributes 21.2% to Pakistan’s manufacturing value added. It is capital-intensive and its share in employment is 8.9%. Pharmaceuticals, fertilizers, synthetic resins and petroleum refining and products constitute the bulk of the sector’s value added.
The chemical industry is significant: the global chemical market is worth US$1.8 trillion and its trade volume is US$600 billion. Over the last two decades the industry has grown at a rate of 1.5 times the world GDP growth rate. The Asia-Pacific region chemical industry has grown faster than the global chemical industry and adds US$30 billion of output every year. As much as 45% of the total chemical products produced in the region are bulk organic chemicals, which also form a major component in the export basket from the region. This region commands a 30% share of the global chemical market and is fast emerging as a key player in the global chemicals business.

International Trade Centre Page 11
Petrochemical and chemical products constitute approximately 40% of Pakistan’s total imports. Pakistan has no facilities to produce basic petrochemicals – like ethylene, propylene, butadiene, etc. – and they are imported in bulk. Total production of chemicals in Pakistan is around US$3 billion. Imports of chemical-related products constitute 20%, or around US$2 billion, of total imports. Thus, there is a vast potential for development of this sector through import substitution and self-reliance.
Locally available natural gas, petroleum and coal resources are being used mainly to meet the energy requirements of the country. They have not been utilized in the manufacture of chemicals where, in some cases, value-addition can be ten-fold. The only exception is the use of natural gas to produce fertilizers. There exists vast potential to manufacture chemicals from reserves of indigenous natural gas, coal and minerals.
Some organized chemical sectors are well developed. A few basic chemicals – like sulphuric acid, caustic soda, soda ash and chlorine – have sufficient installed capacity to meet local demand. Most raw materials and intermediates for dyes and pigments, paints and varnishes, pesticides, and plastics and plasticizers are being imported. These raw materials and intermediates mainly belong to or are derived from petrochemicals, which have no base in Pakistan.
Dyes and pigments are being produced locally but only partially meet local demand. Most of these raw materials are imported. Active ingredients used in pesticides and insecticides are not produced locally, but about 30 units are involved in formulations based on imported raw materials. There is a strong need for domestic production of some active ingredients. Numerous units are involved in the production of soaps and detergents. However, there is heavy dependence on imported tallow for soaps and alkyl benzene, and sulfonic acid for the production of detergents. The plastics, plasticizers and polyester downstream industries are well developed but, again, depend on imported petrochemical raw materials, i.e. olefins, poly olefins and benzene, toulene and xylene (BTX).
Development of the petrochemical sector has been neglected, in spite of numerous recommendations over the last three decades to setup a naphtha or hydro cracker. No appreciable progress is possible in the chemical sector without the indigenous production of petrochemical building blocks, like olefins (ethylene, propylene, butadiene) and basic aromatics, like BTX. In view of the importance of basic petrochemicals, the setting up of a petrochemical complex is strongly recommended.
Major issues for the chemical sector include the inadequate supply of energy and other inputs as well as their high cost, an obsolete technology base, limited research and development (R&D) and quality control, environmental problems, and the large investments required to diversify into other processes with higher scales of production. However, this would likely require greater levels of import protection or support than are presently available and any such increases would run counter to the Government’s liberalisation strategy. So far, investment in this industry is estimated to be PKR 360 billion.
This sector also faces serious threats from Chinese exporters, who have had a history of dumping chemicals in the Pakistani market. The Government may need to take effective measures to safeguard this sector against such activities.

Page 12 International Trade Centre
Electrical goods and appliances
Pakistan’s electronics and electrical goods industry is basically a consumer product industry, involved in the manufacture of electric light bulbs, tubes, air conditioners, fans, refrigerators, freezers, television sets, radios, and other electrical appliances. The home appliance sector has grown phenomenally in the last five years: production of refrigerators grew by 20% and air conditioners by 31% from 2001 to 2005. Consistent production growth over this period was due to robust growth in the economy. This, coupled with improved quality, has lead to a preference for local products and gradual development of brand loyalty. Additionally, a low tariff regime has encouraged price competitiveness.
Pakistan does not produce picture tubes, deflection yokes, etc., which are vital components for a number of electrical goods being assembled and manufactured locally. Hence, there is demand for spare parts and various accessories, which are presently being imported. Growth in this sector is being hampered by lack of availability of local raw materials, capacity constraints due to low investment, high financial and infrastructure costs and relatively low technology levels. However, despite the above factors, Pakistan’s exports in the home appliance sector remain competitive.
Adequate market access could open doors for Pakistan’s electronic exports to a US$72 billion annual world trade in appliances. The Government should consider granting a degree of protection and incentives to this growing sector, particularly with the Chinese Free Trade Agreement (FTA) expected to come into force in 2007. It is also important that Pakistan continues its efforts to curtail the smuggling of electronic goods into the country via Afghanistan. The northern areas (Punjab & NWFP) are especially affected by the influx of such smuggled products. Increasingly, used television sets and picture tubes are also being smuggled into the country from China.
Larger production volumes have also resulted in the development of a vibrant vendor industry, with major opportunities in sub-assembly and modules. There is enormous scope for indigenous development and manufacturing of switching equipment, computers, modems and routers, and broadband Internet services. The Government plans to assist development of an international quality indigenous supply chain, and to raise the share of electronics in the output of the manufacturing sector from under 3% at present to 10% in 2010 and 20% in 2020.

International Trade Centre Page 13
II. Pakistan’s export and import regimes
In 1947, only 5% of the large-scale industrial facilities in British India were located in what became Pakistan. The country started with virtually no industrial base and no institutional, financial, or energy resources.
The pace of industrialization in Pakistan since independence has been rapid, although it has fluctuated in response to changes in government policy and world economic conditions. During the 1950s, manufacturing expanded at about 16% annually. During the first half of the 1960s it expanded at around 11% a year, but this pace slowed to under 7% a year in the second half of the 1960s. Between 1970-71 and 1977-78 the index of manufacturing output increased on average by only 2.3% a year, but this rose to an average of 9.9% a year between 1977-78 and 1982-83. Growth averaged 7.7% during the Sixth Five-Year Plan (1983-1988) and 5.4% from 1989-90 to 1992-93. In 1993-94, manufacturing accounted for 17.3% of GDP, of which large-scale manufacturing accounted for 61% and small-scale manufacturing for 39%. Manufactured goods accounted for 64% of all exports by value in 1993-94; the bulk of these exports came in the relatively low-technology areas of cotton textiles and clothing.
In the early 1990s, food processing and textiles dominated the manufacturing sector. Provisional figures for 1992-93 indicated that sugar production was 2.1 million tons, vegetable ghee 819,000 tons, cotton yarn 862,000 tons, and cotton cloth 234 million metres. Other industrial products included motor tyres (647,000 units), cycle tyres (2.2 million units), cement (6.1 million tons), urea (1.4 million tons), soda ash (147,000 tons), bicycles (364,000 units), and paperboard (13,000 tons).
Exports
Exports from Pakistan in 2005-06 were US$16.47 billion, an increase of 14.4% over the previous fiscal year. During the period from 1999 to 2003 world exports increased by 31%. During the same period, Pakistan’s exports grew by 43% reflecting an improvement in its world share. By comparison, Singapore’s exports increased by 26%, Malaysia 19%, Indonesia 25%, UAE 5%, and the Philippines 1%.
Pakistan’s main exports are textiles and related products. The world textile trade is currently estimated to be worth around US$300 billion. Pakistan’s share of current trade volume is around 3%. Pakistan’s non-textile exports are negligible.
The renaissance of export development
Exports from Pakistan had annual compound growth of 5.6% during the 1990s. However, from 2000-01 exports started to increase at a faster pace, with an annual compound growth rate of 9.1% during the period 2001 to 2004. Exports reached US$12 billion in 2003-04.
Over time, there has been a shift in the composition of exports with the share of primary commodities falling and that of manufactured goods increasing. The share of primary commodities decreased from 19% in 1991 to 11% in 2002-03; the share of manufactured goods increased from 57% to 78% during the same period. This increased share of manufactured goods has lessened Pakistan’s export vulnerability to fluctuations in the international price of primary commodities. Pakistan’s principal exports are cotton yarn, cotton

Page 14 International Trade Centre
fabrics, ready-made garments, synthetic textiles, hosiery, other textile made-ups, fish products, leather and leather garments, sports goods, surgical goods and carpet. The T&C sector alone has been the backbone of the export sector.
Pakistan is not a major player in international trade. In fact, it is under-represented as a trading nation based on its share of world exports and imports when compared with other developing countries: it accounted for merely 0.12% of world exports in 2004. In addition, its share in world exports has declined from 0.26% in 1960 to 0.12% in 2004, whereas the share of other developing countries has increased manifold. For example, Korea has increased its share of world exports from 0.1% during the 1960s to 2.06% in 2000.
Table II.1 below explains the share of world exports over time.
Table II.1: Cross country comparison – growth rates (%) and (share of exports (%))
Region / Country 1960s 1970s 1980s 1990s 2000s
World 8.8 20.1 6.8 6.6 7.2
Asia 4.5 23.8 10.9 8.3 5.4
China 0.04 (1.31) 22.1 (0.2) 14.3 (1.39) 13.7 (2.72) 21.0 (3.5)
India 4.1 (0.91) 14.4 (0.55) 10.0 (0.48) 9.2 (0.58) 14.0 (0.58)
Korea 39.4 (0.10) 37.4 (0.63) 17.2 (1.56) 9.8 (2.27) 7.7 (2.06)
Malaysia 4.1 (0.68) 23.3 (0.53) 8.6 (0.74) 11.5 (1.27) 1.3 (1.16)
Pakistan 0.3 (0.26) 20.1 (0.13) 8.1 (0.15) 5.9 (0.12) 12.2 (0.12) Source: International Trade Centre
The non-diversif ied export basket
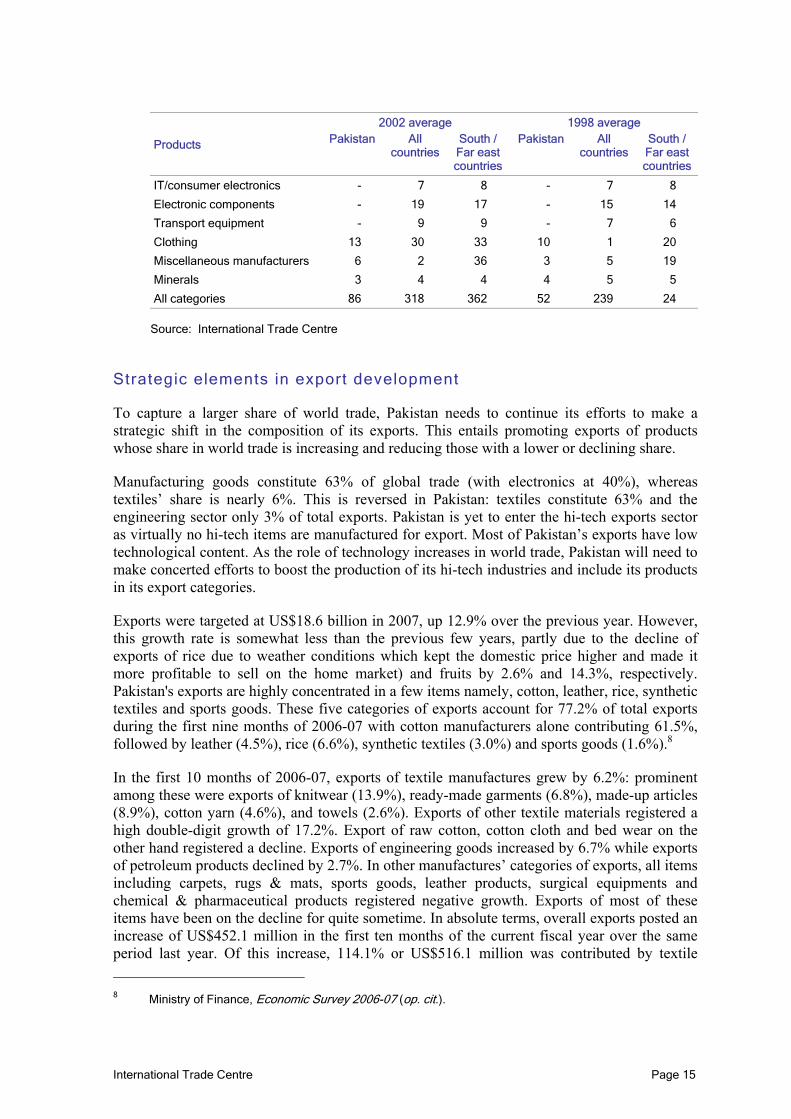
It has been widely acknowledged that Pakistan’s export base is extremely narrow; the cotton group alone contributes 63% of export earnings. Not only is Pakistan’s export base relatively undiversified, it is also concentrated in relatively low value added products. This combination represents a serious issue for Pakistan. Unfortunately, there has been little progress in increasing the number of products; only 34 new products have been added since 1998.
Table II.2 below explains Pakistan’s diversification vis-à-vis all other countries and South/Far Eastern countries.
Table II.2: Product diversification – Number of equivalent products
2002 average 1998 average
Products Pakistan All countries
South / Far east countries
Pakistan All countries
South / Far east countries
Fresh food 9 15 19 13 14 16
Processed food 2 14 15 12 10 11
Wood products - 15 15 - 13 13
Textiles 30 37 43 11 20 25
Chemicals 4 4 66 - 43 5
Leather products 5 8 3 8 5 6
Basic manufacturers 14 53 60 6 42 47
Non-electronic machinery - 31 29 - 25 26
International Trade Centre Page 15
2002 average 1998 average
Products Pakistan All countries
South / Far east countries
Pakistan All countries
South / Far east countries
IT/consumer electronics - 7 8 - 7 8
Electronic components - 19 17 - 15 14
Transport equipment - 9 9 - 7 6
Clothing 13 30 33 10 1 20
Miscellaneous manufacturers 6 2 36 3 5 19
Minerals 3 4 4 4 5 5
All categories 86 318 362 52 239 24 Source: International Trade Centre
Strategic elements in export development
To capture a larger share of world trade, Pakistan needs to continue its efforts to make a strategic shift in the composition of its exports. This entails promoting exports of products whose share in world trade is increasing and reducing those with a lower or declining share.
Manufacturing goods constitute 63% of global trade (with electronics at 40%), whereas textiles’ share is nearly 6%. This is reversed in Pakistan: textiles constitute 63% and the engineering sector only 3% of total exports. Pakistan is yet to enter the hi-tech exports sector as virtually no hi-tech items are manufactured for export. Most of Pakistan’s exports have low technological content. As the role of technology increases in world trade, Pakistan will need to make concerted efforts to boost the production of its hi-tech industries and include its products in its export categories.
Exports were targeted at US$18.6 billion in 2007, up 12.9% over the previous year. However, this growth rate is somewhat less than the previous few years, partly due to the decline of exports of rice due to weather conditions which kept the domestic price higher and made it more profitable to sell on the home market) and fruits by 2.6% and 14.3%, respectively. Pakistan's exports are highly concentrated in a few items namely, cotton, leather, rice, synthetic textiles and sports goods. These five categories of exports account for 77.2% of total exports during the first nine months of 2006-07 with cotton manufacturers alone contributing 61.5%, followed by leather (4.5%), rice (6.6%), synthetic textiles (3.0%) and sports goods (1.6%).8
In the first 10 months of 2006-07, exports of textile manufactures grew by 6.2%: prominent among these were exports of knitwear (13.9%), ready-made garments (6.8%), made-up articles (8.9%), cotton yarn (4.6%), and towels (2.6%). Exports of other textile materials registered a high double-digit growth of 17.2%. Export of raw cotton, cotton cloth and bed wear on the other hand registered a decline. Exports of engineering goods increased by 6.7% while exports of petroleum products declined by 2.7%. In other manufactures’ categories of exports, all items including carpets, rugs & mats, sports goods, leather products, surgical equipments and chemical & pharmaceutical products registered negative growth. Exports of most of these items have been on the decline for quite sometime. In absolute terms, overall exports posted an increase of US$452.1 million in the first ten months of the current fiscal year over the same period last year. Of this increase, 114.1% or US$516.1 million was contributed by textile 8 Ministry of Finance, Economic Survey 2006-07 (op. cit.).

Page 16 International Trade Centre
manufactures while ‘all other items’ increased by 64.8% or US$293.2 million. This increase of US$809 million was offset by a decline of exports of rice (US$59.3 million) and other manufacturers (US$296.6 million) leaving a net increase of US$452 million.
The Government of Pakistan attributes the less than satisfactory export performance of textile manufacturers to a variety of factors.9 First, it appears that Pakistan’s textile exporters are having difficulties in competing with their traditional competitors. Second, the discriminating and tied-dumping duty of 5.8% on bed linen exports also affected Pakistan’s competitiveness. Third, the poor quality of cotton, due to the contaminated cotton issue, has also adversely affected exports of the spinning industry. Fourth, the rise in the prima cotton price (a genetically modified version), which is imported from the US and is a critical input for producing higher quality bed wear and fabrics, has made these items less competitive in the international market. Pakistan’s export industry also appears to be suffering a need to install new equipment that would lift quality and productivity, shifting away from low value added and poor quality products that fetch low international prices. According to the Government, the issues mainly need to be addressed by the private sector, with the Government playing its role of facilitating and providing some financial support on a temporary basis. Pakistan’s exporters spend little money on R&D, and exporters lack the capacity to meet bulk orders or consumer demands in terms of fashion and design.
Pakistan’s exports are also highly concentrated in a few countries. Seven countries – namely the US, Germany, Japan, UK, Hong Kong, Dubai and Saudi Arabia – account for 50% of its exports. The US, at 27% of total exports, is Pakistan’s single largest export market, followed by the United Kingdom (UK), Dubai, Germany and Hong Kong. Japan is fast losing significance as an export destination, with less than 1% of Pakistan’s exports entering Japan.
Pakistan needs to diversify its exports, not only in terms of commodities but also in terms of markets. Heavy concentration of exports in few commodities and few markets could cause serious export instability.
Imports
Pakistan’s imports continue to be pushed higher by the unprecedented rise in oil prices and continued strength of non-oil imports owing to buoyant domestic demand. Imports were projected to grow by 4.25% for the fiscal year 2005-06. In the first 9 months (July-March), imports were up by 43.2% – rising from US$14.5 billion to US$20.7 billion over the same period the previous year.
Disaggregation of total imports suggests that food imports grew by 35.9% – up from US$990.7 million to US$1.4 billion. Major contributors included wheat, sugar and pulses, which together contributed 93% to the substantial rise in food imports.
Imports of petroleum products have played a key role in taking Pakistan’s imports to a new height. Emerging as the single largest item in the country’s import bill, petroleum group imports amounted to US$4.6 billion during the first 9 months of 2005-06, an increase of 64.5% over the same period in the previous year. Although the quantities of imported crude and petroleum products are down by 2.3% and 5.8%, respectively, the prices of these two items rose by 76.6% and 62.9%, respectively, compared with the previous year, causing imports of
9 Idem.

International Trade Centre Page 17
these two items to rise by 64.5% in value terms. Despite quantity being down, Pakistan was forced to pay US$1.9 billion more to import crude and petroleum products.
Major contributions to 2005-06 incremental imports came from the petroleum group (29%), and raw materials and machinery (almost 35%). These three items alone are responsible for 64% of the increase in imports and for 27.6% of the 43.2% growth in total imports over last year.
Consumer durables, including cars, contributed only 6.4% to the increase in total imports and 2.8% of the 43.2% growth in total imports over last year. Within this category of imports, electrical machinery and appliances contributed a mere 1.7%, and cars only 4.7%.
Like exports, Pakistan’s imports are highly concentrated in a few items, namely machinery, petroleum and petroleum products, chemicals, transport equipment, edible oils, iron and steel, fertilizer and tea. These eight import categories accounted for 72.5% of total imports during 2005-06: machinery, petroleum and petroleum products, and chemicals together accounted for 53.4% of total imports. The concentration of imports remained, by and large, unchanged over the last decade, with the exception of 2000-01.
Pakistan’s imports are highly concentrated from few countries: over 40% of imports originate from just seven countries, namely, US, Japan, Kuwait, Saudi Arabia, Germany, UK and Malaysia. Saudi Arabia is emerging as a major supplier, followed by the US and Japan.
Policy support for economic development
The present multilateral trade negotiations on the Doha Development Agenda (DDA) in the WTO are likely to result in further liberalization of industrial trade and give rise to new opportunities for exporters. However, optimum benefit from these opportunities can only be achieved if sound sector strategies are prepared and succeed in generating exportable surpluses that are competitive both in terms of price and quality. With this in mind, the Prime Minister of Pakistan has asked the Planning Commission to develop sectoral development strategies for traditional or core industrial sectors, as well as developmental sectors with good potential.
Rapid Export Growth Strategy
In order to facilitate a quantum jump in the level of exports, the Trade Policy 2005-06 announced a Rapid Export Growth Strategy (REGS) based on the following five pillars:
1. Resort to trade diplomacy to increase market access.
2. Regional diversification of export markets.
3. Strengthening of the trade promotion infrastructure.
4. Skill development.
5. Early provision of modern infrastructure.
Within the REGS framework, Pakistan planned to focus attention from 2006-07 on the export promotion of a few selected product groups, with a view to facilitating annual exports of each of these products to a level in excess of US$1 billion within 3 years. The product groups

Page 18 International Trade Centre
selected for this purpose include leather products, engineering goods, chemicals and pharmaceuticals, towels, denim, and services.
Trade Development Authority of Pakistan
In view of the rapidly changing international trading environment, the Government has established the Trade Development Authority of Pakistan (TDAP) with the objective of achieving a quantum jump in Pakistan’s exports. The Authority’s mandate has been expanded to include trade development rather than just export promotion. The President signed the Ordinance bringing the TDAP into operation in November 2006. The Authority replaces the Export Promotion Bureau (EPB), which was responsible for trade promotion for the previous 43 years.
The TDAP will be equipped with the necessary resources and autonomy so that it can effectively exploit opportunities for increasing Pakistan’s prosperity through enhanced trade. A Policy Board, chaired by the Commerce Minister and with members representing both the public and private sectors, will supervise the Authority. Highly qualified professionals, paid market-based salary packages, will staff the TDAP. The transition from EPB to TDAP will take approximately 18-24 months.

International Trade Centre Page 19
III. Analysis of Pakistan’s export and imports
Pakistan’s exports during 2004-05 were US$14.4 billion, compared with US$12.3 billion in 2003-04 and US$11.2 billion in 2002-03. This reflects an increase of 16.9% and 28.9%, or achievement of Pakistan’s export targets by 101.7% and 107.3%, respectively.
Following is an analysis of four of Pakistan’s important export sectors. Data on Pakistan’s top 20 exports and imports are attached as Annex 1 and Annex 2, respectively.
Texti les and clothing
The T&C sector contributed 62% to Pakistan’s exports in 2004-05, increasing in value to US$8.9 billion, up 8% over 2003-04. Major categories registering an increase over the previous year were: cotton cloth (9%), knitwear (hosiery) (12%), ready-made garments (10%), towels (29%) and textiles made-ups, including bed wear (6%). There was also a decrease in some items, such as yarn (6%), synthetic textiles (36%) and tents and canvas (11%).
Five categories of goods – cotton yarn, garments and hosiery, cotton cloth, raw cotton and rice – account for 80% of the country’s export earnings. Table III.1 below shows Pakistan’s core export basket.
Table III.1: Key products in Pakistan’s export basket (Million PKR)
Period Raw
cotton Cotton fabrics
Cotton yarn& thread
Knitwear Bedwear Woollen carpets
1999-2000 3,760.8 56,757.2 55,551.4 45,913.1 36,757.1 13,200.4
2000-01 8,072.5 60,485.6 62,954.8 53,201.6 43,649.8 16,424.7
2001-02 1,502.1 69,296.9 57,165.3 52,089.6 56,383.6 14,976.9
2002-03 2,872.6 78,665.4 54,342.0 67,033.7 77,633.0 12,689.8
2003-04 2,741.5 98,542.2 64,868.0 84,014.8 79,666.0 13,173.4
2004-05 6,549.3 110,578.7 62,805.6 96,879.8 86,063.9 16,216.9
Source: www.statpak.gov.pk
A basic analysis of Pakistan’s T&C sector underlines its importance to the social and economic welfare of the country. The sector accounts for more than 69% of total exports, while its share in total manufacturing is 46%. Total textile exports are worth US$8.4 billion, and account for 8.5% of GDP. Substantial investment in the T&C sector over the 5 years from 1999 to 2004 amounted to US$4.5 billion.
Importantly, the sector also accounts for 38% of the country’s employment.10 The clothing sector is the single largest source of industrial employment in the country, employing mainly men (87%) as sewers, with women working in trimming and packing (23%)11. The sector’s
10 Textile Commissioner’s Organization, Ministry of Textile Industry, Government of Pakistan.
11 There is no specific source of these figures and numbers vary distinctly from different sources. The above reflects a mean analysis of the situation determined through industry interviews.

Page 20 International Trade Centre
labour costs are among the lowest in the world, but quality and productivity are also generally low.
Figure III.1 below shows the contribution of the T&C sector to Pakistan’s economy.
Figure III.1: Contribution of the textiles and clothing sector to Pakistan’s economy (2005-06)
Source: Pakistan Textile Commissioner’s Organisation.
Pakistan has an established industry, which adds value at all levels from cotton to made-ups. A broad policy framework – Textile Vision 2005 – aims to make Pakistan a more viable, stronger and more competitive textile industry, especially at the value added stages. For this, over US$2 billion has been invested over the last 3 years on the restructuring of the textile industry as a whole. Emphasis is being laid on increasing the share of downstream industry in overall textile exports, meaning greater value addition. Vertically integrated units or specialized mills both demand consistent quality across huge volumes of single items of clothing, which can only be produced with a skilled workforce.
Despite the high number of units and employment opportunities in the clothing sector, investments here are lowest at 4.8%, compared with spinning, which attracted investment of 47%.
The importance of the EU’s GSP
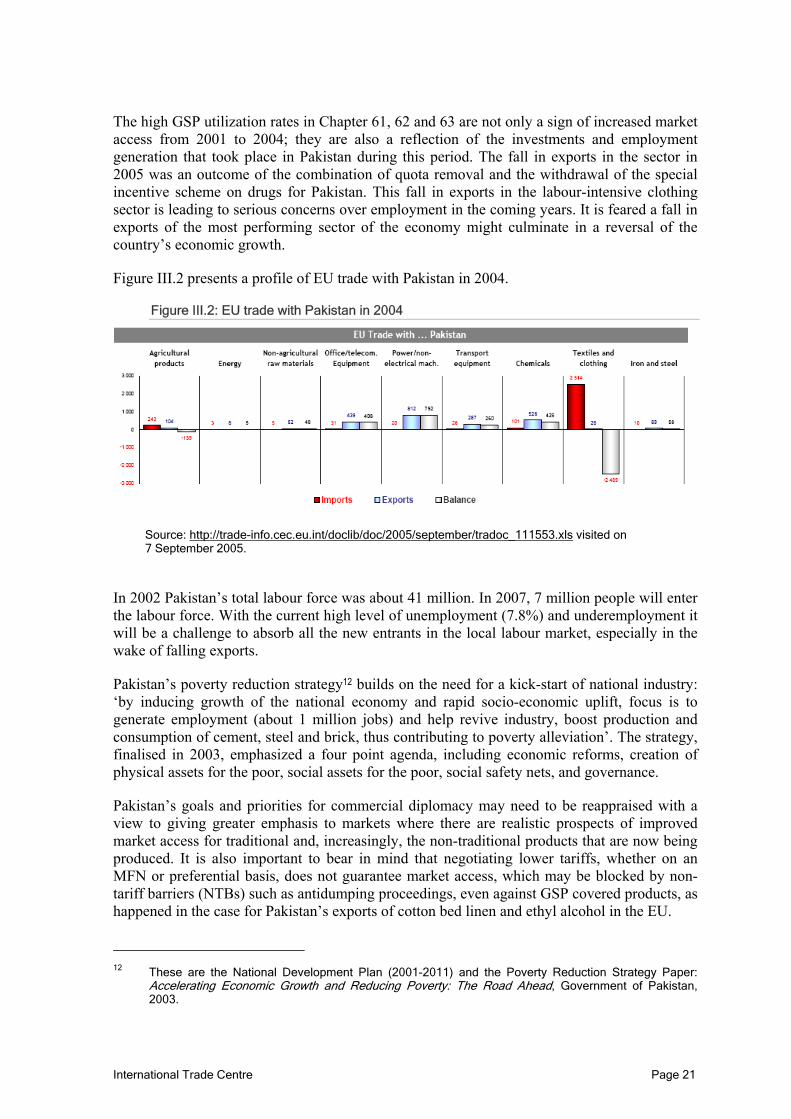
From 2002 to 2004 Pakistan gained substantially from the special incentive for drugs. From 1999 to 2004, Pakistan experienced a fall in exports of raw cotton, whereas exports of fabrics, knitwear and bed wear, including garments, increased tremendously as a result of the EU’s Generalised System of Preferences (GSP) scheme. (Figure III.2 below gives a profile of EU trade with Pakistan in 2004.) However, this steady growth from 2001 to 2004 decreased in the first quarter of 2005. While there was growth of more than 11% in yarn and fabrics, knitwear and bed wear exports fell by 10%–15%.
11% 9%
67%
8%31% 38% 27% 16%
89% 91%
33%
92%69% 62% 73% 84%
0%10%20%30%40%50%60%70%80%90%
100%
GDP
Value A
dded
Expo
rts
Marke
t Cap
italiz
atio
n
Fixed
Ass
ets
Emplo
ymen
t
Emplo
ymen
t Cos
t
Indire
ct Ta
xes
Textile Others
International Trade Centre Page 21
The high GSP utilization rates in Chapter 61, 62 and 63 are not only a sign of increased market access from 2001 to 2004; they are also a reflection of the investments and employment generation that took place in Pakistan during this period. The fall in exports in the sector in 2005 was an outcome of the combination of quota removal and the withdrawal of the special incentive scheme on drugs for Pakistan. This fall in exports in the labour-intensive clothing sector is leading to serious concerns over employment in the coming years. It is feared a fall in exports of the most performing sector of the economy might culminate in a reversal of the country’s economic growth.
Figure III.2 presents a profile of EU trade with Pakistan in 2004.
Figure III.2: EU trade with Pakistan in 2004
Source: http://trade-info.cec.eu.int/doclib/doc/2005/september/tradoc_111553.xls visited on 7 September 2005.
In 2002 Pakistan’s total labour force was about 41 million. In 2007, 7 million people will enter the labour force. With the current high level of unemployment (7.8%) and underemployment it will be a challenge to absorb all the new entrants in the local labour market, especially in the wake of falling exports.
Pakistan’s poverty reduction strategy12 builds on the need for a kick-start of national industry: ‘by inducing growth of the national economy and rapid socio-economic uplift, focus is to generate employment (about 1 million jobs) and help revive industry, boost production and consumption of cement, steel and brick, thus contributing to poverty alleviation’. The strategy, finalised in 2003, emphasized a four point agenda, including economic reforms, creation of physical assets for the poor, social assets for the poor, social safety nets, and governance.
Pakistan’s goals and priorities for commercial diplomacy may need to be reappraised with a view to giving greater emphasis to markets where there are realistic prospects of improved market access for traditional and, increasingly, the non-traditional products that are now being produced. It is also important to bear in mind that negotiating lower tariffs, whether on an MFN or preferential basis, does not guarantee market access, which may be blocked by non-tariff barriers (NTBs) such as antidumping proceedings, even against GSP covered products, as happened in the case for Pakistan’s exports of cotton bed linen and ethyl alcohol in the EU.
12 These are the National Development Plan (2001-2011) and the Poverty Reduction Strategy Paper:
Accelerating Economic Growth and Reducing Poverty: The Road Ahead, Government of Pakistan, 2003.

Page 22 International Trade Centre
Ant i-dumping dut ies on GSP-covered products
Pakistan’s two key products – cotton bed linen and ethyl alcohol – performed exceptionally well in the EU market under the GSP preferential regime. However, this performance has been curbed and restricted by recent anti dumping investigations.
Textile exports from Pakistan in general, and value-added textile exports in particular, suffered a drastic set back as a result of the tragic events on 11 September 2001 in the US. The decision by Pakistan to join the international coalition in the fight against terrorism was based on principles other than its immediate consequence on the economy of the country. However, in order to enable Pakistan to play its role effectively, both the EU and the US offered aid packages.
Under the EU package all value-added exports from Pakistan, i.e. ready-made garments, finished fabric and knitwear, were exempted from import duty with effect from 1 January 2002. Pakistan’s export quota for T&C was increased by 15% with effect from 1 December 2001 and the anti-dumping duty of 6.4% levied on imports of bed linen from Pakistan was terminated. The package made Pakistan eligible for the new GSP scheme applicable to countries combating drugs, removing tariffs on T&C. As a result, Pakistan improved its access to the EU market. The applicable tariffs on T&C were reduced to 5%, 15% and 25% from the beginning of 2002 – a 5% reduction across the board compared with 2001 tariffs.
EU Trade Commissioner, Pascal Lamy, while presenting the package to the EU Council of Ministers and the European Parliament, declared:
We have made these negotiations a top priority because Pakistan is in an exceptional situation. We have targeted those areas where Pakistan can benefit most, namely clothing and textiles. Trade is a weapon of peace. Through trade, and the fostering of greater economic ties with Pakistan, the EU can contribute to alleviating in some measure its current difficulties.
As a direct result of these concessions, there was a surge in bed linen exports to the EU. The value of bed linen exports to the EU increased to approximately 26.5% of the value of total exports of bed linen from Pakistan in the year 2002-03. Exports of bed linen were 18% of the total textile exports of the country in 2003, up from 8% in 1996. Figure III.3 below highlights the steady growth in bed linen exports, which doubled in value from €245,505,650 in 1996 to €533,532,900 in 2003.
However following this increase, and in the wake of Commissioner Lamy’s affirmation that Pakistan was in an ‘exceptional situation’ and that the EU would contribute to alleviating its difficulties through the lifting of import duties, the EU imposed a 13.1% anti-dumping duty on Pakistani bed linen effective from 18 March 2004. In addition, Pakistan also failed to qualify for the EU’s new GSP plus scheme, inter alia also losing the 12.8% benefit of the special drug incentive. In total, the booming bed linen exports suffered a duty of approximately 25%.
The investigation of the EC bed linen case gave rise to some important questions about the EU GSP. In addition to being a GSP-covered product, the increase in imports of bed linen from Pakistan during the investigation period was much less than those of other countries into the EU. For example, imports from Poland increased by 99% (from 4,677.4 to 9,307.7 tonnes), from Turkey by 65% (from 13,412.2 to 22,082.7 tonnes), from Romania by 62% (from 3,179.9 to 8,342.7 tonnes) and from the People's Republic of China by 58% (from 2,842.1 to 4,479.6

International Trade Centre Page 23
tonnes). Moreover, EU market share held by Pakistani producers/exporters (21%) was much lower than the overall increase in market share of imported bed linen (46.3%) or the increase of the market share of Romania (116.3%) or Poland (64%).
Figure III.3: Growth of Pakistan bed linen as a GSP-covered product, 1996-2003 (Euros)
Source: Trade Development Authority of Pakistan (previously Export Promotion Bureau).
While the increase in exports of bed linen from Pakistan was considered dumping, third country exports of bed linen into the EU were not accounted for. The EU also rejected the calculations of Pakistani manufacturers relating to production costs, as well as the price of bed linen in the local Pakistani market. Bed linen export prices were based on calculations of a deemed profit margin of only 3.5%, while a profit margin of 6.5% was taken for the EU industry. This issue was challenged in the reply to the injury statement but was not upheld during the proceedings.
The surge in imports of bed linen from Pakistan during 2002 was helped by the EU concession granted to Pakistan to benefit from duty-free access under the anti-drug GSP special regime. Therefore, the increase was not due to dumping but to the application of lower, preferential rates of duty. Curiously, most of the complainants in the EC investigation were buyers of bed linen from Pakistan that did not seem to be suffering any loss of profitability. Indeed, most complainants boasted of stable results, e.g. Dewerchin: ‘the company is enjoying even greater success and its bed linen is now positioned at the top end of the range’.13 While such promotional statements cannot constitute formal evidence, it is clear that the steady growth in production of developing country T&C product lines was not at odds with the high-end products manufactured by most of the complainant companies.
Pakistan’s share of the EU T&C market is 1.9%. Pakistan’s core competitors in T&C exports to the EU are China, Bangladesh, India, and Sri Lanka. Figure III.4 below shows China’s lead with a market share above 20%, followed by Bangladesh with 6%. India enjoys a 5% market share, while Pakistan and Sri Lanka have less than 3% each.
13 http://www.obcebdbh.be/import_en/info-center/beci views/2000/b142/part3_en.html, visited December
2004.
0
100,000,000
200,000,000
300,000,000
400,000,000
500,000,000
600,000,000
1 2 3 4 5 6 7 8
Ye a r
Euro
s
19 20 20 20 2019 1919 1996 1997 1998 1999 2000 2001 2002 2003
Year

Page 24 International Trade Centre
Figure III.4: EU textiles and clothing imports from Asia (2002-04)
Source: PRGMEA Secretariat, Karachi.
As a result of the Drugs Arrangement, Pakistan’s T&C exports to the EU grew post-2001 at a steady pace. Pakistan’s exports almost doubled from €480 million to €810 million in two years from 2002 to 2004,14 as can be seen in Figure III.5 below.
Figure III.5: EU textiles and clothing imports from Pakistan
Source: PRGMEA Secretariat, Karachi.
It is estimated that, for each €4,100 worth of exports to the EU, employment is generated for one person. In other words, a €330 million increase in exports to the EU over the next 3 years would mean job creation for 483,000 workers. In the spinning sector, every investment worth €700 million will generate employment for 30,000 workers in the country. Similarly, every investment worth €700 million in a clothing-manufacturing unit will generate employment for
14 PRGMEA Secretariat, Karachi
480
650
810
€ 0€ 100€ 200€ 300€ 400€ 500€ 600€ 700€ 800€ 900
Value in millions
2002 2003 2004
0%
5%
10%
15%
20%
25%
Market Share
China BDIn
dia
Pakist
an
Sri Lan
ka

International Trade Centre Page 25
600,000 workers.15 However, these increases can only happen if Pakistan improves its competitiveness through government efforts to improve the policy and institutional environment and infrastructure for business, and strengthens its commercial diplomacy efforts in markets with real prospects of improved access, including through preferences.
Tables III.2 and III.3 below show the increase in Pakistani exports of garments into the EU market. However, this is no longer the case and industry sources suggest that exports have fallen at an average of 10-15% across the board, but the reversal is greatest in the EU. These negative effects, resulting from the loss of the GSP, the phasing out of the T&C quotas from January 2005, and the non-diversified export basket within the T&C sector, are hurting Pakistan’s economy and the sector itself.
Table III.2: Pakistan’s exports of textiles and clothing to the EU
HS4 6106: Women's or girls' blouses, shirts and shirt-blouses, knitted or crocheted:
Year Imports to EUR-15 (Euros) Exports from EUR-15 (Euros)
1996 4,392,910 2,730
1997 5,550,330 3,110
1998 5,531,040 19,700
1999 4,201,260 6,880
2000 3,348,180 1,840
2001 3,516,530 0
2002 8,690,180 2,890
2003 11,963,100 3,440 Source: http://mkaccdb.eu.int/cgi-bin/stb/stat/last visited 7 September 2006.
Table III.3: Pakistan’s exports of textiles and clothing to the EU
HS4 6103: Men's or boys' suits, ensembles, jackets, blazers, trousers, bib and brace overalls, breeches and shorts (other than swimwear), knitted or crocheted:
Year Imports to EUR-15 (Euros) Exports from EUR-15 (Euros)
1996 7,358,170 17,360
1997 6,748,710 26,830
1998 5,827,260 63,550
1999 6,989,230 25,990
2000 8,866,470 19,650
2001 7,846,580 10,030
2002 13,261,540 20,030
2003 19,988,570 17,170 Source: http://mkaccdb.eu.int/cgi-bin/stb/stat/last visited 7 September 2006.
15 All calculations done by the PRGMEA Secretariat, Karachi.

Page 26 International Trade Centre
Taking as examples T&C product categories 6106, 6103 and 6207, all showed steady growth from 1996 to 2004. In category 6106, Pakistan witnessed growth from €4,392,910 in 1996 to €11,963,100 in 2003. Similarly in category 6103, Pakistan’s exports increased from €7,358,170 to €19,988,570. But the scenario has changed and, as mentioned earlier, exports of products like bedwear and knitwear have decreased in 2006. Many SME manufacturing units have closed down, especially in knit garments. These decreases will result in an anticipated loss of employment of about 100,000 jobs over the next three years.16
Will the EU’s regional cumulation for SAARC countries help Pakistan’s exports?
Under its new rules of origin, the EU has expanded the scope of regional cooperation that applies to members of regional trade agreements (RTAs). Compliance with rules of origin can seriously affect the sourcing and investment decisions of companies. Therefore, regional cumulation provisions have been introduced to reduce the constraining effect of the current rules of origin. Though they still hamper the choice of sourcing, in the case of EU’s regional cumulation for South Asian Association of Regional Cooperation (SAARC) countries, the region is likely to benefit.
In Pakistan, textiles and apparel producers have varying interests. Basic textile producers are likely to benefit from regional cumulation, but this might not be the case for apparel producers. However, textile industry sources believe that the new rules, if implemented, would dislocate textile made-ups and garment industries from Pakistan to Bangladesh and Sri Lanka. Bangladesh, being a least developed country (LDC), will enjoy duty free access in the EU. Similarly, Sri Lanka would benefit under the EU’s rules on corporate social responsibility. Pakistani coarse count yarns and woven fabrics are likely to sell well in the regional market due to their high quality. However, according to most garment producers, the thrust of the EU’s new rules towards regional cumulation will have some negative implications for Pakistan’s garments and textile made-ups exports, leading to the loss of markets and also a weakening of the sector’s employment generation capacity, rendering thousands jobless.17
Pakistan’s Free Trade Agreement (FTA) with Sri Lanka and improved trade with Bangladesh will lead to a tremendous increase in exports of yarn and fabrics to both countries. While increasing its basic textiles exports in the region, Pakistan will substantially benefit from the import of fine count yarns and fabrics from India. But Pakistan and India will have to improve their bilateral trade relations to benefit from such regional integration. An additional proposal for super cumulation of SAARC and ASEAN rules of origin was rejected by India and Pakistan, as they considered that it would have led to a lot of dumped and devalued imports of basic textiles from ASEAN countries, especially Indonesia.
Leather and leather goods
Exports of leather and leather products rose by 26% in 2004-05, reaching US$938.5 million up from US$744.1 million. Tanned leather contributed 32.4%, leather garments/manufacturers 56.1% and leather footwear 11.5% to the leather & leather products group.
16 The calculations are based on analysis during the course of meetings with the private sector. 17 This was confirmed by personal interviews with garment manufacturers in Lahore and Karachi, namely
Scantex and Angora.
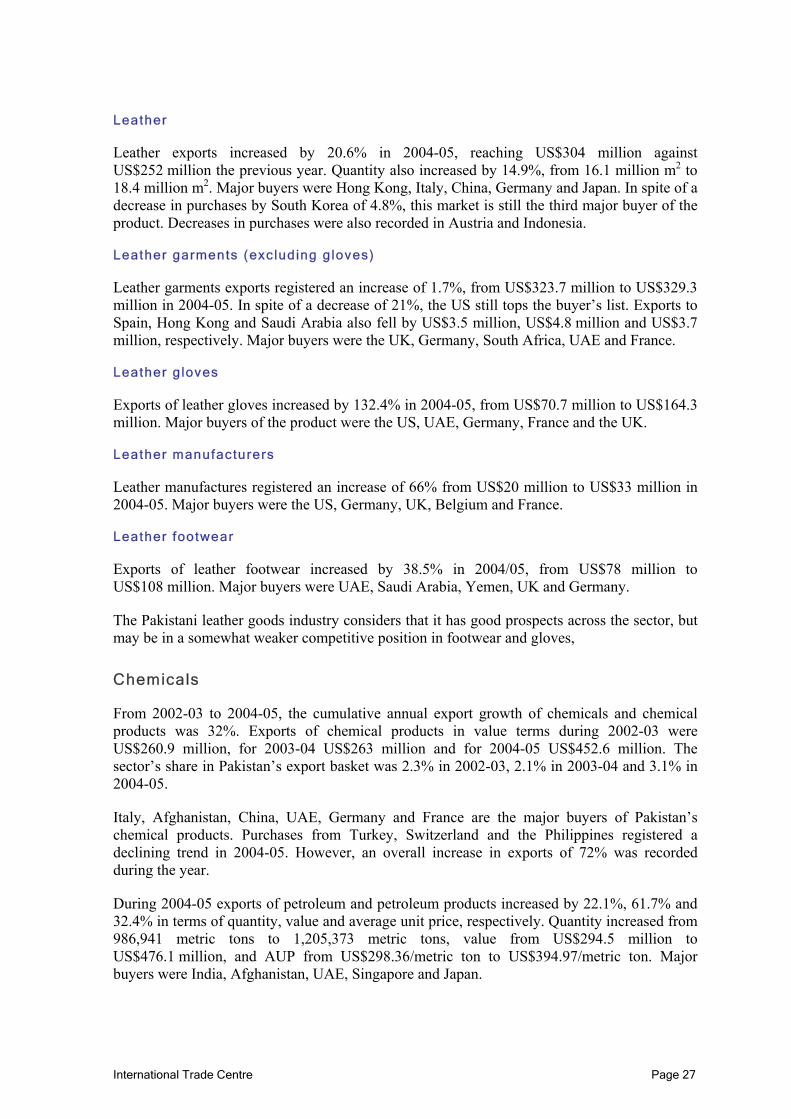
International Trade Centre Page 27
Leather
Leather exports increased by 20.6% in 2004-05, reaching US$304 million against US$252 million the previous year. Quantity also increased by 14.9%, from 16.1 million m2 to 18.4 million m2. Major buyers were Hong Kong, Italy, China, Germany and Japan. In spite of a decrease in purchases by South Korea of 4.8%, this market is still the third major buyer of the product. Decreases in purchases were also recorded in Austria and Indonesia.
Leather garments (excluding gloves)
Leather garments exports registered an increase of 1.7%, from US$323.7 million to US$329.3 million in 2004-05. In spite of a decrease of 21%, the US still tops the buyer’s list. Exports to Spain, Hong Kong and Saudi Arabia also fell by US$3.5 million, US$4.8 million and US$3.7 million, respectively. Major buyers were the UK, Germany, South Africa, UAE and France.
Leather g loves
Exports of leather gloves increased by 132.4% in 2004-05, from US$70.7 million to US$164.3 million. Major buyers of the product were the US, UAE, Germany, France and the UK.
Leather manufacturers
Leather manufactures registered an increase of 66% from US$20 million to US$33 million in 2004-05. Major buyers were the US, Germany, UK, Belgium and France.
Leather footwear
Exports of leather footwear increased by 38.5% in 2004/05, from US$78 million to US$108 million. Major buyers were UAE, Saudi Arabia, Yemen, UK and Germany.
The Pakistani leather goods industry considers that it has good prospects across the sector, but may be in a somewhat weaker competitive position in footwear and gloves,
Chemicals
From 2002-03 to 2004-05, the cumulative annual export growth of chemicals and chemical products was 32%. Exports of chemical products in value terms during 2002-03 were US$260.9 million, for 2003-04 US$263 million and for 2004-05 US$452.6 million. The sector’s share in Pakistan’s export basket was 2.3% in 2002-03, 2.1% in 2003-04 and 3.1% in 2004-05.
Italy, Afghanistan, China, UAE, Germany and France are the major buyers of Pakistan’s chemical products. Purchases from Turkey, Switzerland and the Philippines registered a declining trend in 2004-05. However, an overall increase in exports of 72% was recorded during the year.
During 2004-05 exports of petroleum and petroleum products increased by 22.1%, 61.7% and 32.4% in terms of quantity, value and average unit price, respectively. Quantity increased from 986,941 metric tons to 1,205,373 metric tons, value from US$294.5 million to US$476.1 million, and AUP from US$298.36/metric ton to US$394.97/metric ton. Major buyers were India, Afghanistan, UAE, Singapore and Japan.

Page 28 International Trade Centre
Electrical goods and appliances
During 2004-05, 64,595 home appliances were exported from Pakistan, representing US$6.9 million in value terms. This number was broken down into air conditioners 5,455, refrigerators/deep freezers 16,890, washing machines 41,958, and only 292 TV sets. In contrast, 3,629,624 electrical goods were exported, worth US$10.3 million. These goods included electric motors, electric generating sets, electric transformers, lighting equipment, electric capacitors, fuses, switches, electric meters, etc.
During 2005-06, the number of home appliances exported from Pakistan fell to 60,095. While the export of air conditioners rose to 8,933, the export of refrigerators/deep freezers saw a steep decline to 7,124. There was marginal increase in the export of washing machines to 43,081. Pakistan’s export of 957 TV sets was negligible. In 2005-06, there was also a steep decline in the export of other electric goods, down to 1,830,232, a decline of about 50% over the previous year.
Other sectors of note
Carpet exports during 2004-05 were US$277.8 million, a 20% increase on the previous year. Major buyers were US, Germany, Italy, France and UK.
Surgical instrument exports increased to US$182.9 million in 2004-05, an increase of 38% over the previous year. Exports increased to US, Germany, UK, Italy and UAE, but decreased to the Netherlands and Thailand.
Exports of sports goods decreased in 2004-05 to US$307 million, down 5.4% from the previous year. Exports to US, Germany, UK, France and Sweden declined. However, increases took place in the Netherlands, Italy, Japan, Turkey and Denmark.

International Trade Centre Page 29
IV. NAMA negotiations – substantive issues and process
The state of play of the negotiations – Doha to Hong Kong
The WTO negotiations on non-agricultural market access (NAMA) are an integral part of the comprehensive WTO multilateral negotiations agreed at the fourth WTO Ministerial Conference held in Doha, Qatar in November 2001. The wider negotiations also cover areas such as agriculture, services, intellectual property rights, trade facilitation, etc. Under the so-called Single Undertaking (“nothing is agreed till everything is agreed”), agreement is required in all these areas before settling in any single area, such as NAMA The NAMA negotiations aim at binding and reducing tariffs on the whole range of industrial products, as well as fish and fishery products, which lie outside the purview of the WTO Agreement on Agriculture. It was agreed at the Doha meeting that all products covered by NAMA would be subject to the negotiated reductions with no a priori exceptions, although subsequently a number of flexibilities have been provisionally agreed for developing countries, subject to an overall agreement in all areas of the negotiations. An agreement in non-agricultural market access is important for developing countries, because the products that fall under its ambit are of vital importance to the industrial development of these countries and the livelihoods of their people.
Development is a dominant theme of the Doha Ministerial Declaration, which the WTO has labelled the Doha Development Agenda. Because the industrial sector plays an important role in economic development, NAMA is one of the core areas of the negotiations. To meet the objectives of Doha, developing countries would expect the NAMA negotiations and outcome to contribute to the industrial development of developing countries, ensure the viability of their local industrial enterprises, increase industrial jobs, enable maintenance of government revenue and facilitate an increase in export opportunities. Ideally, developing countries would be able not only to retain but also to increase the national policy space, policy options and policy instruments that promote industrial development. Developing countries should not expect to have to make commitments that are inimical to their development, financial and industrialisation imperatives.
The Doha mandate
Paragraph 16 of the Doha Ministerial Declaration on NAMA states that the negotiations "shall take fully into account the special needs and interests of developing and least developed country participants, including through less than full reciprocity in reduction commitments, in accordance with the relevant provisions of Article XXVIII bis of GATT 1994 and the provisions cited in Paragraph 50 below."
This makes it clear that special and differential treatment and less than full reciprocity in reduction commitments are major principles in the NAMA mandate (and included in GATT Article XXVIII bis). Developing countries have taken the view that this means that they may apply lower percentage cuts in rates than the developed countries, as has been the case in recent rounds. However, developed countries have argued that the use of a higher coefficient by developing countries in the application of a Swiss formula by itself constitutes “less than full reciprocity”. In his paper, issued in July 2007,18 the current Chairman of the NAMA Group notes that “in prior rounds of negotiation, efforts to agree a definition have been unsuccessful,”
18 WTO document JOB(07)/126 of 17 July 2007.

Page 30 International Trade Centre
although past practice usually allowed developing countries to apply lower percentage cuts, for example in the Uruguay Round.19 In saying that “I am confident that my proposed modalities satisfy the requirement for less than full reciprocity in reduction commitments,” despite the higher percentage cuts by developing countries, the Chairman has clearly taken the view that the differential in coefficients meets the requirement of less than full reciprocity.
Background to the negotiations
The NAMA negotiations began at the WTO in early 2002, and a draft Ministerial text was produced for the WTO Cancún Ministerial Conference in September 2003. There were strong differences of opinion on this text and, as is well known, the Cancún meeting ended without agreement.
Following Cancún, the NAMA negotiations continued, and the text produced in Cancún was eventually included in the "July Package" of 2004 as Annex B.20 In this text, the WTO General Council reaffirmed “that negotiations on market access for non-agricultural products shall aim to reduce or as appropriate eliminate tariffs, including the reduction or elimination of tariff peaks, high tariffs, and tariff escalation, as well as non-tariff barriers, in particular on products of export interest to developing countries,” and also reaffirmed “the importance of special and differential treatment and less than full reciprocity in reduction commitments as integral parts of the modalities.” Moreover, the General Council recognized that “a formula approach is key to reducing tariffs, and reducing or eliminating tariff peaks, high tariffs, and tariff escalation” and it agreed “that the Negotiating Group should continue its work on a non-linear formula applied on a line-by-line basis which shall take fully into account the special needs and interests of developing and least-developed country participants, including through less than full reciprocity in reduction commitments.” However, this has to be read in the context of a new paragraph 1 which stated that “Framework contains the initial elements for future work on modalities by the Negotiating Group on Market Access”, which developing countries argued allowed for consideration of other options than the non-linear approach (an indirect reference to earlier proposals that included linear tariff-cutting as a core element).
Among other decisions in respect of NAMA, the General Council reaffirmed the Doha Declaration that “product coverage shall be comprehensive without a priori exclusions”, and it decided that tariff reductions or elimination would commence from the bound rates after full implementation of current concessions, but that “for unbound tariff lines, the basis for commencing the tariff reductions shall be [two] times the MFN applied rate in the base year”. The General Council also agreed that credit would be given for autonomous liberalization by developing countries (provided that the tariff lines were bound on an MFN basis in the WTO since the conclusion of the Uruguay Round), and that all non-ad valorem duties would be converted to ad valorem (or percentage) equivalents on the basis of a methodology to be determined and bound in ad valorem terms. In an important provision for countries with low levels of binding coverage (mainly but not only African countries), the General Council also agreed that, as an exception, participants with a binding coverage of non-agricultural tariff lines of less than [35]% would be exempt from making tariff reductions through the formula. Instead, it expected them to bind [100]% of non-agricultural tariff lines at an average level that 19 In the Uruguay Round, developed countries cut their industrial tariffs by 38%, while developing
countries made tariff reductions of 34%, with both groups of countries implementing the cuts in six equal annual instalments.
20 Doha Work Programme, Decision adopted by the General Council on 1 August 2004, WTO document WT/L/579 of 2 August 2004.

International Trade Centre Page 31
does not exceed the overall average of bound tariffs for all developing countries after full implementation of current concessions.21
The General Council also allowed for the possibility of sectoral negotiations, aiming at elimination or harmonization of tariffs, with a view to achieving the objectives of paragraph 16 of the Doha Ministerial Declaration with regard to the reduction or elimination of tariffs, in particular on products of export interest to developing countries. In addition, the General Council agreed that, pending agreement on core modalities for tariffs, the possibilities of supplementary modalities such as zero-for-zero sector elimination, sectorial harmonization, and request and offer, should be kept open. Developed country participants and other participants were asked to consider the elimination of low duties.
There were also some key flexibilities for developing countries. It was agreed that developing country participants would have longer implementation periods for tariff reductions. In addition, developing countries were to be given a choice in flexibilities, either to apply less than formula cuts to up to [10]% of the tariff lines provided that the cuts are no less than half the formula cuts and that these tariff lines do not exceed [10]% of the total value of a Member's imports; or to keep, as an exception, tariff lines unbound, or not applying formula cuts for up to [5]% of tariff lines provided they do not exceed [5]% of the total value of a Member's imports. It was also recognized non-reciprocal preference beneficiary Members, e.g. GSP beneficiaries, and those Members that were highly dependent on tariff revenue could be negatively affected by the MFN reduction and the Negotiating Group was asked to take into consideration the particular needs that may arise for these countries.
According to the decision, least developed countries (LDCs) would not be required to apply the formula nor participate in the sectorial approach, but would be expected to substantially increase their level of binding commitments. Developed country participants and others who so decided were called on to grant autonomous basis duty-free and quota-free market access for non-agricultural products originating from least-developed countries by the year […].
There was also recognition that newly acceded Members would have recourse to special provisions for tariff reductions in order to take into account their extensive market access commitments undertaken as part of their accession and that staged tariff reductions were still being implemented in many cases.
NTBs were recognized as an integral and equally important part of the negotiations and participants were asked to intensify their work on NTBs.
The General Council recognized that “appropriate studies and capacity building measures shall be an integral part of the modalities to be agreed,” and participants were asked to continue to identify such issues to improve participation in the negotiations.
Finally, the Negotiating Group was encouraged to work closely with the Committee on Trade and Environment in Special Session with a view to addressing the issue of non-agricultural environmental goods (covered in paragraph 31 of the Doha Ministerial Declaration).
The July Package was eventually presented to the Hong Kong, China Ministerial Conference of the WTO in December 2005.
21 In WTO usage, the use of square brackets around text indicates that the content is not agreed.

Page 32 International Trade Centre
Hong Kong Declaration
The Hong Kong Declaration reaffirmed all the elements of the July Package. Among the more important decisions that may be highlighted was the specific decision (paragraph 14) to adopt a Swiss formula and to take account of the special needs of developing countries, including through less than full reciprocity. It urged the finalization of work on flexibilities for developing countries. It said that participation in any sectoral initiative should be on a non-mandatory basis. It also adopted the idea of a non-linear mark-up for unbound rates to establish the basis for commencing tariff reductions (i.e. newly bound rates would be subject to formula cuts, unless covered by the flexibilities). Ministers said there was a need for work to find a solution to the problem of non-reciprocal preference erosion. A new element, inserted at the insistence of agricultural exporters, was the recognition of the need to ensure a comparably high level of ambition in market access for agriculture and NAMA (paragraph 24).
In other words, Ministers agreed with the July Package that there was to be a reduction of tariffs on all products and the coverage of tariff bindings was to be extended to all products (as in agriculture in the Uruguay Round), with the following main exceptions:
• LDCs were excluded from the obligation to cut tariffs, but were urged to increase their binding coverage.
• Ministers reflected the lack of consensus on the extent of binding coverage as well as the precise level of binding for members with very low binding coverage (under 35% of tariff lines).
• Other developing Members were to have an option of keeping, as an exception, tariff lines unbound, or not applying formula cuts for up to [5]% of tariff lines provided they do not exceed [5]% of the total value of a Member's imports (paragraph 8b of the July Framework). Alternatively, developing Members may apply only half of the formula cuts to up to 10% of tariff lines, provided that does not exceed 10 % of imports.
This approach is quite different from that in recent rounds where an overall target was set to be achieved by specified means. For example, in the Uruguay Round negotiations on industrial tariffs it was agreed to meet an overall percentage tariff reduction to be achieved by requests and offers on individual tariff lines. This approach gave developing countries the flexibility to keep tariffs on different products in line with their industrial development imperatives, and also gave the industrial countries the options of sheltering their more sensitive sectors – often in areas of export interest to developing countries. In the current negotiations, Members have agreed that the formula is to apply to tariffs on all products, subject to flexibilities for developing countries, as noted, and the average tariff cut for each Member applying the formula that is eventually agreed could be quite different.
The Chairman’s text of 17 July 2007 is an attempt to move forward in the negotiations by elaborating almost all the elements that were in the July 2004 Framework and Hong Kong Ministerial Declaration. While it is not an agreed text, it is clearly the current basis for the ongoing negotiations in market access for non-agricultural products. The text contains, inter alia, the following main elements, most of which reflect the structure of July Package while elaborating some details:

International Trade Centre Page 33
• A Swiss-type formula, with the differential coefficients for developed and developing countries, suggested by the Chairman as 8-9 for developed countries and 19-23 for developing countries.
• Provisions for increasing binding coverage and setting the level of newly bound tariff rates at 20 percentage points above the MFN applied rate in 2001 (and the conversion on non-ad valorem rates to ad valorem equivalents using a modality outlined earlier (WTO document TN/MA/20)).
• Flexibilities for members covered by the tariff reduction: 10% of lines to be subject to half the formula cut, provided these lines do not exceed 10% of NAMA imports, or, alternatively, the exclusion of 5% of lines, provided these lines do not exceed 5% of NAMA imports.
• Members with a binding coverage of less than 35% of lines to be exempt from tariff cutting in accordance with the formula but would bind 90% of lines at a rate not exceeding 28.5%.22
• Sectoral elimination of tariffs on products of export interest to developing countries. Sectoral initiatives currently proposed are: automotive and related parts; bicycle and related parts; chemicals; electronics/electrical products; fish and fish products; forest products; gems and jewellery; hand tools; open access to enhanced health care; raw materials; sports equipment; toys; and textiles, clothing and footwear.
• Supplementary modalities ("zero-for-zero," sectoral harmonization, and request and offer).
• Members are asked to consider the possible elimination of low duties.
• Provisions for exemption from tariff cuts by LDCs, which are “expected to substantially increase their binding commitments. Members are to implement the Hong Kong Decision on Measures in Favour of the Least Developed Countries – essentially duty-free, quota-free treatment on all but 3% of tariff lines.
• Recently acceded countries to be given a grace period of two years before and an additional two years for implementation.
• Small and vulnerable economies, defined as those having less than 0.1% of world trade, to apply average cuts of different depths depending on the initial average of each country, rather than the application of a formula to all tariff lines of these countries. (This is new, not being covered in the July Package, and is an important departure from the formula approach.)
• NTBs. Work is continuing on identifying NTBs with a view to reducing or eliminating them.
• Nonreciprocal preference beneficiaries and countries highly dependent on tariff revenues. Rates on such products to be given an extended implementation period.
22 This is the approximate arithmetic mean of all developing countries bound rates.

Page 34 International Trade Centre
• Environmental goods. Guidance to be obtained from work in the WTO Committee on Trade and Environment in Special Session.
The Hong Kong Declaration, in agreeing on a Swiss formula, effectively excluded consideration of other approaches, although, as noted, the July Package had included a phrase stating that the framework "contains the initial elements for future work on modalities" by the NAMA Negotiating Group. For some developing countries, the reference to “initial elements” meant that the modalities issue was still wide open, that all options remained possible. While this now seems to be precluded, the NAMA 11, in making new suggestions in June 2007 that, in view of the deadlock, it might be worth reconsidering the earlier proposals for linear cuts, have demonstrated that, at least formally, the issue may still be open.23 At issue is the continuing concern of developing countries that they are being asked to make greater percentage cuts than developed countries, which they regard as against the development objectives of the negotiations and, specifically, against the agreement on less than full reciprocity.
Formulae for tar iff reduction
The WTO’s Doha work programme suffered a set back in mid-2006 when the negotiations were suspended. While these have since been resumed, many of the long-standing issues remain unresolved in agriculture and NAMA. The July 2004 Framework on NAMA (in Annex B), supplemented by the Hong Kong Declaration, remains the only formally agreed basis for the negotiations in all areas (apart from some elements that were not agreed and shown in square brackets). Work is continuing on technical issues as well as at the political level with hopes of a break through that would allow the conclusion of the negotiations by the end of 2007.
Under the proposals as drafted, the NAMA negotiations would lead to an increase in tariff bindings and reductions in their own bound and applied rates, subject to the flexibilities already described, while LDCs would be able to avoid tariff cuts but are asked to increase their binding coverage. Under the formula approach, all affected tariff lines would need to be cut, whereas in the Uruguay Round countries were free to choose the lines affected provided they met the overall average rate cut. While this allowed greater flexibility to developing countries, it also meant that developed countries were better able to shield their more sensitive sectors. Under the current proposals, the likely changes, supplemented by some likely tightening of WTO rules, are likely to reduce the “policy space” available to developing countries for promoting their industrial development.
On the other hand, the proposals should lead to improved market access in developed countries’ markets, as well as in the markets of other developing countries to the extent that the flexibilities (exclusions) do not target the kinds of products exported by developing countries. However, the greater the opening-up of developed country markets, the greater the trade diversion losses as preferential margins are reduced. Preference losses may be particularly relevant for LDCs and ACP countries, but these could also be offset to some degree by improved preference coverage, especially in the US market, and more liberal rules of origin.
The precise implications of the various proposals depend on the selection of coefficients, the flexibilities and the initial level of tariffs. The Swiss formula cuts higher tariffs more steeply
23 WTO document TN/MA/W/86 of 8 June 2007.

International Trade Centre Page 35
than lower tariffs, with the implication that, since most developing countries have quite high industrial tariffs, their tariffs will be cut more steeply than the tariffs of developed countries, unless developing countries are allowed to have vastly different coefficients in the formula than developed countries. If developing countries have to cut their tariffs more than developed countries, this would go against the principle of less than full reciprocity mandated in the Doha Declaration.
Although developed countries largely agree on having different coefficients for developed and developing countries, they do not want a wide difference between the coefficients. They would like coefficients of 10 for developed countries and 15 for developing countries. Such coefficients set the maximum rates (again, subject to flexibilities) for each group of countries so that, under the developed country proposals, a coefficient of 15 would bring down their industrial tariffs to below 15%. Under Pakistan’s proposal of coefficients of 6 and 30, developing country rates would be reduced to below 30% (again subject to flexibilities).
As noted previously, the Chairman’s text is largely an elaboration of the July Package and the relevant part of the Hong Kong Declaration, but it is not an agreed text, and other proposals remain on the table. Among these, for example, Argentina, Brazil and India (ABI) made a proposal, based on a text by the first Chairman of the NAMA Group, Ambassador Girard of Switzerland. Under this proposal the Swiss formula “a” coefficient for each country would be based on its existing average bound rates, so that, with the application of the formula, the average rate for each country would become its own maximum rate.24 A group of developing countries, the so-called NAMA 11,25 further suggested in June 2007 that consideration might even be given to returning to another early proposal in which linear or straight percentage cuts were the key element. A number of other proposals by individual countries and groups have largely been overtaken by subsequent proposals from the same countries or groups in which they participate.
In addition to the formula cuts, less the flexibilities, it has also been proposed that tariffs may be eliminated in products belonging to certain selected sectors that were said to be of export interest to developing countries. However, it now seems to be accepted that participation in such a move would be ‘non-mandatory’ for whole membership. As noted earlier, in the current Chairman’s text, the areas that seem to be under consideration for sectoral initiatives are: automotive and related parts; bicycle and related parts; chemicals; electronics/electrical products; fish and fish products; forest products; gems and jewellery; hand tools; open access to enhanced health care; raw materials; sports equipment; toys; and textiles, clothing and footwear.
Also, NTBs, which hinder the access of developing countries’ products to developed countries’ markets, are supposed to be an integral part of the NAMA negotiations. However, there has been little progress on this issue, which is also being discussed in the negotiations on WTO rules.
24 Under this proposal the “a” coefficient could also be multiplied by a second, “b”, coefficient which, if
greater than unity, would lessen the tariff-cutting effect. It may be noted that use of such a second coefficient was also favoured at one stage by the small and vulnerable economies as a means of providing them with additional flexibilities.
25 The NAMA 11 consists of Argentina, Bolivarian Republic of Venezuela, Brazil, Egypt, India, Indonesia, Namibia, Philippines, South Africa and Tunisia.

Page 36 International Trade Centre
In the current NAMA negotiations, many developing countries feel disadvantaged in that they are unable to understand the full implications of variations of formulae and coefficients on their tariffs and domestic industries. Very few countries have the technical capacity to work out the national figures for themselves. It is very difficult for diplomats and policy makers (except those who are appropriately trained) to quickly translate the coefficients into what they mean in terms of percentage reductions of various tariff lines.
The following table shows final rates after the application of selected Swiss coefficients to initial rates of 5% to 200%. Pakistan’s proposal corresponds to Swiss coefficients of 6 and 30, respectively, for developed and developing countries. The Canadian, EU and US proposal corresponds to Swiss coefficients of 10 and 15, respectively, for developed and developing countries. The July 2007 Chairman’s text refers to coefficients of 8-9 and 19-23, respectively, for developed and developing countries. The ABI formula applies each country’s own national average: for major developed countries these are around 3% so that the coefficient would be 3; in Pakistan’s case, the national average is now 55% so that the coefficient would be 55.
Table VI.1: Initial and final rates after application of Swiss formula with selected coefficients
Selected Swiss coefficients
3 6 8 9 10 15 19 23 30 55 Initial rate %
Final rate after application of Swiss coefficient %
5 1.9 2.7 3.1 3.2 3.3 3.8 4.0 4.1 4.3 4.6
10 2.3 3.8 4.4 4.7 5.0 6.0 6.6 7.0 7.5 8.5
15 2.5 4.3 5.2 5.6 6.0 7.5 8.4 9.1 10.0 11.8
20 2.6 4.6 5.7 6.2 6.7 8.6 9.7 10.7 12.0 14.7
25 2.7 4.8 6.1 6.6 7.1 9.4 10.8 12.0 13.6 17.2
30 2.7 5.0 6.3 6.9 7.5 10.0 11.6 13.0 15.0 19.4
35 2.8 5.1 6.5 7.2 7.8 10.5 12.3 13.9 16.2 21.4
40 2.8 5.2 6.7 7.3 8.0 10.9 12.9 14.6 17.1 23.2
45 2.8 5.3 6.8 7.5 8.2 11.3 13.4 15.2 18.0 24.8
50 2.8 5.4 6.9 7.6 8.3 11.5 13.8 15.8 18.8 26.2
55 2.8 5.4 7.0 7.7 8.5 11.8 14.1 16.2 19.4 27.5
60 2.9 5.5 7.1 7.8 8.6 12.0 14.4 16.6 20.0 28.7
65 2.9 5.5 7.1 7.9 8.7 12.2 14.7 17.0 20.5 29.8
70 2.9 5.5 7.2 8.0 8.8 12.4 14.9 17.3 21.0 30.8
75 2.9 5.6 7.2 8.0 8.8 12.5 15.2 17.6 21.4 31.7
80 2.9 5.6 7.3 8.1 8.9 12.6 15.4 17.9 21.8 32.6
85 2.9 5.6 7.3 8.1 8.9 12.8 15.5 18.1 22.2 33.4
90 2.9 5.6 7.3 8.2 9.0 12.9 15.7 18.3 22.5 34.1
95 2.9 5.6 7.4 8.2 9.0 13.0 15.8 18.5 22.8 34.8
100 2.9 5.7 7.4 8.3 9.1 13.0 16.0 18.7 23.1 35.5
105 2.9 5.7 7.4 8.3 9.1 13.1 16.1 18.9 23.3 36.1
110 2.9 5.7 7.5 8.3 9.2 13.2 16.2 19.0 23.6 36.7

International Trade Centre Page 37
Selected Swiss coefficients
3 6 8 9 10 15 19 23 30 55 Initial rate %
Final rate after application of Swiss coefficient %
115 2.9 5.7 7.5 8.3 9.2 13.3 16.3 19.2 23.8 37.2
120 2.9 5.7 7.5 8.4 9.2 13.3 16.4 19.3 24.0 37.7
125 2.9 5.7 7.5 8.4 9.3 13.4 16.5 19.4 24.2 38.2
130 2.9 5.7 7.5 8.4 9.3 13.4 16.6 19.5 24.4 38.6
135 2.9 5.7 7.6 8.4 9.3 13.5 16.7 19.7 24.5 39.1
140 2.9 5.8 7.6 8.5 9.3 13.5 16.7 19.8 24.7 39.5
145 2.9 5.8 7.6 8.5 9.4 13.6 16.8 19.9 24.9 39.9
150 2.9 5.8 7.6 8.5 9.4 13.6 16.9 19.9 25.0 40.2
155 2.9 5.8 7.6 8.5 9.4 13.7 16.9 20.0 25.1 40.6
160 2.9 5.8 7.6 8.5 9.4 13.7 17.0 20.1 25.3 40.9
165 2.9 5.8 7.6 8.5 9.4 13.8 17.0 20.2 25.4 41.3
170 2.9 5.8 7.6 8.5 9.4 13.8 17.1 20.3 25.5 41.6
175 2.9 5.8 7.7 8.6 9.5 13.8 17.1 20.3 25.6 41.8
180 3.0 5.8 7.7 8.6 9.5 13.8 17.2 20.4 25.7 42.1
185 3.0 5.8 7.7 8.6 9.5 13.9 17.2 20.5 25.8 42.4
190 3.0 5.8 7.7 8.6 9.5 13.9 17.3 20.5 25.9 42.7
195 3.0 5.8 7.7 8.6 9.5 13.9 17.3 20.6 26.0 42.9
200 3.0 5.8 7.7 8.6 9.5 14.0 17.4 20.6 26.1 43.1
Developed countries have projected the idea that having two coefficients would take care of the requirements of special and differential treatment for developing countries, and also of the "less than full reciprocity in commitments" principle mandated by the Doha Declaration. But developing countries argue that “less than full reciprocity” implies making lower percentage cuts to their MFN rates, and merely having separate coefficients will not fulfil the requirements of the Doha Declaration. In their view, only a large difference in the coefficients would lead to lesser percentage cuts by developing countries, even taking account of the flexibilities they are afforded. For example, a coefficient of 10 for the EU and the US would mean that developing countries would need a coefficient of at least 120 in order for the less than full reciprocity principle to be met. Developed countries are most unlikely to accept such a huge gap between the two coefficients.
Developing countries are under considerable pressure to give in to the demands of developed countries to undertake commitments that would require their tariffs to be slashed by very high percentages, in return for anticipated gains in the agriculture negotiations. As a result, local industries in many sectors and many countries may not be able to withstand competition from imports that may suddenly become much cheaper. This would call for substantial adjustment costs in many developing countries. Governments would also lose a significant part of their revenue as tariffs are cut sharply, and many developing countries would likely need an extended transition period to revise their tax systems to make up revenues form other sources.

Page 38 International Trade Centre
There is a view that developed countries and successful developing countries industrialised because they had low or zero tariffs, and that the lower the tariff the higher the industrial growth. In fact, developed countries made use of high tariffs to protect their industries during their industrialisation phase. Also, the successful East Asian economies of Taiwan, South Korea and Japan resorted to tariff and other support measures to pursue their industrial development. The success of these countries points to the argument that developing countries need the policy space and flexibility to be able to modify their tariff levels at various phases of industrialisation. However, the proposed formula approach, as well as some tightening of other WTO rules, may well encroach on the present flexibilities available to developing countries. They may also need assistance (e.g. Aid for Trade) to build their supply capabilities, allowing them to diversify their production and trade, as well as to help them cope with the adjustment that could be required from the implementation of the current proposals.26 Short of such assistance, developing countries need greater flexibility than would be available under the more liberalising proposals now on the table.
Tariff rationalizat ion of industr ial goods in South Asia
South Asian countries have made some progress in easing restrictions on trade by addressing trade protective measures through the implementation of structural adjustment programmes, including liberalization of trade and payments, the promotion of the private sector, reductions in controls of prices and interest rates, foreign investment promotion and financial sector reforms. On NAMA, South Asian countries attach the highest importance to the reduction and elimination of market access barriers, such as high tariffs and NTBs, in key developed world markets while asking for flexible policy space that takes fully into account each country’s development goals.
LDCs, such as Bangladesh and Nepal, have, as noted above, been exempted from making tariff reductions under NAMA, while Sri Lanka will also avoid serious tariff cutting because of the flexibilities afforded to countries that currently have very low binding coverage. However, the larger South Asian countries – India and Pakistan – will have to reduce the level of tariffs under the Swiss formula approach. Nevertheless, they will also benefit from the flexibilities under paragraph 8 of the July Package which would allow them to apply “less than formula cuts to up to [10]% of the tariff lines provided that the cuts are no less than half the formula cuts and that these tariff lines do not exceed [10]% of the total value of a Member's imports” or, as discussed earlier, to exempt “up to [5]% of tariff lines provided they do not exceed [5]% of the total value” of their imports. There is also a buffer in that the formula cuts are to be applied, as in previous rounds, to bound rates, while in practice their applied rates are much lower, having been reduced by India and Pakistan under autonomous reforms. Nevertheless, it is estimated that they will have to make real cuts in some applied rates and this will further expose some of their economic activity to international competition.
Every South Asian country has its own position on tariff rationalization of industrial goods. The positions of Bangladesh, India, Nepal, Sri Lanka and Pakistan on major NAMA issues are summarised below.
26 It needs to be acknowledged that some developing countries are concerned that Aid for Trade could
imply accepting new conditionalities imposed by the main lending agencies that some consider caused serious adjustment problems under structural adjustment programmes.

International Trade Centre Page 39
Bangladesh
Because of its LDC status, Bangladesh is not required to undertake any tariff reduction commitment under NAMA. However, it is concerned about the erosion of preferential margins presently available to it under various GSP schemes, particularly in the EU. Another major concern is the duty-free access of garments and other products, like fish and fish products and leather and leather goods, to US, where it does not enjoy the same degree of preferences as in the EU, and other countries. The ready-made garment industry, which has so far enjoyed preferential access to developed countries, is important for the livelihood of marginalised sections of society, especially poor women who constitute an important part of the workforce in this sector.
India
India would like to gain greater market access in developed countries, not so much through the reduction of their tariffs, but through the dismantling of NTBs to trade and some GSP. India also wants to avoid a steep reduction in applied tariff rates. Rather, it would like to reduce tariffs voluntarily at a more measured pace, consistent with its own reform programme, and that would minimize short-term adjustment costs.
India was one of the countries that insisted that t any tariff reduction formula should apply only to bound rates, as in previous rounds, and not to applied rates. India wants an equitable tariff reduction formula in the negotiations keeping in view the concerns of the developing countries. India also successfully argued that ‘zero for zero’ reductions in sectoral negotiations (the sectors remain to be determined) should not be mandatory for developing countries.27
Nepal
Nepal has a significant stake in the ongoing NAMA negotiations. Though Nepal bound 99.3% of its tariff lines at the time of its accession to the WTO and, as an LDC, is not required to make any tariff reduction commitment, the NAMA outcomes could have serious implications for the competitiveness of the Nepalese manufacturing sector because of preference erosion as MFN tariffs are reduced. As an LDC, Nepal will not have to undertake any tariff reductions in the NAMA negotiations.
Sri Lanka
Sri Lanka would like developed countries to eliminate barriers to free trade and to ensure duty free, quota free market access for non-agricultural products originating from developing and least developing countries. It is also interested in issues such as the formula approach of tariff reduction, tariffs bindings, reduction or elimination of tariff peaks and tariff escalation, sectoral approach and reduction of NTBs. Sri Lanka’s bound coverage is very low so it will be able to avail itself of the flexibilities offered under paragraph 6 of the July Package and avoid making major tariff reductions. Preference erosion is another area of concern to Sri Lanka, particularly in the EU where they benefit from GSP plus.
27 Although seven sectors – fish and fish products, textiles and clothing, automotive parts and components,
electronics and electrical goods, stones, gems and precious metals – were mentioned in an earlier text by the Chairman of the NAMA Negotiating Group, these are not mentioned in the July Framework.

Page 40 International Trade Centre
Pakistan
Pakistan argues that tariff peaks should be removed, tariff escalation minimised and that developing countries be provided improved market access. Pakistan is also of the view that special consideration should be given for products of export interest to developing countries. It supports the idea of less than full reciprocity for developing countries.
Pakistan has proposed the adoption of a simple Swiss formula with two distinct coefficients for developed and developing countries. According to Pakistan’s submission28 (see Annex 4) “These coefficients should be based on an objective criterion; taking the over all average of the bound tariff lines for developed and developing countries as their respective coefficients. These averages have been worked out to be 5.48% for developed countries, and 29.12% for developing countries. For the sake of simplicity these could be taken as 6 and 30.”
Concerning the treatment of unbound rates proposed that a “mark up of 30 should be added to the base rate (applied rate of 2001) for each unbound line before the application of a formula.” As Pakistan explained: “By this proposal, the base rate of 5% would be marked up to 35% and through the application of the formula (with a coefficient of 30 proposed for developing countries), it would get reduced to about 16% where it could be bound. This would give some policy space to developing countries with low unbound rates. For higher unbound rate of 100% and above it would result in lowering that rate to around 24% where it would be bound.”
28 WTO Document TN/MA/W/60 of 21 July 2005 – see Annex 3.

International Trade Centre Page 41
V. Pakistan’s preferential trade pockets
Like many other countries, Pakistan is also pursuing preferential market access arrangements at regional and bilateral levels, in addition to its involvement in WTO multilateral negotiations. Examples of such arrangements are given below.
Agreement on South Asian Free Trade Area
The Governments of Bangladesh, Bhutan, India, Maldives, Nepal, Pakistan and Sri Lanka signed the Agreement on South Asian Free Trade Area (SAFTA) during the 12th SAARC Summit in Islamabad on 6 January 2004. The ratification of SAFTA by all the member countries was a major achievement of the SAARC mandate. The agreement entered into force on 1 January 2006. The South Asian Free Trade Area will be completed by 1 January 2016.
Article 7 of the Agreement contains the tariff reduction modality, referred to as the Trade Liberalisation Programme (TLP). In the first phase, India, Pakistan and Sri Lanka will bring down their customs tariffs to 20% by 1 January 2008. LDC Member States, i.e. Bangladesh, Bhutan, Maldives and Nepal, would reduce their customs tariffs to 30%. All Member states made the first round of tariff reductions on 1 July 2006, with the exception of Nepal, which did so on 1 August 2006.
The modalities for tariff reduction under the TLP are as follows:
• No tariff reduction on items in the Sensitive List.
• Non-LDCs (Pakistan, India, Sri Lanka) shall reduce tariffs to 0%–5% for LDCs (Bangladesh, Bhutan, Nepal, Maldives) within 3 years (by 2009).
• Tariff reduction by non-LDCs for non-LDCs.
• Tariff reduction in two phases:
Phase I Phase II
Non-LDCs 2006-2008 Existing tariff rates above 20% to be reduced to 20% within 2 years.
Tariffs below 20% to be reduced on margin of preference basis of 10% per year.
2008-2013 Tariffs to be reduced to 0% – 5% within 5 years
LDCs 2006-2008 Existing tariff rates above 30% to be reduced to 30% within 2 years.
Tariffs below 30% to be reduced on margin of preference basis of 5% per year.
2008-2016 Tariffs to be reduced to 0% – 5% within 8 years

Page 42 International Trade Centre
FTA with Sri Lanka
A FTA between Pakistan and Sri Lanka became operational on 12 June 2005. Under the FTA, Sri Lanka and Pakistan offer preferential market access to each other’s exports by way of granting tariff concessions. Sri Lanka enjoys duty free market access to 206 products in the Pakistani market, including tea, rubber and coconut. Pakistan, in return, gains duty free access to 102 products in the Sri Lankan market. These include oranges, basmati rice and engineering goods.
The FTA contains articles on the elimination of tariffs, para-tariffs and NTBs, rules of origin, safeguard measures, settlement of disputes, etc. Annexes to the agreement cover the following areas:
• Annex A contains Pakistan’s No-Concession List (Negative List), which consists of 540 HS tariff lines (products) at 6-digit level that will not be entitled to any tariff concession when imported from Sri Lanka. The Immediate Concession List contains a total of 206 HS tariff lines (products) at 6-digit level for which Sri Lanka will receive 100% duty free access in the Pakistan market. There is also a list of products (tariff lines) for which Pakistan has agreed to grant a margin of preference on an applied MFN rate.
• Annex B contains Sri Lanka’s No-Concession List (Negative List), which contains a total of 697 HS tariff lines (products) at 6-digit level that will not be entitled to enjoy any tariff concessions when exported to Sri Lanka. Sri Lanka has listed a total of 102 HS tariff lines at 6-digit level on which Pakistan will receive 100% duty free access and tariff rate quotas on specific products.
• Annex C deals with rules of origin, which categorize the products exported under the FTA into the following two main segments:
• Products wholly produced or obtained in the territory of the exporting country, such as agricultural, fisheries and mineral products.
• Products not wholly produced or obtained in the territory of the exporting country (manufactured products). All manufactured products in this category should contain a minimum of 35% Domestic Value Addition of their FOB value in order to qualify for preferential treatments. All non-originating materials used by exporters must also change their HS codes at six-digit level against that of the final product as a result of the manufacturing process undertaken in the exporting country.
• The Annex D sets out the timeframe for Pakistan and Sri Lanka to phase out tariffs on products other than those in their No Concessions Lists (Negative Lists). It also indicates the percentage of tariff reductions undertaken by each country at the respective phasing out stages.
FTA with China
In April 2005 Pakistan and China announced that the two countries want to strengthen bilateral economic and trade relations. They officially launched negotiations for a China-Pakistan FTA, commencing with a joint feasibility study, and culminating in the signature of an FTA on 24 November 2006. Both sides also signed an Agreement on an Early Harvest Programme (EHP), which would serve as the basis for the FTA. Pakistan agreed not to apply any anti-dumping

International Trade Centre Page 43
measures against China under sections 15 and 16 of the WTO accession protocol, and paragraph 242 of the Report of the Working Party on China’s accession to the WTO.
The EHP is an extension of a preferential trade arrangement (PTA) signed between China and Pakistan in November 2003. Under the PTA, Pakistan can export 777 items to China, while China can export 217 items to Pakistan. Both sides will want to add items to the list; in Pakistan’s case, the aim is to add items that will help to reduce its trade deficit with China. Under the EHP, the list of items will be traded at zero-rated tariffs.
Currently, more than 70% of Pakistan’s exports to China are cotton yarn or cotton fabric. The remainder consists of leather products, minerals and seafood. China’s main shipments to Pakistan include machinery equipment, chemicals, electronics and footwear. China’s interest in an FTA lies in the opportunity to achieve greater access to Pakistan’s 150 million people. In particular, China sees opportunities in the chemicals sector for Chinese pesticide and fertiliser producers.
Early Harvest Programme
The Agreement on EHP, including annexes relating to tariff concessions and the time schedule for reduction of tariffs, was signed in April 2005 and became operational on 1 January 2006.
The EHP is a mini fast track prelude to the FTA under negotiation. Both Pakistan and China have increased market access for each other on items of significant commercial interest. The EHP will provide duty free access to a substantial number of products within the next two years. In addition, a large number of products will be exportable by both counties at a margin of preference in relation to MFN duty rate. In this way, both countries will enjoy concessionary duty rates in comparison to exports of the same products from other countries.
The FTA came into effect on 1 July 2007, and further negotiations are now engaged to extend the scope to trade in services. Both sides are working hard to ensure the FTA is a win-win outcome. As noted earlier, if developing countries, including China, choose to exercise the flexibilities available to them under the existing NAMA proposals, then this could substantially reduce the value of the WTO agreement, and improving access to other developing countries may need to be achieved in the short term through South-South cooperation or regional trade agreements.

Page 44 International Trade Centre
VI. Conclusions and recommendations
Most of Pakistan’s international trade is conducted on a multilateral basis rather than under a FTA or deep preferences, such as those available to LDCs. Therefore, the WTO trade negotiations are crucial. Pakistan therefore considers that a successful outcome to the negotiations would involve the substantial reduction or elimination of discriminatory practices against its exports, and the creation of new market access opportunities. At present, Pakistani exporters have to pay an average of over 10% duty on exports to the US and the EU, whereas most of Pakistan’s competitors enjoy preferential rates either because they have FTAs with these economies or because they have LDC status. For these reasons, Pakistan has been keen for the current round of negotiations to be completed quickly.
Pakistan’s main objective in the NAMA negotiations is to achieve the reduction or elimination of tariff peaks and tariff escalation on its exports, especially in the T&C sector. Many countries receive better preferential tariff treatment than Pakistan, which is not a member of any meaningful FTA, especially with its major trading partners e.g. the US and the EU, and multilateral liberalization works better for Pakistan’s interests. At the same time, Pakistan has been asking for a formula that would provide adequate special and differential treatment for developing countries so that it is able to maintain adequate tariff levels to protect sensitive industries where liberalisation could lead to a large loss in jobs, as well as for revenue purposes. This could be as part of the formula itself as well as through additional flexibilities that would allow it to either keep its sensitive sectors out of the ambit of the main formula cuts.
As noted in the main text, the key feature of Pakistan’s proposal is to have two coefficients, one of 6 for developed countries and another of 30 for developing countries. If such coefficients were eventually agreed, it would mean that tariffs on T&C in the EU and the US markets would be cut by more than 50%. In fact, they would be cut to less than 6% from the current 12%─30%. This would considerably reduce discriminatory tariff rates that Pakistani exporters face vis-à-vis their competitors, many of whom enjoy duty-free access because of their LDC status or because they have FTAs with major trading partners.
In the work carried out under this project,29 tariff cut simulations for Pakistan’s four major non-agricultural export sectors (T&C, leather, chemicals and electrical goods) show that the various formulae under consideration would provide improved market access opportunities for Pakistani exports. These simulations of tariff cuts cover 33 major industrial export products (15 top export products from T&C, 4 from leather, 10 from chemicals and 4 from electrical goods). The application of the Swiss type formulae by developed countries not only results in improved market access for Pakistan’s industrial goods, it also allows the retention of some policy space for Pakistan and a buffer against shocks from external trade as it liberalizes its tariffs. This could be important to avoid expensive and socially difficult adjustments in sensitive sectors in Pakistan. The recent binding of most of Pakistan’s industrial tariffs at an average of 55% also provides an additional safety margin. The dual Swiss formula with a 29 See WTO NAMA Negotiations: Challenges and opportunities for Pakistan – NAMA formulas – Tariff cut
scenarios, ITC, February 2007. However, it should be noted that the main work for the simulation study was carried out on the basis of 2005 tariff structures, when Pakistan’s unweighted bound average MFN rate was some 35% (the corresponding applied MFN rate was 14%). However, early in the negotiations, Pakistan extended its binding coverage to close to 99% of tariff lines, raising the overall unweighted average MFN rate to 55% in 2006. This means that the Pakistan coefficient in the ABI formula would rise from 35 to 55, implying even less cuts of bound tariff rates for Pakistan than those shown in that study.

International Trade Centre Page 45
coefficient of 10 for the developed countries, as proposed by the EU and the US, or 8-9 as suggested recently by the current Chairman of the NAMA Negotiating Group, would not achieve the same degree of market opening in major markets as Pakistan’s own proposal. Domestically, the application of the lower Swiss coefficients under the EU/US or the Chairman’s proposal could prove difficult for some areas within Pakistan’s industrial sector, as indicated in the sectoral analysis, but for the flexibilities in the NAMA draft text that help to soften the extent of the cuts.
For T&C, which constitute around 70% of Pakistan’s export basket, tariff rates are high – mostly exceeding 10% and in general ranging from 12–32% particularly in developed countries. Applied tariff rates also tend to be even higher for garments. Therefore, Pakistan would benefit greatly from deep cuts in the applied rates of major importers. Some developing country markets are also important for Pakistan but these countries are less important overall and also have access to the flexibilities for developing countries that they may use to exclude these produces from formula liberalization. Therefore, seeking additional markets through deeper cuts in the tariff rates of major importers for this sector should be the main objective while choosing the right formula for Pakistan. Pakistan may also wish to pursue the idea that this sector should be subject to sectoral elimination in industrial countries.
With the analysis of the T&C sector in mind, Pakistan should adopt an aggressive approach on the NAMA negotiations and seek substantive reductions in the high tariffs and tariff peaks of developed countries. As far as its home market is concerned, Pakistan’s new higher level of average MFN bound rates should provide some buffer to protect its domestic industries against external shocks, but there is not a huge difference in the various formulae because of the deep-cutting effect of Swiss-type formulae. Here, insulation from shocks might best be achieved by the application of the flexibilities available under paragraph 8 of the July Framework.
In the case of the leather goods sector, the US, Canada, the EU, Australia, Japan and the UAE are the key markets for Pakistan’s leather products. Since none of the simulated tariff cuts of UAE will bring down its tariff rates to the current applied rate of 5% for all top four leather products, Pakistani exports of these products to the UAE will remain unaffected by the NAMA negotiations. Therefore, Pakistan’s main objective for this sector should be to seek maximum cuts in the tariff rates of major importers of the developed world, such as the US, Canada, the EU, Australia and Japan. Because Pakistan has not bound tariffs for major leather goods, the outcome of a cut in Pakistan’s bound tariff will not have an immediate impact on its domestic market. Therefore, Pakistan need not worry about home market protection in the near future and should seek deeper cuts in the tariff rates of its major developed world importers.
For the chemical sector, applied tariffs are already very low for inorganic chemicals and key markets for them are in the developing world – South and South East Asia, the Middle East and Africa. Since Pakistan has a higher bound rate than its markets, Pakistan will have to be careful about home market protection, and may want to exclude or lighten its commitments sensitive sub-sectors exercise under the paragraph 8 flexibilities of the July Framework.
The chemical sectoral analysis suggests that, unlike the T&C or the leather goods sectors where Pakistan is likely to benefit most by steep tariff reductions in developed countries, Pakistan will have to seek deeper tariff cuts in developing countries because they constitute major importers, especially for inorganic chemicals. This poses a potential problem, since these countries, like Pakistan itself, may choose to exercise their options to apply the flexibilities available under the July Framework. Therefore, it will be important for Pakistan to seek clarification from its developing country partners as to their intentions in this area.

Page 46 International Trade Centre
As far as the electrical goods and appliances sector is concerned, the market access situation is unlikely to change significantly under any of the tariff cut simulations because Pakistan’s major importing countries have already applied tariffs at either zero percent or very low rates. Key markets for this sector are in the Middle East and the EU. A significant number of products in this sector enjoy a zero tariff rate in the EU and Australia. Even for products that the EU has bound tariffs above zero, the applied tariff is generally at zero. In the case of the Middle East, Kuwait, Saudi Arabia and the UAE are the three key markets for this sector. Although Kuwait has bound virtually all products at 100%, it applies only 5% tariff. Thus, Kuwait’s situation is unlikely to change as a result of any negotiation outcome. Saudi Arabia applies a 5% tariff rate for virtually every product, as do the other GCC countries. The UAE has bound all electrical goods and appliances products at 15% but the applied rate is only 5%. None of the simulated cuts bring the UAE rate below the current applied rate of 5%. Therefore, Pakistan should not attach too much weight to this sector while selecting the best formula for better market access to its industrial goods; the NAMA negotiations will have little impact on Pakistan’s exports of its electrical goods and appliances.
Pakistan’s main objective in the NAMA negotiations should clearly be to eliminate the tariff peaks of developed countries as they are hurting its exports, especially in the important T&C sector. It should also actively pursue sectoral elimination on its key exports in the developed country markets. A potential problem is that, while higher tariffs may be reduced, other forms of protection, such as safeguard or anti-dumping may take their place, effectively eliminating the potential gains from the tariff reductions, so that Pakistan also has an interest in pursuing these issues in the WTO rules negotiations.
Pakistan also has a substantial export interest in a number of developing country markets, such as South Africa, Tunisia and Thailand. A number of other countries in the Asian region are growing fast and Pakistan cannot afford to ignore the potential of these markets. However, these countries may also avail themselves of the same flexibilities that are afforded to Pakistan, and may choose to shelter sectors of export interest to Pakistan from liberalization. This is something that Pakistan will need to discuss with its developing country partners. Pakistan may also wish to consider trying to seek improved access to these markets through some form of South-South cooperation, such as Global System of Trade Preferences among Developing Countries (GSTP), or through regional trading agreements, as it has begun to do.
As a developing country, Pakistan has two options for retaining flexibilities to safeguard its sensitive sectors and support its nascent industries. It may keep up to 5% of lines unbound, provided they account for less than 5% of its imports, or it may submit to 100% binding but only cut tariffs by half of the agreed formula for 10% of lines, provided they amount to no less than 10% of its imports. What it decides will depend on how it sees the level of challenge posed by the possible cuts implied by the flexibilities. With a relatively diverse manufacturing sector – and some prospects of further diversification – Pakistan may well be tempted to use the broader shield to spread the remaining protection thinner over its newer and still vulnerable industries. However, if any cuts could cause serious problems for socially important sectors or locations the narrower option may be preferred. In making this decision, it is important to take account of the fact that implementation is likely to take place over a number of years when the world economy is also growing to that the effects of the outcome of the WTO negotiations will be mitigated by these factors.
Pakistan should continue its active participation in the NAMA negotiations and keep pressing for better market access in developed countries through steep reductions in their tariff levels. This should be its highest priority in the negotiations. Whatever flexibility it chooses should

International Trade Centre Page 47
provide an adequate cushion for its domestic industries, given the likelihood of extended transition periods and a healthy outlook for the world economy (despite recent uncertainties on stock markets). However, it might be useful to consider some kind of pro-active policies to foster diversification and competitiveness in the industrial sector alongside the trade policy changes. These could also be accompanied by a concerted effort in the area of South-South and regional cooperation.
Finally, Pakistan must continue to work with other developing countries to maintain unity and solidarity in the negotiations. If developing countries lose the NAMA battle, Pakistan will also be a loser. If developing countries succeed in striking a deal that meets their expectations from the DDA, Pakistan too would win.


International Trade Centre Page 49
Annex 1 – Pakistan’s top 20 exported products
2002-03 2003-04 2004-05 No. Commodity
US$’000 % US$’000 % US$’000 %
CAGR Value
%
1 Cotton cloth 1,345,650 12.06 1,711,492 13.90 1,862,886 12.94 18
2 Knitwear 1,146,674 10.27 1,458,736 11.85 1,635,033 11.36 19
3 Bed ware 1,329,064 11.91 1,383,334 11.23 1,449,533 10.07 4
4 Ready made garments 1,092,607 9.79 993,322 8.07 1,087,954 7.56 0
5 Cotton yarn 928,358 8.32 1,126,876 9.15 1,056,535 7.34 7
6 Rice 555,457 4.98 634,457 5.15 932,549 6.48 30
A) Rice - Basmati 360,810 3.23 421,748 3.43 439,240 3.05 10
B) Rice - Other varieties 194,647 1.74 212,709 1.73 493,309 3.43 59
7 Leather & its products (ex. footwear) 621,321 5.57 666,036 5.41 830,380 5.77 16
A) Leather 234,774 2.10 251,693 2.04 303,606 2.11 14
B) Leather clothing 232,316 2.08 323,656 2.63 329,272 2.29 19
C) Leather gloves 56,969 0.51 70,722 0.57 164,333 1.14 70
D) Other leather manufactures 97,262 0.87 19,965 0.16 33,169 0.23 -42
8 Towels 374,839 3.36 403,500 3.28 520,480 3.62 18
9 Petroleum / Products 248,575 2.23 294,461 2.39 476,090 3.31 38
10 Textile made ups (ex. towels & bedwear) 359,775 3.22 416,604 3.38 466,000 3.24 14
11 Chemicals and its products 260,931 2.34 262,957 2.14 452,576 3.14 32
12 Sports goods 335,173 3.00 324,751 2.64 307,129 2.13 -4
13 Artificial silk & synthetic textile 574,306 5.15 470,757 3.82 300,264 2.09 -28
14 Carpets 220,899 1.98 231,449 1.88 277,842 1.93 12
15 Surgical goods, medical instruments 149,965 1.34 132,563 1.08 182,877 1.27 10
16 Engineering goods 74,087 0.66 100,008 0.81 181,983 1.26 57
17 Fish and fish preparations 134,499 1.21 152,890 1.24 138,943 0.97 2
18 Footwear 85,887 0.77 88,833 0.72 137,666 0.96 27
19 Articles of plastic 17,361 0.16 33,437 0.27 111,484 0.77 153
20 Raw cotton 49,016 0.44 47,671 0.39 109,957 0.76 50
Sub-total – Top 20 Exports 10,459,901 93.72 11,568,591 93.95 13,450,710 93.47 13
Others 700,345 6.28 744,694 6.05 940,371 6.53 16
Total 11,160,246 100.00 12,313,285 100.00 14,391,081 100.00 14
Source: UN COMTRADE
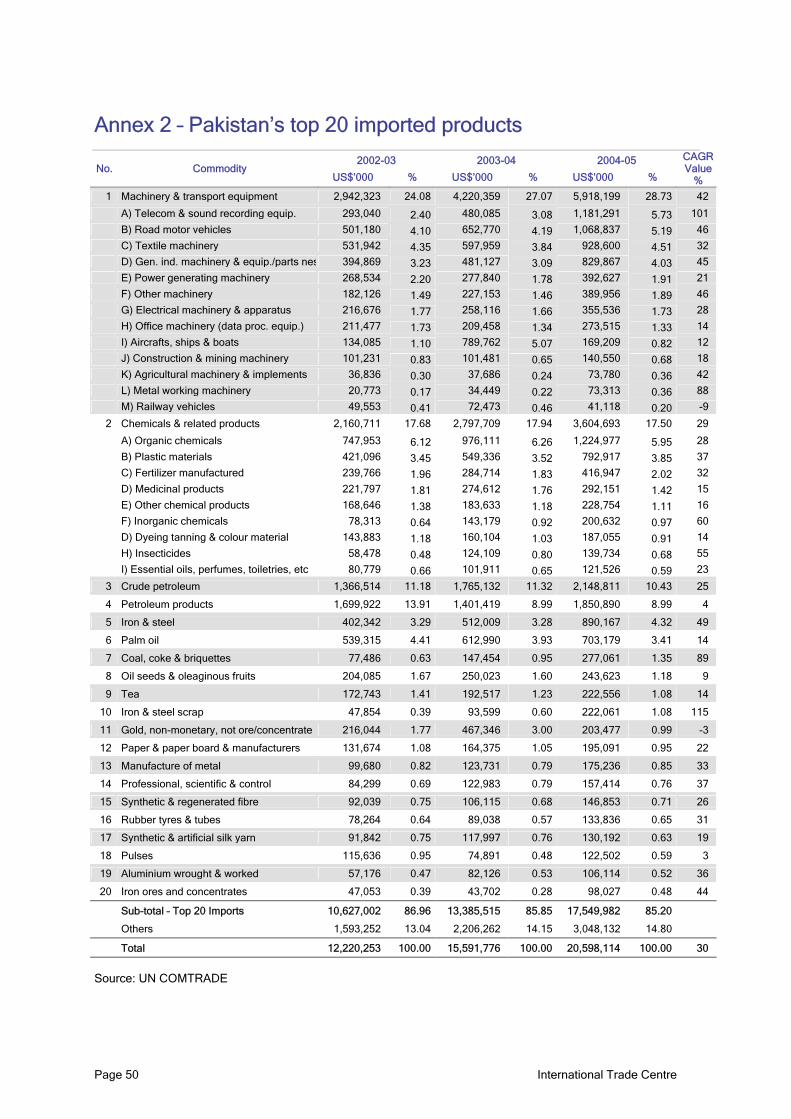
Page 50 International Trade Centre
Annex 2 – Pakistan’s top 20 imported products
2002-03 2003-04 2004-05 No. Commodity
US$’000 % US$’000 % US$’000 %
CAGR Value
%
1 Machinery & transport equipment 2,942,323 24.08 4,220,359 27.07 5,918,199 28.73 42
A) Telecom & sound recording equip. 293,040 2.40 480,085 3.08 1,181,291 5.73 101
B) Road motor vehicles 501,180 4.10 652,770 4.19 1,068,837 5.19 46
C) Textile machinery 531,942 4.35 597,959 3.84 928,600 4.51 32
D) Gen. ind. machinery & equip./parts nes 394,869 3.23 481,127 3.09 829,867 4.03 45
E) Power generating machinery 268,534 2.20 277,840 1.78 392,627 1.91 21
F) Other machinery 182,126 1.49 227,153 1.46 389,956 1.89 46
G) Electrical machinery & apparatus 216,676 1.77 258,116 1.66 355,536 1.73 28
H) Office machinery (data proc. equip.) 211,477 1.73 209,458 1.34 273,515 1.33 14
I) Aircrafts, ships & boats 134,085 1.10 789,762 5.07 169,209 0.82 12
J) Construction & mining machinery 101,231 0.83 101,481 0.65 140,550 0.68 18
K) Agricultural machinery & implements 36,836 0.30 37,686 0.24 73,780 0.36 42
L) Metal working machinery 20,773 0.17 34,449 0.22 73,313 0.36 88
M) Railway vehicles 49,553 0.41 72,473 0.46 41,118 0.20 -9
2 Chemicals & related products 2,160,711 17.68 2,797,709 17.94 3,604,693 17.50 29
A) Organic chemicals 747,953 6.12 976,111 6.26 1,224,977 5.95 28
B) Plastic materials 421,096 3.45 549,336 3.52 792,917 3.85 37
C) Fertilizer manufactured 239,766 1.96 284,714 1.83 416,947 2.02 32
D) Medicinal products 221,797 1.81 274,612 1.76 292,151 1.42 15
E) Other chemical products 168,646 1.38 183,633 1.18 228,754 1.11 16
F) Inorganic chemicals 78,313 0.64 143,179 0.92 200,632 0.97 60
D) Dyeing tanning & colour material 143,883 1.18 160,104 1.03 187,055 0.91 14
H) Insecticides 58,478 0.48 124,109 0.80 139,734 0.68 55
I) Essential oils, perfumes, toiletries, etc 80,779 0.66 101,911 0.65 121,526 0.59 23
3 Crude petroleum 1,366,514 11.18 1,765,132 11.32 2,148,811 10.43 25
4 Petroleum products 1,699,922 13.91 1,401,419 8.99 1,850,890 8.99 4
5 Iron & steel 402,342 3.29 512,009 3.28 890,167 4.32 49
6 Palm oil 539,315 4.41 612,990 3.93 703,179 3.41 14
7 Coal, coke & briquettes 77,486 0.63 147,454 0.95 277,061 1.35 89
8 Oil seeds & oleaginous fruits 204,085 1.67 250,023 1.60 243,623 1.18 9
9 Tea 172,743 1.41 192,517 1.23 222,556 1.08 14
10 Iron & steel scrap 47,854 0.39 93,599 0.60 222,061 1.08 115
11 Gold, non-monetary, not ore/concentrate 216,044 1.77 467,346 3.00 203,477 0.99 -3
12 Paper & paper board & manufacturers 131,674 1.08 164,375 1.05 195,091 0.95 22
13 Manufacture of metal 99,680 0.82 123,731 0.79 175,236 0.85 33
14 Professional, scientific & control 84,299 0.69 122,983 0.79 157,414 0.76 37
15 Synthetic & regenerated fibre 92,039 0.75 106,115 0.68 146,853 0.71 26
16 Rubber tyres & tubes 78,264 0.64 89,038 0.57 133,836 0.65 31
17 Synthetic & artificial silk yarn 91,842 0.75 117,997 0.76 130,192 0.63 19
18 Pulses 115,636 0.95 74,891 0.48 122,502 0.59 3
19 Aluminium wrought & worked 57,176 0.47 82,126 0.53 106,114 0.52 36
20 Iron ores and concentrates 47,053 0.39 43,702 0.28 98,027 0.48 44
Sub-total – Top 20 Imports 10,627,002 86.96 13,385,515 85.85 17,549,982 85.20
Others 1,593,252 13.04 2,206,262 14.15 3,048,132 14.80
Total 12,220,253 100.00 15,591,776 100.00 20,598,114 100.00 30
Source: UN COMTRADE

International Trade Centre Page 51
Annex 3 – Pakistan’s NAMA proposal

Page 52 International Trade Centre
WORLD TRADE
ORGANIZATION TN/MA/W/60 21 July 2005
(05-3268)
Negotiating Group on Market Access Original: English
MARKET ACCESS FOR NON-AGRICULTURAL PRODUCTS
The Way Forward
Communication from Pakistan
The following communication, dated 20 July 2005, is being circulated at the request of the Delegation of Pakistan.
_______________ 1. The objective of this document is not to present a new proposal for NAMA modalities, but to put forward some ideas for bridging the gap between the current proposals relating to the key issues of tariff reduction formulae and treatment of unbound tariffs: I. Tariff Reduction Formula 2. The proposals currently on the table can be summarized as under:
• Swiss formula with a single coefficient, but conditional flexibilities for developing countries to use the provisions of paragraph 8 of the July Framework (EU)
• Swiss formula with conditional flexibility of applying two coefficients (Norway and the US) or four coefficients (Chile, Colombia and Mexico)
• Swiss-type formula with multiple coefficients based on tariff averages and with paragraph 8 flexibilities (Argentina, Brazil and India); with addition of a credit system for developing Members (Antigua & Barbuda, Barbados, Jamaica and Trinidad & Tobago)
3. The first option is being advocated on the grounds that it is ambitious and simple to understand. However, this approach places disproportionate burden on developing countries who would be obliged to make major cuts in their tariffs as against developed countries that may not be required to carry out any major adjustments or reductions in their tariffs, if the coefficient for them is substantially higher than their average tariffs. 4. In the second option, use of more than one coefficient is allowed for developing countries. However, no criterion is indicated as to how those coefficients would be determined. It seems that the proposals of this category envisage that different coefficients should be “within sight of each other”. Furthermore, flexibility allowed to developing countries (except in the case of the Norwegian proposal) through the use of another coefficient is conditional.

International Trade Centre Page 53
Thus, many developing countries consider that the overall impact of these proposals may not be much different from the first proposal. 5. The third option is based on the objective criterion of current tariff profiles. Additionally, this approach is effective to deal with tariff peaks and tariff escalations of developed countries, which is one of the major objectives of this development round. However, this does not seem to be acceptable to developed countries and countries with low tariffs have expressed their reservations on the grounds that it favours countries with higher tariffs. Moreover, it is felt that this may not create any additional market access in some countries. 6. Since none of the proposals currently on the table seem to attract consensus, either new approaches are considered or the gap in the present proposals is bridged. Considering the time constraints and the fact that the limitations of the existing proposals are well-known, Pakistan feels that the preferred way forward would be to narrow the gap without making the formula too complicated and at the same time ensuring that the ambition of the Doha Round is not compromised. The result should be such that while providing additional opening of markets, it should not put disproportionate burden of restructuring of tariff rates for any group of countries. 7. This could be achieved by the adoption of a simple Swiss Formula with two distinct coefficients for developed and developing countries. These coefficients should be based on an objective criterion; taking the over all average of the bound tariff lines for developed and developing countries as their respective coefficients. These averages have been worked out to be 5.48% for developed countries, and 29.12% for developing countries30. For the sake of simplicity these could be taken as 6 and 30. 8. Some of the advantages of such an approach are:
• It is simple, transparent and easy to comprehend. WTO Members can clearly be aware of the consequences of their commitments.
• It results in a significant reduction of tariff peaks and tariff escalations. • It would cut higher tariffs much more than lower tariffs. • It would make everyone contribute, and everyone will gain through additional
market access. • It is based on an objective criterion.
9. The impact of the above proposal on the tariff rates has been calculated and reflected in annex to this document. For developing countries, the current bound rates up to 30% would reduce to 15% or lower, rates ranging between 30-60% will reduce to 15-20% and rates between 60-200% will reduce to 20-26%. For developed countries the rates of 5, 10, 15 and 30% would reduce to 2.73, 3.75, 4.29 and 5% respectively. II. Treatment of unbound tariffs 10. For the treatment of unbound tariffs, there are five proposals on the table: 30 The calculation was based on the data taken from document TN/MA/S/4/Rev.1/Corr.1. The developed countries mean, Australia, Canada, EC, Iceland, Japan, New Zealand, Norway, Switzerland, and the US, and those developing countries that will apply the formula (i.e. excluding countries under Paragraph 6 &9).

Page 54 International Trade Centre
i. Multiplying the MFN applied rate of 2001 by [two] (July Framework) ii. Marking up unbound lines by x times (to be negotiated) and binding tariff lines
at an average level after the application of the formula (Argentina, Brazil, and India or the ABI proposal)
iii. Capping of new bound tariffs at a ceiling of 40% with target average of 25% and no tariff reductions in this round for new tariff bindings (Malaysia)
iv. The “Rational Formula” Approach-a non –linear mark-up derived through a mathematical formula using two coefficients (Mexico)
v. Non-linear mark-up. Adding 5 percentage points (absolute) to each unbound rate (Canada, Hong Kong, China, New Zealand and Norway or the CHNN proposal)
11. Countries with low unbound tariffs are reluctant to accept options i and ii i.e. marking up unbound tariff lines two times or x times as they feel that this unduly favours those countries which have higher unbound tariffs. The Malaysian proposal may be workable for many developing countries, but countries with low bound tariffs feel that it conflicts with the July framework which requires that tariff reduction has to be comprehensive without ‘a priori exclusion’. The Mexican proposal could answer the concerns of countries with low unbound tariffs but the concept seems to be complicated and thus difficult to negotiate. The CHNN approach for non-linear mark-up is simple but the figure of 5 percentage points (absolute) seems to favour those countries which have low bound tariffs and is not acceptable to a majority of developing countries. 12. Therefore, Pakistan would like to propose that instead of a non-linear mark-up of 5 percentage points (absolute), mark up of 30 should be added to the base rate (applied rate of 2001) for each unbound line before the application of a formula. 13. By this proposal, the base rate of 5% would be marked up to 35% and through the application of the formula (with a coefficient of 30 proposed for developing countries), it would get reduced to about 16% where it could be bound. This would give some policy space to developing countries with low unbound rates. For higher unbound rate of 100% and above it would result in lowering that rate to around 24% where it would be bound. The annex to this document would provide guidance to Members for determining the final bound rate for each unbound line in their own tariff and the tariffs of their trading partners. III. Flexibilities 14. The developing country Members shall be eligible to the longer implementation period and other flexibilities as already agreed in paragraph 8 of the July package. Members covered by paragraph 6 and 9 shall not be subject to the tariff reduction formula. The newly acceded Members shall have special provisions for tariff reductions.

International Trade Centre Page 55
ANNEX
IMPACT OF PAKISTAN’S PROPOSAL
%
Swiss Formula Tariff Rates
C = 06 C = 30
5 2.73 4.29
10 3.75 7.50
15 4.29 10.00
20 4.62 12.00
25 4.84 13.64
30 5.00 15.00
35 5.12 16.15
40 5.22 17.14
45 5.29 18.00
50 5.36 18.75
55 5.41 19.41
60 5.45 20.00
65 5.49 20.53
70 5.53 21.00
75 5.56 21.43
80 5.58 21.82
85 5.60 22.17
90 5.63 22.50
95 5.64 22.80
100 5.66 23.08
%
Swiss Formula Tariff Rates
C = 06 C = 30
105 5.68 23.33
110 5.69 23.57
115 5.70 23.79
120 5.71 24.00
125 5.73 24.19
130 5.74 24.38
135 5.74 24.55
140 5.75 24.71
145 5.76 24.86
150 5.77 25.00
155 5.78 25.14
160 5.78 25.26
165 5.79 25.38
170 5.80 25.50
175 5.80 25.61
180 5.81 25.71
185 5.81 25.81
190 5.82 25.91
195 5.82 26.00
200 5.83 26.09

Page 56 International Trade Centre
References
Consumer Unity & Trust Society (CUTS) International. Pakistan’s Position on July Framework Issues. Available at www.cuts-international.org/pdf/Pakistan_CPP.pdf.
Federal Bureau of Statistics, Statistics Division, Government of Pakistan. Available at www.statpak.gov.pk.
Government of Pakistan. National Development Plan (2001-2011).
Government of Pakistan. Poverty Reduction Strategy Paper: Accelerating Economic Growth and Reducing Poverty: The Road Ahead, Government of Pakistan, 2003.
Industrial Information Network (IIN). Pakistan Leather Industry webpage. Available at http://www.iin.com.pk/SectionCategories.aspx?Id=2360&operationId=90&.
Industrial Information Network (IIN). Pakistan Textile Industry webpage. Available at http://www.iin.com.pk/SectionCategories.aspx?Id=411&operationId=85&.
Kemal, A.R., Muleh-Ud-Din, Ghani, Ejaz. Non-Agricultural Market Access: Priorities for South Asia, CUTS International Briefing Paper No. 3/2005. Available at www.cuts-international.org/pdf/No.3-NAMA.pdf.
Khor, Martin. A Development Assessment of the Current WTO Negotiations in Third World Resurgence, No 192/193, Aug/Sept 2006. Available at http://www.twnside.org.sg/title2/twr192-193.htm.
Minister of Commerce, Humayan Akhtar Khan. Trade Policy 2006-07 Speech, given 17 July 2006. Available at http://www.commerce.gov.pk/Tradepolicy.asp.
Ministry of Commerce, Government of Pakistan. ‘Regional/Bilateral Trade Agreements’ webpage. Available at http://www.commerce.gov.pk/tradeagreements.asp.
Ministry of Finance, Government of Pakistan. Economic Survey 2005-06. Available at http://www.finance.gov.pk/survey/home.htm.
Ministry of Finance, Government of Pakistan. Economic Survey 2006-07. Available at http://www.finance.gov.pk/survey/survey.htm.
Pakistan Readymade Garments Manufacturers & Exporters Association. Available at www.prgmea.org.
Permanent Mission of Pakistan to the World Trade Organisation (WTO). Pakistan’s Position on the Main Issues in the WTO Negotiations. Available at http://www.wto-pakistan.org/back_up/Documents_Index/Pak_DDA_position_23rd_July_2006.pdf.
Planning Commission, Government of Pakistan. Medium Term Development Framework 2005-10. Available at http://www.pakistan.gov.pk/ministries/planninganddevelopment-ministry/mtdf.htm.
Textile Commissioner’s Organisation, Ministry of Textile Industry, Government of Pakistan. Available at www.tco.gov.pk.
Trade Development Authority of Pakistan [previously Export Promotion Bureau]. ‘Export Statistics & Trends’ webpage. Available at http://www.tdap.gov.pk/v1/statistics/july/exports_pak.xls.
Wikipedia. ‘Economy of Pakistan’ webpage. Available at http://en.wikipedia.org/wiki/Economy_of_Pakistan#The_economy_today.

International Trade Centre Page 57