Embed Size (px)
Citation preview

Journal of Economic Cooperation and Development, 30, 1 (2009), 59-86
WTO AND PAKISTAN’S AGRICULTURE: A PRICE
INTEGRATION AND WELFARE ANALYSIS FOR WHEAT
Tahir Mukhtar & Muhammad Ishfaq1
This study evaluates the impacts of the Uruguay Round Agreement on
Agriculture (URAoA) on wheat using a partial equilibrium model. We
apply cointegration method for Pakistan in order to examine whether
there exists a stable long run relationship between farm gate price and
wholesale price and between wholesale price and world price of wheat.
Further Granger causality test is applied to discover the direction of
influence between the prices. Price integration analysis shows that there
is a stable long run relationship between farm gate price and wholesale
price and between wholesale price and world price of wheat. Direction
of influence is from world price to wholesale price and from wholesale
price to farm gate price. The welfare analysis has been conducted by
estimating the domestic demand and supply functions and by using the
concepts of consumer and producer surpluses. It is found that loss in
consumer surplus exceeds gain in producer surplus and the nation will
have to face net welfare loss in case of wheat under trade liberalization.
1. Introduction
Pakistan is a low-income, food-deficit country (LIFDC) with a gross
national product per capita of US$950. Agriculture is a major economic
activity in Pakistan. Although its share in the economy is declining and
has come down to 20.9 percent of GDP, it is still the backbone of the
economy. It is a dominant sector in terms of employment (43.4 percent),
directly sustains 66 percent of population and claims a high share in the
total trade (Pakistan, 2006).
1 The authors are respectively, Ph.D Scholar & Assistant Professor, Department of
Economics, Quaid-i-Azam Unioversity, Islamabad.

60 WTO and Pakistan‟s Agriculture: A Price Integration and
Welfare Analysis for Wheat
Pakistan joined World Trade Organization (WTO) in 1994. Being a
signatory of WTO; Pakistan has accepted both the opportunity and the
challenge of trade liberalization. In view of the importance of agriculture
sector in its economy, Pakistan has actively supported agriculture sector
liberalization in the Uruguay Round (UR) of trade negotiations with a
view to increasing market access for its agriculture exports. While
Pakistan has broadly fulfilled its obligations under the Agreement on
Agriculture (AoA), the consequent changes in its policy have
implications for various domestic stakeholders – consumers and
producers.
Until the mid 1980, Pakistan pursued an economic policy that was
strongly interventionist. One of the consequences has been price
discrimination against agriculture in the sense that the government taxed
the producers and subsidized consumers. During the late 1980s, Pakistan
turned from inward-looking policies towards trade liberalization and
export promotion strategies. From the late 1980s onwards, the
governments changed frequently but all of them considerably liberalized
the economy (Akhtar, 1999).
Crops are the most important sub-sector of Agriculture sector of
Pakistan. Among the major food crops wheat is the main staple diet of
the country‟s population. It contributes 74 percent of the overall
production of food grains. Wheat area constitutes 36 percent of the total
cropped area and its production accounts for 30 percent of the value
added by major crops (APCOM, 2004). Pakistan is one of the major
producers of wheat in the world. Yet the domestic wheat production
remains insufficient for the needs of population, which is at present
growing at about 1.9 percent per annum. Hence to ensure food security,
the country has to supplement the local production with imports. It is
estimated that imports cover from 10-20 percent of national
consumption needs (Ashiq & Ahmed, 2001). By virtue of its high import
dependence for essential items like wheat and edible oil that absorb 13
percent of total foreign exchange earnings, Pakistan is characterized as
net food importing developing country (FAO, 1999).
Because of the strategic importance of wheat as a major staple food
commodity, government used to intervene not only to guarantee
affordable supplies to consumers, but also to provide market support to

Journal of Economic Cooperation and Development 61
producers. The present wheat policy is based on a system of official
wheat procurement and releases of wheat at officially regulated
procurement and release prices. It involves a significant cost to the
public exchequer on account of marketing and storage of wheat by the
public sector. In addition, the government of Pakistan has tried to keep
the price of wheat below the international level in order to subsidize
domestic consumers (Ghani, 1998).
The impact of the Uruguay Round Agreement on Agriculture (URAoA)
on wheat has been predicted more than for most other grains due in part
to the greater degree of subsidization of wheat in the past. Total
subsidized wheat exports are scheduled to fall from 59 million tons in
initial year to 40 million tons by 2004 (FAO, 1995). During the UR of
Talks, the United States and Canada, promised to reduce government
subsidies on wheat farmers. These two countries are major sources of
wheat imports in Pakistan. Since they are major supplier of wheat in the
world too, they are the price leaders. The elimination of subsidies on
wheat by these countries would result in higher prices of Pakistan‟s
wheat imports. Most global general exercises have predicted almost 7-
11 percent increase in wheat price, following implementation of the UR
Agreement on Agriculture.
The main objectives of this study are: first, to determine the impact of
trade liberalization on domestic prices, production and consumption of
wheat in Pakistan; second to examine the extent of benefits and losses to
be gained by Pakistan as a result of trade liberalization with special
reference to wheat.
2. Literature Review
In this section some of the past studies are reviewed keeping in view the
objective of our study.
Ghani (1998) evaluates the impact on wheat production, consumption
and trade of changing the input subsidy and output price subsidy
policies. The results of the study indicate that there will be a greater
decline in wheat production if the government eliminates the input
subsidies at once than if there is a gradual phasing out of these. There
will be a slight decline in the consumption of wheat due to an increase in

62 WTO and Pakistan‟s Agriculture: A Price Integration and
Welfare Analysis for Wheat
the consumer price of wheat. However, the low-income household with
the higher number of family members will be affected more with the
increase in the price of staple wheat. Imports of wheat are greater if the
subsidies are eliminated at once, as compared to phase them out
gradually. Akhtar (1999) estimates the impact of trade liberalization on
wheat, rice (both Basmati and non-Basmati rice) and maize by using
simple welfare analysis to conduct welfare analysis for these
commodities. He finds net loss to Pakistan of Rs. 3711 million and Rs.
64.86 million for wheat and maize respectively during 1997-98. While
in case of rice, net gain to Pakistan is calculated Rs. 3232.76 million
during 1997-98. Ashfaq, et al (2001) identify the relevance and
importance of various factors that have affected wheat market of
Pakistan during the period of 1971-96. Their study is an improvement
on earlier ones as it includes all-important activities of the wheat
economy of Pakistan and as a larger time period is covered for the
analysis. Various types of elasticities estimated in the study are found to
be consistent with the results obtained by other researchers. The highly
inelastic supply of wheat suggests that in future substantial increase in
the supply of wheat will occur if price incentives are given along with
other institutional supports like research and extension, timely
availability of inputs and development of infrastructure like irrigation
facilities which will bring additional land into cultivation. Conforti
(2004) aims at providing evidence on price transmission in a number of
agricultural markets, both per se and in support of analytical efforts in
the area of agricultural trade policy analysis. His work is based on a
price database collected from various sources in sixteen developing
countries including Pakistan, primarily for basic food commodities. Data
are analyzed with an econometric framework based on the estimation of
Autoregressive Distributed lag Models and of the corresponding Error
correction specification. Tests for Granger causality and for asymmetric
transmission are also performed. Results of the test in case of Pakistan
indicate the presence of long run equilibrium between the domestic and
the world reference prices primarily for wheat, rice, maize and bovine
meat. Khan et al (2004) probe into the interplay of the factors operating
on supply side of the wheat economy of Pakistan. They carry out an
analysis to determine the performance of the agricultural policy of the
country in securing a sustainable measure of self-sufficiency in food
production. The results show that supports price policy, adequate water
availability and technology together helped enhance the wheat

Journal of Economic Cooperation and Development 63
production of the country. It is argued that achievement of the
proclaimed objectives of the wheat support price policy in Pakistan has
been constrained because of the incumbent governments‟ high political
stakes, usually warranting protection of urban consumers and producers
by keeping food prices low. They conclude that wheat production is not
some peripheral issue and the target of increasing both wheat production
and wheat growers‟ income must be central to the macro management
policy in Pakistan.
3. Method of Analysis
The present study has used a partial equilibrium model in order to
quantify the gains and losses to Pakistan after trade liberalization in case
of wheat. We make use of Partial equilibrium trade models as they focus
on international markets for a selected set of traded goods, such as
agricultural goods. In most cases, they consider the agricultural system
as a closed system without linkages to the rest of the economy. Effects
of the rest of the domestic and world economy on the agricultural
system could be included by altering parameters and exogenous
variables. The models may be single or multi products. Partial
equilibrium trade models have primarily been constructed to provide
insight into the implications for domestic and international agricultural
markets of existing and alternative agricultural policies. The models
generate information on the effects of such policies on domestic supply,
demand, prices, the volume of international trade and “world market”
prices. This information is often used to compute partial equilibrium
welfare measures such as producers‟ and consumers‟ surplus.
In order to assess the effects of trade liberalization on wheat, we first
check whether there exists any co-integration between wholesale price
and world price and between farm-gate price and wholesale price of
wheat. If there is no stable relationship between the above prices, then
the implementation of AoA of WTO has no important implications in
case of wheat for Pakistan. The welfare analysis has been conducted by
estimating the domestic demand and supply functions and by using the
concepts of consumer and producer surplus. The demand, supply and
price linkage equations are estimated using double log standard
regression analysis. The multiplicative (or log-log) function has the
advantage of facilitating use of results in terms of percentage change in

64 WTO and Pakistan‟s Agriculture: A Price Integration and
Welfare Analysis for Wheat
the variables, allowing estimated parameters to be interpreted as
elasticities. To get more reliable estimates, all the equations are also
corrected for autocorrelation.
3.1. Price Integration Model
For price integration, simple bivariate correlation coefficients measure
price movements of a commodity in different markets. This is the
simplest way to measure the spatial price relationships between two
markets. However, this method clearly has some limitations, as it cannot
measure the direction of price integration between two markets. The co-
integration procedure measures the degree of price integration and takes
into account the direction of price integration. This econometric
technique provides more information than the correlation procedure, as
it allows for the identification of both the integration process and its
direction between two markets.
Domestic and World prices move over time because of various shocks.
If in the long run they exhibit a constant linear relation, then they are co-
integrated. In general, the presence of co-integration between two series
is indicative of inter-dependence. In other words, co-integration
indicates non-segmentation between the two series. Co-integration
analysis is a useful tool to give an answer about the existence of a
relation between two economic time-series.
We apply co- integration method developed by Engle and Granger
(1987) in order to examine whether there exists a stable relationship
between farm-gate price and wholesale price and between wholesale
price and world price of wheat in case of Pakistan. Further Granger-
Causality test is applied to find the direction of influences between the
prices and to decide on the leading prices for rice. The objective of this
exercise is to explore the possibility of trade liberalization in term of
relationship between world prices and domestic prices of wheat.
3.2. Domestic Demand Function
In accordance with standard demand theory, wheat demand in Pakistan
is function of its own price, prices of substitutes and complementary

Journal of Economic Cooperation and Development 65
products and Per capita income. In the present study only two factors i.e.
commodity‟s own price and Per capita income are being used.
)1(),( IPfQ cd
Where
Qd is Total quantity demanded of wheat;
Pc is Domestic market price of wheat;
I is Per capita income;
Elasticity of demand )(%/)(%)( cdcp PQE .
3. 3. Domestic Supply Function
Agriculture production is affected by many and varying factors
according to the nature of the crop. The supply response of wheat can be
assumed to be a function of own output price, prices of all the other
relevant crops and prices of inputs and technology (Ali, 1990). In this
study, two variables namely commodity‟s own output price and
technology have been used to measure price elasticity coefficients, while
other factors are being kept constant.
)2(),( TPfQfs
Where
Qsi = total quantity supplied of wheat;
Pf = price of wheat at farm level;
T = trend variable used as a proxy for technology
Elasticity of supply (Epf ) = (%∆Qs) / (%∆Pf).
Price transmission elasticity estimates (α1 and β1) will be computed
using method of co-integration. Following Thompson and Bohl (1999),
we define:
)3(110 uPwPd
)4(110vPP
cf
α1 as the percentage change in the domestic price (Pd) in response to a
one percent change in the world price (Pw) i.e. α1= (% Pd) / (%Pw)
and β1 as the percentage change in the farm level price (Pf) in response

66 WTO and Pakistan‟s Agriculture: A Price Integration and
Welfare Analysis for Wheat
to a one percent change in the wholesale price (Pd) ie. β1= (% Pf)/ (%
Pd). Normally α1 and β1 range from 0 to 1, where a high price
transmission elasticity signifies a high degree of co movement of the
prices of the above two sets of markets of a given commodity. For
example, α1= 1 means that a one percent change in the world price of a
commodity is precisely reflected in a one percent change in the local
price of that commodity, so a high value for α1 can be taken as a
measure of well integrated markets.
3.4. Welfare Analysis
The magnitude of the net welfare effect depends on the magnitude of the
price change, the initial price and quantity, and the consumers‟ and
producers‟ sensitivity to price changes. If consumers exhibit a high
elasticity of demand, then they will greatly decrease their consumption
when faced with a price increase. This flexibility allows them to escape
the new high price, which softens the effect. On the other hand, if
consumers have inelastic demand, changes in the price bring only a
small response from consumers. In this case, price increases have a more
harmful effect on consumers‟ welfare, as they do not escape the higher
price by decreasing their consumption of the good. The welfare effect
also depends on the producers‟ sensitivity to price changes. If producers
have elastic supply, then they will greatly increase production at the
higher price. However, in Pakistan and in other developing countries,
there are many factors that can decrease the elasticity of supply. These
include poor transportation infrastructure and limited ability to increase
productivity due to a lack of access to credit.
One of the main objectives of our study is to determine the net welfare
change for Pakistan as a result of trade liberalization in the light of
Agreement on Agriculture (AoA) of WTO. To measure the net welfare
change, we combine the change in producer surplus with the change in
consumer surplus. Consumer surplus is the difference between the price
of a unit of a good, and the maximum amount that the consumer would
have been willing to spend on that unit. Producer surplus is difference
between the cost of producing a unit of a good, and the price at which
that unit is sold. Following equations have been estimated to measure
the changes in consumer surplus and producer surplus for wheat.
Journal of Economic Cooperation and Development 67
)5(}5.0*)'('{)( DDDSurplusConsumerinChange tb
)6(}5.0*)({)(Pr ' SSSSurplusoducerinChange tb
Net welfare effect = Change in Producer Surplus +Change in Consumer
Surplus.
Where, Pti is the price of wheat in the base year i.e 2003; Pw is the price
of wheat after trade liberalization; D is the quantity demanded of wheat
in the base year i.e 2003; D' is the quantity demanded of wheat after
trade liberalization; S is the quantity supplied wheat in the base year i.e
2003; S' is the quantity supplied of wheat after trade liberalization.
4. Data Sources
The time series data for wheat have been used for quantitative analysis.
The study covers the time period from 1980 to 2003. Ideally data should
be from a single source to maintain consistency. However, there is no
single source that can provide all relevant data. Therefore, different
secondary sources of data have been used to take the above-required
data. The data have been taken from Agricultural Statistics of Pakistan
(various issues), Economic Survey of Pakistan (various issues),
Agriculture Prices Commission, Islamabad, Pakistan, Federal Bureau of
Statistics, Islamabad, Pakistan and Food & Agriculture Organization of
United Nations, Rome, Italy.
5. Results and Discussion
The core of this study is to determine the impact of trade liberalization
on domestic prices, production and consumption of wheat in Pakistan
and to conduct the welfare analysis. For this purpose, the equations
specified in the research methodology have been estimated, using data
on the relevant variables for the period 1980-2003. The number of
observations used for each price series (about 24) prevents us from
obtaining fully conclusive evidence from tests on dynamic properties of
the price series and therefore, also from the co-integration tests. So, for
getting more concrete evidence on price transmission, a future analysis
68 WTO and Pakistan‟s Agriculture: A Price Integration and
Welfare Analysis for Wheat
will have to concentrate on using a more significant number of
observations for each price series.
Using the FAO‟s study on “Impact of Uruguay Round on Agriculture “,
1995, it is assumed that the international price of wheat would increase
by 7 percent at world level. Different price elasticity coefficients have
been then used to estimate this projected increase in price on wheat at
national level.
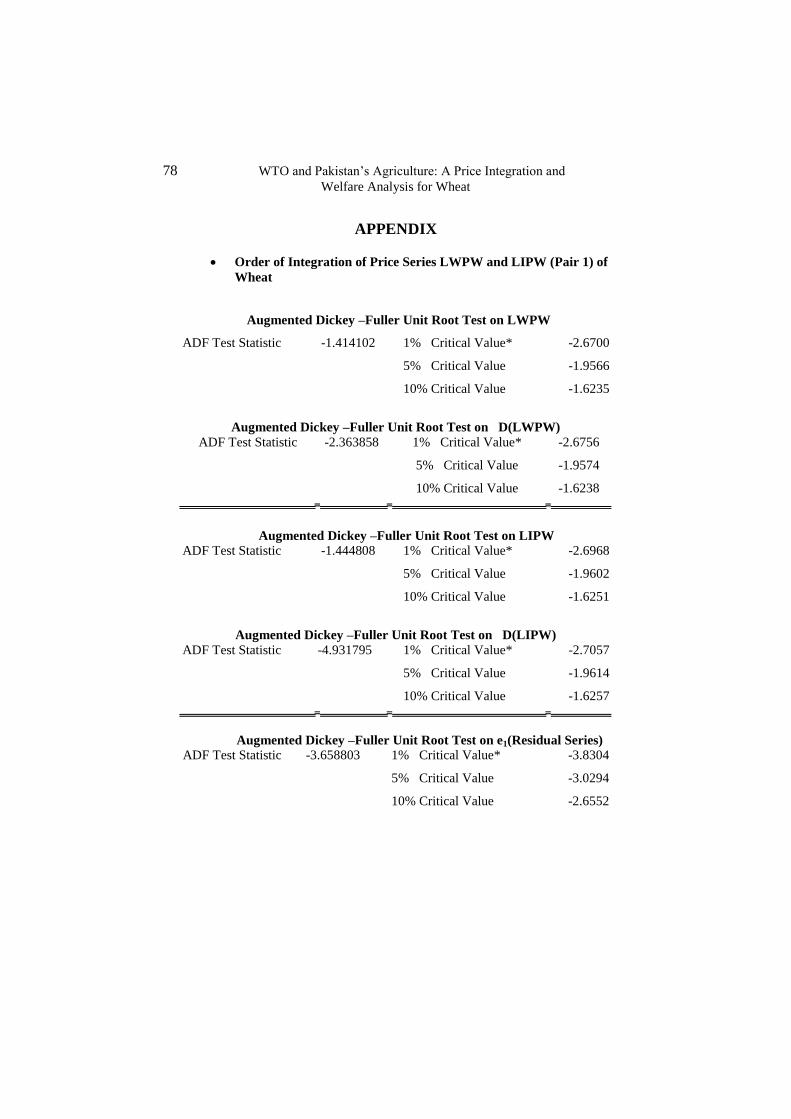
5.1. Price Integration of Wheat
To start with, we investigate the stochastic properties of the three price
series of wheat that is determine their order of integration, arranged into
two pairs where pair one contains LWPW1 and LIPW while pair two
includes LFPW and LWPW. If price series are stationary or integrated
of order zero, it is denoted as I(0).If series must be differenced once to
become stationary , it is denoted as I(1).If series must be differenced d
times to become stationary , it is denoted as I(d).The difference between
I(d) and I(0) is the I(0) has finite mean and variance when for the former
they do not exist. In order to be integrated, price need to be integrated of
the same order. Usually prices are found to be I(1) their first
differencing would give I(0).If prices are integrated of different order,
no co integration exist, because at least one of the series contains
explosive components. To check for the order of integration we apply
Augmented Dickey-Fuller test on two pairs of price series of wheat. The
results of ADF tests support the presence of unit root in each case. Test
results are presented in detail in Appendix. According to the
methodology; prices are checked for the order of integration. Prices in
both the pairs are integrated of order (1) that is each is non-stationary in
levels but stationary in first difference and there exists a linear
combination between them, which is stationary.
1 LWPW=Natural log of Wholesale Price of Wheat at Lahore
LIPW= Natural log of International Price of Wheat
LFPW=Natural log of Farm gate Price of Wheat
Journal of Economic Cooperation and Development 69
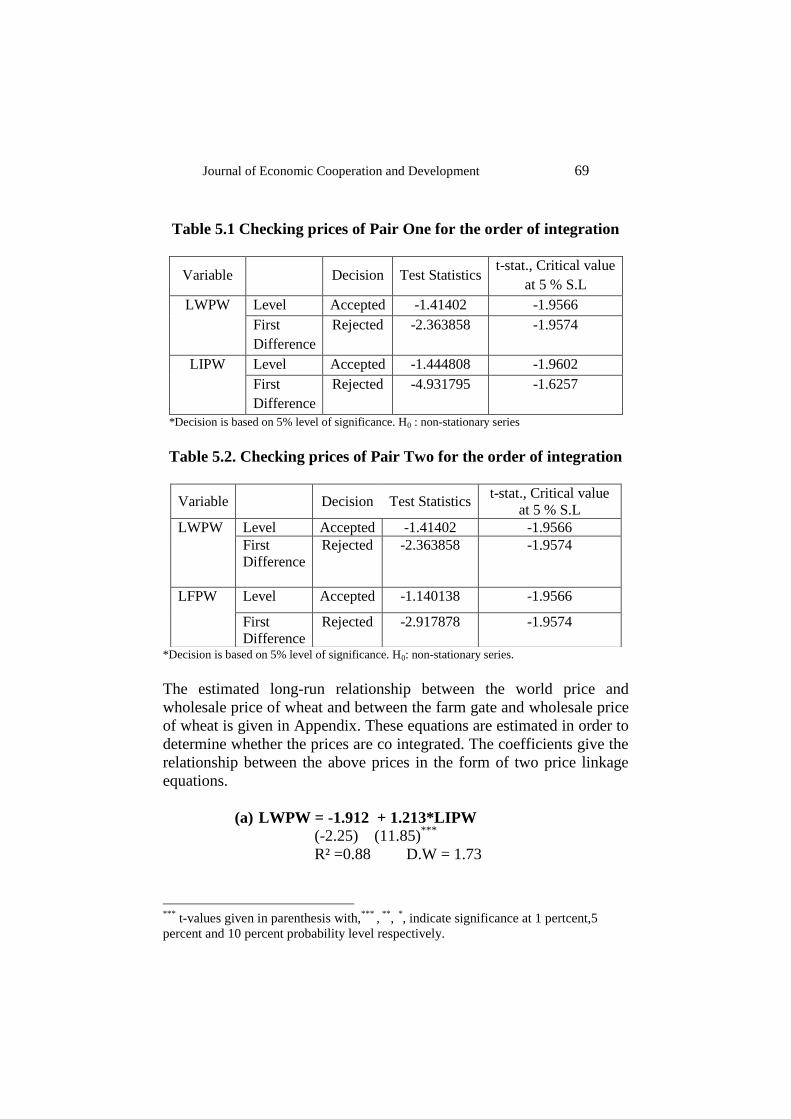
Table 5.1 Checking prices of Pair One for the order of integration
*Decision is based on 5% level of significance. H0 : non-stationary series
Table 5.2. Checking prices of Pair Two for the order of integration
*Decision is based on 5% level of significance. H0: non-stationary series.
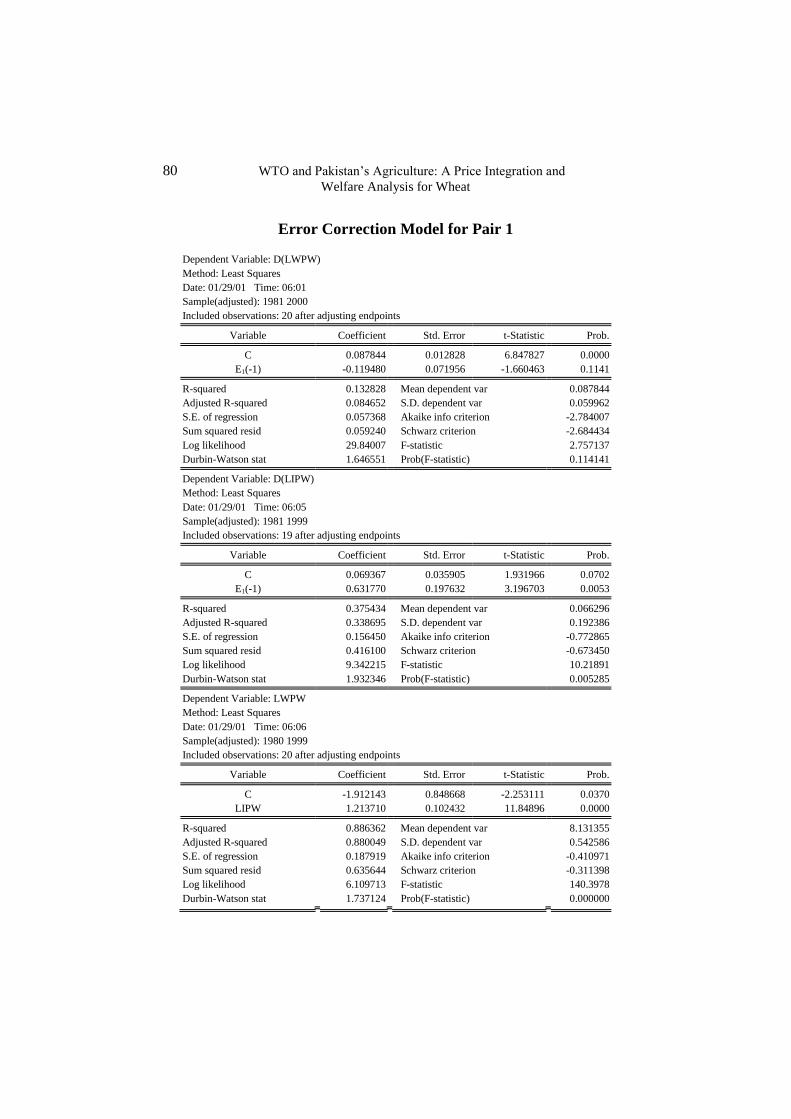
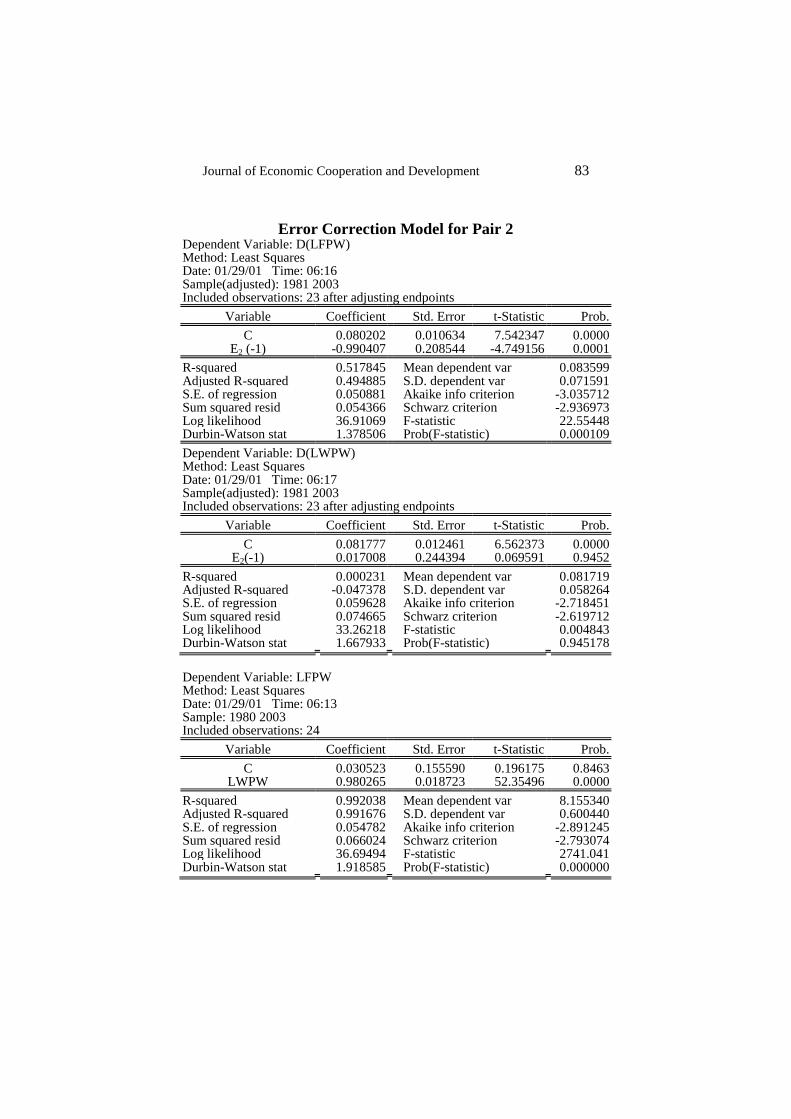
The estimated long-run relationship between the world price and
wholesale price of wheat and between the farm gate and wholesale price
of wheat is given in Appendix. These equations are estimated in order to
determine whether the prices are co integrated. The coefficients give the
relationship between the above prices in the form of two price linkage
equations.
(a) LWPW = -1.912 + 1.213*LIPW
(-2.25) (11.85)***
R² =0.88 D.W = 1.73
***
t-values given in parenthesis with,***
, **
, *
, indicate significance at 1 pertcent,5
percent and 10 percent probability level respectively.
Variable Decision Test Statistics t-stat., Critical value
at 5 % S.L
LWPW Level Accepted -1.41402 -1.9566
First
Difference
Rejected
-2.363858
-1.9574
LIPW Level Accepted -1.444808 -1.9602
First
Difference
Rejected -4.931795 -1.6257
Variable Decision Test Statistics t-stat., Critical value
at 5 % S.L
LWPW Level Accepted -1.41402 -1.9566
First
Difference
Rejected -2.363858 -1.9574
LFPW Level Accepted -1.140138 -1.9566
First
Difference
Rejected -2.917878 -1.9574

70 WTO and Pakistan‟s Agriculture: A Price Integration and
Welfare Analysis for Wheat
(b) LFPW = 0.030 + 0.980*LWPW
(0.19) (52.35) ***
R2 =0.99 D.W =1.91
Each of the price series is non-stationary and transformation into the
first difference is required to obtain a stationary series. The linear
combination of the two price series in both the pairs gives the residuals
which are stationary I(0) and this gives the basis for condition that two
price series are indeed co integrated in each pair. The corresponding co
integration test is presented in tables 5.3, 5.4 and in Appendix.
Table 5.3. Checking Residuals for the presence of a unit root
*Decision is based on 5% level of significance
Table 5.4. Checking Residuals for the presence of a unit root
*Decision is based on 5% level of significance
However, to a certain degree, the world and domestic prices should influence
each other, so this study does the causality test to investigate the direction of
the influences. In order to analyze the causality pattern in detail, this study
applies the Granger-causality method to do test with 1~ 3 lagged periods
respectively. The results are listed in table 5.5 and 5.6 respectively.
Table 5.5: Price Causality between LWPW and LIPW
Lagged years Null Hypothesis Decision
1 No causality from LWPW to LIPW Accepted
No causality from LIPW to LWPW Rejected
2 No causality from LWPW to LIPW Accepted
No causality from LIPW to LWPW Rejected
3 No causality from LWPW to LIPW Accepted
No causality from LIPW to LWPW Rejected
Variable Decision Test - Statistics t- stat
Residuals from (a) Level Rejected -3.767933 -1.9602
Variable Decision Test -
Statistics t- stat
Residuals from (b) Level Rejected -4.495793 -1.9566
Journal of Economic Cooperation and Development 71
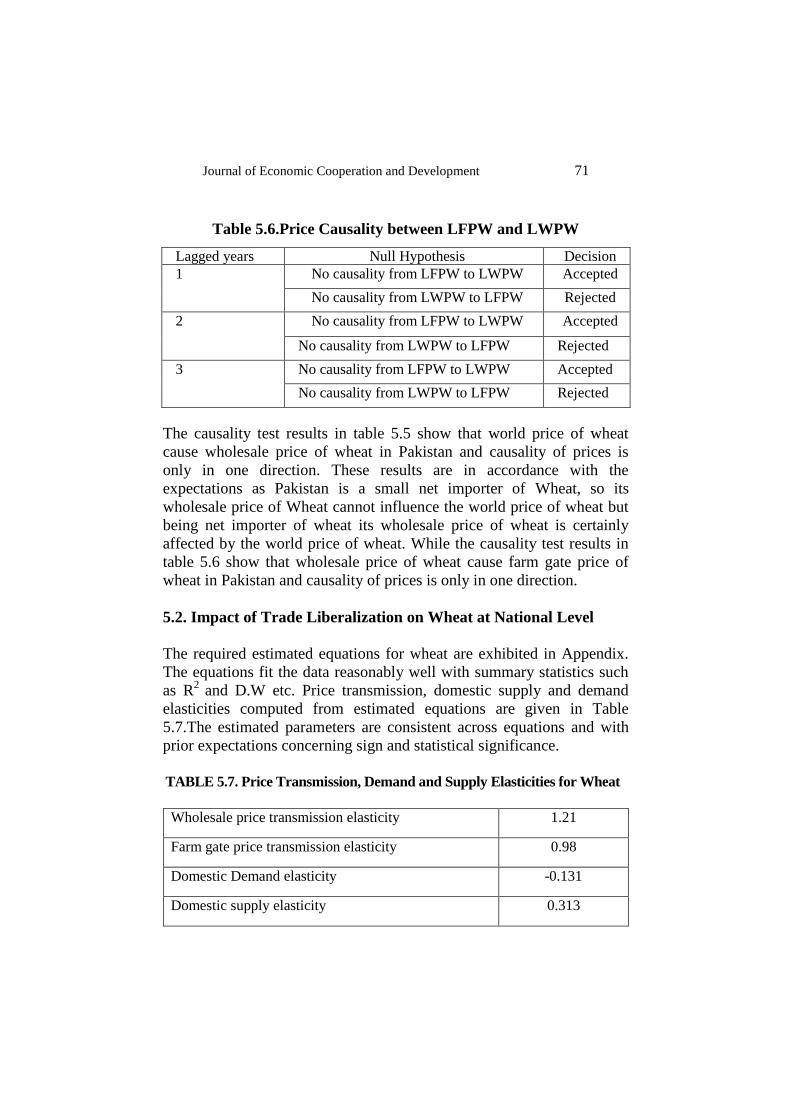
Table 5.6.Price Causality between LFPW and LWPW
Lagged years Null Hypothesis Decision
1 No causality from LFPW to LWPW Accepted
No causality from LWPW to LFPW Rejected
2 No causality from LFPW to LWPW Accepted
No causality from LWPW to LFPW Rejected
3 No causality from LFPW to LWPW Accepted
No causality from LWPW to LFPW Rejected
The causality test results in table 5.5 show that world price of wheat
cause wholesale price of wheat in Pakistan and causality of prices is
only in one direction. These results are in accordance with the
expectations as Pakistan is a small net importer of Wheat, so its
wholesale price of Wheat cannot influence the world price of wheat but
being net importer of wheat its wholesale price of wheat is certainly
affected by the world price of wheat. While the causality test results in
table 5.6 show that wholesale price of wheat cause farm gate price of
wheat in Pakistan and causality of prices is only in one direction.
5.2. Impact of Trade Liberalization on Wheat at National Level
The required estimated equations for wheat are exhibited in Appendix.
The equations fit the data reasonably well with summary statistics such
as R2
and D.W etc. Price transmission, domestic supply and demand
elasticities computed from estimated equations are given in Table
5.7.The estimated parameters are consistent across equations and with
prior expectations concerning sign and statistical significance.
TABLE 5.7. Price Transmission, Demand and Supply Elasticities for Wheat
Wholesale price transmission elasticity 1.21
Farm gate price transmission elasticity 0.98
Domestic Demand elasticity -0.131
Domestic supply elasticity 0.313

72 WTO and Pakistan‟s Agriculture: A Price Integration and
Welfare Analysis for Wheat
5.2.1. Impact on Domestic Prices of Wheat
The elasticity of price transmission of wholesale price of wheat at the
Lahore market with respect to the international price of wheat (c.i.f.
Karachi) is 1.21. This means that a 1 percent increase in the
international price of wheat would increase the Lahore wholesale price
of wheat by 1.21 percent. Therefore, the increase in world price of wheat
by 7 percent would cause an increase in wholesale price of wheat by
8.50 percent in Pakistan due to trade liberalization. Thus Rs. 9326/ton
wholesale price of wheat in 2003, which has been taken as a base year,
would become Rs. 10119/ton after the trade liberalization at current
market price.
The price elasticity of transmission of wheat price received by farmers
with respect to the wholesale price of wheat is 0.95. It means that a 1
percent change in wholesale price will result in a 0.98 percent change to
farm level prices. Since wholesale price is expected to increase by 8.50
percent under total trade liberalization, farm gate price to be received by
farmers is expected to increase by 8.33 percent i.e. from Rs 8687/ton to
9411/ton.
5.2.2. Impact on Domestic Demand for Wheat
The demand elasticity with respect to Lahore wholesale price is –0.131
as presented in table 5.7. This means that a 1 percent increase in the
Lahore wholesale price of wheat is estimated to decrease the domestic
demand by 0.131 percent. Therefore the impact of increase in the world
price of wheat by 7 percent would cause the demand for wheat to
decline by 1.11 percent i.e. from 18233 thousand tons to 18031 thousand
tons during 2003-04.The increase in wholesale price of wheat in
Pakistan and resulting decrease in quantity demanded would cause a
change in consumer surplus of -Rs. 14379 millions.
5.2.3. Impact on Domestic Supply of Wheat
The elasticity supply of wheat with respect to the farm level price of
wheat is 0.313 as presented in table 5.7. This value indicates that if price
of wheat is increased by 1 percent, production of wheat goes up by
0.313 percent. The impact of the 7 percent increase in the world price of
Journal of Economic Cooperation and Development 73
wheat on the price of wheat received by the Pakistani farmers is
estimated at 8.33 percent. Therefore, this would cause an increase in
domestic production of wheat by 2.6 percent i.e. from 19500 thousand
tons to 20007 thousand tons. This increase in the production of wheat
would generate a change in producer surplus of Rs. 14302 millions
(using the equation for producer surplus in the analytical framework).
It is concluded from the above analysis that the seven percent increase in
the international price of wheat due to the UR agreement will have a
positive impact on the production of wheat in Pakistan. On the other
hand, it will have a negative impact on the consumers. However, the
overall impact to Pakistan is negative (Rs 77 million).
The inelastic supply elasticity of wheat suggests that price incentives
alone cannot boost the production to a substantial level. Institutional
support like research and extension is prerequisite to take the full
advantage of UR induced higher prices of wheat.
6. Conclusions and Policy Implications
Agriculture is a key sector in Pakistan because of its major share
(around one-fourth in GDP) in the economy in terms of its contribution
to national income and employment. Crops are the most important sub-
sector of Agriculture sector of Pakistan. Among the major food crops,
wheat is the main staple food of the country‟s population and it occupies
more land under agriculture than all other crops. Considering the
importance of wheat, we have analyzed the impact of trade liberalization
on wheat both at national and farm levels in Pakistan. Although Pakistan
is a greater producer of wheat in the world yet it has to import
substantial amount of wheat in order to ensure food security. The
challenges for agriculture sector of Pakistan and particularly for wheat
are quite different from those met in the previous decades, as it will soon
engage in free international trade of agricultural products.
For quantifying the impacts of trade liberalization on wheat in Pakistan,
a partial equilibrium model has been used where we tested price
integration to check the relationship between wholesale price and world
price and between farm gate price and wholesale price of wheat. Price
integration analysis shows that there is a stable long run relationship
between the wholesale price and world price and between farm gate

74 WTO and Pakistan‟s Agriculture: A Price Integration and
Welfare Analysis for Wheat
price and the wholesale price for wheat. Direction of influence is from
world price to wholesale price and from wholesale price to farm gate
price under Granger causality test.
The impact of increase in world price of wheat as a result of trade
liberalization on wholesale and farm gate level prices of wheat in
Pakistan has been estimated using elasticity coefficients from estimated
demand, supply and price linkage equations. The demand elasticity is
found less elastic, which shows that along with increase in its price,
there will be very small decrease in the demand of wheat. Moreover, it is
evident that with the increase in wheat price, there will be increase in the
import bill of wheat on one hand and on the other hand further burden
on the poor people who purchase food grains from the market. The
supply elasticity is also found to be low by any reasonable standard.
Thus, increase in wheat production may not be sufficient to meet the
country‟s demand as a result of rise in its price after trade liberalization.
Under welfare analysis, it is found that loss in consumer surplus exceeds
gain in producer surplus and the nation will have to face net welfare loss
in case of wheat under trade liberalization.
The present study shows that domestic price of wheat will rise in
future and as a result will harm the poor consumers. In order to
protect the consumers from high or sudden rise in price and to
ensure food security, following essential conditions are
recommended:
(a) Food security objectives should not be compromised in any case
and major reliance will have to be placed on government stocks
for price stability and availability of staple food to entire
population.
(b) Along with public sector, efforts should be made to encourage
the investment by the private sector in marketing and
procurement of wheat. But the issue of food security cannot be
left entirely at the mercy of private sector and the government
should always be there to play a supervisory and dominant role.
Journal of Economic Cooperation and Development 75
(c) Targeted consumer subsidies should be provided to the low-
income groups and people below the poverty line who are
expected to be adversely affected by increase in food prices.
The responsiveness of wheat production to change in price has
been found to be very low. Therefore, price policy of agriculture
should not be pressed to increase production but its main
function should be to act as a signal for proper allocation of
resources.
In order to increase the productivity of wheat, non-price factors
should be well appreciated. Non- price support can be provided
to producers through the Special and Differential Treatment
(SDT) provisions and the Green Box exemptions. Following
measures can be applied to take the full advantage of these
exemptions:
(a) Technology meant to increase water efficiency and other inputs
can be made available for hiring at union council level.
(b) Proper and timely supply of inputs like seeds, fertilizers and
permitted pesticides etc. should be ensured.
(d) Agriculture policy needs to aim at improved infrastructure so
that Pakistan may able to take full advantage of the price
increase in the world market.

76 WTO and Pakistan‟s Agriculture: A Price Integration and
Welfare Analysis for Wheat
References
Ali,M.(1990), "The Price Response of Major Crops in Pakistan: An
Application of Simultaneous Equation Model”, The Pakistan
Development Review,29(2-3):305-325. Akhtar, M. R. (1999), “Effects of Trade Liberalization on Agriculture in
Pakistan: Commodity Aspects “. Working Paper No. 44, United Nations
ESCAP CGPRT Center, Bogor, Indonesia. APCOM. (2004),"Support Price Policy for Wheat, 2004-05 Crop",
Agricultural Price Commission Series No.212, Islamabad. Ashfaq, M., G. Griffith and K. Parton, (2001), “An Econometric Model
of Wheat Market in Pakistan”. Pakistan Journal of Agricultural
Economics 4 (2), 99-111. Ashiq, M.R.and M.I Ahmed,(2001),"Social Profitability of Wheat and
Oil seeds Production In Pakistan”, Pakistan Journal of Agricultural
Economics, 4 (1): 34-37. Binswanger, H. and Ernst L. (1990),"Agricultural Trade Barriers, Trade
Negotiations, and the Interests Of Developing Countries”, The World
Bank, Washington DC, USA. Bessler, D. and J. Brandt, (1982)," Causality Tests in Livestock
Markets", American Journal of Agricultural Economics, 64, 140-144. Baffes, J. and B. Gardner, (2003), "The Transmission Of World
Commodity Prices To Domestic Markets Under Policy Reforms In
Developing Countries", Journal of Policy Reform, 6(3): 159-80 Engel,R.F. and C.W.J.Granger (1987),"Cointegration And Error
Correction: Representation,Estimation And Testing",Econometrica,
49:251-276. FAO, (1995), “Impact of the Uruguay Round on Agriculture”, Food and
Agriculture Organization of the United Nations, Rome, Italy.
FAO.(1999),"Experience With The Implication Of The Uruguay Round
Agreement On Agriculture-Developing Country Experiences”,
Commodities And Trade Division. United Nations, Rome, Italy.

Journal of Economic Cooperation and Development 77
Ghani, Ejaz (1998), “The Wheat Pricing Policies in Pakistan: Some
Alternative Options”, The Pakistan Development Review, 37 (2): 149-
166. Khan, N. Z., Munir Ahmad and Asia Rasheed, (2004), “Wheat
Production in Pakistan: Saga of Policy Disincentives”, Paper presented
at 19th
Annual Meeting and Conference.13-15 Jan.2004,Pakistan Society
of Development Economists, Islamabad. Mundlak Y. and D. F. Larson, (1992), “On the Transmission of World
Agricultural Prices”, The World Bank Economic Review, 6 (3): 399-422 Pakistan, Government of (2006-07),"Economic Survey” Finance
Division, Islamabad. Pakistan, Government of (2003-04),"Agricultural Statistics Of
Pakistan”, Ministry Of Food, Agriculture & Livestock, Islamabad. Thompson, S. R., and M. T. Bohl. (1999), “Wheat Price Transmission
and CAP Policy Reform”. Discussion Paper No. 53, Institute for
Agricultural Policy and Market Research, Justus-Liebig University
Giessen, Germany. 17p.
78 WTO and Pakistan‟s Agriculture: A Price Integration and
Welfare Analysis for Wheat
APPENDIX
Order of Integration of Price Series LWPW and LIPW (Pair 1) of
Wheat
Augmented Dickey –Fuller Unit Root Test on LWPW
ADF Test Statistic -1.414102 1% Critical Value* -2.6700
5% Critical Value -1.9566
10% Critical Value -1.6235
Augmented Dickey –Fuller Unit Root Test on D(LWPW)
ADF Test Statistic -2.363858 1% Critical Value* -2.6756
5% Critical Value -1.9574
10% Critical Value -1.6238
Augmented Dickey –Fuller Unit Root Test on LIPW
ADF Test Statistic -1.444808 1% Critical Value* -2.6968
5% Critical Value -1.9602
10% Critical Value -1.6251
Augmented Dickey –Fuller Unit Root Test on D(LIPW) ADF Test Statistic -4.931795 1% Critical Value* -2.7057
5% Critical Value -1.9614
10% Critical Value -1.6257
Augmented Dickey –Fuller Unit Root Test on e1(Residual Series)
ADF Test Statistic -3.658803 1% Critical Value* -3.8304
5% Critical Value -3.0294
10% Critical Value -2.6552

Journal of Economic Cooperation and Development 79
Causality between LWPW and LIPW
Pairwise Granger Causality Tests
Date: 02/08/01 Time: 00:39
Sample: 1980 2003
Lags: 1
Null Hypothesis: Obs F-Statistic Probability
LIPW does not Granger Cause LWPW 19 10.0562 0.00593
LWPW does not Granger Cause LIPW 2.08753 0.16781
Pairwise Granger Causality Tests
Date: 02/08/01 Time: 00:40
Sample: 1980 2003
Lags: 2
Null Hypothesis: Obs F-Statistic Probability
LIPW does not Granger Cause LWPW 18 9.76046 0.01145
LWPW does not Granger Cause LIPW 1.41015 0.27908
Pairwise Granger Causality Tests
Date: 02/08/01 Time: 00:40
Sample: 1980 2003
Lags: 3
Null Hypothesis: Obs F-Statistic Probability
LIPW does not Granger Cause LWPW 17 13.66418 0.00149
LWPW does not Granger Cause LIPW 2.32480 0.13663
80 WTO and Pakistan‟s Agriculture: A Price Integration and
Welfare Analysis for Wheat
Error Correction Model for Pair 1
Dependent Variable: D(LWPW)
Method: Least Squares
Date: 01/29/01 Time: 06:01
Sample(adjusted): 1981 2000
Included observations: 20 after adjusting endpoints
Variable Coefficient Std. Error t-Statistic Prob.
C 0.087844 0.012828 6.847827 0.0000
E1(-1) -0.119480 0.071956 -1.660463 0.1141
R-squared 0.132828 Mean dependent var 0.087844
Adjusted R-squared 0.084652 S.D. dependent var 0.059962
S.E. of regression 0.057368 Akaike info criterion -2.784007
Sum squared resid 0.059240 Schwarz criterion -2.684434
Log likelihood 29.84007 F-statistic 2.757137
Durbin-Watson stat 1.646551 Prob(F-statistic) 0.114141
Dependent Variable: D(LIPW)
Method: Least Squares
Date: 01/29/01 Time: 06:05
Sample(adjusted): 1981 1999
Included observations: 19 after adjusting endpoints
Variable Coefficient Std. Error t-Statistic Prob.
C 0.069367 0.035905 1.931966 0.0702
E1(-1) 0.631770 0.197632 3.196703 0.0053
R-squared 0.375434 Mean dependent var 0.066296
Adjusted R-squared 0.338695 S.D. dependent var 0.192386
S.E. of regression 0.156450 Akaike info criterion -0.772865
Sum squared resid 0.416100 Schwarz criterion -0.673450
Log likelihood 9.342215 F-statistic 10.21891
Durbin-Watson stat 1.932346 Prob(F-statistic) 0.005285
Dependent Variable: LWPW
Method: Least Squares
Date: 01/29/01 Time: 06:06
Sample(adjusted): 1980 1999
Included observations: 20 after adjusting endpoints
Variable Coefficient Std. Error t-Statistic Prob.
C -1.912143 0.848668 -2.253111 0.0370
LIPW 1.213710 0.102432 11.84896 0.0000
R-squared 0.886362 Mean dependent var 8.131355
Adjusted R-squared 0.880049 S.D. dependent var 0.542586
S.E. of regression 0.187919 Akaike info criterion -0.410971
Sum squared resid 0.635644 Schwarz criterion -0.311398
Log likelihood 6.109713 F-statistic 140.3978
Durbin-Watson stat 1.737124 Prob(F-statistic) 0.000000

Journal of Economic Cooperation and Development 81
Stability Condition under ECM
-0.119480 - 1.213710 (0.631770) = -0.8865 < 0
Therefore, cointegration between LWPW and LIPW is stable. Where,
LWPW= Natural log of wholesale price of Wheat at Lahore in Rs./ton
LIPW= Natural log of International price of Wheat (c.i.f Karachi) in Rs./ton
Order of Integration of Price Series LFPW and LWPW
(Pair 2) of Wheat
Augmented Dickey –Fuller Unit Root Test on LFPW ADF Test Statistic -1.140138 1% Critical Value* -2.6700
5% Critical Value -1.9566
10% Critical Value -1.6235
Augmented Dickey –Fuller Unit Root Test on D(LFPW) ADF Test Statistic -2.917878 1% Critical Value* -2.6756
5% Critical Value -1.9574
10% Critical Value -1.6238
Augmented Dickey –Fuller Unit Root Test on LWPW ADF Test Statistic -1.414102 1% Critical Value* -2.6700
5% Critical Value -1.9566
10% Critical Value -1.6235
Augmented Dickey –Fuller Unit Root Test on D(LWPW) ADF Test Statistic -2.363858 1% Critical Value* -2.6756
5% Critical Value -1.9574
10% Critical Value -1.6238
Augmented Dickey –Fuller Unit Root Test on e2(Residual Series)
ADF Test Statistic -4.495793 1% Critical Value* -2.6700
5% Critical Value -1.9566
10% Critical Value -1.6235

82 WTO and Pakistan‟s Agriculture: A Price Integration and
Welfare Analysis for Wheat
Causality Between LFPW and LWPW
Pairwise Granger Causality Tests
Date: 02/08/01 Time: 00:43
Sample: 1980 2003
Lags: 1
Null Hypothesis: Obs F-Statistic Probability
LWPW does not Granger Cause LFPW 23 23.0893 0.00011
LFPW does not Granger Cause LWPW 0.00370 0.95208
Pairwise Granger Causality Tests
Date: 02/08/01 Time: 00:44
Sample: 1980 2003
Lags: 2
Null Hypothesis: Obs F-Statistic Probability
LWPW does not Granger Cause LFPW 22 14.0763 0.00025
LFPW does not Granger Cause LWPW 0.06273 0.93941
Pairwise Granger Causality Tests
Date: 02/08/01 Time: 00:46
Sample: 1980 2003
Lags: 3
Null Hypothesis: Obs F-Statistic Probability
LWPW does not Granger Cause LFPW 21 8.42231 0.00191
LFPW does not Granger Cause LWPW 0.35790 0.78427
Journal of Economic Cooperation and Development 83
Error Correction Model for Pair 2 Dependent Variable: D(LFPW) Method: Least Squares Date: 01/29/01 Time: 06:16 Sample(adjusted): 1981 2003 Included observations: 23 after adjusting endpoints
Variable Coefficient Std. Error t-Statistic Prob.
C 0.080202 0.010634 7.542347 0.0000 E2 (-1) -0.990407 0.208544 -4.749156 0.0001
R-squared 0.517845 Mean dependent var 0.083599 Adjusted R-squared 0.494885 S.D. dependent var 0.071591 S.E. of regression 0.050881 Akaike info criterion -3.035712 Sum squared resid 0.054366 Schwarz criterion -2.936973 Log likelihood 36.91069 F-statistic 22.55448 Durbin-Watson stat 1.378506 Prob(F-statistic) 0.000109
Dependent Variable: D(LWPW) Method: Least Squares Date: 01/29/01 Time: 06:17 Sample(adjusted): 1981 2003 Included observations: 23 after adjusting endpoints
Variable Coefficient Std. Error t-Statistic Prob.
C 0.081777 0.012461 6.562373 0.0000 E2(-1) 0.017008 0.244394 0.069591 0.9452
R-squared 0.000231 Mean dependent var 0.081719 Adjusted R-squared -0.047378 S.D. dependent var 0.058264 S.E. of regression 0.059628 Akaike info criterion -2.718451 Sum squared resid 0.074665 Schwarz criterion -2.619712 Log likelihood 33.26218 F-statistic 0.004843 Durbin-Watson stat 1.667933 Prob(F-statistic) 0.945178
Dependent Variable: LFPW Method: Least Squares Date: 01/29/01 Time: 06:13 Sample: 1980 2003 Included observations: 24
Variable Coefficient Std. Error t-Statistic Prob.
C 0.030523 0.155590 0.196175 0.8463 LWPW 0.980265 0.018723 52.35496 0.0000
R-squared 0.992038 Mean dependent var 8.155340 Adjusted R-squared 0.991676 S.D. dependent var 0.600440 S.E. of regression 0.054782 Akaike info criterion -2.891245 Sum squared resid 0.066024 Schwarz criterion -2.793074 Log likelihood 36.69494 F-statistic 2741.041 Durbin-Watson stat 1.918585 Prob(F-statistic) 0.000000

84 WTO and Pakistan‟s Agriculture: A Price Integration and
Welfare Analysis for Wheat
Stability Condition under ECM
-0.99-(0.98)(0.17) = -1.01
As –1.01 < 0, therefore, there exists a strong long run relationship
between LFPW and LWPW.
Where,
LFPW= Natural log of Farm gate price of Wheat in Rs./ton
Wheat Estimated Model
Estimated Domestic Demand Equation For Wheat in Pakistan
(PCCW):
LPCCW = 10.223 - 0.131*LWPW + 0.007*LPCI
(17.82)***
(-10.45)***
(0.101)
R² =0.99 Edw = -0.131 D.W = 1.38
Where, LPCCW =Natural log of Per capita consumption of Wheat in kg
WCONS = Total consumption of Wheat (PCCW * POP) in thousands
tonnes
POP = Population
LWPB = Natural log of wholesale price of Rice at Lahore in Rs./ton
Edb =Elasticity of demand of Wheat w.r.t. Wholesale price of Wheat
LPCI = Natural log of Per capita income
For all estimated equations, t-values given in parenthesis, with ***, **, *
indicate
significance at 1 percent, 5 percent and 10 percent probability level respectively.
Journal of Economic Cooperation and Development 85
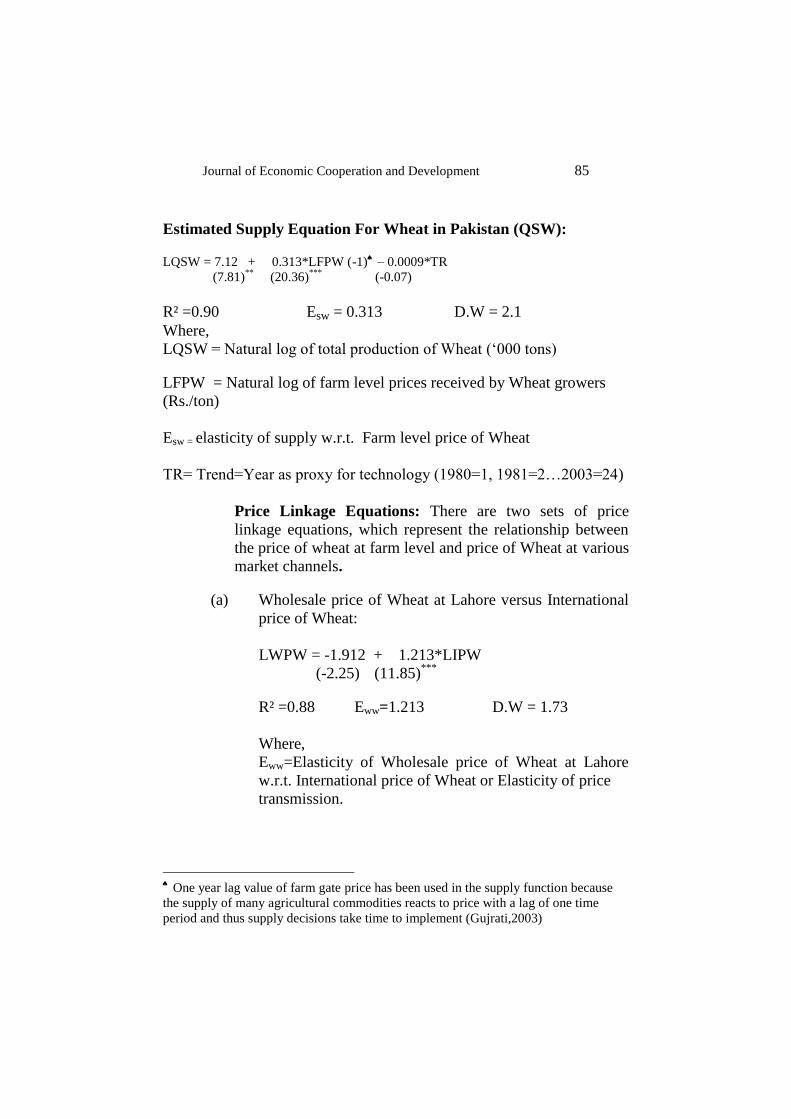
Estimated Supply Equation For Wheat in Pakistan (QSW):
LQSW = 7.12 + 0.313*LFPW (-1) – 0.0009*TR
(7.81)**
(20.36)***
(-0.07)
R² =0.90 Esw = 0.313 D.W = 2.1
Where,
LQSW = Natural log of total production of Wheat („000 tons)
LFPW = Natural log of farm level prices received by Wheat growers
(Rs./ton)
Esw = elasticity of supply w.r.t. Farm level price of Wheat
TR= Trend=Year as proxy for technology (1980=1, 1981=2…2003=24)
Price Linkage Equations: There are two sets of price
linkage equations, which represent the relationship between
the price of wheat at farm level and price of Wheat at various
market channels.
(a) Wholesale price of Wheat at Lahore versus International
price of Wheat:
LWPW = -1.912 + 1.213*LIPW
(-2.25) (11.85)***
R² =0.88 Eww=1.213 D.W = 1.73
Where,
Eww=Elasticity of Wholesale price of Wheat at Lahore
w.r.t. International price of Wheat or Elasticity of price
transmission.
One year lag value of farm gate price has been used in the supply function because
the supply of many agricultural commodities reacts to price with a lag of one time
period and thus supply decisions take time to implement (Gujrati,2003)

86 WTO and Pakistan‟s Agriculture: A Price Integration and
Welfare Analysis for Wheat
(b) Price of Wheat received by farmers versus wholesale
price of Wheat at Lahore:
LFPW = 0.030 + 0.980*LWPW
(0.19) (52.35)***
R2 =0.99 Efw=0.98 D.W =1.91
Where,
Efw=Elasticity of. farm gate price of Wheat w.r.t Wholesale price of
Wheat at Lahore or Elasticity of price transmission.


![Presentation Wto Agriculture[1]](https://img.dokumen.tips/doc/110x75/555734ebd8b42a320c8b50c5/presentation-wto-agriculture1.jpg)