Embed Size (px)
Citation preview

WTO
Agricultural Issues
for Africa
Ron Sandrey Moses Lubinga William Mwanza Elizabeth Nderitu Miriam W O Omolo Yolanda Potelwa and Willemien Viljoen
Published by the Trade Law Centre (tralac)
PO Box 224
Stellenbosch
South Africa 7599
First published 2017
Language editing by Alta Schoeman
Cover design by Natalia Le Roux
Back cover text by Trudi Hartzenberg
ISBN 9780994686114
Printed by RSA Litho
copy 2017 Trade Law Centre and National Agricultural Marketing Council
All rights reserved No reproduction copy or transmission of this publication
may be made without written permission No paragraph of the publication
may be reproduced copied or transmitted save with written permission Any
person who does any unauthorised act in relation to this publication may be
liable to criminal prosecution and civil claims for damages
Publication of this book was made possible by the support of the Trade Law
Centre (tralac) and the National Agricultural Marketing Council The views
expressed by the authors are not necessarily the view of any of these
institutions
i
Contents
About the authors
iii
Preface
v
Introduction
1
Chapter 1
The profile of South African imports of agricultural forestry and
fisheries products
Yolanda Potelwa Moses Lubinga Ron Sandrey and William Mwanza 12
Chapter 2
African Agriculture and the WTO ndash the big picture
Ron Sandrey 32
Chapter 3
Analytics of the WTO Agricultural Agreement for Africa
Ron Sandrey 54
Chapter 4
How the Agreement on Agricultural might improve the South African
Agricultural Forestry and Fisheries Trade performance
Moses Lubinga Yolanda Potelwa Ron Sandrey and William Mwanza 69
Chapter 5
The Agriculture Negotiations at the World Trade Organisation
An update after the Nairobi Ministerial Conference
Miriam W O Omolo 90
ii
Chapter 6
Resolving non-tariff barrier disputes multilateral versus regional
mechanisms
William Mwanza Elizabeth Nderitu Yolanda Potelwa Ron Sandrey
and Willemien Viljoen 112
Chapter 7
Where do the Singapore and related issues fit into the WTO
Ron Sandrey 143
iii
About the authors
Ron Sandrey ndash Sandrey Ron is a tralac Associate Professor Extraordinaire
Department of Agricultural Economics University of Stellenbosch and an
Adjunct Associate Professor at the Agribusiness amp Economics Research Unit
Lincoln University New Zealand He came to South Africa in 2005 following
a career as an economist with New Zealands Ministry of Foreign Affairs and
Trade and Ministry of Agriculture and Fisheries and has since worked
extensively on trade-related issues in southern Africa He holds a PhD in
Economics from Oregon State University and currently resides in Christchurch
New Zealand
Miriam W O Omolo ndash Omolo Miriam PhD is the Director of Programmes
at the African Policy Research Institute (APRI) She manages research and
communication in the following areas trade and investment governance and
public finance natural resource and climate change and social sector She has
over 12 years of experience in international trade and development and
poverty issues having working at the Institute of Economic Affairs and the
African Economic Research Consortium both in Kenya She holds a doctorate
degree in economics from University of South Africa where she examined the
impact of trade policy reforms on household welfare in Kenya Using a
computable general equilibrium model Her main areas of research interest are
trade and development poverty and welfare and the emerging extractive sector
Miriam is also a network member of the African Economic Research
Consortium and African Growth Policy Modelling Network hosted by the
International Food Policy Research Institute
Moses Lubinga ndash Lubinga Moses is a Senior Economist for Trade Research at
the National Agricultural Marketing Council SA (NAMC) His research
supported by his passion for understanding how trade stimulates economic
development focuses on how policy decisions affect the day-to-day life style
of farmers traders and agro-processors among other actors Academically he
holds a PhD in Agricultural Economics from the University of the Free State
South Africa a MSc in Agricultural amp Applied Economics from Makerere
iv
University Uganda and a BSc in Agriculture ndash Economics from Makerere
University
Elizabeth Murungi Nderitu ndash Nderitu Elizabeth is currently the Acting
Director (Non-Tariff Barriers to Trade (NTBs) and Standards) of TradeMark
East Africa based in Nairobi Kenya She has experience in investment analy-
sis agricultural market systems development and trade facilitation Prior to
TradeMark East Africa Elizabeth worked in Kampala Uganda with Techno-
Serve a not-for-profit organization that facilitates poverty eradication through
business-driven solutions She also worked as a Research Associate with the
CARANA Corporation and as a Strategy Analyst with the US-Africa Develop-
ment Foundation in Washington DC USA Elizabeth holds a Master of
Business Administration degree in International Business from the American
University in Washington DC USA and Bachelor of Science degree in Agri-
cultural Education and Extension from Egerton University in Njoro Kenya
William Mwanza ndash Mwanza Williamis a Trade and Competitiveness Consul-
tant at the World Bank Group He holds a Bachelor of Social Science Degree in
Economics from the University of Malawi Postgraduate Diploma in Manage-
ment Practice (Trade Law and Policy) offered by tralac and the University of
Cape Town Masters in Development Policy Practice and Process from the
University of Reading and an LLM in International Economic Law from the
University of Edinburgh
William worked as Researcher at tralac from 2013 to 2016 His main research
interests are in the political economy and law of international trade and invest-
ment industrial policy community law and regional integration in Africa
Yolanda Potelwa ndash Potelwa Xolisiwe Yolanda is an Economist at the
National Agricultural Marketing Council SA(NAMC) Her work includes trade
research under the MERC Division Currently she is working on issues
relating to non-tariff measures (NTMs) more particularly Sanitary and Phyto-
sanitary (SPS) issues in the fruit industry
Willemien Viljoen ndash Viljoen Willemien holds a Masterrsquos degree in Eco-
nomics and a Bachelor of Laws degree (LLB) from the University of Stellen-
bosch Her research interests are in regional integration and international trade
policy and specifically in issues pertaining to non-tariff barriers to trade trade
data analysis and modelling and trade and climate change
v
Preface
Let me start with the relationship between the NAMC and tralac which has
resulted in many scientific outputs In the book titled Africarsquos trade
relations ndash Old friends good friends and new friends published in 2015 I
outlined the awards won by products of the relationship This book marks
another milestone in the longstanding relationship between the two
organisations that has also seen many capacity building initiatives called
Geek Weeks that provide an opportunity for young professionals to work
with established scholars such as Professor Ron Sandrey to mention one
The book examines the complex multilateral trade negotiations
specifically as regards the inclusion of agriculture as part of the multilateral
talks The agriculture trade talks started in 2000 in terms of the original
mandate of the Agreement on Agriculture and then became part of the
Doha Round of negotiations in 2001 Many scholars argue that following
the completion of the Uruguay Round (UR) the sensitive issues
surrounding agriculture are the main reasons why the Doha Round of trade
negotiations is proving so difficult to conclude It seems to me that these
scholars are right Trade Ministers at the 2013 Bali Ministerial Conference
adopted important decisions on agriculture and at the most recent
Ministerial Conference in December 2015 in Nairobi members of the
WTO agreed to eliminate agricultural export subsidies This marks an
extremely important step in the reform of international trade rules on
agriculture since the establishment of the WTO This book focuses on these
developments as well as the increasingly important role of non-tariff
barriers that impact international of agricultural products In addition an
examination of dispute resolution provisions in the WTO and in regional
trade agreements is also presented The analysis emphasises that a rules
based system of international trade requires a well-established dispute
settlement mechanism and the enforcement of rules
vi
Thank you to tralac and the NAMC team for compiling such an exciting
book that covers a broad range of issues including the current and relevant
issue of non-tariff barriers
Tshililo Ronald Ramabulana
Chief Executive Officer
National Agricultural Marketing Council
1
Introduction
There are generally considered to be four legs to the global trading seat of trade
liberalisation These are the unilateral leg or what one does on onersquos own the
bilateral leg or what one does between one other partner the regional leg
representing what one does with more than one partner and the multilateral leg
or what one does with all of onersquos trading partners collectively Over the last
few years the third leg that of regionalism in the form of free and partial trade
agreements has become more in vogue on the international trade policy scene
and in particular the two so-called Mega agreements of the Trans-Pacific
Partnership Agreement (TPPA) and the proposed Transatlantic Trade and
Investment Partnership (TTIP) between the European Union and the United
States On the African scene politicians have conveniently skipped over the
Tripartite Free Trade Arrangement (T-FTA) that has not advanced much past
the talking phase and are concentrating on promoting continental integration
through the Continental Free Trade Agreement (CFTA)
Meanwhile the WTO remains the largest trading bloc despite being in a state
of what many regard as moribund and having done little since its inauguration
as a part of the old General Agreement on Trade and Tariffs (GATT) to further
its mandate of facilitating a free global trading system Undoubtedly the GATT
had made significant progress in liberalising merchandise trade with tariff
rates on manufactured goods now often at very low levels There was much
hope for agriculture reform at the inauguration of the WTO following the
Uruguay Round (UR) as for the first time agriculture had been an important
and significant part of the outcome of a GATT Round Domestic subsidies for
agriculture were at least forced into a restrained set of rules that must take
credit for being a major factor curtailing their worst excesses Tariffs have been
reduced although there are significant exceptions to this statement and in
particular in the importation of sensitive products to developed country
markets
The WTO covers trade in goods services and intellectual property dispute
settlements and a periodic review of the trade policy of members Within goods
2
there are the two basic divisions of agriculture and non-agriculture and this
paper is primarily concerned with the WTO role in agriculture In turn the
agricultural interests of the WTO concern the three basic areas of
i Substantially reducing tariff and non-tariff measures that would ensure
market access of agricultural products
ii Reduction and ultimately phasing out all artificial forms of export
competition
iii Substantial reduction in domestic support that would ensure non-trade
distortion
Proposals based around moving forward in these three broad areas have been
on the table since 2004 with little progress except in the export competition
area Outside of these broad categories perhaps the main one that is of direct
interest to African agriculture is the dispute mechanism and here the focus is
largely upon the cotton case In understanding the WTO one must appreciate
that not all members are equal The organisation comprises a self-selection
made of both developed and developing countries (which includes a sub-
category of least developing countries) with all the African countries in the
developing category In general these developing countries are not required to
meet as strict a compliance target as the developed countries and indeed for
those in the least developing category the targets are currently such that in most
cases little adjustments would be needed in their policies to meet an agreement
of the DDA
Against this background the object of the current book is to examine the
current proposals associated with the DDA and assess what a successful
agreement might mean for African agriculture We concentrate upon the three
keys themes that are core to agriculture in the WTO those of domestic
supports market access and export incentives We fully recognise that the
WTO and the DDA is about more than just these core themes and introduce
many of these activities in different chapters to assess the WTOrsquos relevance of
these to African agriculture
A little more on the WTO and the DDA
Chapter 1 provides a comprehensive background to the WTO and elaborates on
the general points made above An important aspect of the DDA is that it
operates as a single undertaking meaning that nothing is agreed until
3
everything is agreed Thus failure to agree in one aspect of the negotiations
can stall the whole process
The market access negotiations focus on the six aspects of tariffs tariff quotas
administration special safeguards state trading enterprises and the sixth being
other issues Tariff reductions are the main issue here and this operates on a
formula basis that juggles between deeper cuts for developed member rates
generally higher cuts for higher starting rates (and importantly these are bound
and not applied rates) and maximum and minimum rates within the different
tariff bands to average out within the band Domestic supports operate in a
regime of green (permitted) special and differential (amber) and an additional
blue box Most attention focusses on the amber box where the reductions are
proposed although the interplay between boxes is somewhat complex at times
Export competition is becoming less of an issue as there was significant
progress at the Nairobi Ministerial in achieving a reduction in export subsidies
Unfortunately little or no progress was made at Nairobi on market access or
domestic supports although some progress was made on issues such as food
stockpiling food aid and the cotton dispute
Estimates of the value of DDA outcomes
In recent years the global trade modellers of the world or perhaps more
accurately their patrons have largely moved on from assessing the gains from
an outcome from the WTOrsquos DDA Perhaps it is because as the DDA stalled it
lost some of its lsquosexinessrsquo appeal or perhaps it was because as trade models
become more sophisticated their assessments and the limitations of the DDA
for agriculture became more apparent the magnitude of the gains declined The
salient feature of this modelling research is that the gains for Africa are modest
with some countries actually losing welfare through results such as preference
erosion in developed markets This chapter undertakes a review of the literature
that is relevant to quantitative analysis of the impacts of the DDA with special
reference to Africa and South Africa While some of this review may be a little
dated that is of no real concern in that the general principles of the stalled
DDA have barely changed although what has changed in recent years is that
the computer model analysis has become more sophisticated This is especially
so for the Global Trade Analysis Project (GTAP) the model of choice for most
practitioners as more countries have been added to its data base and the trade
and economic data is continually moving forward
4
Assessment results reflect changes from a combination of better models that
have more recent information such as the final UR tariffs the full implications
of Chinarsquos accession to the WTO incorporated an ability to model tariff
revenue losses and the impacts of trade creationdiversion effects the
consequences of the erosion of tariff preferences and a scaling down of the
DDA ambitions that are now being modelled as more realistic assumptions of
any outcome Virtually all of the recent modelling work is pointing to reduced
gains from the DDA and even in some cases for developing countries to
losses These modest results are accentuated by the problems facing Africa in
its major infrastructural and capacity constraints that will severely limit the
abilities of most African countries to take advantage of any new opportunities
We also find that reforms to the highly protected sugar regimes in developed
countries and the consequential market outcomes are not necessarily good
news for all African producers For example simulating changes to the EU
sugar regime and introducing a situation where inter-African tariffs are
eliminated confirm that these reforms are dominated by changes in the African
sugar production and trade profiles The big gainers are South Africa from
enhanced sugar exports to mainly Kenya and Kenya itself as resources are
diverted away from its inefficient sugar sector
Another WTO programme that has generated interest is the issue of trade
facilitation We examine tralac research relating to simulations of time in
transit to proxy infrastructural deficits in Africa such as delays at border
crossings roadblocks for trucks and the necessity to pay bribes The welfare
gains to Africa were substantial The striking feature is that almost all of the
gains to each country overwhelmingly accrue to that same country and that (a)
these gains are substantial (b) they mostly accrue to the liberaliser and (c) in
only taking 20 of the costs of time over and above an international
benchmark we are leaving plenty of room for improvement in most African
countries Similarly while not strictly speaking a WTO issue tralac used this
GTAP computer database and the full suite of African agricultural sectors and
African countriesregions in order to assess the benefits of intra-African tariff
abolition in agricultural trade across the continent This research suggests that
Africa has as much to gain from its own continental liberalisation of
agricultural trade as it does from relying on the WTO
5
The global agricultural profile as it relates to African agriculture
This chapter examines the two main remaining agricultural issues of market
access and global domestic supports to assess where gains to Africa may come
from The primary focus is on the gains for African agriculture and overall
African welfare It starts by providing a profile of African agricultural exports
by the main sources and products and examines this trade in detail to assess the
tariff duties faced in their markets to glean some information as to where the
WTO may be able to assist exports This examination suggests that given the
African export profile and current access conditions more progress in access
gains may result from better access into both the EU and fellow African
countries and we argue that in the former the EPAs and the Trade
Development and Cooperation Agreement (TDCA) are the best negotiating
forums for European destinations and the suite of African integration
negotiations in progress offer the best opportunities for intra-African access
liberalisation In general tariffs facing agricultural exports from least
developed countries into developed countries are declining to a very low level
although there are still lsquosome nuts to crackrsquo (sugar in particular)
An assessment on the profile on global agricultural subsidies shows that in
many but not all cases domestic agricultural subsidies are declining and that
the declining role of export subsidies along with recent progress on an
agreement here means that these export subsidies are a minor issue Overall
OECD agricultural protection is declining dramatically driven by the weight of
the US and EU declines In the category of highly supported regime there are
the well-known lsquoculpritsrsquo of Switzerland Norway Japan and Korea along with
the two surprises of Indonesia and China where protection is climbing rapidly
In general subsidies globally are concentrated upon the so-called rice pudding
of rice milk and sugar Only sugar is of export interest to Africa South Africa
and Swaziland in particular for exports and Kenya for imports Both cotton and
oilseeds are also important and cotton carries much symbolic significance for
Africa
The overall assessment is that there seems to be few of the major African
agricultural exports where the WTO could provide some benefits and
especially against the background of low agricultural tariffs into developed
countries from LDCs More specifically cotton seems to be more of a flash-
point than an actual source of benefits and there is an outside possibility that
perhaps some relief from the high (20) tariffs into China may result from an
6
agreement at the WTO Sugar trade exists in a complex regime but solutions
through this maze for African producers are best pursued within Africa itself
by negotiations in the African trade agreements currently in play and between
South Africa and the EU under the TDCA Several of the main products ndash
cocoa coffee and tea live animals ndash exist in an almost duty free environment
for African exporters Of the others for fruit and vegetable exports non-tariff
barriers are probably the main worry as South Africa the main fruit exporter
faces tariff complexities in the EU and high tariff barriers into China and India
Although tobacco exports from the main suppliers have duty free access into
EU and South African markets tobacco exports from Zimbabwe to China face
a high 2375 tariff The semi-related products of oil seeds and animal and
vegetable fats are largely destined for the EU and Africa and here if the
imports are not already duty free then bilateral or regional negotiations must
offer the best possibilities for improved access conditions
South African agricultural forestry and fisheries exports ndash a profile
In the next two chapters we examine the profile of South Africarsquos exports and
imports respectively and here we extend the analysis to include both forestry
and fisheries products This is because both are under the auspices of the South
African Department of Agriculture Forestry and Fisheries (DAFF) We
analyse market access conditions only as the previous chapter shows that it is
through market access that the major overall gains may come from the WTO
for agriculture while for fisheries the WTO does not investigate subsidy
supports to member countries
For the agricultural sector we find that a significant portion of exports from
South Africa is destined either for the EU or for fellow African destinations
We consider that for the former any gains for market access are likely to come
from direct negotiations under the umbrella of the TDCA rather than
multilateral agreements Furthermore a multilateral agreement improving EU
market access conditions is likely reduce South African preferential access
conditions and therefore be of little or no value to South Africa Africa itself is
becoming an increasingly important destination for South African agriculture
we similarly consider that access conditions on the continent are much more
likely to improve with direct negotiations through the SDAC FTA the Trindash
Partite FTA or the Continental FTA Importantly as most African WTO
members are least developed countries they are very unlikely to have to make
market access conditions under any foreseeable WTO outcome and moreover
7
any access concessions that they do make to all competing external sources are
once again likely to reduce possible preferences for South Africa
We confirm this general picture by analysis of the top-10 agricultural exports at
the HS 4 level into the top-10 export destinations We find that fellow SACU
destinations of Botswana Lesotho Namibia and Swaziland all of whom are in
the top-10 destinations are all duty free under the SACU agreement and
Zambia only applies duties on exports of South African citrus fruits and even
here the rate is under 1 Both Mozambique and Zimbabwe have a mixture of
zero low and modest rates This leaves the three top-10 destinations of the EU
China and the US The same general pattern of a mixture of zero low and
modest rates also applies to US applied tariffs for South Africa with cane
sugar and related products being the sectors where access conditions could
improve We have observed that the TDCA governs access conditions for
South Africarsquos premiere market of the EU and note that despite this bilateral
agreement most of the exports to the EU have duties assessed In particular the
sugar tariff is 3773 This leaves China as the outlier where tariff rates are all
double figures Our analysis of course ignores possible markets where lsquotrade
chillingrsquo inhibits or prohibits exports from South Africa although as a
generalisation we consider that these cases may be limited to sugar and
associated products
For the forestry exports the situation is less complex Again examining the
major markets by the major commodities we find that the exports to the EU
Japan Namibia Botswana and Mozambique are all duty-free The same
conditions apply to exports into both Indonesia and Thailand where virtually
the only products of wood pulp are also duty-free This leaves the major market
for 2015 of China India and Zimbabwe For China exports of wood pulp the
dominant export and the next most important wood chips are all duty-free
leaving only modest exports of paper and paperboard facing tariffs of 412
For India exports duties are 50 except for some negligible trade at 10
Zimbabwe imports a wider range of forestry products and here the tariffs are
generally either at or near duty-free or at or near 10 Overall there are very
few exports facing duties in the major markets other than India or Zimbabwe
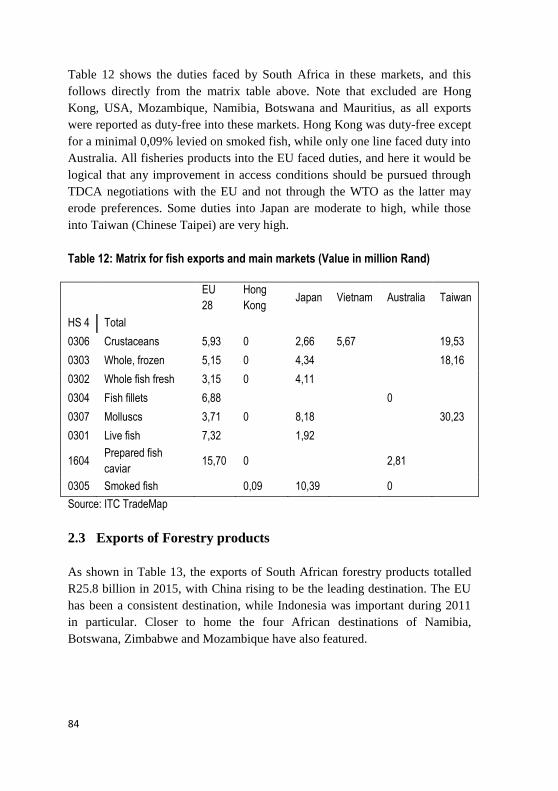
Five of the 11 major markets for South African seafood exports are duty-free
namely Hong Kong USA Namibia Botswana and Mauritius Mozambique
imposes a 20 duty on crustaceans but otherwise is duty-free Despite the
TDCA the EU again the major market levies duties ranging from 315 to
8
1570 and again the appropriate negotiating process is through the TDCA
This leaves the minor markets of Japan Vietnam Australia and Taiwan
(Chinese Taipei) Japan imposes tariffs ranging from 192 to 1039
Vietnam has duties of 761 and 567 on its two import lines Australia has
only one dutiable import line at 281 and Taiwan has duties ranging up to
1953 Thus the major access concerns are the EU Mozambiquersquos
crustaceans and to a lesser extent Japan Lesser but still important access issues
remain with Vietnam and Taiwan
Overall we see few cases where the WTO negotiations may improve South
Africarsquos access conditions into the major markets for these exports In all cases
the EU is the top destination and except for forestry products access con-
ditions are generally constrained Africa is becoming increasingly important
and here the access conditions are more likely to improve through direct intra-
African agreements in the different negotiations that are in progress In
particular Zimbabwe remains problematical
South African agricultural forestry and fisheries imports ndash a profile
The objective of this second South African paper is to evaluate the profile for
South African agricultural forestry and fisheries imports in recent years We
generally use trade data over the period from 2010 to 2015 inclusive as it is
only over this period that reliable and easily accessible trade data is available
The key findings from this research are that imports of both agricultural and
forestry products have been steadily climbing while imports of fishery products
have been more volatile but are in general also increasing
The main agricultural imports have been wheat rice and poultry meats with a
significant share of both wheat and poultry imports sourced from the EU and
the rice from mainly Thailand and India Next are spirits from mainly the EU
cane sugar from Swaziland and Brazil and palm oils from Indonesia while
South African climatic conditions have forced an increased quantity of maize
to be imported from South America The duties on poultry meats wheat and
sugar have all increased in recent years as South Africa strives to protect
domestic producers although diluting these efforts are the significant imports
from the preferential sources of the EU and SACUSADC countries Imports of
both rice and maize are duty-free from all sources
9
For 2015 paper was the main forestry product imported followed by printed
products such as books brochures and similar products and then sawn timber
The EU is again the main supplier (where all imports are duty free) followed
by China the USA and Swaziland South African non-preferential tariffs are
modest with the highest rates being 1015 levied on packing containers
607 on uncoated paper and 579 on printed material not elsewhere
specified Five of the top ten products enter duty-free from all sources while
paper with cellulose face a low nuisance tariff of 092
Namibia was ranked as number one supplier of fishery products to South
Africa followed by Thailand India and China with the EU only ranked in
eighth position The highest tariff rate assessed on fishery products is a 25
rate levied on non-preferential imports of extracts and juices of fish while
three lines are duty-free or below 1 All non-EU preferential imports are
tariff free (and that includes Norway) Significantly EU imports into South
Africa from the EU are subject to tariff rates that in most cases do not give the
EU any tariff preferences
How may the Agreement on Agricultural improve the Agricultural
Forestry and Fisheries Trade performance of the BLNS1 countries
through better market access
This chapter is a companion paper to a similar analysis of South African
exports of agricultural forestry and fisheries products and here we similarly
include the three sectors for consistency although we eschew an analysis of the
BLNS imports in these products The major BLNS exports are sugar and sugar-
related and beef and other meats The sugar is from Swaziland while the beef
products are from both Botswana and Namibia In all cases South Africa and
the EU are the dominant export destinations followed generally by neigh-
bouring or near-neighbouring African countries Again in all cases entry into
South Africa and the EU is duty free and entry into several African countries is
also largely duty free Thus access conditions requiring further negotiations
are mostly limited to fellow African countries and here we consider that
African trade agreement negotiations already on the table are the appropriate
forums and not the WTO This leaves very few instances where the WTO may
be of benefit to BLNS agricultural exports
1 Where BLNS represents Botswana Lesotho Namibia and Swaziland
10
With respect to the individual BLNS countries Botswana exports mainly beef
and related products Lesotho wool and wheat milling related products
Namibia again beef related products along with grapes and beer and
Swaziland almost exclusively sugar and sugar-related products The duty-free
markets of South Africa and the EU dominate the destination profiles except
for Lesotho where South Africa is effectively the only market for agricultural
products
The situation regarding market access for forestry products is even more clear-
cut as exports to the dominant destination of South Africa and the third market
of the EU are duty-free and exports to second placed Zambia are largely duty-
free This basically only leaves some African destinations among the majors
with possible duties that would again be best addressed through African
negotiations
Fishery exports to the main destinations of South Africa and the EU are again
duty free as are minor exports to Hong Kong the US and Australia Again a
significant percentage of the other destinations are African countries where any
remaining tariffs associated with these exports would be best negotiated under
one of the several African agreements Thus except for relatively minor exports
to China and Japan which attract similarly relatively minor tariffs the
complete access position can be summed up as being either (a) duty free or (b)
where this is not the case then it is a matter of negotiations in African agree-
ments or the very minor duties into Japan and China It is therefore difficult
based on this evidence to see the WTO negotiations doing much for BLNS
(mostly Namibian) fisheries exports
Overall there appears to be very limited export markets where the BLNS
exporters of agricultural forestry and fisheries products can expect the WTO to
provide access gains
How do other related issues fit into the WTO
This book to date has focussed on the traditional core values of the WTO and
their relationships to African agriculture This chapter expands upon these core
WTO issues and looks at some of the new and emerging trade issues and sees
where the WTO fits into this landscape and how they may impact on Africa
Much of the attention is devoted to looking at the so-called Singapore issues of
trade and investment competition policy transparency in government procure-
11
ment and trade facilitation Here we find that while the WTO now has a
minimal interest in the first three of these important issues it has a strong
presence in trade facilitation Consequently we examine trade facilitation in
more detail and see that improvement here is certainly needed in Africa but
caution that there are a lot of commentators questioning whether the reality of
the programme will match the rhetoric that has been associated with it
Other trade related issues examined are rules of origin trade and environment
trade and labour food security tariff quota issues and the WTO disputes
settlement mechanism Again while the WTO is involved to varying degrees in
these issues there are few cases where direct gains to African agriculture can be
foreseen in the near future
One aspect of agricultural trade that is attracting attention is the issue of value-
added in the process chain and constraints to fully benefiting from being able to
move up this chain We have not examined the role that the WTO may be able
to play here directly so we shall introduce some points at this stage The first
factor that is important is the issue of tariff escalation and how increased tariffs
may constrain further processing In analysis of tariffs facing African agri-
cultural exports in this book we concluded that tariff escalation is not really a
problem for most of the African agricultural exports as exports to the EU and
US in particular are generally quota and duty free Where problems exist in
Africa this is more a matter for regional negotiations rather than multilateral
negotiations Other factors inhibiting value-added are the various NTBs and
again this is covered in the book These NTBs can be very broad and in
Africarsquos case the inefficient processing and transport structures are definite
barriers but these are addressed by unilateral or possibly bilateral actions
rather than through the WTO An example of this is the costs to Africa of time
in transit as reducing these are crucial for value-added In general we consider
that the WTO offers little for enhancing African value-added opportunities
unless of course the WTO trade facilitation benefits are fully realised
12
Chapter 1
The profile of South African imports of
agricultural forestry and fisheries products
Yolanda Potelwa Moses Lubinga Ron Sandrey
and William Mwanza2
1 Introduction
The objective of this paper is to evaluate the profile for South African
agricultural forestry and fisheries (AFF) imports in recent years We expand
the traditional agricultural sector as the Department of Agriculture Forestry
and Fisheries (DAFF) in South Africa administer all these three sectors We
generally use trade data over the period from 2010 to 2015 inclusive as it is
only over this period that reliable and easily accessible trade data is available
The key findings from this research are that imports of both agricultural and
forestry products have been steadily climbing while imports of fishery products
have been more volatile but are in general also increasing
The main agricultural imports have been wheat rice and poultry meats with a
significant share of both wheat and poultry imports sourced from the EU and
rice from mainly Thailand and India Next are spirits from mainly the EU cane
sugar from Swaziland and Brazil and palm oils from Indonesia while South
African climatic conditions have forced an increased quantity of maize from
South America The duties on poultry meats wheat and sugar have all
2 Economist National Agricultural Marketing Council (NAMC) Senior Economist NAMC
tralac Associate and tralac Researcher respectively This paper is an output from the lsquoGeek
Weekrsquo data training workshop held at tralac during the week of Monday 11 April to Friday 15 April 2016
13
increased in recent years as South Africa strives to protect domestic producers
although diluting these efforts are the significant imports from the preferential
sources of the EU and SACUSADC countries Imports of both rice and maize
are duty-free from all sources
For 2015 paper was the main forestry product imported followed by printed
products such as books brochures and similar products and then sawn timber
The EU is again the main supplier followed by China the USA and Swazi-
land Tariffs here are modest with the highest rates being 1015 levied on
packing containers 607 on uncoated paper and 579 on printed material
not elsewhere specified All imports from preferential partners are duty free as
are several lines for all sources
2 South Africarsquos agricultural import profile
Figure 1 shows the AFF trade performance between 1996 and 2014 and since
the implementation of AoA South Africarsquos AFF trade has improved an average
of 12 between 1996 and 2014 In most years exports have been marginally
above imports leading to a positive trade balance as shown
Figure 1 South African AFF trade performance
Source World Trade Atlas
14
21 Agriculture Forestry and Fishery Import profile into South
Africa
Imports of Agricultural products
This section focuses on agricultural imports into South Africa from the world
between 2010 and 2015 with agricultural products as defined by the WTO In
2015 South Africa imported a total of R92 billion with EU-28 as the leading
supplier with imports worth R28 billion Swaziland was in second place with
R72 billion followed by Argentina China and Thailand
Table 1 Main suppliers of agricultural products in South Africa
Source TradeMap
Table 2 expresses this same data as percentage shares of South Africarsquos main
suppliers of agricultural imports between 2010 and 2014 The EUrsquos imports
have been somewhat stable during the period with a low of 268 in 2012 and
a high of 325 in 2014 before declining again to 305 in 2015 Swazilandrsquos
share increased significant between 2010 and 2015 (by 21 percentage points)
and this was largely an increase of sugar imports Shares from both Argentina
and China showed fluctuations against a general decline while those from
Thailand Brazil USA and Namibia also declined over the period In the lower
Values in millions Rand
Sources 2010 2011 2012 2013 2014 2015
World 48 035 59 621 72 498 79 979 84 273 92 379
EU-28 12 895 16 164 19 412 22 749 27 428 28 171
Swaziland 2 797 3 138 4 778 5 987 6 499 7 330
Argentina 4391 5 587 6 828 5 590 4 163 5 907
China 2 757 3 028 5 512 5 697 4 518 5 017
Thailand 3 428 3 540 4 077 4 457 4 204 4 908
Brazil 3 033 3 805 4 489 4 960 3 500 4 691
India 1 427 1 969 2 700 3 711 3 667 4 127
USA 2 497 3 684 2 997 3 710 3 934 3 852
Namibia 2 818 3 386 3 365 3 597 2 949 3 568
Indonesia 1 411 1 809 2 241 2 682 3 931 3 029
15
segment of Table 2 the respective shares for India and Indonesia both slowly
increased
Table 2 Main suppliers of agricultural products in South Africa ( share values)
2010 2011 2012 2013 2014 2015
EU-28 268 271 268 284 325 305
Swaziland 58 53 66 75 77 79
Argentina 91 94 94 70 49 64
China 57 51 76 71 54 54
Thailand 71 59 56 56 50 53
Brazil 63 64 62 62 42 51
India 30 33 37 46 44 45
USA 52 62 41 46 47 42
Namibia 59 57 46 45 35 39
Indonesia 29 30 31 34 47 33
Source TradeMap
Tables 3 and 4 show main agricultural products imported by South Africa
between 2010 and 2014 with this data expressed in R million in Table 3 and
the associated percentage shares in Table 4 Wheat and Rice were the largest
single import lines and are both essentially staple foods Poultry was the third
largest single product (R45 billion in 2015) followed by spirits and cane sugar
Note the large increase in maize imports as drought conditions reduced
domestic production and forced South Africa to import significant quantities of
maize
16
Table 3 Main imported agricultural products into South Africa R million
Values in Million Rand
HS
code Product description 2010 2011 2012 2013 2014 2015
AGRIC PRODUCTS 48035 59621 72498 79979 84273 92379
1001 Wheat and muslin 2026 4230 3941 4005 5376 5942
1006 Rice 3023 3651 5613 6412 4558 5436
0207 Poultry 1750 2706 3510 3876 4055 4574
2208 Spirits 2276 2603 2840 3733 3741 3692
1701 Cane Sugar 1666 1983 2507 3546 2935 3414
1511 Palm oil amp its fraction 2176 2930 3292 2960 3788 3118
2304 Soya-bean oil-cake 2471 2578 2798 3155 2755 2370
2106 Food preparations
nes 1002 1194 1401 1845 2054 2212
1005 Maize (corn) 91 285 731 114 399 1856
2309 Animal feed nes 671 910 1109 1161 1440 1698
Source TradeMap
Again Table 4 presents the same data expressed as percentage shares and
shows that agricultural imports as a share of total imports is generally stable
though fluctuating somewhat Demand for poultry meats has been steadily
increasing and between 2010 and 2015 these imports increased by 16
percentage points in terms of share
17
Table 4 Main imported agricultural products into South Africa (share values)
HS code Product description 2010 2011 2012 2013 2014 2015
Agriculture share in total imports 70 72 75 69 66 74
1001 Wheat and muslin 48 8 62 58 75 75
1006 Rice 72 69 88 93 64 69
0207 Poultry 42 51 55 56 57 58
2208 Spirits 54 49 45 54 52 47
1701 Cane Sugar 40 37 39 52 41 43
1511 Palm oil amp its fraction 52 55 52 43 53 40
2304 Soya-bean oil-cake 59 49 44 46 38 30
2106 Food preparations nes 24 23 22 27 29 28
1005 Maize (corn) 02 05 11 02 06 24
2309 Animal feed nes 16 17 17 17 20 22
Source TradeMap
Table 5 introduces a matrix that shows the values from the main country
sources by the top 20 import commodities It shows that wheat is mostly from
by the EU-28 market followed by Argentina and Namibia Rice is mostly
imported from Thailand and India with minimal imports from Brazil USA and
Namibia while the EU-28 and Brazil sources mainly supply the poultry
imports The EU-28 is the largest supplier of wheat poultry meat spirits and
food preparations Namibia was the eight supplier of agricultural product and
the data shows that live cattle to be eventually slaughtered in South Africa is
the main import from Namibia
18
Table 5 Matrix of main agricultural products imported by sources R million for 2015
Source TradeMap
EU-28 Argentina Thailand Brazil Swaziland Indonesia India Namibia China USA
Total 13571 5256 4336 3771 2700 2298 2114 1543 1364 1201
Wheat 1559 192 0 0 0 0 0 0 0 155
Rice 7 0 2963 46 0 0 1713 28 33 10
Poultry meat 2645 214 29 1660 3 0 0 0 0 3
Spirit 3157 0 1 33 0 0 0 0 1 225
Cane sugar 8 0 23 623 2426 0 45 3 1 1
Palm oil 0 0 0 0 0 2163 0 0 0 0
Soya-bean oil-cake 0 2367 0 1 0 0 2 0 0 0
Food preparations nes 1258 26 23 6 42 1 46 0 85 429
Maize (corn) 1 932 0 603 1 0 1 0 0 105
Animal feed nes 1092 14 12 30 137 0 2 8 83 173
Soya-bean oil 767 922 0 0 0 0 0 0 0 1
Tobacco 121 0 0 515 0 0 180 0 17 0
Chocolate 916 0 0 6 52 4 4 0 16 22
Coffee 168 0 0 84 0 117 9 0 0 11
Live cattle 0 0 0 0 12 0 0 1070 0 0
Sunflower oil 928 153 0 0 0 0 0 0 0 0
Coffeetea 698 0 0 17 17 0 93 0 2 16
Juices 89 401 13 46 10 1 11 0 346 10
Guts bladders etc 136 35 0 101 0 0 8 0 566 35
19
South African imports of Forestry products
Examining South Africa sources of forestry products (Table6) we find that the
EU is the largest supplier followed by China and USA At the bottom of the
table note that India and Turkey round out the top 12 sources with imports
from Turkey increasing in 2015
Table 6 Main suppliers of forestry products in South Africa
Values in million Rand
Exporters 2010 2011 2012 2013 2014 2015
World 12493 13481 15299 18200 20015 21127
EU-28 5836 5885 6963 8573 9159 9236
China 1265 1568 1869 2240 2552 2814
USA 1066 1134 1158 1374 1604 1683
Swaziland 555 599 856 891 902 1154
Brazil 304 495 526 600 800 721
Malaysia 512 549 610 588 640 705
Indonesia 524 524 481 499 505 571
New Zealand 81 76 185 397 611 558
Korea Republic of 365 381 527 485 435 453
India 198 205 256 272 371 442
Turkey 92 66 24 28 47 365
Source TradeMap
This same data is again expressed in percentage shares in Table 7 The EU
market share has been somewhat stable between 2010 and 2015 with a low of
44 in 2011 and highs of 47 in 2010 and 2013 Most other sources have also
been relatively stable with perhaps Chinese and Turkish imports the exception
to this as their shares have increased over the period shown
20
Table 7 Main suppliers of forestry products in South Africa (shares)
2010 2011 2012 2013 2014 2015
EU-28 47 44 46 47 46 44
China 10 12 12 12 13 13
USA 9 8 8 8 8 8
Swaziland 4 4 6 5 5 5
Brazil 2 4 3 3 4 3
Malaysia 4 4 4 3 3 3
Indonesia 4 4 3 3 3 3
New Zealand 1 1 1 2 3 3
Korea Republic of 3 3 3 3 2 2
India 2 2 2 1 2 2
Turkey 1 0 0 0 0 2
Source TradeMap
Tables 8 and 9 show main forestry products imported by South Africa between
2010 and 2015 by HS 4 products This data is in values expressed by R million
in Table 8 and the associated percentage shares in Table 9 Paper with
cellulose paper with kaolin and printed books were among the top thee
imported products by South Africa
21
Table 8 Main imported forestry products into South Africa R million by HS 4
codes
Values in Million Rand
Code Product label 2010 2011 2012 2013 2014 2015
HS 4 Forestry 12493 13481 15299 18200 20015 21127
4811 Paper with cellulose 1185 1405 1844 2299 2848 3102
4810 Paper with kaolin 2121 2096 2372 2516 2594 2730
4901 Printed booksbrochures 1696 1594 1798 2003 1865 1816
4407 Wood sawn 833 937 1122 1136 1267 1512
4802 Uncoated paper 888 757 1236 1394 1381 1368
4804 Uncoated Kraft paper 395 489 625 927 1058 1157
4819 Packing containers 381 388 450 619 743 864
4703 Chemical wood pulp 304 336 349 597 873 850
4412 Plywood 226 295 402 451 653 630
4911 Printed matter nes 260 257 330 321 405 546
Source TradeMap
Overall forestry products have ranged between 18 and 21 of South
Africarsquos total imports over the period The increases leading up to and
including 2015 were mainly from paper with cellulose wood sawn and
uncoated kraft paper with increased shares of 21 1and 04respectively
between 2013 and 2015
22
Table 9 Main imported forestry products into South Africa (share values)
2010 2011 2012 2013 2014 2015
Forestry 21 18 18 18 19 20
4811 Paper with cellulose 95 104 121 126 142 147
4810 Paper with kaolin 170 155 155 138 130 129
4901 Printed books amp
brochures 136 118 118 110 93 86
4407 Wood sawn 67 70 73 62 63 72
4802 Uncoated paper 71 56 81 77 69 65
4804 Uncoated kraft paper 32 36 41 51 53 55
4819 Packing containers 30 29 29 34 37 41
4703 Chemical wood pulp 24 25 23 33 44 40
4412 Plywood 18 22 26 25 33 30
4911 Printed matter nes 21 19 22 18 20 26
Source TradeMap
Table 10 introduces a matrix presenting forestry imports into South Africa by
source country and HS 4 classifications Again the EU is the source of most of
these imports followed China and USA Imports of wood pulp from New
Zealand are significant while both India and Korea are important sources of
paper
23
Table 10 Matrix of main imported forestry products and their sources R millions for 2015
HS code EU China USA Swaziland Brazil Malaysia Indonesia New Zealand Korea India
4811 Paper with cellulose 1767 234 120 0 62 62 35 0 14 286
4810 Paper with kaolin 1568 439 130 0 83 83 32 0 383 8
4901 Printed books amp brochures 943 151 383 164 1 1 0 0 2 31
4407 Wood sawn 43 5 122 496 54 54 50 0 0 0
4802 Uncoated paper 875 150 21 0 105 105 88 0 1 31
4804 Uncoated kraft paper 647 8 66 0 101 101 6 0 1 2
4819 Packing containers 368 173 16 141 12 12 2 0 3 6
4703 Chemical wood pulp 108 6 340 0 27 27 33 260 0 0
4412 Plywood 125 265 5 0 109 109 11 8 0 7
4911 Printed matter nes 276 83 33 0 0 0 0 0 2 5
4411 Fibreboard of wood 250 75 0 0 53 53 0 1 1 0
4823 Other paper 225 115 32 0 1 1 22 0 31 8
4418 Builders joinerycarpentry wood 121 77 0 3 1 1 129 3 0 1
4704 Chemical wood pulp 10 0 33 0 7 7 0 273 0 0
4805 Paperpaperboard nes 176 55 20 0 4 4 12 0 0 0
4813 Cigarette paper 185 14 71 0 34 34 1 0 0 0
4803 Sanitary paper 35 136 1 0 0 0 29 0 0 6
4416 Casks barrels etc of wood 226 1 31 1 0 0 0 0 0 0
4818 Toilet paper tissues diapers 110 45 5 0 0 0 0 0 0 0
4409 Wood continuously 5 71 1 18 62 62 47 0 0 0
4809 Carbon self-copy paper 104 11 69 0 0 0 20 0 1 0
Source TradeMap
24
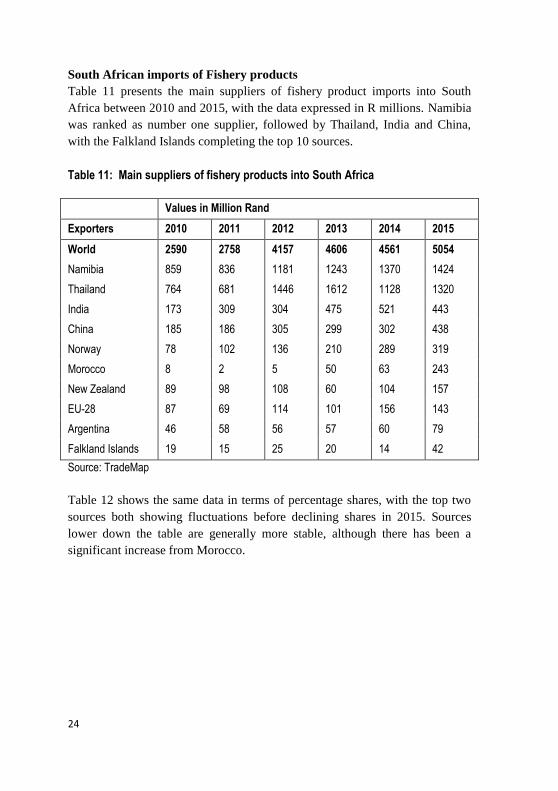
South African imports of Fishery products
Table 11 presents the main suppliers of fishery product imports into South
Africa between 2010 and 2015 with the data expressed in R millions Namibia
was ranked as number one supplier followed by Thailand India and China
with the Falkland Islands completing the top 10 sources
Table 11 Main suppliers of fishery products into South Africa
Values in Million Rand
Exporters 2010 2011 2012 2013 2014 2015
World 2590 2758 4157 4606 4561 5054
Namibia 859 836 1181 1243 1370 1424
Thailand 764 681 1446 1612 1128 1320
India 173 309 304 475 521 443
China 185 186 305 299 302 438
Norway 78 102 136 210 289 319
Morocco 8 2 5 50 63 243
New Zealand 89 98 108 60 104 157
EU-28 87 69 114 101 156 143
Argentina 46 58 56 57 60 79
Falkland Islands 19 15 25 20 14 42
Source TradeMap
Table 12 shows the same data in terms of percentage shares with the top two
sources both showing fluctuations before declining shares in 2015 Sources
lower down the table are generally more stable although there has been a
significant increase from Morocco
25
Table 12 Main suppliers of fisheries products into South Africa (shares)
Countries 2010 2011 2012 2013 2014 2015
Namibia 33 30 28 27 30 28
Thailand 29 25 35 35 25 26
India 7 11 7 10 11 9
China 7 7 7 6 7 9
Norway 3 4 3 5 6 6
Morocco 0 0 0 1 1 5
New Zealand 3 4 3 1 2 3
EU-28 3 3 3 2 3 3
Argentina 2 2 1 1 1 2
Falkland Islands (Malvinas) 1 1 1 0 0 1
Source TradeMap
Table 13 and 14 show main fishery products imported by South Africa between
2010 and 2015 in monetary and percentage shares respectively Table 13 shows
South Africa imports mainly prepared and whole frozen fish followed by
crustaceans
Table 13 Main fishery products imported by South Africa 2015 R million
Code Product label 2010 2011 2012 2013 2014 2015
Fishery products 2590 2758 4157 4606 4561 5054
1604 Prepared fish 1056 918 2065 2166 1797 2026
0303 Fish frozen whole 589 713 705 854 1134 1444
0306 Crustaceans 281 465 401 611 626 539
0304 Fish fillets fresh and frozen 276 178 300 366 327 314
0307 Molluscs 146 195 208 164 247 278
1605 Crustaceans amp molluscs
prepared 109 136 184 205 215 208
0302 Fish fresh whole 75 90 211 164 132 156
0305 Smoked fish 3 44 61 50 54 62
0301 Live fish 17 17 19 24 24 24
Source TradeMap
26
Overall fishery imports have constituted between 04 and 05 of South
Africarsquos total imports over the period By product whole frozen fish showed
the most significant increase while frozen fish fillet declined from 2010 levels
to become stable Other imports have been generally stable
Table 14 Main fishery products imported by product (shares)
2010 2011 2012 2013 2014 2015
Fishery products 04 04 05 05 04 05
Prepared fish 41 33 50 47 39 40
Fish frozen whole 23 26 17 19 25 29
Crustaceans 11 17 10 13 14 11
Fish fillets fresh and frozen 11 6 7 8 7 6
Molluscs 6 7 5 4 5 6
Crustaceans amp molluscs prepared 4 5 4 4 5 4
Fish fresh whole 3 3 5 4 3 3
Smoked fish 1 2 1 1 1 1
Live fish 1 1 0 1 1 0
Source TradeMap
Table 15 introduces a matrix presenting fishery imports into South Africa by
source country and commodities Prepared fish the main import is mostly
sourced from Thailand followed by Namibia and China with a collective total
of R19 billion The whole frozen fish is mostly supplied by Namibia New
Zealand and Norway with the total of R663 million R152 million and R125
million respectively in 2015 Morocco mainly supplies whole frozen fish while
the Falkland Island supply only molluscs (squid and cuttle fish)
27
Table 15 matrix for main fishery products and main suppliers of fishery products 2015 R millions for 2015
Source Trademap
Namibia Thailand India China Norway Morocco New Zealand EU-28 Argentina Falkland
Islands
1604 Prepared fish 434457 1271765 25 214095 1326 7154 0 21163 0 0
0303 Fish frozen
whole 663112 500 5516 46266 125728 235409 152870 68956 4303 0
0306 Crustaceans 4953 353482 2877 15322 0 826 12846 73183 0
0304 Fish fillets 245565 0 0 4390 17423 0 0 3291 0 0
0307 Molluscs 23502 0 12220 111932 0 0 1076 30906 800 42960
1605 Crustacean
molluscs prep 3415 41088 70344 57823 0 0 2527 2540 0 0
0302 Fish fresh whole 6554 0 1351 0 140762 0 0 251 0 0
0305 Smoked fish 38224 38 38 0 18224 0 0 1690 375 0
0301 Live fish 0 1213 63 150 0 0 0 902 0 0
28
Level of protection for imports of South Africa AFF products
The latest WTO country profile for South Africa reports that overall simple
average applied tariffs on agricultural products were some 84 with the
comparable bound rates being much higher at 404 This shows a significant
gap between the applied and bound rates overall and suggests that any WTO
agreement is unlikely to lower these applied tariffs in the immediate future In
addition some 421 of agricultural goods were entering South Africa at MFN
duty free rates during 2013
Table 16 shows the tariff imposed on agricultural imports as reported in the
ITC database as at mid-2015 The tariffs are shown for lsquomembersrsquo such as the
EU and SADC with preferential access and others (non-members) at the so-
called most favoured nation (MFN) rate Chicken meat and offal wheat and
sugar have all had their non-member tariffs increased by South Africa in recent
years3 The two highest rates shown in Table 16 are applied to poultry meat and
sugar followed a long way back by palm oils Rice and maize are free duty for
all imports while imports of spirits face a tariff duty of only 157 (they also
pay excise duty though along with all domestic production of the same
products) Note also that South Africa imposed a tariff rate on member
countries for wheat and sugar with both of these products subject to a complex
dollar reference-pricing rate applied to protect the local producers Table 5
earlier shows that significant imports of these products shown are lsquomemberrsquo
imports from the EU and SACUSADC (mainly Swazilandrsquos sugar)
3 See lsquoSouth Africa Tariff Policy - Does It Matterrsquo By Susara J Jansen Van Rensburg and
Ron Sandrey tralac Working Paper 2016
29
Table 16 Tariff imposed on the main imported agricultural products
HS
Code 2015
Non-members Members
0207 Poultry meats 2847 0
1001 Wheat 1164 0 (SA imposes 289 on EU
countries)
1005 Maize 0 0
1006 Rice 0 0
1511 Palm oil 1000 0
1701 Sugar 2708 0 (SAs imposes 1649 on EU
countries)
2106 Food
preparations 591 0
2208 Spirits 157 0
2304 Oil-cake etc 660 0
2309 Animal feed 909 0
Source TradeMap
Table 17 shows the tariffs imposed by South Africa on fishery imported into
the country Note in particular that even in the lsquomembersrsquo column the EU
imports are subject to tariff rates that are mostly basically the same as lsquonon-
membersrsquo The highest tariff rate is a 25 rate levied on lsquonon-memberrsquo imports
of extracts and juices of fish while three lines are duty-free or below 1 All
non-EU lsquomemberrsquo imports are tariff free and that includes Norway in all cases
Again refer to Table 14 for the details of the productsource profile
30
Table 17 Tariff imposed on the main imported fishery products
HS
Code
Non-members Members
EU SADC
0301 Live fish 0 0 0
0302 Fish fresh 1149 1148 0
0303 Fish frozen 067 067 0
0304 Fish fillets 1377 1377 0
0305 Fish dried salted o 1236 1236 0
0306 Crustaceans 014 014 0
0307 Molluscs 216 010 0
1603 Extracts and juices of fish 2500 0 0
1604 Prepared or preserved fish 632 633 0
1605 Crustaceans molluscs prepared 092 028 0
Source TradeMap
Table 18 shows the tariff imposed by South Africa on forestry products
imported into the country The ITC reports that all imports shown are duty-free
to the EU and SACUSADC lsquomemberrsquo sources For the other sources South
Africa imposes the highest tariff rate of 1015 for packing containers
followed by a modest 607 for uncoated paper and 579 for printed matter
not elsewhere specified (nes) Five of the top ten products enter duty-free from
all sources while paper with cellulose face a low lsquonuisancersquo tariff of 092
31
Table 18 Tariff imposed on the main imports of forestry products
HS 4 Description Non-members Members
4811 Paper with cellulose 092 0
4810 Paper with kaolin 0 0
4901 Printed books amp brochures 0 0
4407 Wood sawn 0 0
4802 Uncoated paper 607 0
4804 Uncoated Kraft paper 0 0
4819 Packing containers 1015 0
4703 Chemical wood pulp 0 0
4412 Plywood 10 0
4911 Printed matter nes 579 0
Source ITC TradeMap
32
Chapter 2
African Agriculture and the WTO
ndash the big picture
Ron Sandrey
In this paper we will provide a profile of African agricultural exports by the
main sources and products and examine this trade in detail to assess the tariff
duties faced in their markets to glean some information as to where the WTO
may be able to assist exports In the examination we will look at where more
progress in access gains may result from better access into both the EU and
fellow African countries and we argue that in the former the EPAs and the
TDCA are the best negotiating forums for these destinations In addition we
shall provide a background profile on global agricultural subsidies and show
how in many but not all cases these subsidies are declining and the declining
role of export subsidies Similarly tariffs facing agricultural exports from least
developed countries into developed countries are declining to a very low level
To complete the picture we will also provide background information on
related issues of concern such as some specific products that are important to
Africa (sugar and cotton) and problems such as tariff escalation in general
1 Introduction
Omolo 2015 in a background introduction to the WTO and how it relates to
agriculture and agricultural trade liberalisation provides the platform for this
Chapter to build on To recap the Agreement on Agriculture (AoA) has three
pillars market access domestic support and export competition
a Market access is related to trade restrictions that importers face while
trading at the international level These obstacles are largely in the form of
tariff and non-tariff measures where the AoA sort to replace the latter
tariffs (tariffication) Importantly countries negotiate to reduce their
33
bound tariffs that they are legally committed not to exceed at the WTO
These bounds rates are generally (but not always) above what countries
actually charge at the border ndash the applied tariff rate The difference
between the bound and applied tariff gives the tariff overhang and in
cases where this overhang is large then an agreed WTO tariff reduction
may in fact be a hollow outcome This is particularly the case in agri-
culture and especially for developing countries
b Domestic supports are policies that subsidize production through prices
or incomes In the WTO parlance boxes are used to identify subsidies
These boxes take the colours of traffic lights green (permitted) amber
(slow down mdash ie be reduced) red (forbidden)
c Export competition These are initiatives that make exports artificially
competitive They include export subsidies and credits guarantees and
insurance food aid exporting state trading enterprises and export
restrictions and taxes
The objective for this chapter is to build upon the platform provided by Omolo
and assess African agriculture against these three pillars to see where impacts
of a Doha Development Round (DDA) agreement may come from Special
attention is given to market access for the main African agricultural exports
The emphasis on this market access focus is reinforced by Anderson et al 2006
who assess the research and find that the potential contribution to global
economic welfare of removing agricultural subsidies is less than one-tenth of
that from removing agricultural tariffs This is backed up by the Organisation
of Economic Cooperation and Development (OECD) and model-based
estimates of producer distortions and shows that 75 of total support is
provided by market access barriers when account is taken of all forms of
support to farmers and to agricultural processors globally and only 19 to
domestic farm subsidies Other research suggests an even higher 86 of the
welfare cost of agricultural distortions is due to tariffs and only 6 to domestic
farm subsidies We will however examine the other two pillars of domestic
supports and export completion to assure ourselves that this is indeed the case
We will also take the latest DDA positions as being the benchmark for how
comprehensive a possible agreement may be It would seem a little fanciful to
expect an agreement that goes much beyond this benchmark when the WTO
34
has not even been able to reach this position in discussion since the official
DDA launch in November 2001
11 Levels of protection
The OECD is the authoritative source of information on the levels of protection
given to farmers Their measure of producer protection is defined as the ratio
between the average price received by producers (measured at the farm gate)
including net payments per unit of current output and the border price
(measured at the farm gate) For instance a coefficient of 110 suggests that
farmers overall received prices that were 10 above international market
levels This indicator reflects the level of price distortions and is measured by
the Producer Nominal Protection Coefficient expressed as the ratio of farm
price to border reference price It is an overall measure and thus while
aggregated across all sectors may hide variations to individual sectors It is
nonetheless the best general guide Table 1 below shows the OECD ratios for
several of the major global countries It is ranked in three sections for the
average of 2012ndash2014 inclusive the first is for ratios of up to and including
105 the second for ratios up to and including 110 while the third category is
for ratios above 110
South Africa sits in the top group along with the generally accepted low
agricultural protection countries of Australia Chile New Zealand and Brazil
What is unexpected is that both the United States and the EU are also now in
this group This is in contrast to their ratios in the first time period of 2000ndash
2002 average and shows that protection has dramatically decreased in recent
years There are reasons for the decline in US protection in particular with the
strong commodity prices in the later period meaning that some of the price
support mechanisms were dormant during this period and that the US leans
towards lsquogreen boxrsquo supports that are considered to be environmentally
friendly and thus acceptable and not included The EU decline is at a level that
is much lower than what is the general perception of a highly protected
agricultural regime
35
Table 1 OECD ratios of agricultural protection three yearsrsquo averages
2000-02 2006-08 2012-14
Australia 100 100 100
Chile 106 101 100
New Zealand 100 101 101
Brazil 101 103 101
South Africa 107 105 102
United States 113 102 102
Mexico 122 105 104
EU 127 112 105
Russia 102 115 106
Israel 118 106 107
Canada 111 110 108
Kazakhstan 112 103 109
OECD - Total 129 114 110
Turkey 128 130 120
China 103 104 121
Indonesia 109 108 126
Switzerland 256 176 145
Norway 263 181 174
Japan 228 186 194
Korea 251 205 196
Source OECD
The central segment shows that the OECD total protection is declining
dramatically as well driven of course by the weight of the US and EU declines
Also note that Canada is in this segment with its strong protection to dairy and
poultry sectors neither of which concern Africa Finally in the lower segment
there are the well-known culprits of Switzerland Norway Japan and Korea
along with the two surprises of Indonesia and China where protection is
climbing rapidly
36
We emphasise that these are aggregate measures and give little information of
the trade distorting nature of the overall supports Butault et al 2012 report on a
European Parliament assessment of agricultural supports in the main trading
nations They report that the EU has carried out reforms that have made farm
support more efficient in the sense that more of the transfers from taxpayers
and consumers now reach the farmersrsquo pockets and that the EU support now
generates much less distortion in world markets In many other OECD
countries the evolution of farm support has followed a rather similar path
They also reinforce that while US supports are lower than the EU part of the
difference can be explained by the high world prices at that time (2012) as the
US relies more on countercyclical instruments Interestingly their analysis
shows that Brazil and China invest heavily in research and we consider that
the spectacular success of agriculture in these two countries in recent years
points strongly in the direction for Africa of more research and infrastructural
development to assist the sector rather than direct supports This is in supported
by Butault et al as in contrasting both EU and US policies seem to keep
focusing more on supporting farmersrsquo income rather than investing in
innovation while the latest OECD reports indicate that the changes to global
agricultural supports emphasise the swing from the 1990s where emerging
economies taxed the sector and the developing countries protected their sector
to one where protection is increasing in the emerging countries while
developed countries support (US and EU in particular) is declining The times
they are a changing
Meanwhile the US heavily subsidizes grains oilseeds cotton sugar and dairy
products Most other agriculture ndash including beef pork poultry hay fruits tree
nuts and vegetables (accounting for about half of the total value of production)
ndash receives only minimal government support In general subsidies globally are
concentrated upon to so-called lsquorice puddingrsquo of rice milk and sugar Only
sugar is of export interest to Africa South Africa and Swaziland in particular
for exports and Kenya for imports Both cotton and oilseeds are also important
and we will discuss cotton later as it carries much symbolic significance for
Africa
37
2 Where may the gains come from ndash a look at African
agricultural trade
We introduce this section by showing Africarsquos agricultural exporters in Table
2 ranked by 2015 values We emphasise that these values may be incomplete
as several African countries do not report their trade data to the International
Trade Centre (ITC) the source of all our trade data and therefore the ITC relies
on mirror (partner) data in some cases This can be a problem when neither
party reports to the ITC as does happen in Africa
South Africa has consistently been the main exporter from Africa over the
period shown Cocircte dIvoire consistently follows behind and then there are the
four relatively tightly grouped countries of Morocco Egypt Ethiopia and
Ghana Even further down the list there are several countries with exports of at
least one billion dollars and the importance of agriculture to several of the
countries not shown is demonstrated by the fact that the table with the top 15
exporters only contains 84 of Africarsquos agricultural exports during 2015 Also
shown in line 3 is that Africarsquos agricultural exports to the world have risen
from a low of 30 in 2008 to consistently being 36 or 38 in recent years
To put this in perspective it is a lower share than Francersquos (which includes
intra-EU exports) and Chinarsquos Not shown on the table are the next five African
exporters of Mauritius Zambia Burkina Faso Mozambique Madagascar and
Somalia all of whom had exports of over half a billion dollars during 2015
38
Table 2 African exporters of agricultural products amp African world exports
Exporters 2006 2008 2010 2012 2013 2014 2015
Africa 24247 33295 42980 51410 53537 57060 48293
Africa world 32 30 38 36 36 38 36
South Africa 3611 5346 8079 8621 9178 9315 8424
Cocircte dIvoire 2984 4017 5138 5024 4720 6741 6024
Morocco 1910 2741 2778 2966 3350 3634 3982
Egypt 1189 3338 5419 4958 5447 5478 3765
Ethiopia 876 1337 1907 2456 3345 4019 3743
Ghana 1735 1326 1136 2688 2347 3869 3094
Kenya 1834 2667 2921 0 3083 3298 2284
Tanzania 533 952 990 1576 1338 2464 1446
Tunisia 1305 1627 1263 1591 1621 1280 1333
Sudan 423 431 515 809 1280 1334 1305
Uganda 450 881 842 1226 1333 1245 1283
Zimbabwe 1795 620 772 1260 1226 1160 1145
Nigeria 230 1164 3402 7902 4771 2092 1080
Cameroon 537 752 1029 879 0 1064 993
Malawi 565 779 836 950 952 1028 893
Subtotal 82 84 86 83 82 84 84
Source ITC
Next we show the destinations for these exports in Table 3 and here the EU
dominates with a share of 398 of the total in 2015 followed by South Africa
who is the destination for another 172 in the latest year Thus some 570
of Africarsquos agricultural exports during 2015 were destined for wither the EU or
South Africa In both cases the main sticky import is sugar and related
products as virtually all other agricultural products have tariff and quota free
entry in both destinations The exceptions are largely South Africarsquos entry into
the EU and details of this will be covered in the next chapter Perversely with
respect to African access into the EU with the Economic Partnership Agree-
ments (EPAs) the African interest is to limit a WTO agreement that would
dilute the value of its preferential access Similarly the rest of Africarsquos access
into South Africa is being negotiated and Potelwa et al 2015 show that outside
of the East African Tripartite negotiating area there is very limited intra-
African agricultural trade Any progress on access issues within Africa are
39
likely to be advanced in the potential African Continental-wide FTA rather
than via the WTO in any event Similarly Africarsquos agricultural access into the
US the next main market is constantly being negotiated through the American
African Growth and Opportunity Act (AGOA) process
There leaves few lsquonuts to crackrsquo although one must be careful in that lsquotrade
chillingrsquo or high tariffs and other barriers may be lsquochillingrsquo trade that otherwise
would take place This is especially the case with sugar and we will explore
this commodity later to assess whether the WTO offers a promise of better
access for Africa here
Table 3 African agricultural exports by destinations US$ millions amp shares
Importers 2006 2008 2010 2012 2013 2014 2015
Total $ millions 25026 33778 43117 54622 54561 57108 48537
EU $ millions 11758 14467 15380 18351 18797 19099 19308
Africa $ millions 5738 8372 12638 15524 5738 6384 8372
shares
to EU 470 428 357 336 345 334 398
to Africa 229 248 293 284 105 112 172
subtotal EUAfrica 699 676 650 620 450 446 570
US dollar millions
USA 1125 1448 1762 3092 1904 2272 2797
Saudi Arabia 364 836 1246 1568 1851 1981 2382
India 545 769 881 1425 1741 2176 2044
South Africa 907 742 1301 2393 2385 1991 1872
China 806 504 1043 1605 1716 1859 1483
Russia 344 632 697 847 898 1035 1455
Turkey 241 384 755 692 848 941 1067
Japan 431 453 525 686 874 849 779
Malaysia 190 319 370 952 830 1167 743
Mozambique 266 317 415 598 675 841 734
Zimbabwe 180 536 686 1057 845 788 729
Namibia 22 12 730 823 786 767 720
shown 916 882 891 908 731 738 917
Source ITC
40
3 Access conditions for the main individual commodities
exported by Africa
Before we start examining the access conditions for African agricultural
exports it is important to gain a perspective on these tariffs globally and
especially for the Least Developed Countries (LDCs) where most African
countries are defined in the WTO The WTO (Table 4 bottom half) shows that
average developed country tariffs on agricultural products for these LDCs
witnessed a gradual decline from 36 in 2000 to a mere 1 in 2011
Agricultural access for LDCs has the largest preference margin over
Developing country tariffs (top half of Table 4) where the preference margins
are around 6 percentage points Note in particular how these tariffs have been
declining since 2000 and especially for the LDCs
Table 4 Average tariffs levied by developed countries on key products from
developing and least-developed countries 2000-2011 (percentage ad valorem)
Developing countries
2000 2005 2006 2007 2008 2009 2010 2011
Agriculture 92 88 85 83 80 78 73 72
Least Developed Countries (LDCs)
Agriculture 36 30 27 19 16 12 10 10
Source WTO
We will now examine trade access conditions for the African exports as given
in Table 5 The format used will be to take the major supplier for each of the
main commodities and use that as a proxy for African access This is of course
a partial analysis but a comprehensive analysis assessing the tariffs facing each
supplier would be a major undertaking In general we will report on exports to
the EU and Africa For the former we note that access conditions into the
former have been exhaustively negotiated under the Economic Partnership
Agreements (EPAs) between African countries and the EU and there would be
no improvement on the essentially duty free and quota free access that African
countries either have or are in the process of ratifying The exceptions here are
South Africa (discussed in the next chapter of this book) and sugar For the
latter (intra-African access) we note that 1) few African countries would be
obliged to make access conditions to any suppliers based in the special and
sensitive product exemptions and the large tariff overhang between bound and
41
applied rates for most African counties along with their developing and Least-
developing Country status
Table 5 African agricultural exports by commodity US$ millions amp shares
Product label 2014 2015 2014 2015
$ million shares
HS 2 Agriculture $ million amp total 57060 48293 995 1295
18 Cocoa 9650 8503 169 176
08 Fresh fruit 7574 8081 133 167
07 Fresh vegetables 4240 4241 74 88
09 Coffee tea 4322 3466 76 72
24 Tobacco 3259 2753 57 57
12 Oil seed 3430 2579 60 53
15 Fats and oils 2163 2042 38 42
52 Cotton 3193 1893 56 39
17 Sugars 2699 1745 47 36
01 Live animals 1632 1680 29 35
06 Plants etc 1802 1664 32 34
16 Meat fish processed 1913 1659 34 34
22 Beverages 2060 1632 36 34
20 Processed fruit veg nuts etc 1620 1212 28 25
23 Residues 1136 880 20 18
10 Cereals 1368 874 24 18
21 Miscellaneous edible 1175 844 21 17
02 Meat and offal 654 676 11 14
04 Dairy -eggs -honey etc 1099 562 19 12
19 Processed cereal etc 796 411 14 09
Subtotal total 978 981
Source ITC
31 The commodity by countrymarket profile analysis
We next examine the trade profiles for the top ten African agricultural exports
by HS 2 Chapters as shown in Table 5 We would note in passing that two of
these exports tobacco and sugar are the subject of intense international
condemnation in recent times as a result of health concerns This may or may
not have implications for African exports
42
1) The analysis starts with cocoa where the exports are predominantly HS
1801 cocoa beans and the major supplier to world markets is Cocircte dIvoire
with a 55 market share of the full HS 18 exports (followed by Ghana)
The major market is the EU with a market share of around 60 and given
that the EU tariff is already zero there are no gains from that destination
Tariffs for the next two markets of the US and Malaysia are a modest 5
Within Africa South Africa is the leading importer with a reported tariff of
84
2) The exports of fruit (HS 08) are the second largest export commodity and
here the situation is more complex a complexity accentuated by actual and
perceived non-tariff barriers in several markets South Africa with a 36
share is the dominant exporter and overall around 40 of Africarsquos fruit is
destined for the EU followed by India Russia and the US Using South
Africa as the benchmark tariffs are reported in aggregate to be 24 into
the EU 14 into the United Arab Emirates and 35 into Russia Rates of
10 and above suggest that access into both India and China may be a
problem Exports of nuts are important to mainly South Africa and these
exports are destined for the EU Hong Kong and the US all of whom are
duty-free for this product Banana trade has been the subject of a large
WTO dispute between the EU and suppliers and we note that African
banana exports are mainly from Cameroon and Cocircte dIvoire to the EU
duty-free Morocco the second supplier of HS 08 is mainly exporting
citrus with Russia as the top destination where tariffs of 359 are
assessed on average
3) African exporters of the eclectic vegetable mix are headed by Morocco and
Egypt with the main destinations overall being the EU (447 during
2015) and intra-Africa (233 during 2015) Benchmarking Morocco we
find that tariffs were 637 into the main market of the EU and 863 into
the next market of Russia while the other lesser markets were generally
much less A similar pattern applies for Egypt the next supplier although
here the duty-free market of Saudi Arabia is the main market South
Africarsquos exports were mainly to SADC countries and here the exports were
mainly duty-free except to the 50 levied by Angola
4) Next are exports of HS 09 which for Africa is coffee tea vanilla and
cloves in that order The main exporters were Ethiopia Kenya Uganda
43
Madagascar and Tanzania with coffee dominating with exports of just over
two billion during 2015 and tea following with $716 million in the same
year Examining Ethiopia (which is not a WTO member and therefore
cannot expect any benefits) we find that its exports of almost exclusively
coffee are destined for the duty-free or almost duty-free markets of the EU
Saudi Arabia and the US We note here that there seem to be
inconsistencies in the data as several countries such as Afghanistan
Swaziland Mali Romania and Poland are showing wide variations in their
reported imports
5) Tobacco is exported from predominantly Zimbabwe (32) Malawi (18)
and Tanzania (15) to mostly the EU and South Africa (both duty free)
There is however a major issue with exports from Zimbabwe that tralac has
identified in the ITC data They are listed as exports to South Africa but
there are corresponding South African imports from Zimbabwe of only a
fraction of that amount And while there are no Zimbabwean exports to
China Conversely China reports imports from Zimbabwe that generally
match those reported by Zimbabwe as destined for South Africa It seems
to be merely a transit through South Africa as there is no change at the
detailed code description suggesting any value-added Tariff in this line are
reported by the ITC as being 556 into Russia 2375 into China and
258 into the US This would indicate a significant tariff bill for someone
if the Zimbabwean tobacco is actually going to China as seems to be the
case
6) Oil seeds are number six on the African export list and here the main
exporters are Ethiopia Sudan Nigeria Tanzania and Burkina Faso with the
main products being oil seeds per se medicinal plants locust beans and
ground nuts (peanuts) The main markets overall (with tariffs faced by
Ethiopia in brackets) were China and then the EU (both 0) Turkey
(711) Japan (027) India (17) and Saudi Arabia (203) Of the
African total from 18 to 32 have been destined for China over the last
five years 13 to 17 to the EU and from 11 to 16 to Africa
7) Animal and vegetable fats and oils are the next export with Tunisian olive
oils dominating and they are followed by South Africa and Morocco
Overall some 72 ndash 77 of the total has been destined for mostly the EU
and Africa with the respective shares varying over the last three years For
44
Ethiopia the bulk of the exports are to the EU but here there is an assessed
duty of 996 for this EU-sensitive product Next are exports to the US
(293 duty) and Libya at zero duties For South Africa it is mostly soy
bean and sunflower oils destined for fellow SADC members where the
exports are duty free except to the main market of Zimbabwe with itrsquos
626 duties
8) Cotton HS 52 is the flash-point for Africa and the WO The issue here is
not market access though but rather US subsidies to domestic production
African exports of HS 5201 raw cotton are predominantly from West
Africa and the three main destinations are China India and Singapore in
somewhat equal values The duty into China is 20 while for India and
Singapore (and most other destinations) it is zero China is the main global
importer taking around a third of imports while the US is the main exporter
with a similar market share Therefore duties into China of 20 and
competition from the subsidised American exports are the main issues for
Africa and the WTO with respect to cotton
9) Sugar HS 17 is the most protected sector where Africa is a significant
global exporter and here the situation is more complex Currently the
major African exporters are Swaziland Mauritius and South Africa with a
combined global market share of 33 during 2015 Both Swaziland and
Mauritius have virtually free tariff access to all their markets (both within
Africa and the EU) according to the ITC data while South Africa still faces
tariffs both within Africa and the EU as well as high tariffs in the
significant markets of Indonesia Japan and India The African tariff rates
are best addressed in the context of the Tri-Partite FTA in the case of
Kenya in particular or the TDCA in the case of South African access to the
EU We will discuss this in more detail later
10) Live animal exports (HS 01) are concentrated from Sudan Somalia and
Ethiopia (83 of African exports) with the main destinations being
Saudi Arabia Oman and Somalia None of the three main exporters are
WTO members and therefore it is difficult to see what the WTO may be
able to do and in addition the main destination from Sudan is Saudi
Arabia where tariffs are zero the main destinations from Somalia are
Saudi Arabia and Oman where again the tariffs are zero and the main
45
destination for Ethiopia is Somalia who is not a WTO member
Therefore in general the WTO offers nothing for live animal exporters
In conclusion there seems to be few of the major African agricultural exports
where the WTO could provide some benefits and especially against the back-
ground of low agricultural tariffs into Developed countries from LDCs as
shown in Table 4 Cotton seems to be more of a flash-point than an actual
source of benefits as the background issue is US supports to its domestic
producers This is already subject to an agreement (discussed below) and there
is an outside possibility that perhaps some relief from the high (20) tariffs
into China may result from an agreement in the WTO Sugar trade exists in a
complex regime but solutions through this maze for African producers are best
pursued within Africa itself by negotiations in the African trade agreements
currently in play and between South Africa and the EU under the TDCA
Several of the main products ndash cocoa coffee and tea live animals ndash exist in an
almost duty free environment Of the others for fruit and vegetable exports
non-tariff barriers are probably the main worry although South Africa the main
fruit exporter faces tariff complexities in the EU and high tariff barriers into
China and India Although tobacco exports from the main suppliers are
outlined in the ITC data as being largely destined for the duty free EU and
South African markets the exports from Zimbabwe to South Africa are
actually destined for China where a 2375 tariff is reported The semi-related
products of oil seeds and animal and vegetable fats are largely destined for the
EU and Africa where if the imports are not already duty free then bilateral or
regional negotiations must offer the best possibilities for improved access
conditions (we note that exports of oil seeds into China are duty free)
The limitation of an analysis such as the above is that there may well be cases
where medium to high tariffs are lsquochillingrsquo trade that would take place or
increase with better access conditions Other than the general cases discussed
above there are few examples that we can identify although access for sugar
into Kenya where the current tariffs of 85 are extraordinarily high and
generally trade prohibiting Also in the sugar regimes the protectionism
spreads beyond just the basic raw sugar imports to include any further
processing such as tinned fruits jams and preserves that contain sugar
46
32 Additional comments on particular products of export interest
Sugar
The Uruguay Round of the General Agreement on Tariffs and Trade (GATT)
(the old WTO) did little directly for sugar but indirectly helped in both setting
up the framework for a substantial liberalisation of sugar production and trade
in the future and augmented this through the dispute settlement mechanism
(where the Appellate Body applied and confirmed earlier case law developed in
New Zealandrsquos successful case against Canadian dairy export subsidies) The
disruptive polices of the EU the US and Japan cause most of the problems by
heavily subsidising their producers and providing limited quota access and very
high out-of-quota tariffs to maintain these regimes Accentuating the problems
for competitive producers are the export subsidies that the EU uses to sell
surpluses onto remaining free-world markets This is the product with the most
potential for preference erosion for the region but currently exports are low It
is also a case that will pit developing countries against one another and even in
Africa This is because some who currently export a limited amount but have
the potential to become competitive will take trade away from others who are
relying on preferences
Sandrey and Moobi 2016 outline how Brazil is a leading cane sugar producer
and also has the fastest growth rate among the leading producer Conversely
cane production in the USA Australia South Africa Cuba and Venezuela all
show a decline in sugar production over this same period South Africa the top
African producer is just ahead of Egypt and they are followed by Sudan
Kenya and Swaziland who each have similar shares of African production
Overall Africa accounted for 5 production share of global production in
2013 and this was down from the 7 in 2000
South Africa has generally been marginally ahead of Swaziland as the top
African global exporter of sugar followed by Mauritius Algeria was the main
African importer of sugar during 2014 followed by Nigeria Sudan and
Morocco Africa imported some 183 of the global sugar exports during
2014 a figure that has been relatively stable since 2012 after climbing from
lower levels South Africa was the main intra-African importer of sugar
followed by Sudan Namibia and Kenya and overall Africa is a net importer
of sugar
47
Sandrey and Moobi also consider that the South Africa sector has not been
subjected to market forces in the same way that other agricultural sectors have
been in recent years The argument employed by the sugar sector that they face
a distorted international trading environment holds equally true for many of the
sectors that have been fully exposed to international competition Indeed
currently sugar in South Africa enjoys more protection than the major
producers of Brazil the EU Australia and China and is only behind the US in
the major OECD support measures Much of this protection is through a dollar
based reference price (DBRP) tariff system that grants import protection
against low world prices but special treatment to sugar extends to trade
restrictions on free trade from non-SACU SADC imports into SACU This
latter special treatment is not given to any other products either agricultural or
non-agricultural
Jensen and Sandrey 2015 simulated the impacts of reforms in the EU sugar
sector upon this African production and trade using the Global Trade Analysis
Project (GTAP) computer model During 2006 a reform of the CAP sugar
regime brought a simplification of the EU quota structure when these quotas
were prolonged until 201415 with no commitment to further renewal Other
research has estimated that EU production will increase and sugar imports into
the EU will decline Meanwhile the recently concluded Economic Partnership
Agreements (EPAs) is crucial for sugar access to the EU for many LDC
countries and it is against this background that tralac ran these simulations
They found that production in the EU increases by 529 African exports to
the EU declined by 14 and by 108 in total to market outside of Africa as
the increased EU competition puts pressure on Africarsquos traditional markets
Production declined across the board in Africa and the trade results mirror the
production affects with all African exports declining in the face of an 11
increase in EU global exports and a loss of markets in the EU Changes are
marginal for intra-African trade although there is a decline of 14 to the EU
and displacement by the EUrsquos global export increase of 11 displaces African
exports Furthermore in reporting on tralac research simulating the
implications of a liberalisation whereby all agricultural tariffs on intra-African
trade go to zero after factoring the EU reforms into the trade model these
intra-African reforms were dominated by changes in the African sugar
production and trade profiles The big gainers were South Africa from
enhanced exports to mainly Kenya and Kenya itself as resources are diverted
48
away from its inefficient sugar sector Thus changes to the EU sugar regime
are not necessarily good news for Africa and the big potential gains to the
sugar sector are mainly within Africa itself The latter is within the auspices of
African integration and not the WTO
Coffee is a classic example of an agricultural product whose long-term market
prices have fallen dramatically over the last two decades in spite of increasing
demand Coffee beans sold in the international market are significantly
differentiated from coffee sold as a final product to the consumer with coffee
as most people know it sold in an end market where advertising and service
quality dominate the cost of coffee beans According to the FAO Brazil and
Vietnam are the worldrsquos largest coffee growers with a combined share of 49
in 2013 Africa contributed just on 10 with Ethiopia Uganda and Cocircte
dIvoire being the largest growers Worryingly although almost all coffee is
grown in the developing world there were signs in late 2013 that Brazil the
champion of developing country agricultural free trade was implementing a
coffee subsidy to growers Since then however coffee bean prices have
recovered albeit not back to previous highs
Cotton emerged as a major flashpoint at the WTO trade summit in Cancun
Mexico as four West African countries namely Benin Burkina Faso Chad
and Mali called for an end to cotton subsidies in rich countries and
compensation to cover economic losses caused by these subsidies This
challenge dramatically highlighted both the problems that African farmers in
particular face in a distorted agricultural market and how the balance of power
in the WTO is swinging away from rich countries to a more representative
view of the entire WTO membership In general West African cotton farmers
are able to produce cotton at perhaps one third of their counterparts in the US
but it is the US subsidies that are denying them export opportunities
Cotton while not a crucial issue for eastern Africa is still important in that (a)
some exports do originate from the region and (b) this issue has become the
rally-cry for African nations In actuality better access may not deliver as much
as some hoped for but in the interests of solidarity with fellow Africans the
region should support comprehensive reforms (but not to the extent of being
lsquobrought offrsquo by a cotton outcome) African nations export very limited
quantities of cotton to the US and although market access is not the issue for
49
cotton the use of domestic subsidies in the US and EU and the consequential
price reduction for internationally traded cotton is
On market access the decision calls for cotton from LDCs to be given duty-
free and quota-free access to the markets of developed countries and to those of
developing countries declaring that they are able to do so from 1 January 2016
The domestic support part of the cotton decision acknowledges members
reforms in their domestic cotton policies and stresses that more efforts remain
to be made On export competition for cotton the decision mandates that
developed countries prohibit cotton export subsidies immediately and
developing countries do so at a later date
The situation for bananas is similar to that of sugar where the developing
countries are being set against one another as a result of the WTO banana
dispute Basically Latin American producers with a share of about 60
dominate the EU market while many of the other ACP countries have a
restricted quota access of about 20 of the market Africa had around a 7
share of exports during 2013 The situations for bananas demonstrate that there
are both winners and losers in many trade disputes and that the two camps can
both contain developing and least developed countries The losers were those
earning rents from exporting at better access prices while the gainers are the
more efficient producers who now have an ability to export into a freer market
at a fairer price
33 Export subsidies
Strubenhoff 2016 writes that in December 2015 at the World Trade
Organizationrsquos (WTO) 10th Ministerial Conference in Nairobi members
finally agreed that export subsidies for agriculture would be abolished The
agreement states that lsquodeveloped country members shall immediately eliminate
their remaining scheduled export subsidy entitlements as of the date of
adoption of this decisionrsquo and lsquodeveloping country members shall eliminate
their export subsidy entitlements by the end of 2018rsquo WTO members also
lsquoundertake not to provide export credit export credit guarantees or insurance
programsrsquo for agricultural products He then asks lsquoWhy did the EU agree to
abolish export subsidies and the US agree to abolish export creditsrsquo He
considers that farming lobby groups loved them and governments in poor
food-importing countries liked the cheap imported food But they were
50
distorting market prices leading to higher-than-market prices and surplus
production in exporting countries and lower prices and less production in
importing countries Hence policymakers in developed countries cared more
about farmers while developing countries cared more about consumers
The benefits from this action are hard to quantify as this measure of support
has been declining and thus the direct impact is rather minimal Perhaps more
important is that new subsidies shouldnrsquot be implemented and perhaps we can
wave goodbye to one instrument of distortion
34 Other issues
Special products the SSM and even perhaps Sensitive Products need to be
carefully considered The latter are products that a member may declare and
thus be obliged to make lesser market access commitments for that product
Special products extend this concept to developing members only for those
products that are a staple or basic food of that country and negotiations
continue on how extensive this concession may be Unfortunately in Africa
there seems to be a tendency for countries to bow to special interest groups
rather than consider a more broad approach which examines overall welfare
when special products are listed and this protectionist approach negates a
significant share of the likely welfare gains from trade liberalisation
Extending this still further is the SSM measure that will allow both developing
and least developed members to raise tariffs in the event of an import surge that
threatens domestic producers The SSM constitutes a unique instrument to
assist with food security livelihood security and rural development It must be
simple effective and easy to implement Members will need to consider what
products they consider important to list in their schedules and this extends to
the SSM products Similarly developing countries and least developed
countries are entitled to nominate Sensitive products as these are not just for
the developed countries In practice the use of Special products is likely to be
more important for defensive interests Members need to carefully watch the
use of Sensitive products by the developed members as there is a balance
between better market access and possibly preserving some preference rents as
discussed earlier
51
Tariff escalation similarly needs to be carefully considered without prejudice
to the products benefiting from preferential arrangements This is an issue in
commodities such as the further processing of coffee beans for example This
is a difficult area to analyse as most researchers commonly just look at the
increase in tariffs as the raw product moves through the processing chain
While indicative it does not tell anything about the increased tariff rate relative
to the value-added component of the processing chain or the capacity
competitiveness of the country in undertaking that value added process
Cocoa and products are the leading single agricultural export from Africa and
here tariff escalation does not seem to be a problem The export of the further
value added products of cocoa butter chocolate and cocoa powder from the
leading exporter of Cocircte dIvoire all seem to have largely duty free access to
their markets Similarly for coffee where looking at exports from Ethiopia (and
even though it is not a WTO member we could argue that it is a worst-case
example for Africa as it has no WTO access benefits) we find that access is
generally duty free for its main raw coffee exports and for the extremely
limited exports of roasted coffee as well There do however seem to be
significant tariffs against roasted coffee in several markets so we cannot rule
out trade chilling or prohibition through tariff escalation here but the evidence
is very limited
There have however been suggestions that the monopolistic competition in the
cocoa and related products market is impacting on these products Here the
WTO is concerned that as government barriers to trade and investment have
been reduced the gains from this liberalisation may be thwarted by private anti-
competitive practices Mutually supportive trade and competition policies can
contribute to sound economic development and effective competition policies
help to ensure that the benefits of liberalisation and market-based reforms flow
through to all citizens Many WTO member countries including many
developing and transition countries have adopted competition laws
Too often we find that access conditions into many markets are stymied by
overly rigorous rules of origin (ROO) regimes The WTO is moving on this
problem The 2013 Bali Ministerial Decision on preferential rules of origin for
LDCs set out for the first time a set of multilaterally agreed guidelines to help
make it easier for LDC exports to qualify for preferential market access The
Nairobi Decision expands upon this by providing more detailed directions on
52
specific issues such as methods for determining when a product qualifies as
lsquomade in an LDCrsquo and when inputs from other sources can be lsquocumulatedrsquo
(combined together) into the consideration of origin It calls on preference-
granting members to consider allowing the use of non-originating materials up
to 75 of the final value of the product and calls on preference-granting
members to consider simplifying documentary and procedural requirements
related to origin The key beneficiaries will be sub-Saharan African countries
which make up the majority of the LDC Group the proponent for the Nairobi
Decision on Preferential Rules of Origin for LDCs
53
References
Anderson K and Martin W (eds) 2005 Agricultural Trade Reform amp the
Doha Development Agenda Washington DC World Bank
Anderson Kym Will Martin and Ernesto Valenzuela2006 The relative importance
of global agricultural subsidies and market access World Trade Review (2006) 5
3 357-376
Butault J-P J-CBureau H-PWitzke T Heckelei and A Zintl2012
Comparative Analysis of Agricultural Support within the Major Agricultural
Trading Nations European Parliament IPBAGRIIC2011-068 May 2012
Jensen H G and R Sandrey2016 The impact of EU reforms on African
sugar production and trade a GTAP analysis tralac Trade Brief at
wwwtralacorg 4 November 2015
Omolo M W O 2015The Agriculture Negotiations at the World Trade
Organization (WTO) tralac Trade Brief at wwwtralacorg 18 Dec 2015
Potelwa Y R Sandrey and Sun Zhina2015 The West and Central African
trade profile with a special review of the relationship with China and regional
agricultural trade tralac Working Paper at wwwtralacorg 27 November
2015
Sandrey R and M Moobi2015 Sugar the production trade and policy
profiles for South Africa and other selected African countries tralac Working
Paper at wwwtralacorg 18 December 2015
Strubenhoff H February 8 2016 Brookings Institute Blog at
httpwwwbrookingsedublogsfuture-developmentposts20160208-wto-
agriculture-export-subsidies-strubenhoff
WTO2013 Market Access for Products and Services of Export Interest to
Least-Developed Countries Note by the Secretariat WTO
WTCOMTDLDCW58 September 2013
54
Chapter 3
Analytics of the WTO Agricultural
Agreement for Africa
Ron Sandrey
1 Introduction
In recent years the global trade modellers of the world or perhaps more
accurately their patrons have largely moved on from assessing the gains from
an outcome from the WTOrsquos Doha Development Agenda (DDA) Perhaps it is
because as the DDA stalled it lost some of its lsquosexinessrsquo appeal or perhaps it
was because as trade models become more sophisticated the limitations of the
DDA for agriculture became more apparent and consequently the magnitude of
the gains declined Funders and especially government funders do not want to
hear of lowering gains
The salient feature of this modelling research is that the gains for Africa are
modest with some countries actually losing welfare through results such as
preference erosion in developed markets
Background and modelling assessments of the DDA for agriculture in
particular Sandrey 2006 a succinctly set the scene for agriculture in the WTO
with lsquoFor nearly 50 years agriculture was largely exempt from manufactured
goods trade rules While member countriesrsquo prosperity grew on the back of a
relatively open trading system for manufactured goods these same countries
erected trade barriers ndash some insurmountable ndash to agricultural imports Hand-
in-hand with trade barriers went generous farm support payments provided by
government treasuries Rather than being driven by straightforward economic
principles as is largely the case with manufactured products domestic agri-
cultural policies were driven by a perceived need for self-sufficiency in food
wartime food shortages memories and strong government decision-making
55
representation This resulted in growing unsaleable product surpluses for which
governments had to provide further subsidies to dispose of on world markets
The ideological view that agriculture is somehow different from other sectors
continued despite it being comprehensively brought into the multilateral
negotiating environment for the first time Separate agriculture disciplines were
agreed under the Agreement on Agriculture (AoA) although the Uruguay
Round (UR) did initiate a process to reduce or limit agriculturersquos exemptions
and bring them more fully under GATTWTO disciplinesrsquo
Against that background this section undertakes a review of the literature that
is relevant to quantitative analysis of the impacts of the DDA with special
reference to Africa and South Africa While some of this review may be a little
dated that is of no real concern in that the general principles of the stalled
DDA have barely changed although what has changed in recent years is that
the computer model analysis has become more sophisticated This is especially
so for the Global Trade Analysis Project (GTAP) the model of choice for most
practitioners More countries have been added to its database and the trade and
economic data is continually moving forward While models such as GTAP
have the undoubted strength of forcing consistency in their analysis they also
suffer from weaknesses in that they are a representation of the lsquoreal worldrsquo
Against this background they can however provide interesting insights into
simulated outcomes
We could also start the paper with a more recent and in-depth assessment by
summarising Brink (2014) He examined the policy settings of twelve
developing and seven developed countries and found that few of these
countries would need to change their settings very much if at all in order to
conform with the rules and commitments of an agreement if it was
implemented immediately as it now stands For market access this is mainly
because the margins between bound tariffs that are the base for negotiations
and actual applied tariffs are large enough to allow the bound rates to remain
larger than the applied rates after a DDA agreement for several countries and
for others the reductions in the applied rates would be quite small This is
accentuated when the use of sensitive and special products is taken into
account Similarly most of the nineteen countries would face no or little
difficulty in complying with constraints on domestic subsidies Those that may
face a challenge include Canada Norway Switzerland Thailand and the
United States as well as possibly Russia and China
56
We shall eschew the obvious question of why the negotiations are so difficult if
there seems to be little pain Perhaps politics holds sway over economic
outcomes in that widely spread and diverse gainers are less visible than the
concentrated and hence more visible (and vocal) losers
2 A precautionary note who stole the gains from trade
liberalisation
A notable feature of the December 2005 WTO Hong Kong Ministerial was the
use and citation of models with the more recent ones at that time showing a
considerable reduction in global welfare gains from trade liberalisation and in
particular an almost-disappearance of the gains to developing countries Why
are the gains shrinking Part of the answer is that some of the assumptions are
being re-visited while the newer version of the GTAP model and its associated
database enables analysts to use better trade and tariff data and incorporate
both the EU expansion and Chinarsquos WTO accession into their updated base
work These combinations are making a huge difference but even so ten years
ago Ackerman (2005) for example detailed how the gains were becoming
both smaller and skewed towards the developed countries rather than poverty
alleviation in the developing world
Using the Version 6 database the World Bank revised the potential benefits
downwards to a miserly $313 per head in the developing world (in contrast to
the $7904 per head in the developed world)4 This work acknowledges the
difficulties associated with anticipating an outcome for the Doha Development
Agenda (DDA) and recognises some of the issues such as sensitive products
the bound versus applied tariffs5 problems of quota rates and preference
erosion and that of defining and disciplining reductions in agricultural supports
in Organisation for Economic and Cooperation Development (OECD)
countries High income countries are the winners and in some instance where
4 Anderson K and Martin W (2005)Note that these gains are not repeatable gains but
rather a once-only step upwards 5 The margins between bound tariffs that are the base for negotiations and actual applied
tariffs are large enough to allow the bound rates to remain larger than the applied rates after
a DDA agreement for several countries and for others the reductions in the applied rates
would be quite small This is accentuated when the use of sensitive and special products is
taken into account
57
special products can be exempted the developing countries as a group actually
lose out
In this World Bank research the gains for South Africa are generally modest
but always positive Under a complete global liberalisation of trade assumption
the global gains from the World Bank analysis were $287 billion with
$13 billion of this going to South Africa (with all exports up by 143 and
imports up by a greater 180 and agricultural exports up by 24 and
imports up by a lesser 11 thus highlighting that most of the gains are from
non-agricultural sectors) We caution that this model used a dynamic recursive
approach which will lead to greater gains than the standard model and thus the
results are not directly comparable to the gains that we will present later in this
paper6 Now moving to a DDA outcome simulation the World Bank gains for
South Africa become very modest but always positive from $01 to
$03 billion There was greater variation in the global outcome with respect to
the agricultural-only gains from $75 billion with full agricultural liberalisation
to a mere $134 billion even using a dynamic model but with generous
allowances for special products As a percentage of real income these South
African gains are similar to those for India but well below those for Thailand
Argentina and Brazil
Another source of information detailing the potential benefits to South Africa
from liberalisation of OECD agricultural policies was the OECD review of
South African agriculture (OECD 2006) They also used the GTAP model but
we must caution that it is based upon Version 5 (1997 base year) and not
Version 6 using the 2001 base year data7 In addition the different assumptions
make it difficult to compare results but with partial global liberalisation in both
agriculture and non-agriculture the South African gain is some $251 million
with around one-third of the South African gains ($88m) coming from
agriculture The most import contributions are from global reforms in wheat
fruit and vegetables dairy products processed sugar and other processed food
sectors
6 Indeed these gains are about three times the standard GTAP global gains of $84 billion as
presented in the same World Bank book in Chapter 2 7 Tralac is now using version 9 but some analysts are still using Version 8 claiming that
Version 9 has too many errors in its African data
58
Polaski (2006) using a very detailed approach found that agricultural
liberalisation benefits only a relatively small subset of developing countries
and global benefits were modest Those benefiting from agricultural liberali-
sation include Brazil Argentina most of Latin America South Africa and
Thailand Accounting for this modest global result is the lsquoSpecial Productsrsquo
For South Africa gains are some $57 million from the DDA agricultural-only
with most of these gains resulting from better sugar marketing conditions
Another paper that examined the plausible impacts of the DDA was that by
Kirkpatrick et al (2006) where they agreed that the economic impact of the
DDA is likely to be modest and smaller than earlier predicted In particular
they were worried that the gains are not shared and in the poorer countries
with Sub-Sahara Africa as the example poverty may worsen as these countries
lose from trade liberalisation on the one hand and on the other face severe
supply constraints that bedevil Africa This is especially so when the dynamic
or second and subsequent effects of the DDA are examined as the developing
countries have the best infrastructure to exploit these advantages If the DDA is
to be a lsquodevelopment roundrsquo then additional measures such as lsquoaid for tradersquo
will need to be implemented
The Swedish Board of Trade (2006) simulated three potential Doha outcomes
using GTAP one core scenario and two scenarios involving more and less far-
reaching liberalisation respectively (with lsquolessrsquo appearing to be a more realistic
scenario) Four elements were included in all scenarios non-agricultural
market access (NAMA) agricultural liberalisation services liberalisation and
trade facilitation For these options three versions of the GTAP model were
used lsquomain modelrsquo lsquostandard GTAPrsquo and lsquodynamic GTAPrsquo The Least
Developed Countries (LDCs) did not make any commitments on manufactures
agriculture and services but they were expected to make commitments in trade
facilitation The estimated potential gain in real global income from this
simulated Doha round were from $46-230 billion per year with the lower
estimate from less liberalisation using the standard GTAP and the higher from
the more far-reaching outcome All countryregional groups gained and the
developing countries including LDCs were the major winners (although with
the somewhat nebulous lsquotrade facilitationrsquo contributing the most to developing
countriesrsquo gains) Gains for South Africa from Doha reform in the less
liberalisation scenario using the standard model were exactly $1 000 million
with 59 of this from Doha NAMA liberalisation 37 from lsquotrade
59
facilitationrsquo and only 3 from agricultural liberalisation (with the remaining
2 from services) Netting out the trade facilitation gains these results (and
using the standard GTAP model and a not-overly optimistic view of a possible
Doha) outcome are consistent with the other research discussed above
In addition there are two other themes pertinent to the analysis of both Free
Trade Agreements(FTAs) and the DDA for Africa These are (a) the question
of tariff revenue loss and (b) the issue of trade creation and trade diversion
For the first issue Sandrey and Jensen (2007) examine the impacts of known
and possible trade agreements that involve Southern African Customs Union
(SACU) and calculate the potential loss of tariff revenues to SACU as
preferences are granted to trading partners They find that this loss will have
major impacts upon Lesothos economy in particular as these tariff revenues
currently comprise half of total government revenues in the Kingdom On the
second issue Sandrey (2006b) takes this a step further and finds that
introducing the trade creation and diversion formulas into the analysis
accentuates the revenue loss problem
Analysts are warning that the projected gains from the DDA and the Economic
Partnership Agreement (EPA) are not what they initially expected (or hoped
for) to be as an updated model database enables factors such as tariff revenue
loss to be factored into recent research and the hopes of anything approaching a
comprehensive DDA agreement are fading With respect to the proposed EPA
the same tariff revenue loss and the related concept of trade creationtrade
diversion is important However more crucially the potential damage to
Africarsquos industrial base the probable reluctance of the EU to make meaningful
reforms to their agricultural sector during the DDA negotiations and the
limitations to take advantage of opportunities imposed by self-inflicted African
infrastructural constraints is casting a shadow that suggests there may even be
losses to at least some African countries from both the EPA and the DDA
This results from a combination of better models that have more recent
information such as the final UR tariffs the full implications of Chinarsquos
accession to the WTO incorporated an ability to model tariff revenues losses
and the impacts of trade creationdiversion effects the consequences of the
erosion of tariff preferences and a lsquoscaling downrsquo of the DDA ambitions that
are now being modelled as more realistic assumptions of any outcome
Virtually all of the recent modelling work is pointing to reduced gains from the
60
DDA and even in some cases for developing countries to losses These same
or similar factors are also contributing to the cautious results that are now
coming from researchers who are looking at the EPA possibilities and
especially so as most African countries at the time had good access into Europe
under CONOTOU8 for developing or the Everything but Arms (EBA) for the
least developed countries (thus there was limited lsquoupsidersquo gain
These results are accentuated by the problems facing Africa in its major
infrastructural and capacity constraints that will severely limit the abilities of
most African countries to take advantage of the new opportunities Africa itself
must address most of these problems and in doing so ensure that aid monies
for these projects are well spent African countries must negotiate hard to
ensure that the development promises of both the DDA and the EPA are in
fact realised To this end they must be vigilant against efforts to use lsquothe old
shell gamersquo of just moving aid already promised into another package
3 South Africa and African research specifically
Sandrey and Jensen 2007 simulated a likely WTO outcome for South Africa
and found that global welfare gains from Doha are estimated to be some
$48 billion with a minor $3 billion of this from agricultural reform and the
dominant $45 billion from the liberalisation of markets for non-agricultural
goods South Africa gains some $340 million with $42 million of this from
agricultural reform and the remainder from non-agricultural reforms They
considered that these results were consistent with those presented in recent
research and reinforced that the shielding of some sensitive and special
products considerably reduces the global gains from agricultural liberalisation
By product the gainers in South Africa are the beef and sheep meat and dairy
products sectors where output and consequently exports increase albeit from
low bases Production and trade in the wheat and sugar sectors decline (where
South Africa largely chose to utilise its protective flexibility in the sugar
8 The Cotonou Agreement is a treaty between the European Union and the African
Caribbean and Pacific Group of States (ACP countries) It was signed in June 2000 in
Cotonou Benins largest city by 78 ACP countries (Cuba did not sign) and the then fifteen
Member States of the European Union
61
sector) Beef exports to the EU and the lsquorest of the worldrsquo are the big export
gainers There was a very slight increase in agricultural imports
Outside of Africa the big gainers were China Japan EU and their lsquorest of the
worldrsquo while the US loses Within the Southern African Customs Union
(SACU) Botswana loses by some $9 million while the lsquorest of SACUrsquo aggre-
gation of Lesotho Namibia and Swaziland gains substantially by $134 million
In addition Sandrey and Jensen report that there are two other themes pertinent
to the analysis of the DDA for Africa These are (a) the question of tariff
revenue loss and (b) the issue of trade creation and trade diversion and both of
these are important and must be considered
Nyhodo (2009) sums up the dilemma that faces some developing countries
with respect to agricultural liberalisation On the one hand it is expected that
liberalisation would increase prices and hence the demand for developing
country imports and the subsequent benefits to terms of trade On the other
hand these same developing countries may lose preferential access and then
face wider compensation from developed country exports Therefore the
outcomes are not unambiguously beneficial to developing countries in general
it is commonly thought that net exporters would gain but net importers would
lose although preference loss may cloud this generalisation Later in the paper
we will look at the example of recent liberalisation in the EUrsquos sugar regime
and report that tralacrsquos computer analysis assessed these changes as making
African traders marginally worse off In general there is a theme that comes
from simulating trade liberalisation and that is that the benefits often flow
disproportionally to those undertaking the liberalisation as resources are
diverted into their most productive use
Overall as Nyhodo notes depending on the distribution of the gains South
Africa may gain or lose from an outcome from the DDA Using the South
Africa PROVIDE model9 he assesses the results for South Africa Importantly
there is a big difference between comprehensive liberalisation and that of
excluding the three crucial commodities of wheat other grains and sugar In
this latter case there are changes to world prices of only between ndash3 and
9 He uses the GLOBE model to firstly assess the wider global impacts of liberalisation before
feeding these results into the PRONIDE model
62
+3 whereas when the excluded three are simulated the changes are signi-
ficantly higher There are also significant differences between global export
prices and global import prices with export prices generally higher as
developed country protection is mitigated
The reported results concentrate upon wheat an import sector and sugar a
sector that used to be export but is now also a significant import sector They
also highlight the complexities of assessing a lsquopricersquo as that depends upon
what price we are actually talking about Perhaps the most important one for
assessing the overall production response is that facing farmers and here their
price increase of 38 for wheat and 047 for sugar is below the increases in
import prices There is a modest increase in production in both of these
commodities in response to the price increase but overall the results seem to be
similarly modest
Examining a wider African perspective Coulibaly et al 2016 reviewed and
modelled Africarsquos priority issues and interests in ongoing WTO negotiations10
They found that an agreement on the DDA in agriculture would have a high
positive impact on growth and welfare in Africa relative to the rest of the
world although they caution that not all African countries gain Importantly the
WTO has to make progress on the three key issues of market access
agricultural support and SampD treatment Estimates of welfare changes under
the proposed Doha scenario for African regions are quite modest and are
estimated at around US$ 83 billion and the study reveals the relative
importance of market access for Africa The net gain to Africa is estimated to
be US$ 320 million under market access reforms compared to US$ 99 million
gains under export subsidy reforms and US$ 4 million under domestic support
reforms
As always the inclusion of Trade Facilitation and removal of non-tariff barriers
(NTBs) in trade liberalisation amplifies the gains from liberalisation Using the
export and import value of time11 it is found that the welfare gains are
10 A perusal of the comprehensive set of references in this paper reaffirms our view that little
has been written on computer modelling research on the DDA agricultural outcome over the
last ten years 11 We caution that there may be an element of double counting here where both import and
export values of time are incorporated into the model
63
respectively estimated to be US$ 44 million and US$ 56 million By estimating
welfare gains using alternative proxies for NTBs the welfare gain varies from
US$ 64 million to US$ 18 billion
They also assess the counter-balancing impacts of recent developments on the
Trans-Atlantic FTA and Trans-Pacific FTA where they are expected to
enhance trade among the participating countries but would have trade diversion
for Africa Here the welfare loses for Africa area round US$ 290 million under
the Trans-Atlantic FTA and US$ 976 million under the Trans-Pacific FTA
Reverting back to more WTO-related changes they found that there would be
substantial gains following the EU CAP reforms of 2014ndash20 compared to the
US Farm Bill of 2014ndash2018 with the CAP reforms estimated as
US$ 72 million welfare gains compared to US$ 16 million for the Farm Bill
Furthermore closer to home the study supports the integration agenda of
African countries with welfare and trade effects under both Tripartite FTA and
Continental FTA with the latter estimated to generate welfare gains at around
US$ 134 billion while for the former welfare gains would be around
US$ 29 billion
Overall their Doha scenario suggested that agricultural-only liberalisation
would generate a global gain of US$ 63 billion with almost half accruing to
the EU 28 and Canada Gains for Africa amount to US$ 826 billion (which is
130 of the total welfare gain) with a mixed outcome as a result of differences
in initial specialisation domestic protection and factor endowment Countries
affected by the erosion of preferences and the changes in relative prices lose
(North Africa Central Africa Zimbabwe Botswana Namibia Cameroon and
Cocircte drsquoIvoire) Conversely Cameroon and Cocircte drsquoIvoire both net agricultural
exporters gained through market access while gains for South Africa are
unexpectedly limited Technically total gains for Africa are almost the same
using either the Swiss or the tiered market access tariff reduction formulas
Also in one of the few other recent analyses of the DDA Decreux and
Fontagneacute 2011 stress that the case of Sub-Saharan Africa (SSA) is important
for the Round and deserves additional comment This region does not liberalise
overall (or only to a very small extent) due to the combined presence of LDCs
Paragraph 6 Annex b countries and other flexibilities conceded to developing
countries In particular improved market access opportunities are usually
limited for SSA countries which already benefit from preferential schemes in
64
some important markets Importantly improved market access granted to SSA
countriesrsquo competitors actually works to decrease some of the SSA countriesrsquo
export prices leading to terms of trade losses and reduced domestic production
for SSA countries
4 Sugar reforms
The global sugar sector operates on a stage that includes (a) highly protected
sectors in some developed countries that concentrate upon beet sugar
production and (b) the cane sugar producers who generally but not always
operate in more open production and trade regime in generally but again not
always in developing countries Despite the complex and restrictive trade
policies of many countries sugar trade plays an important role in global
agricultural trade and indeed during the 2011 sugar price spike it was the 4th
most traded agricultural product by value at the HS 4 level South Africa has
generally been marginally ahead of Swaziland as the top African global
exporter of sugar with these two also being the top intra-African sugar
exporters Algeria was the main African importer of sugar during 2014
followed by Sudan (both North and South combined) and Nigeria and overall
Africa is a net importer of sugar
Jensen and Sandrey 2015b analysed the impacts of reforms in the EU sugar
sector upon this African production and trade using the GTAP computer
model They found that production in the EU increased by 529 African
exports to the EU declined by 14 and by 108 in total to markets outside of
Africa as the increased EU competition puts pressure on Africarsquos traditional
markets Production declined across the board in Africa and the trade results
mirrored the production affects with all African exports declining in the face of
an 11 increase in EU global exports and a loss of markets in the EU Changes
are marginal for intra-African trade although there is a decline of 14 to the
EU and displacement by the EUrsquos global export increase of 11 displaces
African exports Thus reforms in developed country markets are not
necessarily good news for African producers They also extended this research
to assess the implications of agricultural tariffs on intra-African trade going to
zero (after factoring the EU reforms into the model) Here the results confirm
that these agricultural-only reforms are dominated by changes in the African
sugar production and trade profiles The big gainers are South Africa from
65
enhanced sugar exports to mainly Kenya and Kenya itself as resources are
diverted away from its inefficient sugar sector
5 Related issues
While not specifically on the WTO agricultural and Africa theme the issue of
trade facilitation is one that is attracting increased attention in the WTO Jensen
and Sandrey 2015c examined the issue of lsquotime in transitrsquo to proxy
infrastructural deficits in Africa such as delays at border crossings roadblocks
for trucks and the necessity to pay bribes African countries are well aware of
these problems and trade facilitation was the main outcome from the 2013 Bali
WTO Ministerial Conference The agreement was to streamline customs
procedures and minimise delays at borders ndash with Africa expected to be the
main beneficiary World Bank researchers and others have combined to
produce a database of per day ad valorem costs to use in GTAP with these
estimates provided in ad valorem equivalents of the per day costs along with
the number of days involved and Jensen and Sandrey used the Singapore
international best-practice benchmark of four days for imports and assessed a
reduction of 20 in the days over and above this benchmark for African
imports
The welfare gains to Africa were substantial For South Africa they are some
US$ 8519 million in real terms and as is usually the case this is the most
significant result for both Africa and the total worldwide gain of
US$ 31231 million Following close behind are the very large gains to Nigeria
and the rest of Africa aggregation In direct contrast to our tariff elimination
scenarios there are gains to many of the large economies outside Africa as
their export prices rise in response to more efficient transit times in Africa The
striking feature from the results is that almost all of the gains to each country
overwhelmingly accrue to that same country and that (a) these gains are
substantial (b) they mostly accrue to the liberaliser and (c) in only taking 20
of the costs of time over and above an international benchmark we are leaving
plenty of room for improvement in most African countries
Similarly while not strictly speaking a WTO issue Jensen and Sandrey
(2015a) used the GTAP computer database and the full suite of African
agricultural sectors and African countriesregions in order to assess the benefits
of intra-African tariff abolition in agricultural trade across the continent This
66
research suggests that Africa has as much to gain from its own continental
liberalisation of agricultural trade as it does from relying on the WTO
South Africa was the leading beneficiary with the economy at 2015 being
some US$ 1840 million better off than it would otherwise have been Kenya is
the next largest African gainer followed by Senegal and Cocircte dIvoire The key
agricultural sectors were vegetables fruits and nuts crops (other) red meat
vegetable oils and fats dairy products refined sugar and associated products
food products not classified elsewhere and beverages and tobacco Overall the
largest impact was felt in the vegetable oils and fats sector with Cocircte dIvoire
and Kenya the African gainers Perhaps the more interesting and important
outcome however was in the sugar sector as reported above Changes in other
sectors are often dominated by South Africa They found that Kenya Tanzania
Zimbabwe and the rest of Africa lose significant tariff revenues that would
have to be adjusted for in some way and that Zimbabwe and to a lesser extent
Tanzania were the big losers overall
In addition tralac has undertaken significant research on non-tariff issues in
both analytical modelling and related survey work These barriers are
significant and not reported here as they are the subject of a separate Chapter
67
References
Ackerman F 2005 The shrinking gains from Trade A critical assessment of
Doha Round projections Global development and Environment Institute
Working Paper No 05-01 Tufts University October 2005
Anderson K and Martin W (Editors) 2005 Agricultural Trade reform amp the
Doha Development Agenda Washington DC World Bank
Brink R 2014Commitments under the WTO Agreement on Agriculture and
the Doha Draft Modalities How do they compare to current policy Paper
prepared as a background document for the OECD Global Forum on
Agriculture Issues in Agricultural Trade Policy 2 December 2014 Paris At
httpswwwoecdorgtadeventsAL-Brinkpdf
Coulibaly A El-Helepi M Chikhuri K and Tariq Ali2016 The Doha
agenda Whatrsquos in it for Africa and what next for secured development
outcomes and fast integration imperatives Draft Paper Prepared for the 19th
Annual Conference on Global Economic Analysis Washington D C
Decreux Y and L Fontagneacute Economic Impact of Potential Outcome of the
DDA II CEPII-CIREM October 2011
Jensen H G and Sandrey R 2015aTrade liberalisation in Africa a GTAP
analysis of intra-African agricultural tariffs going to zero tralac Working
Paper 27 Nov 2015
Jensen H G and Sandrey R 2015b The impact of EU reforms on African
sugar production and trade a GTAP analysis tralac Trade Brief 4 Nov 2015
Jensen H G and Sandrey R 2015c The Continental Free Trade Area ndash A
GTAP assessment tralac E-Book at httpwwwtralacorgpublications
bookshtml17 Apr 2015
Kinnman Susanna and Magnus Lodefalk Economic implications of the Doha
round Paper presented to 9th Annual GTAP Conference Addis Ababa
Ethiopia June 2006
68
Kirkpatrick Colin Clive George and Serban Scrieciu Sustainability Impact
Assessment of Proposed WTO Negotiations Institute for Development policy
and Management University of Manchester May 2006
National Board of Trade Stockholm Sweden Economic Implications of the
Doha Round (2006)httpwwwkommerssetemplatesAnalyseraspxid=15
Nyhodo B 2009The impact of the WTO round of agricultural negotiations on
the South African economy Master thesis from the Department of Agricultural
Economics Stellenbosch University March 2009
OECD (2006) OECD Review of Agricultural Policies South Africa 2006
OECD Publishing Paris DOI httpdxdoiorg1017879789264021907-en
Osakwe PN 2006 Emerging Issues and Concerns of African Countries in the
WTO Negotiations on Agriculture and the Doha Round Addis Ababa Trade
and Regional Integration Division (UNECA)
Polaski Sandra 2006 Winners and Losers Impact of the Doha Round
Carnegie Endowment for International Peace Washington D C
Sandrey R 2006a Agriculture and the World Trade Organization ndash 10 Years
On tralac Working Paper No 12006 January 2006
Sandrey R 2006b Trade Creation and Trade Diversion Resulting from SACU
trading Agreements[Online] wwwtralacorg
Sandrey R and Jensen H G 2007South African agriculture a possible WTO
outcome and FTA policy space ndash a modelling approach Chapter 5 in Sandrey
et al 2007South Africarsquos way ahead Trade Policy options tralac and AusAid
2007
69
Chapter 4
How the Agreement on Agricultural might
improve the South African Agricultural
Forestry and Fisheries Trade performance
Moses Lubinga Yolanda Potelwa Ron Sandrey
and William Mwanza
1 Introduction
This paper examines the export trade profiles of the South African agricultural
forestry and fisheries sectors to assess where the WTO may be able to improve
market access for these exports We have extended the traditional agricultural
sector to include the forestry and fisheries sectors as although classified as
manufacturing sectors in the WTO these two sectors are under the auspices of
the Department of Agriculture Forestry and Fisheries (DAFF) in South Africa
We analyse market access conditions only An earlier chapter in this book
shows that it is through market access that the major overall gains may come
from the WTO for agriculture while for fisheries the WTO does not investigate
subsidy supports to member countries
For the agricultural sector we find that a significant portion of exports from
South Africa is destined either for the EU or for fellow African destinations
We consider that for the former any gains for market access are likely to come
from direct negotiations under the auspices of the Trade and Development
Cooperation Agreement (TDCA) rather than multilateral agreements In fact a
multilateral agreement improving EU market access conditions for South
African competitors is likely to reduce South African preferential access
conditions and therefore be of little or no value to South Africa Similarly with
Africa becoming an increasingly important destination for South African
agriculture we consider that access conditions are much more likely to
70
improve with direct negotiations through the SDAC FTA the TrindashPartite FTA
or the Continental FTA As most African WTO members are least developed
countries they are very unlikely to have to make market access concessions
under any foreseeable WTO outcome and any that they do make are once
again likely to reduce possible preferences for South Africa
We confirm this general picture by analysis of the top-10 agricultural exports at
the HS 4 level into the top-10 export destinations We find that fellow SACU
destinations of Botswana Lesotho Namibia and Swaziland all of whom are in
the top-10 destinations are all duty-free under the SACU agreement and
Zambia only applies duties on exports of South African citrus fruits and even
here the rate is under 1 Both Mozambique and Zimbabwe have a mixture of
zero low and modest rates This leaves the three top-10 destinations of the EU
China and the US The same general pattern of a mixture of zero low and
modest rates also applies to US applied tariffs for South Africa with cane
sugar and related products being the sectors where access conditions could
improve We have observed that the TDCA governs access conditions for
South Africarsquos premiere market of the EU and note that despite this bilateral
agreement most of the exports to the EU have duties assessed In particular the
sugar tariff is 3773 This leaves China as the outlier where tariff rates are all
double figures Our analysis of course ignores possible markets where lsquotrade
chillingrsquo inhibits or prohibits exports from South Africa although as a
generalisation we consider that these cases may be limited to sugar and
associated products
For the forestry exports the situation is less complex Again examining the
major markets by the major commodities we find that the exports to the EU
Japan Namibia Botswana and Mozambique are all duty-free The same
conditions apply to exports into both Indonesia and Thailand where virtually
the only products of wood pulp are also duty-free This leaves the major market
for 2015 of China and India and Zimbabwe For China exports of wood pulp
the dominant export and the next most important wood chips are all duty-free
leaving only modest exports of paper and paperboard facing tariffs of 412
For India exports duties are 50 except for some negligible trade at
10Zimbabwe imports a wider range of forestry products and here the tariffs
are generally either at or near duty-free or at or near 10 Overall there are
very few exports facing duties in the major markets other than India or
Zimbabwe
71
Five of the 11 major markets for South African seafood exports are duty-free
namely Hong Kong USA Namibia Botswana and Mauritius Mozambique
imposes a 20 duty on crustaceans but otherwise is duty-free Despite the
TDCA the EU again the major market levies duties ranging from 315 to
1570 and again the appropriate negotiating process is through the TDCA
This leaves the minor markets of Japan Vietnam Australia and Taiwan
(Chinese Taipei) Japan imposes tariffs ranging from 192 to 1039
Vietnam has duties of 761 and 567 on its two import lines Australia has
only one dutiable import line at 281 and Taiwan has duties ranging up to
1953 Thus the major access concerns are the EU Mozambiquersquos
crustaceans and to a lesser extent Japan Lesser but still important access
issues remain with Vietnam and Taiwan
Overall we see few cases where the WTO negotiations may improve South
Africarsquos access conditions into the major markets for these exports In all cases
the EU is the top destination and except for forestry products access
conditions are generally constrained Africa is becoming increasingly
important and here the access conditions are more likely to improve through
direct intra-African agreements in the different negotiations that are in
progress In particular Zimbabwe remains problematical
In April 1994 contracting parties to the General Agreement on Tariffs and
Trade (GATT) including South Africa officially signed the Marrakesh
Declaration which established the World Trade Organization (WTO) as an
institutional framework for overseeing further trade negotiation rounds and
adjudicating trade disputes The declaration also formalised the successful
conclusion of the seven-year Uruguay Round (UR) of multilateral trade
negotiations a Round where agricultural products were comprehensively
included for the first time Subsequently agricultural trade was subject to less
discrimination though it is still regarded as the poor cousin of trade in
industrial or manufactured goods with respect to protection levels Arguably
the AoA set the scene for a radical change in the way agriculture is globally
supported and traded and as shown in an earlier chapter it has had a significant
effect in bringing down domestic subsidies and lowering access barriers in
developed markets for least developed countries and effectively ending export
subsidies This paper will however explore what the WTO may do for the
South African agriculture forestry and fisheries sectors in the future
72
Sandrey 2006 assessed the impacts of the AoA on the South African sector ten
years after the establishment of the WTO He concluded that although the
policies and the resultant institutional framework the new South Africa
inherited as it emerged from the troubled years of the apartheid era still heavily
influenced South African agriculture there had been major changes over the 10
years to 2006 These changes included land reform programmes the intro-
duction of minimum wages and other employment conditions for farm
workers the deregulation of the Control Boards substantial liberalisation of
international trade and the withdrawal of a large proportion of the farmer
support services provided to commercial and small-scale farmers alike The
AoA influenced the agricultural sector in South Africa through several
different channels such as domestic policy (with tariff policy as sub-set) and
offshore market access conditions although arguably domestic policy reforms
went beyond any changes mandated by the UR
The objective of this paper is to evaluate the impact of South African agri-
cultural trade performance since the inception of the Agreement on Agriculture
(AoA) the background to which is outlined an earlier chapter and will not be
repeated here Our analysis includes both the forestry and fishery sectors as
DAFF administer both of these sectors
2 The Agriculture Forestry and Fishery (AFF) Export Trade
profiles from South Africa
Following the Uruguay Round of the WTO and the subsequent AoA South
African agriculture entered a new era came into part through the removal of
imports quota and tariff in their borders with an objective of increasing South
Africarsquos participation and export competition in the global market Figure 1
shows the AFF trade performance between 1996 and 2015 and since the
implementation of AoA South Africarsquos AFF trade has improved at an average
of 12 In most years exports have been marginally above imports leading to
a small positive trade balance as shown
73
Figure 1 South African AFF trade performance
Source World Trade Atlas
In this section we will look at the South African Agriculture Forestry and
Fishery trade in a more comprehensive analysis of South Africarsquos overall
export trade performance in recent years We have limited our analysis to the
years between 2010 and 2015 as it was only in 2010 that intra-SACU trade
data became accessible and reliable
21 The agricultural export profile
This section focuses on the agricultural exports from South Africa into the
world between the period in 2010 and 2015 Table 1 profiles South Africarsquos
agricultural exports where overall these exports increased by 47 from
R62 billion in 2010 to R116 billion in 2015 The EU has consistently been the
largest destination since 2010 taking some R299 billion in 2015 Namibia has
been the second largest destination with R93 billion in 2015 followed by
Botswana Mozambique and China with a 2015 total of R68 billion
R58 billion and R52 billion respectively
74
Table 1 South Africarsquos Top 10 export destinations (Agriculture) R millions
Importers 2010 2011 2012 2013 2014 2015
World 62103 65051 74907 93462 107613 116629
EU 28 16819 16908 18153 24598 27017 29952
Namibia 5628 6148 6552 7572 8503 9377
Botswana 4691 4811 5419 6037 6305 6830
Mozambique 2395 2473 2815 4313 5523 5844
China 1374 1642 2543 3579 4324 5322
Zimbabwe 3452 4189 5023 5268 5314 5227
Lesotho 2381 2668 3132 3508 3747 4091
Zambia 1071 1244 1729 2370 3190 3716
USA 1768 1744 2087 2385 3020 3605
UAE 1409 1477 1757 2266 3022 3587
Source International Trade Commission (ITC) TradeMap
The agricultural products used are based on the definition of the WTO which
excludes fish and forestry products It also includes various degrees of
processing for different commodities in agriculture Table 2 shows these same
destinations by percentage share The EU of course dominates and has done
across the period with relatively consistent shares from a high of 27 in 2010
to a low of 24 in 2012The table highlights the importance of the SACU and
SADC countries most of whom who have similarly been relatively consistent
destinations Increasing Chinese and UAE shares complete the main features of
the table
75
Table 2 Percentage shares () of South Africarsquos Top 10 agricultural export
destinations
Importers 2010 2011 2012 2013 2014 2015
EU-28 27 26 24 26 25 26
Namibia 9 9 9 8 8 8
Botswana 8 7 7 6 6 6
Mozambique 4 4 4 5 5 5
China 2 3 3 4 4 5
Zimbabwe 6 6 7 6 5 4
Lesotho 4 4 4 4 3 4
Zambia 2 2 2 3 3 3
USA 3 3 3 3 3 3
UAE 2 2 2 2 3 3
Source ITC TradeMap
Table 3 introduces the main South African agricultural exports by HS 4 for
2010 to 2015 inclusive with the data expressed in R million Citrus fruit has
been ranked number one since 2010 with exports of R137 billion in 2015
Wine grapes and apples (pome fruit) followed these fruits in 2015 Note that
sugar was among the top ten agricultural exports and although South Africa
exported significant quantities of sugar it was a nett importer of sugar in 2015
76
Table 3 South Africarsquos Top 10 agricultural exports R millions
Value in Million Rand
Code Product label 2010 2011 2012 2013 2014 2015
Agricultural Products 62103 65026 74907 93462 107613 116628
0805 Citrus fruit 6686 6840 7388 9342 11625 13694
2204 Wine 6075 5795 6314 8340 8509 8733
0806 Grapes 3654 3385 4093 4986 6286 7418
0808 Pome fruit 3161 3457 4053 6100 5892 6975
0802 Nuts nes 740 1013 1349 1808 2721 3864
2009 Fruit amp vegetable
juices 2111 2260 2535 3007 3568 3670
5101 Wool 1300 2091 2385 2920 2834 3178
2106 Food preparations
nes 1178 1426 1560 1753 2277 2521
2008 Preserved fruits nes 1 601 1423 1604 1849 2033 2395
1701 Cane Sugar 2664 2283 2716 4278 4592 1998
Source ITC TradeMap
The data for these top 10 commodities is expressed in of export market
shares in Table 4 Over the period citrus (0805) became more important
increasing in market share from 1077 in 2010 to 1174 in 2015 and we
may add that this increase took place in a competitive global market Wine in a
similarly competitive market has been losing market share ndash from 978 in
2010 to 749 in 2015 Similarly sugar has also been losing the market share
from 429 in 2010 to 17 in 201512 Most other HS 4 lines are relatively
stable
12 We add that 2015 was a year beset by adverse climatic conditions that altered exports of
sugar and maize in particular
77
We next combine these tables to show the matrix of Table 5 where the main
destinations are paired with the main exported products The EU-28 is the main
destination for all the top ten agricultural products except where the USA for
nuts etc and the SACUSADC destinations for both food preparations and
sugar dispose it from the top position China is an important market for wool
and fruits and wine Note that the four SACU partners of Namibia Botswana
Lesotho and Swaziland all appear in this top destinations list
Table 4 Percentage share of South Africarsquos Top 10 agricultural exports shares
Code Product label 2010 2011 2012 2013 2014 2015
0805 Citrus fruit 1077 1052 986 10 108 1174
2204 Wine 978 891 843 892 791 749
0806 Grapes 589 521 546 54 584 636
0808 Pome fruit 509 532 541 653 548 598
0802 Nuts nes 119 156 18 193 253 331
2009 Fruit amp vegetable juices 34 348 339 322 332 315
5101 Wool 209 322 318 312 263 272
2106 Food preparations nes 19 219 208 188 212 216
2008 Preserved fruits nes 258 219 214 198 189 205
1701 Sugar cane 429 351 363 458 427 171
Source ITC TradeMap
78
Table 5 Matrix for main agricultural exports and main export markets (Million Rand)
Source ITC TradeMap
HS 4 EU 28 Namibia Botswana China Mozambique Zimbabwe Lesotho Zambia Swaziland USA
0805 Citrus fruit 5117 31 21 499 54 5 13 34 14 504
2204 Wine 4917 416 82 455 150 46 24 60 41 513
0806 Grapes 5126 14 16 52 11 43 3 10 5 96
0808 Pome fruit 2435 76 103 5 52 66 25 94 37 17
0802 Nuts nes 616 14 10 282 3 3 1 2 5 831
2009 Fruitveg
juices 691 383 406 31 318 180 98 157 85 92
5101 Wool 695 0 0 2237 1 0 1 0 0 5
2106 Food
preparations 121 170 181 0 311 395 55 325 103 12
2008 Preserved
fruit nes 741 50 66 187 11 14 16 14 30 93
1701 Cane Sugar 16 681 347 1 348 133 114 1 7 13
79
Table 6 shows the tariff rates associated with these exports We have deleted
Botswana Lesotho Namibia and Swaziland as they are all duty-free under the
SACU agreement Note in particular that despite the TDCA between South
Africa and the EU most of the exports to the EU have a duty assessed into that
market and in particular the sugar tariff is 3773 Rates into China are all
double figures and it is worth reporting here that the main Southern
Hemisphere competitors of Australia and New Zealand have significant tariff
advantages over China in these products thanks to their FTAs Zambia is
largely duty-free while both Mozambique and Zimbabwe have a mixture of
zero low and modest rates We see the same general pattern in the US applied
tariffs
Table 6 Matrix of applied tariff rates for main exports into main markets ()
Source ITC TradeMap
22 Fisheries exports
Shown in Table 7 are South Africarsquos fishery exports by destination expressed
in R million and they highlight that between 2010 and 2015 these exports to
the world grew from R39 to R59 billion EU consistently and dominantly
ranked in 1st place among these top 10 importers registering an amount of
HS 4 EU
28 China Mozambique Zimbabwe Zambia USA
0805 Citrus fruit 777 1152 1058 0 096 022
2204 Wine 338 1474 0 1004 0 138
0806 Grapes 0 1257 0 220 0 0
0808 Pome fruit 749 1116 1362 0 0 0
0802 Nuts nes 0 1402 0 724 0 014
2009 Fruitveg
juices 809 2089 0 325 0 008
5101 Wool 0 380 0 0 0 062
2106 Food
preparations 389 1701 1062 028 0 942
2008 Preserved
fruit nes 207 1599 150 0 0 809
1701 Cane Sugar 3773 500 353 554 0 1073
80
R27 billion in 2015 Next in 2015 were Hong Kong Vietnam and the USA
According to the ITC South Africa ranked as the 24th largest global exporter of
HS 03 the standard finfish category with a 04 global share
Table 7 South Africarsquos Top 10 export destinations of fish amp related products
R million
Importers Value in Million Rand
World 3908 4220 4368 5015 6098 5971
EU-28 1837 1934 1885 2033 2671 2695
Hong Kong 551 502 542 618 617 731
Vietnam 4 178 19 147 317 365
USA 192 187 230 296 329 321
Australia 181 221 264 329 276 255
Mozambique 50 66 97 125 184 162
Namibia 139 141 136 154 162 161
Mauritius 62 62 62 90 159 144
Botswana 86 74 106 117 129 141
Taipei Chinese 33 35 47 77 109 119
Japan 120 139 137 139 186 111
Source ITC TradeMap
The EU share has remained consistently around 45 of South Africarsquos total
fishery exports to the world over the period Exports to Vietnam and
Mozambique have increased relative to the total thus increasing their market
share while conversely exports to Hong Kong have declined relative to the
total (thus declining market shares)
81
Table 8 Percentage () share of South Africarsquos Top 10 export destinations (fish)
Importers 2010 2011 2012 2013 2014 2015
EU 28 47 46 43 41 44 45
Hong Kong 14 12 12 12 10 12
Vietnam 011 004 05 3 5 6
USA 5 4 5 6 5 5
Australia 5 5 6 7 5 4
Mozambique 1 2 2 3 3 3
Namibia 4 3 3 3 3 3
Mauritius 2 1 1 2 3 2
Botswana 2 2 2 2 2 2
Taipei Chinese 08 08 1 2 2 2
Japan 3 3 3 3 3 2
Source ITC TradeMap
In monetary terms Table 9 shows the top 10 fishery exports from South Africa
Frozen fish was ranked as the largest export fishery products with the total
amount of R14 billion in 2015Frozen fish fillets was ranked as the second
largest exported fishery product with an amount of R12 billion followed by
molluscs and crustaceans with totals of R115 billion and R990 million
respectively in 2015
Table 9 South Africarsquos Top 10 fishery product exports R million
Code Product label 2010 2011 2012 2013 2014 2015
Fishery products 3908 4220 4368 5015 6098 5971
0303 Whole fish frozen 870 966 992 1185 1429 1456
0304 Fish fillets 724 807 906 1079 1410 1278
0307 Molluscs 801 785 732 659 920 1158
0306 Crustaceans 649 686 722 913 1110 990
1604 Prepared fish amp caviar 365 431 559 657 654 520
0302 Whole fish fresh 293 306 254 230 250 233
1605 Prepared crustaceans amp
molluscs 67 101 68 149 178 208
0305 Smoked fish 104 91 97 98 105 92
1603 Extracts crustaceans amp
molluscs 2 2 4 4 17 11
Source ITC TradeMap
82
Since 2011 the whole fish frozen was ranked as the largest fish export with a
positive growth of export share except for the minor decline in 2012 (see table
10) Fish fillets and crustaceans showed significant declines of export shares by
17 and 16 respectively between 2014 and 2015 The molluscs has been
showing positive export share growth from 132 in 2013 to 194 in 2015
Table 10 Percentage share of South Africarsquos Top 10 export destinations (fish)
Code Product label 2010 2011 2012 2013 2014 2015
0303 Whole fish frozen 223 229 227 236 234 244
0304 Fish fillets 185 191 207 215 231 214
0307 Molluscs 205 186 168 132 151 194
0306 Crustaceans 166 163 165 182 182 166
1604 Prepared fish amp caviar 93 102 128 131 107 87
0302 Whole fish fresh 75 73 58 46 41 39
1605 Prepared crustaceans amp
molluscs 17 24 16 30 29 35
0305 Smoked fish 27 22 22 20 17 16
1603 Extracts crustaceans amp
molluscs 01 01 01 01 03 02
Source ITC TradeMap
Table 11 introduces the matrix where the main destinations are displayed along
with the main exported products The EU market is the largest importer with
imports of fish fillets crustaceans and prepared fish and caviar amounts of
R783 million R960 million and R643 million respectively in 2015
83
Table 11 Matrix for fish exports and main markets (Value in million Rand)
EU
28
Hong
Kong USA Mozambique Namibia Botswana Japan Vietnam Australia Mauritius Taiwan
HS 4 Total 2692 730 322 162 156 126 65 28 20 10 9
0306 Crustaceans 46 173 180 1 14 3 6 28
3
0303 Whole frozen 783 16 65 148 29 11 4
8 2
0302 Whole fish fresh 112
43 2 8 6 14
0304 Fish fillets 960
32 5 32 14
12
0307 Molluscs 643 351 2 1 10 1 33
5
0301 Live fish 2
2
1604 Prepared fish caviar 146 1
4 56 88
5 2
0305 Smoked Fish
22
1 3 1 7
3
1603 Extracts
1
1605 Prepared crust
molluscs 167 4 1
Source ITC TradeMap
84
Table 12 shows the duties faced by South Africa in these markets and this
follows directly from the matrix table above Note that excluded are Hong
Kong USA Mozambique Namibia Botswana and Mauritius as all exports
were reported as duty-free into these markets Hong Kong was duty-free except
for a minimal 009 levied on smoked fish while only one line faced duty into
Australia All fisheries products into the EU faced duties and here it would be
logical that any improvement in access conditions should be pursued through
TDCA negotiations with the EU and not through the WTO as the latter may
erode preferences Some duties into Japan are moderate to high while those
into Taiwan (Chinese Taipei) are very high
Table 12 Matrix for fish exports and main markets (Value in million Rand)
EU
28
Hong
Kong Japan Vietnam Australia Taiwan
HS 4 Total
0306 Crustaceans 593 0 266 567 1953
0303 Whole frozen 515 0 434 1816
0302 Whole fish fresh 315 0 411
0304 Fish fillets 688 0
0307 Molluscs 371 0 818 3023
0301 Live fish 732 192
1604 Prepared fish
caviar 1570 0 281
0305 Smoked fish 009 1039 0
Source ITC TradeMap
23 Exports of Forestry products
As shown in Table 13 the exports of South African forestry products totalled
R258 billion in 2015 with China rising to be the leading destination The EU
has been a consistent destination while Indonesia was important during 2011
in particular Closer to home the four African destinations of Namibia
Botswana Zimbabwe and Mozambique have also featured
85
Table 13 South Africarsquos Top 10 export destinations (Forestry)
Values in million Rand
Importers 2010 2011 2012 2013 2014 2015
World 17164 18596 17178 19262 23669 25859
EU 28 2553 2389 2316 2372 3223 3166
China 726 1266 1391 2187 3857 4081
Japan 1508 1652 1375 1504 1627 2114
India 408 568 509 846 968 2046
Namibia 1223 1391 1456 1537 1759 1899
Indonesia 1970 2647 1893 1824 1646 1581
Botswana 1161 1244 1236 1251 1386 1379
Zimbabwe 718 806 897 1053 1163 1207
Mozambique 468 556 599 801 1103 1011
Thailand 658 611 597 526 725 923
Source ITC TradeMap
Table 14 represents this same data displayed as percentage shares for the main
destination for forestry products As observed earlier with agriculture and
fishery exports the EU had been the dominant export destination market
although its shares have been stable to perhaps declining and it has been
overtaken by the rapidly rising exports to China Indonesiarsquos declining share is
apparent as is the rise in the share of exports to India Other markets are
relatively stable
86
Table 14 Percentage share of South Africarsquos Top 10 export destinations (forestry)
Importers 2010 2011 2012 2013 2014 2015
EU 28 1488 1285 1348 1232 1362 1225
China 423 681 810 1136 1630 1578
Japan 879 889 801 71 688 818
India 238 306 297 440 409 791
Namibia 713 748 848 798 744 734
Indonesia 1148 1423 1102 947 695 612
Botswana 67 669 720 649 586 533
Zimbabwe 418 434 523 547 491 467
Mozambique 273 3 349 416 466 391
Thailand 384 33 348 273 307 357
Source ITC TradeMap
The main HS 4 categories are shown in Table15 with chemical wood pulp
ranked as the largest individual product in 2015 with exports of R87 billion
Uncoated kraft paper was ranked as the second largest exported forestry
products with an amount of R26 billion followed by packing containers and
chemical wood pulp with totals of R265 billion and R13 billion in 2015 The
same data is presented in terms of the percentage shares in Table 16
87
Table 15 Top 10 forestry exports
Million Rand
Code Product label 2010 2011 2012 2013 2014 2015
Forestry Products 17163 18596 17178 19262 23669 25859
4702 Chemical wood pulp 4340 5597 4696 5861 8009 8706
4401 Wood chips etc 1816 1715 1438 1638 1979 2626
4804 Uncoated kraft paper 1706 1959 1968 1908 2240 2514
4819 Packing containers 979 925 958 1107 1262 1322
4703 Chemical wood pulp 1085 1210 754 691 865 1257
4802 Uncoated paper 1438 1004 1067 1040 1178 937
4403 Logs 184 284 433 493 814 713
4901 Printed books and
brochures 676 687 594 659 625 702
4418 Builders specialist timber 412 465 457 476 633 687
4805 Uncoated paper 201 236 279 347 461 593
Source ITC TradeMap
Table 16 Percentage share South Africarsquos Top 10 forestry product exports
Code Product label 2010 2011 2012 2013 2014 2015
Forestry Products 29 24 21 21 24 25
4702 Chemical wood pulp 253 301 273 304 338 337
4401 Wood chips etc 106 92 84 85 84 102
4804 Uncoated kraft paper 99 105 115 99 95 97
4819 Packing containers 57 50 56 57 53 51
4703 Chemical wood pulp 63 65 44 36 37 49
4802 Uncoated paper 84 54 62 54 50 36
4403 Logs 11 15 25 26 34 28
4901 Printed books and brochures 39 37 35 34 26 27
4418 Builders specialist timber 24 25 27 25 27 27
4805 Uncoated paper 12 13 16 18 19 23
Source ITC TradeMap
88
Table 17 Matrix for forestry exports and main export markets for 2015 (value in million Rands)
Source ITC TradeMap Note that the 2015 totals are updated by the ITC They may not necessarily reconcile exactly with earlier tables
HS 4 Product label EU China Japan India Namibia Indonesia Botswana Zimbabwe Mozambique Thailand Total
Forestry 3211 4139 2145 2075 1922 1604 1392 1211 1019 936 75
4702 Chemical pulp 1081 3234 140 1630 0 1438 0 0 21 710 93
4401 Wood chips etc 14 169 2003 318 2 0 6 1 2 0 94
4804 Paperpaperboard 1556 37 0 1 80 2 46 138 15 0 74
4703 Chemical pulp 0 681 0 0 0 159 0 0 0 218 83
4819 Packing
containers 35 1 0 22 252 0 198 149 256 0 68
4418 Builders timber 150 0 0 0 122 0 127 20 41 0 66
4407 Sawn wood 7 0 0 1 137 0 157 5 129 0 78
4818 Toilet paper etc 1 0 0 0 161 0 123 48 56 0 70
4802 Uncoated paper 6 0 0 0 76 0 79 124 64 0 37
4403 Logs 20 5 0 1 117 0 91 3 101 0 47
4901 Books etc 44 0 0 0 134 0 49 44 28 0 42
4820 Registers etc 6 0 0 1 71 0 46 115 22 0 62
4805 Paperpaperboard 17 0 0 3 39 0 17 121 9 1 34
to Destination 91 100 100 95 62 100 67 64 73 99
89
The data in Table 17 shows that the matrix of the top 13 export lines from
South Africa represents 75 of the total forestry exports for 2015 (right hand
column) The African destinations of Namibia Botswana and Zimbabwe show
that only 62 to 67 of the total exports are in the table and similarly the
exports of HS 4805 and HS 4802 show that only 34 and 37 respectively of
the exports are similarly in the table An examination of the data shows that of
HS 4802 and HS 4805 almost all of the missing exports are to African
destinations not represented in the table Exports to China Japan Indonesia
and Thailand are conversely all shown in the table (100 in bottom line) and
furthermore these exports are effectively in only two product lines for Japan
Indonesia and Thailand Conversely the EU and the African destinations
shown all report trade in most product lines
The tariff rates associated with this export trade in forestry products are shown
in Table 18 below As all exports to the EU Japan Botswana Namibia and
Mozambique are duty-free they are not shown while an lsquoxrsquo denotes no trade
reported in that line Tariffs into China Indonesia and Thailand are modest
while those into India are based at 50 or 100 and those into Zimbabwe
vary significantly and range from zero or very low to around 11
Table 18 Tariff rates into major markets by major products
Source ITC Trade Map
HS 4 Product label China India Indonesia Zimbabwe Thailand
4702 Chemical pulp 0 50 x x 0
4401 Wood chips etc 0 50 x 0 x
4804 Paperpaperboard 412 100 487 50 x
4703 Chemical pulp 0 x 0 x 0
4819 Packing containers 578 102 x 854 x
4418 Builders timber x x x 1125 x
4407 Sawn wood x 100 x 0 x
4818 Toilet paper etc x x x 1152 x
4802 Uncoated paper x x x 073 x
4403 Logs 0 50 x 036 x
4901 Books etc x x x 0 x
4820 Registers etc x 100 x 100 x
4805 Paperpaperboard x 100 x 0 50
90
Chapter 5
The Agriculture Negotiations At the World
Trade Organisation An update after the
Nairobi Ministerial Conference
Miriam W O Omolo
1 Introduction
The World Trade Organization (WTO) is considered the largest trading bloc
with the goal of facilitating a free global trading system Multilateral
negotiations began after World War II with the objective of establishing an
umbrella body International Trade Organization (ITO) parallel to the Breton
Woods Institutions Due to political difficulties the ITO was never established
A group of 2313 countries began trade negotiations under a provisional set of
rules known as the General Agreement on Trade and Tariffs (GATT)14 and in
1995 the WTO was created while the GATT rules remained in force The
fundamental differences between GATT and the WTO are while GATT was
an agreement the WTO is an international organization which is concerned
with members following the trade rules set out The GATT was concerned with
trade in goods and tariff reductions only
The stylised process used to gain progress in international negotiations is called
the trade round Countries meet together to negotiate a set of tariff reductions
and other measures that liberalise trade There have been eight trade rounds
13 The countries include Australia Belgium Brazil Burma Canada Ceylon Chile China
Cuba Czechoslovakia France India Lebanon Luxembourg the Netherlands New
Zealand Norway Pakistan Southern Rhodesia Syria South Africa United Kingdom and
United States Subsequently the United States China Lebanon and Syria withdrew 14 An agreement where contracting parties operated on a set of rules in order to reduce tariffs
as per the GATT agreement
91
since 1947 of which the Uruguay round completed in 1994 established the
WTO The WTO agreements cover goods services and intellectual property
The agreement has six main parts the agreement establishing the WTO the
agreement for the three broad categories of trade (goods services and
intellectual property) dispute settlement and the review of government trade
policies The agreement starts with the broad principles of GATT General
Agreement on Trade in Services (GATS) and Trade Related Aspects of
Intellectual Property Rights (TRIPS) This is followed by extra agreements and
annexes dealing with special requirements of specific sectors or issues
2 The Agreement on Agriculture
The Agreement on Agriculture (AoA) was the outcome of the Uruguay round
of negotiations (1986ndash1994) The objective of the AoA was to remove agri-
cultural trade distortions in order to ensure that import and export markets
remained predictable for traders These distortions arose from the loopholes in
the GATT that allowed members to use import quotas and subsidise
agricultural trade The AoA has three pillars market access domestic support
and export competition
i Market access These are trade restrictions that importers face while
trading at the international level The AoA sought to remove these
market access obstacles which were largely in the form of tariff and
non-tariff measures (such as quotas) and replace them with tariffs ndash a
process known as tariffication Countries negotiate to reduce their
bound tariffs ie tariff ceilings that countries have legally committed
to at the WTO However the respective country governments charge
lower tariffs on agricultural imports this is known as the applied
tariff The difference between the bound and applied tariff gives the
tariff overhang
ii Domestic support These are policies that subsidise production
through prices or incomes When agricultural producers receive sub-
sidies from their governments they are able to produce and charge
lower prices this has the effect of increasing production and flooding
both local and international markets to the detriment of other agri-
cultural producers who do not receive domestic support In the WTO
parlance boxes are used to identify subsidies These boxes take the
92
colours of traffic lights green (permitted) amber (slow down - ie be
reduced) red (forbidden) In the AoA the red box does not exist
Domestic support is measured using the aggregated measurement of
support (AMS) This is the annual level of support (in monetary
terms) provided for an agricultural product that favours the producer
of that specific product
iii Export competition These are initiatives that make exports arti-
ficially competitive They include export subsidies export credits
guarantees and insurance food aid export state trading enterprises
and export restrictions and taxes
The Uruguay round of trade negotiations resulted in setting numerical targets
for reducing trade distortions in agriculture as presented in table 2-1 The
framework of rules set to reduce all these forms of trade distorting support is
presented in Article 20 of the AoA The negotiations took place in two phases
phase I (March 2000ndashMarch 2001) countries submitted proposals of their
initial starting point of negotiations phase II (March 2001ndashFebruary 2002)
members had informal meetings where they discussed specific topics and
developed technical proposals on how to reach a consensus agreement on the
changes to rules and commitments Apart from the tariff reductions domestic
support and export subsidies there are also issues of special and differential
treatment (SampD15) for developing countries and non-tariff concerns16
15 SampD is the treatment accorded to developing countries which are more favourable than
other WTO members for example longer periods for implementing agreements and
commitments (see table 21) 16 Non-tariff concerns include issues related to food security poverty alleviation
environmental protection and rural development which governments tend to pursue as part
of their development objectives
93
Table 2-1 Summary of Uruguay Round Targets Under Agreement on Agriculture
Developed Countries
(1995ndash2000)
ndash 6 years
Developing Countries
(1995ndash2004)
ndash 10 years
Tariffs
Average cut for agricultural products - 36 - 24
Minimum cut per product - 15 - 10
Domestic Support
Total AMS cut for sector
(base period 1986ndash88) - 20 - 30
Exports
Value of subsidies - 36 - 24
Subsidised quantities
(base period 1986ndash90) - 21 - 24
Source WTO Agreement on Agriculture
21 Groups Negotiating in Agriculture17
It is worth mentioning that there are several groups that negotiate in agri-
culture these groups tend to come together with the key feature being an issue
of common interest affecting them Figure 1 provides a summary of these
groups and their objectives
17 httpswwwwtoorgenglishtratop_eagric_enegoti_groups_ehtm
94
Figure 1 Groups Negotiating in Agriculture
African Caribbean and Pacific (ACP) ndash these are countries that have
preferences to the EU Their main issue of concern is agricultural
preference The ACP group negotiating at the WTO is made up of 79
countries 61 are WTO members while the rest are either observers or non-
WTO members
African Group ndash is made up of 43 African countries that are members of
the WTO they focus on all issues affecting African countries
Asian Developing members ndash is made up of 31 Asian countries that are
members of the WTO
European Union (EU) ndash is made up of 29 European countries that are
members of the EU customs union and the WTO the focus is on all issues
affecting the EU
Mercosur ndash this is the common market of the southern Cone made up of
four WTO members WTO Argentina Brazil Paraguay and Uruguay
G90 ndash is made up of the African group ACP and least developed countries
They focus on all issues affecting the group members
Least Developed Countries (LDCs) ndash made up of 34 WTO members and 14
observersnon-WTO members They negotiate on issues affecting LDCs at
the WTO
Small and Vulnerable Economies (SVEs) in agriculture ndash these are made
up of 15 countries with small economies (Barbados Bolivia Cuba
Dominican Republic El Salvador Fiji Guatemala Honduras Maldives
Mauritius Mongolia Nicaragua Papua New Guinea Paraguay Trinidad
and Tobago) whose agricultural sectors are vulnerable to negative shocks
due to their size
Recent new members (RAMs) ndash these are recently acceded members who
joined the WTO after 1995 They negotiate on general issues affecting
them
Low-income economies in transition ndash these countries seek the same
treatment as LDCrsquos they include Armenia Kyrgyz Republic and Moldova
Cairns Group ndash a list of agricultural exporting countries that push for
agricultural liberalisation it is made up of 20 countries
The tropical products group ndash made up of eight countries that negotiate in
favour of tropical products
G10 ndash a coalition of countries lobbying for agriculture to be treated as
diverse as possible because of non-trade concerns such as food security
95
G33 aka lsquoFriends of Special Productsrsquo ndash made up of 48 developing
countries who want limited opening of the agricultural sector for
developing countries
Cotton-4 ndash made up of Benin Mali Burkina Faso and Chad Their main
objective is to ensure cotton subsidies and tariffs are cut to enable them to
have market access in the cotton-subsiding countries
3 The Doha Development Agenda (DDA) ndash Agriculture
The DDA owes its existence to the fourth WTO Ministerial Conference held in
Doha Qatar in November 2001 where a declaration was issued on 14
November 2001 with key dates (Figure 2) There were a range of subjects
discussed under the declaration however this background paper focuses on the
section on agriculture The Doha declaration built on the work that was already
going on in agriculture negotiations (phase I and II) The declaration
reconfirmed the long-term objective of establishing a fair and market-oriented
trading system through a programme of fundamental reforms The commitment
by member governments in this sector is aimed at
i substantially reducing tariff and non-tariff measures that would
ensure market access of agricultural products
ii reducing and ultimately phasing out all forms of export subsidies
iii substantial reduction in domestic support that would ensure non-trade
distortion
96
31
Marc
h2003 Member
countries to produce formulas and other modalitiescommitments
10-1
4 S
ep
tem
ber
2003
5th Ministerial Conference (in Cancuacuten Mexico) ndashmember countries to provide comprehensive draft commitments This would be a stock taking conference
1 Ja
nu
ary
2005 Agriculture is
part of a single undertaking
Figure 2 Key Dates in the Doha Ministerial Declaration
Source Doha Ministerial Declaration
31 The Missed Deadlines
Members were unable to meet the deadline of March 2003 on modalities that
would enable them to produce their comprehensive draft commitments They
proceeded to prepare a framework of modalities which was completed in
August 2003 even though the process continued to August 2004 From
September 2004 till now members are in the modalities phase The
preparations for the Cancun Ministerial Conference saw the preparation of a
joint text from the United States (US) and the European Union (EU) and
proposals from country groupings such as the G2018 Dominican Republic
Honduras Nicaragua and Panama Japan Bulgaria Chinese Taipei Iceland
Republic of Korea Liechtenstein Switzerland Norway and Kenya These
proposals later formed the Annex A Draft Framework on Agriculture (aka
Perez del Castillo text) of the draft Ministerial Declaration19 Proposed
amendments and further negotiations from members resulted in the Derbez
18 Argentina Bolivia Brazil Chile China Colombia Costa Rica Cuba Ecuador Egypt El
Salvador Guatemala India Mexico Nigeria Pakistan Paraguay Peru Philippines South
Africa Thailand Venezuela 19 WTO-JOB (03)150Rev1 24 August 2003
97
Text20 Members could still not agree on the four Singapore issues21
investment competition government procurement and trade facilitation The
Cancun Ministerial Conference ended in a deadlock following the conclusion
by Chairperson Luis Ernesto Derbez that despite considerable movement in
consultations members held firm positions particularly on the Singapore
Issues On 1 August 2004 the 147 members of the WTO approved a package
which had frameworks that could be used to complete the modalities on
agriculture
32 Market Access
Tariffs
The market access negotiations focused on tariffs and quotas The preparations
for modalities were handled under six components tariffs tariff quotas tariff
quota administration special safeguards importing state trading enterprises
and other issues Phase I of the negotiations on tariffs and quota focused on
how tariffs would be handled Countries such as Canada and the US argued in
favour of inclusion of sectoral liberalisation and there were discussions of
whether to base negotiations on bound or applied tariffs this was because most
countries had large tariff overhangs Most developing countries also com-
plained about tariff escalation22 hence increasing incomes through processing
agricultural products was not a viable option In phase II two proposals
emerged on tariff reduction
i Use the formula of the 1986ndash94 Uruguay Round negotiations that
averaged the reduction over all products with variation for individual
products as long as the minimum reduction level is met
ii Use the cocktail approach that uses a flat-rate percentage reduction
for all products with additional non-linear reductions on higher
tariffs expanding quotas and special treatment for developing
countries whilst factoring in non-trade concerns The percentage was
not specified
20 WTO-JOB (03)150Rev2 13 September 2003 21 Singapore issues are four working groups set up during the WTO Ministerial Conference of
1996 in Singapore 22 Tariff escalation is the increase in duty and other tariff charges on processed imports as
compared to raw materials
98
In preparation for the modalities two proposals for reducing the tariff were put
forward
bull the Swiss Formula which was proposed by the Swiss in the Tokyo
Round for negotiating industrial tariffs They (the Swiss) did not
support the Swiss formula for the agriculture negotiations
bull the Uruguay Round Approach which was linear and variations were
allowed for all products as long as the average target was met
Interestingly looking at the country proposal Uruguay preferred the Swiss
Formula whilst Switzerland preferred the Uruguay Round Approach A middle
ground was reached where there was a blend between the two approaches with
the flexibility of varying around the averages as long as they are above a
minimum set for each product Table 31 provides a summary of the tariff
reduction which factored in special and differential treatment of developing
countries
Table 3-1 Tariff Band Proposals for Developed and Developing Countries
Developed Countries Developing Countries
Tariff
Rate
Average
Cut
Minimum Cut
for any
product
Tariff Rate Average
Cut
Minimum Cut
for any
product
90+ 60 45 120+ 40 30
15ndash90 50 35 60ndash120 35 25
0ndash15 40 25 20ndash60 30 20
0ndash20 25 15
Special
products 10 5
Source WTO Agriculture Negotiations
In preparation for the draft framework modalities the EU and the US proposed
a blended formula in which products are separated into three groups one
would use the Uruguay Round Approach another the Swiss Formula and one
would be duty-free In preparation for Cancun the Peacuterez del Castillo draft
offered had the option of three groups of products all using the Uruguay Round
Approach but with different cuts or two groups one applying the Uruguay
Round Approach while the other used the Swiss Formula The Derbez Text
draft on the other hand provided two groups (for the Swiss Formula and the
99
Uruguay Round Approach) but with control on developed countriesrsquo tariffs and
measures this was meant to deal with tariff escalation
Tariff Quotas
Members agreed that tariff quota administration tariff quota expansion and in-
quota tariff remained a challenge and there was no single formula that could
work for all The following were the proposals for the draft modalities
bull For tariff quotas there would be no obligation to reduce in-quota
duties except in preferential tariff-free and quota-free programmes
and for tropical products or those used to diversify agriculture and in
cases where less than 65 of the quota is used
bull Expansion of tariff quota volumes to 10 of domestic consumption
(66 for developing countries) with an implementation period of 5
years (10 years for developing countries) and the flexibility of
allowing one quarter of total tariff quotas allowed to increase to 8
(5 for developing countries) but only if another quarter is increased
to 12 (8 for developing countries)
Given that special and differential treatment is an integral part of the
negotiations developed countries would give duty-free access for key products
while developing countries would not have to expand tariff quotas for selected
Special Products (SPs) for food security rural development or livelihood
security In preparation for Cancun both the Peacuterez del Castillo draft and the
Derbez Text adopted the US-EU approach The former text focused on
developed countries only since quota expansion and in-quota tariff reductions
were not agreed on The latter included flexibilities related to non-trade
concerns and proposed the need to further negotiate on quota expansion and in-
quota tariff reductions
Domestic Support
The discussions on domestic support covered green box Article 62 on special
and differential treatment blue box and amber box
Amber Box
All production and trade distorting domestic support are included in this box
The objective is to reduce the total value of these measures and there was
debate in phase II as to whether subsidies in this box should be reduced by
product
100
bull Aggregate Measure of Support (AMS) would be reduced from final
bound levels by 60 over 5 years (40 over 10 years for developing
countries)
bull The Peacuterez del Castillo text adopted the US-EU proposal of broadly
reducing trade-distorting supports by a range of percentages to be
negotiated The Derbez Text proposed a ceiling on amber box
supports paid for each product to reduce governmentsrsquo ability to shift
supports between products
Green Box
The green box subsidies cause nominimal trade distortions The main pro-
posals were to maintain the set of measures that do not distortminimally distort
trade these measures largely include objectives that deal with non-trade
concerns such as food security environmental protection etc There was a
proposal for updating the base period for decoupled23 income support There
was another proposal for a development box added to the green box in order to
enable them to deal with non-trade concerns In revised draft modalities in
addition to the above proposals countries asked for stringent criteria for
compensation allowed in the green box as well as allowing for increased cost
for protecting animal welfare Both the Peacuterez del Castillo and Derbez Texts
proposed the negotiations for the green criteria box be discussed or reviewed
Blue Box
The blue box provides an exemption to the rule that all subsidies linked to
production must be kept within the de minimis support level Currently the EU
Iceland Norway Japan the Slovak Republic and Slovenia have notified the
WTO on the use of this box There have been proposals by developing
countries to move this box to the amber box since it is a way of providing
domestic support There have been proposals to reduce the support in this box
by 50 over a 5 year period (cut by 33 over 10 years for developing
countries) another alternative is to merge it under the green box allowing
developing countries to delay the merger for up to 5 years The Peacuterez del
Castillo and Derbez Texts straddled between the US-EU proposals modifying
the definition of the blue box and totally eliminating this box as proposed by
23 These are domestic support programmes that are not product specific but include direct
income supports for farmers that are not related to current production levels or prices
101
the G20 and the G90 by including further reductions after a negotiated end of
implementation period
Export Competition
Export had five components export subsidies export credit guarantees and
insurance food aid exporting state trading enterprises and export restrictions
and taxes In all the discussions and negotiations special and differential
treatment and non-trade concerns were an integral part of the five components
During phase I there were 24 proposals received from WTO members on
issues relating to export competition under any of the five components Some
proposals included the elimination of all forms of subsidies while others
proposed deep reductions in subsidies There were proposals for ensuring a
zero sum where subsidies could increase in one product whilst reduce in the
other Several proposals were made which are highlighted either as preparation
for modalities draft modalities or draft frameworks (outlines)
Export Subsidies
There were several proposals made by different countries these can largely be
summarised as
bull 50 immediate reduction in exports subsidies This would serve as a
down payment and subsequently a further reduction to zero can be done
in 3 years for developed countries (6 years for developing countries)
bull 50 immediate reduction without down payment and further reduction
of subsidies to zero in 5 years
bull Broadly lsquoelimination is neither included nor excludedrsquo depending on
what happens in other areas including export credit and domestic
support
bull Modulation ndash allowing moderate cuts for some products in return for
steeper cuts in others
bull There were countries that proposed commitments on per unit subsidies
(eg dollars per tonne of a product)
The draft modalities ie time within which to eliminate the export subsidies
included 5 years (10 years for developing countries) for one set of products (of
interest to developing countries) and 9 years (12 years for developing
countries) for the rest of the products In the draft framework the Derbez Text
proposed a negotiated end date for phasing out all forms of export subsidies
102
Export Credit
There were two main proposals with regards to export credit
bull Rules based ndash export credit and insurance would have to be granted
on commercial terms such as duration of credit (eg 180 days)
benchmarks for interest rates (such as the London inter-bank rate)
appropriate insurance premiums etc Anything that deviated from this
would be classified as export subsidies and would have to be reduced
or eliminated
bull Reduction commitments ndash this means calculating the subsidy
component of credit insurance and guarantees and treating them in
the same way as regular export subsidies
Both the Peacuterez del Castillo and Derbez Text drafts proposed that lsquodistorting
elementsrsquo of export credits should mirror those of export subsidies both in the
selection of products and the reduction or elimination
Food Aid
Most countries agreed that food aid was not a threat if it emanates from appeals
from the World Food Programme (WFP) and any other humanitarian
organisations that declare an emergency Most developing countries get
concerned when food aid is meant to offload surpluses The G90 reiterates that
food aid dealing with emergencies should be addressed in order to meet
chronic food shortages or a countryrsquos development goals Both the Peacuterez del
Castillo and Derbez Text drafts envisage disciplines or additional disciplines
to prevent food aid from replacing commercial trade
Export and State Trading Enterprises (STE)
There is concern about exporting state trading enterprises since they are
perceived to be a likely cause of trade distortion in the world market There is
also a debate as to whether state trading enterprises can have monopoly power
and be bailed out using subsidies when they are in a crisis unlike private
companies However most developing countries argue that STEs can be used
to meet government objectives such as food security and to meet the demand
where private sector is too weak to trade or compete with foreign traders In
cases where there is a state granted monopoly there were proposals for
notification of purchase sales prices and transactions costs this would ensure
price transparency The Peacuterez del Castillo and Derbez Text drafts stated that
disciplines on export subsidies and subsidised export credits should also apply
to all relevant export subsidies
103
4 The August 2004 Framework
In July 2004 delegations negotiated intensively in order to come up with a
package of agreements (hence the name July Package) and a framework
(outline) to be used for the completion of modalities (the August Framework)
41 Market Access
The August Framework provided guidelines for negotiations that would ensure
substantial expansion of trade without explicitly spelling out any formulas
bull All members except LDCs would ensure they contribute towards
improvement to market access ndash hence a singular approach
bull The agreed formula should be tiered and progressive so that higher
tiers would have steeper cuts
bull Tariff reductions would be based on bound tariffs
bull Special and differential treatment accorded to developing countries
should be operationally effective
bull All countries would have the flexibility to have sensitive products
however even with these products in place there should still be
substantial improvement in market access Each member would
select his or her list of sensitive products
Issues relating to special safeguard mechanisms sectoral initiatives and
geographical indications were not agreed on Negotiations would continue on
reducing or eliminating in-quota tariff rates improving the administration of
quotas reducing or eliminating tariff escalation and tariff simplification
42 Domestic Support
bull A tiered formula would be used for the overall level of support which
combines the amber box de minimis and blue box This would ensure
that higher levels of support would have steeper tariff cuts All
countries would have the overall permitted level of support cut by
20
bull The amber box would be cut using a tiered formula and like the
overall support higher tariffs will have steeper cuts There would also
be limits set on particular products
104
bull Developing countries are allowed a de minimis support of 5 value
of total agricultural production (10 for developing countries) It
further allows 5 de minimis for the value of production of a product
(10 for developing countries) in case of product specific support
bull Blue box support would be capped at 5 of agricultural production
over a period to be negotiated
bull Green box support would be reviewed and clarified to ensure non-
trade distortion
43 Export Competition
Under export competition it was agreed that the following issues would be
subject to negotiations
bull A date that would mark the end of export subsidies that are listed in
the memberrsquos commitments
bull A all export credits export credit guarantees or insurance pro-
grammes with repayment periods beyond 180 days those with shorter
repayment periods but failing to conform with disciplines that are to
be negotiated trade-distorting practices of state trading enterprises
that are considered to be subsidised
bull Food aid that does not conform to various disciplines
bull The details of annual reductions by instalments and parallel treatment
for the different forms of export subsidies
5 The Honk Kong Ministerial Conference (MC6)
The 6th WTO Ministerial Conference was held in Hong Kong China on 13ndash18
December 2005 The objective of this meeting was to take stock of the on-
going round of negotiations There was significant progress made especially
after the July Package and August 2004 Framework since the Director Pascal
Lamy announced that the Doha was back on track after hibernation The Doha
Mandate and August Framework provided the basis for the negotiations Table
51 provides a summary of the key outcomes from the agriculture negotiations
105
Table 5-1 Summary of Key Outcomes of Hong Kong Ministerial Conference
Pillars Key Outcomes
Market Access bull Four bands would be adapted to structure tariff cuts with the
relevant threshold to be agreed upon There was near
convergence on a linear based approach within the tariff bands
bull Developing countries had the flexibility to designate an appro-
priate number of tariff lines for special products based on food
security livelihood security and rural development indicators
bull Special safeguards mechanisms would be based on price
triggers and import quantities the precise arrangements would
be subject to further negotiations
bull Special products and special safeguard mechanisms (SSM)
would be an integral part of the agriculture negotiations
Domestic Support bull There would be three bands in the final bound total AMS and an
overall cut in trade distorting subsidies
Export
Competition
bull There will be parallel elimination of all forms of export subsidies
and disciplines on all export measures with equivalent effects
which should be completed by December 2013
o The modalities for achieving this will be specified so that the
targets are realised in the first half of the implementation
period
bull Export credits export credit guarantee schemes or insurance
programmes with a guarantee of 180 days and below should be
self-financing to reflect market consistency
bull Disciplines relating to trade distorting exporting STEs will extend
to monopoly power so that they donrsquot circumvent the direct
disciplines on STEs on export subsidies government financing
and underwriting of losses
Food Aid bull A safe box for bona fide food aid will be provided to ensure the
emergency food aid is not impeded through agreement
bull The establishment of effective disciplines for in-kind food aid
monetization and re-exports
Cotton bull All forms of export subsidies on cotton to be eliminated by 2006
bull Countries will provide duty and quota-free access to all LDCs
bull The trade distorting subsidy on cotton production is to be more
ambitiously reduced with a shorter implementation period than
other trade distorting subsidies
Source Hong Kong Ministerial Declaration (2005)
106
6 The Bali Ministerial Conference (MC9)
The Bali Ministerial Conference held 3ndash6 December 2013 Bali Indonesia was
held after several missed deadlines24 The Bali Package had the objective of
identifying a set of low-hanging fruits with a particular focus on LDCs The
focus of the package was on trade facilitation agriculture and food security
There were two proposals given under agriculture
i The G20 gave proposals on export tariff rate quota (TRQ) admini-
stration and export subsidies
ii The G33 proposed public stockholding for food security purposes A
key area of discussion was the consistency of national policies and
WTO farm subsidy rules where government expenditure on building
food stocks for food security are minimal or non-trade distorting
India for example feared being in such a situation due to its National Food
Security Act which provided for subsidised food grains under the Public
Distribution System India proposed such price support schemes should be
considered compatible with the green box and not be subjected to limitations
However green box measures should not provide price support to producers
61 Outcomes
iThe tariff rate quota-discussion remained a technical issue ndash eventually to
be solved through an understanding on TRQ administration
iiExport subsidy ndashlsquoMembers would exercise utmost restraint in using any
form of export subsidy and ensure to the maximum extent possible that
progress towards the parallel elimination of all forms of export
subsidies [hellip] will be maintainedrsquo
iiiPublic food stockpiling
a A list of support policies used as general government
services under the WTO green box were defined such as
land rehabilitation drought management and rural employ-
ment and farmer settlement programmes
24 Draft 2006 modalities (June) 2007 revised draft modalities 2008 revised draft modalities
July 2008 package 2008 revised draft modalities
107
b Members opted for an interim solution in the form of a peace
clause and committed to finding a permanent solution by the
11th ministerial conference in 2017
c The WTO temporarily refrains from lodging a legal complaint
through the WTO Dispute Settlement Mechanism if a developing
country exceeds its amber box limits as a result of stockholding
for food security The following conditions would have to be
satisfied
i This is limited to traditional staple food crops and to
existing programmes
ii There are a series of notification and transparency
requirements and the obligation to hold consultations
upon request
iii The stocks procured under such programmes should not
distort trade or adversely affect the food security of
other members
7 The Nairobi Ministerial Conference (MC10)
The MC10 was the first WTO ministerial meeting to be held in Africa Little
progress had been made so far in terms of possible areas of agreement and if
the statement by the chair of agriculture was anything to go by then there was
little hope in concluding the agriculture negations
lsquoUnfortunately the areas of divergence remain and our challenge is to see what
is still possible to narrow the gaps and precisely wherehelliprsquo
The Chair of the agriculture negotiations Ambassador Vangelis Vitalis of New
Zealand
The G33 had made proposals to have special safeguards mechanisms that
would allow developing countries to temporarily raise tariffs to curb import
surges be included under issues to be discussed in Nairobi Australia had also
made a proposal on how export competition could be commercially beneficial
There had been no changes on discussions on public stock holding cotton
domestic support and market access The Nairobi Package (table 71) made
some remarkable progress in agriculture even though it did not result in the
conclusion of the Doha round of negotiations
108
Table 7-1 Summary of Key Outcomes in the Agriculture Negotiations ndash MC10
Pillars Key Outcomes
Special Safeguard
Mechanism
bull Developing countries have the right to recourse to a
special safeguard mechanism (SSM) based on the Hong
Kong Ministerial Declaration Members to further negotiate
on SSM in a dedicated special session within the
Committee of Agriculture
Export Competition25 bull Developed member countries shall eliminate all export
subsidies in their schedules with immediate effect while
developing country members shall eliminate all export
subsidies by 2018
bull Developing countries will keep the flexibility to cover
transport and marketing costs up to 2023 while least
developing countries and net food importing countries will
enjoy additional time until 2030
bull Export subsidies by members should have minimal trade
distorting effects and should not impede the exports of
other members
bull Agricultural state trading enterprises will not operate in a
manner to circumvent the disciplines set out in Article
XVII the Understanding on the Interpretation of Article
XVII and other relevant provisions of GATT 1994 the
Agreement on Agriculture and other WTO Agreements
Public Stock Holding
for Food Security26
bull Members are to further negotiate in order to come up with
a permanent solution to public stockholding for food
security purposes
bull The negotiations will take place within the special session
in the committee of agriculture
Cotton bull Duty and quota-free market access of cotton and cotton
products originating from LDCs to developing and
developed countries shall be on a voluntary basis this
takes effect from 1 January 2016 This arrangement is
subject to the preferential trade arrangement between the
LDC and developingdeveloped country
25 WTMIN (15)W47
26 WTMIN (15)W46
109
Pillars Key Outcomes
bull Members shall not provide export credits guarantees or
insurance schemes for products listed in Annex 1 of the
Agreement on Agriculture Some of the export financing
support includes direct creditsfinancing refinancing and
interest rate support export credit insurance or
reinsurance and export credit guarantees government-to-
government credit agreements where someall risks are
covered by government direct and indirect government
export credit support such as deferred invoicing and
foreign exchange risk hedging
o Export financing support shall be for a maximum of
18 months of repayment period from the start date of
the contract to the final day of payment
o All the export credits guarantees or insurance
schemes mentioned above shall be self-financing and
shall cover the long-term operating costs and losses
of programmes as illustrated in Annex I of the
Agreement on Subsidies and Countervailing
Measures item (j)27
bull Under special and differential treatment developing
country members who provide export financing support
will have a maximum of 18 months repayment period with
an implementation period starting in 2016 to 31 December
2020
bull Least developed and net food importing countries shall
have 34ndash54 months repayment terms for the acquisition of
basic foodstuff
Food Aid bull Members would ensure that disciplines agreed on would
not hamper provision of food aid in cases of emergencies
Source Nairobi Ministerial Declaration (2015)
27 The provision by governments (or special institutions controlled by governments) of export
credit guarantee or insurance programmes of insurance or guarantee programmes against
increases in the cost of exported products or of exchange risk programmes at premium rates
which are inadequate to cover the long-term operating costs and losses of the programmes
110
8 Conclusion
Reviewing the progress made in the negotiations under agriculture from the
Uruguay Round Targets under the Doha Development agenda up to the Nairobi
Ministerial Conference (MC10) it will be acknowledged that progress has been
made towards achieving the Uruguay Round Targets However this progress is
not sufficient to complete the Doha Round There is progress in achieving
reduction in export subsidies much more than even set out under the Uruguay
Round Targets However under the market access pillar and domestic support
very little progress has been made There is a lot of work that needs to be put in
place in order to carry forward the commitments under the Hong Kong
Ministerial Conference this includes
bull setting up a four-band tariff structure under the market access pillar
bull setting up three bands in the final bound total AMS and in the overall cut
in trade distorting subsidies under the domestic support pillar
111
References
WTO (1994) The Uruguay Round Agreement on Agriculture accessed at
httpswwwwtoorgenglishdocs_elegal_e14-ag_01_ehtm
WTO (2001) The Doha Ministerial Declaration WTMIN (01)DEC1
accessed at httpswwwwtoorgenglishthewto_eminist_emin01_e
mindecl_ehtm (1ndash30 November 2015)
WTO (2003) Draft Cancun Ministerial Text ndash (The Perez del Castillo Text)
accessed at httpswwwwtoorgenglishthewto_eminist_emin03_e
draft_decl_annex_ehtm(1ndash30 November 2015)
WTO (2003) Draft Cancun Ministerial Text ndash (The Derbez Text) accessed at
httpswwwwtoorgenglishthewto_eminist_emin03_edraft_decl_rev2_eht
m (1ndash30 November 2015)
WTO(2004) The July Package WTL579 accessed at
httpswwwwtoorgenglishtratop_edda_edraft_text_gc_dg_31july04_ehtm
(1ndash30 November 2015)
WTO (2005) Hong Kong Ministerial DeclarationWTMIN(05)DEC accessed
at httpswwwwtoorgenglishthewto_eminist_emin05_efinal_text_ehtm
(1ndash30 November 2015)
WTO (2013) Bali Ministerial DeclarationWTMIN(13)DEC accessed at
httpsmc9wtoorgdraft-bali-ministerial-declaration (1ndash30 November 2015)
WTO (2013) Nairobi Ministerial DeclarationWTMIN (15)W33Rev3
accessed at httpswwwwtoorgenglishthewto_eminist_emc10_e
mindecision_ehtm (20ndash24 December 2015)
112
Chapter 6
Resolving non-tariff barrier disputes
multilateral versus regional mechanisms
William Mwanza Elizabeth Nderitu Yolanda Potelwa
Ron Sandrey and Willemien Viljoen
1 Introduction
Non-tariff barriers (NTBs) and their associated problems of trade facilitation
pose a particular challenge to trade liberalisation and development in Africa
and that is especially so since in many cases the more transparent tariff costs
are reducing NTBs need priority attention These border and beyond-the-
border constraints raise the costs of doing business and contribute to the low
levels of intraregional trade Intra-African non-tariff barriers are significant
and indeed the majority of African countries would gain more from NTB
reductions than from tariff eliminations However recently there has been a
notable and disappointing increase in the use of NTBs in both Southern African
Development Community (SADC) and the East African Community (EAC)
Many of these barriers relate to Sanitary and Phytosanitary (SPS) Measures and
Technical Barriers to Trade (TBT) measures applicable to trade in agricultural
and industrial goods
There are well-established multilateral disciplines (on international standards
TBT and SPS measures) which provide conceptual frameworks for addressing
NTBs The World Trade Organisation (WTO) agreements contain disciplines
on customs and transit technical regulations and health and safety issues WTO
members have implemented the SPS and TBT Agreements while the WTO
dispute settlement process has resolved various NTB-related disputes Further-
more in the Regional Economic Communities (RECs) within eastern and
southern Africa the agreements protocols and annexes of the EAC Common
113
Market for East and Southern Africa (COMESA) and SADC all provide legal
frameworks for the elimination (or resolution) of NTBs
An effective rules-based dispensation requires the means to (a) settle disputes
and then (b) to ensure that the rules are enforced There must be effective
remedies when NTB obligations are violated in both the multilateral and
regional arenas Comparing the WTO dispute resolution mechanism with that
in the RECs shows that the WTO dispute settlement bodies have been effective
in hearing and resolving many disputes related to NTB issues while dispute
resolution in the EAC COMESA and SADC have both been problematic and
underutilised when it comes to NTBs The SADC dispute resolution
mechanism faces its own inherent difficulties (due to its new design) while the
EAC has a formal dispute settlement process in place which has not yet heard
even one NTB-related dispute Instead informal bilateral and regional
discussions are currently the preferred method for addressing NTB matters in
the EAC However this might change once the EAC Elimination of Non-Tariff
Barriers Act of 2015 comes into effect
One of the outcomes of the Uruguay Round of the General Agreement on
Tariffs and Trade (GATT) was to change its name and morph itself into the
new WTO This was more than a symbolic change as it roughly represented a
time of major shift in the issues for the new WTO to concentrate on Through
to that time the GATT focus had largely been on reducing global non-
agricultural tariffs and here its success was remarkable The very high tariffs
on these goods were largely (but not completely) reduced to minimal levels
and now the WTO positioned itself to act upon agricultural issues as discussed
in the other chapters of this book and the multiplicity of so-called new-
generation issues Among these new issues were the Singapore issues of trade
and investment competition policy transparency in government procurement
and trade facilitation Except for trade facilitation these issues proved to be lsquoa
bridge too farrsquo and were not picked up by the WTO Some aspects of these
issues and many others such as rules of origin trade and environment trade
and labour food security tariff quota issues and the WTO disputes settlement
mechanism for example remain as issues where the WTO is involved in to
varying degrees If these issues impede trade in any way without being tariffs
they are by definition non-tariff barriers to trade This timing of GATT to
WTO change was also a simultaneous to the proliferation of bilateral and
regional free trade agreements (FTAs) that now criss-cross the global scene in
114
a bewildering manner One has only to look at the negotiated schedule for the
now possibly stalled Trans Pacific Partnership (TPP) Agreement to see that
tariffs are but a minor component of a new generation FTAs as the new
generation issues take precedence To remain relevant in the modern area the
WTO not only has to move forward but it also has to act in coordinating these
FTAs this is because almost all of the FTA partners are also WTO members
and therefore regarded as family
This same situation exists in Africa While much of the talk about continental-
wide FTAs is centred on tariffs evidence tells us that other barriers including
inefficient and time-consuming border procedures for example contribute
more than tariffs to low levels of intraregional trade This proliferation of
border and beyond-the-border constraints raises the cost of doing business
including cumbersome and ineffective customs documentation and border
procedures export taxes and quantitative restrictions
The aim of this chapter is to explore the variety of options under WTO law vis-
agrave-vis regional legal instruments to address NTBs and resolve NTB disputes
particularly NTBs affecting agricultural trade Through contrasting and
comparing the WTO and REC legal instruments as they pertain to NTBs and
dispute resolution it is possible to determine whether the WTO offers a way
ahead to deal with NTBs and NTB disputes Are the WTO dispute settlement
bodies better placed to deal with agricultural NTBs and NTB disputes or does
regional dispute settlement options offer some more appropriate fora
The paper starts with a short discussion on the clarification of NTBs and here
we find that these descriptions can be very wide and all-encompassing The
next section presents a short analysis of the potential gains to the region that
implores Africa to make a determined effort to alleviate NTBs The paper then
examines some case studies on NTBs experienced by traders in SADC and the
EAC Resolution has been reached in some but not all of these cases In the
final section we address the primary purpose of this paper that of introducing
and examining the rules governing NTBs and examining the all-important
question of where the regional authorities and the WTO can coordinate and
cooperate in moving forward
115
2 Definitions and related issues
The Organisation for Economic and Cooperation Development (OECD) makes
a distinction between non-tariff measures (NTMs) and non-tariff barriers
(NTBs) NTMs are seen as covering policy measures other than import duties
which limit trade but with no implied judgement on the legitimacy of such
measures NTBs are seen as instruments that violate WTO law Operationally
lsquoin the fieldrsquo NTBs are also seen as restrictions or prohibitions or conditions or
specific market requirements which make the import or export of products
difficult andor costly The term NTB is also often used to describe the
unjustified or improper application of NTMs including SPS measures Here the
OECD definition ndashlsquowith no implied judgement on the legitimacy of such
measuresrsquondash is an interesting one which highlights the lsquogreyrsquo areas of many
trade constraints and the need for arbitration Others has indulged in the
semantics of these differences between NTBs and NTMs but we shall avoid
this discussion and state that NTBs or NTMs are basically measures other than
tariffs that are restricting or prohibiting trade As with the remainder of the
book our emphasis will be on agriculture but we also stress that these
measures can equally apply to manufactured goods or services Similarly we
shall not engage in a cataloguing exercise of NTBs and NTMs as several
institutions are already doing just that28
We must always recognise that NTMs can exist for valid reasons including
public safety consumer protection and food security and also to address
anticompetitive behaviour It is only when these measures are implemented in
such a way as to unnecessarily increase the cost of international trade inhibit
trade or are implemented in a manner which discriminates against imports
relative to domestically produced goods or applied in an illegitimate or WTO-
inconsistent manner that they potentially become genuine barriers to trade It
therefore depends on from whose perspective one is looking to determine
whether NTBs are lsquogoodrsquo or lsquobadrsquo That is why arbitration and enforcement are
needed
28 For example UNCTAD at httpntbunctadorgdocsClassification20of20NTMspdf
COMESA at httpwwwtradebarriersorgntbnon_tariff_barriers OECD at
httpswwwoecdorgtadagricultural-trade45013630pdf and APEC at
httpswwwgpogovfdsyspkgFR-1998-05-15html98-12908htm and the WTO itself at
httpi-tipwtoorggoodsdefaultaspxlanguage=en
116
In this next section we look at some case study examples to see how their
resolution process is addressed We start with NTBs in the SADC and EAC
region a comparison and contrast between the WTO dispute resolution
mechanism and regional dispute mechanisms follow and finally our particular
focus shifts to the EAC as it seems to have the most active process in
operation
3 Illustrating the importance of addressing barriers to trade in
Africa
A recent analysis using the Global Trade Analysis Project (GTAP) computer
model by Jensen and Sandrey (2015) illustrates the potential impact of NTB
reductions for African economies The analysis used the pre - released Version
92 GTAP database (based on actual trade date for 2011) and detailed and
comprehensive datasets for trade-related barriers by country Balistreri et al
have decomposed trade costs into three categories of costs that can be lowered
by (a) trade facilitation (b) non-tariff barriers and (c) the costs of barriers to
business services For non-tariff barriers the focus was on licences quotas and
bans price control measures competition restrictions and technical barriers to
trade (customs delays were not included) Technically NTBs were reduced by
50 and this was done in two separate technical ways that will not be outlined
here but can be found in Jensen and Sandrey (2015)
The results were presented in terms of final economic gains from the
simulations expressed in terms of Equivalent Variation (EV) welfare at 2025 as
measured by the amount over and above the lsquobusiness as usualrsquo situation Gains
from complete African integration in the form of tariff elimination are
substantial and spread across all African countries except Zimbabwe A very
similar pattern applies to the African-wide reduction in NTB costs Those
countries outside Africa lose as their trade became displaced through increased
intra-African trade These results support Mevel and Karingi (2012) in showing
that intra-African non-tariff constraints to trade are at least as important but
probably more important than actual tariff barriers
The results also highlight that many countries gain from their own
liberalisation as greater efficiencies flow through their own economies These
countries include Kenya and Nigeria for example South Africa is a major
117
gainer in secondary agriculture as are Namibia Morocco and Senegal while
the rest of Africa gains in both primary and secondary agriculture In many
instances the sums representing lsquoownrsquo gains are very large Here the policy
implications are again clear this is because reducing these domestic NTB are
directly under the control of the home government Coordinated efforts to
reduce NTBs are the best option but much can be done in those countries with
high barriers by unilateral actions Importantly the research found an emphasis
on NTBs in the agricultural sectors for most countries
4 Non-tariff barriers experienced by traders of SADC and EAC
For the SADC region we find that common NTBs include trade facilitation the
SPS technical barriers to trade rules of origin (RoO) and quantitative
restrictions and prohibitions Firstly trade facilitation mainly focuses on
transport clearing and forwarding customs and administrative entry that adds
extra costs was reported by Amoako-Tuffour et al (2016) who found that trade
facilitation efforts in the SADC region reduced transaction costs as the result of
reduced times of clearance and transportation cost at the borders Viljoen
(2015) argued that SPS measures were identified as the most problematic
technical NTBs thus suggesting that harmonisation of these measures would
improve intraregional trade RoO measures have also played a very important
limiting role in the SADC trade Lastly NTBs such as quantitative restrictions
and prohibitions are particularly prevalent in agricultural trade (Hartzenberg
and Kalenga 2015)
South Africa citrus exports to the EU Sanitary and phytosanitary
measures
South Africa currently exports more than one third of its total citrus exports to
the European Union (EU) market This sector is a major contributor to the
agriculture sector in terms of employment and export earnings In recent years
the sector was faced with stricter Citrus Black Spot (CBS) regulations in the
EU as it is regarded as an important phytosanitary requirement for citrus
import permission (Carstens et al 2012)) Phytosanitary is applied on the basis
of food safety plant health and environment The EU had indicated that if
South Africa exceeded more than the five allowable CBS interceptions the
country would be subjected to a ban This measure was because CBS has not
occurred in in the EU and the EU feared that the disease contained by South
Africarsquos imports would spread in the EU territory This was despite the fact
118
that Citrus Research international had conducted a number of scientific
research projects indicating no likelihood that the disease would occur in the
EU due to its colder temperature Nonetheless South African citrus producers
and exporters were required to comply with CBS regulations in order to retain
market share Both producers and exporters now have to comply with the CBS
regulation through spraying their orchards and redirected CBS-affected fruit
into a non-CBS-sensitive market into the world Although it is costly to comply
with EU market regulations there is a likelihood that it will have returns for
South African industry in future
Zimbabwersquos temporary import ban of fruit and vegetables
The Zimbabwean fresh-fruit industry has been growing at an average growth
rate of 32 over the past ten years Its local supply is now sufficient to meet
the local demand and the Zimbabwean government introduced a temporary ban
on imports of fresh fruit and vegetables in 2014 (Collen 2014) Zimbabwe
followed with other import bans and in late 2016 Minister Davies told South
African media that Zimbabwe should have followed a process under the SADC
protocol that sets out procedural requirements for trade restrictions The SADC
protocol which regulates intraregional trade allows a member country to adopt
protection measures if it demonstrates that its industries are under stress
(Mataranyika 2016)
Exporting beer to Tanzania ndash TBT matters
In 2013 the Tanzania Food and Drugs Authority (TFDA) imposed new
requirements on importing BRARUDI beer into Tanzania The TFDA
requested a new label that provided additional information about the storage
conditions for products that had not been submitted during the application for
export The failure to adhere to the Tanzanian technical regulations by
importers will mean that their products cannot enter the Tanzanian market
The restriction on the new labels was imposed on two companies based in
Kenya and Burundi Although the issue was apparently resolved in 2015 there
seems to have been delays in processing the applications for registration
(COMESA EAC and SADC Reporting Monitoring and Eliminating
Mechanism 2016)
119
Import licensing introduced by Malawi
In 2015 Malawi ratified the Control of Goods Act for both imports and exports
requiring import licencing whereby importers are required to produce an
import licence before bringing goods into the country This restricts SADC
partner imports Zambia laid a complaint through the online NTB portal
(wwwtradebarriersorg) as this new measure requires countries to obtain an
import licence under conditions and instructions provided by Malawi
South African poultry industry anti-dumping measures
The South African poultry industry has in recent years been experiencing
increased import competition The International Trade Administration
Commission (ITAC) imposed provisional anti-dumping duties on Brazilian
imports Brazil argued that these measures did not comply with substantive and
procedural requirements Accordingly it challenged South Africa in the WTO
South Africa then chose to impose import tariffs of up to 82 (up from 27)
on all poultry products originating in countries with which South Africa had no
preferential trade arrangements The tariff increase did not apply to the EU
countries due to the Trade Development and Cooperation Agreement (TDCA)
between South Africa and the EU but South African producers then made
another anti-dumping application with regard to boneless chicken imported
from EU countries This was approved with measures applied on imports from
Germany Netherlands and the United Kingdom (UK) for the protection of the
poultry industry
Kenyarsquos import ban on import of sugar from Uganda
It was reported that Kenya banned imports of sugar from Uganda based on
allegations that some unscrupulous traders were sourcing sugar cheaply from
outside the region repackaging it and re-exporting it to countries in the region
including Kenya where sugar prices have remained high (Kisero 2015)
Uganda threatened to retaliate by also banning imports of other products from
Kenya The matter was settled amicably after discussions between the
presidents of the two countries (Goin 2015)
Uganda imposes VAT on rice imports
It was reported that exports of Tanzanian rice to Uganda faced difficulties due
to the imposition of an 18 value added tax (VAT) which was not levied on
domestically produced and traded rice This VAT was also imposed in reaction
to alleged illicit trade whereby rice imported from outside the region was said
120
to be repackaged in Tanzania and exported to partner states like Uganda
(Barigaba 2015) It is clear that the imposition of VAT on imported rice and
not domestically produced rice was in contravention of the WTO national
treatment principle which is also enshrined in article 15 of the EAC Customs
Union Protocol
5 Resolving the non-tariff barriers dispute
A pertinent issue with a rules-based dispensation is that the rules are enforced
and where rules are broken there are effective remedies for the affected party
This holds true for commitments made by countries in the multilateral regional
and bilateral trade fronts These agreements govern the rules of the game and
countries have undertaken to be bound by the commitments made In the
multilateral trade arena the WTO has many agreements in place which relate
to non-tariff issues the same goes for regional and bilateral non-tariff issues
Not only do the trade agreements and protocols of the EAC COMESA and
SADC govern the use of these non-tariff measures to try and limit the potential
harmful effect of these on trade but also explicitly state that countries must
eliminate existing NTBs and refrain from using any new NTBs However the
proliferation of NTBs shows that countries are not abiding by these
commitments made Seeing that non-tariff barriers are increasingly becoming
more problematic for traders given their associated trade costs and reduction in
competitiveness the question is What remedy is available for traders and the
private sector
For countries which do not abide by their commitments dispute resolution is
available through the different dispute resolution mechanisms allowed for in
different agreements Article 1 of the WTO Dispute Settlement Understanding
states lsquoThis Understanding shall apply to disputes brought pursuant to the
consultation and dispute settlement provisions of the agreements listed in
Appendix 1hellipand the settlement of disputes between Members concerning
their rights and obligations under the provisions of the Agreement Establishing
the World Trade Organizationhelliprsquo Article 6 of the WTO Agreement on import
licensing procedures states lsquoThe settlement of disputes with respect of any
matter affecting the operation of this Agreements shall be subject to the
provisions of Articles XXII and XXIII of GATT 1994 as elaborated and
applied by the Dispute Settlement Understandingrsquo Article 23 of the EAC
Treaty states that the East African Court of Justice lsquoshall ensure the adherence
121
to law in the interpretation and application of and compliance with this Treatyrsquo
According to Article 241 of the COMESA Treaty a member state can refer the
failure to meet an obligation or an infringement of a provision in the Treaty to
the COMESA Court of Justice while the 2000 SADC Protocol on the SADC
Tribunal states in Article 14 that it has jurisdiction over disputes which relate to
lsquointerpretation and application of the Treatyhelliprsquo According to Article 33 of the
2014 SADC Protocol on the Tribunal the new SADC Tribunal will have
lsquojurisdiction on the interpretation of the SADC Treaty and Protocols relating to
disputes between Member Statesrsquo when the protocol enters into force
If countries do not abide by their commitments to address non-tariff barriers
dispute resolution is available However whether these dispute resolution
mechanisms provide effective remedies for those who incur the costs has come
into question It is business which experiences these barriers runs the added
trade cost when a barrier arises or bears the brunt if a loss is made due to
barriers and additional costs Often these costs are also shifted onto consumers
through higher consumer prices To provide effective relief for the private
sector (and consumers) dispute resolution should entail the expeditious
elimination of NTBs and appropriate remedies to the affected traders The
ability of current dispute mechanisms to provide effective relief for traders in
the case of NTBs is questionable Some of the issues which have been brought
to the fore with the available mechanisms include the locus standi of private
individuals and business in the multilateral and regional dispute settlement
arena the extra-territorial application and enforcement of domestic court
rulings the jurisdiction of domestic and regional courts and the WTO dispute
settlement body over matters and the time involved in resolving matters
through these dispute mechanisms
bull Locus standi The WTO dispute mechanism and the new SADC Tribunal
(once it comes into effect) do not afford private individuals or business the
opportunity to bring a dispute in front of the relevant fora The use of these
mechanisms is reserved for member states (ie governments) only when
commitments of the relevant treaties are breached by other member states
The EAC Court of Justice does provide standing in front of the court to
natural and legal persons and member states if an lsquoact regulation
directive decision or action of a member state or institution of the
communityrsquo is unlawful or results in the breach of a provision of the
treaty In terms of COMESA natural and legal persons and member states
122
have standing if an lsquoact regulation directive or decision of the council or
member statersquo is unlawful or results in the breach of a provision of the
treaty However Article 26 of the COMESA Treaty contains the proviso
that natural and legal persons must first exhaust local remedies in national
courts or tribunals of the relevant member state prior to the dispute being
referred to the regional court If the relevant fora for a NTB dispute is a
domestic court the individual or legal person will have to show that he has
standing before the court based on the breach of a multilateral or regional
agreement by a decision or action of the particular government This can
be exceptionally difficult if a foreign trader brings a dispute in a foreign
associated court against actions taken by the relevant foreign government
bull Jurisdiction over NTB matters The various WTO agreements and regional
treaties contain commitments about NTBs and trade-barrier-related
matters The dispute-resolution provisions give the relevant dispute
settlement body jurisdiction when there has been a breach of these
commitments under certain circumstances However domestic courts will
first have to establish jurisdiction over a matter covered in multilateral and
regional agreements Whether a particular domestic court does have
jurisdiction will depend on the incorporation requirements of international
law into the domestic law of a specific country and the jurisdictional
powers of the relevant domestic court
bull Extraterritorial application and enforceability If the domestic courts are
the relevant fora the extraterritorial application of national laws and
enforceability of remedies beyond national boundaries are always drawn
into question Furthermore the ability of regional courts to ensure
remedies as enforced by the member state which is in breach of a treaty
commitment can also be weak What is one to do if the government does
not implement a decision made by the regional court In the case of NTBs
in SADC COMESA and the EAC this is a very complex issue According
to all three these treaties member states have committed themselves to
remove existing NTBs and must refrain from using any new NTBs
However there is an ever-increasing use of measures which are NTBs
(import permits export levies seasonal bans SPS and TBT measures
etc) and which sprout from new legislation and regulations A pertinent
question if these measures are ever tested in front of a regional court is
123
How can the court ensure that a decision made will result in a change of
legislation or regulation in the offending member state
bull Time lapse Dispute settlement procedures irrespective of the fora (WTO
regional or domestic) are all time consuming especially if appeal
procedures follow the initial court proceedings This is problematic for
traders and the private sector The private sector incurs the higher cost of
doing business or the loss at the moment the barrier is in place However
the available dispute resolution mechanisms are unable to give immediate
relief for those traders As a matter of fact the traders will have to incur
further costs to bring a case in front of the relevant court with the hope of
receiving compensation after the fact
6 Rules governing non-tariff barriers
The multilateral rules of the WTO include explicit agreements to manage
NTBs with a specific focus on customs and transit technical regulations and
health and safety issues Over the years WTO member countries have
implemented the SPS and TBT agreements The principal disciplines of the
WTO which apply to NTBs are the prohibition on quantitative restrictions in
GATT Article XI the non-discrimination obligation in Articles I and III (with
the added flexibility of the general exception in Article XX) and transparency
obligations
Although there is no WTO agreement dealing explicitly with the issue of
NTBs there are numerous WTO agreements which are applicable to areas of
NTBs The following agreements aim to provide strict rules under which
policies can be implemented or utilised in order to limit the harmful effect of
specific barriers on trade
bull Articles 42 and 5 of the Agreement on Agriculture
bull Agreement on Implementation of Article VI of the General
Agreement on Tariffs and Trade 1994 (Anti-Dumping Agreement)
bull Agreement on Implementation of Article VII of the General
Agreement on Tariffs and Trade 1994 (Customs Valuation
Agreement)
bull Agreement on the Application of Sanitary and Phytosanitary
Measures
124
bull Agreement Technical Barriers to Trade
bull Agreement on Pre-Shipment Inspection
bull Agreement on Rules of Origin
bull Agreement Import Licensing Procedures
bull Agreement Subsidies and Countervailing Measures
bull Agreement on Safeguards
bull Trade Facilitation Agreement
The WTO dispute settlement process has also resulted in a number of NTBs
resolved on a multilateral level through the enforceable legal process and the
consequent development of case law At the same time regional agreements
have also now shifted their focus to addressing NTBs prevailing in regional
trade
This is also the case in the RECs in southern and eastern Africa with the trade
agreements and protocols of the EAC COMESA and SADC providing a legal
framework for the elimination of NTBs
bull SADC Article 6 of the SADC Trade Protocol requires all member
countries to adopt and implement policies to eliminate current NTBs
in terms of intra-SADC trade Member countries must also refrain
from imposing any new NTBs on intra-SADC trade Furthermore
there are numerous annexes to the Trade Protocol protocols
memoranda of understanding (MoU) and regional policies which are
applicable to the areas of NTBs These include Annexes II (Customs
Cooperation) III (Simplification and Harmonisation of Trade
Documentation and Procedures) IV (Transit) VIII (SPS) and IX
(TBTs) Protocol against Corruption Protocol on Transport
Communication and Meteorology MoU on Standardisation Quality
Assurance Accreditation and Metrology and the SADC Regional
Agricultural Policy
bull COMESA The COMESA Treaty Article 45 calls for the removal of
NTBs on trade among members Article 49 requires countries to
remove all those intra-COMESA NTBs which were in place when the
treaty entered into force and to refrain from imposing any new
restrictions and prohibitions on member countries However intra-
COMESA quantitative restrictions or prohibitions are allowed for a
125
limited time period for the protection of infant industries Further-
more various other provisions are applicable to NTBs including
articles in the COMESA Treaty pertaining to trade remedies customs
cooperation simplification and harmonisation of trade documents and
procedures standardisation and quality assurance and cooperation in
agriculture and Annex I to the Treaty pertaining to transit and
Regulations on the Application of SPS Measures
bull EAC According to Article 75(5) of the EAC Treaty and Article 13 of
the East African Customs Union Protocol countries need to remove
all intra-EAC NTBs and are required not to impose any further NTBs
on imports from other member states Article 13(2) of the Customs
Union Protocol calls for a mechanism to identify monitor and remove
NTBs within the Customs Union This has led to the development of
the Time-Bound Matrix and the East African Community Elimination
of Non-Tariff Barriers Act 2015 Articles in the EAC Treaty
regarding trade remedies cooperation in standardisation quality
assurance metrology and testing cooperation in infrastructure and
services cooperation in agriculture the EAC Standardisation Quality
Assurance Metrology and Testing Act and the Agriculture and Rural
Development Strategy are all also relevant to NTBs
7 Comparing WTO and regional dispute settlement mechanisms
A vital component of a rules-based dispensation is the means to effectively
settle disputes to ensure that the rules are enforced Rules-based inter-state
trade disputes result from measures taken under national laws The validity of
such measures are then measured against the requirements set by the applicable
international agreements This is the reason for trade disputes mainly being
about the application or interpretation of the applicable international instru-
ments If relevant national laws are absent or defective rules-based trade
becomes impossible Thus settling disputes about the application and
interpretation of legal instruments in an objective and binding manner leads to
certainty in the market and certainty for investors Legal certainty and the
predictable application of the rules are necessary This brings benefits to
intergovernmental relations and to the private sector This advances the
effectiveness and legitimacy with which government policies are implemented
126
and can lead to a general improvement in governance the ability to fight
corruption and the limitation of illegal activities
71 The choice of forum to resolve NTB disputes ndash issues to
consider
Most of the concluded Regional Trading Agreements (RTAs) concern the same
issues as various WTO agreements including trade in goods and services
sanitary and phytosanitary measures and agricultural issues The majority of
these trade agreements also contain some form of dispute settlement
mechanism These dispute settlement arrangements can broadly be
characterised as being one of the following (1) choice of forum agreements
with or without the requirements granting exclusive jurisdiction to the chosen
forum (2) exclusive jurisdiction agreements which require all RTA disputes to
be brought only in front of the RTA dispute settlement forum or (3) preference
agreements which specify a preferred forum that can be changed to an
alternative forum upon agreement among the parties The majority of RTAs
utilise the first type allowing for a choice of forum To date there has been
little clarification on the exact relationship between the RTA dispute settlement
mechanisms and the WTO Dispute Settlement Understanding (DSU) The
existence and nature of the dispute settlement mechanisms in RTAs have raised
questions regarding their consistency with the WTO DSU (Hillman 2009)
There is an ongoing debate about the relationship between the WTO and RTAs
in terms of the hierarchy of the legal systems Although Article XXIV of
GATT allows for the establishment of an RTA it is silent on the relationship
between such agreements The DSU also does not state the relationship
between the WTO and other agreements when a dispute arises (Tagle and
Claros 2016)
Due to the lack of clarification on the matter there are differing opinions based
on the general rules of interpretation of international law Opinions are divided
as to whether WTO law prevails over RTA rules when there is an inconsistency
and whether RTAs can be considered as a modification of WTO rules Some
RTAs do not provide for any rules about hierarchy between such agreements
and other international agreements signed by the member countries Dispute
settlement bodies under some RTAs however have taken a position on the
matter The Andean Community Court of Justice (ACJ) takes the view that if
127
there is a conflict between the Andean rules and WTO law the regional rules
will prevail and conflicting WTO laws become inapplicable Furthermore the
application of Andean rules is not conditional upon its compatibility with WTO
rules The Permanent Tribunal of Review (PTR) in Mercosur follows a similar
approach According to the PTR Mercosur rules prevail over public or private
international law of the member states The PTR will not accept the violation
of regional rules as justification to apply a WTO rule by a member country
However in other RTAs like the EU the question around the hierarchical
relationship is yet to be settled The European Court of Justice (ECJ) has
refused to decide whether WTO law trumps Community Law
In the US-Section 301 case the Dispute Settlement Panel (2000) stated that the
function of the DSU was to provide security predictability of the multilateral
trading system and the DSU provisions should be interpreted in light of this
objective and purpose Furthermore the DSU must aim to preserve the rights
and obligations of the member states as covered by the relevant agreements
(Agreement Establishing the WTO the Multilateral Agreements and
Plurilateral Trade Agreements) and provide clarity to existing provisions This
does not explicitly preclude the dispute settlement bodies from considering
claims under non-WTO agreements However Tagle and Claros (2016) state
that according to this interpretation a WTO claim can only be based on the
covered agreements Thus the WTO dispute settlement bodies should assess
whether any measure applied by a WTO member country complies with the
covered WTO agreements in other words they do not assess whether or not
non-WTO agreements should be applied by the dispute settlement bodies
There are numerous issues which relate to dispute resolution and the choice of
forum ndash issues which are yet to be clarified
bull The jurisdiction of WTO law over non-WTO law According to
Hillman (2009) it is firmly established that the WTO dispute
settlement bodies do not have the authority to enforce provisions of
an RTA directly However questions have been raised as to whether
RTA rules should be treated differently than other non-WTO law
because GATT explicitly recognise RTAs Some scholars have
argued that WTO law cannot stand completely separate from public
international law so it does not add to or take away from partiesrsquo
rights and obligations if RTA law is taken into account in the
resolution of a dispute by a WTO forum
128
bull Can a country stand on a RTA provision as a defence to violate WTO
law According to Pauwelyn (2001) bilateral agreements can be
invoked as a defence to set aside WTO provisions The WTO is not
lsquoan island createdrsquo and WTO rules can be applied differently to
different WTO countries depending on non-WTO rules they have
accepted due to a lack of a centralised legislator in international law
However Cho (2003) disagrees with Pauwelyn According to Cho the
WTO must maintain its autonomy by upholding its legal integrity
what is inconsistent with WTO rules cannot be WTO-legal through
any mechanism like unilateral modifications
bull Double breaches and double handling Can the breach of both an
RTA and WTO obligation be handled in parallel by different dispute
settlement fora to enforce an identical or similar RTA and WTO
obligation In the WTO Appellate Body decision in the Mexico Soft
Drinks dispute Mexico argued that the WTO dispute settlement
bodies did not have inherent jurisdiction to exercise their substantive
jurisdiction of the case which Mexico saw as a purely North
American Free Trade Agreement (NAFTA) dispute However both
the Panel and the Appellate Body rejected the argument and were of
the view that various provisions of the WTO DSU required the WTO
adjudicatory bodies to exercise substantive jurisdiction over the
dispute unless there is a legal impediment to stop them from doing so
bull Exclusive forum clause Can the WTO dispute settlement bodies
decline jurisdiction if both parties to a dispute have agreed to a clause
in an RTA which gives exclusive jurisdiction of a dispute to the
dispute settlement mechanism of an RTA
bull Res Judicata If this doctrine is included in an RTA it raises the issue
of whether a WTO dispute is an appeal or relitigation if it has already
been heard by a regional forum If parties in an RTA agree to this
doctrine and a decision by a regional forum is conclusive and places
a bar on subsequent action on the same claim the parties effectively
strip the WTO of some of its jurisdiction Will countries be seen as
violating the terms of the RTA if a case is brought to the WTO
129
Box 1 illustrates two different approaches to resolving disputes which have
been followed by WTO member countries which are also party to a regional
arrangement These disputes relate to sanitary and phytosanitary measures
which have been imposed on imports In both these instances the parties are
signatories to the WTO Agreement on Sanitary and Phytosanitary Measures
(SPS Agreement) the International Plant Protection Convention (IPPC) and the
World Organisation for Animal Health (OIE) Furthermore South Africa and
the EU are parties to the TDCA (as well as the recently concluded Economic
Partnership Agreement ndash EPA) while South Africa and Zambia are members of
SADC These regional arrangements also have specific provisions regarding
SPS matters as well as regional dispute and conflict resolution provisions
According to Tagle and Claros (2016) the factors to consider in the choice of a
dispute settlement forum are
bull WTO law governs the inter-state relationship between WTO member
countries only in their capacity as WTO member countries
bull WTO dispute settlement bodies must ensure the application of WTO
rules not the rules of regional trade arrangements
bull WTO dispute settlement bodies do not have the authority to enforce
the obligations countries have made within a regional agreement
bull the institutions of the WTO should not intervene when regional rules
are disobeyed unless there is a simultaneous infringement of WTO
law
130
Box 1 Different approaches to dispute resolution Citrus Black Spot and American Foulbrood Disease Since 2010 there has been an ongoing dispute between South Africa and the EU regarding citrus fruit exports from the former to the latter At the centre of the matter is the lack of scientific consensus and definitive scientific evidence that Citrus Black Spot (CBS) on the peel of South African citrus fruit exports poses a risk to the orchards of the citrus-producing regions of the EU At the same time South Africa is also involved in a dispute with Zambia regarding similar SPS-related matters This dispute relates to organic honey exports from Zambia to South Africa which are currently being denied market access due to the fact that the honey is not irradiated as required in terms of the South African honey regulations (Regulation Number 835) Although these cases are based on the same allegations divergent approaches are currently being utilised to resolve the disputes a) South Africa and the EU in the case of CBS In February 2013 the IPPC Secretariat hosted formal consultations between South African and the EU under the IPPC Dispute Settlement System as an attempt to resolve the ongoing battle between the two countries on the CBS issue However the proceedings were suspended after the parties agreed to negotiate on further steps to be taken after the results of ongoing scientific analysis have been made known Until the end of 2013 when CBS was found in certain consignments of exports the EU allowed the import of citrus fruits produced in areas categorised as CBS-free or from production sites where no CBS-infected fruit were detected in official inspections The detection of CBS however led to a temporary ban being imposed which was lifted in May 2014 under the conditions that citrus fruits could only be exported to the EU market when stricter plant safety rules were adhered to These rules were notified to the WTO Committee on SPS Measures in July 2014 as emergency measures to be taken against imports from areas not recognised as CBS-free in South Africa and include records of chemical treatments to be kept registering packing houses inspections of orchards and extensive sampling South Africa and the EU are signatories to the WTO Agreement on Sanitary and Phytosanitary Measures (SPS Agreement) the IPPC and the OIE Due to the inability of bilateral talks between South Africa and the EU to resolve the matter South Africa opted to follow the multilateral route to attain a resolution of the dispute South Africa raised its concerns at the SPS Committee of the WTO and requested the IPPC to establish an expert committee to resolve the two opposing views on the matter According to South Africa the stringent import conditions and the threat of reimposing the previous ban are unnecessary and without technical justification or scientific merit South Africa has also posed an alternative solution to the EU in the form of market division In terms of its request the EU can be divided with only the southern citrus-producing region imposing stricter import regulations This should eliminate any concerns regarding the imported fruit contaminating the orchards in the citrus-producing region of the EU However the EU has yet to respond to this request and the matter is now in the hands of the WTO and IPPC to find an amicable solution
131
b) South Africa and Zambia in the case of American foulbrood (AFB) South Africa allows only imports of honey from Zambia that has been irradiated this is due to historical evidence of AFB However the Zambian industry has repeatedly asked for an exception to the irradiation rule due to an analysis undertaken by the South African National Department of Agriculture (NDA) on honey samples from across Zambia revealing that no AFB is currently found in Zambia The problem with irradiating the honey is that it loses its status as organic honey once it has been irradiated and no Zambian non-irradiated honey is currently allowed to enter South Africarsquos borders Zambia is well-known for its honey production of which the majority is certified organic due to the climatic conditions and the traditional processing and harvesting techniques employed by the beekeepers In order to allow organic imports into South Africa it was indicated that draft requirements for imports of non-irradiated honey had been internally consulted with the relevant role players These requirements have been drafted by the National Plant Protection Organisation of South Africa which has the responsibility for setting import measures for honey even though honey falls within the ambit of OIE rather than the IPPCA final draft was expected by the end of November 2013 However these regulations are currently still in draft form and Zambian organic honey is still being denied access South Africa and Zambia are signatories to the WTO SPS Agreement the IPPC and the OIE Zambia has opted to follow the route of continued bilateral consultations through the tripartite and SADC NTB resolution mechanisms to resolve the dispute with South Africa However it is unclear whether these political consultations will actually result in an amicable resolution in the near future The honey issue has been referred to the subcommittee where it has been stalled for the last year If Zambia continues to choose this route it seems that a resolution is still a long time away and with the suspension of the SADC Tribunal finality in the matter might never be reached However Zambia is not limited to taking the route of bilateral consultations and can still decide to follow the same multilateral route as South Africa did in the case of CBS Seeing that both cases are based on a similar violation of the provisions of the WTO Agreement on SPS Measures Zambia can follow suit in an attempt to pressure South Africa into finding a timeous solution in the matter However the lack of financial organisational and human capacity the time-consuming process of the WTO dispute settlement mechanisms and the complexity of the WTO rules are often cited as the main reasons why developing and least developed countries do not utilise the multilateral dispute settlement mechanisms put in place Irrespective of the reasons it seems that Zambia remains unwilling to use multilateral measures to address South Africarsquos use of SPS measures as a barrier to trade and an instrument to protect domestic industries This can turn out to be a costly decision
132
72 Case study Comparing the EACrsquos dispute resolution
processes and their viability with those of the WTO system in
case of NTBs
The WTO dispute settlement systems provides an independent and rules-based
formal dispute settlement mechanism Any dispute arising under the WTO
agreements must be resolved in accordance with the DSU In accordance with
the DSU when a dispute occurs the parties must first engage in consultations
before a request can be made for the Dispute Settlement Body (DSB) to
establish an ad hoc panel to hear the dispute Furthermore parties can make an
appeal of any decision to the Appellate Body If the respondent member
country does not comply with the recommendations made in the final adopted
report within the required reasonable time period and if negotiations for
compensation are fruitless the complainant can request authorisation to impose
retaliatory measures by suspending concessions or obligations
The majority of the disputes which have been brought before the WTO DSB
has covered areas and agreements which fall under non-tariff measures The
majority of these disputes are about trade remedies in general and anti-
dumping in particular Up to date 513 disputes have been brought to the DSB
of which 33 relate to the Agreement on Agriculture (Articles 42 and 5) 114 to
the Anti-Dumping Agreement 17 to customs valuation 46 to import licensing
5 to pre-shipment inspections 7 to rules of origin 46 to safeguards 44 to
sanitary and phytosanitary measures 112 to the Agreement on Subsidies and
Countervailing Measures and 52 to TBTs (tralac calculations based on WTO
DSB statistics)
Comparing the United Nations Country Classification (United Nations
Statistics Division 2016) with the WTO information about disputes by country
and territory (WTO 2016) shows that there is a relative balance between
developed and developing countries as complainants and respondent
economies in total but the concentration varies from dispute to dispute
For instance in the case of the disputes pertaining to Articles 45 and 5 of the
Agreement on Agriculture there are 26 developed countries as complainants
while respondents are mostly developing economics (in 22 of the 33 disputes)
In the case of the Anti-Dumping Agreement of the 114 disputes the majority
133
of the complainants were developing countries and the respondents mostly
developed countries Of the 44 cases citing the Anti-Dumping Agreement with
developing countries as respondents 8 involved anti-dumping measures taken
by South Africa (5) Egypt (2) and Morocco (1) The developed economies
which are mostly party to a dispute include the United States (US) the EU
Canada and Australia while active developing economies include Brazil
China India Indonesia and Argentina Of the African economies South Africa
and Egypt are the only countries which can be seen as being actively involved
in the WTO dispute settlement process However these are also far less than
the average usage by developing and emerging economies in Latin America
and Asia
The EAC Treaty is notified as a regional trade agreement to the WTO under
Article XXIV of GATT It is strictly speaking not separate from the WTO
system but an integral part of it It governs its own processes though these are
supposed to be compatible with WTO disciplines The East African Court of
Justice (EACJ) is the judicial body of the Community Furthermore customs
union and common market frameworks also provide for alternative dispute
resolution mechanisms including a Committee on Trade Remedies To date no
dispute relating to NTM provisions has been heard by the EACJ and the
alternative dispute resolution mechanism in the EAC has also not been greatly
used for resolving NTB matters The resolution of NTBs has thus far mainly
been done on a bilateral or regional basis through National Monitoring
Committees and the EAC Time-bound Matrix However this might soon
change after the EAC Elimination of Non-Tariff Barriers Act 2015 comes into
effect
There exist a number of avenues for dispute resolution in the EAC
a) The East African Court of Justice
First Article 23 of the EAC Treaty establishes the EACJ as the judicial
body of the community responsible for ensuring the adherence to law in
the interpretation and application of and compliance with the treaty
b) Customs Union and Common Market frameworks
Secondary legal instruments of the EAC Treaty provide for alternative
dispute resolution mechanisms from the EACJ ndash specific to particular
stages in the EACrsquos integration process
134
In Article 13 of the Protocol establishing the EAC Customs Union partner
states bound themselves to remove all existing NTBs and to refrain from
introducing new ones Article 24 (1) of the protocol then establishes an East
African Community Committee on Trade Remedies to lsquohandle any matters [in
the implementation of the EAC Customs Union] pertaining torsquo rules of origin
anti-dumping measures subsidiescountervailing measures and safeguard
measures as provided for in the respective annexes to the protocol governing
these areas and any matter referred to the committee by the council These are
areas from which non-tariff barriers to trade can emanate if respective
measures are not optimally implemented
Article 24 (1)(e) particularly provides that the committee is responsible for
dispute settlement provided for under EAC Customs Union (Dispute Settle-
ment Mechanism) Regulations specified in Annex IX to the protocol
With respect to the EAC Common Market the Protocol on the Establishment
of the East African Community Common Market (lsquothe Common Market
Protocolrsquo) provides in Article 54 (2)(a) that partner states guarantee that where
any person whose rights and liberties as recognised by the protocol are
infringed such a person shall have the right to redress in accordance with the
partner statersquos constitutions national laws and administrative procedures and
with provisions of the protocol Article 54(2 (b) further provides that lsquothe
competent judicial administrative or legislative authority or any other
competent authority [at the national level] shall rule on the rights of the person
who is seeking redressrsquo
To date resolution of NTBs has been handled bilaterally or on a regional basis
when the respective National Monitoring Committees (NMC) of the five
partner states meet at the regional NMCs forum They then update a lsquotime-
bound matrixrsquo a tool that shows progress made on elimination of reported
NTBs There also exists the tripartite online reporting system for NTBs Both
these tools strictly speaking were for monitoring the resolution of NTBs The
actual resolution has been taking place following bilateral meetings or follow-
up with focal points after NTBs were reported at the regional forum or on the
tripartite online system In February 2015 the East African Legislative
Assembly (EALA) passed a legislation providing a means for aggrieved parties
to litigate in issues relating to non-tariff barriers to trade as they are identified
by the monitoring mechanisms The law is known as the East African
135
Community Elimination of Non-Tariff Barriers Act 2015 To date the United
Republic of Tanzania and the Republic of Kenya have assented to the act
721 Compatibility of the alternative dispute resolution
mechanisms in the EAC
The issue of whether the dispute resolution mechanisms in the Customs Union
and Common Market Protocols of the EAC oust the jurisdiction of the EACJ
has been considered by the court in the case of East African Law Society V
Secretary General of the EAC The court ruled that the respective protocols
became an integral part of the treaty once they were enacted under Article
151(1) of the treaty The court has jurisdiction as the judicial organ of the EAC
responsible for interpretation and application of the treaty including its annexes
and protocols It held that articles 75 and 76 of the treaty provide for the
establishment of a customs union and a common market and lsquoinstitutions that
the Council may deem necessary for administration of the customs union and
common marketrsquo and that these institutions are not at the exclusion of the
court With regard to the Committee on Trade Remedies established under
Article 24 of the Customs Union Protocol the court noted that it represents a
pragmatic approach to the resolution of disputes as the customs union is being
administered as opposed to the long and arduous litigation process of the
courts Importantly it held that it does not take away the interpretative
jurisdiction of the court It held the same view with regard to the national
dispute resolution process provided for in Articles 54(1) and (2) of the
Common Market Protocol and hence found that the court itself remains the
final authoritative forum in matters of interpretation and application of the
treaty
722 Utilisation of the EAC dispute resolution frameworks in non-
tariff barrier matters
There has thus far not been a high reported utilisation of the alternative dispute
resolution mechanisms in the EAC particularly with respect to NTB matters
The closest that the EACJ came to ruling on an NTB issue was in the case of
Modern Holdings (EA) Limited v Kenya Ports Authority This was a customs
and border procedures issue whereby the applicant challenged in the court the
136
Kenya Ports Authorityrsquos (KPA) failure to clear its consignment of fruit juice
and mineral water in time leading to the expiry of the goods and loss of the
consignment The court did not proceed to make a determination on the matter
at hand but threw out the application because it held that it is only partner states
or institutions of the EAC that can stand as defendants in the court and not a
natural or legal person as was the case with KPA
There has not been any record of utilisation of the panel process provided for
under the Committee on Trade Remedies while the national court deter-
minations of Common Market provisions are an area that requires further
research
723 Does the WTO offer a better dispute resolution option than
EAC processes
There exists some possibility for disputes encountered in the course of trade in
the EAC to be settled at the WTO However this is subject to a number of
considerations
First the nature of the issue at hand will determine which WTO provisions
would apply in the resolution of the dispute For example the rules of origin
provisions that could have applied in the matters concerning the importation of
Ugandan sugar or Tanzanian rice are those of the EAC and not of the WTO
Hence the matter could have been properly dealt with within the EAC dispute
resolution processes On the other hand the WTO rules on national treatment
as also provided for in the Customs Union Protocol would have applied in the
matter of Tanzanian rice and so the matter could have been resolved either
within the WTO or within the EACrsquos processes It is important to note that
there are only certain sections of the EAC Treaty that explicitly provide that
WTO provisions apply Apart from the national treatment provision the
Customs Union Protocol provides that WTO rules apply in some instances ndash
such as investigations involving third countriesndash in the areas of anti-dumping
and subsidies and countervailing measures Dispute settlement of these matters
is the purview of the Committee on Trade Remedies with the WTO Dispute
Settlement Mechanism provided for disputes concerning third countries
137
Second there are temporal considerations As acknowledged by the EAC Court
in East African Law Society V Secretary General of the EAC (2011) its
processes can be long and arduous Issues concerning non-tariff barriers
normally require timeous resolution Each step in the panel processes provided
for in the Committee on Trade Remedies and the WTO Dispute Settlement
Mechanism is time-bound and so increasing the likelihood for resolution of
disputes within a definite period of time
Third there are varying costs ndash monetary and systemic ndash which may tilt in
favour of utilising the EAC processes For example it may be costlier to take a
matter to Geneva for resolution than to resolve it within the region Also the
EAC is premised on its partner states acting jointly to effectively implement
the treaty and its associated legal instruments There are costs involved as to
the legitimacy and effectiveness of the EAC dispute resolution system
according to which a matter is taken for resolution at the WTO where the
concerned provisions could have also been interpreted and applied within the
regionrsquos system
Fourth is the issue of who can bring a matter for resolution The WTO Dispute
Settlement and the Committee on Trade Remedies processes can only be
brought by a partner state against another partner state regarding non-tariff
barriers encountered in the export of products to the allegedly offending party
The EACJ process however provides for references to be brought by natural
and legal persons Such references can be not only against another partner
state but also against a natural or legal personrsquos own government This can be
for example in the case of an importer experiencing non-tariff barriers in their
own country of residence incorporation or establishment Although the court
process has been noted to be potentially long and involving it means that
persons or companies do not have to lobby their governments to open dispute
settlement proceedings against another partner state but can go directly to the
court to seek redress They may also proceed along this route where efforts to
engage their own governments to remove non-tariff barriers either directly or
through national court processes do not yield results
Based on the foregoing it can be seen that the WTO Dispute Settlement
Mechanism is limited in its ability to resolve non-tariff barrier issues within the
EAC Treaty framework Although it can represent a quicker route of resolving
a dispute it is limited due to the WTO provisions that apply within the EAC
138
framework monetary and systemic costs and the ability of private parties to
directly seek redress For the EAC it would be important to ensure that the
dispute settlement framework is functioning optimally and ensuring the quick
and efficient resolution of disputes over non-tariff barriers
8 Conclusion
The debate surrounding the importance of eliminating NTBs within Africa is
not new but it is critical for African integration and trade liberalisation efforts
This is especially the case in terms of agricultural product trade This is not just
because it is the product with the highest incidence of NTBs being utilised but
also because it forms a major part of economic growth export earnings
employment and development in the majority of African economies It is also
troubling that the incidence of NTBs in areas which have been marked for
industrial development (including agro-processing)is also on the rise In order
to address these challenges effective legal frameworks should be in place at
national regional and multilateral levels while countries must commit
themselves to particular undertakings Ultimately there should be effective
remedies when NTB-related obligations are violated
However the jury is still out on whether the best forums to address the
violation of NTB obligations are regional dispute settlement bodies or those of
the WTO There are many scholars who offer different opinions on the
effectiveness of regional dispute settlement arrangements vis-agrave-vis the WTO as
well as what the interaction should be among the various available fora What
is evident from the chapter is that private firms and traders suffer as a result of
NTBs while the consequences are passed on to consumers However the
international agreements regulating this aspect are concluded between states
and the regional institutions which have been put in place and are fora for state
officials Private-sector stakeholders do not have standing before these bodies
this translates into the absence of effective dispute settlement mechanisms The
success of the mechanism is contingent on the capacity of individual
governments to implement their obligations and on advocacy programmes to
inform the private sector We are left with a conundrum ndash current multilateral
regional and national dispute settlement mechanisms fall short to resolve NTB
disputes expeditiously and in a manner beneficial for traders What is needed to
ensure the quick efficient and cost-effective resolution of NTB disputes
139
References
Amoako-Tuffour J Balchin N Calabrese L and Mendez-Par M 2016
African transformation forum 2016 trade facilitation and economic
transformation in Africa httpsetodiorgwp-contentuploads201603SET-
ACET-ATF-Trade-Facilitation-Paperpdf
Balistreri EJ Tarr DG and Yonazawa H 2014a Reducing trade costs in
east Africa deep regional integration and multilateral action World Bank
Policy Research Paper 7049 Washington DC World Bank September
Balistreri E J Tarr DG and Yonazawa H 2014b Deep integration in
eastern and southern Africa what are the stakes Unpublished World Bank
Paper Washington DC World Bank October
Barigaba J 2015 Exit Kenyarsquos sugar enter Tanzania rice Kampalarsquos new
trade war httpwwwtheeastafricancokenewsExit-Kenya-sugar-enter-
Tanzania-rice-Kampala-new-trade-war-25582851112-ky02wu-indexhtml
Carstens E Le Roux HF Holtzhausen MA Van Rooyen L Coetzee J
Wentzel R Laubscher W Dawood Z Venter E Schuttle GC Fourie
PH and Hattingh V 2012 Citrus Black Spot is absent in the Western Cape
Northern Cape and Free State Province Working Paper Stellenbosch
University of Stellenbosch
Collen C 2014 Zimbabwe in produce import ban
wwwfruitnetcomeurofruitarticle161148zimbabwe-in-produce-import-ban
COMESA EAC and SADC 2016 Non-tariff barriers Reporting Monitoring
and Eliminating Mechanism Resolved complaints
httpwwwtradebarriersorgresolved_complaintssearchtanzania
Erasmus G 2014 Trade remedies and dispute settlement under the TDCA
South African anti-dumping duties on chicken imported from the EU
httpwwwtralacorgdiscussionsarticle5825-trade-remedies-and-dispute
Erasmus G 2016 How do the southern African RECs compare as rules-based
arrangements tralac Trade Brief S16TB142016 Stellenbosch tralac
140
Goin J 2015 My sugar deal is sweet President Kenyatta tells raila
httpallafricacomstories201508130358html
Hartzenberg T and Kalenga P 2015 National policies and regional
integration in the in the South African Development Community WIDER
Working Paper 2015056 httpswiderunuedusitesdefaultfilesWP2015-
056-pdf
Hillman J 2009 Conflicts between dispute settlement mechanisms in regional
trade agreements and the WTO ndash what should WTO do Cornell International
Law Journal 42(2) Article 1 194-208
Jensen HG Sandrey R 2015 The Continental Free Trade Area ndash a GTAP
assessment tralac E-Book httpwwwtralacorgpublicationsbookshtml17
Apr 2015
Kee HL Nicita A and Olarreaga M 2009 Estimating trade restrictiveness
indices Economic Journal 119 172-199
Kisero J 2015 Made in Brazil Packed in Kenya How tariff windows feed
Kenyarsquos sugar cartels [Online] httpwwwnationcokelifestyleDN2THE-
UNTOLD-STORY-Hands-in-the-sugar-jar-9578602853564-4kbi9yz-
indexhtml
Mataranyika M 2016 SA Zim import trade impasse City Press 18 August
httpcity-pressnews24comBusinesssa-zim-import-trade-impasse-20160818
Mevel S and Karingi S 2012 Deepening regional integration in Africa A
computable general equilibrium assessment of the establishment of a
continental free trade area followed by a continental customs union Paper
presented at the 7th African Economic Conference Kigali Rwanda 30
October ndash 2 November
Pauwelyn J 2001 The role of Public International Law in the WTO how far
can we go American Journal of International Law 95 (2001) 535-578
Staiger RW 2015 Non-tariff measures and the WTO
httpwwwdartmouthedu~rstaigerNTMs_WTO_123115pdf
141
Tagle YR and Claros R 2016 The law of regional trade agreements in the
WTO dispute settlement system lessons from the Peru-Agricultural Products
case Working Paper 042016
httpspapersssrncomsol3paperscfmabstract_id=2794836
United Nations Statistics Division 2016 Composition of macro geographical
(continental) regions geographical sub-regions and selected economic and
other groupings
httpunstatsunorgunsdmethodsm49m49reginhtmdeveloped
Viljoen W 2015 SADC Regional Agricultural Policy addressing non-tariff
barriers on agricultural trade httpwwwtralacorgdiscussionsarticle7073-
sadc-regional-agricultural-policy-addressing-non-tariff-barriers-on-
agricultural-tradehtml
WTO 2016 Disputes by agreement Geneva World Trade Organisation
httpswwwwtoorgenglishtratop_edispu_edispu_agreements_index_ehtm
id=A1
Legal Instruments
Protocol on the Establishment of the East African Customs Union
httpwwweacintcustomsindexphpoption=com_contentampview=articleampid=
2customs-unE280A6
Protocol on the Establishment of the East African Community Common
Market httpwwweacintcommonmarket
Protocol on Trade in the Southern African Development Community (SADC)
Region 1352928370Protocol_on_Trade1996pdf
Treaty for the Establishment of the East African Community
httpwwweacinttreaty
142
Cases
East African Law Society v Secretary General of the EAC Ref No 1 of 2011
Judgment of Court of First Instance 14 February 2013 httpeacjorgwp-
contentuploads201309FI_EastAfricanLawSociety_v_EastAfricanCommunit
ypdf
Mexico mdash Tax Measures on Soft Drinks and Other Beverages 2006 WTO
Appellate Body Report
httpswwwwtoorgenglishtratop_edispu_ecases_eds308_ehtm
Modern Holdings (EA) Limited v Kenya Ports Authority Reference No 1 of
2008 Judgment of the First Instance Division of the EACJ 12 February 2009
httpeacjorgcases=modern-holdings-e-a-limited-vs-kenya-ports-authority
United States mdash Sections 301ndash310 of the Trade Act 1974 2000 WTO Panel
Report as adopted by the Appellate Body
httpswwwwtoorgenglishtratop_edispu_ecases_eds152_ehtm
143
Chapter 7
Where do the Singapore and related issues fit
into the WTO
Ron Sandrey
1 Introduction
Most of what this book has examined to date has been focussing on the
traditional core values of the WTO and their relationships to African agri-
culture It is the intention of this chapter to expand upon these core issues and
look at some of the new and emerging trade issues and see where the WTO fits
into this landscape and how they may impact on Africa
Much of the attention is devoted to looking at the so-called Singapore issues of
trade and investment competition policy transparency in government procure-
ment and trade facilitation We find that while the WTO now has a minimal
interest in the first three of these important issues it has a strong presence in
trade facilitation Consequently we examine trade facilitation in more detail
and see that improvement here is certainly needed in Africa but caution that
there are a lot of commentators questioning whether the reality of the
programme will match the rhetoric that has been associated with it
Other trade related issues examined are rules of origin trade and environment
trade and labour food security tariff quota issues and the WTO disputes
settlement mechanism Again while the WTO is involved to varying degrees in
these issues there are few cases where direct gains to African agriculture can be
foreseen in the near future
144
Background
Most of this book has focussed on what the WTO may do for African
agriculture in terms of how exports may benefit The focus is on the triple areas
of reducing harmful agricultural product supports enhancing market access
through lowering import tariffs in key markets and countering export subsidies
The latter issue has become much less of a focal point as these subsidies have
been or are being phased out Similarly for the first issue of domestic supports
we found in earlier chapters that they are generally but not always reducing in
the developed economies but at the same time increasing in some developing
economies such as China This leaves market access as epitomised by import
tariffs and here we found that as a sweeping generalisation reducing these
tariffs along with current DDA structures similarly may do little for African
agriculture In a separate chapter we have extended the general issue of market
access to examine non-tariff measuresbarriers (NTMs or NTBs) that actually
or perceivably stand in the way of African agricultural exports We find that
these may indeed be more important than tariff barriers and perhaps the WTO
offers some way forward in helping to mitigate these costs to exporters
The WTO is however about more than just these access-related issues and the
objective for this current work is to explore these other issues and examine
where the WTO may advance the interests of African agricultural trade
Paramount among these issues are the so-called Singapore issues The World
Trade Organisation (WTO) members decided at the 1996 Singapore Ministerial
Conference to set up three new working groups on trade and investment
competition policy and transparency in government procurement They also
instructed the WTO Council for Trade in Goods to look at possible ways of
simplifying trade procedures or as it became known lsquotrade facilitationrsquo These
four issues collectively became known as the Singapore Issues They were
subsequently included on the Doha Development Agenda (DDA) with
negotiations to start after the 2003 Cancun Ministerial Conference lsquoon the
basis of a decision to be taken by explicit consensus at that session on
modalities of negotiationsrsquo
In addition there are other trade issues that could be directly or at least
peripherally associated with the WTO These includes trade and the
environment trade and labour food security and many non-tariff measures
(with the latter mainly being covered in a separate chapter) A particular NTM
145
are the ubiquitous rules of origin (ROO) and here we will examine how the
ROO is acting as an increasingly important barrier to trade as global tariffs
reduce and these other issues become more transparent Several of these issues
tend to mean different things to different countries and therefore perhaps
become more mired as a result An example of this may be food security an
issue that means much more to Africa than perhaps the Island city-state of
Singapore with virtually no agricultural resources and a reliance upon its
prosperity to purchase agricultural products on the global market
The objective for this paper is to examine these related issues with a special
emphasis on how the WTO may benefit African agriculture For the Singapore
issues in particular it borrows heavily from the recent publication by Sandrey
2015a but it adds an emphasis on agriculture and introduces some of the other
related issues In general we are finding that developed and even emerging
countries are less interested in areas such as subsidies and market access that
has the core of WTOs activity They are moving on issues such as investments
competition polices government procurement migration intellectual property
financial services and taxation and pharmaceuticals While African economies
have less interest in these new issues it behoves us to examine at least some of
them here
Related to these new issues is an innovative approach from Hufbauer and
Schott 2013 They evaluated the potential gains to the world economy
focussing on what they believed were seven agreements that could be ratified
at that time through the DDA These seven were trade facilitation international
trade in services the digital economy duty-free quota-free (DFQF) market
access for developing countries agricultural subsidies food export controls and
gains from environmental goods and services The total global gains to GDP
were in excess of two trillion US dollars ($2212 billion) A staggering sum
Directly relevant to this paper are the trade facilitation gains of nearly one
trillion dollars and the gains from DFQF controls on agricultural subsidies (as
represented by export subsidies)and food export controls The gains from the
latter three were inconsequential in the overall total Ignoring the realities of
achieving this outcome the salient point from their analysis is that global gains
from DFQF access and controls on agricultural export subsidies are almost
negligible Interestingly their gains from trade facilitation were almost evenly
split between developed and developing countries with Sub-Sahara Africa
gaining very little
146
2 The so-called Singapore issue29
The WTO members decided at the 1996 Singapore Ministerial Conference to
set up three new working groups on trade and investment competition policy
and transparency in government procurement They also instructed the WTO
Council for Trade in Goods to look at possible ways of simplifying trade
procedures or as it became known as trade facilitation These four issues
collectively became known as the Singapore Issues They were subsequently
included on the Doha Development Agenda (DDA) with negotiations to start
after the 2003 Cancun Ministerial Conference lsquoon the basis of a decision to be
taken by explicit consensus at that session on modalities of negotiationsrsquo
The basic problem for the WTO was that these negotiations would only
proceed following a clear consensus decision to do so and this was especially
crucial for competition policies and investment as the WTO already had an
Agreement on Government Procurement At the time of the Cancun WTO
meetings Sandrey 2006 reports that these Singapore issues had become a
priority for the European Union (EU) in particular and were pushed ahead
until the final days of those meetings Developing countries had consistently
opposed their inclusion in the negotiating agenda arguing that the subject and
scope of these issues were unclear and that they lacked the technical capacity to
implement them and therefore it was unrealistic to pursue them without
knowing what compensatory gains they would get in other negotiating areas
Investment competition policy and government procurement were seen as
areas where the developed countries were imposing their standards upon
developing countries in a one-way manner Tensions became based around the
degree to which the WTO should intrude into domestic policy space rather than
remain essentially a trade organisation Were Singapore Issues a bridge too far
Yes they were and the outcome from Cancun was that talks collapsed with the
three Singapore Issues of investment competition policies and procurement
shouldering a significant and possibly unfair portion of the blame Trade
facilitation did however find common ground Developing members saw trade
facilitation as an opportunity to leverage aid for a chronic internal domestic
problem and developed members saw reduced transaction costs as enabling
29 This section draws heavily from and expands Sandrey 2015a
147
their exporters to gain advantage in these markets Consequently of the
Singapore Issues trade facilitation alone has specifically stayed with the DDA
and this was reinforced by WTO Members who agreed on 1 August 2004 (the
so-called July Framework) to proceed with negotiations on only one Singapore
Issue trade facilitation The other three were dropped from the DDA but for
the purpose of this paper we can still include them as DDA issues
Nearly twenty years after the 1996 Singapore Ministerial several salient facts
relating to the Singapore Issues are still relevant The first is that while the
WTO remains essentially moribund arguably the only real outcome from the
WTO since the Uruguay Round outcome was the Agreement on Trade
Facilitation (TF) that emerged from the Ninth Ministerial Conference held in
Bali Indonesia from 3 to 7 December 2013 For the first three issues of trade
and investment trade and competition policy and government procurement the
battle ground has moved from the WTO to the various free trade agreement
(FTA) negotiation tables around the world This in itself highlights how the
focus has moved from the WTO per se to these bilateral and regional
negotiating tables Importantly Africa is evaluating its regional policies in the
context of both the Tripartite Free Trade Area (TFTA) for the whole of eastern
and southern Africa and the Continental Free Trade Area (CFTA) and these
issues need to be seen within the nexus of the WTO the mega-regionals and
the African TFTA and CFTA
In some respects for Africa the international conflict of Cancun continues The
developing countries still see these issues through the prism of exporting
countries that are trying to force open markets of the poorer importing
countries thus attempting to ensure economic development in their nations at
the expense of the developing countriesrsquo policy space The extent to which
lsquoex-Singapore issuesrsquo are being introduced into the African and other regions
through bilateral and regional agreements negotiated with the EU and the US
as the dominant economies becomes an important one and in general the EU
seems to be pursuing them with some vigour and rigour while the US is
adopting a more benign approach
The old General Agreement on Tariffs and Trade (GATT) the precursor to the
WTO was hugely successful in bringing industrial tariffs down dramatically
since World War Two It had not however achieved the same success in
bringing agricultural tariffs and supports down and many felt that a
148
concentration on these core areas was preferable to attempting to embrace too
many new issues that while important are not lsquofrontlinersquo issues Conversely
behind-the-border issues are becoming more important as tariffs and visible
protection measures are reducing and in that respect perhaps the GATTWTO
had become a victim of its own success as these so-called lsquonot frontlinersquo issues
were becoming more visible and therefore increasingly relevant
Meanwhile investment and competition policy have always been an indirect
component of the GATT and WTO The General Agreement on Trade in
Services (GATS) contain rules on monopolies and exclusive service suppliers
and the principles have been elaborated considerably in the rules and
commitments on telecommunications for example The agreements on
intellectual property and services also both recognise governmentsrsquo rights to
act against anti-competitive practices and their rights to work together to limit
these practices And the WTO already have a limited Agreement on Trade
Related Investment Measures (TRIMs) and an Agreement on Government
Procurement that cover such issues as transparency and non-discrimination that
some WTO members have signed
It has long been known that at the heart of the so-called Asian growth miracle
has been the ability of these Asian nations to get most of their economic and
trade related policies functioning in a coherent manner While the general and
over-used term of lsquogood governancersquo may be used to describe this general
coherence and we need to be conscious that this term can mean different
things to different people and different societies many observers stress the
importance of an inclusive society that values social coherence and equality as
being just as important as growth per se For economic and social development
it is important to get policy sets working together and the new theme word for
this in trade agreements is lsquoregulatory coherencersquo
Essentially this emphasises the fact that as Mumford 2014 outlines the
lsquobehind the borderrsquo barriers to trade have become the new frontier for trade
policy This is reinforced by the lowering importance of tariffs per se and the
growth of global chain trade in both goods and services The attention to this
frontier is not without controversy however There are concerns that the global
business sector will push reforms and international coherence at the expense of
governments ceding domestic sovereignty in many social economic and
environmental areas Accepting that as in all issues there are extreme views
149
Mumford provides a description of regulatory coherence as the interface
between domestic regulation and international trade and investment
liberalisation We consider that many aspects of the Singapore Issues fit neatly
into this interface and are an essential part of the lsquogood governancersquo package of
modern trade policy
3 Competition policies
The OECD in a background note to their June 2015 meeting of Competition
Policy experts30 outlined how it is a fundamental principle of competition law
and policy that firms should compete on the merits and should not benefit from
undue advantages due to their ownership or nationality Governments can
affect the way markets function sometimes to the detriment of free
competition They can set procurementtax rules or regulatory regimes putting
private companies at a disadvantage compared to state-controlled or supported
firms or yet they can participate in a market by providing services directly or
through state-ownedcontrolled firms
Ensuring a lsquolevel playing fieldrsquo is therefore key to enabling competition to
work properly but the proviso must be made that markets must actually be free
and fair Often of course it is not the case and the objective for competition
policies is to monitor and correct anomalies and asymmetries in the market
place Typically (and by definition) competition policy means providing
remedies to deal with a range of anticompetitive practices including price
fixing cartel arrangements abuses of a dominant position or monopolisation
mergers that limit competition and agreements between suppliers and
distributors (lsquovertical agreementsrsquo) that foreclose markets to new competitors
In examining a mega-regional agreement we find that the objective of the
Trans-Pacific Partnership (TPP) chapter on competition policy was outlined by
Asian Pacific Economic Cooperation (APEC) leaders as being lsquoto promote a
competitive business environment protect consumers and ensure a level
playing field for TPP companiesrsquoi This seems to involve the enactment and
enforcement of competition laws and relevant institutional frameworks due
30 httpwwwoecdorgdafcompetitioncompetitive-neutrality-in-competition-
enforcementhtm
150
process provisions in the enforcement of competition laws transparency
obligations consumer protection affording standing to private parties to
initiate legal action under competition laws and technical cooperation for the
developing country partners with limited legislation and competence in this
area This became a contentious issue in the TPP and negotiations focused on
New Zealandrsquos pharmaceuticals subsidies by Pharmac the agricultural
producer boards from Canada and Singapore in public utility and transport
services and the US in examples such as their antitrust and associated laws
pertaining to the generous treatment given to the US civil aviation industry
The USTR 2015 reported that the TPP Parties31 agreed to adopt or maintain
national competition laws that proscribe anticompetitive business conduct and
work to apply these laws to all commercial activities in their territories They
agreed to establish or maintain authorities responsible for the enforcement of
national competition laws and adopt or maintain laws or regulations that
proscribe fraudulent and deceptive commercial activities that cause harm or
potential harm to consumers and to cooperate as appropriate on matters of
mutual interest related to competition activities They also agreed to obligations
on due process and procedural fairness as well as private rights of action for
injury caused by a violation of a Partyrsquos national competition law and agreed
to cooperate in the area of competition policy and competition law
enforcement including through notification consultation and exchange of
information We note that this chapter is not subject to the dispute settlement
provisions of the TPP but Parties may consult on concerns It therefore seems
like a lsquobest endeavourrsquo outcome but it does move the general international
frontier forward and further away from excluded countriesregions such as
Africa
Since the WTO withdrew from the competition policy field focus moved more
to the OECD where the main policy response has been the development of so-
called lsquocompetitive neutrality frameworksrsquo that a number of OECD member
countries have implemented These are required for government business
activities not to have a net competitive advantage over their private-sector
competitors simply by virtue of public-sector ownership For the TFTA
31 We note at the time of writing this paper that TPP negotiations have concluded but the
agreement has not been fully ratified with the position of the US in doubt
151
members the main implication may well be a potential closing of available
policy space and especially so in view of many states trying to implement
industrial policies
31 The African dimension
This is an active part of the trade policy agenda in South Africa and the region
although there is an asymmetry in the enthusiasm legislative support and
administrative capacity through the region While unquestionably South
Africa has a competition policy framework and capability that are equal to or
better than many developed countries the same does not hold regionally There
is a need to bring more SADC countries into a functioning competition policy
framework to enhance economic efficiency Perhaps the TPP in particular will
highlight this and convince more developing states in the region that
associated with market access commitments there is a need to have these
policies aligned with policies that discipline that market More widely this
should in turn reflect on opportunities to progress the issue through the WTO
as the final policy convergence agency And capacity building is once again a
key factor here
Within SADC Article 25 of the SADC Protocol on Trade provides for member
states to implement measures within the Community that prohibit unfair
business practices and promote competition The Protocol provides for a
framework of trade co-operation among member states based on equity fair
competition and mutual benefit that will contribute to the creation of a viable
Development Community in Southern Africa Within the EAC the WTO
(2013) reported that in general competition issues are not yet regulated at the
EAC regional level while at the national level only Kenya and Tanzania have
fully functioning competition laws and institutions The EAC Competition Act
was however enacted in 2006 and this Act contains provisions on inter alia
abuse of market dominance mergers and acquisitions consumer welfare
member statesrsquo subsidies and prohibits anti-competitive concerted practices
The COMESA Competition Commission is the first regional competition
authority in Africa and second in the world Its mandate is to ensure fair
competition and transparency among economic operators in the region It
commenced operations in January 2014 and promotes and encourages
competition by preventing restrictive business practices and other restrictions
152
that deter the efficient operation of markets thereby enhancing the welfare of
the consumers in the Common Market and protecting consumers against
offensive conduct by market actors
Similarly for the TFTA Annex 7 on Competition Policy and Consumer
Protection states that under Article 23(3) of the Agreement Article 1 lsquothe
Tripartite Member States recognise the importance of fair competition in
promoting trade supporting industrialisation and promoting consumer welfare
and note that fair competition creates a level playing field by all players large
and small and therefore promotes a good working environment for companies
and businesses particularly the micro small and medium scale enterprises in
this way promoting investment in the regionrsquo
4 Government procurement
The role of government in its procurement of goods and services typically
accounts for 10ndash15 of GDP for developed countries and up to as much as
20 of GDP for developing countries In an attempt to open this significant
portion of the international economy to international competition WTO
members signed the plurilateral (only binding on WTO members who choose
to sign) Agreement on Government Procurement (GPA) at the Uruguay Round
in 1994 This agreement was based on the 1979 Tokyo Round government
procurement agreement and as of June 2016 there were46 signatories (with all
28 members counted individually) Most of the members are developed
countries The intention of the GPA is to ensure that government decisions
regarding government purchases of goods and services do not depend upon
where the good is produced or the service rendered nor upon the supplierrsquos
foreign affiliations
The text of the original Agreement while limited in scope establishes rules
requiring that open fair and transparent conditions of competition be ensured
in government procurement However these rules do not automatically apply
to all procurement activities of each party Rather the coverage schedules play
a critical role in determining whether a procurement activity is covered by the
Agreement or not Only those procurement activities that are carried out by
covered entities purchasing listed goods services or construction services of a
value exceeding specified threshold values are covered by the Agreement The
WTO Working Group on Transparency in Government Procurement examines
153
questions such as does a particular government publish the criteria upon which
it bases its procurement decisions Does it publish the opportunities for
procurement so that all suppliers know about them Does it encourage
competition among potential suppliers After investigating these questions and
others the working group will then try to create policies to open competition
for government contracts
Many countries for a variety of reasons place restrictions on government
procurement of both goods and services Some will do so to encourage
domestic industry though many developing countries have limited domestic
service industries and turn to foreign providers as a result Several developed
countries would like to see the GPA become a multilateral agreement This
would increase market opportunities for their own firms allowing them to bid
for foreign government purchases on a level playing field The strongest
advocates of the multilateral GPA are unsurprisingly the US and EU
Supporters as they see it is part of lsquogood governancersquo in the developing world
in introducing a more transparent and competitive procurement process to
reduce opportunity for corruption and rent-seeking by domestic governments
and suppliers Opposition comes from many developing countries that realise
they will be disadvantaged by established foreign companies and this in turn
would lead to local problems of employment and balance of payments as well
as running counter to possible industrial policy and infant industry labour
environmental and racial empowerment policies But in reality they have far
less capacity to bid for tenders in the developed countries
A reflection upon the linkages of government procurement and other aspects of
the WTO disciplines may be appropriate as procurement relates by definition
to either goods or services and market access for these are covered by the
fundamental WTO principles While government procurement is probably
more important because of the scope of the issue given the role of the state in
many economies the basic principles of market access and domestic subsidies
remain the same On a similar note we could mention that the concept of lsquobuy
localrsquo patriotic campaigns are widespread but they do not seem to attract
censure and condemnation to the same extent Should these campaigns be
placed under some disciplines Perhaps a WTO challenge would answer this
and perhaps some procurement may also be open to challenges within the
current WTO rules
154
Despite several differences in procurement practice a similar non-binding
outcome resulted from the TPP agreement The parties commit to core
disciplines of national treatment and non-discrimination and agree to publish
relevant information in a timely manner to treat tenders fairly and impartially
and to maintain confidentiality of tenders They also agree to use fair and
objective technical specifications to award contracts based solely on the
evaluation criteria specified in the notices and tender documentation and to
establish due process procedures to question or review complaints about an
award This outcome seems to strengthen the GPA and indirectly the WTO
41 The African dimension
In recent years the South African government has taken measures to implement
a reformed government procurement practice It is the vehicle through which
many of the governmentrsquos policies and strategies will be realised and the
vision is to give effect to positive discrimination enshrined in the Constitution
which in turn will boost local businesses and create much-needed wealth for
previously disadvantaged people In South Africa the government procurement
policy and the related strategies have a very specific economic social and
political aim These socio-economic dimensions are the reason that many
developing countries including South Africa refuse to enter into negotiations
in government procurement
COMESA 2009 outlines how the objectives of COMESA Public Procurement
Regulations include (a) to foster competition and openness in public
procurement procedures (b) to foster fair management systems in procure-
ment (c) to promote accountability transparency and value for money in the
public procurement process for national development and (d) to promote
harmonisation of public procurement laws and practices for the enhancement
of intra- COMESA Trade WTO 2013 reports that in the EAC in general open
tendering is the rule in public procurement by EAC countries and except for
Uganda all EAC countries had at that time brought new procurement laws into
operation Meanwhile South Africa will need to be cognisant of the fact that
future FTAs may examine the noble endeavours of using procurement as a
means of redressing previously disadvantaged persons who were discriminated
against under the former apartheid regime
155
In the final analysis though procurement policies probably have little to do
with African agriculture Firstly Africa has minimal involvement in the WTO
GPA and perhaps more importantly it is difficult to see where agricultural
products are likely to be directly related to procurement policies with the
possible exception of famine relief efforts
5 Trade and Investment
We cannot stress enough that the lessons over the last three or four decades
from the dynamic regions of Asia in particular show that the preconditions for
growth are putting domestic structures in place to foster investment and export-
oriented trade However while investment is a necessary condition it is
certainly not a sufficient condition for export-led growth There is a correlation
between the two but the main foundation is getting the basics or that over-
used term lsquogood governancersquo right This latter is very much under the control
of a countryrsquos own government and it is unclear why domestic legislation and
regimes need external control to maximise a countryrsquos own welfare
The WTO has only been peripherally involved with investment in three ways
Firstly a Working Group established in 1996 conducts analytical work on the
relationship between trade and investment Secondly the Agreement on Trade-
Related Investment Measures (TRIMS) prohibits trade-related investment
measures such as local content requirements that are inconsistent with the
basic provisions of GATT 1994 And thirdly the General Agreement on Trade
in Services addresses foreign investment in services as one of four modes of
supply of services
Investment issues are however increasingly becoming an essential component
of the modern FTA as partners seek to benefit from an increase in bilateral
investment as well as from the exchange and transfer of knowledge
technology ideas and export opportunities Ways in which an FTA could
contribute to these aims include
bull greater transparency of regulations or laws that affect foreign
investments
bull more liberalised regimes which will facilitate the foreign investment
bull improvements that can make it easier for investors to resolve any
disputes that they may have
156
bull promotion of bilateral or regional investment by strengthening investor
confidence and thereby encouraging current partnerships into new areas
of manufacturing and service industries through joint ventures and
strategic alliances
Much of the current Foreign Direct Investment (FDI) into Africa is driven
simply by the need to control the resource extraction sectors and has little in
the way of linkage back to desired aspects of FDI such as technology transfer
and poverty alleviation Until better governance regimes become the norm in
Africa it is difficult to see how trade agreements will foster much in the way of
more desirable FDI
Hufbauer and Schott 2013 offer some interesting thoughts on how the WTO
could use investment policies to re-establish itself into the international scene
in a meaningful way For example they could undertake a systematic analysis
of the terms and coverage of existing BITs and RTAs and look at how several
aspects of these agreements cover different things such as environmental and
taxation policies and help provide a framework for common rules and a more
effective disputes resolution framework While these ideas are valid again
there are limited direct links to African agriculture given the relatively basic
foundation for much of the continentrsquos structure
6 Trade facilitation
Trade facilitation can mean different things to different people and is closely
linked to and an integral part of capacity building In the strict sense of the
WTO agenda trade facilitation is focused upon customs and border operational
procedures In a wider sense the OECD views it as helping the institutions
negotiators and processes that shape trade policy and the rules of international
commerce In its extreme but still accurate form it can be viewed as the
complete infrastructural package that leads to international competitiveness in
global trade The latter is an area in which Africa is notoriously lagging as
there can be no question that general trading costs are very high in Africa
(Shayanowako 2014 Pearson and Chaitezvi 2012 and Pearson 2011)
Arguably the only real outcome from the WTO since the Uruguay Round
outcome was the Agreement on Trade Facilitation (ATF or TF) that emerged
157
from the Bali talks Pearson 2015 relates how in December 2013 WTO
Members concluded negotiations on a new Trade Facilitation Agreement
(WTMIN (13)36) aimed at expediting the movement release and clearance
of goods including goods in transit and at improving customs cooperation as
part of a wider Bali package The members then adopted on 27 November
2014 a Protocol of Amendment to insert the new Trade Facilitation Agreement
into Annex 1A of the WTO Agreement This Agreement will enter into force
once two‐thirds of WTO members have completed their domestic ratification
process and it will be binding on all member states (with no exclusions) from
the time of its entry into force although with provisions for delayed
implementation for Developing and Least Developed Countries As of 18 June
2015 only eight members had signed the Agreement (Botswana Hong Kong
China Singapore the USA Mauritius Malaysia Japan and Australia) This is
far short of the 107 required and with the WTO Ministerial in December 2015
looming observers are doubtful that more than 40 members will have signed
(with the EUrsquos 28 members contributing massively to that total)
The African Development Bank (ADB) reported on the implications of the TF
for Africaii The report notes that firstly a binding TF agreement will push
countries to undertake trade facilitation reforms in keeping with their
commitments and that there are a number of countries that have been lethargic
in undertaking customs reforms and other trade facilitation measures This has
impeded the efficient operation of their infrastructure including the regional
transport corridors In some instances there is little inclination from key
African government agencies to undertake reforms and a binding commitment
on TF would help initiate and lock in reforms In addition the TF contains
obligations on the publication of information on issues such as documentation
for imports export and transit procedures duties and taxes fees imposed by
governments regarding importation or exportation import export or transit
restriction and appeal procedures
Shintaro Hamanaka 2014 from the ADB acknowledges that it could be argued
that the TF benefits are heavily tilted in favour of exporting countries and
regards it as an lsquoimport-facilitating agreementrsquo which will worsen Africarsquos
trade balance and does little to address the productive and export constraints
facing developing countries To directly benefit African exporters must
increase value-adding activities by promoting investment in areas such as value
chains otherwise the benefits of the TF deal will be marginal and African
158
countries will miss out on the alleged $1 trillion Bali trade boost Meanwhile
issues such as NTBs compliance with SPS tariff escalation and tariff peaks on
products of interest African exporters continue to stifle Africarsquos potential to
reach international markets and upgrade along the value chain Therefore
parallel efforts to the TF are required in addressing these issues both in regional
and global markets
The Organisation for Economic and Cooperation Development (OECD)32
assesses the potential benefits of the Bali package This is done with the
lsquolimitedrsquo implementation scenario that assumes that countries that are already
implementing best practices will continue doing so but that others will not
(where implementation is discretionary showing significant potential benefits)
This package is however not without controversy the African countries argue
that this package lacks balance and is tilted heavily in favour of an agreement
forced on the poor nations by the industrialised countries Many developing
countries including the African countries see the package as aimed at opening
their markets to goods through enhanced merchandise access They believe
that conversely there is little to gain for developing-country exports to the
developed world whose infrastructure is generally excellent
Within the TPP the United States Trade Representative (USTR) reported that
initially the TPP countries agreed that capacity building and other forms of
cooperation were critical both during the negotiations and post conclusion to
support TPP countriesrsquo abilities to implement and take advantage of the
agreement These will be needed to help developing countries to meet the high
standards the TPP countries aspire to To this end several cooperation and
capacity-building activities have already been implemented and more are
planned The TPP countries are also discussing specific texts that will establish
a demand-driven and flexible institutional mechanism to effectively facilitate
cooperation and capacity-building assistance after the TPP is implemented
The big questions remain though as to whether any of the monies directed to
trade facilitation will be lsquonew moniesrsquo or merely a redirection of monies
32 See website
httpwwwoecdorgtradetradedevOECD_TAD_WTO_trade_facilitation_agreement_pote
ntial_impact_trade_costs_february_2014pdf
159
already allocated to projects that may or may not be similar to lsquotrade
facilitationrsquo Many observers believe answers to this range from lsquounlikelyrsquo to a
flat lsquonorsquo and that smoke and mirrors will be the order of the day Is there more
rhetoric than reality in the whole trade facilitation project Many think so
Shintaro Hamanaka after an examination of the AFT is left less than
impressed He offers two critical points the first is developing and LDC
members can decide when to implement obligations and implementation can be
subject to the provision of assistance from donors and secondly the
obligations are not ambitious and tend to be best endeavour (lsquoto the extent
possiblersquo) The agreement is not expected to have a major legal impact on
members and the economic impact also seems to be narrow because it covers
only limited trade facilitation items While the paper considers that technical
assistance may be helpful and financial assistance can be an important catalyst
ATF trade facilitation reform is fundamentally a unilateral action and political
will is essential Therefore the ATF can be a guide for trade facilitation reform
at the domestic level and the likelihood for success of such unilateral reforms is
enhanced with assistance Importantly gains from trade facilitation mainly
result from investment in physical infrastructure such as ports airports roads
and rail infrastructure and this wider aspect of trade facilitation is outside the
scope of the ATF
Impacts
Others are even more pessimistic and even to the point of scathing Capaldo
summarises his paper with an abstract that reads lsquoOfficial estimates tend to
overstate the benefits of trade facilitation and ignore its costs When all
underlying assumptions are brought to light expecting large gains appears
unreasonable At the same time estimated employment benefits may easily
turn into net losses With fundamental uncertainty surrounding its effects
implementing trade facilitation without enhancing systems of social protection
would be ill advised Indeed the net effect of trade facilitation may depend on
the social policies it is complemented with While trade facilitation may bring
extra business to import-export firms it is not a feasible or sustainable growth
strategy for all countries and it cannot be expected to deliver growth to the
global economy Importantly he considers that the figures generally bandied
about as gains from trade facilitation fail to support any reasonable expectation
that the reform may benefit developing economies Thus can we expect little
for Africa
160
61 A tralac African analysis
Politics aside there is little argument that African countries have a problem
with infrastructural delays and associated costs33 But how serious are these
problems Jensen and Sandrey 2015 examined the costs of trade facilitation in
Africa only as represented by costs such as delays at border crossings
roadblocks for trucks and the necessity to pay bribes They used cost of delay
data from Minor 2013 and Hummels and Schaur 2013 who developed a
database of per day ad valorem costs to use in the Global Trade Analysis
Project (GTAP) computer model with these estimates providing ad valorem
equivalents of the per day costs along with the number of days involved In
implementing the GTAP model Jensen and Sandrey used the Singapore
international best-practice benchmark of four days for imports and assessed a
reduction of 20 in Africa for the days over and above this benchmark for
imports only to avoid possible double counting
The data reinforced that transit delays and subsequent costs are largely an
African issue and in taking a calculation of a 20 reduction in these African
costs they argued that their approach was conservative There was still plenty
of lsquoslackrsquo in the system although there are countries in Africa that are very
close to international benchmarks this proves that Africa has the potential to
improve
The welfare gains to Africa were substantial For South Africa they were some
US $8519 billion in real terms and as is usually the case this is the most
significant result for both Africa and the total worldwide gain of US $31231
billion Following close behind are the very large gains to Nigeria and the rest
of Africa aggregation In direct contrast in tariff elimination scenarios there
were gains to many of the large economies outside Africa as their export prices
rise in response to more efficient transit times in Africa
The striking feature from the Jensen and Sandrey results is that almost all of
the gains to each country overwhelmingly accrue to that same country This
may in part be a feature of the way in which they modelled their reductions as
they only addressed changes in import times in transit whereby the benefits
33 See United Nations Economic Commission for Africa (2013)
161
accrue to the importer Notwithstanding these technical issues the facts remain
that (a) these gains are substantial (b) they mostly accrue to the liberaliser and
(c) in only taking 20 of the costs of time over and above an international
benchmark they were leaving plenty of room for improvement in most African
countries And the gains in welfare although concentrated in Africa were
global in nature This goes some way to refuting the argument (paranoia) that
the gains disproportionately accrue to developed country exporters
7 Rules of Origin (ROO)
Sandrey 2015b examined the ROO and found an almost universal agreement
that the ROO as designed mainly to stop trade deflection or lsquoimports sneaking
through the back doorrsquo in preferential trade agreements are becoming
increasingly complex through an interlay of different rules and are therefore
unduly trade restricting costly to manufacturers and overall welfare reducing
They represent a NTB in a global trading environment where these NTBs are
becoming more trade restrictive than actual tariffs and especially so in a global
manufacturing and trading environment that is rapidly changing in this century
while the ROO remain firmly rooted in their 1970s base While some observers
have boldly questioned the need for the ROO unfortunately some indication of
origin of goods will always be necessary They are required as identification
for reporting purposes and also for several trade-related reasons apart from
preferential trade agreements This leaves a situation whereby the best option
forward is to re-examine the ROO and as a minimum try to simply coordinate
the rules and regimes
This state-of-the-art solution for the way forward in the reform process is
currently represented by a 2014 WTO paper (the lsquoUganda paperrsquo) which cites
an internal EU report that considers the ROO provisions to be old-fashioned
and not to be following developments in world trade ROO were drawn up in
the 1970s and have not changed much since whereas the commercial world
has They were also based on the need to protect community (EU) industry and
on the premise that beneficiary countries should be encouraged to build up
their own industries in order to comply In most cases this has not happened
Instead there has been a trend towards the globalisation of production but
ROO have not been adapted to this Compliance costs are high and the
procedures outdated and this combined with lower preferential margins and
high compliance costs makes preferences unattractive Successive rounds of
162
negotiations have substantially lowered the preferential margins and dramatic
changes in technologies and transport information technology and
communication occurred The fragmentation of production and the global value
chains approach have defeated any argument for a vertical integration of
industrial sectors that traditionally underpinned the need for strict ROO
Moreover there is no evidence that some set ROO are transparent and simple
or that they have been trade and investment creating in LDCs
As a sweeping generalisation the ROO is not a major issue in agriculture and
especially not in the African case where agriculture tends to be exported at a
primary level They are much more of an issue in manufacturing and
especially so for Africa in textile and clothing exports Thus it is hard to see
many avenues where the WTO nexus with African agriculture can be of direct
benefit Having said that the Nairobi Ministerial Conference adopted a
decision that will facilitate opportunities for least-developed countries export
of goods to both developed and developing countries under unilateral
preferential trade arrangements in favour of LDCs This gives more detailed
directions on specific issues such as methods for determining when a product
qualifies as lsquomade in an LDCrsquo and when inputs from other sources can be
lsquocumulatedrsquo and calls on preference-granting members to consider allowing
the use of non-originating materials up to 75 of the final value of the product
It also calls on preference-granting members to consider simplifying
documentary and procedural requirements related to ROO and the WTO
considers that the key beneficiaries will be sub-Saharan African countries
Hufbauer and Schott 2013 also suggest a practical way in which the WTO can
make a valuable contribution They argue that as the World Customs
Organization (WCO) has created a database of preferential rules of origin
prescribed by regional free trade agreements (RTAs) this information should be
matched by the WTO with the MFN tariff rate schedules This in turn would
identify sectors where the MFN tariffs do not differ greatly Here the WTO
could suggest to the RTA members that rules of origin are not needed to
prevent lsquotrade deflectionrsquo as the transhipment costs will eat up the tariff
advantage Furthermore the WTO could identify sectors where RTA members
could easily attain a reasonable degree of harmonisation in applied tariffs and
thereafter eliminate rules of origin since lsquotrade deflectionrsquo would no longer be a
serious problem
163
8 Trade and environment
The WTO reports that sustainable development and protection and preservation
of the environment are fundamental goals of the WTO They are enshrined in
the Marrakesh Agreement (which established the WTO) and complement the
WTOrsquos objective to reduce trade barriers and eliminate discriminatory
treatment in international trade relations While there is no specific agreement
dealing with the environment under WTO rules members can adopt trade-
related measures aimed at protecting the environment provided a number of
conditions to avoid the misuse of such measures for protectionist ends are
fulfilled
The WTO contributes to protection and preservation of the environment
through its objective of trade openness through its rules and enforcement
mechanism through work in different WTO bodies and through ongoing
efforts under the Doha Development Agenda The Doha Agenda includes
specific negotiations on trade and environment and some tasks assigned to the
regular Trade and Environment Committee and it is also looking at the effects
of environmental measures on market access the intellectual property
agreement and biodiversity and labelling for environmental purposes
Similarly while climate change per se is not part of the WTOs ongoing work
programme and there are no WTO rules specific to climate change the WTO is
relevant because climate change measures and policies intersect with
international trade in a number of different ways The WTO is also actively
seeking a way forwards with its tariff-liberalising Environmental Goods
Agreement (EGA) whereby it would build on an APEC initiative to phase out
these tariffs over time
9 Trade and Labour
Wikipedia reports that the WTO currently does not have jurisdiction over
labour standards and the only place in which they are mentioned in the entire
set of WTO Agreements is in GATT Article XX e) lsquorelating to the products of
prison labourrsquo However since the formation of the WTO in 1995 there have
been increasing calls for action on the labour standards issue and requests for a
lsquohuman face on the world economyrsquo The United Nations is among those
bodies which have criticised the current system and have called for a shift to a
human rights oriented approach to trade with steps to be taken lsquoto ensure that
164
human rights principles and obligations are fully integrated in future
negotiations in the World Trade Organizationrsquo
There are several issues that cloud the trade and labour issue for the WTO
These include political economy questions on domestic sovereignty that go
beyond current WTO positions and seek to dictate how countries treat their
citizens In strictly economic and trade terms this trade and labour boils down
to the concept of comparative advantage where developing countries with their
excess of cheap and usually unskilled labour are accused of ignoring labour
standards by developed countries The developing countries in turn see this
stance as protectionist measures In theory there is wording in the WTO
agreement that could be used to protect human rights but in practice it seems
unlikely that this will become a major WTO issue in the foreseeable future
10 Food security
At the 2013 Bali Ministerial Conference there was a proposal to shield public
stockholding programmes for food security in developing countries so that
they would not be challenged legally even if a countryrsquos agreed limits for trade-
distorting domestic support were breached When governments buy food from
farmers at supported prices to build up stocks this counts as Amber Box
domestic support and can be considered as a measure that distorts trade by
affecting market prices and the quantities produced This Amber Box support is
limited with most developing countries allowed an amount that is conceptually
minimal (de minimis) of up to 10 of the value of production Some of
developing countries are saying it is difficult to remain within these limits
Members agree that food security is a vital issue but are concerned that it
might weaken the disciplines that apply to all domestic support
It became an issue at the Bali conference and members sort a compromise
interim agreement India became the villain that stalled the entry into force of
the WTO Trade Facilitation Agreement (TFA) and the associated lsquoBali
packagersquo with the drastic reversal of the negotiating position post-Bali by
Indiarsquos new government Indiarsquos standpoint was based on its genuine concern
over food security All seems to be resolved and in April 2016 India ratified
the new TFA and an outcome from the Nairobi meetings was that Ministers
adopted a Ministerial Decision on Public Stockholding for Food Security
165
Purposes that commits members to engage constructively in finding a
permanent solution to this issue
11 Tariff quotas under-fill and special treatment
Tariff quotas (TRQs) are where import duties are lower on quantities within the
quotas and higher for quantities outside They were agreed in the Uruguay
Round negotiations as a means of allowing exporters some access to other
countriesrsquo markets when the normal (out-of-quota) tariffs on imports are high
Some countries are concerned with the methods governments use to share these
quotas among traders (TRQ administration) and that this can become an
additional trade barrier and consequently means that quotas are sometimes not
used (under-filled) Conversely importing countries argue under-fill is often
simply supply and demand in the market Developing countries have argued for
information and monitoring on these quotas along with mechanisms to ensure
quotas are filled A partial compromise was struck at Nairobi but the issue
remains largely unresolved and TRQs can be regarded as non-tariff barriers to
trade
12 Disputes settlement
Perhaps one of the real successes of the WTO has been the Disputes Settlement
Understanding The dispute of most interest to African agriculture has been the
lsquocotton problemrsquo This began in 2002 when Brazil and the four African cotton
producers of Benin Burkina Faso Chad and Mali argued that cotton subsidies
caused world cotton prices to decline and reduced their export revenues It
became a long drawn out saga and virtually ended at the Nairobi 2015 WT
Ministerial Meetings in what could be called a draw It did however highlight
two key shortcomings of the current trading system the inability of less
powerful trading partners to bring their cases to the WTO and the need to
broaden the lsquosentencingrsquo procedures to include compensation when counter-
measures from these less powerful members are not applicable Another
agricultural dispute that indirectly concerned Africa was the even longer
running banana dispute It was finally settled in 2012 with the EUrsquos revised
commitments replacing with tariffs only a complicated and WTO-illegal
banana import regime and with the Africa EPA agreements with the EU they
will have duty and quota free access
166
While the mechanism may have been (almost periphery) of benefit to Africa
and African agriculture there are undoubtedly ways in which reforms would
make it easier for smaller countries with limited resources to use The WTO
needs to give serious consideration to this
167
References
Capaldo J 2014 Trade Hallucination Risks of Trade Facilitation and
Suggestions for Implementation Global Development and Environment
Institute (GDAE) Working Paper No 14-02 June 2014
COMESA 2009Official Gazette of the Common Market for Eastern and
Southern Africa (COMESA)Volume 15 No 3 09 June 2009
Hufbauer G and J Schott 2013 Payoff from the World Trade Agenda
Report to the ICC research Foundation Peterson Institute for International
Economics April 2013
Hummels D and Schaur G 2013 Time as a Trade Barrier American
Economic Review 103 1ndash27
Jensen H G and R Sandrey 2015 Chapter 8 lsquoReduction in the time costs of
transitrsquo in The Continental Free Trade Area ndash A GTAP assessment [complete
e-book] wwwtralacorgpublications
Minor P 2013 Time as a Barrier to Trade A GTAP Database of ad valorem
Trade Time Costs Second Edition ImpactEcon
Mumford P 2014 Regulatory Coherence blending trade theory and
regulatory policy Policy Quarterly Volume 10 Issue 4 ndash November 2014
pages 3 ndash 9
Pearson M 2015 Trade Facilitation Agreement Presentation at the 2015
Annual Conference on 16 and 17 in Lusaka Zambia Available at
wwwtralacorg
Pearson M and C Chaitezvi2012 Trade Facilitation in the COMESA-EAC-
SADC Tripartite Regional Integration Research Network Discussion
Paper(RIRNDP1202)Published by TradeMark Southern Africa September
2012
168
Pearson M Trade facilitation in the COMESA ndash EAC ndash SADC Tripartite Free
Trade Area tralac Working Paper S11WP11 September 2011
SADC Declaration on Regional Cooperation in Competition and Consumer
Policies downloaded from httpwwwtralacorgfiles201103SADC-
Declaration-on-Regional-Cooperation-Competition-Policypdf
Sandrey R 2015a Where are the Singapore Issues tralac Working Paper 3
September 2015
Sandrey R 2015bRules of origin ndash looking outside the box tralac Working
Paper 11 February 2015
Sandrey R 2014 Mega-regional Trade Agreements and South Africarsquos Trade
Strategy Implications for the Tripartite Free trade Area Negotiations SAIIA
Occasional Paper No 195 July 2014
Sandrey R 2006 WTO and the Singapore Issues tralac Working Paper No 18
Stellenbosch US Printers
Shayanowako P 2014 The Bali Trade Facilitation Agreement Implications
for Southern Africa tralac Working Paper No US14WP012014 Stellenbosch
tralac
Shintaro Hamanaka 2014 World Trade Organisation Agreement on Trade
Facilitation Assessing the Level of Ambition and the Likely ImpactADB
Working paper Series on Regional Economic Integration Asian Development
Bank No 138 September 2014
United Nations Economic Commission for Africa 2013 Harmonizing policies
to transform the trading environment Assessing Regional Integration in Africa
VI United Nations Economic Commission for Africa Addis Ababa
UNCTAD 2015 World Investment Report 2015 ndash Reforming International
Investment Governance Available at httpunctadorgenpages
PublicationWebflyeraspxpublicationid=1245
Office of the United States Trade Representative (USTR) 2015 Summary of
the Trans-Pacific Partnership Agreement Press release October 2015
169
WTO 2009 Trade Policy Review Report by the Secretariat SOUTHERN
AFRICAN CUSTOMS UNIONWTTPRS222 30 September 2009
WTO 2013 Policy Review Report by the Secretariat EAST AFRICAN
COMMUNITY Revision WTTPRS271Rev131 May 2013
i Asia Pacific Economic Community Perspectives towards the APEC Bogor Goals
Perspectives of the APEC Policy Support Unit November 2010
httpwwwmfatgovtnzTrade-and-Economic-RelationsAPEC0-highlights-bogor- reportphp ii See httpwwwafdborgenblogsintegrating-africaposttrade-facilitation-in-the- bali-package-whats-in-it-for-africa-12698

Published by the Trade Law Centre (tralac)
PO Box 224
Stellenbosch
South Africa 7599
First published 2017
Language editing by Alta Schoeman
Cover design by Natalia Le Roux
Back cover text by Trudi Hartzenberg
ISBN 9780994686114
Printed by RSA Litho
copy 2017 Trade Law Centre and National Agricultural Marketing Council
All rights reserved No reproduction copy or transmission of this publication
may be made without written permission No paragraph of the publication
may be reproduced copied or transmitted save with written permission Any
person who does any unauthorised act in relation to this publication may be
liable to criminal prosecution and civil claims for damages
Publication of this book was made possible by the support of the Trade Law
Centre (tralac) and the National Agricultural Marketing Council The views
expressed by the authors are not necessarily the view of any of these
institutions
i
Contents
About the authors
iii
Preface
v
Introduction
1
Chapter 1
The profile of South African imports of agricultural forestry and
fisheries products
Yolanda Potelwa Moses Lubinga Ron Sandrey and William Mwanza 12
Chapter 2
African Agriculture and the WTO ndash the big picture
Ron Sandrey 32
Chapter 3
Analytics of the WTO Agricultural Agreement for Africa
Ron Sandrey 54
Chapter 4
How the Agreement on Agricultural might improve the South African
Agricultural Forestry and Fisheries Trade performance
Moses Lubinga Yolanda Potelwa Ron Sandrey and William Mwanza 69
Chapter 5
The Agriculture Negotiations at the World Trade Organisation
An update after the Nairobi Ministerial Conference
Miriam W O Omolo 90
ii
Chapter 6
Resolving non-tariff barrier disputes multilateral versus regional
mechanisms
William Mwanza Elizabeth Nderitu Yolanda Potelwa Ron Sandrey
and Willemien Viljoen 112
Chapter 7
Where do the Singapore and related issues fit into the WTO
Ron Sandrey 143
iii
About the authors
Ron Sandrey ndash Sandrey Ron is a tralac Associate Professor Extraordinaire
Department of Agricultural Economics University of Stellenbosch and an
Adjunct Associate Professor at the Agribusiness amp Economics Research Unit
Lincoln University New Zealand He came to South Africa in 2005 following
a career as an economist with New Zealands Ministry of Foreign Affairs and
Trade and Ministry of Agriculture and Fisheries and has since worked
extensively on trade-related issues in southern Africa He holds a PhD in
Economics from Oregon State University and currently resides in Christchurch
New Zealand
Miriam W O Omolo ndash Omolo Miriam PhD is the Director of Programmes
at the African Policy Research Institute (APRI) She manages research and
communication in the following areas trade and investment governance and
public finance natural resource and climate change and social sector She has
over 12 years of experience in international trade and development and
poverty issues having working at the Institute of Economic Affairs and the
African Economic Research Consortium both in Kenya She holds a doctorate
degree in economics from University of South Africa where she examined the
impact of trade policy reforms on household welfare in Kenya Using a
computable general equilibrium model Her main areas of research interest are
trade and development poverty and welfare and the emerging extractive sector
Miriam is also a network member of the African Economic Research
Consortium and African Growth Policy Modelling Network hosted by the
International Food Policy Research Institute
Moses Lubinga ndash Lubinga Moses is a Senior Economist for Trade Research at
the National Agricultural Marketing Council SA (NAMC) His research
supported by his passion for understanding how trade stimulates economic
development focuses on how policy decisions affect the day-to-day life style
of farmers traders and agro-processors among other actors Academically he
holds a PhD in Agricultural Economics from the University of the Free State
South Africa a MSc in Agricultural amp Applied Economics from Makerere
iv
University Uganda and a BSc in Agriculture ndash Economics from Makerere
University
Elizabeth Murungi Nderitu ndash Nderitu Elizabeth is currently the Acting
Director (Non-Tariff Barriers to Trade (NTBs) and Standards) of TradeMark
East Africa based in Nairobi Kenya She has experience in investment analy-
sis agricultural market systems development and trade facilitation Prior to
TradeMark East Africa Elizabeth worked in Kampala Uganda with Techno-
Serve a not-for-profit organization that facilitates poverty eradication through
business-driven solutions She also worked as a Research Associate with the
CARANA Corporation and as a Strategy Analyst with the US-Africa Develop-
ment Foundation in Washington DC USA Elizabeth holds a Master of
Business Administration degree in International Business from the American
University in Washington DC USA and Bachelor of Science degree in Agri-
cultural Education and Extension from Egerton University in Njoro Kenya
William Mwanza ndash Mwanza Williamis a Trade and Competitiveness Consul-
tant at the World Bank Group He holds a Bachelor of Social Science Degree in
Economics from the University of Malawi Postgraduate Diploma in Manage-
ment Practice (Trade Law and Policy) offered by tralac and the University of
Cape Town Masters in Development Policy Practice and Process from the
University of Reading and an LLM in International Economic Law from the
University of Edinburgh
William worked as Researcher at tralac from 2013 to 2016 His main research
interests are in the political economy and law of international trade and invest-
ment industrial policy community law and regional integration in Africa
Yolanda Potelwa ndash Potelwa Xolisiwe Yolanda is an Economist at the
National Agricultural Marketing Council SA(NAMC) Her work includes trade
research under the MERC Division Currently she is working on issues
relating to non-tariff measures (NTMs) more particularly Sanitary and Phyto-
sanitary (SPS) issues in the fruit industry
Willemien Viljoen ndash Viljoen Willemien holds a Masterrsquos degree in Eco-
nomics and a Bachelor of Laws degree (LLB) from the University of Stellen-
bosch Her research interests are in regional integration and international trade
policy and specifically in issues pertaining to non-tariff barriers to trade trade
data analysis and modelling and trade and climate change
v
Preface
Let me start with the relationship between the NAMC and tralac which has
resulted in many scientific outputs In the book titled Africarsquos trade
relations ndash Old friends good friends and new friends published in 2015 I
outlined the awards won by products of the relationship This book marks
another milestone in the longstanding relationship between the two
organisations that has also seen many capacity building initiatives called
Geek Weeks that provide an opportunity for young professionals to work
with established scholars such as Professor Ron Sandrey to mention one
The book examines the complex multilateral trade negotiations
specifically as regards the inclusion of agriculture as part of the multilateral
talks The agriculture trade talks started in 2000 in terms of the original
mandate of the Agreement on Agriculture and then became part of the
Doha Round of negotiations in 2001 Many scholars argue that following
the completion of the Uruguay Round (UR) the sensitive issues
surrounding agriculture are the main reasons why the Doha Round of trade
negotiations is proving so difficult to conclude It seems to me that these
scholars are right Trade Ministers at the 2013 Bali Ministerial Conference
adopted important decisions on agriculture and at the most recent
Ministerial Conference in December 2015 in Nairobi members of the
WTO agreed to eliminate agricultural export subsidies This marks an
extremely important step in the reform of international trade rules on
agriculture since the establishment of the WTO This book focuses on these
developments as well as the increasingly important role of non-tariff
barriers that impact international of agricultural products In addition an
examination of dispute resolution provisions in the WTO and in regional
trade agreements is also presented The analysis emphasises that a rules
based system of international trade requires a well-established dispute
settlement mechanism and the enforcement of rules
vi
Thank you to tralac and the NAMC team for compiling such an exciting
book that covers a broad range of issues including the current and relevant
issue of non-tariff barriers
Tshililo Ronald Ramabulana
Chief Executive Officer
National Agricultural Marketing Council
1
Introduction
There are generally considered to be four legs to the global trading seat of trade
liberalisation These are the unilateral leg or what one does on onersquos own the
bilateral leg or what one does between one other partner the regional leg
representing what one does with more than one partner and the multilateral leg
or what one does with all of onersquos trading partners collectively Over the last
few years the third leg that of regionalism in the form of free and partial trade
agreements has become more in vogue on the international trade policy scene
and in particular the two so-called Mega agreements of the Trans-Pacific
Partnership Agreement (TPPA) and the proposed Transatlantic Trade and
Investment Partnership (TTIP) between the European Union and the United
States On the African scene politicians have conveniently skipped over the
Tripartite Free Trade Arrangement (T-FTA) that has not advanced much past
the talking phase and are concentrating on promoting continental integration
through the Continental Free Trade Agreement (CFTA)
Meanwhile the WTO remains the largest trading bloc despite being in a state
of what many regard as moribund and having done little since its inauguration
as a part of the old General Agreement on Trade and Tariffs (GATT) to further
its mandate of facilitating a free global trading system Undoubtedly the GATT
had made significant progress in liberalising merchandise trade with tariff
rates on manufactured goods now often at very low levels There was much
hope for agriculture reform at the inauguration of the WTO following the
Uruguay Round (UR) as for the first time agriculture had been an important
and significant part of the outcome of a GATT Round Domestic subsidies for
agriculture were at least forced into a restrained set of rules that must take
credit for being a major factor curtailing their worst excesses Tariffs have been
reduced although there are significant exceptions to this statement and in
particular in the importation of sensitive products to developed country
markets
The WTO covers trade in goods services and intellectual property dispute
settlements and a periodic review of the trade policy of members Within goods
2
there are the two basic divisions of agriculture and non-agriculture and this
paper is primarily concerned with the WTO role in agriculture In turn the
agricultural interests of the WTO concern the three basic areas of
i Substantially reducing tariff and non-tariff measures that would ensure
market access of agricultural products
ii Reduction and ultimately phasing out all artificial forms of export
competition
iii Substantial reduction in domestic support that would ensure non-trade
distortion
Proposals based around moving forward in these three broad areas have been
on the table since 2004 with little progress except in the export competition
area Outside of these broad categories perhaps the main one that is of direct
interest to African agriculture is the dispute mechanism and here the focus is
largely upon the cotton case In understanding the WTO one must appreciate
that not all members are equal The organisation comprises a self-selection
made of both developed and developing countries (which includes a sub-
category of least developing countries) with all the African countries in the
developing category In general these developing countries are not required to
meet as strict a compliance target as the developed countries and indeed for
those in the least developing category the targets are currently such that in most
cases little adjustments would be needed in their policies to meet an agreement
of the DDA
Against this background the object of the current book is to examine the
current proposals associated with the DDA and assess what a successful
agreement might mean for African agriculture We concentrate upon the three
keys themes that are core to agriculture in the WTO those of domestic
supports market access and export incentives We fully recognise that the
WTO and the DDA is about more than just these core themes and introduce
many of these activities in different chapters to assess the WTOrsquos relevance of
these to African agriculture
A little more on the WTO and the DDA
Chapter 1 provides a comprehensive background to the WTO and elaborates on
the general points made above An important aspect of the DDA is that it
operates as a single undertaking meaning that nothing is agreed until
3
everything is agreed Thus failure to agree in one aspect of the negotiations
can stall the whole process
The market access negotiations focus on the six aspects of tariffs tariff quotas
administration special safeguards state trading enterprises and the sixth being
other issues Tariff reductions are the main issue here and this operates on a
formula basis that juggles between deeper cuts for developed member rates
generally higher cuts for higher starting rates (and importantly these are bound
and not applied rates) and maximum and minimum rates within the different
tariff bands to average out within the band Domestic supports operate in a
regime of green (permitted) special and differential (amber) and an additional
blue box Most attention focusses on the amber box where the reductions are
proposed although the interplay between boxes is somewhat complex at times
Export competition is becoming less of an issue as there was significant
progress at the Nairobi Ministerial in achieving a reduction in export subsidies
Unfortunately little or no progress was made at Nairobi on market access or
domestic supports although some progress was made on issues such as food
stockpiling food aid and the cotton dispute
Estimates of the value of DDA outcomes
In recent years the global trade modellers of the world or perhaps more
accurately their patrons have largely moved on from assessing the gains from
an outcome from the WTOrsquos DDA Perhaps it is because as the DDA stalled it
lost some of its lsquosexinessrsquo appeal or perhaps it was because as trade models
become more sophisticated their assessments and the limitations of the DDA
for agriculture became more apparent the magnitude of the gains declined The
salient feature of this modelling research is that the gains for Africa are modest
with some countries actually losing welfare through results such as preference
erosion in developed markets This chapter undertakes a review of the literature
that is relevant to quantitative analysis of the impacts of the DDA with special
reference to Africa and South Africa While some of this review may be a little
dated that is of no real concern in that the general principles of the stalled
DDA have barely changed although what has changed in recent years is that
the computer model analysis has become more sophisticated This is especially
so for the Global Trade Analysis Project (GTAP) the model of choice for most
practitioners as more countries have been added to its data base and the trade
and economic data is continually moving forward
4
Assessment results reflect changes from a combination of better models that
have more recent information such as the final UR tariffs the full implications
of Chinarsquos accession to the WTO incorporated an ability to model tariff
revenue losses and the impacts of trade creationdiversion effects the
consequences of the erosion of tariff preferences and a scaling down of the
DDA ambitions that are now being modelled as more realistic assumptions of
any outcome Virtually all of the recent modelling work is pointing to reduced
gains from the DDA and even in some cases for developing countries to
losses These modest results are accentuated by the problems facing Africa in
its major infrastructural and capacity constraints that will severely limit the
abilities of most African countries to take advantage of any new opportunities
We also find that reforms to the highly protected sugar regimes in developed
countries and the consequential market outcomes are not necessarily good
news for all African producers For example simulating changes to the EU
sugar regime and introducing a situation where inter-African tariffs are
eliminated confirm that these reforms are dominated by changes in the African
sugar production and trade profiles The big gainers are South Africa from
enhanced sugar exports to mainly Kenya and Kenya itself as resources are
diverted away from its inefficient sugar sector
Another WTO programme that has generated interest is the issue of trade
facilitation We examine tralac research relating to simulations of time in
transit to proxy infrastructural deficits in Africa such as delays at border
crossings roadblocks for trucks and the necessity to pay bribes The welfare
gains to Africa were substantial The striking feature is that almost all of the
gains to each country overwhelmingly accrue to that same country and that (a)
these gains are substantial (b) they mostly accrue to the liberaliser and (c) in
only taking 20 of the costs of time over and above an international
benchmark we are leaving plenty of room for improvement in most African
countries Similarly while not strictly speaking a WTO issue tralac used this
GTAP computer database and the full suite of African agricultural sectors and
African countriesregions in order to assess the benefits of intra-African tariff
abolition in agricultural trade across the continent This research suggests that
Africa has as much to gain from its own continental liberalisation of
agricultural trade as it does from relying on the WTO
5
The global agricultural profile as it relates to African agriculture
This chapter examines the two main remaining agricultural issues of market
access and global domestic supports to assess where gains to Africa may come
from The primary focus is on the gains for African agriculture and overall
African welfare It starts by providing a profile of African agricultural exports
by the main sources and products and examines this trade in detail to assess the
tariff duties faced in their markets to glean some information as to where the
WTO may be able to assist exports This examination suggests that given the
African export profile and current access conditions more progress in access
gains may result from better access into both the EU and fellow African
countries and we argue that in the former the EPAs and the Trade
Development and Cooperation Agreement (TDCA) are the best negotiating
forums for European destinations and the suite of African integration
negotiations in progress offer the best opportunities for intra-African access
liberalisation In general tariffs facing agricultural exports from least
developed countries into developed countries are declining to a very low level
although there are still lsquosome nuts to crackrsquo (sugar in particular)
An assessment on the profile on global agricultural subsidies shows that in
many but not all cases domestic agricultural subsidies are declining and that
the declining role of export subsidies along with recent progress on an
agreement here means that these export subsidies are a minor issue Overall
OECD agricultural protection is declining dramatically driven by the weight of
the US and EU declines In the category of highly supported regime there are
the well-known lsquoculpritsrsquo of Switzerland Norway Japan and Korea along with
the two surprises of Indonesia and China where protection is climbing rapidly
In general subsidies globally are concentrated upon the so-called rice pudding
of rice milk and sugar Only sugar is of export interest to Africa South Africa
and Swaziland in particular for exports and Kenya for imports Both cotton and
oilseeds are also important and cotton carries much symbolic significance for
Africa
The overall assessment is that there seems to be few of the major African
agricultural exports where the WTO could provide some benefits and
especially against the background of low agricultural tariffs into developed
countries from LDCs More specifically cotton seems to be more of a flash-
point than an actual source of benefits and there is an outside possibility that
perhaps some relief from the high (20) tariffs into China may result from an
6
agreement at the WTO Sugar trade exists in a complex regime but solutions
through this maze for African producers are best pursued within Africa itself
by negotiations in the African trade agreements currently in play and between
South Africa and the EU under the TDCA Several of the main products ndash
cocoa coffee and tea live animals ndash exist in an almost duty free environment
for African exporters Of the others for fruit and vegetable exports non-tariff
barriers are probably the main worry as South Africa the main fruit exporter
faces tariff complexities in the EU and high tariff barriers into China and India
Although tobacco exports from the main suppliers have duty free access into
EU and South African markets tobacco exports from Zimbabwe to China face
a high 2375 tariff The semi-related products of oil seeds and animal and
vegetable fats are largely destined for the EU and Africa and here if the
imports are not already duty free then bilateral or regional negotiations must
offer the best possibilities for improved access conditions
South African agricultural forestry and fisheries exports ndash a profile
In the next two chapters we examine the profile of South Africarsquos exports and
imports respectively and here we extend the analysis to include both forestry
and fisheries products This is because both are under the auspices of the South
African Department of Agriculture Forestry and Fisheries (DAFF) We
analyse market access conditions only as the previous chapter shows that it is
through market access that the major overall gains may come from the WTO
for agriculture while for fisheries the WTO does not investigate subsidy
supports to member countries
For the agricultural sector we find that a significant portion of exports from
South Africa is destined either for the EU or for fellow African destinations
We consider that for the former any gains for market access are likely to come
from direct negotiations under the umbrella of the TDCA rather than
multilateral agreements Furthermore a multilateral agreement improving EU
market access conditions is likely reduce South African preferential access
conditions and therefore be of little or no value to South Africa Africa itself is
becoming an increasingly important destination for South African agriculture
we similarly consider that access conditions on the continent are much more
likely to improve with direct negotiations through the SDAC FTA the Trindash
Partite FTA or the Continental FTA Importantly as most African WTO
members are least developed countries they are very unlikely to have to make
market access conditions under any foreseeable WTO outcome and moreover
7
any access concessions that they do make to all competing external sources are
once again likely to reduce possible preferences for South Africa
We confirm this general picture by analysis of the top-10 agricultural exports at
the HS 4 level into the top-10 export destinations We find that fellow SACU
destinations of Botswana Lesotho Namibia and Swaziland all of whom are in
the top-10 destinations are all duty free under the SACU agreement and
Zambia only applies duties on exports of South African citrus fruits and even
here the rate is under 1 Both Mozambique and Zimbabwe have a mixture of
zero low and modest rates This leaves the three top-10 destinations of the EU
China and the US The same general pattern of a mixture of zero low and
modest rates also applies to US applied tariffs for South Africa with cane
sugar and related products being the sectors where access conditions could
improve We have observed that the TDCA governs access conditions for
South Africarsquos premiere market of the EU and note that despite this bilateral
agreement most of the exports to the EU have duties assessed In particular the
sugar tariff is 3773 This leaves China as the outlier where tariff rates are all
double figures Our analysis of course ignores possible markets where lsquotrade
chillingrsquo inhibits or prohibits exports from South Africa although as a
generalisation we consider that these cases may be limited to sugar and
associated products
For the forestry exports the situation is less complex Again examining the
major markets by the major commodities we find that the exports to the EU
Japan Namibia Botswana and Mozambique are all duty-free The same
conditions apply to exports into both Indonesia and Thailand where virtually
the only products of wood pulp are also duty-free This leaves the major market
for 2015 of China India and Zimbabwe For China exports of wood pulp the
dominant export and the next most important wood chips are all duty-free
leaving only modest exports of paper and paperboard facing tariffs of 412
For India exports duties are 50 except for some negligible trade at 10
Zimbabwe imports a wider range of forestry products and here the tariffs are
generally either at or near duty-free or at or near 10 Overall there are very
few exports facing duties in the major markets other than India or Zimbabwe
Five of the 11 major markets for South African seafood exports are duty-free
namely Hong Kong USA Namibia Botswana and Mauritius Mozambique
imposes a 20 duty on crustaceans but otherwise is duty-free Despite the
TDCA the EU again the major market levies duties ranging from 315 to
8
1570 and again the appropriate negotiating process is through the TDCA
This leaves the minor markets of Japan Vietnam Australia and Taiwan
(Chinese Taipei) Japan imposes tariffs ranging from 192 to 1039
Vietnam has duties of 761 and 567 on its two import lines Australia has
only one dutiable import line at 281 and Taiwan has duties ranging up to
1953 Thus the major access concerns are the EU Mozambiquersquos
crustaceans and to a lesser extent Japan Lesser but still important access issues
remain with Vietnam and Taiwan
Overall we see few cases where the WTO negotiations may improve South
Africarsquos access conditions into the major markets for these exports In all cases
the EU is the top destination and except for forestry products access con-
ditions are generally constrained Africa is becoming increasingly important
and here the access conditions are more likely to improve through direct intra-
African agreements in the different negotiations that are in progress In
particular Zimbabwe remains problematical
South African agricultural forestry and fisheries imports ndash a profile
The objective of this second South African paper is to evaluate the profile for
South African agricultural forestry and fisheries imports in recent years We
generally use trade data over the period from 2010 to 2015 inclusive as it is
only over this period that reliable and easily accessible trade data is available
The key findings from this research are that imports of both agricultural and
forestry products have been steadily climbing while imports of fishery products
have been more volatile but are in general also increasing
The main agricultural imports have been wheat rice and poultry meats with a
significant share of both wheat and poultry imports sourced from the EU and
the rice from mainly Thailand and India Next are spirits from mainly the EU
cane sugar from Swaziland and Brazil and palm oils from Indonesia while
South African climatic conditions have forced an increased quantity of maize
to be imported from South America The duties on poultry meats wheat and
sugar have all increased in recent years as South Africa strives to protect
domestic producers although diluting these efforts are the significant imports
from the preferential sources of the EU and SACUSADC countries Imports of
both rice and maize are duty-free from all sources
9
For 2015 paper was the main forestry product imported followed by printed
products such as books brochures and similar products and then sawn timber
The EU is again the main supplier (where all imports are duty free) followed
by China the USA and Swaziland South African non-preferential tariffs are
modest with the highest rates being 1015 levied on packing containers
607 on uncoated paper and 579 on printed material not elsewhere
specified Five of the top ten products enter duty-free from all sources while
paper with cellulose face a low nuisance tariff of 092
Namibia was ranked as number one supplier of fishery products to South
Africa followed by Thailand India and China with the EU only ranked in
eighth position The highest tariff rate assessed on fishery products is a 25
rate levied on non-preferential imports of extracts and juices of fish while
three lines are duty-free or below 1 All non-EU preferential imports are
tariff free (and that includes Norway) Significantly EU imports into South
Africa from the EU are subject to tariff rates that in most cases do not give the
EU any tariff preferences
How may the Agreement on Agricultural improve the Agricultural
Forestry and Fisheries Trade performance of the BLNS1 countries
through better market access
This chapter is a companion paper to a similar analysis of South African
exports of agricultural forestry and fisheries products and here we similarly
include the three sectors for consistency although we eschew an analysis of the
BLNS imports in these products The major BLNS exports are sugar and sugar-
related and beef and other meats The sugar is from Swaziland while the beef
products are from both Botswana and Namibia In all cases South Africa and
the EU are the dominant export destinations followed generally by neigh-
bouring or near-neighbouring African countries Again in all cases entry into
South Africa and the EU is duty free and entry into several African countries is
also largely duty free Thus access conditions requiring further negotiations
are mostly limited to fellow African countries and here we consider that
African trade agreement negotiations already on the table are the appropriate
forums and not the WTO This leaves very few instances where the WTO may
be of benefit to BLNS agricultural exports
1 Where BLNS represents Botswana Lesotho Namibia and Swaziland
10
With respect to the individual BLNS countries Botswana exports mainly beef
and related products Lesotho wool and wheat milling related products
Namibia again beef related products along with grapes and beer and
Swaziland almost exclusively sugar and sugar-related products The duty-free
markets of South Africa and the EU dominate the destination profiles except
for Lesotho where South Africa is effectively the only market for agricultural
products
The situation regarding market access for forestry products is even more clear-
cut as exports to the dominant destination of South Africa and the third market
of the EU are duty-free and exports to second placed Zambia are largely duty-
free This basically only leaves some African destinations among the majors
with possible duties that would again be best addressed through African
negotiations
Fishery exports to the main destinations of South Africa and the EU are again
duty free as are minor exports to Hong Kong the US and Australia Again a
significant percentage of the other destinations are African countries where any
remaining tariffs associated with these exports would be best negotiated under
one of the several African agreements Thus except for relatively minor exports
to China and Japan which attract similarly relatively minor tariffs the
complete access position can be summed up as being either (a) duty free or (b)
where this is not the case then it is a matter of negotiations in African agree-
ments or the very minor duties into Japan and China It is therefore difficult
based on this evidence to see the WTO negotiations doing much for BLNS
(mostly Namibian) fisheries exports
Overall there appears to be very limited export markets where the BLNS
exporters of agricultural forestry and fisheries products can expect the WTO to
provide access gains
How do other related issues fit into the WTO
This book to date has focussed on the traditional core values of the WTO and
their relationships to African agriculture This chapter expands upon these core
WTO issues and looks at some of the new and emerging trade issues and sees
where the WTO fits into this landscape and how they may impact on Africa
Much of the attention is devoted to looking at the so-called Singapore issues of
trade and investment competition policy transparency in government procure-
11
ment and trade facilitation Here we find that while the WTO now has a
minimal interest in the first three of these important issues it has a strong
presence in trade facilitation Consequently we examine trade facilitation in
more detail and see that improvement here is certainly needed in Africa but
caution that there are a lot of commentators questioning whether the reality of
the programme will match the rhetoric that has been associated with it
Other trade related issues examined are rules of origin trade and environment
trade and labour food security tariff quota issues and the WTO disputes
settlement mechanism Again while the WTO is involved to varying degrees in
these issues there are few cases where direct gains to African agriculture can be
foreseen in the near future
One aspect of agricultural trade that is attracting attention is the issue of value-
added in the process chain and constraints to fully benefiting from being able to
move up this chain We have not examined the role that the WTO may be able
to play here directly so we shall introduce some points at this stage The first
factor that is important is the issue of tariff escalation and how increased tariffs
may constrain further processing In analysis of tariffs facing African agri-
cultural exports in this book we concluded that tariff escalation is not really a
problem for most of the African agricultural exports as exports to the EU and
US in particular are generally quota and duty free Where problems exist in
Africa this is more a matter for regional negotiations rather than multilateral
negotiations Other factors inhibiting value-added are the various NTBs and
again this is covered in the book These NTBs can be very broad and in
Africarsquos case the inefficient processing and transport structures are definite
barriers but these are addressed by unilateral or possibly bilateral actions
rather than through the WTO An example of this is the costs to Africa of time
in transit as reducing these are crucial for value-added In general we consider
that the WTO offers little for enhancing African value-added opportunities
unless of course the WTO trade facilitation benefits are fully realised
12
Chapter 1
The profile of South African imports of
agricultural forestry and fisheries products
Yolanda Potelwa Moses Lubinga Ron Sandrey
and William Mwanza2
1 Introduction
The objective of this paper is to evaluate the profile for South African
agricultural forestry and fisheries (AFF) imports in recent years We expand
the traditional agricultural sector as the Department of Agriculture Forestry
and Fisheries (DAFF) in South Africa administer all these three sectors We
generally use trade data over the period from 2010 to 2015 inclusive as it is
only over this period that reliable and easily accessible trade data is available
The key findings from this research are that imports of both agricultural and
forestry products have been steadily climbing while imports of fishery products
have been more volatile but are in general also increasing
The main agricultural imports have been wheat rice and poultry meats with a
significant share of both wheat and poultry imports sourced from the EU and
rice from mainly Thailand and India Next are spirits from mainly the EU cane
sugar from Swaziland and Brazil and palm oils from Indonesia while South
African climatic conditions have forced an increased quantity of maize from
South America The duties on poultry meats wheat and sugar have all
2 Economist National Agricultural Marketing Council (NAMC) Senior Economist NAMC
tralac Associate and tralac Researcher respectively This paper is an output from the lsquoGeek
Weekrsquo data training workshop held at tralac during the week of Monday 11 April to Friday 15 April 2016
13
increased in recent years as South Africa strives to protect domestic producers
although diluting these efforts are the significant imports from the preferential
sources of the EU and SACUSADC countries Imports of both rice and maize
are duty-free from all sources
For 2015 paper was the main forestry product imported followed by printed
products such as books brochures and similar products and then sawn timber
The EU is again the main supplier followed by China the USA and Swazi-
land Tariffs here are modest with the highest rates being 1015 levied on
packing containers 607 on uncoated paper and 579 on printed material
not elsewhere specified All imports from preferential partners are duty free as
are several lines for all sources
2 South Africarsquos agricultural import profile
Figure 1 shows the AFF trade performance between 1996 and 2014 and since
the implementation of AoA South Africarsquos AFF trade has improved an average
of 12 between 1996 and 2014 In most years exports have been marginally
above imports leading to a positive trade balance as shown
Figure 1 South African AFF trade performance
Source World Trade Atlas
14
21 Agriculture Forestry and Fishery Import profile into South
Africa
Imports of Agricultural products
This section focuses on agricultural imports into South Africa from the world
between 2010 and 2015 with agricultural products as defined by the WTO In
2015 South Africa imported a total of R92 billion with EU-28 as the leading
supplier with imports worth R28 billion Swaziland was in second place with
R72 billion followed by Argentina China and Thailand
Table 1 Main suppliers of agricultural products in South Africa
Source TradeMap
Table 2 expresses this same data as percentage shares of South Africarsquos main
suppliers of agricultural imports between 2010 and 2014 The EUrsquos imports
have been somewhat stable during the period with a low of 268 in 2012 and
a high of 325 in 2014 before declining again to 305 in 2015 Swazilandrsquos
share increased significant between 2010 and 2015 (by 21 percentage points)
and this was largely an increase of sugar imports Shares from both Argentina
and China showed fluctuations against a general decline while those from
Thailand Brazil USA and Namibia also declined over the period In the lower
Values in millions Rand
Sources 2010 2011 2012 2013 2014 2015
World 48 035 59 621 72 498 79 979 84 273 92 379
EU-28 12 895 16 164 19 412 22 749 27 428 28 171
Swaziland 2 797 3 138 4 778 5 987 6 499 7 330
Argentina 4391 5 587 6 828 5 590 4 163 5 907
China 2 757 3 028 5 512 5 697 4 518 5 017
Thailand 3 428 3 540 4 077 4 457 4 204 4 908
Brazil 3 033 3 805 4 489 4 960 3 500 4 691
India 1 427 1 969 2 700 3 711 3 667 4 127
USA 2 497 3 684 2 997 3 710 3 934 3 852
Namibia 2 818 3 386 3 365 3 597 2 949 3 568
Indonesia 1 411 1 809 2 241 2 682 3 931 3 029
15
segment of Table 2 the respective shares for India and Indonesia both slowly
increased
Table 2 Main suppliers of agricultural products in South Africa ( share values)
2010 2011 2012 2013 2014 2015
EU-28 268 271 268 284 325 305
Swaziland 58 53 66 75 77 79
Argentina 91 94 94 70 49 64
China 57 51 76 71 54 54
Thailand 71 59 56 56 50 53
Brazil 63 64 62 62 42 51
India 30 33 37 46 44 45
USA 52 62 41 46 47 42
Namibia 59 57 46 45 35 39
Indonesia 29 30 31 34 47 33
Source TradeMap
Tables 3 and 4 show main agricultural products imported by South Africa
between 2010 and 2014 with this data expressed in R million in Table 3 and
the associated percentage shares in Table 4 Wheat and Rice were the largest
single import lines and are both essentially staple foods Poultry was the third
largest single product (R45 billion in 2015) followed by spirits and cane sugar
Note the large increase in maize imports as drought conditions reduced
domestic production and forced South Africa to import significant quantities of
maize
16
Table 3 Main imported agricultural products into South Africa R million
Values in Million Rand
HS
code Product description 2010 2011 2012 2013 2014 2015
AGRIC PRODUCTS 48035 59621 72498 79979 84273 92379
1001 Wheat and muslin 2026 4230 3941 4005 5376 5942
1006 Rice 3023 3651 5613 6412 4558 5436
0207 Poultry 1750 2706 3510 3876 4055 4574
2208 Spirits 2276 2603 2840 3733 3741 3692
1701 Cane Sugar 1666 1983 2507 3546 2935 3414
1511 Palm oil amp its fraction 2176 2930 3292 2960 3788 3118
2304 Soya-bean oil-cake 2471 2578 2798 3155 2755 2370
2106 Food preparations
nes 1002 1194 1401 1845 2054 2212
1005 Maize (corn) 91 285 731 114 399 1856
2309 Animal feed nes 671 910 1109 1161 1440 1698
Source TradeMap
Again Table 4 presents the same data expressed as percentage shares and
shows that agricultural imports as a share of total imports is generally stable
though fluctuating somewhat Demand for poultry meats has been steadily
increasing and between 2010 and 2015 these imports increased by 16
percentage points in terms of share
17
Table 4 Main imported agricultural products into South Africa (share values)
HS code Product description 2010 2011 2012 2013 2014 2015
Agriculture share in total imports 70 72 75 69 66 74
1001 Wheat and muslin 48 8 62 58 75 75
1006 Rice 72 69 88 93 64 69
0207 Poultry 42 51 55 56 57 58
2208 Spirits 54 49 45 54 52 47
1701 Cane Sugar 40 37 39 52 41 43
1511 Palm oil amp its fraction 52 55 52 43 53 40
2304 Soya-bean oil-cake 59 49 44 46 38 30
2106 Food preparations nes 24 23 22 27 29 28
1005 Maize (corn) 02 05 11 02 06 24
2309 Animal feed nes 16 17 17 17 20 22
Source TradeMap
Table 5 introduces a matrix that shows the values from the main country
sources by the top 20 import commodities It shows that wheat is mostly from
by the EU-28 market followed by Argentina and Namibia Rice is mostly
imported from Thailand and India with minimal imports from Brazil USA and
Namibia while the EU-28 and Brazil sources mainly supply the poultry
imports The EU-28 is the largest supplier of wheat poultry meat spirits and
food preparations Namibia was the eight supplier of agricultural product and
the data shows that live cattle to be eventually slaughtered in South Africa is
the main import from Namibia
18
Table 5 Matrix of main agricultural products imported by sources R million for 2015
Source TradeMap
EU-28 Argentina Thailand Brazil Swaziland Indonesia India Namibia China USA
Total 13571 5256 4336 3771 2700 2298 2114 1543 1364 1201
Wheat 1559 192 0 0 0 0 0 0 0 155
Rice 7 0 2963 46 0 0 1713 28 33 10
Poultry meat 2645 214 29 1660 3 0 0 0 0 3
Spirit 3157 0 1 33 0 0 0 0 1 225
Cane sugar 8 0 23 623 2426 0 45 3 1 1
Palm oil 0 0 0 0 0 2163 0 0 0 0
Soya-bean oil-cake 0 2367 0 1 0 0 2 0 0 0
Food preparations nes 1258 26 23 6 42 1 46 0 85 429
Maize (corn) 1 932 0 603 1 0 1 0 0 105
Animal feed nes 1092 14 12 30 137 0 2 8 83 173
Soya-bean oil 767 922 0 0 0 0 0 0 0 1
Tobacco 121 0 0 515 0 0 180 0 17 0
Chocolate 916 0 0 6 52 4 4 0 16 22
Coffee 168 0 0 84 0 117 9 0 0 11
Live cattle 0 0 0 0 12 0 0 1070 0 0
Sunflower oil 928 153 0 0 0 0 0 0 0 0
Coffeetea 698 0 0 17 17 0 93 0 2 16
Juices 89 401 13 46 10 1 11 0 346 10
Guts bladders etc 136 35 0 101 0 0 8 0 566 35
19
South African imports of Forestry products
Examining South Africa sources of forestry products (Table6) we find that the
EU is the largest supplier followed by China and USA At the bottom of the
table note that India and Turkey round out the top 12 sources with imports
from Turkey increasing in 2015
Table 6 Main suppliers of forestry products in South Africa
Values in million Rand
Exporters 2010 2011 2012 2013 2014 2015
World 12493 13481 15299 18200 20015 21127
EU-28 5836 5885 6963 8573 9159 9236
China 1265 1568 1869 2240 2552 2814
USA 1066 1134 1158 1374 1604 1683
Swaziland 555 599 856 891 902 1154
Brazil 304 495 526 600 800 721
Malaysia 512 549 610 588 640 705
Indonesia 524 524 481 499 505 571
New Zealand 81 76 185 397 611 558
Korea Republic of 365 381 527 485 435 453
India 198 205 256 272 371 442
Turkey 92 66 24 28 47 365
Source TradeMap
This same data is again expressed in percentage shares in Table 7 The EU
market share has been somewhat stable between 2010 and 2015 with a low of
44 in 2011 and highs of 47 in 2010 and 2013 Most other sources have also
been relatively stable with perhaps Chinese and Turkish imports the exception
to this as their shares have increased over the period shown
20
Table 7 Main suppliers of forestry products in South Africa (shares)
2010 2011 2012 2013 2014 2015
EU-28 47 44 46 47 46 44
China 10 12 12 12 13 13
USA 9 8 8 8 8 8
Swaziland 4 4 6 5 5 5
Brazil 2 4 3 3 4 3
Malaysia 4 4 4 3 3 3
Indonesia 4 4 3 3 3 3
New Zealand 1 1 1 2 3 3
Korea Republic of 3 3 3 3 2 2
India 2 2 2 1 2 2
Turkey 1 0 0 0 0 2
Source TradeMap
Tables 8 and 9 show main forestry products imported by South Africa between
2010 and 2015 by HS 4 products This data is in values expressed by R million
in Table 8 and the associated percentage shares in Table 9 Paper with
cellulose paper with kaolin and printed books were among the top thee
imported products by South Africa
21
Table 8 Main imported forestry products into South Africa R million by HS 4
codes
Values in Million Rand
Code Product label 2010 2011 2012 2013 2014 2015
HS 4 Forestry 12493 13481 15299 18200 20015 21127
4811 Paper with cellulose 1185 1405 1844 2299 2848 3102
4810 Paper with kaolin 2121 2096 2372 2516 2594 2730
4901 Printed booksbrochures 1696 1594 1798 2003 1865 1816
4407 Wood sawn 833 937 1122 1136 1267 1512
4802 Uncoated paper 888 757 1236 1394 1381 1368
4804 Uncoated Kraft paper 395 489 625 927 1058 1157
4819 Packing containers 381 388 450 619 743 864
4703 Chemical wood pulp 304 336 349 597 873 850
4412 Plywood 226 295 402 451 653 630
4911 Printed matter nes 260 257 330 321 405 546
Source TradeMap
Overall forestry products have ranged between 18 and 21 of South
Africarsquos total imports over the period The increases leading up to and
including 2015 were mainly from paper with cellulose wood sawn and
uncoated kraft paper with increased shares of 21 1and 04respectively
between 2013 and 2015
22
Table 9 Main imported forestry products into South Africa (share values)
2010 2011 2012 2013 2014 2015
Forestry 21 18 18 18 19 20
4811 Paper with cellulose 95 104 121 126 142 147
4810 Paper with kaolin 170 155 155 138 130 129
4901 Printed books amp
brochures 136 118 118 110 93 86
4407 Wood sawn 67 70 73 62 63 72
4802 Uncoated paper 71 56 81 77 69 65
4804 Uncoated kraft paper 32 36 41 51 53 55
4819 Packing containers 30 29 29 34 37 41
4703 Chemical wood pulp 24 25 23 33 44 40
4412 Plywood 18 22 26 25 33 30
4911 Printed matter nes 21 19 22 18 20 26
Source TradeMap
Table 10 introduces a matrix presenting forestry imports into South Africa by
source country and HS 4 classifications Again the EU is the source of most of
these imports followed China and USA Imports of wood pulp from New
Zealand are significant while both India and Korea are important sources of
paper
23
Table 10 Matrix of main imported forestry products and their sources R millions for 2015
HS code EU China USA Swaziland Brazil Malaysia Indonesia New Zealand Korea India
4811 Paper with cellulose 1767 234 120 0 62 62 35 0 14 286
4810 Paper with kaolin 1568 439 130 0 83 83 32 0 383 8
4901 Printed books amp brochures 943 151 383 164 1 1 0 0 2 31
4407 Wood sawn 43 5 122 496 54 54 50 0 0 0
4802 Uncoated paper 875 150 21 0 105 105 88 0 1 31
4804 Uncoated kraft paper 647 8 66 0 101 101 6 0 1 2
4819 Packing containers 368 173 16 141 12 12 2 0 3 6
4703 Chemical wood pulp 108 6 340 0 27 27 33 260 0 0
4412 Plywood 125 265 5 0 109 109 11 8 0 7
4911 Printed matter nes 276 83 33 0 0 0 0 0 2 5
4411 Fibreboard of wood 250 75 0 0 53 53 0 1 1 0
4823 Other paper 225 115 32 0 1 1 22 0 31 8
4418 Builders joinerycarpentry wood 121 77 0 3 1 1 129 3 0 1
4704 Chemical wood pulp 10 0 33 0 7 7 0 273 0 0
4805 Paperpaperboard nes 176 55 20 0 4 4 12 0 0 0
4813 Cigarette paper 185 14 71 0 34 34 1 0 0 0
4803 Sanitary paper 35 136 1 0 0 0 29 0 0 6
4416 Casks barrels etc of wood 226 1 31 1 0 0 0 0 0 0
4818 Toilet paper tissues diapers 110 45 5 0 0 0 0 0 0 0
4409 Wood continuously 5 71 1 18 62 62 47 0 0 0
4809 Carbon self-copy paper 104 11 69 0 0 0 20 0 1 0
Source TradeMap
24
South African imports of Fishery products
Table 11 presents the main suppliers of fishery product imports into South
Africa between 2010 and 2015 with the data expressed in R millions Namibia
was ranked as number one supplier followed by Thailand India and China
with the Falkland Islands completing the top 10 sources
Table 11 Main suppliers of fishery products into South Africa
Values in Million Rand
Exporters 2010 2011 2012 2013 2014 2015
World 2590 2758 4157 4606 4561 5054
Namibia 859 836 1181 1243 1370 1424
Thailand 764 681 1446 1612 1128 1320
India 173 309 304 475 521 443
China 185 186 305 299 302 438
Norway 78 102 136 210 289 319
Morocco 8 2 5 50 63 243
New Zealand 89 98 108 60 104 157
EU-28 87 69 114 101 156 143
Argentina 46 58 56 57 60 79
Falkland Islands 19 15 25 20 14 42
Source TradeMap
Table 12 shows the same data in terms of percentage shares with the top two
sources both showing fluctuations before declining shares in 2015 Sources
lower down the table are generally more stable although there has been a
significant increase from Morocco
25
Table 12 Main suppliers of fisheries products into South Africa (shares)
Countries 2010 2011 2012 2013 2014 2015
Namibia 33 30 28 27 30 28
Thailand 29 25 35 35 25 26
India 7 11 7 10 11 9
China 7 7 7 6 7 9
Norway 3 4 3 5 6 6
Morocco 0 0 0 1 1 5
New Zealand 3 4 3 1 2 3
EU-28 3 3 3 2 3 3
Argentina 2 2 1 1 1 2
Falkland Islands (Malvinas) 1 1 1 0 0 1
Source TradeMap
Table 13 and 14 show main fishery products imported by South Africa between
2010 and 2015 in monetary and percentage shares respectively Table 13 shows
South Africa imports mainly prepared and whole frozen fish followed by
crustaceans
Table 13 Main fishery products imported by South Africa 2015 R million
Code Product label 2010 2011 2012 2013 2014 2015
Fishery products 2590 2758 4157 4606 4561 5054
1604 Prepared fish 1056 918 2065 2166 1797 2026
0303 Fish frozen whole 589 713 705 854 1134 1444
0306 Crustaceans 281 465 401 611 626 539
0304 Fish fillets fresh and frozen 276 178 300 366 327 314
0307 Molluscs 146 195 208 164 247 278
1605 Crustaceans amp molluscs
prepared 109 136 184 205 215 208
0302 Fish fresh whole 75 90 211 164 132 156
0305 Smoked fish 3 44 61 50 54 62
0301 Live fish 17 17 19 24 24 24
Source TradeMap
26
Overall fishery imports have constituted between 04 and 05 of South
Africarsquos total imports over the period By product whole frozen fish showed
the most significant increase while frozen fish fillet declined from 2010 levels
to become stable Other imports have been generally stable
Table 14 Main fishery products imported by product (shares)
2010 2011 2012 2013 2014 2015
Fishery products 04 04 05 05 04 05
Prepared fish 41 33 50 47 39 40
Fish frozen whole 23 26 17 19 25 29
Crustaceans 11 17 10 13 14 11
Fish fillets fresh and frozen 11 6 7 8 7 6
Molluscs 6 7 5 4 5 6
Crustaceans amp molluscs prepared 4 5 4 4 5 4
Fish fresh whole 3 3 5 4 3 3
Smoked fish 1 2 1 1 1 1
Live fish 1 1 0 1 1 0
Source TradeMap
Table 15 introduces a matrix presenting fishery imports into South Africa by
source country and commodities Prepared fish the main import is mostly
sourced from Thailand followed by Namibia and China with a collective total
of R19 billion The whole frozen fish is mostly supplied by Namibia New
Zealand and Norway with the total of R663 million R152 million and R125
million respectively in 2015 Morocco mainly supplies whole frozen fish while
the Falkland Island supply only molluscs (squid and cuttle fish)
27
Table 15 matrix for main fishery products and main suppliers of fishery products 2015 R millions for 2015
Source Trademap
Namibia Thailand India China Norway Morocco New Zealand EU-28 Argentina Falkland
Islands
1604 Prepared fish 434457 1271765 25 214095 1326 7154 0 21163 0 0
0303 Fish frozen
whole 663112 500 5516 46266 125728 235409 152870 68956 4303 0
0306 Crustaceans 4953 353482 2877 15322 0 826 12846 73183 0
0304 Fish fillets 245565 0 0 4390 17423 0 0 3291 0 0
0307 Molluscs 23502 0 12220 111932 0 0 1076 30906 800 42960
1605 Crustacean
molluscs prep 3415 41088 70344 57823 0 0 2527 2540 0 0
0302 Fish fresh whole 6554 0 1351 0 140762 0 0 251 0 0
0305 Smoked fish 38224 38 38 0 18224 0 0 1690 375 0
0301 Live fish 0 1213 63 150 0 0 0 902 0 0
28
Level of protection for imports of South Africa AFF products
The latest WTO country profile for South Africa reports that overall simple
average applied tariffs on agricultural products were some 84 with the
comparable bound rates being much higher at 404 This shows a significant
gap between the applied and bound rates overall and suggests that any WTO
agreement is unlikely to lower these applied tariffs in the immediate future In
addition some 421 of agricultural goods were entering South Africa at MFN
duty free rates during 2013
Table 16 shows the tariff imposed on agricultural imports as reported in the
ITC database as at mid-2015 The tariffs are shown for lsquomembersrsquo such as the
EU and SADC with preferential access and others (non-members) at the so-
called most favoured nation (MFN) rate Chicken meat and offal wheat and
sugar have all had their non-member tariffs increased by South Africa in recent
years3 The two highest rates shown in Table 16 are applied to poultry meat and
sugar followed a long way back by palm oils Rice and maize are free duty for
all imports while imports of spirits face a tariff duty of only 157 (they also
pay excise duty though along with all domestic production of the same
products) Note also that South Africa imposed a tariff rate on member
countries for wheat and sugar with both of these products subject to a complex
dollar reference-pricing rate applied to protect the local producers Table 5
earlier shows that significant imports of these products shown are lsquomemberrsquo
imports from the EU and SACUSADC (mainly Swazilandrsquos sugar)
3 See lsquoSouth Africa Tariff Policy - Does It Matterrsquo By Susara J Jansen Van Rensburg and
Ron Sandrey tralac Working Paper 2016
29
Table 16 Tariff imposed on the main imported agricultural products
HS
Code 2015
Non-members Members
0207 Poultry meats 2847 0
1001 Wheat 1164 0 (SA imposes 289 on EU
countries)
1005 Maize 0 0
1006 Rice 0 0
1511 Palm oil 1000 0
1701 Sugar 2708 0 (SAs imposes 1649 on EU
countries)
2106 Food
preparations 591 0
2208 Spirits 157 0
2304 Oil-cake etc 660 0
2309 Animal feed 909 0
Source TradeMap
Table 17 shows the tariffs imposed by South Africa on fishery imported into
the country Note in particular that even in the lsquomembersrsquo column the EU
imports are subject to tariff rates that are mostly basically the same as lsquonon-
membersrsquo The highest tariff rate is a 25 rate levied on lsquonon-memberrsquo imports
of extracts and juices of fish while three lines are duty-free or below 1 All
non-EU lsquomemberrsquo imports are tariff free and that includes Norway in all cases
Again refer to Table 14 for the details of the productsource profile
30
Table 17 Tariff imposed on the main imported fishery products
HS
Code
Non-members Members
EU SADC
0301 Live fish 0 0 0
0302 Fish fresh 1149 1148 0
0303 Fish frozen 067 067 0
0304 Fish fillets 1377 1377 0
0305 Fish dried salted o 1236 1236 0
0306 Crustaceans 014 014 0
0307 Molluscs 216 010 0
1603 Extracts and juices of fish 2500 0 0
1604 Prepared or preserved fish 632 633 0
1605 Crustaceans molluscs prepared 092 028 0
Source TradeMap
Table 18 shows the tariff imposed by South Africa on forestry products
imported into the country The ITC reports that all imports shown are duty-free
to the EU and SACUSADC lsquomemberrsquo sources For the other sources South
Africa imposes the highest tariff rate of 1015 for packing containers
followed by a modest 607 for uncoated paper and 579 for printed matter
not elsewhere specified (nes) Five of the top ten products enter duty-free from
all sources while paper with cellulose face a low lsquonuisancersquo tariff of 092
31
Table 18 Tariff imposed on the main imports of forestry products
HS 4 Description Non-members Members
4811 Paper with cellulose 092 0
4810 Paper with kaolin 0 0
4901 Printed books amp brochures 0 0
4407 Wood sawn 0 0
4802 Uncoated paper 607 0
4804 Uncoated Kraft paper 0 0
4819 Packing containers 1015 0
4703 Chemical wood pulp 0 0
4412 Plywood 10 0
4911 Printed matter nes 579 0
Source ITC TradeMap
32
Chapter 2
African Agriculture and the WTO
ndash the big picture
Ron Sandrey
In this paper we will provide a profile of African agricultural exports by the
main sources and products and examine this trade in detail to assess the tariff
duties faced in their markets to glean some information as to where the WTO
may be able to assist exports In the examination we will look at where more
progress in access gains may result from better access into both the EU and
fellow African countries and we argue that in the former the EPAs and the
TDCA are the best negotiating forums for these destinations In addition we
shall provide a background profile on global agricultural subsidies and show
how in many but not all cases these subsidies are declining and the declining
role of export subsidies Similarly tariffs facing agricultural exports from least
developed countries into developed countries are declining to a very low level
To complete the picture we will also provide background information on
related issues of concern such as some specific products that are important to
Africa (sugar and cotton) and problems such as tariff escalation in general
1 Introduction
Omolo 2015 in a background introduction to the WTO and how it relates to
agriculture and agricultural trade liberalisation provides the platform for this
Chapter to build on To recap the Agreement on Agriculture (AoA) has three
pillars market access domestic support and export competition
a Market access is related to trade restrictions that importers face while
trading at the international level These obstacles are largely in the form of
tariff and non-tariff measures where the AoA sort to replace the latter
tariffs (tariffication) Importantly countries negotiate to reduce their
33
bound tariffs that they are legally committed not to exceed at the WTO
These bounds rates are generally (but not always) above what countries
actually charge at the border ndash the applied tariff rate The difference
between the bound and applied tariff gives the tariff overhang and in
cases where this overhang is large then an agreed WTO tariff reduction
may in fact be a hollow outcome This is particularly the case in agri-
culture and especially for developing countries
b Domestic supports are policies that subsidize production through prices
or incomes In the WTO parlance boxes are used to identify subsidies
These boxes take the colours of traffic lights green (permitted) amber
(slow down mdash ie be reduced) red (forbidden)
c Export competition These are initiatives that make exports artificially
competitive They include export subsidies and credits guarantees and
insurance food aid exporting state trading enterprises and export
restrictions and taxes
The objective for this chapter is to build upon the platform provided by Omolo
and assess African agriculture against these three pillars to see where impacts
of a Doha Development Round (DDA) agreement may come from Special
attention is given to market access for the main African agricultural exports
The emphasis on this market access focus is reinforced by Anderson et al 2006
who assess the research and find that the potential contribution to global
economic welfare of removing agricultural subsidies is less than one-tenth of
that from removing agricultural tariffs This is backed up by the Organisation
of Economic Cooperation and Development (OECD) and model-based
estimates of producer distortions and shows that 75 of total support is
provided by market access barriers when account is taken of all forms of
support to farmers and to agricultural processors globally and only 19 to
domestic farm subsidies Other research suggests an even higher 86 of the
welfare cost of agricultural distortions is due to tariffs and only 6 to domestic
farm subsidies We will however examine the other two pillars of domestic
supports and export completion to assure ourselves that this is indeed the case
We will also take the latest DDA positions as being the benchmark for how
comprehensive a possible agreement may be It would seem a little fanciful to
expect an agreement that goes much beyond this benchmark when the WTO
34
has not even been able to reach this position in discussion since the official
DDA launch in November 2001
11 Levels of protection
The OECD is the authoritative source of information on the levels of protection
given to farmers Their measure of producer protection is defined as the ratio
between the average price received by producers (measured at the farm gate)
including net payments per unit of current output and the border price
(measured at the farm gate) For instance a coefficient of 110 suggests that
farmers overall received prices that were 10 above international market
levels This indicator reflects the level of price distortions and is measured by
the Producer Nominal Protection Coefficient expressed as the ratio of farm
price to border reference price It is an overall measure and thus while
aggregated across all sectors may hide variations to individual sectors It is
nonetheless the best general guide Table 1 below shows the OECD ratios for
several of the major global countries It is ranked in three sections for the
average of 2012ndash2014 inclusive the first is for ratios of up to and including
105 the second for ratios up to and including 110 while the third category is
for ratios above 110
South Africa sits in the top group along with the generally accepted low
agricultural protection countries of Australia Chile New Zealand and Brazil
What is unexpected is that both the United States and the EU are also now in
this group This is in contrast to their ratios in the first time period of 2000ndash
2002 average and shows that protection has dramatically decreased in recent
years There are reasons for the decline in US protection in particular with the
strong commodity prices in the later period meaning that some of the price
support mechanisms were dormant during this period and that the US leans
towards lsquogreen boxrsquo supports that are considered to be environmentally
friendly and thus acceptable and not included The EU decline is at a level that
is much lower than what is the general perception of a highly protected
agricultural regime
35
Table 1 OECD ratios of agricultural protection three yearsrsquo averages
2000-02 2006-08 2012-14
Australia 100 100 100
Chile 106 101 100
New Zealand 100 101 101
Brazil 101 103 101
South Africa 107 105 102
United States 113 102 102
Mexico 122 105 104
EU 127 112 105
Russia 102 115 106
Israel 118 106 107
Canada 111 110 108
Kazakhstan 112 103 109
OECD - Total 129 114 110
Turkey 128 130 120
China 103 104 121
Indonesia 109 108 126
Switzerland 256 176 145
Norway 263 181 174
Japan 228 186 194
Korea 251 205 196
Source OECD
The central segment shows that the OECD total protection is declining
dramatically as well driven of course by the weight of the US and EU declines
Also note that Canada is in this segment with its strong protection to dairy and
poultry sectors neither of which concern Africa Finally in the lower segment
there are the well-known culprits of Switzerland Norway Japan and Korea
along with the two surprises of Indonesia and China where protection is
climbing rapidly
36
We emphasise that these are aggregate measures and give little information of
the trade distorting nature of the overall supports Butault et al 2012 report on a
European Parliament assessment of agricultural supports in the main trading
nations They report that the EU has carried out reforms that have made farm
support more efficient in the sense that more of the transfers from taxpayers
and consumers now reach the farmersrsquo pockets and that the EU support now
generates much less distortion in world markets In many other OECD
countries the evolution of farm support has followed a rather similar path
They also reinforce that while US supports are lower than the EU part of the
difference can be explained by the high world prices at that time (2012) as the
US relies more on countercyclical instruments Interestingly their analysis
shows that Brazil and China invest heavily in research and we consider that
the spectacular success of agriculture in these two countries in recent years
points strongly in the direction for Africa of more research and infrastructural
development to assist the sector rather than direct supports This is in supported
by Butault et al as in contrasting both EU and US policies seem to keep
focusing more on supporting farmersrsquo income rather than investing in
innovation while the latest OECD reports indicate that the changes to global
agricultural supports emphasise the swing from the 1990s where emerging
economies taxed the sector and the developing countries protected their sector
to one where protection is increasing in the emerging countries while
developed countries support (US and EU in particular) is declining The times
they are a changing
Meanwhile the US heavily subsidizes grains oilseeds cotton sugar and dairy
products Most other agriculture ndash including beef pork poultry hay fruits tree
nuts and vegetables (accounting for about half of the total value of production)
ndash receives only minimal government support In general subsidies globally are
concentrated upon to so-called lsquorice puddingrsquo of rice milk and sugar Only
sugar is of export interest to Africa South Africa and Swaziland in particular
for exports and Kenya for imports Both cotton and oilseeds are also important
and we will discuss cotton later as it carries much symbolic significance for
Africa
37
2 Where may the gains come from ndash a look at African
agricultural trade
We introduce this section by showing Africarsquos agricultural exporters in Table
2 ranked by 2015 values We emphasise that these values may be incomplete
as several African countries do not report their trade data to the International
Trade Centre (ITC) the source of all our trade data and therefore the ITC relies
on mirror (partner) data in some cases This can be a problem when neither
party reports to the ITC as does happen in Africa
South Africa has consistently been the main exporter from Africa over the
period shown Cocircte dIvoire consistently follows behind and then there are the
four relatively tightly grouped countries of Morocco Egypt Ethiopia and
Ghana Even further down the list there are several countries with exports of at
least one billion dollars and the importance of agriculture to several of the
countries not shown is demonstrated by the fact that the table with the top 15
exporters only contains 84 of Africarsquos agricultural exports during 2015 Also
shown in line 3 is that Africarsquos agricultural exports to the world have risen
from a low of 30 in 2008 to consistently being 36 or 38 in recent years
To put this in perspective it is a lower share than Francersquos (which includes
intra-EU exports) and Chinarsquos Not shown on the table are the next five African
exporters of Mauritius Zambia Burkina Faso Mozambique Madagascar and
Somalia all of whom had exports of over half a billion dollars during 2015
38
Table 2 African exporters of agricultural products amp African world exports
Exporters 2006 2008 2010 2012 2013 2014 2015
Africa 24247 33295 42980 51410 53537 57060 48293
Africa world 32 30 38 36 36 38 36
South Africa 3611 5346 8079 8621 9178 9315 8424
Cocircte dIvoire 2984 4017 5138 5024 4720 6741 6024
Morocco 1910 2741 2778 2966 3350 3634 3982
Egypt 1189 3338 5419 4958 5447 5478 3765
Ethiopia 876 1337 1907 2456 3345 4019 3743
Ghana 1735 1326 1136 2688 2347 3869 3094
Kenya 1834 2667 2921 0 3083 3298 2284
Tanzania 533 952 990 1576 1338 2464 1446
Tunisia 1305 1627 1263 1591 1621 1280 1333
Sudan 423 431 515 809 1280 1334 1305
Uganda 450 881 842 1226 1333 1245 1283
Zimbabwe 1795 620 772 1260 1226 1160 1145
Nigeria 230 1164 3402 7902 4771 2092 1080
Cameroon 537 752 1029 879 0 1064 993
Malawi 565 779 836 950 952 1028 893
Subtotal 82 84 86 83 82 84 84
Source ITC
Next we show the destinations for these exports in Table 3 and here the EU
dominates with a share of 398 of the total in 2015 followed by South Africa
who is the destination for another 172 in the latest year Thus some 570
of Africarsquos agricultural exports during 2015 were destined for wither the EU or
South Africa In both cases the main sticky import is sugar and related
products as virtually all other agricultural products have tariff and quota free
entry in both destinations The exceptions are largely South Africarsquos entry into
the EU and details of this will be covered in the next chapter Perversely with
respect to African access into the EU with the Economic Partnership Agree-
ments (EPAs) the African interest is to limit a WTO agreement that would
dilute the value of its preferential access Similarly the rest of Africarsquos access
into South Africa is being negotiated and Potelwa et al 2015 show that outside
of the East African Tripartite negotiating area there is very limited intra-
African agricultural trade Any progress on access issues within Africa are
39
likely to be advanced in the potential African Continental-wide FTA rather
than via the WTO in any event Similarly Africarsquos agricultural access into the
US the next main market is constantly being negotiated through the American
African Growth and Opportunity Act (AGOA) process
There leaves few lsquonuts to crackrsquo although one must be careful in that lsquotrade
chillingrsquo or high tariffs and other barriers may be lsquochillingrsquo trade that otherwise
would take place This is especially the case with sugar and we will explore
this commodity later to assess whether the WTO offers a promise of better
access for Africa here
Table 3 African agricultural exports by destinations US$ millions amp shares
Importers 2006 2008 2010 2012 2013 2014 2015
Total $ millions 25026 33778 43117 54622 54561 57108 48537
EU $ millions 11758 14467 15380 18351 18797 19099 19308
Africa $ millions 5738 8372 12638 15524 5738 6384 8372
shares
to EU 470 428 357 336 345 334 398
to Africa 229 248 293 284 105 112 172
subtotal EUAfrica 699 676 650 620 450 446 570
US dollar millions
USA 1125 1448 1762 3092 1904 2272 2797
Saudi Arabia 364 836 1246 1568 1851 1981 2382
India 545 769 881 1425 1741 2176 2044
South Africa 907 742 1301 2393 2385 1991 1872
China 806 504 1043 1605 1716 1859 1483
Russia 344 632 697 847 898 1035 1455
Turkey 241 384 755 692 848 941 1067
Japan 431 453 525 686 874 849 779
Malaysia 190 319 370 952 830 1167 743
Mozambique 266 317 415 598 675 841 734
Zimbabwe 180 536 686 1057 845 788 729
Namibia 22 12 730 823 786 767 720
shown 916 882 891 908 731 738 917
Source ITC
40
3 Access conditions for the main individual commodities
exported by Africa
Before we start examining the access conditions for African agricultural
exports it is important to gain a perspective on these tariffs globally and
especially for the Least Developed Countries (LDCs) where most African
countries are defined in the WTO The WTO (Table 4 bottom half) shows that
average developed country tariffs on agricultural products for these LDCs
witnessed a gradual decline from 36 in 2000 to a mere 1 in 2011
Agricultural access for LDCs has the largest preference margin over
Developing country tariffs (top half of Table 4) where the preference margins
are around 6 percentage points Note in particular how these tariffs have been
declining since 2000 and especially for the LDCs
Table 4 Average tariffs levied by developed countries on key products from
developing and least-developed countries 2000-2011 (percentage ad valorem)
Developing countries
2000 2005 2006 2007 2008 2009 2010 2011
Agriculture 92 88 85 83 80 78 73 72
Least Developed Countries (LDCs)
Agriculture 36 30 27 19 16 12 10 10
Source WTO
We will now examine trade access conditions for the African exports as given
in Table 5 The format used will be to take the major supplier for each of the
main commodities and use that as a proxy for African access This is of course
a partial analysis but a comprehensive analysis assessing the tariffs facing each
supplier would be a major undertaking In general we will report on exports to
the EU and Africa For the former we note that access conditions into the
former have been exhaustively negotiated under the Economic Partnership
Agreements (EPAs) between African countries and the EU and there would be
no improvement on the essentially duty free and quota free access that African
countries either have or are in the process of ratifying The exceptions here are
South Africa (discussed in the next chapter of this book) and sugar For the
latter (intra-African access) we note that 1) few African countries would be
obliged to make access conditions to any suppliers based in the special and
sensitive product exemptions and the large tariff overhang between bound and
41
applied rates for most African counties along with their developing and Least-
developing Country status
Table 5 African agricultural exports by commodity US$ millions amp shares
Product label 2014 2015 2014 2015
$ million shares
HS 2 Agriculture $ million amp total 57060 48293 995 1295
18 Cocoa 9650 8503 169 176
08 Fresh fruit 7574 8081 133 167
07 Fresh vegetables 4240 4241 74 88
09 Coffee tea 4322 3466 76 72
24 Tobacco 3259 2753 57 57
12 Oil seed 3430 2579 60 53
15 Fats and oils 2163 2042 38 42
52 Cotton 3193 1893 56 39
17 Sugars 2699 1745 47 36
01 Live animals 1632 1680 29 35
06 Plants etc 1802 1664 32 34
16 Meat fish processed 1913 1659 34 34
22 Beverages 2060 1632 36 34
20 Processed fruit veg nuts etc 1620 1212 28 25
23 Residues 1136 880 20 18
10 Cereals 1368 874 24 18
21 Miscellaneous edible 1175 844 21 17
02 Meat and offal 654 676 11 14
04 Dairy -eggs -honey etc 1099 562 19 12
19 Processed cereal etc 796 411 14 09
Subtotal total 978 981
Source ITC
31 The commodity by countrymarket profile analysis
We next examine the trade profiles for the top ten African agricultural exports
by HS 2 Chapters as shown in Table 5 We would note in passing that two of
these exports tobacco and sugar are the subject of intense international
condemnation in recent times as a result of health concerns This may or may
not have implications for African exports
42
1) The analysis starts with cocoa where the exports are predominantly HS
1801 cocoa beans and the major supplier to world markets is Cocircte dIvoire
with a 55 market share of the full HS 18 exports (followed by Ghana)
The major market is the EU with a market share of around 60 and given
that the EU tariff is already zero there are no gains from that destination
Tariffs for the next two markets of the US and Malaysia are a modest 5
Within Africa South Africa is the leading importer with a reported tariff of
84
2) The exports of fruit (HS 08) are the second largest export commodity and
here the situation is more complex a complexity accentuated by actual and
perceived non-tariff barriers in several markets South Africa with a 36
share is the dominant exporter and overall around 40 of Africarsquos fruit is
destined for the EU followed by India Russia and the US Using South
Africa as the benchmark tariffs are reported in aggregate to be 24 into
the EU 14 into the United Arab Emirates and 35 into Russia Rates of
10 and above suggest that access into both India and China may be a
problem Exports of nuts are important to mainly South Africa and these
exports are destined for the EU Hong Kong and the US all of whom are
duty-free for this product Banana trade has been the subject of a large
WTO dispute between the EU and suppliers and we note that African
banana exports are mainly from Cameroon and Cocircte dIvoire to the EU
duty-free Morocco the second supplier of HS 08 is mainly exporting
citrus with Russia as the top destination where tariffs of 359 are
assessed on average
3) African exporters of the eclectic vegetable mix are headed by Morocco and
Egypt with the main destinations overall being the EU (447 during
2015) and intra-Africa (233 during 2015) Benchmarking Morocco we
find that tariffs were 637 into the main market of the EU and 863 into
the next market of Russia while the other lesser markets were generally
much less A similar pattern applies for Egypt the next supplier although
here the duty-free market of Saudi Arabia is the main market South
Africarsquos exports were mainly to SADC countries and here the exports were
mainly duty-free except to the 50 levied by Angola
4) Next are exports of HS 09 which for Africa is coffee tea vanilla and
cloves in that order The main exporters were Ethiopia Kenya Uganda
43
Madagascar and Tanzania with coffee dominating with exports of just over
two billion during 2015 and tea following with $716 million in the same
year Examining Ethiopia (which is not a WTO member and therefore
cannot expect any benefits) we find that its exports of almost exclusively
coffee are destined for the duty-free or almost duty-free markets of the EU
Saudi Arabia and the US We note here that there seem to be
inconsistencies in the data as several countries such as Afghanistan
Swaziland Mali Romania and Poland are showing wide variations in their
reported imports
5) Tobacco is exported from predominantly Zimbabwe (32) Malawi (18)
and Tanzania (15) to mostly the EU and South Africa (both duty free)
There is however a major issue with exports from Zimbabwe that tralac has
identified in the ITC data They are listed as exports to South Africa but
there are corresponding South African imports from Zimbabwe of only a
fraction of that amount And while there are no Zimbabwean exports to
China Conversely China reports imports from Zimbabwe that generally
match those reported by Zimbabwe as destined for South Africa It seems
to be merely a transit through South Africa as there is no change at the
detailed code description suggesting any value-added Tariff in this line are
reported by the ITC as being 556 into Russia 2375 into China and
258 into the US This would indicate a significant tariff bill for someone
if the Zimbabwean tobacco is actually going to China as seems to be the
case
6) Oil seeds are number six on the African export list and here the main
exporters are Ethiopia Sudan Nigeria Tanzania and Burkina Faso with the
main products being oil seeds per se medicinal plants locust beans and
ground nuts (peanuts) The main markets overall (with tariffs faced by
Ethiopia in brackets) were China and then the EU (both 0) Turkey
(711) Japan (027) India (17) and Saudi Arabia (203) Of the
African total from 18 to 32 have been destined for China over the last
five years 13 to 17 to the EU and from 11 to 16 to Africa
7) Animal and vegetable fats and oils are the next export with Tunisian olive
oils dominating and they are followed by South Africa and Morocco
Overall some 72 ndash 77 of the total has been destined for mostly the EU
and Africa with the respective shares varying over the last three years For
44
Ethiopia the bulk of the exports are to the EU but here there is an assessed
duty of 996 for this EU-sensitive product Next are exports to the US
(293 duty) and Libya at zero duties For South Africa it is mostly soy
bean and sunflower oils destined for fellow SADC members where the
exports are duty free except to the main market of Zimbabwe with itrsquos
626 duties
8) Cotton HS 52 is the flash-point for Africa and the WO The issue here is
not market access though but rather US subsidies to domestic production
African exports of HS 5201 raw cotton are predominantly from West
Africa and the three main destinations are China India and Singapore in
somewhat equal values The duty into China is 20 while for India and
Singapore (and most other destinations) it is zero China is the main global
importer taking around a third of imports while the US is the main exporter
with a similar market share Therefore duties into China of 20 and
competition from the subsidised American exports are the main issues for
Africa and the WTO with respect to cotton
9) Sugar HS 17 is the most protected sector where Africa is a significant
global exporter and here the situation is more complex Currently the
major African exporters are Swaziland Mauritius and South Africa with a
combined global market share of 33 during 2015 Both Swaziland and
Mauritius have virtually free tariff access to all their markets (both within
Africa and the EU) according to the ITC data while South Africa still faces
tariffs both within Africa and the EU as well as high tariffs in the
significant markets of Indonesia Japan and India The African tariff rates
are best addressed in the context of the Tri-Partite FTA in the case of
Kenya in particular or the TDCA in the case of South African access to the
EU We will discuss this in more detail later
10) Live animal exports (HS 01) are concentrated from Sudan Somalia and
Ethiopia (83 of African exports) with the main destinations being
Saudi Arabia Oman and Somalia None of the three main exporters are
WTO members and therefore it is difficult to see what the WTO may be
able to do and in addition the main destination from Sudan is Saudi
Arabia where tariffs are zero the main destinations from Somalia are
Saudi Arabia and Oman where again the tariffs are zero and the main
45
destination for Ethiopia is Somalia who is not a WTO member
Therefore in general the WTO offers nothing for live animal exporters
In conclusion there seems to be few of the major African agricultural exports
where the WTO could provide some benefits and especially against the back-
ground of low agricultural tariffs into Developed countries from LDCs as
shown in Table 4 Cotton seems to be more of a flash-point than an actual
source of benefits as the background issue is US supports to its domestic
producers This is already subject to an agreement (discussed below) and there
is an outside possibility that perhaps some relief from the high (20) tariffs
into China may result from an agreement in the WTO Sugar trade exists in a
complex regime but solutions through this maze for African producers are best
pursued within Africa itself by negotiations in the African trade agreements
currently in play and between South Africa and the EU under the TDCA
Several of the main products ndash cocoa coffee and tea live animals ndash exist in an
almost duty free environment Of the others for fruit and vegetable exports
non-tariff barriers are probably the main worry although South Africa the main
fruit exporter faces tariff complexities in the EU and high tariff barriers into
China and India Although tobacco exports from the main suppliers are
outlined in the ITC data as being largely destined for the duty free EU and
South African markets the exports from Zimbabwe to South Africa are
actually destined for China where a 2375 tariff is reported The semi-related
products of oil seeds and animal and vegetable fats are largely destined for the
EU and Africa where if the imports are not already duty free then bilateral or
regional negotiations must offer the best possibilities for improved access
conditions (we note that exports of oil seeds into China are duty free)
The limitation of an analysis such as the above is that there may well be cases
where medium to high tariffs are lsquochillingrsquo trade that would take place or
increase with better access conditions Other than the general cases discussed
above there are few examples that we can identify although access for sugar
into Kenya where the current tariffs of 85 are extraordinarily high and
generally trade prohibiting Also in the sugar regimes the protectionism
spreads beyond just the basic raw sugar imports to include any further
processing such as tinned fruits jams and preserves that contain sugar
46
32 Additional comments on particular products of export interest
Sugar
The Uruguay Round of the General Agreement on Tariffs and Trade (GATT)
(the old WTO) did little directly for sugar but indirectly helped in both setting
up the framework for a substantial liberalisation of sugar production and trade
in the future and augmented this through the dispute settlement mechanism
(where the Appellate Body applied and confirmed earlier case law developed in
New Zealandrsquos successful case against Canadian dairy export subsidies) The
disruptive polices of the EU the US and Japan cause most of the problems by
heavily subsidising their producers and providing limited quota access and very
high out-of-quota tariffs to maintain these regimes Accentuating the problems
for competitive producers are the export subsidies that the EU uses to sell
surpluses onto remaining free-world markets This is the product with the most
potential for preference erosion for the region but currently exports are low It
is also a case that will pit developing countries against one another and even in
Africa This is because some who currently export a limited amount but have
the potential to become competitive will take trade away from others who are
relying on preferences
Sandrey and Moobi 2016 outline how Brazil is a leading cane sugar producer
and also has the fastest growth rate among the leading producer Conversely
cane production in the USA Australia South Africa Cuba and Venezuela all
show a decline in sugar production over this same period South Africa the top
African producer is just ahead of Egypt and they are followed by Sudan
Kenya and Swaziland who each have similar shares of African production
Overall Africa accounted for 5 production share of global production in
2013 and this was down from the 7 in 2000
South Africa has generally been marginally ahead of Swaziland as the top
African global exporter of sugar followed by Mauritius Algeria was the main
African importer of sugar during 2014 followed by Nigeria Sudan and
Morocco Africa imported some 183 of the global sugar exports during
2014 a figure that has been relatively stable since 2012 after climbing from
lower levels South Africa was the main intra-African importer of sugar
followed by Sudan Namibia and Kenya and overall Africa is a net importer
of sugar
47
Sandrey and Moobi also consider that the South Africa sector has not been
subjected to market forces in the same way that other agricultural sectors have
been in recent years The argument employed by the sugar sector that they face
a distorted international trading environment holds equally true for many of the
sectors that have been fully exposed to international competition Indeed
currently sugar in South Africa enjoys more protection than the major
producers of Brazil the EU Australia and China and is only behind the US in
the major OECD support measures Much of this protection is through a dollar
based reference price (DBRP) tariff system that grants import protection
against low world prices but special treatment to sugar extends to trade
restrictions on free trade from non-SACU SADC imports into SACU This
latter special treatment is not given to any other products either agricultural or
non-agricultural
Jensen and Sandrey 2015 simulated the impacts of reforms in the EU sugar
sector upon this African production and trade using the Global Trade Analysis
Project (GTAP) computer model During 2006 a reform of the CAP sugar
regime brought a simplification of the EU quota structure when these quotas
were prolonged until 201415 with no commitment to further renewal Other
research has estimated that EU production will increase and sugar imports into
the EU will decline Meanwhile the recently concluded Economic Partnership
Agreements (EPAs) is crucial for sugar access to the EU for many LDC
countries and it is against this background that tralac ran these simulations
They found that production in the EU increases by 529 African exports to
the EU declined by 14 and by 108 in total to market outside of Africa as
the increased EU competition puts pressure on Africarsquos traditional markets
Production declined across the board in Africa and the trade results mirror the
production affects with all African exports declining in the face of an 11
increase in EU global exports and a loss of markets in the EU Changes are
marginal for intra-African trade although there is a decline of 14 to the EU
and displacement by the EUrsquos global export increase of 11 displaces African
exports Furthermore in reporting on tralac research simulating the
implications of a liberalisation whereby all agricultural tariffs on intra-African
trade go to zero after factoring the EU reforms into the trade model these
intra-African reforms were dominated by changes in the African sugar
production and trade profiles The big gainers were South Africa from
enhanced exports to mainly Kenya and Kenya itself as resources are diverted
48
away from its inefficient sugar sector Thus changes to the EU sugar regime
are not necessarily good news for Africa and the big potential gains to the
sugar sector are mainly within Africa itself The latter is within the auspices of
African integration and not the WTO
Coffee is a classic example of an agricultural product whose long-term market
prices have fallen dramatically over the last two decades in spite of increasing
demand Coffee beans sold in the international market are significantly
differentiated from coffee sold as a final product to the consumer with coffee
as most people know it sold in an end market where advertising and service
quality dominate the cost of coffee beans According to the FAO Brazil and
Vietnam are the worldrsquos largest coffee growers with a combined share of 49
in 2013 Africa contributed just on 10 with Ethiopia Uganda and Cocircte
dIvoire being the largest growers Worryingly although almost all coffee is
grown in the developing world there were signs in late 2013 that Brazil the
champion of developing country agricultural free trade was implementing a
coffee subsidy to growers Since then however coffee bean prices have
recovered albeit not back to previous highs
Cotton emerged as a major flashpoint at the WTO trade summit in Cancun
Mexico as four West African countries namely Benin Burkina Faso Chad
and Mali called for an end to cotton subsidies in rich countries and
compensation to cover economic losses caused by these subsidies This
challenge dramatically highlighted both the problems that African farmers in
particular face in a distorted agricultural market and how the balance of power
in the WTO is swinging away from rich countries to a more representative
view of the entire WTO membership In general West African cotton farmers
are able to produce cotton at perhaps one third of their counterparts in the US
but it is the US subsidies that are denying them export opportunities
Cotton while not a crucial issue for eastern Africa is still important in that (a)
some exports do originate from the region and (b) this issue has become the
rally-cry for African nations In actuality better access may not deliver as much
as some hoped for but in the interests of solidarity with fellow Africans the
region should support comprehensive reforms (but not to the extent of being
lsquobrought offrsquo by a cotton outcome) African nations export very limited
quantities of cotton to the US and although market access is not the issue for
49
cotton the use of domestic subsidies in the US and EU and the consequential
price reduction for internationally traded cotton is
On market access the decision calls for cotton from LDCs to be given duty-
free and quota-free access to the markets of developed countries and to those of
developing countries declaring that they are able to do so from 1 January 2016
The domestic support part of the cotton decision acknowledges members
reforms in their domestic cotton policies and stresses that more efforts remain
to be made On export competition for cotton the decision mandates that
developed countries prohibit cotton export subsidies immediately and
developing countries do so at a later date
The situation for bananas is similar to that of sugar where the developing
countries are being set against one another as a result of the WTO banana
dispute Basically Latin American producers with a share of about 60
dominate the EU market while many of the other ACP countries have a
restricted quota access of about 20 of the market Africa had around a 7
share of exports during 2013 The situations for bananas demonstrate that there
are both winners and losers in many trade disputes and that the two camps can
both contain developing and least developed countries The losers were those
earning rents from exporting at better access prices while the gainers are the
more efficient producers who now have an ability to export into a freer market
at a fairer price
33 Export subsidies
Strubenhoff 2016 writes that in December 2015 at the World Trade
Organizationrsquos (WTO) 10th Ministerial Conference in Nairobi members
finally agreed that export subsidies for agriculture would be abolished The
agreement states that lsquodeveloped country members shall immediately eliminate
their remaining scheduled export subsidy entitlements as of the date of
adoption of this decisionrsquo and lsquodeveloping country members shall eliminate
their export subsidy entitlements by the end of 2018rsquo WTO members also
lsquoundertake not to provide export credit export credit guarantees or insurance
programsrsquo for agricultural products He then asks lsquoWhy did the EU agree to
abolish export subsidies and the US agree to abolish export creditsrsquo He
considers that farming lobby groups loved them and governments in poor
food-importing countries liked the cheap imported food But they were
50
distorting market prices leading to higher-than-market prices and surplus
production in exporting countries and lower prices and less production in
importing countries Hence policymakers in developed countries cared more
about farmers while developing countries cared more about consumers
The benefits from this action are hard to quantify as this measure of support
has been declining and thus the direct impact is rather minimal Perhaps more
important is that new subsidies shouldnrsquot be implemented and perhaps we can
wave goodbye to one instrument of distortion
34 Other issues
Special products the SSM and even perhaps Sensitive Products need to be
carefully considered The latter are products that a member may declare and
thus be obliged to make lesser market access commitments for that product
Special products extend this concept to developing members only for those
products that are a staple or basic food of that country and negotiations
continue on how extensive this concession may be Unfortunately in Africa
there seems to be a tendency for countries to bow to special interest groups
rather than consider a more broad approach which examines overall welfare
when special products are listed and this protectionist approach negates a
significant share of the likely welfare gains from trade liberalisation
Extending this still further is the SSM measure that will allow both developing
and least developed members to raise tariffs in the event of an import surge that
threatens domestic producers The SSM constitutes a unique instrument to
assist with food security livelihood security and rural development It must be
simple effective and easy to implement Members will need to consider what
products they consider important to list in their schedules and this extends to
the SSM products Similarly developing countries and least developed
countries are entitled to nominate Sensitive products as these are not just for
the developed countries In practice the use of Special products is likely to be
more important for defensive interests Members need to carefully watch the
use of Sensitive products by the developed members as there is a balance
between better market access and possibly preserving some preference rents as
discussed earlier
51
Tariff escalation similarly needs to be carefully considered without prejudice
to the products benefiting from preferential arrangements This is an issue in
commodities such as the further processing of coffee beans for example This
is a difficult area to analyse as most researchers commonly just look at the
increase in tariffs as the raw product moves through the processing chain
While indicative it does not tell anything about the increased tariff rate relative
to the value-added component of the processing chain or the capacity
competitiveness of the country in undertaking that value added process
Cocoa and products are the leading single agricultural export from Africa and
here tariff escalation does not seem to be a problem The export of the further
value added products of cocoa butter chocolate and cocoa powder from the
leading exporter of Cocircte dIvoire all seem to have largely duty free access to
their markets Similarly for coffee where looking at exports from Ethiopia (and
even though it is not a WTO member we could argue that it is a worst-case
example for Africa as it has no WTO access benefits) we find that access is
generally duty free for its main raw coffee exports and for the extremely
limited exports of roasted coffee as well There do however seem to be
significant tariffs against roasted coffee in several markets so we cannot rule
out trade chilling or prohibition through tariff escalation here but the evidence
is very limited
There have however been suggestions that the monopolistic competition in the
cocoa and related products market is impacting on these products Here the
WTO is concerned that as government barriers to trade and investment have
been reduced the gains from this liberalisation may be thwarted by private anti-
competitive practices Mutually supportive trade and competition policies can
contribute to sound economic development and effective competition policies
help to ensure that the benefits of liberalisation and market-based reforms flow
through to all citizens Many WTO member countries including many
developing and transition countries have adopted competition laws
Too often we find that access conditions into many markets are stymied by
overly rigorous rules of origin (ROO) regimes The WTO is moving on this
problem The 2013 Bali Ministerial Decision on preferential rules of origin for
LDCs set out for the first time a set of multilaterally agreed guidelines to help
make it easier for LDC exports to qualify for preferential market access The
Nairobi Decision expands upon this by providing more detailed directions on
52
specific issues such as methods for determining when a product qualifies as
lsquomade in an LDCrsquo and when inputs from other sources can be lsquocumulatedrsquo
(combined together) into the consideration of origin It calls on preference-
granting members to consider allowing the use of non-originating materials up
to 75 of the final value of the product and calls on preference-granting
members to consider simplifying documentary and procedural requirements
related to origin The key beneficiaries will be sub-Saharan African countries
which make up the majority of the LDC Group the proponent for the Nairobi
Decision on Preferential Rules of Origin for LDCs
53
References
Anderson K and Martin W (eds) 2005 Agricultural Trade Reform amp the
Doha Development Agenda Washington DC World Bank
Anderson Kym Will Martin and Ernesto Valenzuela2006 The relative importance
of global agricultural subsidies and market access World Trade Review (2006) 5
3 357-376
Butault J-P J-CBureau H-PWitzke T Heckelei and A Zintl2012
Comparative Analysis of Agricultural Support within the Major Agricultural
Trading Nations European Parliament IPBAGRIIC2011-068 May 2012
Jensen H G and R Sandrey2016 The impact of EU reforms on African
sugar production and trade a GTAP analysis tralac Trade Brief at
wwwtralacorg 4 November 2015
Omolo M W O 2015The Agriculture Negotiations at the World Trade
Organization (WTO) tralac Trade Brief at wwwtralacorg 18 Dec 2015
Potelwa Y R Sandrey and Sun Zhina2015 The West and Central African
trade profile with a special review of the relationship with China and regional
agricultural trade tralac Working Paper at wwwtralacorg 27 November
2015
Sandrey R and M Moobi2015 Sugar the production trade and policy
profiles for South Africa and other selected African countries tralac Working
Paper at wwwtralacorg 18 December 2015
Strubenhoff H February 8 2016 Brookings Institute Blog at
httpwwwbrookingsedublogsfuture-developmentposts20160208-wto-
agriculture-export-subsidies-strubenhoff
WTO2013 Market Access for Products and Services of Export Interest to
Least-Developed Countries Note by the Secretariat WTO
WTCOMTDLDCW58 September 2013
54
Chapter 3
Analytics of the WTO Agricultural
Agreement for Africa
Ron Sandrey
1 Introduction
In recent years the global trade modellers of the world or perhaps more
accurately their patrons have largely moved on from assessing the gains from
an outcome from the WTOrsquos Doha Development Agenda (DDA) Perhaps it is
because as the DDA stalled it lost some of its lsquosexinessrsquo appeal or perhaps it
was because as trade models become more sophisticated the limitations of the
DDA for agriculture became more apparent and consequently the magnitude of
the gains declined Funders and especially government funders do not want to
hear of lowering gains
The salient feature of this modelling research is that the gains for Africa are
modest with some countries actually losing welfare through results such as
preference erosion in developed markets
Background and modelling assessments of the DDA for agriculture in
particular Sandrey 2006 a succinctly set the scene for agriculture in the WTO
with lsquoFor nearly 50 years agriculture was largely exempt from manufactured
goods trade rules While member countriesrsquo prosperity grew on the back of a
relatively open trading system for manufactured goods these same countries
erected trade barriers ndash some insurmountable ndash to agricultural imports Hand-
in-hand with trade barriers went generous farm support payments provided by
government treasuries Rather than being driven by straightforward economic
principles as is largely the case with manufactured products domestic agri-
cultural policies were driven by a perceived need for self-sufficiency in food
wartime food shortages memories and strong government decision-making
55
representation This resulted in growing unsaleable product surpluses for which
governments had to provide further subsidies to dispose of on world markets
The ideological view that agriculture is somehow different from other sectors
continued despite it being comprehensively brought into the multilateral
negotiating environment for the first time Separate agriculture disciplines were
agreed under the Agreement on Agriculture (AoA) although the Uruguay
Round (UR) did initiate a process to reduce or limit agriculturersquos exemptions
and bring them more fully under GATTWTO disciplinesrsquo
Against that background this section undertakes a review of the literature that
is relevant to quantitative analysis of the impacts of the DDA with special
reference to Africa and South Africa While some of this review may be a little
dated that is of no real concern in that the general principles of the stalled
DDA have barely changed although what has changed in recent years is that
the computer model analysis has become more sophisticated This is especially
so for the Global Trade Analysis Project (GTAP) the model of choice for most
practitioners More countries have been added to its database and the trade and
economic data is continually moving forward While models such as GTAP
have the undoubted strength of forcing consistency in their analysis they also
suffer from weaknesses in that they are a representation of the lsquoreal worldrsquo
Against this background they can however provide interesting insights into
simulated outcomes
We could also start the paper with a more recent and in-depth assessment by
summarising Brink (2014) He examined the policy settings of twelve
developing and seven developed countries and found that few of these
countries would need to change their settings very much if at all in order to
conform with the rules and commitments of an agreement if it was
implemented immediately as it now stands For market access this is mainly
because the margins between bound tariffs that are the base for negotiations
and actual applied tariffs are large enough to allow the bound rates to remain
larger than the applied rates after a DDA agreement for several countries and
for others the reductions in the applied rates would be quite small This is
accentuated when the use of sensitive and special products is taken into
account Similarly most of the nineteen countries would face no or little
difficulty in complying with constraints on domestic subsidies Those that may
face a challenge include Canada Norway Switzerland Thailand and the
United States as well as possibly Russia and China
56
We shall eschew the obvious question of why the negotiations are so difficult if
there seems to be little pain Perhaps politics holds sway over economic
outcomes in that widely spread and diverse gainers are less visible than the
concentrated and hence more visible (and vocal) losers
2 A precautionary note who stole the gains from trade
liberalisation
A notable feature of the December 2005 WTO Hong Kong Ministerial was the
use and citation of models with the more recent ones at that time showing a
considerable reduction in global welfare gains from trade liberalisation and in
particular an almost-disappearance of the gains to developing countries Why
are the gains shrinking Part of the answer is that some of the assumptions are
being re-visited while the newer version of the GTAP model and its associated
database enables analysts to use better trade and tariff data and incorporate
both the EU expansion and Chinarsquos WTO accession into their updated base
work These combinations are making a huge difference but even so ten years
ago Ackerman (2005) for example detailed how the gains were becoming
both smaller and skewed towards the developed countries rather than poverty
alleviation in the developing world
Using the Version 6 database the World Bank revised the potential benefits
downwards to a miserly $313 per head in the developing world (in contrast to
the $7904 per head in the developed world)4 This work acknowledges the
difficulties associated with anticipating an outcome for the Doha Development
Agenda (DDA) and recognises some of the issues such as sensitive products
the bound versus applied tariffs5 problems of quota rates and preference
erosion and that of defining and disciplining reductions in agricultural supports
in Organisation for Economic and Cooperation Development (OECD)
countries High income countries are the winners and in some instance where
4 Anderson K and Martin W (2005)Note that these gains are not repeatable gains but
rather a once-only step upwards 5 The margins between bound tariffs that are the base for negotiations and actual applied
tariffs are large enough to allow the bound rates to remain larger than the applied rates after
a DDA agreement for several countries and for others the reductions in the applied rates
would be quite small This is accentuated when the use of sensitive and special products is
taken into account
57
special products can be exempted the developing countries as a group actually
lose out
In this World Bank research the gains for South Africa are generally modest
but always positive Under a complete global liberalisation of trade assumption
the global gains from the World Bank analysis were $287 billion with
$13 billion of this going to South Africa (with all exports up by 143 and
imports up by a greater 180 and agricultural exports up by 24 and
imports up by a lesser 11 thus highlighting that most of the gains are from
non-agricultural sectors) We caution that this model used a dynamic recursive
approach which will lead to greater gains than the standard model and thus the
results are not directly comparable to the gains that we will present later in this
paper6 Now moving to a DDA outcome simulation the World Bank gains for
South Africa become very modest but always positive from $01 to
$03 billion There was greater variation in the global outcome with respect to
the agricultural-only gains from $75 billion with full agricultural liberalisation
to a mere $134 billion even using a dynamic model but with generous
allowances for special products As a percentage of real income these South
African gains are similar to those for India but well below those for Thailand
Argentina and Brazil
Another source of information detailing the potential benefits to South Africa
from liberalisation of OECD agricultural policies was the OECD review of
South African agriculture (OECD 2006) They also used the GTAP model but
we must caution that it is based upon Version 5 (1997 base year) and not
Version 6 using the 2001 base year data7 In addition the different assumptions
make it difficult to compare results but with partial global liberalisation in both
agriculture and non-agriculture the South African gain is some $251 million
with around one-third of the South African gains ($88m) coming from
agriculture The most import contributions are from global reforms in wheat
fruit and vegetables dairy products processed sugar and other processed food
sectors
6 Indeed these gains are about three times the standard GTAP global gains of $84 billion as
presented in the same World Bank book in Chapter 2 7 Tralac is now using version 9 but some analysts are still using Version 8 claiming that
Version 9 has too many errors in its African data
58
Polaski (2006) using a very detailed approach found that agricultural
liberalisation benefits only a relatively small subset of developing countries
and global benefits were modest Those benefiting from agricultural liberali-
sation include Brazil Argentina most of Latin America South Africa and
Thailand Accounting for this modest global result is the lsquoSpecial Productsrsquo
For South Africa gains are some $57 million from the DDA agricultural-only
with most of these gains resulting from better sugar marketing conditions
Another paper that examined the plausible impacts of the DDA was that by
Kirkpatrick et al (2006) where they agreed that the economic impact of the
DDA is likely to be modest and smaller than earlier predicted In particular
they were worried that the gains are not shared and in the poorer countries
with Sub-Sahara Africa as the example poverty may worsen as these countries
lose from trade liberalisation on the one hand and on the other face severe
supply constraints that bedevil Africa This is especially so when the dynamic
or second and subsequent effects of the DDA are examined as the developing
countries have the best infrastructure to exploit these advantages If the DDA is
to be a lsquodevelopment roundrsquo then additional measures such as lsquoaid for tradersquo
will need to be implemented
The Swedish Board of Trade (2006) simulated three potential Doha outcomes
using GTAP one core scenario and two scenarios involving more and less far-
reaching liberalisation respectively (with lsquolessrsquo appearing to be a more realistic
scenario) Four elements were included in all scenarios non-agricultural
market access (NAMA) agricultural liberalisation services liberalisation and
trade facilitation For these options three versions of the GTAP model were
used lsquomain modelrsquo lsquostandard GTAPrsquo and lsquodynamic GTAPrsquo The Least
Developed Countries (LDCs) did not make any commitments on manufactures
agriculture and services but they were expected to make commitments in trade
facilitation The estimated potential gain in real global income from this
simulated Doha round were from $46-230 billion per year with the lower
estimate from less liberalisation using the standard GTAP and the higher from
the more far-reaching outcome All countryregional groups gained and the
developing countries including LDCs were the major winners (although with
the somewhat nebulous lsquotrade facilitationrsquo contributing the most to developing
countriesrsquo gains) Gains for South Africa from Doha reform in the less
liberalisation scenario using the standard model were exactly $1 000 million
with 59 of this from Doha NAMA liberalisation 37 from lsquotrade
59
facilitationrsquo and only 3 from agricultural liberalisation (with the remaining
2 from services) Netting out the trade facilitation gains these results (and
using the standard GTAP model and a not-overly optimistic view of a possible
Doha) outcome are consistent with the other research discussed above
In addition there are two other themes pertinent to the analysis of both Free
Trade Agreements(FTAs) and the DDA for Africa These are (a) the question
of tariff revenue loss and (b) the issue of trade creation and trade diversion
For the first issue Sandrey and Jensen (2007) examine the impacts of known
and possible trade agreements that involve Southern African Customs Union
(SACU) and calculate the potential loss of tariff revenues to SACU as
preferences are granted to trading partners They find that this loss will have
major impacts upon Lesothos economy in particular as these tariff revenues
currently comprise half of total government revenues in the Kingdom On the
second issue Sandrey (2006b) takes this a step further and finds that
introducing the trade creation and diversion formulas into the analysis
accentuates the revenue loss problem
Analysts are warning that the projected gains from the DDA and the Economic
Partnership Agreement (EPA) are not what they initially expected (or hoped
for) to be as an updated model database enables factors such as tariff revenue
loss to be factored into recent research and the hopes of anything approaching a
comprehensive DDA agreement are fading With respect to the proposed EPA
the same tariff revenue loss and the related concept of trade creationtrade
diversion is important However more crucially the potential damage to
Africarsquos industrial base the probable reluctance of the EU to make meaningful
reforms to their agricultural sector during the DDA negotiations and the
limitations to take advantage of opportunities imposed by self-inflicted African
infrastructural constraints is casting a shadow that suggests there may even be
losses to at least some African countries from both the EPA and the DDA
This results from a combination of better models that have more recent
information such as the final UR tariffs the full implications of Chinarsquos
accession to the WTO incorporated an ability to model tariff revenues losses
and the impacts of trade creationdiversion effects the consequences of the
erosion of tariff preferences and a lsquoscaling downrsquo of the DDA ambitions that
are now being modelled as more realistic assumptions of any outcome
Virtually all of the recent modelling work is pointing to reduced gains from the
60
DDA and even in some cases for developing countries to losses These same
or similar factors are also contributing to the cautious results that are now
coming from researchers who are looking at the EPA possibilities and
especially so as most African countries at the time had good access into Europe
under CONOTOU8 for developing or the Everything but Arms (EBA) for the
least developed countries (thus there was limited lsquoupsidersquo gain
These results are accentuated by the problems facing Africa in its major
infrastructural and capacity constraints that will severely limit the abilities of
most African countries to take advantage of the new opportunities Africa itself
must address most of these problems and in doing so ensure that aid monies
for these projects are well spent African countries must negotiate hard to
ensure that the development promises of both the DDA and the EPA are in
fact realised To this end they must be vigilant against efforts to use lsquothe old
shell gamersquo of just moving aid already promised into another package
3 South Africa and African research specifically
Sandrey and Jensen 2007 simulated a likely WTO outcome for South Africa
and found that global welfare gains from Doha are estimated to be some
$48 billion with a minor $3 billion of this from agricultural reform and the
dominant $45 billion from the liberalisation of markets for non-agricultural
goods South Africa gains some $340 million with $42 million of this from
agricultural reform and the remainder from non-agricultural reforms They
considered that these results were consistent with those presented in recent
research and reinforced that the shielding of some sensitive and special
products considerably reduces the global gains from agricultural liberalisation
By product the gainers in South Africa are the beef and sheep meat and dairy
products sectors where output and consequently exports increase albeit from
low bases Production and trade in the wheat and sugar sectors decline (where
South Africa largely chose to utilise its protective flexibility in the sugar
8 The Cotonou Agreement is a treaty between the European Union and the African
Caribbean and Pacific Group of States (ACP countries) It was signed in June 2000 in
Cotonou Benins largest city by 78 ACP countries (Cuba did not sign) and the then fifteen
Member States of the European Union
61
sector) Beef exports to the EU and the lsquorest of the worldrsquo are the big export
gainers There was a very slight increase in agricultural imports
Outside of Africa the big gainers were China Japan EU and their lsquorest of the
worldrsquo while the US loses Within the Southern African Customs Union
(SACU) Botswana loses by some $9 million while the lsquorest of SACUrsquo aggre-
gation of Lesotho Namibia and Swaziland gains substantially by $134 million
In addition Sandrey and Jensen report that there are two other themes pertinent
to the analysis of the DDA for Africa These are (a) the question of tariff
revenue loss and (b) the issue of trade creation and trade diversion and both of
these are important and must be considered
Nyhodo (2009) sums up the dilemma that faces some developing countries
with respect to agricultural liberalisation On the one hand it is expected that
liberalisation would increase prices and hence the demand for developing
country imports and the subsequent benefits to terms of trade On the other
hand these same developing countries may lose preferential access and then
face wider compensation from developed country exports Therefore the
outcomes are not unambiguously beneficial to developing countries in general
it is commonly thought that net exporters would gain but net importers would
lose although preference loss may cloud this generalisation Later in the paper
we will look at the example of recent liberalisation in the EUrsquos sugar regime
and report that tralacrsquos computer analysis assessed these changes as making
African traders marginally worse off In general there is a theme that comes
from simulating trade liberalisation and that is that the benefits often flow
disproportionally to those undertaking the liberalisation as resources are
diverted into their most productive use
Overall as Nyhodo notes depending on the distribution of the gains South
Africa may gain or lose from an outcome from the DDA Using the South
Africa PROVIDE model9 he assesses the results for South Africa Importantly
there is a big difference between comprehensive liberalisation and that of
excluding the three crucial commodities of wheat other grains and sugar In
this latter case there are changes to world prices of only between ndash3 and
9 He uses the GLOBE model to firstly assess the wider global impacts of liberalisation before
feeding these results into the PRONIDE model
62
+3 whereas when the excluded three are simulated the changes are signi-
ficantly higher There are also significant differences between global export
prices and global import prices with export prices generally higher as
developed country protection is mitigated
The reported results concentrate upon wheat an import sector and sugar a
sector that used to be export but is now also a significant import sector They
also highlight the complexities of assessing a lsquopricersquo as that depends upon
what price we are actually talking about Perhaps the most important one for
assessing the overall production response is that facing farmers and here their
price increase of 38 for wheat and 047 for sugar is below the increases in
import prices There is a modest increase in production in both of these
commodities in response to the price increase but overall the results seem to be
similarly modest
Examining a wider African perspective Coulibaly et al 2016 reviewed and
modelled Africarsquos priority issues and interests in ongoing WTO negotiations10
They found that an agreement on the DDA in agriculture would have a high
positive impact on growth and welfare in Africa relative to the rest of the
world although they caution that not all African countries gain Importantly the
WTO has to make progress on the three key issues of market access
agricultural support and SampD treatment Estimates of welfare changes under
the proposed Doha scenario for African regions are quite modest and are
estimated at around US$ 83 billion and the study reveals the relative
importance of market access for Africa The net gain to Africa is estimated to
be US$ 320 million under market access reforms compared to US$ 99 million
gains under export subsidy reforms and US$ 4 million under domestic support
reforms
As always the inclusion of Trade Facilitation and removal of non-tariff barriers
(NTBs) in trade liberalisation amplifies the gains from liberalisation Using the
export and import value of time11 it is found that the welfare gains are
10 A perusal of the comprehensive set of references in this paper reaffirms our view that little
has been written on computer modelling research on the DDA agricultural outcome over the
last ten years 11 We caution that there may be an element of double counting here where both import and
export values of time are incorporated into the model
63
respectively estimated to be US$ 44 million and US$ 56 million By estimating
welfare gains using alternative proxies for NTBs the welfare gain varies from
US$ 64 million to US$ 18 billion
They also assess the counter-balancing impacts of recent developments on the
Trans-Atlantic FTA and Trans-Pacific FTA where they are expected to
enhance trade among the participating countries but would have trade diversion
for Africa Here the welfare loses for Africa area round US$ 290 million under
the Trans-Atlantic FTA and US$ 976 million under the Trans-Pacific FTA
Reverting back to more WTO-related changes they found that there would be
substantial gains following the EU CAP reforms of 2014ndash20 compared to the
US Farm Bill of 2014ndash2018 with the CAP reforms estimated as
US$ 72 million welfare gains compared to US$ 16 million for the Farm Bill
Furthermore closer to home the study supports the integration agenda of
African countries with welfare and trade effects under both Tripartite FTA and
Continental FTA with the latter estimated to generate welfare gains at around
US$ 134 billion while for the former welfare gains would be around
US$ 29 billion
Overall their Doha scenario suggested that agricultural-only liberalisation
would generate a global gain of US$ 63 billion with almost half accruing to
the EU 28 and Canada Gains for Africa amount to US$ 826 billion (which is
130 of the total welfare gain) with a mixed outcome as a result of differences
in initial specialisation domestic protection and factor endowment Countries
affected by the erosion of preferences and the changes in relative prices lose
(North Africa Central Africa Zimbabwe Botswana Namibia Cameroon and
Cocircte drsquoIvoire) Conversely Cameroon and Cocircte drsquoIvoire both net agricultural
exporters gained through market access while gains for South Africa are
unexpectedly limited Technically total gains for Africa are almost the same
using either the Swiss or the tiered market access tariff reduction formulas
Also in one of the few other recent analyses of the DDA Decreux and
Fontagneacute 2011 stress that the case of Sub-Saharan Africa (SSA) is important
for the Round and deserves additional comment This region does not liberalise
overall (or only to a very small extent) due to the combined presence of LDCs
Paragraph 6 Annex b countries and other flexibilities conceded to developing
countries In particular improved market access opportunities are usually
limited for SSA countries which already benefit from preferential schemes in
64
some important markets Importantly improved market access granted to SSA
countriesrsquo competitors actually works to decrease some of the SSA countriesrsquo
export prices leading to terms of trade losses and reduced domestic production
for SSA countries
4 Sugar reforms
The global sugar sector operates on a stage that includes (a) highly protected
sectors in some developed countries that concentrate upon beet sugar
production and (b) the cane sugar producers who generally but not always
operate in more open production and trade regime in generally but again not
always in developing countries Despite the complex and restrictive trade
policies of many countries sugar trade plays an important role in global
agricultural trade and indeed during the 2011 sugar price spike it was the 4th
most traded agricultural product by value at the HS 4 level South Africa has
generally been marginally ahead of Swaziland as the top African global
exporter of sugar with these two also being the top intra-African sugar
exporters Algeria was the main African importer of sugar during 2014
followed by Sudan (both North and South combined) and Nigeria and overall
Africa is a net importer of sugar
Jensen and Sandrey 2015b analysed the impacts of reforms in the EU sugar
sector upon this African production and trade using the GTAP computer
model They found that production in the EU increased by 529 African
exports to the EU declined by 14 and by 108 in total to markets outside of
Africa as the increased EU competition puts pressure on Africarsquos traditional
markets Production declined across the board in Africa and the trade results
mirrored the production affects with all African exports declining in the face of
an 11 increase in EU global exports and a loss of markets in the EU Changes
are marginal for intra-African trade although there is a decline of 14 to the
EU and displacement by the EUrsquos global export increase of 11 displaces
African exports Thus reforms in developed country markets are not
necessarily good news for African producers They also extended this research
to assess the implications of agricultural tariffs on intra-African trade going to
zero (after factoring the EU reforms into the model) Here the results confirm
that these agricultural-only reforms are dominated by changes in the African
sugar production and trade profiles The big gainers are South Africa from
65
enhanced sugar exports to mainly Kenya and Kenya itself as resources are
diverted away from its inefficient sugar sector
5 Related issues
While not specifically on the WTO agricultural and Africa theme the issue of
trade facilitation is one that is attracting increased attention in the WTO Jensen
and Sandrey 2015c examined the issue of lsquotime in transitrsquo to proxy
infrastructural deficits in Africa such as delays at border crossings roadblocks
for trucks and the necessity to pay bribes African countries are well aware of
these problems and trade facilitation was the main outcome from the 2013 Bali
WTO Ministerial Conference The agreement was to streamline customs
procedures and minimise delays at borders ndash with Africa expected to be the
main beneficiary World Bank researchers and others have combined to
produce a database of per day ad valorem costs to use in GTAP with these
estimates provided in ad valorem equivalents of the per day costs along with
the number of days involved and Jensen and Sandrey used the Singapore
international best-practice benchmark of four days for imports and assessed a
reduction of 20 in the days over and above this benchmark for African
imports
The welfare gains to Africa were substantial For South Africa they are some
US$ 8519 million in real terms and as is usually the case this is the most
significant result for both Africa and the total worldwide gain of
US$ 31231 million Following close behind are the very large gains to Nigeria
and the rest of Africa aggregation In direct contrast to our tariff elimination
scenarios there are gains to many of the large economies outside Africa as
their export prices rise in response to more efficient transit times in Africa The
striking feature from the results is that almost all of the gains to each country
overwhelmingly accrue to that same country and that (a) these gains are
substantial (b) they mostly accrue to the liberaliser and (c) in only taking 20
of the costs of time over and above an international benchmark we are leaving
plenty of room for improvement in most African countries
Similarly while not strictly speaking a WTO issue Jensen and Sandrey
(2015a) used the GTAP computer database and the full suite of African
agricultural sectors and African countriesregions in order to assess the benefits
of intra-African tariff abolition in agricultural trade across the continent This
66
research suggests that Africa has as much to gain from its own continental
liberalisation of agricultural trade as it does from relying on the WTO
South Africa was the leading beneficiary with the economy at 2015 being
some US$ 1840 million better off than it would otherwise have been Kenya is
the next largest African gainer followed by Senegal and Cocircte dIvoire The key
agricultural sectors were vegetables fruits and nuts crops (other) red meat
vegetable oils and fats dairy products refined sugar and associated products
food products not classified elsewhere and beverages and tobacco Overall the
largest impact was felt in the vegetable oils and fats sector with Cocircte dIvoire
and Kenya the African gainers Perhaps the more interesting and important
outcome however was in the sugar sector as reported above Changes in other
sectors are often dominated by South Africa They found that Kenya Tanzania
Zimbabwe and the rest of Africa lose significant tariff revenues that would
have to be adjusted for in some way and that Zimbabwe and to a lesser extent
Tanzania were the big losers overall
In addition tralac has undertaken significant research on non-tariff issues in
both analytical modelling and related survey work These barriers are
significant and not reported here as they are the subject of a separate Chapter
67
References
Ackerman F 2005 The shrinking gains from Trade A critical assessment of
Doha Round projections Global development and Environment Institute
Working Paper No 05-01 Tufts University October 2005
Anderson K and Martin W (Editors) 2005 Agricultural Trade reform amp the
Doha Development Agenda Washington DC World Bank
Brink R 2014Commitments under the WTO Agreement on Agriculture and
the Doha Draft Modalities How do they compare to current policy Paper
prepared as a background document for the OECD Global Forum on
Agriculture Issues in Agricultural Trade Policy 2 December 2014 Paris At
httpswwwoecdorgtadeventsAL-Brinkpdf
Coulibaly A El-Helepi M Chikhuri K and Tariq Ali2016 The Doha
agenda Whatrsquos in it for Africa and what next for secured development
outcomes and fast integration imperatives Draft Paper Prepared for the 19th
Annual Conference on Global Economic Analysis Washington D C
Decreux Y and L Fontagneacute Economic Impact of Potential Outcome of the
DDA II CEPII-CIREM October 2011
Jensen H G and Sandrey R 2015aTrade liberalisation in Africa a GTAP
analysis of intra-African agricultural tariffs going to zero tralac Working
Paper 27 Nov 2015
Jensen H G and Sandrey R 2015b The impact of EU reforms on African
sugar production and trade a GTAP analysis tralac Trade Brief 4 Nov 2015
Jensen H G and Sandrey R 2015c The Continental Free Trade Area ndash A
GTAP assessment tralac E-Book at httpwwwtralacorgpublications
bookshtml17 Apr 2015
Kinnman Susanna and Magnus Lodefalk Economic implications of the Doha
round Paper presented to 9th Annual GTAP Conference Addis Ababa
Ethiopia June 2006
68
Kirkpatrick Colin Clive George and Serban Scrieciu Sustainability Impact
Assessment of Proposed WTO Negotiations Institute for Development policy
and Management University of Manchester May 2006
National Board of Trade Stockholm Sweden Economic Implications of the
Doha Round (2006)httpwwwkommerssetemplatesAnalyseraspxid=15
Nyhodo B 2009The impact of the WTO round of agricultural negotiations on
the South African economy Master thesis from the Department of Agricultural
Economics Stellenbosch University March 2009
OECD (2006) OECD Review of Agricultural Policies South Africa 2006
OECD Publishing Paris DOI httpdxdoiorg1017879789264021907-en
Osakwe PN 2006 Emerging Issues and Concerns of African Countries in the
WTO Negotiations on Agriculture and the Doha Round Addis Ababa Trade
and Regional Integration Division (UNECA)
Polaski Sandra 2006 Winners and Losers Impact of the Doha Round
Carnegie Endowment for International Peace Washington D C
Sandrey R 2006a Agriculture and the World Trade Organization ndash 10 Years
On tralac Working Paper No 12006 January 2006
Sandrey R 2006b Trade Creation and Trade Diversion Resulting from SACU
trading Agreements[Online] wwwtralacorg
Sandrey R and Jensen H G 2007South African agriculture a possible WTO
outcome and FTA policy space ndash a modelling approach Chapter 5 in Sandrey
et al 2007South Africarsquos way ahead Trade Policy options tralac and AusAid
2007
69
Chapter 4
How the Agreement on Agricultural might
improve the South African Agricultural
Forestry and Fisheries Trade performance
Moses Lubinga Yolanda Potelwa Ron Sandrey
and William Mwanza
1 Introduction
This paper examines the export trade profiles of the South African agricultural
forestry and fisheries sectors to assess where the WTO may be able to improve
market access for these exports We have extended the traditional agricultural
sector to include the forestry and fisheries sectors as although classified as
manufacturing sectors in the WTO these two sectors are under the auspices of
the Department of Agriculture Forestry and Fisheries (DAFF) in South Africa
We analyse market access conditions only An earlier chapter in this book
shows that it is through market access that the major overall gains may come
from the WTO for agriculture while for fisheries the WTO does not investigate
subsidy supports to member countries
For the agricultural sector we find that a significant portion of exports from
South Africa is destined either for the EU or for fellow African destinations
We consider that for the former any gains for market access are likely to come
from direct negotiations under the auspices of the Trade and Development
Cooperation Agreement (TDCA) rather than multilateral agreements In fact a
multilateral agreement improving EU market access conditions for South
African competitors is likely to reduce South African preferential access
conditions and therefore be of little or no value to South Africa Similarly with
Africa becoming an increasingly important destination for South African
agriculture we consider that access conditions are much more likely to
70
improve with direct negotiations through the SDAC FTA the TrindashPartite FTA
or the Continental FTA As most African WTO members are least developed
countries they are very unlikely to have to make market access concessions
under any foreseeable WTO outcome and any that they do make are once
again likely to reduce possible preferences for South Africa
We confirm this general picture by analysis of the top-10 agricultural exports at
the HS 4 level into the top-10 export destinations We find that fellow SACU
destinations of Botswana Lesotho Namibia and Swaziland all of whom are in
the top-10 destinations are all duty-free under the SACU agreement and
Zambia only applies duties on exports of South African citrus fruits and even
here the rate is under 1 Both Mozambique and Zimbabwe have a mixture of
zero low and modest rates This leaves the three top-10 destinations of the EU
China and the US The same general pattern of a mixture of zero low and
modest rates also applies to US applied tariffs for South Africa with cane
sugar and related products being the sectors where access conditions could
improve We have observed that the TDCA governs access conditions for
South Africarsquos premiere market of the EU and note that despite this bilateral
agreement most of the exports to the EU have duties assessed In particular the
sugar tariff is 3773 This leaves China as the outlier where tariff rates are all
double figures Our analysis of course ignores possible markets where lsquotrade
chillingrsquo inhibits or prohibits exports from South Africa although as a
generalisation we consider that these cases may be limited to sugar and
associated products
For the forestry exports the situation is less complex Again examining the
major markets by the major commodities we find that the exports to the EU
Japan Namibia Botswana and Mozambique are all duty-free The same
conditions apply to exports into both Indonesia and Thailand where virtually
the only products of wood pulp are also duty-free This leaves the major market
for 2015 of China and India and Zimbabwe For China exports of wood pulp
the dominant export and the next most important wood chips are all duty-free
leaving only modest exports of paper and paperboard facing tariffs of 412
For India exports duties are 50 except for some negligible trade at
10Zimbabwe imports a wider range of forestry products and here the tariffs
are generally either at or near duty-free or at or near 10 Overall there are
very few exports facing duties in the major markets other than India or
Zimbabwe
71
Five of the 11 major markets for South African seafood exports are duty-free
namely Hong Kong USA Namibia Botswana and Mauritius Mozambique
imposes a 20 duty on crustaceans but otherwise is duty-free Despite the
TDCA the EU again the major market levies duties ranging from 315 to
1570 and again the appropriate negotiating process is through the TDCA
This leaves the minor markets of Japan Vietnam Australia and Taiwan
(Chinese Taipei) Japan imposes tariffs ranging from 192 to 1039
Vietnam has duties of 761 and 567 on its two import lines Australia has
only one dutiable import line at 281 and Taiwan has duties ranging up to
1953 Thus the major access concerns are the EU Mozambiquersquos
crustaceans and to a lesser extent Japan Lesser but still important access
issues remain with Vietnam and Taiwan
Overall we see few cases where the WTO negotiations may improve South
Africarsquos access conditions into the major markets for these exports In all cases
the EU is the top destination and except for forestry products access
conditions are generally constrained Africa is becoming increasingly
important and here the access conditions are more likely to improve through
direct intra-African agreements in the different negotiations that are in
progress In particular Zimbabwe remains problematical
In April 1994 contracting parties to the General Agreement on Tariffs and
Trade (GATT) including South Africa officially signed the Marrakesh
Declaration which established the World Trade Organization (WTO) as an
institutional framework for overseeing further trade negotiation rounds and
adjudicating trade disputes The declaration also formalised the successful
conclusion of the seven-year Uruguay Round (UR) of multilateral trade
negotiations a Round where agricultural products were comprehensively
included for the first time Subsequently agricultural trade was subject to less
discrimination though it is still regarded as the poor cousin of trade in
industrial or manufactured goods with respect to protection levels Arguably
the AoA set the scene for a radical change in the way agriculture is globally
supported and traded and as shown in an earlier chapter it has had a significant
effect in bringing down domestic subsidies and lowering access barriers in
developed markets for least developed countries and effectively ending export
subsidies This paper will however explore what the WTO may do for the
South African agriculture forestry and fisheries sectors in the future
72
Sandrey 2006 assessed the impacts of the AoA on the South African sector ten
years after the establishment of the WTO He concluded that although the
policies and the resultant institutional framework the new South Africa
inherited as it emerged from the troubled years of the apartheid era still heavily
influenced South African agriculture there had been major changes over the 10
years to 2006 These changes included land reform programmes the intro-
duction of minimum wages and other employment conditions for farm
workers the deregulation of the Control Boards substantial liberalisation of
international trade and the withdrawal of a large proportion of the farmer
support services provided to commercial and small-scale farmers alike The
AoA influenced the agricultural sector in South Africa through several
different channels such as domestic policy (with tariff policy as sub-set) and
offshore market access conditions although arguably domestic policy reforms
went beyond any changes mandated by the UR
The objective of this paper is to evaluate the impact of South African agri-
cultural trade performance since the inception of the Agreement on Agriculture
(AoA) the background to which is outlined an earlier chapter and will not be
repeated here Our analysis includes both the forestry and fishery sectors as
DAFF administer both of these sectors
2 The Agriculture Forestry and Fishery (AFF) Export Trade
profiles from South Africa
Following the Uruguay Round of the WTO and the subsequent AoA South
African agriculture entered a new era came into part through the removal of
imports quota and tariff in their borders with an objective of increasing South
Africarsquos participation and export competition in the global market Figure 1
shows the AFF trade performance between 1996 and 2015 and since the
implementation of AoA South Africarsquos AFF trade has improved at an average
of 12 In most years exports have been marginally above imports leading to
a small positive trade balance as shown
73
Figure 1 South African AFF trade performance
Source World Trade Atlas
In this section we will look at the South African Agriculture Forestry and
Fishery trade in a more comprehensive analysis of South Africarsquos overall
export trade performance in recent years We have limited our analysis to the
years between 2010 and 2015 as it was only in 2010 that intra-SACU trade
data became accessible and reliable
21 The agricultural export profile
This section focuses on the agricultural exports from South Africa into the
world between the period in 2010 and 2015 Table 1 profiles South Africarsquos
agricultural exports where overall these exports increased by 47 from
R62 billion in 2010 to R116 billion in 2015 The EU has consistently been the
largest destination since 2010 taking some R299 billion in 2015 Namibia has
been the second largest destination with R93 billion in 2015 followed by
Botswana Mozambique and China with a 2015 total of R68 billion
R58 billion and R52 billion respectively
74
Table 1 South Africarsquos Top 10 export destinations (Agriculture) R millions
Importers 2010 2011 2012 2013 2014 2015
World 62103 65051 74907 93462 107613 116629
EU 28 16819 16908 18153 24598 27017 29952
Namibia 5628 6148 6552 7572 8503 9377
Botswana 4691 4811 5419 6037 6305 6830
Mozambique 2395 2473 2815 4313 5523 5844
China 1374 1642 2543 3579 4324 5322
Zimbabwe 3452 4189 5023 5268 5314 5227
Lesotho 2381 2668 3132 3508 3747 4091
Zambia 1071 1244 1729 2370 3190 3716
USA 1768 1744 2087 2385 3020 3605
UAE 1409 1477 1757 2266 3022 3587
Source International Trade Commission (ITC) TradeMap
The agricultural products used are based on the definition of the WTO which
excludes fish and forestry products It also includes various degrees of
processing for different commodities in agriculture Table 2 shows these same
destinations by percentage share The EU of course dominates and has done
across the period with relatively consistent shares from a high of 27 in 2010
to a low of 24 in 2012The table highlights the importance of the SACU and
SADC countries most of whom who have similarly been relatively consistent
destinations Increasing Chinese and UAE shares complete the main features of
the table
75
Table 2 Percentage shares () of South Africarsquos Top 10 agricultural export
destinations
Importers 2010 2011 2012 2013 2014 2015
EU-28 27 26 24 26 25 26
Namibia 9 9 9 8 8 8
Botswana 8 7 7 6 6 6
Mozambique 4 4 4 5 5 5
China 2 3 3 4 4 5
Zimbabwe 6 6 7 6 5 4
Lesotho 4 4 4 4 3 4
Zambia 2 2 2 3 3 3
USA 3 3 3 3 3 3
UAE 2 2 2 2 3 3
Source ITC TradeMap
Table 3 introduces the main South African agricultural exports by HS 4 for
2010 to 2015 inclusive with the data expressed in R million Citrus fruit has
been ranked number one since 2010 with exports of R137 billion in 2015
Wine grapes and apples (pome fruit) followed these fruits in 2015 Note that
sugar was among the top ten agricultural exports and although South Africa
exported significant quantities of sugar it was a nett importer of sugar in 2015
76
Table 3 South Africarsquos Top 10 agricultural exports R millions
Value in Million Rand
Code Product label 2010 2011 2012 2013 2014 2015
Agricultural Products 62103 65026 74907 93462 107613 116628
0805 Citrus fruit 6686 6840 7388 9342 11625 13694
2204 Wine 6075 5795 6314 8340 8509 8733
0806 Grapes 3654 3385 4093 4986 6286 7418
0808 Pome fruit 3161 3457 4053 6100 5892 6975
0802 Nuts nes 740 1013 1349 1808 2721 3864
2009 Fruit amp vegetable
juices 2111 2260 2535 3007 3568 3670
5101 Wool 1300 2091 2385 2920 2834 3178
2106 Food preparations
nes 1178 1426 1560 1753 2277 2521
2008 Preserved fruits nes 1 601 1423 1604 1849 2033 2395
1701 Cane Sugar 2664 2283 2716 4278 4592 1998
Source ITC TradeMap
The data for these top 10 commodities is expressed in of export market
shares in Table 4 Over the period citrus (0805) became more important
increasing in market share from 1077 in 2010 to 1174 in 2015 and we
may add that this increase took place in a competitive global market Wine in a
similarly competitive market has been losing market share ndash from 978 in
2010 to 749 in 2015 Similarly sugar has also been losing the market share
from 429 in 2010 to 17 in 201512 Most other HS 4 lines are relatively
stable
12 We add that 2015 was a year beset by adverse climatic conditions that altered exports of
sugar and maize in particular
77
We next combine these tables to show the matrix of Table 5 where the main
destinations are paired with the main exported products The EU-28 is the main
destination for all the top ten agricultural products except where the USA for
nuts etc and the SACUSADC destinations for both food preparations and
sugar dispose it from the top position China is an important market for wool
and fruits and wine Note that the four SACU partners of Namibia Botswana
Lesotho and Swaziland all appear in this top destinations list
Table 4 Percentage share of South Africarsquos Top 10 agricultural exports shares
Code Product label 2010 2011 2012 2013 2014 2015
0805 Citrus fruit 1077 1052 986 10 108 1174
2204 Wine 978 891 843 892 791 749
0806 Grapes 589 521 546 54 584 636
0808 Pome fruit 509 532 541 653 548 598
0802 Nuts nes 119 156 18 193 253 331
2009 Fruit amp vegetable juices 34 348 339 322 332 315
5101 Wool 209 322 318 312 263 272
2106 Food preparations nes 19 219 208 188 212 216
2008 Preserved fruits nes 258 219 214 198 189 205
1701 Sugar cane 429 351 363 458 427 171
Source ITC TradeMap
78
Table 5 Matrix for main agricultural exports and main export markets (Million Rand)
Source ITC TradeMap
HS 4 EU 28 Namibia Botswana China Mozambique Zimbabwe Lesotho Zambia Swaziland USA
0805 Citrus fruit 5117 31 21 499 54 5 13 34 14 504
2204 Wine 4917 416 82 455 150 46 24 60 41 513
0806 Grapes 5126 14 16 52 11 43 3 10 5 96
0808 Pome fruit 2435 76 103 5 52 66 25 94 37 17
0802 Nuts nes 616 14 10 282 3 3 1 2 5 831
2009 Fruitveg
juices 691 383 406 31 318 180 98 157 85 92
5101 Wool 695 0 0 2237 1 0 1 0 0 5
2106 Food
preparations 121 170 181 0 311 395 55 325 103 12
2008 Preserved
fruit nes 741 50 66 187 11 14 16 14 30 93
1701 Cane Sugar 16 681 347 1 348 133 114 1 7 13
79
Table 6 shows the tariff rates associated with these exports We have deleted
Botswana Lesotho Namibia and Swaziland as they are all duty-free under the
SACU agreement Note in particular that despite the TDCA between South
Africa and the EU most of the exports to the EU have a duty assessed into that
market and in particular the sugar tariff is 3773 Rates into China are all
double figures and it is worth reporting here that the main Southern
Hemisphere competitors of Australia and New Zealand have significant tariff
advantages over China in these products thanks to their FTAs Zambia is
largely duty-free while both Mozambique and Zimbabwe have a mixture of
zero low and modest rates We see the same general pattern in the US applied
tariffs
Table 6 Matrix of applied tariff rates for main exports into main markets ()
Source ITC TradeMap
22 Fisheries exports
Shown in Table 7 are South Africarsquos fishery exports by destination expressed
in R million and they highlight that between 2010 and 2015 these exports to
the world grew from R39 to R59 billion EU consistently and dominantly
ranked in 1st place among these top 10 importers registering an amount of
HS 4 EU
28 China Mozambique Zimbabwe Zambia USA
0805 Citrus fruit 777 1152 1058 0 096 022
2204 Wine 338 1474 0 1004 0 138
0806 Grapes 0 1257 0 220 0 0
0808 Pome fruit 749 1116 1362 0 0 0
0802 Nuts nes 0 1402 0 724 0 014
2009 Fruitveg
juices 809 2089 0 325 0 008
5101 Wool 0 380 0 0 0 062
2106 Food
preparations 389 1701 1062 028 0 942
2008 Preserved
fruit nes 207 1599 150 0 0 809
1701 Cane Sugar 3773 500 353 554 0 1073
80
R27 billion in 2015 Next in 2015 were Hong Kong Vietnam and the USA
According to the ITC South Africa ranked as the 24th largest global exporter of
HS 03 the standard finfish category with a 04 global share
Table 7 South Africarsquos Top 10 export destinations of fish amp related products
R million
Importers Value in Million Rand
World 3908 4220 4368 5015 6098 5971
EU-28 1837 1934 1885 2033 2671 2695
Hong Kong 551 502 542 618 617 731
Vietnam 4 178 19 147 317 365
USA 192 187 230 296 329 321
Australia 181 221 264 329 276 255
Mozambique 50 66 97 125 184 162
Namibia 139 141 136 154 162 161
Mauritius 62 62 62 90 159 144
Botswana 86 74 106 117 129 141
Taipei Chinese 33 35 47 77 109 119
Japan 120 139 137 139 186 111
Source ITC TradeMap
The EU share has remained consistently around 45 of South Africarsquos total
fishery exports to the world over the period Exports to Vietnam and
Mozambique have increased relative to the total thus increasing their market
share while conversely exports to Hong Kong have declined relative to the
total (thus declining market shares)
81
Table 8 Percentage () share of South Africarsquos Top 10 export destinations (fish)
Importers 2010 2011 2012 2013 2014 2015
EU 28 47 46 43 41 44 45
Hong Kong 14 12 12 12 10 12
Vietnam 011 004 05 3 5 6
USA 5 4 5 6 5 5
Australia 5 5 6 7 5 4
Mozambique 1 2 2 3 3 3
Namibia 4 3 3 3 3 3
Mauritius 2 1 1 2 3 2
Botswana 2 2 2 2 2 2
Taipei Chinese 08 08 1 2 2 2
Japan 3 3 3 3 3 2
Source ITC TradeMap
In monetary terms Table 9 shows the top 10 fishery exports from South Africa
Frozen fish was ranked as the largest export fishery products with the total
amount of R14 billion in 2015Frozen fish fillets was ranked as the second
largest exported fishery product with an amount of R12 billion followed by
molluscs and crustaceans with totals of R115 billion and R990 million
respectively in 2015
Table 9 South Africarsquos Top 10 fishery product exports R million
Code Product label 2010 2011 2012 2013 2014 2015
Fishery products 3908 4220 4368 5015 6098 5971
0303 Whole fish frozen 870 966 992 1185 1429 1456
0304 Fish fillets 724 807 906 1079 1410 1278
0307 Molluscs 801 785 732 659 920 1158
0306 Crustaceans 649 686 722 913 1110 990
1604 Prepared fish amp caviar 365 431 559 657 654 520
0302 Whole fish fresh 293 306 254 230 250 233
1605 Prepared crustaceans amp
molluscs 67 101 68 149 178 208
0305 Smoked fish 104 91 97 98 105 92
1603 Extracts crustaceans amp
molluscs 2 2 4 4 17 11
Source ITC TradeMap
82
Since 2011 the whole fish frozen was ranked as the largest fish export with a
positive growth of export share except for the minor decline in 2012 (see table
10) Fish fillets and crustaceans showed significant declines of export shares by
17 and 16 respectively between 2014 and 2015 The molluscs has been
showing positive export share growth from 132 in 2013 to 194 in 2015
Table 10 Percentage share of South Africarsquos Top 10 export destinations (fish)
Code Product label 2010 2011 2012 2013 2014 2015
0303 Whole fish frozen 223 229 227 236 234 244
0304 Fish fillets 185 191 207 215 231 214
0307 Molluscs 205 186 168 132 151 194
0306 Crustaceans 166 163 165 182 182 166
1604 Prepared fish amp caviar 93 102 128 131 107 87
0302 Whole fish fresh 75 73 58 46 41 39
1605 Prepared crustaceans amp
molluscs 17 24 16 30 29 35
0305 Smoked fish 27 22 22 20 17 16
1603 Extracts crustaceans amp
molluscs 01 01 01 01 03 02
Source ITC TradeMap
Table 11 introduces the matrix where the main destinations are displayed along
with the main exported products The EU market is the largest importer with
imports of fish fillets crustaceans and prepared fish and caviar amounts of
R783 million R960 million and R643 million respectively in 2015
83
Table 11 Matrix for fish exports and main markets (Value in million Rand)
EU
28
Hong
Kong USA Mozambique Namibia Botswana Japan Vietnam Australia Mauritius Taiwan
HS 4 Total 2692 730 322 162 156 126 65 28 20 10 9
0306 Crustaceans 46 173 180 1 14 3 6 28
3
0303 Whole frozen 783 16 65 148 29 11 4
8 2
0302 Whole fish fresh 112
43 2 8 6 14
0304 Fish fillets 960
32 5 32 14
12
0307 Molluscs 643 351 2 1 10 1 33
5
0301 Live fish 2
2
1604 Prepared fish caviar 146 1
4 56 88
5 2
0305 Smoked Fish
22
1 3 1 7
3
1603 Extracts
1
1605 Prepared crust
molluscs 167 4 1
Source ITC TradeMap
84
Table 12 shows the duties faced by South Africa in these markets and this
follows directly from the matrix table above Note that excluded are Hong
Kong USA Mozambique Namibia Botswana and Mauritius as all exports
were reported as duty-free into these markets Hong Kong was duty-free except
for a minimal 009 levied on smoked fish while only one line faced duty into
Australia All fisheries products into the EU faced duties and here it would be
logical that any improvement in access conditions should be pursued through
TDCA negotiations with the EU and not through the WTO as the latter may
erode preferences Some duties into Japan are moderate to high while those
into Taiwan (Chinese Taipei) are very high
Table 12 Matrix for fish exports and main markets (Value in million Rand)
EU
28
Hong
Kong Japan Vietnam Australia Taiwan
HS 4 Total
0306 Crustaceans 593 0 266 567 1953
0303 Whole frozen 515 0 434 1816
0302 Whole fish fresh 315 0 411
0304 Fish fillets 688 0
0307 Molluscs 371 0 818 3023
0301 Live fish 732 192
1604 Prepared fish
caviar 1570 0 281
0305 Smoked fish 009 1039 0
Source ITC TradeMap
23 Exports of Forestry products
As shown in Table 13 the exports of South African forestry products totalled
R258 billion in 2015 with China rising to be the leading destination The EU
has been a consistent destination while Indonesia was important during 2011
in particular Closer to home the four African destinations of Namibia
Botswana Zimbabwe and Mozambique have also featured
85
Table 13 South Africarsquos Top 10 export destinations (Forestry)
Values in million Rand
Importers 2010 2011 2012 2013 2014 2015
World 17164 18596 17178 19262 23669 25859
EU 28 2553 2389 2316 2372 3223 3166
China 726 1266 1391 2187 3857 4081
Japan 1508 1652 1375 1504 1627 2114
India 408 568 509 846 968 2046
Namibia 1223 1391 1456 1537 1759 1899
Indonesia 1970 2647 1893 1824 1646 1581
Botswana 1161 1244 1236 1251 1386 1379
Zimbabwe 718 806 897 1053 1163 1207
Mozambique 468 556 599 801 1103 1011
Thailand 658 611 597 526 725 923
Source ITC TradeMap
Table 14 represents this same data displayed as percentage shares for the main
destination for forestry products As observed earlier with agriculture and
fishery exports the EU had been the dominant export destination market
although its shares have been stable to perhaps declining and it has been
overtaken by the rapidly rising exports to China Indonesiarsquos declining share is
apparent as is the rise in the share of exports to India Other markets are
relatively stable
86
Table 14 Percentage share of South Africarsquos Top 10 export destinations (forestry)
Importers 2010 2011 2012 2013 2014 2015
EU 28 1488 1285 1348 1232 1362 1225
China 423 681 810 1136 1630 1578
Japan 879 889 801 71 688 818
India 238 306 297 440 409 791
Namibia 713 748 848 798 744 734
Indonesia 1148 1423 1102 947 695 612
Botswana 67 669 720 649 586 533
Zimbabwe 418 434 523 547 491 467
Mozambique 273 3 349 416 466 391
Thailand 384 33 348 273 307 357
Source ITC TradeMap
The main HS 4 categories are shown in Table15 with chemical wood pulp
ranked as the largest individual product in 2015 with exports of R87 billion
Uncoated kraft paper was ranked as the second largest exported forestry
products with an amount of R26 billion followed by packing containers and
chemical wood pulp with totals of R265 billion and R13 billion in 2015 The
same data is presented in terms of the percentage shares in Table 16
87
Table 15 Top 10 forestry exports
Million Rand
Code Product label 2010 2011 2012 2013 2014 2015
Forestry Products 17163 18596 17178 19262 23669 25859
4702 Chemical wood pulp 4340 5597 4696 5861 8009 8706
4401 Wood chips etc 1816 1715 1438 1638 1979 2626
4804 Uncoated kraft paper 1706 1959 1968 1908 2240 2514
4819 Packing containers 979 925 958 1107 1262 1322
4703 Chemical wood pulp 1085 1210 754 691 865 1257
4802 Uncoated paper 1438 1004 1067 1040 1178 937
4403 Logs 184 284 433 493 814 713
4901 Printed books and
brochures 676 687 594 659 625 702
4418 Builders specialist timber 412 465 457 476 633 687
4805 Uncoated paper 201 236 279 347 461 593
Source ITC TradeMap
Table 16 Percentage share South Africarsquos Top 10 forestry product exports
Code Product label 2010 2011 2012 2013 2014 2015
Forestry Products 29 24 21 21 24 25
4702 Chemical wood pulp 253 301 273 304 338 337
4401 Wood chips etc 106 92 84 85 84 102
4804 Uncoated kraft paper 99 105 115 99 95 97
4819 Packing containers 57 50 56 57 53 51
4703 Chemical wood pulp 63 65 44 36 37 49
4802 Uncoated paper 84 54 62 54 50 36
4403 Logs 11 15 25 26 34 28
4901 Printed books and brochures 39 37 35 34 26 27
4418 Builders specialist timber 24 25 27 25 27 27
4805 Uncoated paper 12 13 16 18 19 23
Source ITC TradeMap
88
Table 17 Matrix for forestry exports and main export markets for 2015 (value in million Rands)
Source ITC TradeMap Note that the 2015 totals are updated by the ITC They may not necessarily reconcile exactly with earlier tables
HS 4 Product label EU China Japan India Namibia Indonesia Botswana Zimbabwe Mozambique Thailand Total
Forestry 3211 4139 2145 2075 1922 1604 1392 1211 1019 936 75
4702 Chemical pulp 1081 3234 140 1630 0 1438 0 0 21 710 93
4401 Wood chips etc 14 169 2003 318 2 0 6 1 2 0 94
4804 Paperpaperboard 1556 37 0 1 80 2 46 138 15 0 74
4703 Chemical pulp 0 681 0 0 0 159 0 0 0 218 83
4819 Packing
containers 35 1 0 22 252 0 198 149 256 0 68
4418 Builders timber 150 0 0 0 122 0 127 20 41 0 66
4407 Sawn wood 7 0 0 1 137 0 157 5 129 0 78
4818 Toilet paper etc 1 0 0 0 161 0 123 48 56 0 70
4802 Uncoated paper 6 0 0 0 76 0 79 124 64 0 37
4403 Logs 20 5 0 1 117 0 91 3 101 0 47
4901 Books etc 44 0 0 0 134 0 49 44 28 0 42
4820 Registers etc 6 0 0 1 71 0 46 115 22 0 62
4805 Paperpaperboard 17 0 0 3 39 0 17 121 9 1 34
to Destination 91 100 100 95 62 100 67 64 73 99
89
The data in Table 17 shows that the matrix of the top 13 export lines from
South Africa represents 75 of the total forestry exports for 2015 (right hand
column) The African destinations of Namibia Botswana and Zimbabwe show
that only 62 to 67 of the total exports are in the table and similarly the
exports of HS 4805 and HS 4802 show that only 34 and 37 respectively of
the exports are similarly in the table An examination of the data shows that of
HS 4802 and HS 4805 almost all of the missing exports are to African
destinations not represented in the table Exports to China Japan Indonesia
and Thailand are conversely all shown in the table (100 in bottom line) and
furthermore these exports are effectively in only two product lines for Japan
Indonesia and Thailand Conversely the EU and the African destinations
shown all report trade in most product lines
The tariff rates associated with this export trade in forestry products are shown
in Table 18 below As all exports to the EU Japan Botswana Namibia and
Mozambique are duty-free they are not shown while an lsquoxrsquo denotes no trade
reported in that line Tariffs into China Indonesia and Thailand are modest
while those into India are based at 50 or 100 and those into Zimbabwe
vary significantly and range from zero or very low to around 11
Table 18 Tariff rates into major markets by major products
Source ITC Trade Map
HS 4 Product label China India Indonesia Zimbabwe Thailand
4702 Chemical pulp 0 50 x x 0
4401 Wood chips etc 0 50 x 0 x
4804 Paperpaperboard 412 100 487 50 x
4703 Chemical pulp 0 x 0 x 0
4819 Packing containers 578 102 x 854 x
4418 Builders timber x x x 1125 x
4407 Sawn wood x 100 x 0 x
4818 Toilet paper etc x x x 1152 x
4802 Uncoated paper x x x 073 x
4403 Logs 0 50 x 036 x
4901 Books etc x x x 0 x
4820 Registers etc x 100 x 100 x
4805 Paperpaperboard x 100 x 0 50
90
Chapter 5
The Agriculture Negotiations At the World
Trade Organisation An update after the
Nairobi Ministerial Conference
Miriam W O Omolo
1 Introduction
The World Trade Organization (WTO) is considered the largest trading bloc
with the goal of facilitating a free global trading system Multilateral
negotiations began after World War II with the objective of establishing an
umbrella body International Trade Organization (ITO) parallel to the Breton
Woods Institutions Due to political difficulties the ITO was never established
A group of 2313 countries began trade negotiations under a provisional set of
rules known as the General Agreement on Trade and Tariffs (GATT)14 and in
1995 the WTO was created while the GATT rules remained in force The
fundamental differences between GATT and the WTO are while GATT was
an agreement the WTO is an international organization which is concerned
with members following the trade rules set out The GATT was concerned with
trade in goods and tariff reductions only
The stylised process used to gain progress in international negotiations is called
the trade round Countries meet together to negotiate a set of tariff reductions
and other measures that liberalise trade There have been eight trade rounds
13 The countries include Australia Belgium Brazil Burma Canada Ceylon Chile China
Cuba Czechoslovakia France India Lebanon Luxembourg the Netherlands New
Zealand Norway Pakistan Southern Rhodesia Syria South Africa United Kingdom and
United States Subsequently the United States China Lebanon and Syria withdrew 14 An agreement where contracting parties operated on a set of rules in order to reduce tariffs
as per the GATT agreement
91
since 1947 of which the Uruguay round completed in 1994 established the
WTO The WTO agreements cover goods services and intellectual property
The agreement has six main parts the agreement establishing the WTO the
agreement for the three broad categories of trade (goods services and
intellectual property) dispute settlement and the review of government trade
policies The agreement starts with the broad principles of GATT General
Agreement on Trade in Services (GATS) and Trade Related Aspects of
Intellectual Property Rights (TRIPS) This is followed by extra agreements and
annexes dealing with special requirements of specific sectors or issues
2 The Agreement on Agriculture
The Agreement on Agriculture (AoA) was the outcome of the Uruguay round
of negotiations (1986ndash1994) The objective of the AoA was to remove agri-
cultural trade distortions in order to ensure that import and export markets
remained predictable for traders These distortions arose from the loopholes in
the GATT that allowed members to use import quotas and subsidise
agricultural trade The AoA has three pillars market access domestic support
and export competition
i Market access These are trade restrictions that importers face while
trading at the international level The AoA sought to remove these
market access obstacles which were largely in the form of tariff and
non-tariff measures (such as quotas) and replace them with tariffs ndash a
process known as tariffication Countries negotiate to reduce their
bound tariffs ie tariff ceilings that countries have legally committed
to at the WTO However the respective country governments charge
lower tariffs on agricultural imports this is known as the applied
tariff The difference between the bound and applied tariff gives the
tariff overhang
ii Domestic support These are policies that subsidise production
through prices or incomes When agricultural producers receive sub-
sidies from their governments they are able to produce and charge
lower prices this has the effect of increasing production and flooding
both local and international markets to the detriment of other agri-
cultural producers who do not receive domestic support In the WTO
parlance boxes are used to identify subsidies These boxes take the
92
colours of traffic lights green (permitted) amber (slow down - ie be
reduced) red (forbidden) In the AoA the red box does not exist
Domestic support is measured using the aggregated measurement of
support (AMS) This is the annual level of support (in monetary
terms) provided for an agricultural product that favours the producer
of that specific product
iii Export competition These are initiatives that make exports arti-
ficially competitive They include export subsidies export credits
guarantees and insurance food aid export state trading enterprises
and export restrictions and taxes
The Uruguay round of trade negotiations resulted in setting numerical targets
for reducing trade distortions in agriculture as presented in table 2-1 The
framework of rules set to reduce all these forms of trade distorting support is
presented in Article 20 of the AoA The negotiations took place in two phases
phase I (March 2000ndashMarch 2001) countries submitted proposals of their
initial starting point of negotiations phase II (March 2001ndashFebruary 2002)
members had informal meetings where they discussed specific topics and
developed technical proposals on how to reach a consensus agreement on the
changes to rules and commitments Apart from the tariff reductions domestic
support and export subsidies there are also issues of special and differential
treatment (SampD15) for developing countries and non-tariff concerns16
15 SampD is the treatment accorded to developing countries which are more favourable than
other WTO members for example longer periods for implementing agreements and
commitments (see table 21) 16 Non-tariff concerns include issues related to food security poverty alleviation
environmental protection and rural development which governments tend to pursue as part
of their development objectives
93
Table 2-1 Summary of Uruguay Round Targets Under Agreement on Agriculture
Developed Countries
(1995ndash2000)
ndash 6 years
Developing Countries
(1995ndash2004)
ndash 10 years
Tariffs
Average cut for agricultural products - 36 - 24
Minimum cut per product - 15 - 10
Domestic Support
Total AMS cut for sector
(base period 1986ndash88) - 20 - 30
Exports
Value of subsidies - 36 - 24
Subsidised quantities
(base period 1986ndash90) - 21 - 24
Source WTO Agreement on Agriculture
21 Groups Negotiating in Agriculture17
It is worth mentioning that there are several groups that negotiate in agri-
culture these groups tend to come together with the key feature being an issue
of common interest affecting them Figure 1 provides a summary of these
groups and their objectives
17 httpswwwwtoorgenglishtratop_eagric_enegoti_groups_ehtm
94
Figure 1 Groups Negotiating in Agriculture
African Caribbean and Pacific (ACP) ndash these are countries that have
preferences to the EU Their main issue of concern is agricultural
preference The ACP group negotiating at the WTO is made up of 79
countries 61 are WTO members while the rest are either observers or non-
WTO members
African Group ndash is made up of 43 African countries that are members of
the WTO they focus on all issues affecting African countries
Asian Developing members ndash is made up of 31 Asian countries that are
members of the WTO
European Union (EU) ndash is made up of 29 European countries that are
members of the EU customs union and the WTO the focus is on all issues
affecting the EU
Mercosur ndash this is the common market of the southern Cone made up of
four WTO members WTO Argentina Brazil Paraguay and Uruguay
G90 ndash is made up of the African group ACP and least developed countries
They focus on all issues affecting the group members
Least Developed Countries (LDCs) ndash made up of 34 WTO members and 14
observersnon-WTO members They negotiate on issues affecting LDCs at
the WTO
Small and Vulnerable Economies (SVEs) in agriculture ndash these are made
up of 15 countries with small economies (Barbados Bolivia Cuba
Dominican Republic El Salvador Fiji Guatemala Honduras Maldives
Mauritius Mongolia Nicaragua Papua New Guinea Paraguay Trinidad
and Tobago) whose agricultural sectors are vulnerable to negative shocks
due to their size
Recent new members (RAMs) ndash these are recently acceded members who
joined the WTO after 1995 They negotiate on general issues affecting
them
Low-income economies in transition ndash these countries seek the same
treatment as LDCrsquos they include Armenia Kyrgyz Republic and Moldova
Cairns Group ndash a list of agricultural exporting countries that push for
agricultural liberalisation it is made up of 20 countries
The tropical products group ndash made up of eight countries that negotiate in
favour of tropical products
G10 ndash a coalition of countries lobbying for agriculture to be treated as
diverse as possible because of non-trade concerns such as food security
95
G33 aka lsquoFriends of Special Productsrsquo ndash made up of 48 developing
countries who want limited opening of the agricultural sector for
developing countries
Cotton-4 ndash made up of Benin Mali Burkina Faso and Chad Their main
objective is to ensure cotton subsidies and tariffs are cut to enable them to
have market access in the cotton-subsiding countries
3 The Doha Development Agenda (DDA) ndash Agriculture
The DDA owes its existence to the fourth WTO Ministerial Conference held in
Doha Qatar in November 2001 where a declaration was issued on 14
November 2001 with key dates (Figure 2) There were a range of subjects
discussed under the declaration however this background paper focuses on the
section on agriculture The Doha declaration built on the work that was already
going on in agriculture negotiations (phase I and II) The declaration
reconfirmed the long-term objective of establishing a fair and market-oriented
trading system through a programme of fundamental reforms The commitment
by member governments in this sector is aimed at
i substantially reducing tariff and non-tariff measures that would
ensure market access of agricultural products
ii reducing and ultimately phasing out all forms of export subsidies
iii substantial reduction in domestic support that would ensure non-trade
distortion
96
31
Marc
h2003 Member
countries to produce formulas and other modalitiescommitments
10-1
4 S
ep
tem
ber
2003
5th Ministerial Conference (in Cancuacuten Mexico) ndashmember countries to provide comprehensive draft commitments This would be a stock taking conference
1 Ja
nu
ary
2005 Agriculture is
part of a single undertaking
Figure 2 Key Dates in the Doha Ministerial Declaration
Source Doha Ministerial Declaration
31 The Missed Deadlines
Members were unable to meet the deadline of March 2003 on modalities that
would enable them to produce their comprehensive draft commitments They
proceeded to prepare a framework of modalities which was completed in
August 2003 even though the process continued to August 2004 From
September 2004 till now members are in the modalities phase The
preparations for the Cancun Ministerial Conference saw the preparation of a
joint text from the United States (US) and the European Union (EU) and
proposals from country groupings such as the G2018 Dominican Republic
Honduras Nicaragua and Panama Japan Bulgaria Chinese Taipei Iceland
Republic of Korea Liechtenstein Switzerland Norway and Kenya These
proposals later formed the Annex A Draft Framework on Agriculture (aka
Perez del Castillo text) of the draft Ministerial Declaration19 Proposed
amendments and further negotiations from members resulted in the Derbez
18 Argentina Bolivia Brazil Chile China Colombia Costa Rica Cuba Ecuador Egypt El
Salvador Guatemala India Mexico Nigeria Pakistan Paraguay Peru Philippines South
Africa Thailand Venezuela 19 WTO-JOB (03)150Rev1 24 August 2003
97
Text20 Members could still not agree on the four Singapore issues21
investment competition government procurement and trade facilitation The
Cancun Ministerial Conference ended in a deadlock following the conclusion
by Chairperson Luis Ernesto Derbez that despite considerable movement in
consultations members held firm positions particularly on the Singapore
Issues On 1 August 2004 the 147 members of the WTO approved a package
which had frameworks that could be used to complete the modalities on
agriculture
32 Market Access
Tariffs
The market access negotiations focused on tariffs and quotas The preparations
for modalities were handled under six components tariffs tariff quotas tariff
quota administration special safeguards importing state trading enterprises
and other issues Phase I of the negotiations on tariffs and quota focused on
how tariffs would be handled Countries such as Canada and the US argued in
favour of inclusion of sectoral liberalisation and there were discussions of
whether to base negotiations on bound or applied tariffs this was because most
countries had large tariff overhangs Most developing countries also com-
plained about tariff escalation22 hence increasing incomes through processing
agricultural products was not a viable option In phase II two proposals
emerged on tariff reduction
i Use the formula of the 1986ndash94 Uruguay Round negotiations that
averaged the reduction over all products with variation for individual
products as long as the minimum reduction level is met
ii Use the cocktail approach that uses a flat-rate percentage reduction
for all products with additional non-linear reductions on higher
tariffs expanding quotas and special treatment for developing
countries whilst factoring in non-trade concerns The percentage was
not specified
20 WTO-JOB (03)150Rev2 13 September 2003 21 Singapore issues are four working groups set up during the WTO Ministerial Conference of
1996 in Singapore 22 Tariff escalation is the increase in duty and other tariff charges on processed imports as
compared to raw materials
98
In preparation for the modalities two proposals for reducing the tariff were put
forward
bull the Swiss Formula which was proposed by the Swiss in the Tokyo
Round for negotiating industrial tariffs They (the Swiss) did not
support the Swiss formula for the agriculture negotiations
bull the Uruguay Round Approach which was linear and variations were
allowed for all products as long as the average target was met
Interestingly looking at the country proposal Uruguay preferred the Swiss
Formula whilst Switzerland preferred the Uruguay Round Approach A middle
ground was reached where there was a blend between the two approaches with
the flexibility of varying around the averages as long as they are above a
minimum set for each product Table 31 provides a summary of the tariff
reduction which factored in special and differential treatment of developing
countries
Table 3-1 Tariff Band Proposals for Developed and Developing Countries
Developed Countries Developing Countries
Tariff
Rate
Average
Cut
Minimum Cut
for any
product
Tariff Rate Average
Cut
Minimum Cut
for any
product
90+ 60 45 120+ 40 30
15ndash90 50 35 60ndash120 35 25
0ndash15 40 25 20ndash60 30 20
0ndash20 25 15
Special
products 10 5
Source WTO Agriculture Negotiations
In preparation for the draft framework modalities the EU and the US proposed
a blended formula in which products are separated into three groups one
would use the Uruguay Round Approach another the Swiss Formula and one
would be duty-free In preparation for Cancun the Peacuterez del Castillo draft
offered had the option of three groups of products all using the Uruguay Round
Approach but with different cuts or two groups one applying the Uruguay
Round Approach while the other used the Swiss Formula The Derbez Text
draft on the other hand provided two groups (for the Swiss Formula and the
99
Uruguay Round Approach) but with control on developed countriesrsquo tariffs and
measures this was meant to deal with tariff escalation
Tariff Quotas
Members agreed that tariff quota administration tariff quota expansion and in-
quota tariff remained a challenge and there was no single formula that could
work for all The following were the proposals for the draft modalities
bull For tariff quotas there would be no obligation to reduce in-quota
duties except in preferential tariff-free and quota-free programmes
and for tropical products or those used to diversify agriculture and in
cases where less than 65 of the quota is used
bull Expansion of tariff quota volumes to 10 of domestic consumption
(66 for developing countries) with an implementation period of 5
years (10 years for developing countries) and the flexibility of
allowing one quarter of total tariff quotas allowed to increase to 8
(5 for developing countries) but only if another quarter is increased
to 12 (8 for developing countries)
Given that special and differential treatment is an integral part of the
negotiations developed countries would give duty-free access for key products
while developing countries would not have to expand tariff quotas for selected
Special Products (SPs) for food security rural development or livelihood
security In preparation for Cancun both the Peacuterez del Castillo draft and the
Derbez Text adopted the US-EU approach The former text focused on
developed countries only since quota expansion and in-quota tariff reductions
were not agreed on The latter included flexibilities related to non-trade
concerns and proposed the need to further negotiate on quota expansion and in-
quota tariff reductions
Domestic Support
The discussions on domestic support covered green box Article 62 on special
and differential treatment blue box and amber box
Amber Box
All production and trade distorting domestic support are included in this box
The objective is to reduce the total value of these measures and there was
debate in phase II as to whether subsidies in this box should be reduced by
product
100
bull Aggregate Measure of Support (AMS) would be reduced from final
bound levels by 60 over 5 years (40 over 10 years for developing
countries)
bull The Peacuterez del Castillo text adopted the US-EU proposal of broadly
reducing trade-distorting supports by a range of percentages to be
negotiated The Derbez Text proposed a ceiling on amber box
supports paid for each product to reduce governmentsrsquo ability to shift
supports between products
Green Box
The green box subsidies cause nominimal trade distortions The main pro-
posals were to maintain the set of measures that do not distortminimally distort
trade these measures largely include objectives that deal with non-trade
concerns such as food security environmental protection etc There was a
proposal for updating the base period for decoupled23 income support There
was another proposal for a development box added to the green box in order to
enable them to deal with non-trade concerns In revised draft modalities in
addition to the above proposals countries asked for stringent criteria for
compensation allowed in the green box as well as allowing for increased cost
for protecting animal welfare Both the Peacuterez del Castillo and Derbez Texts
proposed the negotiations for the green criteria box be discussed or reviewed
Blue Box
The blue box provides an exemption to the rule that all subsidies linked to
production must be kept within the de minimis support level Currently the EU
Iceland Norway Japan the Slovak Republic and Slovenia have notified the
WTO on the use of this box There have been proposals by developing
countries to move this box to the amber box since it is a way of providing
domestic support There have been proposals to reduce the support in this box
by 50 over a 5 year period (cut by 33 over 10 years for developing
countries) another alternative is to merge it under the green box allowing
developing countries to delay the merger for up to 5 years The Peacuterez del
Castillo and Derbez Texts straddled between the US-EU proposals modifying
the definition of the blue box and totally eliminating this box as proposed by
23 These are domestic support programmes that are not product specific but include direct
income supports for farmers that are not related to current production levels or prices
101
the G20 and the G90 by including further reductions after a negotiated end of
implementation period
Export Competition
Export had five components export subsidies export credit guarantees and
insurance food aid exporting state trading enterprises and export restrictions
and taxes In all the discussions and negotiations special and differential
treatment and non-trade concerns were an integral part of the five components
During phase I there were 24 proposals received from WTO members on
issues relating to export competition under any of the five components Some
proposals included the elimination of all forms of subsidies while others
proposed deep reductions in subsidies There were proposals for ensuring a
zero sum where subsidies could increase in one product whilst reduce in the
other Several proposals were made which are highlighted either as preparation
for modalities draft modalities or draft frameworks (outlines)
Export Subsidies
There were several proposals made by different countries these can largely be
summarised as
bull 50 immediate reduction in exports subsidies This would serve as a
down payment and subsequently a further reduction to zero can be done
in 3 years for developed countries (6 years for developing countries)
bull 50 immediate reduction without down payment and further reduction
of subsidies to zero in 5 years
bull Broadly lsquoelimination is neither included nor excludedrsquo depending on
what happens in other areas including export credit and domestic
support
bull Modulation ndash allowing moderate cuts for some products in return for
steeper cuts in others
bull There were countries that proposed commitments on per unit subsidies
(eg dollars per tonne of a product)
The draft modalities ie time within which to eliminate the export subsidies
included 5 years (10 years for developing countries) for one set of products (of
interest to developing countries) and 9 years (12 years for developing
countries) for the rest of the products In the draft framework the Derbez Text
proposed a negotiated end date for phasing out all forms of export subsidies
102
Export Credit
There were two main proposals with regards to export credit
bull Rules based ndash export credit and insurance would have to be granted
on commercial terms such as duration of credit (eg 180 days)
benchmarks for interest rates (such as the London inter-bank rate)
appropriate insurance premiums etc Anything that deviated from this
would be classified as export subsidies and would have to be reduced
or eliminated
bull Reduction commitments ndash this means calculating the subsidy
component of credit insurance and guarantees and treating them in
the same way as regular export subsidies
Both the Peacuterez del Castillo and Derbez Text drafts proposed that lsquodistorting
elementsrsquo of export credits should mirror those of export subsidies both in the
selection of products and the reduction or elimination
Food Aid
Most countries agreed that food aid was not a threat if it emanates from appeals
from the World Food Programme (WFP) and any other humanitarian
organisations that declare an emergency Most developing countries get
concerned when food aid is meant to offload surpluses The G90 reiterates that
food aid dealing with emergencies should be addressed in order to meet
chronic food shortages or a countryrsquos development goals Both the Peacuterez del
Castillo and Derbez Text drafts envisage disciplines or additional disciplines
to prevent food aid from replacing commercial trade
Export and State Trading Enterprises (STE)
There is concern about exporting state trading enterprises since they are
perceived to be a likely cause of trade distortion in the world market There is
also a debate as to whether state trading enterprises can have monopoly power
and be bailed out using subsidies when they are in a crisis unlike private
companies However most developing countries argue that STEs can be used
to meet government objectives such as food security and to meet the demand
where private sector is too weak to trade or compete with foreign traders In
cases where there is a state granted monopoly there were proposals for
notification of purchase sales prices and transactions costs this would ensure
price transparency The Peacuterez del Castillo and Derbez Text drafts stated that
disciplines on export subsidies and subsidised export credits should also apply
to all relevant export subsidies
103
4 The August 2004 Framework
In July 2004 delegations negotiated intensively in order to come up with a
package of agreements (hence the name July Package) and a framework
(outline) to be used for the completion of modalities (the August Framework)
41 Market Access
The August Framework provided guidelines for negotiations that would ensure
substantial expansion of trade without explicitly spelling out any formulas
bull All members except LDCs would ensure they contribute towards
improvement to market access ndash hence a singular approach
bull The agreed formula should be tiered and progressive so that higher
tiers would have steeper cuts
bull Tariff reductions would be based on bound tariffs
bull Special and differential treatment accorded to developing countries
should be operationally effective
bull All countries would have the flexibility to have sensitive products
however even with these products in place there should still be
substantial improvement in market access Each member would
select his or her list of sensitive products
Issues relating to special safeguard mechanisms sectoral initiatives and
geographical indications were not agreed on Negotiations would continue on
reducing or eliminating in-quota tariff rates improving the administration of
quotas reducing or eliminating tariff escalation and tariff simplification
42 Domestic Support
bull A tiered formula would be used for the overall level of support which
combines the amber box de minimis and blue box This would ensure
that higher levels of support would have steeper tariff cuts All
countries would have the overall permitted level of support cut by
20
bull The amber box would be cut using a tiered formula and like the
overall support higher tariffs will have steeper cuts There would also
be limits set on particular products
104
bull Developing countries are allowed a de minimis support of 5 value
of total agricultural production (10 for developing countries) It
further allows 5 de minimis for the value of production of a product
(10 for developing countries) in case of product specific support
bull Blue box support would be capped at 5 of agricultural production
over a period to be negotiated
bull Green box support would be reviewed and clarified to ensure non-
trade distortion
43 Export Competition
Under export competition it was agreed that the following issues would be
subject to negotiations
bull A date that would mark the end of export subsidies that are listed in
the memberrsquos commitments
bull A all export credits export credit guarantees or insurance pro-
grammes with repayment periods beyond 180 days those with shorter
repayment periods but failing to conform with disciplines that are to
be negotiated trade-distorting practices of state trading enterprises
that are considered to be subsidised
bull Food aid that does not conform to various disciplines
bull The details of annual reductions by instalments and parallel treatment
for the different forms of export subsidies
5 The Honk Kong Ministerial Conference (MC6)
The 6th WTO Ministerial Conference was held in Hong Kong China on 13ndash18
December 2005 The objective of this meeting was to take stock of the on-
going round of negotiations There was significant progress made especially
after the July Package and August 2004 Framework since the Director Pascal
Lamy announced that the Doha was back on track after hibernation The Doha
Mandate and August Framework provided the basis for the negotiations Table
51 provides a summary of the key outcomes from the agriculture negotiations
105
Table 5-1 Summary of Key Outcomes of Hong Kong Ministerial Conference
Pillars Key Outcomes
Market Access bull Four bands would be adapted to structure tariff cuts with the
relevant threshold to be agreed upon There was near
convergence on a linear based approach within the tariff bands
bull Developing countries had the flexibility to designate an appro-
priate number of tariff lines for special products based on food
security livelihood security and rural development indicators
bull Special safeguards mechanisms would be based on price
triggers and import quantities the precise arrangements would
be subject to further negotiations
bull Special products and special safeguard mechanisms (SSM)
would be an integral part of the agriculture negotiations
Domestic Support bull There would be three bands in the final bound total AMS and an
overall cut in trade distorting subsidies
Export
Competition
bull There will be parallel elimination of all forms of export subsidies
and disciplines on all export measures with equivalent effects
which should be completed by December 2013
o The modalities for achieving this will be specified so that the
targets are realised in the first half of the implementation
period
bull Export credits export credit guarantee schemes or insurance
programmes with a guarantee of 180 days and below should be
self-financing to reflect market consistency
bull Disciplines relating to trade distorting exporting STEs will extend
to monopoly power so that they donrsquot circumvent the direct
disciplines on STEs on export subsidies government financing
and underwriting of losses
Food Aid bull A safe box for bona fide food aid will be provided to ensure the
emergency food aid is not impeded through agreement
bull The establishment of effective disciplines for in-kind food aid
monetization and re-exports
Cotton bull All forms of export subsidies on cotton to be eliminated by 2006
bull Countries will provide duty and quota-free access to all LDCs
bull The trade distorting subsidy on cotton production is to be more
ambitiously reduced with a shorter implementation period than
other trade distorting subsidies
Source Hong Kong Ministerial Declaration (2005)
106
6 The Bali Ministerial Conference (MC9)
The Bali Ministerial Conference held 3ndash6 December 2013 Bali Indonesia was
held after several missed deadlines24 The Bali Package had the objective of
identifying a set of low-hanging fruits with a particular focus on LDCs The
focus of the package was on trade facilitation agriculture and food security
There were two proposals given under agriculture
i The G20 gave proposals on export tariff rate quota (TRQ) admini-
stration and export subsidies
ii The G33 proposed public stockholding for food security purposes A
key area of discussion was the consistency of national policies and
WTO farm subsidy rules where government expenditure on building
food stocks for food security are minimal or non-trade distorting
India for example feared being in such a situation due to its National Food
Security Act which provided for subsidised food grains under the Public
Distribution System India proposed such price support schemes should be
considered compatible with the green box and not be subjected to limitations
However green box measures should not provide price support to producers
61 Outcomes
iThe tariff rate quota-discussion remained a technical issue ndash eventually to
be solved through an understanding on TRQ administration
iiExport subsidy ndashlsquoMembers would exercise utmost restraint in using any
form of export subsidy and ensure to the maximum extent possible that
progress towards the parallel elimination of all forms of export
subsidies [hellip] will be maintainedrsquo
iiiPublic food stockpiling
a A list of support policies used as general government
services under the WTO green box were defined such as
land rehabilitation drought management and rural employ-
ment and farmer settlement programmes
24 Draft 2006 modalities (June) 2007 revised draft modalities 2008 revised draft modalities
July 2008 package 2008 revised draft modalities
107
b Members opted for an interim solution in the form of a peace
clause and committed to finding a permanent solution by the
11th ministerial conference in 2017
c The WTO temporarily refrains from lodging a legal complaint
through the WTO Dispute Settlement Mechanism if a developing
country exceeds its amber box limits as a result of stockholding
for food security The following conditions would have to be
satisfied
i This is limited to traditional staple food crops and to
existing programmes
ii There are a series of notification and transparency
requirements and the obligation to hold consultations
upon request
iii The stocks procured under such programmes should not
distort trade or adversely affect the food security of
other members
7 The Nairobi Ministerial Conference (MC10)
The MC10 was the first WTO ministerial meeting to be held in Africa Little
progress had been made so far in terms of possible areas of agreement and if
the statement by the chair of agriculture was anything to go by then there was
little hope in concluding the agriculture negations
lsquoUnfortunately the areas of divergence remain and our challenge is to see what
is still possible to narrow the gaps and precisely wherehelliprsquo
The Chair of the agriculture negotiations Ambassador Vangelis Vitalis of New
Zealand
The G33 had made proposals to have special safeguards mechanisms that
would allow developing countries to temporarily raise tariffs to curb import
surges be included under issues to be discussed in Nairobi Australia had also
made a proposal on how export competition could be commercially beneficial
There had been no changes on discussions on public stock holding cotton
domestic support and market access The Nairobi Package (table 71) made
some remarkable progress in agriculture even though it did not result in the
conclusion of the Doha round of negotiations
108
Table 7-1 Summary of Key Outcomes in the Agriculture Negotiations ndash MC10
Pillars Key Outcomes
Special Safeguard
Mechanism
bull Developing countries have the right to recourse to a
special safeguard mechanism (SSM) based on the Hong
Kong Ministerial Declaration Members to further negotiate
on SSM in a dedicated special session within the
Committee of Agriculture
Export Competition25 bull Developed member countries shall eliminate all export
subsidies in their schedules with immediate effect while
developing country members shall eliminate all export
subsidies by 2018
bull Developing countries will keep the flexibility to cover
transport and marketing costs up to 2023 while least
developing countries and net food importing countries will
enjoy additional time until 2030
bull Export subsidies by members should have minimal trade
distorting effects and should not impede the exports of
other members
bull Agricultural state trading enterprises will not operate in a
manner to circumvent the disciplines set out in Article
XVII the Understanding on the Interpretation of Article
XVII and other relevant provisions of GATT 1994 the
Agreement on Agriculture and other WTO Agreements
Public Stock Holding
for Food Security26
bull Members are to further negotiate in order to come up with
a permanent solution to public stockholding for food
security purposes
bull The negotiations will take place within the special session
in the committee of agriculture
Cotton bull Duty and quota-free market access of cotton and cotton
products originating from LDCs to developing and
developed countries shall be on a voluntary basis this
takes effect from 1 January 2016 This arrangement is
subject to the preferential trade arrangement between the
LDC and developingdeveloped country
25 WTMIN (15)W47
26 WTMIN (15)W46
109
Pillars Key Outcomes
bull Members shall not provide export credits guarantees or
insurance schemes for products listed in Annex 1 of the
Agreement on Agriculture Some of the export financing
support includes direct creditsfinancing refinancing and
interest rate support export credit insurance or
reinsurance and export credit guarantees government-to-
government credit agreements where someall risks are
covered by government direct and indirect government
export credit support such as deferred invoicing and
foreign exchange risk hedging
o Export financing support shall be for a maximum of
18 months of repayment period from the start date of
the contract to the final day of payment
o All the export credits guarantees or insurance
schemes mentioned above shall be self-financing and
shall cover the long-term operating costs and losses
of programmes as illustrated in Annex I of the
Agreement on Subsidies and Countervailing
Measures item (j)27
bull Under special and differential treatment developing
country members who provide export financing support
will have a maximum of 18 months repayment period with
an implementation period starting in 2016 to 31 December
2020
bull Least developed and net food importing countries shall
have 34ndash54 months repayment terms for the acquisition of
basic foodstuff
Food Aid bull Members would ensure that disciplines agreed on would
not hamper provision of food aid in cases of emergencies
Source Nairobi Ministerial Declaration (2015)
27 The provision by governments (or special institutions controlled by governments) of export
credit guarantee or insurance programmes of insurance or guarantee programmes against
increases in the cost of exported products or of exchange risk programmes at premium rates
which are inadequate to cover the long-term operating costs and losses of the programmes
110
8 Conclusion
Reviewing the progress made in the negotiations under agriculture from the
Uruguay Round Targets under the Doha Development agenda up to the Nairobi
Ministerial Conference (MC10) it will be acknowledged that progress has been
made towards achieving the Uruguay Round Targets However this progress is
not sufficient to complete the Doha Round There is progress in achieving
reduction in export subsidies much more than even set out under the Uruguay
Round Targets However under the market access pillar and domestic support
very little progress has been made There is a lot of work that needs to be put in
place in order to carry forward the commitments under the Hong Kong
Ministerial Conference this includes
bull setting up a four-band tariff structure under the market access pillar
bull setting up three bands in the final bound total AMS and in the overall cut
in trade distorting subsidies under the domestic support pillar
111
References
WTO (1994) The Uruguay Round Agreement on Agriculture accessed at
httpswwwwtoorgenglishdocs_elegal_e14-ag_01_ehtm
WTO (2001) The Doha Ministerial Declaration WTMIN (01)DEC1
accessed at httpswwwwtoorgenglishthewto_eminist_emin01_e
mindecl_ehtm (1ndash30 November 2015)
WTO (2003) Draft Cancun Ministerial Text ndash (The Perez del Castillo Text)
accessed at httpswwwwtoorgenglishthewto_eminist_emin03_e
draft_decl_annex_ehtm(1ndash30 November 2015)
WTO (2003) Draft Cancun Ministerial Text ndash (The Derbez Text) accessed at
httpswwwwtoorgenglishthewto_eminist_emin03_edraft_decl_rev2_eht
m (1ndash30 November 2015)
WTO(2004) The July Package WTL579 accessed at
httpswwwwtoorgenglishtratop_edda_edraft_text_gc_dg_31july04_ehtm
(1ndash30 November 2015)
WTO (2005) Hong Kong Ministerial DeclarationWTMIN(05)DEC accessed
at httpswwwwtoorgenglishthewto_eminist_emin05_efinal_text_ehtm
(1ndash30 November 2015)
WTO (2013) Bali Ministerial DeclarationWTMIN(13)DEC accessed at
httpsmc9wtoorgdraft-bali-ministerial-declaration (1ndash30 November 2015)
WTO (2013) Nairobi Ministerial DeclarationWTMIN (15)W33Rev3
accessed at httpswwwwtoorgenglishthewto_eminist_emc10_e
mindecision_ehtm (20ndash24 December 2015)
112
Chapter 6
Resolving non-tariff barrier disputes
multilateral versus regional mechanisms
William Mwanza Elizabeth Nderitu Yolanda Potelwa
Ron Sandrey and Willemien Viljoen
1 Introduction
Non-tariff barriers (NTBs) and their associated problems of trade facilitation
pose a particular challenge to trade liberalisation and development in Africa
and that is especially so since in many cases the more transparent tariff costs
are reducing NTBs need priority attention These border and beyond-the-
border constraints raise the costs of doing business and contribute to the low
levels of intraregional trade Intra-African non-tariff barriers are significant
and indeed the majority of African countries would gain more from NTB
reductions than from tariff eliminations However recently there has been a
notable and disappointing increase in the use of NTBs in both Southern African
Development Community (SADC) and the East African Community (EAC)
Many of these barriers relate to Sanitary and Phytosanitary (SPS) Measures and
Technical Barriers to Trade (TBT) measures applicable to trade in agricultural
and industrial goods
There are well-established multilateral disciplines (on international standards
TBT and SPS measures) which provide conceptual frameworks for addressing
NTBs The World Trade Organisation (WTO) agreements contain disciplines
on customs and transit technical regulations and health and safety issues WTO
members have implemented the SPS and TBT Agreements while the WTO
dispute settlement process has resolved various NTB-related disputes Further-
more in the Regional Economic Communities (RECs) within eastern and
southern Africa the agreements protocols and annexes of the EAC Common
113
Market for East and Southern Africa (COMESA) and SADC all provide legal
frameworks for the elimination (or resolution) of NTBs
An effective rules-based dispensation requires the means to (a) settle disputes
and then (b) to ensure that the rules are enforced There must be effective
remedies when NTB obligations are violated in both the multilateral and
regional arenas Comparing the WTO dispute resolution mechanism with that
in the RECs shows that the WTO dispute settlement bodies have been effective
in hearing and resolving many disputes related to NTB issues while dispute
resolution in the EAC COMESA and SADC have both been problematic and
underutilised when it comes to NTBs The SADC dispute resolution
mechanism faces its own inherent difficulties (due to its new design) while the
EAC has a formal dispute settlement process in place which has not yet heard
even one NTB-related dispute Instead informal bilateral and regional
discussions are currently the preferred method for addressing NTB matters in
the EAC However this might change once the EAC Elimination of Non-Tariff
Barriers Act of 2015 comes into effect
One of the outcomes of the Uruguay Round of the General Agreement on
Tariffs and Trade (GATT) was to change its name and morph itself into the
new WTO This was more than a symbolic change as it roughly represented a
time of major shift in the issues for the new WTO to concentrate on Through
to that time the GATT focus had largely been on reducing global non-
agricultural tariffs and here its success was remarkable The very high tariffs
on these goods were largely (but not completely) reduced to minimal levels
and now the WTO positioned itself to act upon agricultural issues as discussed
in the other chapters of this book and the multiplicity of so-called new-
generation issues Among these new issues were the Singapore issues of trade
and investment competition policy transparency in government procurement
and trade facilitation Except for trade facilitation these issues proved to be lsquoa
bridge too farrsquo and were not picked up by the WTO Some aspects of these
issues and many others such as rules of origin trade and environment trade
and labour food security tariff quota issues and the WTO disputes settlement
mechanism for example remain as issues where the WTO is involved in to
varying degrees If these issues impede trade in any way without being tariffs
they are by definition non-tariff barriers to trade This timing of GATT to
WTO change was also a simultaneous to the proliferation of bilateral and
regional free trade agreements (FTAs) that now criss-cross the global scene in
114
a bewildering manner One has only to look at the negotiated schedule for the
now possibly stalled Trans Pacific Partnership (TPP) Agreement to see that
tariffs are but a minor component of a new generation FTAs as the new
generation issues take precedence To remain relevant in the modern area the
WTO not only has to move forward but it also has to act in coordinating these
FTAs this is because almost all of the FTA partners are also WTO members
and therefore regarded as family
This same situation exists in Africa While much of the talk about continental-
wide FTAs is centred on tariffs evidence tells us that other barriers including
inefficient and time-consuming border procedures for example contribute
more than tariffs to low levels of intraregional trade This proliferation of
border and beyond-the-border constraints raises the cost of doing business
including cumbersome and ineffective customs documentation and border
procedures export taxes and quantitative restrictions
The aim of this chapter is to explore the variety of options under WTO law vis-
agrave-vis regional legal instruments to address NTBs and resolve NTB disputes
particularly NTBs affecting agricultural trade Through contrasting and
comparing the WTO and REC legal instruments as they pertain to NTBs and
dispute resolution it is possible to determine whether the WTO offers a way
ahead to deal with NTBs and NTB disputes Are the WTO dispute settlement
bodies better placed to deal with agricultural NTBs and NTB disputes or does
regional dispute settlement options offer some more appropriate fora
The paper starts with a short discussion on the clarification of NTBs and here
we find that these descriptions can be very wide and all-encompassing The
next section presents a short analysis of the potential gains to the region that
implores Africa to make a determined effort to alleviate NTBs The paper then
examines some case studies on NTBs experienced by traders in SADC and the
EAC Resolution has been reached in some but not all of these cases In the
final section we address the primary purpose of this paper that of introducing
and examining the rules governing NTBs and examining the all-important
question of where the regional authorities and the WTO can coordinate and
cooperate in moving forward
115
2 Definitions and related issues
The Organisation for Economic and Cooperation Development (OECD) makes
a distinction between non-tariff measures (NTMs) and non-tariff barriers
(NTBs) NTMs are seen as covering policy measures other than import duties
which limit trade but with no implied judgement on the legitimacy of such
measures NTBs are seen as instruments that violate WTO law Operationally
lsquoin the fieldrsquo NTBs are also seen as restrictions or prohibitions or conditions or
specific market requirements which make the import or export of products
difficult andor costly The term NTB is also often used to describe the
unjustified or improper application of NTMs including SPS measures Here the
OECD definition ndashlsquowith no implied judgement on the legitimacy of such
measuresrsquondash is an interesting one which highlights the lsquogreyrsquo areas of many
trade constraints and the need for arbitration Others has indulged in the
semantics of these differences between NTBs and NTMs but we shall avoid
this discussion and state that NTBs or NTMs are basically measures other than
tariffs that are restricting or prohibiting trade As with the remainder of the
book our emphasis will be on agriculture but we also stress that these
measures can equally apply to manufactured goods or services Similarly we
shall not engage in a cataloguing exercise of NTBs and NTMs as several
institutions are already doing just that28
We must always recognise that NTMs can exist for valid reasons including
public safety consumer protection and food security and also to address
anticompetitive behaviour It is only when these measures are implemented in
such a way as to unnecessarily increase the cost of international trade inhibit
trade or are implemented in a manner which discriminates against imports
relative to domestically produced goods or applied in an illegitimate or WTO-
inconsistent manner that they potentially become genuine barriers to trade It
therefore depends on from whose perspective one is looking to determine
whether NTBs are lsquogoodrsquo or lsquobadrsquo That is why arbitration and enforcement are
needed
28 For example UNCTAD at httpntbunctadorgdocsClassification20of20NTMspdf
COMESA at httpwwwtradebarriersorgntbnon_tariff_barriers OECD at
httpswwwoecdorgtadagricultural-trade45013630pdf and APEC at
httpswwwgpogovfdsyspkgFR-1998-05-15html98-12908htm and the WTO itself at
httpi-tipwtoorggoodsdefaultaspxlanguage=en
116
In this next section we look at some case study examples to see how their
resolution process is addressed We start with NTBs in the SADC and EAC
region a comparison and contrast between the WTO dispute resolution
mechanism and regional dispute mechanisms follow and finally our particular
focus shifts to the EAC as it seems to have the most active process in
operation
3 Illustrating the importance of addressing barriers to trade in
Africa
A recent analysis using the Global Trade Analysis Project (GTAP) computer
model by Jensen and Sandrey (2015) illustrates the potential impact of NTB
reductions for African economies The analysis used the pre - released Version
92 GTAP database (based on actual trade date for 2011) and detailed and
comprehensive datasets for trade-related barriers by country Balistreri et al
have decomposed trade costs into three categories of costs that can be lowered
by (a) trade facilitation (b) non-tariff barriers and (c) the costs of barriers to
business services For non-tariff barriers the focus was on licences quotas and
bans price control measures competition restrictions and technical barriers to
trade (customs delays were not included) Technically NTBs were reduced by
50 and this was done in two separate technical ways that will not be outlined
here but can be found in Jensen and Sandrey (2015)
The results were presented in terms of final economic gains from the
simulations expressed in terms of Equivalent Variation (EV) welfare at 2025 as
measured by the amount over and above the lsquobusiness as usualrsquo situation Gains
from complete African integration in the form of tariff elimination are
substantial and spread across all African countries except Zimbabwe A very
similar pattern applies to the African-wide reduction in NTB costs Those
countries outside Africa lose as their trade became displaced through increased
intra-African trade These results support Mevel and Karingi (2012) in showing
that intra-African non-tariff constraints to trade are at least as important but
probably more important than actual tariff barriers
The results also highlight that many countries gain from their own
liberalisation as greater efficiencies flow through their own economies These
countries include Kenya and Nigeria for example South Africa is a major
117
gainer in secondary agriculture as are Namibia Morocco and Senegal while
the rest of Africa gains in both primary and secondary agriculture In many
instances the sums representing lsquoownrsquo gains are very large Here the policy
implications are again clear this is because reducing these domestic NTB are
directly under the control of the home government Coordinated efforts to
reduce NTBs are the best option but much can be done in those countries with
high barriers by unilateral actions Importantly the research found an emphasis
on NTBs in the agricultural sectors for most countries
4 Non-tariff barriers experienced by traders of SADC and EAC
For the SADC region we find that common NTBs include trade facilitation the
SPS technical barriers to trade rules of origin (RoO) and quantitative
restrictions and prohibitions Firstly trade facilitation mainly focuses on
transport clearing and forwarding customs and administrative entry that adds
extra costs was reported by Amoako-Tuffour et al (2016) who found that trade
facilitation efforts in the SADC region reduced transaction costs as the result of
reduced times of clearance and transportation cost at the borders Viljoen
(2015) argued that SPS measures were identified as the most problematic
technical NTBs thus suggesting that harmonisation of these measures would
improve intraregional trade RoO measures have also played a very important
limiting role in the SADC trade Lastly NTBs such as quantitative restrictions
and prohibitions are particularly prevalent in agricultural trade (Hartzenberg
and Kalenga 2015)
South Africa citrus exports to the EU Sanitary and phytosanitary
measures
South Africa currently exports more than one third of its total citrus exports to
the European Union (EU) market This sector is a major contributor to the
agriculture sector in terms of employment and export earnings In recent years
the sector was faced with stricter Citrus Black Spot (CBS) regulations in the
EU as it is regarded as an important phytosanitary requirement for citrus
import permission (Carstens et al 2012)) Phytosanitary is applied on the basis
of food safety plant health and environment The EU had indicated that if
South Africa exceeded more than the five allowable CBS interceptions the
country would be subjected to a ban This measure was because CBS has not
occurred in in the EU and the EU feared that the disease contained by South
Africarsquos imports would spread in the EU territory This was despite the fact
118
that Citrus Research international had conducted a number of scientific
research projects indicating no likelihood that the disease would occur in the
EU due to its colder temperature Nonetheless South African citrus producers
and exporters were required to comply with CBS regulations in order to retain
market share Both producers and exporters now have to comply with the CBS
regulation through spraying their orchards and redirected CBS-affected fruit
into a non-CBS-sensitive market into the world Although it is costly to comply
with EU market regulations there is a likelihood that it will have returns for
South African industry in future
Zimbabwersquos temporary import ban of fruit and vegetables
The Zimbabwean fresh-fruit industry has been growing at an average growth
rate of 32 over the past ten years Its local supply is now sufficient to meet
the local demand and the Zimbabwean government introduced a temporary ban
on imports of fresh fruit and vegetables in 2014 (Collen 2014) Zimbabwe
followed with other import bans and in late 2016 Minister Davies told South
African media that Zimbabwe should have followed a process under the SADC
protocol that sets out procedural requirements for trade restrictions The SADC
protocol which regulates intraregional trade allows a member country to adopt
protection measures if it demonstrates that its industries are under stress
(Mataranyika 2016)
Exporting beer to Tanzania ndash TBT matters
In 2013 the Tanzania Food and Drugs Authority (TFDA) imposed new
requirements on importing BRARUDI beer into Tanzania The TFDA
requested a new label that provided additional information about the storage
conditions for products that had not been submitted during the application for
export The failure to adhere to the Tanzanian technical regulations by
importers will mean that their products cannot enter the Tanzanian market
The restriction on the new labels was imposed on two companies based in
Kenya and Burundi Although the issue was apparently resolved in 2015 there
seems to have been delays in processing the applications for registration
(COMESA EAC and SADC Reporting Monitoring and Eliminating
Mechanism 2016)
119
Import licensing introduced by Malawi
In 2015 Malawi ratified the Control of Goods Act for both imports and exports
requiring import licencing whereby importers are required to produce an
import licence before bringing goods into the country This restricts SADC
partner imports Zambia laid a complaint through the online NTB portal
(wwwtradebarriersorg) as this new measure requires countries to obtain an
import licence under conditions and instructions provided by Malawi
South African poultry industry anti-dumping measures
The South African poultry industry has in recent years been experiencing
increased import competition The International Trade Administration
Commission (ITAC) imposed provisional anti-dumping duties on Brazilian
imports Brazil argued that these measures did not comply with substantive and
procedural requirements Accordingly it challenged South Africa in the WTO
South Africa then chose to impose import tariffs of up to 82 (up from 27)
on all poultry products originating in countries with which South Africa had no
preferential trade arrangements The tariff increase did not apply to the EU
countries due to the Trade Development and Cooperation Agreement (TDCA)
between South Africa and the EU but South African producers then made
another anti-dumping application with regard to boneless chicken imported
from EU countries This was approved with measures applied on imports from
Germany Netherlands and the United Kingdom (UK) for the protection of the
poultry industry
Kenyarsquos import ban on import of sugar from Uganda
It was reported that Kenya banned imports of sugar from Uganda based on
allegations that some unscrupulous traders were sourcing sugar cheaply from
outside the region repackaging it and re-exporting it to countries in the region
including Kenya where sugar prices have remained high (Kisero 2015)
Uganda threatened to retaliate by also banning imports of other products from
Kenya The matter was settled amicably after discussions between the
presidents of the two countries (Goin 2015)
Uganda imposes VAT on rice imports
It was reported that exports of Tanzanian rice to Uganda faced difficulties due
to the imposition of an 18 value added tax (VAT) which was not levied on
domestically produced and traded rice This VAT was also imposed in reaction
to alleged illicit trade whereby rice imported from outside the region was said
120
to be repackaged in Tanzania and exported to partner states like Uganda
(Barigaba 2015) It is clear that the imposition of VAT on imported rice and
not domestically produced rice was in contravention of the WTO national
treatment principle which is also enshrined in article 15 of the EAC Customs
Union Protocol
5 Resolving the non-tariff barriers dispute
A pertinent issue with a rules-based dispensation is that the rules are enforced
and where rules are broken there are effective remedies for the affected party
This holds true for commitments made by countries in the multilateral regional
and bilateral trade fronts These agreements govern the rules of the game and
countries have undertaken to be bound by the commitments made In the
multilateral trade arena the WTO has many agreements in place which relate
to non-tariff issues the same goes for regional and bilateral non-tariff issues
Not only do the trade agreements and protocols of the EAC COMESA and
SADC govern the use of these non-tariff measures to try and limit the potential
harmful effect of these on trade but also explicitly state that countries must
eliminate existing NTBs and refrain from using any new NTBs However the
proliferation of NTBs shows that countries are not abiding by these
commitments made Seeing that non-tariff barriers are increasingly becoming
more problematic for traders given their associated trade costs and reduction in
competitiveness the question is What remedy is available for traders and the
private sector
For countries which do not abide by their commitments dispute resolution is
available through the different dispute resolution mechanisms allowed for in
different agreements Article 1 of the WTO Dispute Settlement Understanding
states lsquoThis Understanding shall apply to disputes brought pursuant to the
consultation and dispute settlement provisions of the agreements listed in
Appendix 1hellipand the settlement of disputes between Members concerning
their rights and obligations under the provisions of the Agreement Establishing
the World Trade Organizationhelliprsquo Article 6 of the WTO Agreement on import
licensing procedures states lsquoThe settlement of disputes with respect of any
matter affecting the operation of this Agreements shall be subject to the
provisions of Articles XXII and XXIII of GATT 1994 as elaborated and
applied by the Dispute Settlement Understandingrsquo Article 23 of the EAC
Treaty states that the East African Court of Justice lsquoshall ensure the adherence
121
to law in the interpretation and application of and compliance with this Treatyrsquo
According to Article 241 of the COMESA Treaty a member state can refer the
failure to meet an obligation or an infringement of a provision in the Treaty to
the COMESA Court of Justice while the 2000 SADC Protocol on the SADC
Tribunal states in Article 14 that it has jurisdiction over disputes which relate to
lsquointerpretation and application of the Treatyhelliprsquo According to Article 33 of the
2014 SADC Protocol on the Tribunal the new SADC Tribunal will have
lsquojurisdiction on the interpretation of the SADC Treaty and Protocols relating to
disputes between Member Statesrsquo when the protocol enters into force
If countries do not abide by their commitments to address non-tariff barriers
dispute resolution is available However whether these dispute resolution
mechanisms provide effective remedies for those who incur the costs has come
into question It is business which experiences these barriers runs the added
trade cost when a barrier arises or bears the brunt if a loss is made due to
barriers and additional costs Often these costs are also shifted onto consumers
through higher consumer prices To provide effective relief for the private
sector (and consumers) dispute resolution should entail the expeditious
elimination of NTBs and appropriate remedies to the affected traders The
ability of current dispute mechanisms to provide effective relief for traders in
the case of NTBs is questionable Some of the issues which have been brought
to the fore with the available mechanisms include the locus standi of private
individuals and business in the multilateral and regional dispute settlement
arena the extra-territorial application and enforcement of domestic court
rulings the jurisdiction of domestic and regional courts and the WTO dispute
settlement body over matters and the time involved in resolving matters
through these dispute mechanisms
bull Locus standi The WTO dispute mechanism and the new SADC Tribunal
(once it comes into effect) do not afford private individuals or business the
opportunity to bring a dispute in front of the relevant fora The use of these
mechanisms is reserved for member states (ie governments) only when
commitments of the relevant treaties are breached by other member states
The EAC Court of Justice does provide standing in front of the court to
natural and legal persons and member states if an lsquoact regulation
directive decision or action of a member state or institution of the
communityrsquo is unlawful or results in the breach of a provision of the
treaty In terms of COMESA natural and legal persons and member states
122
have standing if an lsquoact regulation directive or decision of the council or
member statersquo is unlawful or results in the breach of a provision of the
treaty However Article 26 of the COMESA Treaty contains the proviso
that natural and legal persons must first exhaust local remedies in national
courts or tribunals of the relevant member state prior to the dispute being
referred to the regional court If the relevant fora for a NTB dispute is a
domestic court the individual or legal person will have to show that he has
standing before the court based on the breach of a multilateral or regional
agreement by a decision or action of the particular government This can
be exceptionally difficult if a foreign trader brings a dispute in a foreign
associated court against actions taken by the relevant foreign government
bull Jurisdiction over NTB matters The various WTO agreements and regional
treaties contain commitments about NTBs and trade-barrier-related
matters The dispute-resolution provisions give the relevant dispute
settlement body jurisdiction when there has been a breach of these
commitments under certain circumstances However domestic courts will
first have to establish jurisdiction over a matter covered in multilateral and
regional agreements Whether a particular domestic court does have
jurisdiction will depend on the incorporation requirements of international
law into the domestic law of a specific country and the jurisdictional
powers of the relevant domestic court
bull Extraterritorial application and enforceability If the domestic courts are
the relevant fora the extraterritorial application of national laws and
enforceability of remedies beyond national boundaries are always drawn
into question Furthermore the ability of regional courts to ensure
remedies as enforced by the member state which is in breach of a treaty
commitment can also be weak What is one to do if the government does
not implement a decision made by the regional court In the case of NTBs
in SADC COMESA and the EAC this is a very complex issue According
to all three these treaties member states have committed themselves to
remove existing NTBs and must refrain from using any new NTBs
However there is an ever-increasing use of measures which are NTBs
(import permits export levies seasonal bans SPS and TBT measures
etc) and which sprout from new legislation and regulations A pertinent
question if these measures are ever tested in front of a regional court is
123
How can the court ensure that a decision made will result in a change of
legislation or regulation in the offending member state
bull Time lapse Dispute settlement procedures irrespective of the fora (WTO
regional or domestic) are all time consuming especially if appeal
procedures follow the initial court proceedings This is problematic for
traders and the private sector The private sector incurs the higher cost of
doing business or the loss at the moment the barrier is in place However
the available dispute resolution mechanisms are unable to give immediate
relief for those traders As a matter of fact the traders will have to incur
further costs to bring a case in front of the relevant court with the hope of
receiving compensation after the fact
6 Rules governing non-tariff barriers
The multilateral rules of the WTO include explicit agreements to manage
NTBs with a specific focus on customs and transit technical regulations and
health and safety issues Over the years WTO member countries have
implemented the SPS and TBT agreements The principal disciplines of the
WTO which apply to NTBs are the prohibition on quantitative restrictions in
GATT Article XI the non-discrimination obligation in Articles I and III (with
the added flexibility of the general exception in Article XX) and transparency
obligations
Although there is no WTO agreement dealing explicitly with the issue of
NTBs there are numerous WTO agreements which are applicable to areas of
NTBs The following agreements aim to provide strict rules under which
policies can be implemented or utilised in order to limit the harmful effect of
specific barriers on trade
bull Articles 42 and 5 of the Agreement on Agriculture
bull Agreement on Implementation of Article VI of the General
Agreement on Tariffs and Trade 1994 (Anti-Dumping Agreement)
bull Agreement on Implementation of Article VII of the General
Agreement on Tariffs and Trade 1994 (Customs Valuation
Agreement)
bull Agreement on the Application of Sanitary and Phytosanitary
Measures
124
bull Agreement Technical Barriers to Trade
bull Agreement on Pre-Shipment Inspection
bull Agreement on Rules of Origin
bull Agreement Import Licensing Procedures
bull Agreement Subsidies and Countervailing Measures
bull Agreement on Safeguards
bull Trade Facilitation Agreement
The WTO dispute settlement process has also resulted in a number of NTBs
resolved on a multilateral level through the enforceable legal process and the
consequent development of case law At the same time regional agreements
have also now shifted their focus to addressing NTBs prevailing in regional
trade
This is also the case in the RECs in southern and eastern Africa with the trade
agreements and protocols of the EAC COMESA and SADC providing a legal
framework for the elimination of NTBs
bull SADC Article 6 of the SADC Trade Protocol requires all member
countries to adopt and implement policies to eliminate current NTBs
in terms of intra-SADC trade Member countries must also refrain
from imposing any new NTBs on intra-SADC trade Furthermore
there are numerous annexes to the Trade Protocol protocols
memoranda of understanding (MoU) and regional policies which are
applicable to the areas of NTBs These include Annexes II (Customs
Cooperation) III (Simplification and Harmonisation of Trade
Documentation and Procedures) IV (Transit) VIII (SPS) and IX
(TBTs) Protocol against Corruption Protocol on Transport
Communication and Meteorology MoU on Standardisation Quality
Assurance Accreditation and Metrology and the SADC Regional
Agricultural Policy
bull COMESA The COMESA Treaty Article 45 calls for the removal of
NTBs on trade among members Article 49 requires countries to
remove all those intra-COMESA NTBs which were in place when the
treaty entered into force and to refrain from imposing any new
restrictions and prohibitions on member countries However intra-
COMESA quantitative restrictions or prohibitions are allowed for a
125
limited time period for the protection of infant industries Further-
more various other provisions are applicable to NTBs including
articles in the COMESA Treaty pertaining to trade remedies customs
cooperation simplification and harmonisation of trade documents and
procedures standardisation and quality assurance and cooperation in
agriculture and Annex I to the Treaty pertaining to transit and
Regulations on the Application of SPS Measures
bull EAC According to Article 75(5) of the EAC Treaty and Article 13 of
the East African Customs Union Protocol countries need to remove
all intra-EAC NTBs and are required not to impose any further NTBs
on imports from other member states Article 13(2) of the Customs
Union Protocol calls for a mechanism to identify monitor and remove
NTBs within the Customs Union This has led to the development of
the Time-Bound Matrix and the East African Community Elimination
of Non-Tariff Barriers Act 2015 Articles in the EAC Treaty
regarding trade remedies cooperation in standardisation quality
assurance metrology and testing cooperation in infrastructure and
services cooperation in agriculture the EAC Standardisation Quality
Assurance Metrology and Testing Act and the Agriculture and Rural
Development Strategy are all also relevant to NTBs
7 Comparing WTO and regional dispute settlement mechanisms
A vital component of a rules-based dispensation is the means to effectively
settle disputes to ensure that the rules are enforced Rules-based inter-state
trade disputes result from measures taken under national laws The validity of
such measures are then measured against the requirements set by the applicable
international agreements This is the reason for trade disputes mainly being
about the application or interpretation of the applicable international instru-
ments If relevant national laws are absent or defective rules-based trade
becomes impossible Thus settling disputes about the application and
interpretation of legal instruments in an objective and binding manner leads to
certainty in the market and certainty for investors Legal certainty and the
predictable application of the rules are necessary This brings benefits to
intergovernmental relations and to the private sector This advances the
effectiveness and legitimacy with which government policies are implemented
126
and can lead to a general improvement in governance the ability to fight
corruption and the limitation of illegal activities
71 The choice of forum to resolve NTB disputes ndash issues to
consider
Most of the concluded Regional Trading Agreements (RTAs) concern the same
issues as various WTO agreements including trade in goods and services
sanitary and phytosanitary measures and agricultural issues The majority of
these trade agreements also contain some form of dispute settlement
mechanism These dispute settlement arrangements can broadly be
characterised as being one of the following (1) choice of forum agreements
with or without the requirements granting exclusive jurisdiction to the chosen
forum (2) exclusive jurisdiction agreements which require all RTA disputes to
be brought only in front of the RTA dispute settlement forum or (3) preference
agreements which specify a preferred forum that can be changed to an
alternative forum upon agreement among the parties The majority of RTAs
utilise the first type allowing for a choice of forum To date there has been
little clarification on the exact relationship between the RTA dispute settlement
mechanisms and the WTO Dispute Settlement Understanding (DSU) The
existence and nature of the dispute settlement mechanisms in RTAs have raised
questions regarding their consistency with the WTO DSU (Hillman 2009)
There is an ongoing debate about the relationship between the WTO and RTAs
in terms of the hierarchy of the legal systems Although Article XXIV of
GATT allows for the establishment of an RTA it is silent on the relationship
between such agreements The DSU also does not state the relationship
between the WTO and other agreements when a dispute arises (Tagle and
Claros 2016)
Due to the lack of clarification on the matter there are differing opinions based
on the general rules of interpretation of international law Opinions are divided
as to whether WTO law prevails over RTA rules when there is an inconsistency
and whether RTAs can be considered as a modification of WTO rules Some
RTAs do not provide for any rules about hierarchy between such agreements
and other international agreements signed by the member countries Dispute
settlement bodies under some RTAs however have taken a position on the
matter The Andean Community Court of Justice (ACJ) takes the view that if
127
there is a conflict between the Andean rules and WTO law the regional rules
will prevail and conflicting WTO laws become inapplicable Furthermore the
application of Andean rules is not conditional upon its compatibility with WTO
rules The Permanent Tribunal of Review (PTR) in Mercosur follows a similar
approach According to the PTR Mercosur rules prevail over public or private
international law of the member states The PTR will not accept the violation
of regional rules as justification to apply a WTO rule by a member country
However in other RTAs like the EU the question around the hierarchical
relationship is yet to be settled The European Court of Justice (ECJ) has
refused to decide whether WTO law trumps Community Law
In the US-Section 301 case the Dispute Settlement Panel (2000) stated that the
function of the DSU was to provide security predictability of the multilateral
trading system and the DSU provisions should be interpreted in light of this
objective and purpose Furthermore the DSU must aim to preserve the rights
and obligations of the member states as covered by the relevant agreements
(Agreement Establishing the WTO the Multilateral Agreements and
Plurilateral Trade Agreements) and provide clarity to existing provisions This
does not explicitly preclude the dispute settlement bodies from considering
claims under non-WTO agreements However Tagle and Claros (2016) state
that according to this interpretation a WTO claim can only be based on the
covered agreements Thus the WTO dispute settlement bodies should assess
whether any measure applied by a WTO member country complies with the
covered WTO agreements in other words they do not assess whether or not
non-WTO agreements should be applied by the dispute settlement bodies
There are numerous issues which relate to dispute resolution and the choice of
forum ndash issues which are yet to be clarified
bull The jurisdiction of WTO law over non-WTO law According to
Hillman (2009) it is firmly established that the WTO dispute
settlement bodies do not have the authority to enforce provisions of
an RTA directly However questions have been raised as to whether
RTA rules should be treated differently than other non-WTO law
because GATT explicitly recognise RTAs Some scholars have
argued that WTO law cannot stand completely separate from public
international law so it does not add to or take away from partiesrsquo
rights and obligations if RTA law is taken into account in the
resolution of a dispute by a WTO forum
128
bull Can a country stand on a RTA provision as a defence to violate WTO
law According to Pauwelyn (2001) bilateral agreements can be
invoked as a defence to set aside WTO provisions The WTO is not
lsquoan island createdrsquo and WTO rules can be applied differently to
different WTO countries depending on non-WTO rules they have
accepted due to a lack of a centralised legislator in international law
However Cho (2003) disagrees with Pauwelyn According to Cho the
WTO must maintain its autonomy by upholding its legal integrity
what is inconsistent with WTO rules cannot be WTO-legal through
any mechanism like unilateral modifications
bull Double breaches and double handling Can the breach of both an
RTA and WTO obligation be handled in parallel by different dispute
settlement fora to enforce an identical or similar RTA and WTO
obligation In the WTO Appellate Body decision in the Mexico Soft
Drinks dispute Mexico argued that the WTO dispute settlement
bodies did not have inherent jurisdiction to exercise their substantive
jurisdiction of the case which Mexico saw as a purely North
American Free Trade Agreement (NAFTA) dispute However both
the Panel and the Appellate Body rejected the argument and were of
the view that various provisions of the WTO DSU required the WTO
adjudicatory bodies to exercise substantive jurisdiction over the
dispute unless there is a legal impediment to stop them from doing so
bull Exclusive forum clause Can the WTO dispute settlement bodies
decline jurisdiction if both parties to a dispute have agreed to a clause
in an RTA which gives exclusive jurisdiction of a dispute to the
dispute settlement mechanism of an RTA
bull Res Judicata If this doctrine is included in an RTA it raises the issue
of whether a WTO dispute is an appeal or relitigation if it has already
been heard by a regional forum If parties in an RTA agree to this
doctrine and a decision by a regional forum is conclusive and places
a bar on subsequent action on the same claim the parties effectively
strip the WTO of some of its jurisdiction Will countries be seen as
violating the terms of the RTA if a case is brought to the WTO
129
Box 1 illustrates two different approaches to resolving disputes which have
been followed by WTO member countries which are also party to a regional
arrangement These disputes relate to sanitary and phytosanitary measures
which have been imposed on imports In both these instances the parties are
signatories to the WTO Agreement on Sanitary and Phytosanitary Measures
(SPS Agreement) the International Plant Protection Convention (IPPC) and the
World Organisation for Animal Health (OIE) Furthermore South Africa and
the EU are parties to the TDCA (as well as the recently concluded Economic
Partnership Agreement ndash EPA) while South Africa and Zambia are members of
SADC These regional arrangements also have specific provisions regarding
SPS matters as well as regional dispute and conflict resolution provisions
According to Tagle and Claros (2016) the factors to consider in the choice of a
dispute settlement forum are
bull WTO law governs the inter-state relationship between WTO member
countries only in their capacity as WTO member countries
bull WTO dispute settlement bodies must ensure the application of WTO
rules not the rules of regional trade arrangements
bull WTO dispute settlement bodies do not have the authority to enforce
the obligations countries have made within a regional agreement
bull the institutions of the WTO should not intervene when regional rules
are disobeyed unless there is a simultaneous infringement of WTO
law
130
Box 1 Different approaches to dispute resolution Citrus Black Spot and American Foulbrood Disease Since 2010 there has been an ongoing dispute between South Africa and the EU regarding citrus fruit exports from the former to the latter At the centre of the matter is the lack of scientific consensus and definitive scientific evidence that Citrus Black Spot (CBS) on the peel of South African citrus fruit exports poses a risk to the orchards of the citrus-producing regions of the EU At the same time South Africa is also involved in a dispute with Zambia regarding similar SPS-related matters This dispute relates to organic honey exports from Zambia to South Africa which are currently being denied market access due to the fact that the honey is not irradiated as required in terms of the South African honey regulations (Regulation Number 835) Although these cases are based on the same allegations divergent approaches are currently being utilised to resolve the disputes a) South Africa and the EU in the case of CBS In February 2013 the IPPC Secretariat hosted formal consultations between South African and the EU under the IPPC Dispute Settlement System as an attempt to resolve the ongoing battle between the two countries on the CBS issue However the proceedings were suspended after the parties agreed to negotiate on further steps to be taken after the results of ongoing scientific analysis have been made known Until the end of 2013 when CBS was found in certain consignments of exports the EU allowed the import of citrus fruits produced in areas categorised as CBS-free or from production sites where no CBS-infected fruit were detected in official inspections The detection of CBS however led to a temporary ban being imposed which was lifted in May 2014 under the conditions that citrus fruits could only be exported to the EU market when stricter plant safety rules were adhered to These rules were notified to the WTO Committee on SPS Measures in July 2014 as emergency measures to be taken against imports from areas not recognised as CBS-free in South Africa and include records of chemical treatments to be kept registering packing houses inspections of orchards and extensive sampling South Africa and the EU are signatories to the WTO Agreement on Sanitary and Phytosanitary Measures (SPS Agreement) the IPPC and the OIE Due to the inability of bilateral talks between South Africa and the EU to resolve the matter South Africa opted to follow the multilateral route to attain a resolution of the dispute South Africa raised its concerns at the SPS Committee of the WTO and requested the IPPC to establish an expert committee to resolve the two opposing views on the matter According to South Africa the stringent import conditions and the threat of reimposing the previous ban are unnecessary and without technical justification or scientific merit South Africa has also posed an alternative solution to the EU in the form of market division In terms of its request the EU can be divided with only the southern citrus-producing region imposing stricter import regulations This should eliminate any concerns regarding the imported fruit contaminating the orchards in the citrus-producing region of the EU However the EU has yet to respond to this request and the matter is now in the hands of the WTO and IPPC to find an amicable solution
131
b) South Africa and Zambia in the case of American foulbrood (AFB) South Africa allows only imports of honey from Zambia that has been irradiated this is due to historical evidence of AFB However the Zambian industry has repeatedly asked for an exception to the irradiation rule due to an analysis undertaken by the South African National Department of Agriculture (NDA) on honey samples from across Zambia revealing that no AFB is currently found in Zambia The problem with irradiating the honey is that it loses its status as organic honey once it has been irradiated and no Zambian non-irradiated honey is currently allowed to enter South Africarsquos borders Zambia is well-known for its honey production of which the majority is certified organic due to the climatic conditions and the traditional processing and harvesting techniques employed by the beekeepers In order to allow organic imports into South Africa it was indicated that draft requirements for imports of non-irradiated honey had been internally consulted with the relevant role players These requirements have been drafted by the National Plant Protection Organisation of South Africa which has the responsibility for setting import measures for honey even though honey falls within the ambit of OIE rather than the IPPCA final draft was expected by the end of November 2013 However these regulations are currently still in draft form and Zambian organic honey is still being denied access South Africa and Zambia are signatories to the WTO SPS Agreement the IPPC and the OIE Zambia has opted to follow the route of continued bilateral consultations through the tripartite and SADC NTB resolution mechanisms to resolve the dispute with South Africa However it is unclear whether these political consultations will actually result in an amicable resolution in the near future The honey issue has been referred to the subcommittee where it has been stalled for the last year If Zambia continues to choose this route it seems that a resolution is still a long time away and with the suspension of the SADC Tribunal finality in the matter might never be reached However Zambia is not limited to taking the route of bilateral consultations and can still decide to follow the same multilateral route as South Africa did in the case of CBS Seeing that both cases are based on a similar violation of the provisions of the WTO Agreement on SPS Measures Zambia can follow suit in an attempt to pressure South Africa into finding a timeous solution in the matter However the lack of financial organisational and human capacity the time-consuming process of the WTO dispute settlement mechanisms and the complexity of the WTO rules are often cited as the main reasons why developing and least developed countries do not utilise the multilateral dispute settlement mechanisms put in place Irrespective of the reasons it seems that Zambia remains unwilling to use multilateral measures to address South Africarsquos use of SPS measures as a barrier to trade and an instrument to protect domestic industries This can turn out to be a costly decision
132
72 Case study Comparing the EACrsquos dispute resolution
processes and their viability with those of the WTO system in
case of NTBs
The WTO dispute settlement systems provides an independent and rules-based
formal dispute settlement mechanism Any dispute arising under the WTO
agreements must be resolved in accordance with the DSU In accordance with
the DSU when a dispute occurs the parties must first engage in consultations
before a request can be made for the Dispute Settlement Body (DSB) to
establish an ad hoc panel to hear the dispute Furthermore parties can make an
appeal of any decision to the Appellate Body If the respondent member
country does not comply with the recommendations made in the final adopted
report within the required reasonable time period and if negotiations for
compensation are fruitless the complainant can request authorisation to impose
retaliatory measures by suspending concessions or obligations
The majority of the disputes which have been brought before the WTO DSB
has covered areas and agreements which fall under non-tariff measures The
majority of these disputes are about trade remedies in general and anti-
dumping in particular Up to date 513 disputes have been brought to the DSB
of which 33 relate to the Agreement on Agriculture (Articles 42 and 5) 114 to
the Anti-Dumping Agreement 17 to customs valuation 46 to import licensing
5 to pre-shipment inspections 7 to rules of origin 46 to safeguards 44 to
sanitary and phytosanitary measures 112 to the Agreement on Subsidies and
Countervailing Measures and 52 to TBTs (tralac calculations based on WTO
DSB statistics)
Comparing the United Nations Country Classification (United Nations
Statistics Division 2016) with the WTO information about disputes by country
and territory (WTO 2016) shows that there is a relative balance between
developed and developing countries as complainants and respondent
economies in total but the concentration varies from dispute to dispute
For instance in the case of the disputes pertaining to Articles 45 and 5 of the
Agreement on Agriculture there are 26 developed countries as complainants
while respondents are mostly developing economics (in 22 of the 33 disputes)
In the case of the Anti-Dumping Agreement of the 114 disputes the majority
133
of the complainants were developing countries and the respondents mostly
developed countries Of the 44 cases citing the Anti-Dumping Agreement with
developing countries as respondents 8 involved anti-dumping measures taken
by South Africa (5) Egypt (2) and Morocco (1) The developed economies
which are mostly party to a dispute include the United States (US) the EU
Canada and Australia while active developing economies include Brazil
China India Indonesia and Argentina Of the African economies South Africa
and Egypt are the only countries which can be seen as being actively involved
in the WTO dispute settlement process However these are also far less than
the average usage by developing and emerging economies in Latin America
and Asia
The EAC Treaty is notified as a regional trade agreement to the WTO under
Article XXIV of GATT It is strictly speaking not separate from the WTO
system but an integral part of it It governs its own processes though these are
supposed to be compatible with WTO disciplines The East African Court of
Justice (EACJ) is the judicial body of the Community Furthermore customs
union and common market frameworks also provide for alternative dispute
resolution mechanisms including a Committee on Trade Remedies To date no
dispute relating to NTM provisions has been heard by the EACJ and the
alternative dispute resolution mechanism in the EAC has also not been greatly
used for resolving NTB matters The resolution of NTBs has thus far mainly
been done on a bilateral or regional basis through National Monitoring
Committees and the EAC Time-bound Matrix However this might soon
change after the EAC Elimination of Non-Tariff Barriers Act 2015 comes into
effect
There exist a number of avenues for dispute resolution in the EAC
a) The East African Court of Justice
First Article 23 of the EAC Treaty establishes the EACJ as the judicial
body of the community responsible for ensuring the adherence to law in
the interpretation and application of and compliance with the treaty
b) Customs Union and Common Market frameworks
Secondary legal instruments of the EAC Treaty provide for alternative
dispute resolution mechanisms from the EACJ ndash specific to particular
stages in the EACrsquos integration process
134
In Article 13 of the Protocol establishing the EAC Customs Union partner
states bound themselves to remove all existing NTBs and to refrain from
introducing new ones Article 24 (1) of the protocol then establishes an East
African Community Committee on Trade Remedies to lsquohandle any matters [in
the implementation of the EAC Customs Union] pertaining torsquo rules of origin
anti-dumping measures subsidiescountervailing measures and safeguard
measures as provided for in the respective annexes to the protocol governing
these areas and any matter referred to the committee by the council These are
areas from which non-tariff barriers to trade can emanate if respective
measures are not optimally implemented
Article 24 (1)(e) particularly provides that the committee is responsible for
dispute settlement provided for under EAC Customs Union (Dispute Settle-
ment Mechanism) Regulations specified in Annex IX to the protocol
With respect to the EAC Common Market the Protocol on the Establishment
of the East African Community Common Market (lsquothe Common Market
Protocolrsquo) provides in Article 54 (2)(a) that partner states guarantee that where
any person whose rights and liberties as recognised by the protocol are
infringed such a person shall have the right to redress in accordance with the
partner statersquos constitutions national laws and administrative procedures and
with provisions of the protocol Article 54(2 (b) further provides that lsquothe
competent judicial administrative or legislative authority or any other
competent authority [at the national level] shall rule on the rights of the person
who is seeking redressrsquo
To date resolution of NTBs has been handled bilaterally or on a regional basis
when the respective National Monitoring Committees (NMC) of the five
partner states meet at the regional NMCs forum They then update a lsquotime-
bound matrixrsquo a tool that shows progress made on elimination of reported
NTBs There also exists the tripartite online reporting system for NTBs Both
these tools strictly speaking were for monitoring the resolution of NTBs The
actual resolution has been taking place following bilateral meetings or follow-
up with focal points after NTBs were reported at the regional forum or on the
tripartite online system In February 2015 the East African Legislative
Assembly (EALA) passed a legislation providing a means for aggrieved parties
to litigate in issues relating to non-tariff barriers to trade as they are identified
by the monitoring mechanisms The law is known as the East African
135
Community Elimination of Non-Tariff Barriers Act 2015 To date the United
Republic of Tanzania and the Republic of Kenya have assented to the act
721 Compatibility of the alternative dispute resolution
mechanisms in the EAC
The issue of whether the dispute resolution mechanisms in the Customs Union
and Common Market Protocols of the EAC oust the jurisdiction of the EACJ
has been considered by the court in the case of East African Law Society V
Secretary General of the EAC The court ruled that the respective protocols
became an integral part of the treaty once they were enacted under Article
151(1) of the treaty The court has jurisdiction as the judicial organ of the EAC
responsible for interpretation and application of the treaty including its annexes
and protocols It held that articles 75 and 76 of the treaty provide for the
establishment of a customs union and a common market and lsquoinstitutions that
the Council may deem necessary for administration of the customs union and
common marketrsquo and that these institutions are not at the exclusion of the
court With regard to the Committee on Trade Remedies established under
Article 24 of the Customs Union Protocol the court noted that it represents a
pragmatic approach to the resolution of disputes as the customs union is being
administered as opposed to the long and arduous litigation process of the
courts Importantly it held that it does not take away the interpretative
jurisdiction of the court It held the same view with regard to the national
dispute resolution process provided for in Articles 54(1) and (2) of the
Common Market Protocol and hence found that the court itself remains the
final authoritative forum in matters of interpretation and application of the
treaty
722 Utilisation of the EAC dispute resolution frameworks in non-
tariff barrier matters
There has thus far not been a high reported utilisation of the alternative dispute
resolution mechanisms in the EAC particularly with respect to NTB matters
The closest that the EACJ came to ruling on an NTB issue was in the case of
Modern Holdings (EA) Limited v Kenya Ports Authority This was a customs
and border procedures issue whereby the applicant challenged in the court the
136
Kenya Ports Authorityrsquos (KPA) failure to clear its consignment of fruit juice
and mineral water in time leading to the expiry of the goods and loss of the
consignment The court did not proceed to make a determination on the matter
at hand but threw out the application because it held that it is only partner states
or institutions of the EAC that can stand as defendants in the court and not a
natural or legal person as was the case with KPA
There has not been any record of utilisation of the panel process provided for
under the Committee on Trade Remedies while the national court deter-
minations of Common Market provisions are an area that requires further
research
723 Does the WTO offer a better dispute resolution option than
EAC processes
There exists some possibility for disputes encountered in the course of trade in
the EAC to be settled at the WTO However this is subject to a number of
considerations
First the nature of the issue at hand will determine which WTO provisions
would apply in the resolution of the dispute For example the rules of origin
provisions that could have applied in the matters concerning the importation of
Ugandan sugar or Tanzanian rice are those of the EAC and not of the WTO
Hence the matter could have been properly dealt with within the EAC dispute
resolution processes On the other hand the WTO rules on national treatment
as also provided for in the Customs Union Protocol would have applied in the
matter of Tanzanian rice and so the matter could have been resolved either
within the WTO or within the EACrsquos processes It is important to note that
there are only certain sections of the EAC Treaty that explicitly provide that
WTO provisions apply Apart from the national treatment provision the
Customs Union Protocol provides that WTO rules apply in some instances ndash
such as investigations involving third countriesndash in the areas of anti-dumping
and subsidies and countervailing measures Dispute settlement of these matters
is the purview of the Committee on Trade Remedies with the WTO Dispute
Settlement Mechanism provided for disputes concerning third countries
137
Second there are temporal considerations As acknowledged by the EAC Court
in East African Law Society V Secretary General of the EAC (2011) its
processes can be long and arduous Issues concerning non-tariff barriers
normally require timeous resolution Each step in the panel processes provided
for in the Committee on Trade Remedies and the WTO Dispute Settlement
Mechanism is time-bound and so increasing the likelihood for resolution of
disputes within a definite period of time
Third there are varying costs ndash monetary and systemic ndash which may tilt in
favour of utilising the EAC processes For example it may be costlier to take a
matter to Geneva for resolution than to resolve it within the region Also the
EAC is premised on its partner states acting jointly to effectively implement
the treaty and its associated legal instruments There are costs involved as to
the legitimacy and effectiveness of the EAC dispute resolution system
according to which a matter is taken for resolution at the WTO where the
concerned provisions could have also been interpreted and applied within the
regionrsquos system
Fourth is the issue of who can bring a matter for resolution The WTO Dispute
Settlement and the Committee on Trade Remedies processes can only be
brought by a partner state against another partner state regarding non-tariff
barriers encountered in the export of products to the allegedly offending party
The EACJ process however provides for references to be brought by natural
and legal persons Such references can be not only against another partner
state but also against a natural or legal personrsquos own government This can be
for example in the case of an importer experiencing non-tariff barriers in their
own country of residence incorporation or establishment Although the court
process has been noted to be potentially long and involving it means that
persons or companies do not have to lobby their governments to open dispute
settlement proceedings against another partner state but can go directly to the
court to seek redress They may also proceed along this route where efforts to
engage their own governments to remove non-tariff barriers either directly or
through national court processes do not yield results
Based on the foregoing it can be seen that the WTO Dispute Settlement
Mechanism is limited in its ability to resolve non-tariff barrier issues within the
EAC Treaty framework Although it can represent a quicker route of resolving
a dispute it is limited due to the WTO provisions that apply within the EAC
138
framework monetary and systemic costs and the ability of private parties to
directly seek redress For the EAC it would be important to ensure that the
dispute settlement framework is functioning optimally and ensuring the quick
and efficient resolution of disputes over non-tariff barriers
8 Conclusion
The debate surrounding the importance of eliminating NTBs within Africa is
not new but it is critical for African integration and trade liberalisation efforts
This is especially the case in terms of agricultural product trade This is not just
because it is the product with the highest incidence of NTBs being utilised but
also because it forms a major part of economic growth export earnings
employment and development in the majority of African economies It is also
troubling that the incidence of NTBs in areas which have been marked for
industrial development (including agro-processing)is also on the rise In order
to address these challenges effective legal frameworks should be in place at
national regional and multilateral levels while countries must commit
themselves to particular undertakings Ultimately there should be effective
remedies when NTB-related obligations are violated
However the jury is still out on whether the best forums to address the
violation of NTB obligations are regional dispute settlement bodies or those of
the WTO There are many scholars who offer different opinions on the
effectiveness of regional dispute settlement arrangements vis-agrave-vis the WTO as
well as what the interaction should be among the various available fora What
is evident from the chapter is that private firms and traders suffer as a result of
NTBs while the consequences are passed on to consumers However the
international agreements regulating this aspect are concluded between states
and the regional institutions which have been put in place and are fora for state
officials Private-sector stakeholders do not have standing before these bodies
this translates into the absence of effective dispute settlement mechanisms The
success of the mechanism is contingent on the capacity of individual
governments to implement their obligations and on advocacy programmes to
inform the private sector We are left with a conundrum ndash current multilateral
regional and national dispute settlement mechanisms fall short to resolve NTB
disputes expeditiously and in a manner beneficial for traders What is needed to
ensure the quick efficient and cost-effective resolution of NTB disputes
139
References
Amoako-Tuffour J Balchin N Calabrese L and Mendez-Par M 2016
African transformation forum 2016 trade facilitation and economic
transformation in Africa httpsetodiorgwp-contentuploads201603SET-
ACET-ATF-Trade-Facilitation-Paperpdf
Balistreri EJ Tarr DG and Yonazawa H 2014a Reducing trade costs in
east Africa deep regional integration and multilateral action World Bank
Policy Research Paper 7049 Washington DC World Bank September
Balistreri E J Tarr DG and Yonazawa H 2014b Deep integration in
eastern and southern Africa what are the stakes Unpublished World Bank
Paper Washington DC World Bank October
Barigaba J 2015 Exit Kenyarsquos sugar enter Tanzania rice Kampalarsquos new
trade war httpwwwtheeastafricancokenewsExit-Kenya-sugar-enter-
Tanzania-rice-Kampala-new-trade-war-25582851112-ky02wu-indexhtml
Carstens E Le Roux HF Holtzhausen MA Van Rooyen L Coetzee J
Wentzel R Laubscher W Dawood Z Venter E Schuttle GC Fourie
PH and Hattingh V 2012 Citrus Black Spot is absent in the Western Cape
Northern Cape and Free State Province Working Paper Stellenbosch
University of Stellenbosch
Collen C 2014 Zimbabwe in produce import ban
wwwfruitnetcomeurofruitarticle161148zimbabwe-in-produce-import-ban
COMESA EAC and SADC 2016 Non-tariff barriers Reporting Monitoring
and Eliminating Mechanism Resolved complaints
httpwwwtradebarriersorgresolved_complaintssearchtanzania
Erasmus G 2014 Trade remedies and dispute settlement under the TDCA
South African anti-dumping duties on chicken imported from the EU
httpwwwtralacorgdiscussionsarticle5825-trade-remedies-and-dispute
Erasmus G 2016 How do the southern African RECs compare as rules-based
arrangements tralac Trade Brief S16TB142016 Stellenbosch tralac
140
Goin J 2015 My sugar deal is sweet President Kenyatta tells raila
httpallafricacomstories201508130358html
Hartzenberg T and Kalenga P 2015 National policies and regional
integration in the in the South African Development Community WIDER
Working Paper 2015056 httpswiderunuedusitesdefaultfilesWP2015-
056-pdf
Hillman J 2009 Conflicts between dispute settlement mechanisms in regional
trade agreements and the WTO ndash what should WTO do Cornell International
Law Journal 42(2) Article 1 194-208
Jensen HG Sandrey R 2015 The Continental Free Trade Area ndash a GTAP
assessment tralac E-Book httpwwwtralacorgpublicationsbookshtml17
Apr 2015
Kee HL Nicita A and Olarreaga M 2009 Estimating trade restrictiveness
indices Economic Journal 119 172-199
Kisero J 2015 Made in Brazil Packed in Kenya How tariff windows feed
Kenyarsquos sugar cartels [Online] httpwwwnationcokelifestyleDN2THE-
UNTOLD-STORY-Hands-in-the-sugar-jar-9578602853564-4kbi9yz-
indexhtml
Mataranyika M 2016 SA Zim import trade impasse City Press 18 August
httpcity-pressnews24comBusinesssa-zim-import-trade-impasse-20160818
Mevel S and Karingi S 2012 Deepening regional integration in Africa A
computable general equilibrium assessment of the establishment of a
continental free trade area followed by a continental customs union Paper
presented at the 7th African Economic Conference Kigali Rwanda 30
October ndash 2 November
Pauwelyn J 2001 The role of Public International Law in the WTO how far
can we go American Journal of International Law 95 (2001) 535-578
Staiger RW 2015 Non-tariff measures and the WTO
httpwwwdartmouthedu~rstaigerNTMs_WTO_123115pdf
141
Tagle YR and Claros R 2016 The law of regional trade agreements in the
WTO dispute settlement system lessons from the Peru-Agricultural Products
case Working Paper 042016
httpspapersssrncomsol3paperscfmabstract_id=2794836
United Nations Statistics Division 2016 Composition of macro geographical
(continental) regions geographical sub-regions and selected economic and
other groupings
httpunstatsunorgunsdmethodsm49m49reginhtmdeveloped
Viljoen W 2015 SADC Regional Agricultural Policy addressing non-tariff
barriers on agricultural trade httpwwwtralacorgdiscussionsarticle7073-
sadc-regional-agricultural-policy-addressing-non-tariff-barriers-on-
agricultural-tradehtml
WTO 2016 Disputes by agreement Geneva World Trade Organisation
httpswwwwtoorgenglishtratop_edispu_edispu_agreements_index_ehtm
id=A1
Legal Instruments
Protocol on the Establishment of the East African Customs Union
httpwwweacintcustomsindexphpoption=com_contentampview=articleampid=
2customs-unE280A6
Protocol on the Establishment of the East African Community Common
Market httpwwweacintcommonmarket
Protocol on Trade in the Southern African Development Community (SADC)
Region 1352928370Protocol_on_Trade1996pdf
Treaty for the Establishment of the East African Community
httpwwweacinttreaty
142
Cases
East African Law Society v Secretary General of the EAC Ref No 1 of 2011
Judgment of Court of First Instance 14 February 2013 httpeacjorgwp-
contentuploads201309FI_EastAfricanLawSociety_v_EastAfricanCommunit
ypdf
Mexico mdash Tax Measures on Soft Drinks and Other Beverages 2006 WTO
Appellate Body Report
httpswwwwtoorgenglishtratop_edispu_ecases_eds308_ehtm
Modern Holdings (EA) Limited v Kenya Ports Authority Reference No 1 of
2008 Judgment of the First Instance Division of the EACJ 12 February 2009
httpeacjorgcases=modern-holdings-e-a-limited-vs-kenya-ports-authority
United States mdash Sections 301ndash310 of the Trade Act 1974 2000 WTO Panel
Report as adopted by the Appellate Body
httpswwwwtoorgenglishtratop_edispu_ecases_eds152_ehtm
143
Chapter 7
Where do the Singapore and related issues fit
into the WTO
Ron Sandrey
1 Introduction
Most of what this book has examined to date has been focussing on the
traditional core values of the WTO and their relationships to African agri-
culture It is the intention of this chapter to expand upon these core issues and
look at some of the new and emerging trade issues and see where the WTO fits
into this landscape and how they may impact on Africa
Much of the attention is devoted to looking at the so-called Singapore issues of
trade and investment competition policy transparency in government procure-
ment and trade facilitation We find that while the WTO now has a minimal
interest in the first three of these important issues it has a strong presence in
trade facilitation Consequently we examine trade facilitation in more detail
and see that improvement here is certainly needed in Africa but caution that
there are a lot of commentators questioning whether the reality of the
programme will match the rhetoric that has been associated with it
Other trade related issues examined are rules of origin trade and environment
trade and labour food security tariff quota issues and the WTO disputes
settlement mechanism Again while the WTO is involved to varying degrees in
these issues there are few cases where direct gains to African agriculture can be
foreseen in the near future
144
Background
Most of this book has focussed on what the WTO may do for African
agriculture in terms of how exports may benefit The focus is on the triple areas
of reducing harmful agricultural product supports enhancing market access
through lowering import tariffs in key markets and countering export subsidies
The latter issue has become much less of a focal point as these subsidies have
been or are being phased out Similarly for the first issue of domestic supports
we found in earlier chapters that they are generally but not always reducing in
the developed economies but at the same time increasing in some developing
economies such as China This leaves market access as epitomised by import
tariffs and here we found that as a sweeping generalisation reducing these
tariffs along with current DDA structures similarly may do little for African
agriculture In a separate chapter we have extended the general issue of market
access to examine non-tariff measuresbarriers (NTMs or NTBs) that actually
or perceivably stand in the way of African agricultural exports We find that
these may indeed be more important than tariff barriers and perhaps the WTO
offers some way forward in helping to mitigate these costs to exporters
The WTO is however about more than just these access-related issues and the
objective for this current work is to explore these other issues and examine
where the WTO may advance the interests of African agricultural trade
Paramount among these issues are the so-called Singapore issues The World
Trade Organisation (WTO) members decided at the 1996 Singapore Ministerial
Conference to set up three new working groups on trade and investment
competition policy and transparency in government procurement They also
instructed the WTO Council for Trade in Goods to look at possible ways of
simplifying trade procedures or as it became known lsquotrade facilitationrsquo These
four issues collectively became known as the Singapore Issues They were
subsequently included on the Doha Development Agenda (DDA) with
negotiations to start after the 2003 Cancun Ministerial Conference lsquoon the
basis of a decision to be taken by explicit consensus at that session on
modalities of negotiationsrsquo
In addition there are other trade issues that could be directly or at least
peripherally associated with the WTO These includes trade and the
environment trade and labour food security and many non-tariff measures
(with the latter mainly being covered in a separate chapter) A particular NTM
145
are the ubiquitous rules of origin (ROO) and here we will examine how the
ROO is acting as an increasingly important barrier to trade as global tariffs
reduce and these other issues become more transparent Several of these issues
tend to mean different things to different countries and therefore perhaps
become more mired as a result An example of this may be food security an
issue that means much more to Africa than perhaps the Island city-state of
Singapore with virtually no agricultural resources and a reliance upon its
prosperity to purchase agricultural products on the global market
The objective for this paper is to examine these related issues with a special
emphasis on how the WTO may benefit African agriculture For the Singapore
issues in particular it borrows heavily from the recent publication by Sandrey
2015a but it adds an emphasis on agriculture and introduces some of the other
related issues In general we are finding that developed and even emerging
countries are less interested in areas such as subsidies and market access that
has the core of WTOs activity They are moving on issues such as investments
competition polices government procurement migration intellectual property
financial services and taxation and pharmaceuticals While African economies
have less interest in these new issues it behoves us to examine at least some of
them here
Related to these new issues is an innovative approach from Hufbauer and
Schott 2013 They evaluated the potential gains to the world economy
focussing on what they believed were seven agreements that could be ratified
at that time through the DDA These seven were trade facilitation international
trade in services the digital economy duty-free quota-free (DFQF) market
access for developing countries agricultural subsidies food export controls and
gains from environmental goods and services The total global gains to GDP
were in excess of two trillion US dollars ($2212 billion) A staggering sum
Directly relevant to this paper are the trade facilitation gains of nearly one
trillion dollars and the gains from DFQF controls on agricultural subsidies (as
represented by export subsidies)and food export controls The gains from the
latter three were inconsequential in the overall total Ignoring the realities of
achieving this outcome the salient point from their analysis is that global gains
from DFQF access and controls on agricultural export subsidies are almost
negligible Interestingly their gains from trade facilitation were almost evenly
split between developed and developing countries with Sub-Sahara Africa
gaining very little
146
2 The so-called Singapore issue29
The WTO members decided at the 1996 Singapore Ministerial Conference to
set up three new working groups on trade and investment competition policy
and transparency in government procurement They also instructed the WTO
Council for Trade in Goods to look at possible ways of simplifying trade
procedures or as it became known as trade facilitation These four issues
collectively became known as the Singapore Issues They were subsequently
included on the Doha Development Agenda (DDA) with negotiations to start
after the 2003 Cancun Ministerial Conference lsquoon the basis of a decision to be
taken by explicit consensus at that session on modalities of negotiationsrsquo
The basic problem for the WTO was that these negotiations would only
proceed following a clear consensus decision to do so and this was especially
crucial for competition policies and investment as the WTO already had an
Agreement on Government Procurement At the time of the Cancun WTO
meetings Sandrey 2006 reports that these Singapore issues had become a
priority for the European Union (EU) in particular and were pushed ahead
until the final days of those meetings Developing countries had consistently
opposed their inclusion in the negotiating agenda arguing that the subject and
scope of these issues were unclear and that they lacked the technical capacity to
implement them and therefore it was unrealistic to pursue them without
knowing what compensatory gains they would get in other negotiating areas
Investment competition policy and government procurement were seen as
areas where the developed countries were imposing their standards upon
developing countries in a one-way manner Tensions became based around the
degree to which the WTO should intrude into domestic policy space rather than
remain essentially a trade organisation Were Singapore Issues a bridge too far
Yes they were and the outcome from Cancun was that talks collapsed with the
three Singapore Issues of investment competition policies and procurement
shouldering a significant and possibly unfair portion of the blame Trade
facilitation did however find common ground Developing members saw trade
facilitation as an opportunity to leverage aid for a chronic internal domestic
problem and developed members saw reduced transaction costs as enabling
29 This section draws heavily from and expands Sandrey 2015a
147
their exporters to gain advantage in these markets Consequently of the
Singapore Issues trade facilitation alone has specifically stayed with the DDA
and this was reinforced by WTO Members who agreed on 1 August 2004 (the
so-called July Framework) to proceed with negotiations on only one Singapore
Issue trade facilitation The other three were dropped from the DDA but for
the purpose of this paper we can still include them as DDA issues
Nearly twenty years after the 1996 Singapore Ministerial several salient facts
relating to the Singapore Issues are still relevant The first is that while the
WTO remains essentially moribund arguably the only real outcome from the
WTO since the Uruguay Round outcome was the Agreement on Trade
Facilitation (TF) that emerged from the Ninth Ministerial Conference held in
Bali Indonesia from 3 to 7 December 2013 For the first three issues of trade
and investment trade and competition policy and government procurement the
battle ground has moved from the WTO to the various free trade agreement
(FTA) negotiation tables around the world This in itself highlights how the
focus has moved from the WTO per se to these bilateral and regional
negotiating tables Importantly Africa is evaluating its regional policies in the
context of both the Tripartite Free Trade Area (TFTA) for the whole of eastern
and southern Africa and the Continental Free Trade Area (CFTA) and these
issues need to be seen within the nexus of the WTO the mega-regionals and
the African TFTA and CFTA
In some respects for Africa the international conflict of Cancun continues The
developing countries still see these issues through the prism of exporting
countries that are trying to force open markets of the poorer importing
countries thus attempting to ensure economic development in their nations at
the expense of the developing countriesrsquo policy space The extent to which
lsquoex-Singapore issuesrsquo are being introduced into the African and other regions
through bilateral and regional agreements negotiated with the EU and the US
as the dominant economies becomes an important one and in general the EU
seems to be pursuing them with some vigour and rigour while the US is
adopting a more benign approach
The old General Agreement on Tariffs and Trade (GATT) the precursor to the
WTO was hugely successful in bringing industrial tariffs down dramatically
since World War Two It had not however achieved the same success in
bringing agricultural tariffs and supports down and many felt that a
148
concentration on these core areas was preferable to attempting to embrace too
many new issues that while important are not lsquofrontlinersquo issues Conversely
behind-the-border issues are becoming more important as tariffs and visible
protection measures are reducing and in that respect perhaps the GATTWTO
had become a victim of its own success as these so-called lsquonot frontlinersquo issues
were becoming more visible and therefore increasingly relevant
Meanwhile investment and competition policy have always been an indirect
component of the GATT and WTO The General Agreement on Trade in
Services (GATS) contain rules on monopolies and exclusive service suppliers
and the principles have been elaborated considerably in the rules and
commitments on telecommunications for example The agreements on
intellectual property and services also both recognise governmentsrsquo rights to
act against anti-competitive practices and their rights to work together to limit
these practices And the WTO already have a limited Agreement on Trade
Related Investment Measures (TRIMs) and an Agreement on Government
Procurement that cover such issues as transparency and non-discrimination that
some WTO members have signed
It has long been known that at the heart of the so-called Asian growth miracle
has been the ability of these Asian nations to get most of their economic and
trade related policies functioning in a coherent manner While the general and
over-used term of lsquogood governancersquo may be used to describe this general
coherence and we need to be conscious that this term can mean different
things to different people and different societies many observers stress the
importance of an inclusive society that values social coherence and equality as
being just as important as growth per se For economic and social development
it is important to get policy sets working together and the new theme word for
this in trade agreements is lsquoregulatory coherencersquo
Essentially this emphasises the fact that as Mumford 2014 outlines the
lsquobehind the borderrsquo barriers to trade have become the new frontier for trade
policy This is reinforced by the lowering importance of tariffs per se and the
growth of global chain trade in both goods and services The attention to this
frontier is not without controversy however There are concerns that the global
business sector will push reforms and international coherence at the expense of
governments ceding domestic sovereignty in many social economic and
environmental areas Accepting that as in all issues there are extreme views
149
Mumford provides a description of regulatory coherence as the interface
between domestic regulation and international trade and investment
liberalisation We consider that many aspects of the Singapore Issues fit neatly
into this interface and are an essential part of the lsquogood governancersquo package of
modern trade policy
3 Competition policies
The OECD in a background note to their June 2015 meeting of Competition
Policy experts30 outlined how it is a fundamental principle of competition law
and policy that firms should compete on the merits and should not benefit from
undue advantages due to their ownership or nationality Governments can
affect the way markets function sometimes to the detriment of free
competition They can set procurementtax rules or regulatory regimes putting
private companies at a disadvantage compared to state-controlled or supported
firms or yet they can participate in a market by providing services directly or
through state-ownedcontrolled firms
Ensuring a lsquolevel playing fieldrsquo is therefore key to enabling competition to
work properly but the proviso must be made that markets must actually be free
and fair Often of course it is not the case and the objective for competition
policies is to monitor and correct anomalies and asymmetries in the market
place Typically (and by definition) competition policy means providing
remedies to deal with a range of anticompetitive practices including price
fixing cartel arrangements abuses of a dominant position or monopolisation
mergers that limit competition and agreements between suppliers and
distributors (lsquovertical agreementsrsquo) that foreclose markets to new competitors
In examining a mega-regional agreement we find that the objective of the
Trans-Pacific Partnership (TPP) chapter on competition policy was outlined by
Asian Pacific Economic Cooperation (APEC) leaders as being lsquoto promote a
competitive business environment protect consumers and ensure a level
playing field for TPP companiesrsquoi This seems to involve the enactment and
enforcement of competition laws and relevant institutional frameworks due
30 httpwwwoecdorgdafcompetitioncompetitive-neutrality-in-competition-
enforcementhtm
150
process provisions in the enforcement of competition laws transparency
obligations consumer protection affording standing to private parties to
initiate legal action under competition laws and technical cooperation for the
developing country partners with limited legislation and competence in this
area This became a contentious issue in the TPP and negotiations focused on
New Zealandrsquos pharmaceuticals subsidies by Pharmac the agricultural
producer boards from Canada and Singapore in public utility and transport
services and the US in examples such as their antitrust and associated laws
pertaining to the generous treatment given to the US civil aviation industry
The USTR 2015 reported that the TPP Parties31 agreed to adopt or maintain
national competition laws that proscribe anticompetitive business conduct and
work to apply these laws to all commercial activities in their territories They
agreed to establish or maintain authorities responsible for the enforcement of
national competition laws and adopt or maintain laws or regulations that
proscribe fraudulent and deceptive commercial activities that cause harm or
potential harm to consumers and to cooperate as appropriate on matters of
mutual interest related to competition activities They also agreed to obligations
on due process and procedural fairness as well as private rights of action for
injury caused by a violation of a Partyrsquos national competition law and agreed
to cooperate in the area of competition policy and competition law
enforcement including through notification consultation and exchange of
information We note that this chapter is not subject to the dispute settlement
provisions of the TPP but Parties may consult on concerns It therefore seems
like a lsquobest endeavourrsquo outcome but it does move the general international
frontier forward and further away from excluded countriesregions such as
Africa
Since the WTO withdrew from the competition policy field focus moved more
to the OECD where the main policy response has been the development of so-
called lsquocompetitive neutrality frameworksrsquo that a number of OECD member
countries have implemented These are required for government business
activities not to have a net competitive advantage over their private-sector
competitors simply by virtue of public-sector ownership For the TFTA
31 We note at the time of writing this paper that TPP negotiations have concluded but the
agreement has not been fully ratified with the position of the US in doubt
151
members the main implication may well be a potential closing of available
policy space and especially so in view of many states trying to implement
industrial policies
31 The African dimension
This is an active part of the trade policy agenda in South Africa and the region
although there is an asymmetry in the enthusiasm legislative support and
administrative capacity through the region While unquestionably South
Africa has a competition policy framework and capability that are equal to or
better than many developed countries the same does not hold regionally There
is a need to bring more SADC countries into a functioning competition policy
framework to enhance economic efficiency Perhaps the TPP in particular will
highlight this and convince more developing states in the region that
associated with market access commitments there is a need to have these
policies aligned with policies that discipline that market More widely this
should in turn reflect on opportunities to progress the issue through the WTO
as the final policy convergence agency And capacity building is once again a
key factor here
Within SADC Article 25 of the SADC Protocol on Trade provides for member
states to implement measures within the Community that prohibit unfair
business practices and promote competition The Protocol provides for a
framework of trade co-operation among member states based on equity fair
competition and mutual benefit that will contribute to the creation of a viable
Development Community in Southern Africa Within the EAC the WTO
(2013) reported that in general competition issues are not yet regulated at the
EAC regional level while at the national level only Kenya and Tanzania have
fully functioning competition laws and institutions The EAC Competition Act
was however enacted in 2006 and this Act contains provisions on inter alia
abuse of market dominance mergers and acquisitions consumer welfare
member statesrsquo subsidies and prohibits anti-competitive concerted practices
The COMESA Competition Commission is the first regional competition
authority in Africa and second in the world Its mandate is to ensure fair
competition and transparency among economic operators in the region It
commenced operations in January 2014 and promotes and encourages
competition by preventing restrictive business practices and other restrictions
152
that deter the efficient operation of markets thereby enhancing the welfare of
the consumers in the Common Market and protecting consumers against
offensive conduct by market actors
Similarly for the TFTA Annex 7 on Competition Policy and Consumer
Protection states that under Article 23(3) of the Agreement Article 1 lsquothe
Tripartite Member States recognise the importance of fair competition in
promoting trade supporting industrialisation and promoting consumer welfare
and note that fair competition creates a level playing field by all players large
and small and therefore promotes a good working environment for companies
and businesses particularly the micro small and medium scale enterprises in
this way promoting investment in the regionrsquo
4 Government procurement
The role of government in its procurement of goods and services typically
accounts for 10ndash15 of GDP for developed countries and up to as much as
20 of GDP for developing countries In an attempt to open this significant
portion of the international economy to international competition WTO
members signed the plurilateral (only binding on WTO members who choose
to sign) Agreement on Government Procurement (GPA) at the Uruguay Round
in 1994 This agreement was based on the 1979 Tokyo Round government
procurement agreement and as of June 2016 there were46 signatories (with all
28 members counted individually) Most of the members are developed
countries The intention of the GPA is to ensure that government decisions
regarding government purchases of goods and services do not depend upon
where the good is produced or the service rendered nor upon the supplierrsquos
foreign affiliations
The text of the original Agreement while limited in scope establishes rules
requiring that open fair and transparent conditions of competition be ensured
in government procurement However these rules do not automatically apply
to all procurement activities of each party Rather the coverage schedules play
a critical role in determining whether a procurement activity is covered by the
Agreement or not Only those procurement activities that are carried out by
covered entities purchasing listed goods services or construction services of a
value exceeding specified threshold values are covered by the Agreement The
WTO Working Group on Transparency in Government Procurement examines
153
questions such as does a particular government publish the criteria upon which
it bases its procurement decisions Does it publish the opportunities for
procurement so that all suppliers know about them Does it encourage
competition among potential suppliers After investigating these questions and
others the working group will then try to create policies to open competition
for government contracts
Many countries for a variety of reasons place restrictions on government
procurement of both goods and services Some will do so to encourage
domestic industry though many developing countries have limited domestic
service industries and turn to foreign providers as a result Several developed
countries would like to see the GPA become a multilateral agreement This
would increase market opportunities for their own firms allowing them to bid
for foreign government purchases on a level playing field The strongest
advocates of the multilateral GPA are unsurprisingly the US and EU
Supporters as they see it is part of lsquogood governancersquo in the developing world
in introducing a more transparent and competitive procurement process to
reduce opportunity for corruption and rent-seeking by domestic governments
and suppliers Opposition comes from many developing countries that realise
they will be disadvantaged by established foreign companies and this in turn
would lead to local problems of employment and balance of payments as well
as running counter to possible industrial policy and infant industry labour
environmental and racial empowerment policies But in reality they have far
less capacity to bid for tenders in the developed countries
A reflection upon the linkages of government procurement and other aspects of
the WTO disciplines may be appropriate as procurement relates by definition
to either goods or services and market access for these are covered by the
fundamental WTO principles While government procurement is probably
more important because of the scope of the issue given the role of the state in
many economies the basic principles of market access and domestic subsidies
remain the same On a similar note we could mention that the concept of lsquobuy
localrsquo patriotic campaigns are widespread but they do not seem to attract
censure and condemnation to the same extent Should these campaigns be
placed under some disciplines Perhaps a WTO challenge would answer this
and perhaps some procurement may also be open to challenges within the
current WTO rules
154
Despite several differences in procurement practice a similar non-binding
outcome resulted from the TPP agreement The parties commit to core
disciplines of national treatment and non-discrimination and agree to publish
relevant information in a timely manner to treat tenders fairly and impartially
and to maintain confidentiality of tenders They also agree to use fair and
objective technical specifications to award contracts based solely on the
evaluation criteria specified in the notices and tender documentation and to
establish due process procedures to question or review complaints about an
award This outcome seems to strengthen the GPA and indirectly the WTO
41 The African dimension
In recent years the South African government has taken measures to implement
a reformed government procurement practice It is the vehicle through which
many of the governmentrsquos policies and strategies will be realised and the
vision is to give effect to positive discrimination enshrined in the Constitution
which in turn will boost local businesses and create much-needed wealth for
previously disadvantaged people In South Africa the government procurement
policy and the related strategies have a very specific economic social and
political aim These socio-economic dimensions are the reason that many
developing countries including South Africa refuse to enter into negotiations
in government procurement
COMESA 2009 outlines how the objectives of COMESA Public Procurement
Regulations include (a) to foster competition and openness in public
procurement procedures (b) to foster fair management systems in procure-
ment (c) to promote accountability transparency and value for money in the
public procurement process for national development and (d) to promote
harmonisation of public procurement laws and practices for the enhancement
of intra- COMESA Trade WTO 2013 reports that in the EAC in general open
tendering is the rule in public procurement by EAC countries and except for
Uganda all EAC countries had at that time brought new procurement laws into
operation Meanwhile South Africa will need to be cognisant of the fact that
future FTAs may examine the noble endeavours of using procurement as a
means of redressing previously disadvantaged persons who were discriminated
against under the former apartheid regime
155
In the final analysis though procurement policies probably have little to do
with African agriculture Firstly Africa has minimal involvement in the WTO
GPA and perhaps more importantly it is difficult to see where agricultural
products are likely to be directly related to procurement policies with the
possible exception of famine relief efforts
5 Trade and Investment
We cannot stress enough that the lessons over the last three or four decades
from the dynamic regions of Asia in particular show that the preconditions for
growth are putting domestic structures in place to foster investment and export-
oriented trade However while investment is a necessary condition it is
certainly not a sufficient condition for export-led growth There is a correlation
between the two but the main foundation is getting the basics or that over-
used term lsquogood governancersquo right This latter is very much under the control
of a countryrsquos own government and it is unclear why domestic legislation and
regimes need external control to maximise a countryrsquos own welfare
The WTO has only been peripherally involved with investment in three ways
Firstly a Working Group established in 1996 conducts analytical work on the
relationship between trade and investment Secondly the Agreement on Trade-
Related Investment Measures (TRIMS) prohibits trade-related investment
measures such as local content requirements that are inconsistent with the
basic provisions of GATT 1994 And thirdly the General Agreement on Trade
in Services addresses foreign investment in services as one of four modes of
supply of services
Investment issues are however increasingly becoming an essential component
of the modern FTA as partners seek to benefit from an increase in bilateral
investment as well as from the exchange and transfer of knowledge
technology ideas and export opportunities Ways in which an FTA could
contribute to these aims include
bull greater transparency of regulations or laws that affect foreign
investments
bull more liberalised regimes which will facilitate the foreign investment
bull improvements that can make it easier for investors to resolve any
disputes that they may have
156
bull promotion of bilateral or regional investment by strengthening investor
confidence and thereby encouraging current partnerships into new areas
of manufacturing and service industries through joint ventures and
strategic alliances
Much of the current Foreign Direct Investment (FDI) into Africa is driven
simply by the need to control the resource extraction sectors and has little in
the way of linkage back to desired aspects of FDI such as technology transfer
and poverty alleviation Until better governance regimes become the norm in
Africa it is difficult to see how trade agreements will foster much in the way of
more desirable FDI
Hufbauer and Schott 2013 offer some interesting thoughts on how the WTO
could use investment policies to re-establish itself into the international scene
in a meaningful way For example they could undertake a systematic analysis
of the terms and coverage of existing BITs and RTAs and look at how several
aspects of these agreements cover different things such as environmental and
taxation policies and help provide a framework for common rules and a more
effective disputes resolution framework While these ideas are valid again
there are limited direct links to African agriculture given the relatively basic
foundation for much of the continentrsquos structure
6 Trade facilitation
Trade facilitation can mean different things to different people and is closely
linked to and an integral part of capacity building In the strict sense of the
WTO agenda trade facilitation is focused upon customs and border operational
procedures In a wider sense the OECD views it as helping the institutions
negotiators and processes that shape trade policy and the rules of international
commerce In its extreme but still accurate form it can be viewed as the
complete infrastructural package that leads to international competitiveness in
global trade The latter is an area in which Africa is notoriously lagging as
there can be no question that general trading costs are very high in Africa
(Shayanowako 2014 Pearson and Chaitezvi 2012 and Pearson 2011)
Arguably the only real outcome from the WTO since the Uruguay Round
outcome was the Agreement on Trade Facilitation (ATF or TF) that emerged
157
from the Bali talks Pearson 2015 relates how in December 2013 WTO
Members concluded negotiations on a new Trade Facilitation Agreement
(WTMIN (13)36) aimed at expediting the movement release and clearance
of goods including goods in transit and at improving customs cooperation as
part of a wider Bali package The members then adopted on 27 November
2014 a Protocol of Amendment to insert the new Trade Facilitation Agreement
into Annex 1A of the WTO Agreement This Agreement will enter into force
once two‐thirds of WTO members have completed their domestic ratification
process and it will be binding on all member states (with no exclusions) from
the time of its entry into force although with provisions for delayed
implementation for Developing and Least Developed Countries As of 18 June
2015 only eight members had signed the Agreement (Botswana Hong Kong
China Singapore the USA Mauritius Malaysia Japan and Australia) This is
far short of the 107 required and with the WTO Ministerial in December 2015
looming observers are doubtful that more than 40 members will have signed
(with the EUrsquos 28 members contributing massively to that total)
The African Development Bank (ADB) reported on the implications of the TF
for Africaii The report notes that firstly a binding TF agreement will push
countries to undertake trade facilitation reforms in keeping with their
commitments and that there are a number of countries that have been lethargic
in undertaking customs reforms and other trade facilitation measures This has
impeded the efficient operation of their infrastructure including the regional
transport corridors In some instances there is little inclination from key
African government agencies to undertake reforms and a binding commitment
on TF would help initiate and lock in reforms In addition the TF contains
obligations on the publication of information on issues such as documentation
for imports export and transit procedures duties and taxes fees imposed by
governments regarding importation or exportation import export or transit
restriction and appeal procedures
Shintaro Hamanaka 2014 from the ADB acknowledges that it could be argued
that the TF benefits are heavily tilted in favour of exporting countries and
regards it as an lsquoimport-facilitating agreementrsquo which will worsen Africarsquos
trade balance and does little to address the productive and export constraints
facing developing countries To directly benefit African exporters must
increase value-adding activities by promoting investment in areas such as value
chains otherwise the benefits of the TF deal will be marginal and African
158
countries will miss out on the alleged $1 trillion Bali trade boost Meanwhile
issues such as NTBs compliance with SPS tariff escalation and tariff peaks on
products of interest African exporters continue to stifle Africarsquos potential to
reach international markets and upgrade along the value chain Therefore
parallel efforts to the TF are required in addressing these issues both in regional
and global markets
The Organisation for Economic and Cooperation Development (OECD)32
assesses the potential benefits of the Bali package This is done with the
lsquolimitedrsquo implementation scenario that assumes that countries that are already
implementing best practices will continue doing so but that others will not
(where implementation is discretionary showing significant potential benefits)
This package is however not without controversy the African countries argue
that this package lacks balance and is tilted heavily in favour of an agreement
forced on the poor nations by the industrialised countries Many developing
countries including the African countries see the package as aimed at opening
their markets to goods through enhanced merchandise access They believe
that conversely there is little to gain for developing-country exports to the
developed world whose infrastructure is generally excellent
Within the TPP the United States Trade Representative (USTR) reported that
initially the TPP countries agreed that capacity building and other forms of
cooperation were critical both during the negotiations and post conclusion to
support TPP countriesrsquo abilities to implement and take advantage of the
agreement These will be needed to help developing countries to meet the high
standards the TPP countries aspire to To this end several cooperation and
capacity-building activities have already been implemented and more are
planned The TPP countries are also discussing specific texts that will establish
a demand-driven and flexible institutional mechanism to effectively facilitate
cooperation and capacity-building assistance after the TPP is implemented
The big questions remain though as to whether any of the monies directed to
trade facilitation will be lsquonew moniesrsquo or merely a redirection of monies
32 See website
httpwwwoecdorgtradetradedevOECD_TAD_WTO_trade_facilitation_agreement_pote
ntial_impact_trade_costs_february_2014pdf
159
already allocated to projects that may or may not be similar to lsquotrade
facilitationrsquo Many observers believe answers to this range from lsquounlikelyrsquo to a
flat lsquonorsquo and that smoke and mirrors will be the order of the day Is there more
rhetoric than reality in the whole trade facilitation project Many think so
Shintaro Hamanaka after an examination of the AFT is left less than
impressed He offers two critical points the first is developing and LDC
members can decide when to implement obligations and implementation can be
subject to the provision of assistance from donors and secondly the
obligations are not ambitious and tend to be best endeavour (lsquoto the extent
possiblersquo) The agreement is not expected to have a major legal impact on
members and the economic impact also seems to be narrow because it covers
only limited trade facilitation items While the paper considers that technical
assistance may be helpful and financial assistance can be an important catalyst
ATF trade facilitation reform is fundamentally a unilateral action and political
will is essential Therefore the ATF can be a guide for trade facilitation reform
at the domestic level and the likelihood for success of such unilateral reforms is
enhanced with assistance Importantly gains from trade facilitation mainly
result from investment in physical infrastructure such as ports airports roads
and rail infrastructure and this wider aspect of trade facilitation is outside the
scope of the ATF
Impacts
Others are even more pessimistic and even to the point of scathing Capaldo
summarises his paper with an abstract that reads lsquoOfficial estimates tend to
overstate the benefits of trade facilitation and ignore its costs When all
underlying assumptions are brought to light expecting large gains appears
unreasonable At the same time estimated employment benefits may easily
turn into net losses With fundamental uncertainty surrounding its effects
implementing trade facilitation without enhancing systems of social protection
would be ill advised Indeed the net effect of trade facilitation may depend on
the social policies it is complemented with While trade facilitation may bring
extra business to import-export firms it is not a feasible or sustainable growth
strategy for all countries and it cannot be expected to deliver growth to the
global economy Importantly he considers that the figures generally bandied
about as gains from trade facilitation fail to support any reasonable expectation
that the reform may benefit developing economies Thus can we expect little
for Africa
160
61 A tralac African analysis
Politics aside there is little argument that African countries have a problem
with infrastructural delays and associated costs33 But how serious are these
problems Jensen and Sandrey 2015 examined the costs of trade facilitation in
Africa only as represented by costs such as delays at border crossings
roadblocks for trucks and the necessity to pay bribes They used cost of delay
data from Minor 2013 and Hummels and Schaur 2013 who developed a
database of per day ad valorem costs to use in the Global Trade Analysis
Project (GTAP) computer model with these estimates providing ad valorem
equivalents of the per day costs along with the number of days involved In
implementing the GTAP model Jensen and Sandrey used the Singapore
international best-practice benchmark of four days for imports and assessed a
reduction of 20 in Africa for the days over and above this benchmark for
imports only to avoid possible double counting
The data reinforced that transit delays and subsequent costs are largely an
African issue and in taking a calculation of a 20 reduction in these African
costs they argued that their approach was conservative There was still plenty
of lsquoslackrsquo in the system although there are countries in Africa that are very
close to international benchmarks this proves that Africa has the potential to
improve
The welfare gains to Africa were substantial For South Africa they were some
US $8519 billion in real terms and as is usually the case this is the most
significant result for both Africa and the total worldwide gain of US $31231
billion Following close behind are the very large gains to Nigeria and the rest
of Africa aggregation In direct contrast in tariff elimination scenarios there
were gains to many of the large economies outside Africa as their export prices
rise in response to more efficient transit times in Africa
The striking feature from the Jensen and Sandrey results is that almost all of
the gains to each country overwhelmingly accrue to that same country This
may in part be a feature of the way in which they modelled their reductions as
they only addressed changes in import times in transit whereby the benefits
33 See United Nations Economic Commission for Africa (2013)
161
accrue to the importer Notwithstanding these technical issues the facts remain
that (a) these gains are substantial (b) they mostly accrue to the liberaliser and
(c) in only taking 20 of the costs of time over and above an international
benchmark they were leaving plenty of room for improvement in most African
countries And the gains in welfare although concentrated in Africa were
global in nature This goes some way to refuting the argument (paranoia) that
the gains disproportionately accrue to developed country exporters
7 Rules of Origin (ROO)
Sandrey 2015b examined the ROO and found an almost universal agreement
that the ROO as designed mainly to stop trade deflection or lsquoimports sneaking
through the back doorrsquo in preferential trade agreements are becoming
increasingly complex through an interlay of different rules and are therefore
unduly trade restricting costly to manufacturers and overall welfare reducing
They represent a NTB in a global trading environment where these NTBs are
becoming more trade restrictive than actual tariffs and especially so in a global
manufacturing and trading environment that is rapidly changing in this century
while the ROO remain firmly rooted in their 1970s base While some observers
have boldly questioned the need for the ROO unfortunately some indication of
origin of goods will always be necessary They are required as identification
for reporting purposes and also for several trade-related reasons apart from
preferential trade agreements This leaves a situation whereby the best option
forward is to re-examine the ROO and as a minimum try to simply coordinate
the rules and regimes
This state-of-the-art solution for the way forward in the reform process is
currently represented by a 2014 WTO paper (the lsquoUganda paperrsquo) which cites
an internal EU report that considers the ROO provisions to be old-fashioned
and not to be following developments in world trade ROO were drawn up in
the 1970s and have not changed much since whereas the commercial world
has They were also based on the need to protect community (EU) industry and
on the premise that beneficiary countries should be encouraged to build up
their own industries in order to comply In most cases this has not happened
Instead there has been a trend towards the globalisation of production but
ROO have not been adapted to this Compliance costs are high and the
procedures outdated and this combined with lower preferential margins and
high compliance costs makes preferences unattractive Successive rounds of
162
negotiations have substantially lowered the preferential margins and dramatic
changes in technologies and transport information technology and
communication occurred The fragmentation of production and the global value
chains approach have defeated any argument for a vertical integration of
industrial sectors that traditionally underpinned the need for strict ROO
Moreover there is no evidence that some set ROO are transparent and simple
or that they have been trade and investment creating in LDCs
As a sweeping generalisation the ROO is not a major issue in agriculture and
especially not in the African case where agriculture tends to be exported at a
primary level They are much more of an issue in manufacturing and
especially so for Africa in textile and clothing exports Thus it is hard to see
many avenues where the WTO nexus with African agriculture can be of direct
benefit Having said that the Nairobi Ministerial Conference adopted a
decision that will facilitate opportunities for least-developed countries export
of goods to both developed and developing countries under unilateral
preferential trade arrangements in favour of LDCs This gives more detailed
directions on specific issues such as methods for determining when a product
qualifies as lsquomade in an LDCrsquo and when inputs from other sources can be
lsquocumulatedrsquo and calls on preference-granting members to consider allowing
the use of non-originating materials up to 75 of the final value of the product
It also calls on preference-granting members to consider simplifying
documentary and procedural requirements related to ROO and the WTO
considers that the key beneficiaries will be sub-Saharan African countries
Hufbauer and Schott 2013 also suggest a practical way in which the WTO can
make a valuable contribution They argue that as the World Customs
Organization (WCO) has created a database of preferential rules of origin
prescribed by regional free trade agreements (RTAs) this information should be
matched by the WTO with the MFN tariff rate schedules This in turn would
identify sectors where the MFN tariffs do not differ greatly Here the WTO
could suggest to the RTA members that rules of origin are not needed to
prevent lsquotrade deflectionrsquo as the transhipment costs will eat up the tariff
advantage Furthermore the WTO could identify sectors where RTA members
could easily attain a reasonable degree of harmonisation in applied tariffs and
thereafter eliminate rules of origin since lsquotrade deflectionrsquo would no longer be a
serious problem
163
8 Trade and environment
The WTO reports that sustainable development and protection and preservation
of the environment are fundamental goals of the WTO They are enshrined in
the Marrakesh Agreement (which established the WTO) and complement the
WTOrsquos objective to reduce trade barriers and eliminate discriminatory
treatment in international trade relations While there is no specific agreement
dealing with the environment under WTO rules members can adopt trade-
related measures aimed at protecting the environment provided a number of
conditions to avoid the misuse of such measures for protectionist ends are
fulfilled
The WTO contributes to protection and preservation of the environment
through its objective of trade openness through its rules and enforcement
mechanism through work in different WTO bodies and through ongoing
efforts under the Doha Development Agenda The Doha Agenda includes
specific negotiations on trade and environment and some tasks assigned to the
regular Trade and Environment Committee and it is also looking at the effects
of environmental measures on market access the intellectual property
agreement and biodiversity and labelling for environmental purposes
Similarly while climate change per se is not part of the WTOs ongoing work
programme and there are no WTO rules specific to climate change the WTO is
relevant because climate change measures and policies intersect with
international trade in a number of different ways The WTO is also actively
seeking a way forwards with its tariff-liberalising Environmental Goods
Agreement (EGA) whereby it would build on an APEC initiative to phase out
these tariffs over time
9 Trade and Labour
Wikipedia reports that the WTO currently does not have jurisdiction over
labour standards and the only place in which they are mentioned in the entire
set of WTO Agreements is in GATT Article XX e) lsquorelating to the products of
prison labourrsquo However since the formation of the WTO in 1995 there have
been increasing calls for action on the labour standards issue and requests for a
lsquohuman face on the world economyrsquo The United Nations is among those
bodies which have criticised the current system and have called for a shift to a
human rights oriented approach to trade with steps to be taken lsquoto ensure that
164
human rights principles and obligations are fully integrated in future
negotiations in the World Trade Organizationrsquo
There are several issues that cloud the trade and labour issue for the WTO
These include political economy questions on domestic sovereignty that go
beyond current WTO positions and seek to dictate how countries treat their
citizens In strictly economic and trade terms this trade and labour boils down
to the concept of comparative advantage where developing countries with their
excess of cheap and usually unskilled labour are accused of ignoring labour
standards by developed countries The developing countries in turn see this
stance as protectionist measures In theory there is wording in the WTO
agreement that could be used to protect human rights but in practice it seems
unlikely that this will become a major WTO issue in the foreseeable future
10 Food security
At the 2013 Bali Ministerial Conference there was a proposal to shield public
stockholding programmes for food security in developing countries so that
they would not be challenged legally even if a countryrsquos agreed limits for trade-
distorting domestic support were breached When governments buy food from
farmers at supported prices to build up stocks this counts as Amber Box
domestic support and can be considered as a measure that distorts trade by
affecting market prices and the quantities produced This Amber Box support is
limited with most developing countries allowed an amount that is conceptually
minimal (de minimis) of up to 10 of the value of production Some of
developing countries are saying it is difficult to remain within these limits
Members agree that food security is a vital issue but are concerned that it
might weaken the disciplines that apply to all domestic support
It became an issue at the Bali conference and members sort a compromise
interim agreement India became the villain that stalled the entry into force of
the WTO Trade Facilitation Agreement (TFA) and the associated lsquoBali
packagersquo with the drastic reversal of the negotiating position post-Bali by
Indiarsquos new government Indiarsquos standpoint was based on its genuine concern
over food security All seems to be resolved and in April 2016 India ratified
the new TFA and an outcome from the Nairobi meetings was that Ministers
adopted a Ministerial Decision on Public Stockholding for Food Security
165
Purposes that commits members to engage constructively in finding a
permanent solution to this issue
11 Tariff quotas under-fill and special treatment
Tariff quotas (TRQs) are where import duties are lower on quantities within the
quotas and higher for quantities outside They were agreed in the Uruguay
Round negotiations as a means of allowing exporters some access to other
countriesrsquo markets when the normal (out-of-quota) tariffs on imports are high
Some countries are concerned with the methods governments use to share these
quotas among traders (TRQ administration) and that this can become an
additional trade barrier and consequently means that quotas are sometimes not
used (under-filled) Conversely importing countries argue under-fill is often
simply supply and demand in the market Developing countries have argued for
information and monitoring on these quotas along with mechanisms to ensure
quotas are filled A partial compromise was struck at Nairobi but the issue
remains largely unresolved and TRQs can be regarded as non-tariff barriers to
trade
12 Disputes settlement
Perhaps one of the real successes of the WTO has been the Disputes Settlement
Understanding The dispute of most interest to African agriculture has been the
lsquocotton problemrsquo This began in 2002 when Brazil and the four African cotton
producers of Benin Burkina Faso Chad and Mali argued that cotton subsidies
caused world cotton prices to decline and reduced their export revenues It
became a long drawn out saga and virtually ended at the Nairobi 2015 WT
Ministerial Meetings in what could be called a draw It did however highlight
two key shortcomings of the current trading system the inability of less
powerful trading partners to bring their cases to the WTO and the need to
broaden the lsquosentencingrsquo procedures to include compensation when counter-
measures from these less powerful members are not applicable Another
agricultural dispute that indirectly concerned Africa was the even longer
running banana dispute It was finally settled in 2012 with the EUrsquos revised
commitments replacing with tariffs only a complicated and WTO-illegal
banana import regime and with the Africa EPA agreements with the EU they
will have duty and quota free access
166
While the mechanism may have been (almost periphery) of benefit to Africa
and African agriculture there are undoubtedly ways in which reforms would
make it easier for smaller countries with limited resources to use The WTO
needs to give serious consideration to this
167
References
Capaldo J 2014 Trade Hallucination Risks of Trade Facilitation and
Suggestions for Implementation Global Development and Environment
Institute (GDAE) Working Paper No 14-02 June 2014
COMESA 2009Official Gazette of the Common Market for Eastern and
Southern Africa (COMESA)Volume 15 No 3 09 June 2009
Hufbauer G and J Schott 2013 Payoff from the World Trade Agenda
Report to the ICC research Foundation Peterson Institute for International
Economics April 2013
Hummels D and Schaur G 2013 Time as a Trade Barrier American
Economic Review 103 1ndash27
Jensen H G and R Sandrey 2015 Chapter 8 lsquoReduction in the time costs of
transitrsquo in The Continental Free Trade Area ndash A GTAP assessment [complete
e-book] wwwtralacorgpublications
Minor P 2013 Time as a Barrier to Trade A GTAP Database of ad valorem
Trade Time Costs Second Edition ImpactEcon
Mumford P 2014 Regulatory Coherence blending trade theory and
regulatory policy Policy Quarterly Volume 10 Issue 4 ndash November 2014
pages 3 ndash 9
Pearson M 2015 Trade Facilitation Agreement Presentation at the 2015
Annual Conference on 16 and 17 in Lusaka Zambia Available at
wwwtralacorg
Pearson M and C Chaitezvi2012 Trade Facilitation in the COMESA-EAC-
SADC Tripartite Regional Integration Research Network Discussion
Paper(RIRNDP1202)Published by TradeMark Southern Africa September
2012
168
Pearson M Trade facilitation in the COMESA ndash EAC ndash SADC Tripartite Free
Trade Area tralac Working Paper S11WP11 September 2011
SADC Declaration on Regional Cooperation in Competition and Consumer
Policies downloaded from httpwwwtralacorgfiles201103SADC-
Declaration-on-Regional-Cooperation-Competition-Policypdf
Sandrey R 2015a Where are the Singapore Issues tralac Working Paper 3
September 2015
Sandrey R 2015bRules of origin ndash looking outside the box tralac Working
Paper 11 February 2015
Sandrey R 2014 Mega-regional Trade Agreements and South Africarsquos Trade
Strategy Implications for the Tripartite Free trade Area Negotiations SAIIA
Occasional Paper No 195 July 2014
Sandrey R 2006 WTO and the Singapore Issues tralac Working Paper No 18
Stellenbosch US Printers
Shayanowako P 2014 The Bali Trade Facilitation Agreement Implications
for Southern Africa tralac Working Paper No US14WP012014 Stellenbosch
tralac
Shintaro Hamanaka 2014 World Trade Organisation Agreement on Trade
Facilitation Assessing the Level of Ambition and the Likely ImpactADB
Working paper Series on Regional Economic Integration Asian Development
Bank No 138 September 2014
United Nations Economic Commission for Africa 2013 Harmonizing policies
to transform the trading environment Assessing Regional Integration in Africa
VI United Nations Economic Commission for Africa Addis Ababa
UNCTAD 2015 World Investment Report 2015 ndash Reforming International
Investment Governance Available at httpunctadorgenpages
PublicationWebflyeraspxpublicationid=1245
Office of the United States Trade Representative (USTR) 2015 Summary of
the Trans-Pacific Partnership Agreement Press release October 2015
169
WTO 2009 Trade Policy Review Report by the Secretariat SOUTHERN
AFRICAN CUSTOMS UNIONWTTPRS222 30 September 2009
WTO 2013 Policy Review Report by the Secretariat EAST AFRICAN
COMMUNITY Revision WTTPRS271Rev131 May 2013
i Asia Pacific Economic Community Perspectives towards the APEC Bogor Goals
Perspectives of the APEC Policy Support Unit November 2010
httpwwwmfatgovtnzTrade-and-Economic-RelationsAPEC0-highlights-bogor- reportphp ii See httpwwwafdborgenblogsintegrating-africaposttrade-facilitation-in-the- bali-package-whats-in-it-for-africa-12698