Embed Size (px)
Citation preview

Writing ontimeline
Writing timelinetimeline
Writing Writing Writing Writing Writing Writing Writing Writing Writing Writing Writing Writing Writing Writing Writing Writing tomorrow s
Annual Report 2013-14
www.jubilantfoodworks.com

Corporate Office -
Domino’s Pizza India
B – 214, Phase II, District
Gautam Budh Nagar
Noida – 201 305
(Uttar Pradesh)
Phone : +91-120-409 0500
Fax : +91-120-409 0599
Corporate Office -
Dunkin’ Donuts India
B - 24, Hosiery Complex,
Phase II
Noida – 201 305
(Uttar Pradesh)
Phone : +91-120-459 9460
Fax: +91-120-459 9489
Regional Office
Addresses
NORTH REGIONAL OFFICE
Domino’s Pizza India
AF 1-3, AF 46, 47, Aditya City
Center Mall, Plot No. C/GH - 3,
Vaibhav Khand, Indirapuram,
Ghaziabad – 201 014
(Uttar Pradesh)
Phone : +91-120-439 6900
FORWARD-LOOKING STATEMENTS
Certain statements in this document may be forward-looking statements. Such forward-looking statements are subject to certain risks and uncertainties like government actions, local political or economic developments, technological risks, and many other factors that could cause our actual results to differ materially from those contemplated by the relevant forward-looking statements. The Company assumes no responsibility to publicly amend, modify or revise any such statements to reflect subsequent developments, information or events.
EAST REGIONAL OFFICE
Domino’s Pizza India
11A, East Topsia Road, 3rd & 4th
Floor, Parama Building, Beside
Mirania Boating Complex, Kolkata
- 700 046
(West Bengal)
Ph: +91-33-4418 2200
WEST REGIONAL OFFICE
Domino’s Pizza India
Office No. 101 & 102, Ground
Floor, Timmy Arcade, Makwana
Road, Marol Naka, Andheri (E),
Mumbai – 400 059 (Maharashtra)
Ph: +91-22-4261 1500
SOUTH REGIONAL OFFICE
Domino’s Pizza India
1573, 1st Floor, Sector 1, AGARA,
HSR Layout, Bangalore – 560 102
(Karnataka)
Ph: +91-80-2572 0347, 48, 49
CENTRAL REGIONAL OFFICE
Domino’s Pizza India
7th Floor, A Wing
Shriram Shyam Tower, Kingsway,
Nagpur - 440 010 (Maharashtra)
Ph: +91-712-662 6300
Board of Directors
Chairman & Director
Mr. Shyam S. Bhartia
Co-Chairman & Director
Mr. Hari S. Bhartia
CEO-cum-Whole Time Director
Mr. Ajay Kaul
Independent Directors
Mr. Arun Seth
Mr. Phiroz Vandrevala
Ms. Ramni Nirula
Mr. Vishal Marwaha
Key Managerial Personnel
President &
Chief Financial Officer
Mr. Ravi S. Gupta
Company Secretary-cum-
Compliance Officer
Ms. Mona Aggarwal
E-mail ID for Investor
Correspondence
Websites
www.jubilantfoodworks.com
www.dominos.co.in
www.dunkinindia.com
Registrar & Share
Transfer Agent
Link Intime India Pvt. Ltd.,
44, Community Centre,
2nd Floor, Naraina
Industrial Area, Phase – I,
Near PVR Naraina,
New Delhi – 110 028
Phone: +91-11-4141 0592,
93, 94
Fax: +91-11-4141 0591
Statutory Auditors
S. R. Batliboi & Co. LLP
Golf View Corporate Tower B,
Sector 42, Sector Road
Gurgaon – 122 002 (Haryana)
Phone : +91-124-464 4000
Fax : +91-124-464 4050
Registered Office
B – 214, Phase – II, District
Gautam Budh Nagar,
Noida – 201 305,
(Uttar Pradesh)
Phone: +91-120-4090 500
Fax: +91-120-4090 599
Corporate Identification
Number
L74899UP1995PLC043677
Stock Code
National Stock Exchange :
JUBLFOOD
Bombay Stock Exchange :
533155
Bankers
Axis Bank Limited
HDFC Bank Limited
ICICI Bank Limited
Yes Bank Limited
IDBI Bank Limited
CorporateInformation

This year, a huge number of our shareholders will be logging on towww.jubilantfoodworks.com/investors/ financial-information to read our Annual Report online. The experience will not only be a more engaging and enriching one, but also a greener & environment friendly one, helping us contribute towards significant paper saving.
Going the e way Scan the bar code to view our Annual Report online:
What’s Inside
History
Management Discussion and Analysis
Expansion
Awards
Innovation
Numbers
Director’s Report
Corporate Governance Report
Technology Commitment
Statement of Profit & Loss
Cash Flow Statement
Balance SheetIndependent Auditor’s Report
Notes Forming part of Financial Statements
Statement of Profit & Loss
Cash Flow Statement
Balance SheetIndependent Auditor’s Report
Notes Forming part of Financial Statements
04
18
22
06
14
8281
08
16
32 38
83
10
52515047
84
12
Board of Directors
21
54
86
Writing on Tomorrow’s Timeline
Chairmen’s Message
StatutoryReports
StrategicReview
Financial Statements
Financial Statements
Standalone Financial Statements
Consolidated Financial Statements
Writing on Tom
orrow’s Tim
eline Strategic Review Statutory Reports Financial Statem
ents
Jubilant FoodWorks Limited 1

timeline
Writing on
tomorrow’s
Annual Report 2013-142

Our yesterdays were spent in writing ‘achievement’ on today’s timeline. Today, we are writing the same on tomorrow’s timeline. Our deeds spell investment, expansion of our network, product innovations and new avenues to connect with our consumers and delighting them. Our aim is to successfully reach out to more places and more people to transform ourselves into a bigger and better brand. We are reaching out towards sustainable long-term success of the organisation and the brands under its umbrella.
“A timeline is an interval between our intent, deed and joy of achievement”
WE BELIEvE THESE DEEDS WILL LEAD TO AN ACHIEvEMENT FOR uS AND OuR STAkEHOLDERS TOMORROW, SuCH IS THE CONFIDENCE WE HAvE IN OuRSELvES.
Writing on Tom
orrow’s Tim
eline Strategic Review Statutory Reports Financial Statem
ents
Jubilant FoodWorks Limited 3

TODAy, WE ARE AN ORGANISATION WITH:
Writing
history on tomorrow’s timeline
70%+share in the organised chain
Pizza market in India (as per Euromonitor data
published in 2014)
Food Service Company to successfully launch online and
mobile ordering nationally in India with 20%+ delivery orders online
1st
on tomorrow’s timeline
Annual Report 2013-144

6.4+ Million Fans on our
Domino’s Pizza Facebook page
152 cities in which Domino’s Pizza
Restaurants are present (on May 19, 2014)
06out of top 10 Domino’s
Pizza Restaurants globally in terms of
number of Pizzas sold are from India
08Million pizzas sold
every month across our Domino’s Pizza
Restaurants
749Domino’s Pizza Restaurants across
the country (on May 19, 2014)
29Dunkin’ Donuts
Restaurants (on May 19, 2014)
Fastest growing franchisee in Domino’s global network of 72
countries
biggest Domino’s Pizza franchise
country in the world outside the uS
2nd
Writing on Tom
orrow’s Tim
eline Strategic Review Statutory Reports Financial Statem
ents
Jubilant FoodWorks Limited 5

WE ARE CONFIDENT THAT OuR INvESTMENTS TODAy WILL MAkE uS BIGGER AND BETTER, TOMORROW. ExPANSION, THuS, IS OuR kEy MANTRA FOR TOMORROW. AS A RESuLT OF THIS AGENDA, WE WENT INTO Fy2014 WITH A STRONG FOCuS ON ExPANSION FOR BOTH OuR BRANDS, DOMINO’S PIzzA AND DuNkIN’ DONuTS.
Writing
expansionon tomorrow’s timeline
NEW CITIES WERE ADDED TO OuR GEOGRAPHICAL SPREAD
27
COMMISSARIES ACROSS INDIA, WELL EquIPPED TO CATER TO THE EvER INCREASING DEMAND, AND ALSO TO SuPPORT OuR ExPANSION PLANS
06
When we began catering to the burgeoning market of more than 1 Billion people, we knew that the potential existed for a large network of restaurants.
We expanded our Domino’s Pizza Restaurant network to 700+ restaurants in 152 cities in India in less than two decades. Of these, 90 cities are one restaurant cities, indicating a huge opportunity for more restaurants in the future in these and many more similar cities. Dunkin’ Donuts made its maiden foray into Western India with the opening of 2 (two) restaurants in Mumbai (on
May 10, 2014), thus taking our Dunkin’ Donuts Restaurants count to 29. Our Dunkin’ Donuts brand now reaches out to consumers in 10 cities, charting a growth plan that is totally geared for the future.
During the year, we commenced construction of new manufacturing location/commissaries in Nagpur, Hyderabad and Guwahati, and also initiated the process of relocating
Annual Report 2013-146

and offers a variety of all-day part food menu that includes burgers, sandwiches, coffee, salads etc. It is positioned as a young adult’s cafe´ with mature fare and a new way of treating consumers. We expanded into entire new product category, Dunkaccino-range of blended Cold Coffee, Burgers and Salads to build a strong all-day part menu so that there are differentiated offerings for consumers to walk in the restaurant at any hour of the day. Also, the launch of Wicked Wraps (in May 2014) takes the agenda forward by creating a new consumption opportunity of light meal for occasions in between meal times.
While in existing markets, focus is on increasing the penetration and frequency of ordering, in new markets we initially focus on attracting new consumers to drive penetration.
our Noida manufacturing location/commissary to a larger premise. As on date, we have six state-of-the-art manufacturing location/commissaries across India, well equipped to cater to our ever expanding network.
We continuously seek to expand occasions for ordering Pizza. We cater to celebratory occasions like anniversaries, birthdays, family get togethers etc., and have expanded into meals specifically for kids, through launch of Junior Joy Box. We are also in the process of expanding our relevance by introducing offerings that can be consumed any time of the day. The success of this strategy is endorsed by the commendable increase in our non-pizza sales.
We have been continuously expanding our menu to offer more locally inspired and region-specific offerings, which resonate with locally popular flavours, thus increasing the propensity of consumption by existing and new consumers.
Dunkin’ Donuts is positioned in the sweet spot between a qSR (quick Service Restaurant) and a cafè,
AT JFL, ExPANSION MEANS MORE THAN ADDITIONAL RESTAuRANTS. IT IS A STORy OF CATERING TO A LARGER SET OF CONSuMERS, WITH MORE MENu INNOvATIONS, MORE OCCASIONS TO ORDER FOR DELIvERy OR DINE IN, AND MORE OPPORTuNITIES TO CONSuME OuR OFFERINGS ANy TIME OF THE DAy. IT IS AN AGENDA THAT IS SELF-SuSTAINING AND GROWTH-ORIENTED.
Writing on Tom
orrow’s Tim
eline Strategic Review Statutory Reports Financial Statem
ents
Jubilant FoodWorks Limited 7

JFL believes ‘Innovation’ is an important pillar for growth and key for maintaining a competitive edge. By writing innovation on tomorrow’s timeline, we are able to increase and sustain our consumer relevance. During the year, our innovation was focussed on new restaurant design and formats, new products, marketing strategies and operational efficiencies.
We adopted a new restaurant design ‘Pizza Theatre’, an innovation that has been steadily gaining popularity in Domino’s world. This new design is interactive, vivid and brings the pizza making process into the forefront for our consumers delight. As on March 31, 2014, we had total of 69 Pizza Theatres and we plan to augment the number in the coming years.
innovationWriting
on tomorrow’s timelineWe also innovated with a new flexi Restaurant format (small kiosk). The kiosk serves as an additional order taking station, away from restaurants but around a high footfall area. The orders from these kiosks are served by nearby restaurants. This format is in the initial stages of experimentation for viability and sustainability. During the year, we launched 9 (nine) such combinations. We are also looking forward to more flexi format restaurants at transit locations such as metro stations, tourist hubs, IT parks, multiplex, etc., aimed at catering to different consumption occasions.
Dunkin’ Donuts new positioning “Get your Mojo Back” is a reflection of our desire to give our consumers an offering that helps them fight the
programmed nature of their lives. It is manifesting in every aspect of the brand starting from product strategy, communication, culture and consumer service attitude. In line with this new positioning of Dunkin’ Donuts, we have refreshed our Dunkin’ Donuts Restaurant designs.
Our marketing strategy for Domino’s Pizza was aimed at augmenting the new positioning of ‘yeh hai rishton ka time’. The campaigns such as ‘Pehli kamayi’, offering the perfect way to celebrate small moments of joy and new product launches such as Lebanese rolls, highlighting celebration of spicy moments with friends scaled up the emotional connect with Domino’s Pizza by integrating it with the new innovations and offerings.
Annual Report 2013-148

Product innovation is an incessant journey for our brands. During the year, we introduced several new products such as Spicy baked chicken, Lebanese roll, Calzone pockets and Fresh Pan Pizza. The new side orders have helped in strengthening all-day part food catering to different consumption occasions.
The strategy of product innovation is also being successfully replicated in Dunkin’ Donuts, with launch of new Tough Guy Burger, Corn and Cheese Burger, the Classic Mutton Burger, Dunkaccino, Stir’accino, delightful array of donuts that included dark chocolate truffle, very very blueberry, alive by chocolate, classic coffee, chocolate hazelnuts, fresh cherry tart, mandarin chocolate orange and coconut ganache fills, strongly aligned to the Indian taste.
We believe that a long-term sustainable relationship with our business partners is vital for ensuring long term success. To enhance our operational efficiency, we have also scaled our supply chain management with adequate number of logistics service providers covering our pan India restaurants. We facilitated our business partners in obtaining various certifications like ISO, HACCP which ensured delivery of quality ingredients to us as well as growth of the business partners. We also remain in continuous discussions with our business partners to address our innovation priorities.
To drive efficiency through innovation, we initiated employees participation programme called Sankalp (which means ‘determination’) across the
organisation. The programme creates mass movement for change by giving an opportunity to the employees to give ideas for improvement. Several ideas are collected through this programme and the beneficial ones are implemented with employees being suitably rewarded for their contribution.
We have been implementing Six Sigma across functions with a rigorous, data-driven, result-oriented approach. Through Six Sigma, we have been driving initiatives for improving processes, building efficiencies and achieving cost efficiency specifically for logistics optimisation, manpower productivity enhancement, lead time reduction, wastage reduction and resource utilisation. One of such exemplary projects successfully deployed is Restaurant manpower optimisation. The optimisation model is helpful in budgeting manpower cost, what-if-scenarios for strategic and tactical level planning, handle the rush (HTR) planning etc.
Our zeal of innovation has placed us in the top seven companies in Asia, as identified by BNP Paribas which are leading the innovation agenda.
Fy2014 WAS, THuS, A STORy OF NEW AND REFRESHED RESTAuRANT DESIGN, NEW FLExI FORMAT - kIOSk, PRODuCT INNOvATIONS, NEW WAyS TO REACH & DELIGHT CONSuMERS, NEW POSITIONING AND MARkETING STRATEGy. INNOvATION AT JFL IS A PART OF LIFE, AND WE BELIEvE THAT WHEN WE WORk INNOvATIvELy TODAy, OuR TOMORROWS BECOME FuNDAMENTALLy BRIGHTER.
Writing on Tom
orrow’s Tim
eline Strategic Review Statutory Reports Financial Statem
ents
Jubilant FoodWorks Limited 9

TECHNOLOGy AT JFL IS A BuSINESS ENABLER. IT ENCOMPASSES THE INITIATIvES THAT WILL IMPROvE OuR EFFICIENCIES, REDuCE OuR OvERHEADS, STREAMLINE OuR OPERATIONS AND DEEPEN OuR CONSuMER CONNECT FOR THE FuTuRE. OuR INvESTMENTS IN TECHNOLOGy HAvE MADE uS STRIDE FAR AHEAD IN FOOD SERvICE INDuSTRy (FSI) AND WE STRIvE TO CONTINuOuSLy LEvERAGE TECHNOLOGy TO OuR ADvANTAGE.
technologyWriting
on tomorrow’s timeline
WE ARE AMONGST vERy FEW COMPANIES IN INDIA TO HAvE OuR CORPORATE & REGIONAL OFFICES CERTIFIED ON ISO 270001:2013, WHICH IS THE uPGRADED vERSION OF INTERNATIONALLy ACCLAIMED STANDARD FOR INFORMATION SECuRITy MANAGEMENT.
Annual Report 2013-1410

from any part of India. During the year, we also rolled out feedback service on this number for our consumers to give us their valuable feedback.
We have also capitalised on technology in Training with the help of web-based platform, Learning Management System (LMS) through dedicated training PCs at more than 500 restaurants. LMS enables standardisation, consistency and quick roll out of new training programmes including product launches. It also ensures integrated career progression with the Organisation.
We further leveraged technology for efficient supply chain management through a leading industry solution for Business Intelligence and Planning. Through this solution, we are able to achieve collaborative sales and operations planning for aligning demand and supply.
As technology is taking rapid strides, driving more consumers to e-commerce, we leveraged this opportunity through launch of online ordering in FSI. Our mobile ordering application on all platforms has been received well by consumers. We are glad to report that during the year, more than a million people ordered through our online ordering platforms. Today, more than 20% of Domino’s Pizza delivery sales is actuated through the online platforms. Features such as Order Customisation, ‘Save your Order’ for reordering quickly in future, 30 minutes delivery guarantee, various payment modes, consumer feedback etc. are some of the key features that add delight to consumer’s ordering experience.
With the frequency of OLO (online ordering) increasing by the day, we also innovated our ways of interacting with our consumers, and introduced a new feature of “chat”, on web-based system enabling people interested in ordering online to chat about their order with our representative. Our web-based system also features ‘Advance ordering’ functionality which enables ordering in advance for the same day to receive the order as per convenience of the consumer and ‘Pizza Tracker’ to track the real-time status of order.
With more and more people becoming active on social media and participating increasingly in their daily interactions online, we leveraged the opportunity for strengthening our relationships with consumers. We ran several engagement initiatives on social media which included contests like ‘vote for your favourite party’ during elections, ‘bachpan ke din’ at the time of launch of Junior Joy Box, PizzaMMManiac, etc. All these initiatives have resulted in Domino’s Pizza having over 6.4 Million followers on Facebook and thereby making it one of the most engaged brand Fan page in the country. Domino’s Pizza also has more than 40,000 followers on twitter.
We also have a single national number 68886888 for Domino’s Pizza which enables our consumer to place order
demand and supply.
TECHNOLOGy IS AN INSTRuMENT THAT FACILITATES DOING THINGS BETTER, AND WE BELIEvE THAT OuR TECHNOLOGy INITIATIvES WILL MAkE OuR ORGANISATION MORE ENGAGED, MORE RESPONSIvE AND MORE LIkED. WRITING ‘TECHNOLOGy’ ON TOMORROW’S TIMELINE ENABLES uS TO BECOME THE vANGuARD OF CHANGE, WITH THE ABILITy TO kEEP AHEAD OF THE CuRvE WHEN COMPARED TO THE INDuSTRy.
Writing on Tom
orrow’s Tim
eline Strategic Review Statutory Reports Financial Statem
ents
Jubilant FoodWorks Limited 11

Contributing to society as a good corporate citizen and as concerned individuals is ingrained in our culture. We have adopted a highly systematic and participatory approach for effective stakeholder engagement which is an ongoing process and is the foundation of our CSR interventions.
With an objective to ‘Connect with the Community’, we strive to add value to the communities at large by undertaking various programmes. Some of them are:
commitment that goes beyond our tomorrows
A
1. National Road Safety Awareness Programme
Considering the fact that most of our business activities revolve around delivery, Road Safety is one of our primary focus areas. Our commitment to ‘Road Safety’ is reflected from the large plethora of social activities undertaken across the country focussing on Safe Driving.
During the National Road Safety Week, we have undertaken a National Level Road Safety Programme in 16 major cities across the country with the respective Traffic Police Authorities supporting the united Nations Action for the Decade of Road Safety.
With an aim to take this message forward, we have launched ‘Road Safety Cards’ for the dine-in guests at our restaurants to give a personalised message on road safety.
Annual Report 2013-1412

2. National Level Poster Competition on Road Safety
We had launched a National Level Poster Competition on Road Safety. The campaign received an overwhelming response and participation from various stakeholders such as schools, colleges, universities and NGOs.
• “We Care” - a beach cleaning initiative post Ganesh Immersion Ceremony
3. Inclusive Development of People with Disabilities
With an aim to provide equitable opportunity to Persons with Disabilities for their inclusive development and growth, we have initiated an Inclusive Employment Programme for PwDs called ‘SAkSHAM’. Till date, we have recruited more than 200 people, having hearing and speech impairment, across the country in our restaurants.
We are one of the first Companies in India to institutionalise the Inclusive Development of People-with-Disabilities and have developed the online training module to sensitise our employees on:
i. Workplace Sensitisation
ii. Basics of Sign Language
iii. Domino’s Buzz Words
4. A Gift of Life - An Organ Donation Drive.
5. SAHyOG Campaign - To support the flood victims.
6. Raahat Ek Abhiyaan - Woollen clothes collection drive for the needy children.
7. Building ‘Good Neighbourhood’
With zeal to ‘build good relationships with the community where we serve’, we undertook Restaurant level social initiatives:
• ‘Building Relationships and Spreading Happiness’ with orphans, people at old-age homes and other less privileged ones.
• Celebrated special days with the underprivileged people thereby sharing our happiness with them viz. Mother’s day, Children’s day, Independence day etc.
• Social campaigns at different points of time like ‘Save a Girl Child’, ‘Awareness for HIv/AIDS’ etc.
8. Environmental Stewardship
• Activities to create sensitisation on various significant campaigns on ‘Save Water’, ‘Save Environment’, ‘Reduce Pollution’.
• Go-Green Campaign - In partnership with Jaagruti, an NGO working on Paper Recycling
Recognitions, Awards and Accolades
Our effort towards CSR was also appreciated by community around us as well as print media. We also received the following recognitions and awards in this area:
• Certificate of Appreciation from Sarthak for the contribution towards ‘Inclusive Development Programme of People-with-Disabilities’
• ‘Best Contribution towards the society and environment’ Award by the Indian Development Foundation
Writing on Tom
orrow’s Tim
eline Strategic Review Statutory Reports Financial Statem
ents
Jubilant FoodWorks Limited 13

yESTERDAy’S EFFORTS CuLMINATE IN AWARDS TODAy, AND OuR EFFORTS TODAy WILL RESuLT IN ACHIEvEMENTS AND RECOGNITION TOMORROW. DuRING THE yEAR, WE WERE THE RECIPIENTS OF MANy AWARDS WHICH ARE ENuMERATED AS BELOW :
awardsWriting
on tomorrow’s timeline
5 (Five) TRRAIN (Trust for Retailers and Retail Associates of India) Retail Awards. The award is for excellence in guest services by honouring front end retail associates who have created memorable shopping experiences for their guests:
• Ms. Neha kumari Singh (Team Member, Patna) – National Silver Award and Regional Award
• Ms. Pranali Meshram (Team Member, Nagpur) and Mr. Chandan kumar Shaw (Team Member, kolkata) were declared Regional Winners
• Mr. Manu M.M. (Team Member, Calicut) won the special category - “Being Human Awards”
Awards from Domino’s International:
• Ms. uzma Ilyas Chaudhry (GM-Training & Guest Services), Trainer of the year- Asia Pacific
• Mr. kundan kumar (Guest Delight Manager, North India) Rookie Manager of the year - Asia Pacific
Mr. Rahul Puri (AvP– Information Technology), was honoured with two awards:
• The ‘Top 100 CISO Award’, given to finest CISO’s who are using information security technology in innovative ways to secure business information.
• The ‘Infosec Maestros Award’, given to the best information security leaders.
Mr. Harneet Singh Rajpal (vP Marketing- Domino’s Pizza) was featured in the A List 2013 and recognised as one of the top Marketing/Media/Advertising Professionals of India.
Mr. Dev Amritesh (President & COO - Dunkin’ Donuts) was recognised as one of the 25 best and brightest Corporate Performers under 40.
Mr. Ajay kaul (CEO-cum-Whole time Director) was listed amongst the 100 Best CEOs in India by Business Today.
Mr. Ajay kaul was honoured with ‘Outstanding CEO of the year’ award by CEO India Inc., India’s premier Lifestyle magazine, supported by Acer India and Grant Thornton.
Mr. Shyam S. Bhartia and Mr. Hari S. Bhartia were honoured with ‘Chairman’s Circle Hall of Fame’ award, the highest honour bestowed upon a franchise owner by the Domino’s International.
EMPLOyEE AWARDS
01
TOMORROW. DuRING THE yEAR, WEAWARDS WHICH ARE ENuMERATED AS
Annual Report 2013-1414
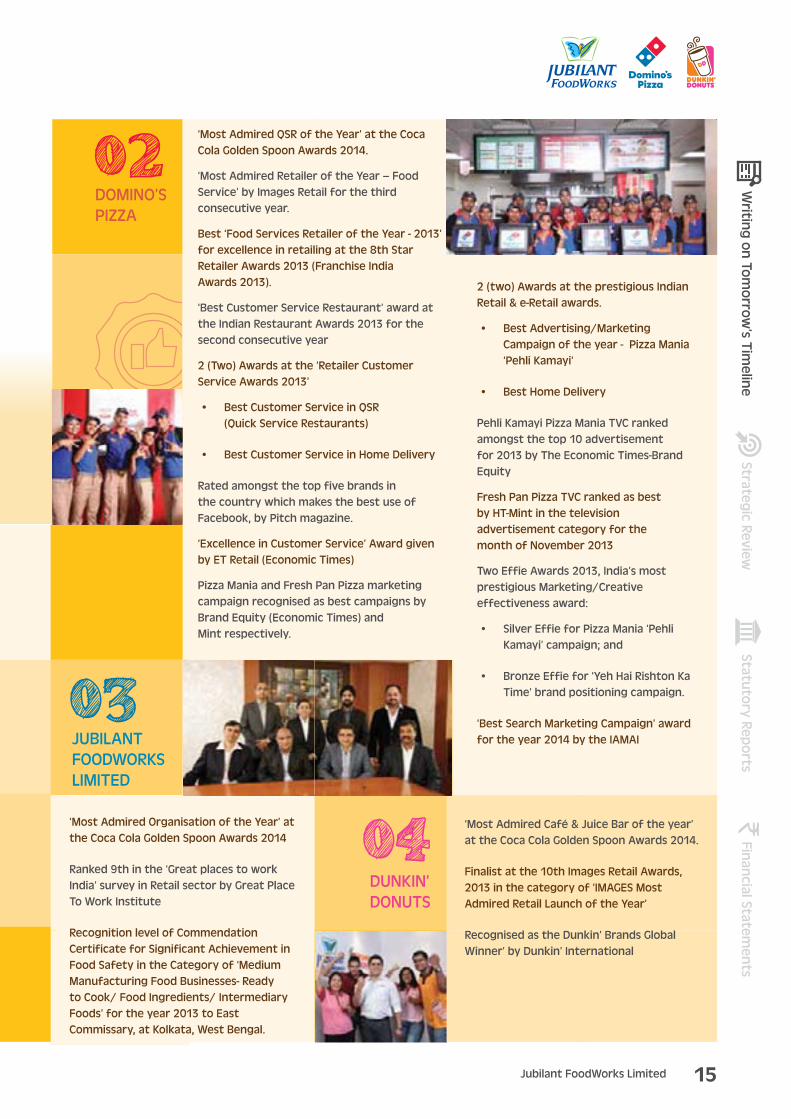
‘Most Admired Organisation of the year’ at the Coca Cola Golden Spoon Awards 2014
Ranked 9th in the ‘Great places to work India’ survey in Retail sector by Great Place To Work Institute
Recognition level of Commendation Certificate for Significant Achievement in Food Safety in the Category of ‘Medium Manufacturing Food Businesses- Ready to Cook/ Food Ingredients/ Intermediary Foods’ for the year 2013 to East Commissary, at kolkata, West Bengal.
‘Most Admired qSR of the year’ at the Coca Cola Golden Spoon Awards 2014.
‘Most Admired Retailer of the year – Food Service’ by Images Retail for the third consecutive year.
Best ‘Food Services Retailer of the year - 2013’ for excellence in retailing at the 8th Star Retailer Awards 2013 (Franchise India Awards 2013).
‘Best Customer Service Restaurant’ award at the Indian Restaurant Awards 2013 for the second consecutive year
2 (Two) Awards at the ‘Retailer Customer Service Awards 2013’
• Best Customer Service in qSR (quick Service Restaurants)
• Best Customer Service in Home Delivery
Rated amongst the top five brands in the country which makes the best use of Facebook, by Pitch magazine.
‘Excellence in Customer Service’ Award given by ET Retail (Economic Times)
Pizza Mania and Fresh Pan Pizza marketing campaign recognised as best campaigns by Brand Equity (Economic Times) and Mint respectively.
‘Most Admired Café & Juice Bar of the year’ at the Coca Cola Golden Spoon Awards 2014.
Finalist at the 10th Images Retail Awards, 2013 in the category of ‘IMAGES Most Admired Retail Launch of the year’
Recognised as the Dunkin’ Brands Global Winner’ by Dunkin’ International
JuBILANT FOODWORkS LIMITED
DuNkIN’ DONuTS
DOMINO’S PIzzA
2 (two) Awards at the prestigious Indian Retail & e-Retail awards.
• Best Advertising/Marketing Campaign of the year - Pizza Mania ‘Pehli kamayi’
• Best Home Delivery
Pehli kamayi Pizza Mania TvC ranked amongst the top 10 advertisement for 2013 by The Economic Times-Brand Equity
Fresh Pan Pizza TvC ranked as best by HT-Mint in the television advertisement category for the month of November 2013
Two Effie Awards 2013, India’s most prestigious Marketing/Creative effectiveness award:
• Silver Effie for Pizza Mania ‘Pehli kamayi’ campaign; and
• Bronze Effie for ‘yeh Hai Rishton ka Time’ brand positioning campaign.
‘Best Search Marketing Campaign’ award for the year 2014 by the IAMAI
02
03
04
Writing on Tom
orrow’s Tim
eline Strategic Review Statutory Reports Financial Statem
ents
Jubilant FoodWorks Limited 15

Particulars March 31,
2014March 31,
2013March 31,
2012March 31,
2011March 31,
2010
Total Income 17,328 14,153 10,233 6,803 4,243
Profit before Interest, Depreciation & Tax (EBITDA)
2,551 2,444 1,904 1,201 656
Add: Other Income 93 78 59 19 1
Less: Interest - 1 - 3 83
Less: Depreciation 767 547 376 293 243
Less: Exceptional Items - - 41 - -
Profit Before Tax 1,877 1,974 1,546 924 331
Provision for Taxation 619 623 490 204 1
Profit After Tax 1,258 1,351 1,056 720 330
Earnings per Share (EPS) (`) 19.3 20.7 16.3 11.2 5.5
No. of Employees 24,969 19,734 14,626 11,514 8,196
No. of Domino’s Pizza Restaurants 726 576 465 378 306
No. of Dunkin’ Donuts Restaurants 26 10 - - -
No. of Cities covered 150 123 105 90 69
System Sales Growth (%) 22 38 50 60 51
Same Store Sales Growth (%) 1.6 16.2 30 37 22
numbersWriting
on tomorrow’s timeline(` in Million, except otherwise stated)
Annual Report 2013-1416

Total Employees
March 31, 2010
March 31, 2011
March 31, 2013
March 31, 2012
March 31, 2014
8,19
6
11,5
14
14,6
26
19,7
34
24,9
69
No. of Cities covered
12390
March 31, 2010
March 31, 2011
March 31, 2013
March 31, 2012
March 31, 2014
15069 105
No. of Domino’s Pizza Restaurants
576
378
March 31, 2010
March 31, 2011
March 31, 2013
March 31, 2012
March 31, 2014
726
306
465
Total Income (` in Million)
March 31, 2010
March 31, 2011
March 31, 2013
March 31, 2012
March 31, 2014
17,3
28
4,24
3
10,2
33
6,80
3
14,15
3
Writing on Tom
orrow’s Tim
eline Strategic Review Statutory Reports Financial Statem
ents
Jubilant FoodWorks Limited 17

Annual Report 2013-1418
Dear Shareholders,
Greetings from the JFL team!
Growth and expansion have been part of our agenda and core to our continual process of planning since inception. The year in review presented us a choice – one that was actuated by the economic circumstances, and other that was incited by our self-belief.
We believed that the unfavourable business circumstances were temporary and we acted according to our self-belief and persisted with our expansion plan. We remained stead fastly committed to our vision to be the largest and most successful organisation in the Food Service Industry.
OuR STRATEGIC INTENT IN TOMORROW’S MARkETS
We believe that tomorrow’s markets will include those in which we have an established presence, as well as new markets. keeping this in mind, we focussed on two strategic areas of expansion for both of our brands, Domino’s Pizza and Dunkin’ Donuts. To strengthen presence in existing markets through deepening penetration, increasing the consumer loyalty and ordering frequency and to cater to new and emerging markets in Tier II, III and Iv cities, which provided us with a ready consumer base.
CHAIRMEN’S MESSAGE
timeline
Writing on
tomorrow’s
Annual Report 2013-1418

Jubilant FoodWorks Limited 19
On one hand, therefore, we worked on brand promotions as well as tactical activation to drive consumer engagement and loyalty towards our brands, while in the new markets, the target was to attract new consumers to the taste, flavours and convenience of our offerings.
INvESTING IN INFRASTRuCTuRE FOR HIGHER CAPACITIES
With our growing network of restaurants, it was essential to have a robust infrastructure to support them and ensure that there is no shortfall between demand and supply. Hence, we also invested in strengthening and expanding our manufacturing locations/commissaries to make ourselves future ready and well equipped to cater to a larger consumer base.
During the year, we commenced construction of three new manufacturing locations/commissaries and are in the process of relocating our Noida commissary to a larger premise.
ExTENDING OuR MENu FOR TOMORROW’S CONSuMERS
Cognizant of the fact that food consumption is not restricted to lunch and dinner, we diversified our menu that offers more choice, while catering to all-day part brand relevance. At Domino’s Pizza, we offered three new side products, apart from Fresh Pan Pizza, in a segment that is fast increasing its proportion in terms of our total sales.
At Dunkin’ Donuts, we launched new offerings with a higher degree of culinary experience and a gourmet touch, focussing on the urban youth consumer through new ‘Get your Mojo Back’ positioning. We complemented this by strengthening our all-day part menu through the launch of burgers and wraps.
AMPLIFyING OuR TECHNOLOGICAL EDGE FOR TOMORROW’S GROWTH
Technology, as you are all aware, positively impacts not just operations but also marketing and communications outreach. Steered by this belief, Domino’s Pizza has consistently leveraged technology to enrich consumer experience and engagement through online / mobile ordering. Further, our initiatives on social media had far reaching impact and strengthened our consumer connect.
This consumer connect has garnered dividends to the Company, with an increase in percentage of our orders coming from technology-enabled ordering formats.
REvAMPING OuR RESTAuRANT DESIGN FOR TOMORROW’S CONSuMER ExPECTATIONS
Every initiative that we undertake has an underlying commonality of purpose- delighting our consumers and increasing consumer loyalty. To further this agenda during the year, we adopted the ‘Pizza Theatre’ design which has been gaining popularity in Domino’s World. This restaurant design has one of its kind of open kitchen, which enables our consumers to enjoy Pizza making. At Dunkin’ Donuts also, our restaurant design was refreshed to reflect new brand positioning, ‘Get your Mojo Back’.
BuILDING OuR PEOPLE CAPABILITIES FOR TOMORROW’S PROGRESS
With approximately 25,000 people aligned with the organisation working towards its success, we are a people- oriented business. Our people have always been at the centrestage of our growth strategy and we believe that they are key drivers for our progress.
We continue to invest in increasing their capabilities through targeted programmes and functional skill training, enabling our people to acquire and hone specific skill sets. Strategy Leader Programmes, Platinum members training, etc. are some of the programmes aimed towards making our people ready for next level. With our continued expansion, we are constantly recruiting people and are perpetually streamlining their on-boarding and training process.
WITH APPROxIMATELy
25,000PEOPLE ALIGNED WITH THE ORGANISATION, WE ARE A PEOPLE-ORIENTED BuSINESS.
Writing on Tom
orrow’s Tim
eline Strategic Review Statutory Reports Financial Statem
ents
xIMATELy IMATELy IMATEL
25,000ALIGNED WITH
ORGANISATION
Statutory Reports Financial Statements
Jubilant FoodWorks Limited 19

REPORTING FINANCIAL PERFORMANCE
During the year, our total income increased from ` 14,076 Million in Fy2013 to ` 17,328 Million in Fy2014. Our EBITDA increased from ` 2,444 Million to ` 2,551 Million, while our PAT was ` 1,258 Million. Our Same Restaurant Sales growth for the year remained subdued at 1.6% which was attributable to the challenging macro-economic environment resulting in reduced discretionary spends by consumers coupled with high inflation.
During the year, we added 150 Domino’s Pizza Restaurants and 16 Dunkin’ Donuts Restaurants increasing our reach and penetration for our consumers. We have confidence in
the potential of the Indian market, and by adhering to our high standards for business, we are confident that with an expected upturn in the macro economic environment, we will deliver improved performance numbers.
On a concluding note, we would like to say that today we are investing in our infrastructure, our product offerings, our consumer connect, our technology and our people to make our tomorrow better. We believe that we are preparing ourselves to be future ready and we shall emerge larger, more connected and stronger organisation. We would like to take this opportunity to thank our shareholders, our Board members, our managers and our team for their support and efforts during the year.
Thank you and best wishes.
Shyam S. Bhartia Chairman & Director
Hari S. Bhartia Co-Chairman & Director
AT DuNkIN’ DONuTS ALSO, OuR RESTAuRANT DESIGN WAS REFRESHED TO REFLECT NEW BRAND POSITIONING, ‘GET yOuR MOJO BACk’.
WE TAkE TO TOMORROW WITH GREAT CONFIDENCE WHICH WE DRAW FROM OuR FIRM BELIEF IN OuR CORE vALuES, THE IMMENSE POTENTIAL IN THE FOOD SERvICE INDuSTRy AND OuR LEADERSHIP STATuRE IN LINE OF BuSINESS. THERE IS MERIT IN CREATING A RESTAuRANT ENvIRONMENT THAT WILL CONNECT EMOTIONALLy WITH THE CONSuMER AND IN AuGMENTING OuR ALREADy ROBuST BACk-END SuPPLy CHAIN SySTEM IN ORDER TO CATER TO THE ExPANSION.
Annual Report 2013-1420

Writing on Tom
orrow’s Tim
eline Strategic Review Statutory Reports Financial Statem
ents
Board of Directors
Standing from left to right :
Mr. Ajay kaul (CEO-cum-Whole Time Director), Mr. Phiroz vandrevala (Independent Director),Mr. vishal Marwaha (Independent Director), Mr. Arun Seth (Independent Director)
Sitting from left to right :
Mr. Hari S. Bhartia (Co-Chairman & Director), Mr. Shyam S. Bhartia (Chairman & Director),Ms. Ramni Nirula (Independent Director)
Jubilant FoodWorks Limited 21

Annual Report 2013-1422
Management Discussion & Analysis
ECONOMIC OVERVIEW
A multitude of external and domestic factors kept Indian economic growth at sub-5% levels, for the second consecutive year in FY2014. On the back of a high fiscal deficit and inflation reigning above 10% during the first three quarters of the fiscal, both consumption and business sentiment remained subdued. Further, exchange rate pressures and external sector vulnerability led to tightening of domestic monetary policy and a clamp-down on outbound investment by both corporate and individuals. Project delays, which arose partly due to executive inaction and partly due to the exigent investment circumstances, resulted in stagnation and a precarious employment scenario.
All these factors impacted business investment decisions as well as disposable and discretionary income in the hands of the consumer, and resulted in a GDP growth of 4.74% (estimated) for FY2014. This was a marginal improvement over the growth of 4.47% posted in FY2013, but still far below the growth rates witnessed earlier in the decade.
Nevertheless, the tide appears to be turning. The latter half of FY2014 saw some improvement in economic indicators, including the current account deficit and inflation, and some pick-up in project clearances. The sweeping victory of the new government could, however, prove to be the game changer. It has boosted business and consumer confidence, as investors and consumers pin their hopes on the winds of change.
All things considered, estimates of future growth by domestic and international institutions are relatively positive. While the RBI and CSO real GDP growth targets fluctuate around 5.5% for FY2015, the IMF and the World Bank have projected that economic growth will pick up to 5.4% and 5.7%, respectively.
INDUSTRY STRUCTURE & OVERVIEW
Food Services Industry
The Indian Food Services Industry (FSI) thrives on growth of disposable and discretionary income. In the context of lower income growth and higher inflation which led to reduced disposable and discretionary income, FSI witnessed slowdown in FY2014. The FSI sector reeled under subdued sales as market growth was severely impacted for a large part of FY2014, mainly in the latter half.
Looking forward to FY2015, in the context of predicted improvement in GDP growth and policy efforts for lowering of inflation, FSI is expected to come back on growth path. As per Euromonitor data published in 2014, FSI is expected to grow at a Compounded Annual Growth Rate (CAGR) of 10.3% to ` 9,17,357 Crore by FY2018 from the size of ` 5,62,780 Crore in FY2013.
Based, on our analysis of above data, we believe that the share of organised or chained FSI is likely to grow to 39% from the current share of 30%. The organised FSI will increase at a 16% CAGR to ` 3,57,770 Crore in FY2018 from ` 1,68,830 Crore in FY2013.
Quick Service Restaurant (QSR) market
A younger population, coupled with high rate of urbanisation and disposable income, is inspiring adoption of new culinary habits. Increased participation of women in the workforce and exposure to Western lifestyle are further enabling the creation of more occasions to eat out. The focus is increasingly on fresh and easy to choose menu, with pizzas, burgers and sandwiches, rather than making the food heavier by going the traditional way. This has led to the emergence of QSR as the fastest growing market, along with the casual dining segment.
The QSR growth is further being boosted by greater accessibility and adaptation to the taste, pricing and service level expectations of the Indian consumer. Most international brands in the Indian market are localising their menu to the Indian palette. Further, QSR chains are running deeper promotions in a bid to lure consumers with a wider range of items and price options. Facebook, Twitter and other social media promotions have become a key in creating a success story for this segment.
QSR chains are giving strong competition to the other FSI segments, not just within the metro and mini metro cities but also in Tier I, II, III cities, which are expected to be major drivers of QSR growth in the future.
As per Euromonitor data published in FY2014, the QSR segment in India is projected to grow at a CAGR of 20.5% to ̀ 33,050 Crore in FY2018 from ` 13,010 Crore in FY2013. The QSR segment is the fastest growing segment across FSI. As per Euromonitor data, Domino’s Pizza is the largest QSR brand by Sales figures in FY2013.
In an effort to benefit from the QSR growth story, several international food chains have announced plans to enter the Indian market. Further, existing players have also paced up their expansion plans in India. This would intensify the competition within organised FSI as it provides wider range of products to consumers enticing them to shift from home food or unorganised FSI towards organised FSI.
GROWTH DRIVERS
The Indian Food Services Industry (FSI) has witnessed healthy growth in recent years and is set for greater traction, moving forward. Multiple factors continue to fuel consumption for FSI in India.

Jubilant FoodWorks Limited 23
Writing on Tom
orrow’s Tim
eline Strategic Review Statutory Reports Financial Statem
ents
Favourable Demographics
• India is currently second most populous country, with 17% of world’s population; expected to become most populous by FY2030
• More than 50% of India’s current population is below the age of 25 years and over 65% below the age of 35 years (IMF)
• By FY2020, India is likely to become the world’s youngest country, with 64% of its population in the working age group
India’s young and growing population demographics augur well for growth in consumption for many years to come.
Growing Urbanisation
• Continuing consumer shift from rural to urban India
• Urban population constitutes more than 30% of total populace, growing at around 2.45% compared to rural population growth of 0.7%
• Strong growth evident in Tier II & III cities
Faster growth of urban population will provide greater incentives and opportunities for brands to penetrate the Tier II & III cities.
Changing Consumer Lifestyle
• Rise in income levels, greater preference to education & rapid industrialisation leading to fast-paced change in consumer lifestyle in India
• Rise in nuclear families & hectic work schedules pushing consumers towards shopping malls, leisure facilities, convenience and easy accessibility
• Large youth population leading to behavioural change in food consumption pattern in favour of QSRs / FSI
• Influence of Western culture causing shift in consumer preference from traditional pattern of dining out only on weekends to even weekdays
As a result of this shift, the Indian consumer is now more willing to experiment with the various delicacies offered from all over the world.
Growing E-commerce
• Currently, India has more than 160 Million Internet users, of which 86 Million access Internet using their mobile devices
Favourable Demographics
Growing Urbanisation
Growing E-Commerce
Changing Consumer Lifestyle
Transport Infrastructure Development
Increasing penetration of Organised Retail and
International Brands
• There are more than 36 Million smartphone users, with 22 Million active users of 3G connection
• Number expected to grow further with increasing penetration of Internet and also with the advent of 4G in India
• Already, many brands are using the e-commerce platform for delivering products and also provide incentives to consumers to buy online
Going forward, e-commerce will become an important platform for growth of the food services market as in the case of many developed Western markets.
Increasing penetration of Organised Retail and International Brands
• Organised retail constitutes 8% of total retail in India
• Huge potential still remains for organised retail to grow further, considering that countries like China have 30%+ organised retail penetration
• Malls have redefined the way people shop and have changed the retail landscape of India, with FSI being a major consumption driver for malls
• Growth of organised retail has led to expansion of international brands in India
Global brands have been successful in adapting to the local tastes of the Indian consumer and continue to penetrate the Indian market. Along with the growth of mall culture and organised retail, FSI is also expected to grow.
Transport Infrastructure Development
• Urbanisation & growth of retail space leading to development of modern airports, metros etc. in India
• These high people density areas also attract demand for food services and are emerging as important avenues for FSI growth
• These transit locations further help in generating business 24×7 in comparison to other locations which are open only for 10-12 hours
Several food services chains are tapping this opportunity and are opening their outlets in these locations.
BUSINESS OVERVIEW
Jubilant FoodWorks Limited (JFL/Company) is part of Jubilant Bhartia group and India’s largest food service company. The Company is the master franchisee of Domino’s Pizza brand in India, Sri Lanka, Bangladesh and Nepal. At present, it operates in India and through its subsidiary, in Sri Lanka. The Company also has exclusive rights for developing and operating Dunkin’ Donuts Restaurants for India.

Annual Report 2013-1424
Domino’s Pizza, U.S., founded in 1960, is the recognised world leader in Pizza delivery and Dunkin’ Donuts, U.S., founded in 1950, is the world’s leading baked goods and coffee chain. Both the brands have a global network of more than 11,000 restaurants each as on date.
JFL continued its strong future-focussed growth strategy despite the challenging macro-economic environment. The Company scaled up its investments during FY2014, strategically aimed at preparing JFL to capitalise on the long-term growth opportunity in Indian FSI. It further deepened the brand association for both, Domino’s Pizza and Dunkin’ Donuts, targeting a greater consumer connect.
The Company leveraged its strengths during the year to sustain its momentum to maintain its position as the largest MNC QSR chain in India. It remained focussed on building operational excellence and efficiencies as well as customisation of its product offerings and supply chain dynamics to suit the Indian conditions.
As the exciting story unfolded through the year, the Company successfully redefined consumer experience with a whole new gamut of innovative menu offerings through more touch points
Expanding Infrastructure across Domino’s Pizza & Dunkin’ Donuts
During the year, JFL made higher investments in building the infrastructure necessary to meet the future requirements. While expanding and strengthening the existing manufacturing locations / commissaries – Noida, Mohali, Mumbai, Kolkata and Bengaluru, the Company commenced work on three new commissaries, namely Hyderabad, Nagpur and Guwahati. The existing Noida commissary is also being planned to be relocated to a bigger space at a state-of-the-art facility in Greater Noida.
Also, the manufacturing locations / commissaries at Mohali and Mumbai are catering to both Domino’s Pizza and Dunkin’ Donuts which delivers an advantage to the Company to effectively utilise the infrastructure.
New Commissaries
Large Size Commissary Greater NoidaMid-Size Commissaries Hyderabad, NagpurSmall Size Commissary Guwahati
Existing manufacturing locations / Commissaries
Large Size Commissary MumbaiMid-Size Commissaries Noida (2), Mohali,
Kolkata, Bengaluru
The Company is continually innovating to grow the scale and coverage of all its existing manufacturing locations /
commissaries to help support the growth it foresees over the next few years.
Domino’s Pizza India
Over the last 18 years, Domino’s Pizza India (DPI) has played a key role in building the organised pizza market in India. Backed by strong business fundamentals, consumer pulse understanding and investment in support infrastructure like people and commissaries, DPI has been able to create a robust organisation in Indian FSI.
DPI is the leader in the organised chain pizza market in India with 70%+ share (as per Euromonitor data published in 2014). DPI has become the 2nd largest country outside the US in Domino’s global network, in terms of number of restaurants, and has remained one of the fastest growing markets in the Domino’s world for the 7th consecutive year.
Expanding footprints
Cognizant of the immense long-term potential for QSR growth in India, the Company made significant investments in increasing the geographical footprints of Domino’s Pizza brand.
• The DPI Restaurant network in the country comprised 726 restaurants as on March 31, 2014 (749 restaurants as on May 19, 2014)
■ DPI crossed the 600th restaurant milestone during the year with the launch of its first Pizza Theatre at Vasant Kunj, New Delhi in August 2013
■ Crossed 700th mark with its restaurant in Gurgaon in March 2014
• Present in 150 cities, as on March 31, 2014 (152 cities as on May 19, 2014). A total of 27 new cities were added to DPI footprint during FY2014
• Present in 23 states and 5 Union Territories as on March 31, 2014. Entry into two new Union Territories during the year, viz. Dadra & Nagar Haveli and Puducherry
Expanding footprints
Expanding horizons to
build the platform for
future growth
Expanding marketing strategies
Expanding technology utilisation
Expanding product
offerings
Expanding business model

Jubilant FoodWorks Limited 25
Writing on Tom
orrow’s Tim
eline Strategic Review Statutory Reports Financial Statem
ents
ExPANDING FOOTPRINTS
Bhiwadi(Rajasthan)
Manesar(Haryana)
Limbdi (Gujarat)
Silvassa(Dadra And
Nagar Haveli)
Amravati (Maharashtra)
Karad & Baramati
(Maharashtra)
Aligarh (UP)
Nainital &Haldwani (Uttarakhand)
Rangpo (Sikkim)
Mathura (UP)Khanna &
Hoshiarpur(Punjab)
Katra (Jammu & Kashmir)
Dharamshala (HP)
Korba & Durg (Chhattisgarh)Cuttack (Odisha)
Rajnandgaon (Chhattisgarh)
Rajahmundry (AP)
Vellore & Hosur (Tamil Nadu)
Puducherry (Tamil Nadu)
Erode (Tamil Nadu)
Belgaum (Karnataka)
Davangere (Karnataka)
New Cities entered into by Domino’s Pizza during FY2014
Map not to scale

Annual Report 2013-1426
With an eye on the future, DPI remained firmly on its growth track, with expansion into new markets and also building on its infrastructure with the aim of leveraging the future potential in FSI.
Expanding Marketing Strategies
Novel marketing and promotional activities augmented DPI’s innovation strength, endorsing consumer confidence through greater choice across different products and price points and assured delivery on its promises.
The promotional campaigns encompassed on-ground activation and media advertising. With a focus on the new positioning of ‘Yeh Hai Rishton Ka Time’, ‘Pehli Kamayi’ campaign was rolled out, offering the perfect way to celebrate small moments of joy with family and friends. The campaign was built on the euphoria around celebrating one’s first salary with loved ones, with Domino’s Pizza Mania.
The promotional campaigns also extended to the regional level in the language of the people, thereby entrenching the Domino’s Pizza flavour firmly in their minds and hearts.
DPI also came out with a series of exciting innovative and promotional offers to drive sales. These special offers helped boost sales by bringing in new guests and encouraging repeat orders. On an intangible level, these helped enhance guest loyalty and drove guest retention in these times of reduced consumer spends.
Expanding Product offerings
Exciting and novel menu offerings have always been the essence of the Company’s innovation thrust. DPI’s growth story has been marked by innovations, developed through detailed and periodic analysis of consumer insights and translating them into new value-added products.
• The Fresh Pan Pizza (baked fresh to order in a pan, amasingly soft, crunchy, buttery and extra cheesy) added a zing to the Company’s menu range;
• Delicious Calzone Pizza Pockets (soft, juicy and spicy pockets filled with paneer, red paprika, onion and capsicum, rolled over a cheesy layer and hot sauce) brought in a flavour of new excitement to relationship with its communication message of ‘Rishton ko phir se thoda spicy thoda juicy banate hain’;
• Exotic Lebanese rolls (spicy vegetarian or juicy chicken roll wrapped into a soft crust with Lebanese seasoning) brought in a tantalising Middle Eastern flavour;
• The launch campaign ‘Yeh Chatakedaar, Banaye Company Mazedaar’ highlighted celebration of ‘spicy’ moments with friends;
• Spicy Baked Chicken (juicy baked chicken drumsticks, tossed in exotic spicy seasoning) tantalised the taste buds of the consumers
All of our new products were aimed at creating new occasions for ordering from Domino’s Pizza. The three new side products have been successful in fortifying the all-day part menu of DPI. DPI also expanded its menu to engage kids through kid-parent bonding and developing products (pizzas and side products) suitable for their tastes, as initiated by Junior’s JoyBox launch.
Expanding Business Model
Pizza Theatre is an embodiment of truly living ‘yeh hai rishton ka time’ positioning of Domino’s Pizza
With focus on enhancing consumer experience, the Company is continually innovating on its operational model through different and more exciting restaurant design and formats.
During the year, DPI adopted the ‘Pizza Theatre’ design – a new global Domino’s Pizza Restaurant design. The design enhances the consumer engagement and experience by having a one of its kind open display kitchen and restaurant layout in the QSR category. Open Kitchen provides an opportunity to our consumers to enjoy the view of Pizza making and also gives them confidence about proper level of hygiene and standard processes followed by the Brand.
These restaurants have flexible seating i.e. soft seating for family, high stools for youngsters, long tables for large groups of family and friends. These restaurants also have a heritage wall that depicts the evolution of Domino’s Pizza from the first restaurant to the logo and how it became favourite of millions of consumers. It also showcases the passion for Pizza Making by highlighting efforts in making and delivering a pizza - “Pizza Perfection a synonym to Domino’s Pizza”. The wall also highlights consumer focus and innovation which has made Domino’s a global brand by bringing convenience to consumers - Delivery Expertise depicted by the first delivery car and industry’s first innovation – “30 minutes or Free Delivery”.
Of the total restaurants opened in FY2014, 69 restaurants were on Pizza Theatre design. Going forward, DPI plans to open all new restaurants on this design.
As a part of innovation in the restaurant format, DPI also introduced new flexi restaurant format during the year in form of a small kiosk. The kiosk is an additional order- taking station around high footfall areas. The orders from these kiosks are served by nearby restaurants. This format is in the initial stages of experimentation for viability and sustainability.
Expanding Technology Utilisation
Leveraging the fast-paced technological transformations, technology and infrastructure upgradation has become the backbone of DPI’s operational model.

Jubilant FoodWorks Limited 27
Writing on Tom
orrow’s Tim
eline Strategic Review Statutory Reports Financial Statem
ents
Online and mobile ordering process is being continuously upgraded to ensure high levels of accessibility for consumers. Availability of mobile application on multiple platforms enables better reach and convenience for consumers to order online.
Online ordering (OLO) got a major push during the year on the back of exciting offers. The success of the mobile app and online ordering facilities can be gauged from the following facts:
• Mobile ordering apps have seen over 1.8 Million downloads since inception
• Online ordering platforms contributes to around 20% to the overall delivery sales
• Mobile ordering sales contribution to overall OLO is around 20%
With online ordering being developed as a growth engine for future and mobile ordering being the latest front of consumer connect and its quick success, the whole digital strategy is working quite well.
Domino’s Pizza - Sri Lanka
Domino’s Pizza operations in Sri Lanka have witnessed a moderate growth, with the number of Domino’s Pizza Restaurants going up from 6 (six) in FY2013 to 11 (eleven) in FY2014.
The consumer awareness and preference for the brand has improved as a result of strategic marketing communications and activities carried out aggressively alongside Sri Lankan Cricket.
However, the overall prevailing environment in the country and increase in competition has resulted in impact on the growth of sales, nonetheless, the Company is looking at replicating successful learnings from Indian operations to drive the growth momentum and build Domino’s brand in Sri Lanka.
The Company plans to focus more on promoting Domino’s Pizza business in the region.
Dunkin’ Donuts India
Creating a buzz
Aiming to strengthen Dunkin’ Donuts position in the sweet spot between the QSR and the Café markets, and targeted at the urban youth consumer, Dunkin’ Donuts India (DD) launched a new positioning for the brand during the year. The campaign, `Get Your Mojo Back’, is inspired by the rapid evolution of the discerning urban youth, as is evident from Company research. The new positioning reflects DD’s strong desire to give the consumers a unique, new offering that seeks to re-activate their lives, adding a new excitement quotient that helps them break away from the programmed nature of their lives.
The brand positioning was brought alive amongst the target consumers through conceptual product development and “storytelling” advertising. DD launched new, more evolved product offerings that drove its new positioning ‘Get Your Mojo Back’ and were designed to resonate with the target consumer’s sensibilities. The new menu offerings, including Tough Guy burger, Stirr’accino Coffee, Death by Chocolate Donut and Alive by Chocolate Donut, were aligned to the new positioning.
FY2014 also saw new product launches like Dunkaccino – the ice blended coffee range and a range of veg and non-veg burgers. The veg range includes Potato Hash Brown Burger, Spicy Veg Burger and Chef’s Special Veg Burger. The non-veg range includes Classic Chicken Burger, Smoked Chicken Burger, Pepper Chicken Burger and the Heaven Can Wait Chicken Burger.
While matching the pace of the evolving consumer needs in the challenging environment, DD added further excitement by introducing salads and expanding the range of burgers with the new Corn & Cheese Burger and the Classic Mutton Burger. The recent addition of a range of wraps and ice teas to the menu, in May 2014, have proved extremely popular with the consumers.
Festival seasonal offerings, such as Diwali-Dunkin’ Donuts Premium Gift Pack, added a new twist to the consumers’ festive celebrations. The collection consisted of a delightful array of donuts that included Dark Chocolate Truffle, Very Very Blueberry, Alive by Chocolate, Classic Coffee, Chocolate Hazelnuts, Fresh Cherry Tart, Mandarin Chocolate Orange and Coconut Ganache Fills.
All the new product offerings have the distinction of being more complex, with a strong element of excitement and virtually gourmet like values, seeking to indulge and pamper the consumers.
In line with the overall expansion strategy for the brand, 16 new DD Restaurants were successfully opened during the fiscal under review, as a result of which the total number of restaurant stood at 26 as on March 31, 2014. DD’s foray outside the NCR kick-started with Chandigarh in Punjab and Dehradun in Uttarakhand and went on to open restaurants in Jalandhar, Ludhiana, Amritsar and Patiala. In May 2014,
New Positioning
New Restaurants
Product Innovation
Get Your Mojo Back!
Expansion into new regions
Drive brand positioning and build consumer base

Annual Report 2013-1428
Mumbai marked another important milestone in the
geographical expansion of Dunkin’ Donuts, which marks its foray
in western India, thereby taking the total restaurant count to 29
as on May 19, 2014.
With new promotional initiatives and more menu offerings,
Business Strengths
JFL’s business strengths, founded on its brand legacy and focussed strategy, continued to drive efficiencies and growth during the year.
Brand legacy • Both Domino’s Pizza and Dunkin’ Donuts are well-established international brands with global appeal that is attractive for the Indian consumers
Integrated supply chain • The entire value chain – from sourcing of raw material to their manufacturing and delivery to restaurants – is standardised and centralised resulting in efficient supply chain management
• Raw materials are sourced from quality vendors and delivery is done through dedicated cold chain trucks
• Since manufacturing locations / commissaries are strategically located across different regions, time to market is minimised and supply chain costs are optimised
Innovative offerings • Product innovation is a strong growth driver for both, DPI and DD, as both the brands continue to introduce innovative and new products based on strong consumer insights which resonate well with Indian palate
Well-planned marketing strategy
• Planned Marketing strategy for strong consumer connect aligned to consumer needs and aspirations
• Effective advertising campaigns for strengthening Brand positioning
• High engagement levels with consumers for enhanced convenience and experience
Healthy cost efficiencies • Continuous efforts to improve cost efficiencies through cost consciousness culture, strategic initiatives across the organisation like Six Sigma, suggestions from employees on process improvement and cost savings through Sankalp programme
• Structured process of identifying new restaurant locations resulting in high ROI and reduced pay-back period
Operational excellence • Running one of the most efficient and disciplined set-ups in Domino’s and Dunkin’ networks
• Strong eye on details in restaurant operations and cost management to drive unit level profitability
• Continuous improvement of processes through use of new technology and eliminating non-value adding activities
People focus • People-centric policies for driving greater employee engagement and strengthening employee motivation and passion
• Regular investments in training to hone specific skill sets
• Employee growth programmes for developing diverse talent pipelines and creating future leaders
High-end technology • Integrated scalable IT system to support rapid business growth with continued focus on technological innovation
• Leveraging new technology for enhancing consumer experience and engagement like Online & Mobile ordering and social connect on digital medium
the thrust shall be on further strengthening the new positioning
and continued expansion into new regions.
The new Dunkin’ Donuts campaign evolved around the
positioning of ‘Get Your Mojo Back’, and focussed on the
urban youth consumer and the young adult.

Jubilant FoodWorks Limited 29
Writing on Tom
orrow’s Tim
eline Strategic Review Statutory Reports Financial Statem
ents
FINANCIAL REVIEW - Standalone Financials
Total Income
In the difficult backdrop of a muted economic environment, where both internal and external challenges impacted discretionary spending and dampened consumer sentiments, the Company sustained its track record of growth, albeit at a slower pace. The total income for the 12-month period ending March 31, 2014 stood at ` 17,328 Million as against ` 14,153 Million for the same period in FY2013, which represents an increase of 22.4%. The growth was a combination of the exciting and innovative new product launches, a completely new exciting restaurant design – Pizza Theatre, and the continued Domino’s Pizza Restaurant expansion which crossed the 700 mark milestone. The new positioning of Dunkin’ Donuts targeting the discerning urban youth, the contemporary restaurant designs and the new, indulgent menu items have placed the brand on the path to better performance.
The subdued external environment also resulted in moderation of Domino’s Pizza Same Restaurant Sales Growth (SSG) from 16.2% in FY2013 to 1.6% in FY2014. The moderation is measured against the higher base due to the fast-paced growth witnessed year-on-year since FY2010, and in the context of the overall economic scenario which was driven by cautious consumer spends.
Total Expenditure
For FY2014, the Total Expenditure stood at ` 15,451 Million as against ` 12,179 Million in the previous year. The increase is a reflection of the continued scale of operations as new restaurants were opened and, importantly, the external inflationary pressures which impacted not only the raw material costs but overall costs, higher advertising and marketing expenditure to attract and engage the consumers. The expenses also reflect the overall branding, marketing, new product innovations and promotional spends to position Dunkin’ Donuts in a new category and opening of new restaurants during the year.
The total raw material and provisions consumed, which includes basic ingredients such as cheese, chicken and other raw materials used in preparing food products, was ` 4,487 Million in FY2014 as against ` 3,670 Million in FY2013. The raw material expenditure reflects the increased operations of both Domino’s Pizza and Dunkin’ Donuts as well as inflation. The food costs also increased due to promotional activities, such as “buy one get one” offers, during the year.
The country has been battling a prolonged spell of high inflation, and over the past two years, while economic growth has dropped to nearly half (below 5%), retail inflation has averaged closer to 10%. While inflation climbed down with the cooling in vegetable prices in the last quarter of FY2014 and raised hopes of breaking out of the high inflation spell, the unseasonal hail
and heavy rains in parts of the country damaged crops and pushed up food prices again.
The Company’s total employee strength, working in restaurants, manufacturing locations/commissaries and offices stood at 24,969 as on March 31, 2014, against nearly 20,000 on same date in the previous fiscal. The augmented employee base is a reflection of the expanding scale of operations and the continued investment in training and employee engagement programmes. The personnel expenses and employees costs stood at ` 3,369 Million for the full year of FY2014 as against ` 2,692 Million for FY2013. The increase can be attributed to wage hikes and recruitment of more employees to meet the requirements of the newly opened restaurants.
Manufacturing and Other Expenses for FY2014 stood at ` 6,828 Million in FY2014 as against ` 5,270 Million in FY2013. This expenditure head includes rental expenses, power and fuel costs, cost of packaging, franchisee fees, advertisement and publicity expenses, as also administrative expenses. The increase also represents the general price escalation due to overall general inflation and increase in number of restaurants.
It also represents the continued advertising and marketing expenditure to build mass market awareness and leverage the consumer’s familiarity of the product with new product extensions which have a mass appeal. The Company is also using the cultural and local insights to develop new variety of local pizzas and also continues to expand occasions for ordering pizza like birthdays, etc., which drive promotional expenditure.
EBITDA
EBITDA for FY2014 moderated to ` 2,551 Million as against ` 2,444 Million in the corresponding period last year. EBITDA margin recorded was 14.8% as against 17.4% in FY2013. The combination of high inflation and decline in SSG impacted the margins. However, the strong robust cost optimisation processes which are in-built in the systems, strong thrust on technology in the core business (of online ordering and also training of staff) to promote higher efficiency will help prevent any deep slide. The initial year of establishing the Dunkin’ Donuts brand and its new restaurants also reflects in the EBITDA performance.
Profitability
Profit Before Tax (PBT) for FY2014 was ` 1,877 Million as compared to ` 1,974 Million in FY2013, representing a decline of 4.9% over the previous fiscal. Profit After Tax (PAT) for FY2014 was ` 1,258 Million as against ` 1,351 Million for the same period in FY2013, reflecting a degrowth of 6.9%.
The profitability of the Company was impacted due to the external economic environment which resulted in lower discretionary spends impacting sales growth. Further, the surcharge on income tax had increased during the year, which

Annual Report 2013-1430
led to higher tax provision/cost. The Company retained its focus on cost optimisation practices to protect the operating margins and to derive sustainable profitability in the backdrop of overall softening of demand. The Company believes this is a short-term phase and the core fundamentals of a solid business foundation remains intact, and hence the focus during the year was on strengthening foundation for tomorrow.
RISK REVIEW
The Company recognises the importance of identifying and actively managing the full range of financial and non-financial risks facing the business. The aim of the Company’s risk management is to create awareness of applicable risks and consequently limit, control and manage them, while safeguarding business opportunities and strengthening profitability. The Company believes that risks that are well managed can create opportunities, whereas risks that are not managed or incorrectly managed could lead to financial losses and reputation loss.
Through its well formulated strategy, the Company ensures that the risk exposure remains at the defined
appropriate levels, while the overall management of
the risks is integrated and embedded in the everyday
business operations and activities.
Risk management is adequately supported by Internal
Assessment teams which review risks periodically.
The core risk management structure is controlled by the Risk
Management Committee that ensures operations are carried out
as per standard procedure and any deviations are measured and
accounted for and controlled in an efficient manner. Structured
risk assessments are integrated in projects, business planning,
performance monitoring processes, common processes and
system implementations. Risk Management and Control Systems
are subject to continuous review and adaptations in order to
remain in balance with the Company’s growing business size and
changes in its risk profile.
The following are some of the key risks as perceived by
the Company:
Risk Risk Review Risk Mitigation
Economic Uncertainty
External environment and uncertainty in the economic climate impacts consumer discretionary spending and therefore can impact business
Strong business fundamentals, pan India footprint, brand influence through innovative products and marketing and leveraging e-commerce and m-commerce model
Inflation Food inflation is a concern for the economy and especially for the Food Services Industry. Consumer inflation also penetrates through all other costs apart from increase in employee cost
Continuous process of cost optimisation, improvising operational efficiencies, developing business partners working in sync with planned growth strategy and utilising Six sigma for cost efficiencies
Competition Expanding presence of renowned brands in the organised sector
Rapid pan India expansion, insight on developing products that appeal to the Indian palette, innovative product offerings, diverse choice of products across different price points and building strong consumer connect
Trained Manpower
Lack of availability of healthy mix of people who are quick to adapt and aligned with the organisational philosophy
Well established and technology-driven training infrastructure and programmes, great working place for employees and rated as one of the best employers in the industry by reputed agencies like Hewitt and Great Place to Work Institute
Supply Chain A strong and efficient supply chain is a critical factor in ensuring smooth functioning of any food services business. Any disruptions in the supply chain could have an impact on the cost & sales and also impact the service quality
Focus on strong and efficient supply chain management practices and a robust vendor base. Stringent quality check processes and HACCP certification for manufacturing locations / commissaries ensuring delivery of quality products to consumers
HUMAN RESOURCES
Its continued expansion drive, led by growing number of
restaurants and increasing consumer expectations on service
delivery front, puts immense pressure on the Company
with respect to recruitment and retention of quality talent.
The Company has in place a comprehensive HR policy that

Jubilant FoodWorks Limited 31
Writing on Tom
orrow’s Tim
eline Strategic Review Statutory Reports Financial Statem
ents
encourages talent growth across functions. To ensure that the organisation has the right kind of people to reflect the right kind of culture, JFL has a strong and well-planned system with a Guest Delight Manager (GDM) leading its consumer connect focus. The HR system is designed to help people scale up in line with the expanding restaurant base with its huge complexities.
Significant investments are made regularly in management development initiatives and manpower training. In line with the demands of the evolving market scenario, the Company changed its training strategy during the year to make it more skill-based and focussed on a multi-pronged agenda comprising talent assessment and performance management. The Company has increased its investment on leadership development and also on skill-based competency development programmes for shift managers.
On the performance management front, there has been a shift to a relative assessment process which is structured to differentiate the top performers from the rest, with the compensation model also linked more directly to performance. Talent acquisition has been another focus area, where the Company has been effectively sourcing people for its restaurants through employee referral programmes, and also through various skill development organisations and NGOs.
Employee Engagement continued to be a strong driver of the HR function, with Fun@Work, Birthday Celebrations, Confluence, Family Get-together, among the initiatives undertaken to enable better bonding of the employees. The “Mera Domino’s” campaign and PAT (Praise, Appreciate and Thank) certification programme to promote peer appreciation proved to be major sources of employee engagement. The Company also organised DDD season II (Dance Domino’s Dunkin’ Dance), which was an all India Dance Competition where more than 500 contestants travelled to twelve different cities for auditions. A total of 46 semi-finalists were shortlisted, of which 10 finalists performed at the Grand Finale held in New Delhi.
The JFL internal newsletter, along with its abridged version, has also become immensely popular as part of the Company’s calendar for employee communication. The Company also undertook an Internal Engagement Survey to gauge the satisfaction levels of the employees and addressed areas of concern through a detailed feedback process.
INTERNAL CONTROL SYSTEMS AND THEIR ADEQUACY
JFL has a strong, process-oriented internal control system, which operates through well-identified internal management assurance teams. These teams periodically review the processes, compliances, gaps and challenges faced by the Company.
Internal audits have also been strengthened and now cover new
areas and processes, including restaurants and manufacturing
locations / commissaries. The Company aims to cover all aspects
of its business functions once in every two years.
Regular audits to identify process improvement areas and two
internal auditors in place, instead of one internal auditor earlier,
are some of the other measurable steps taken by the Company
to strengthen the internal controls.
OUTLOOK
Confident about the inherent strengths of the Indian
consumption story, the Company is firmly on the track of
growth and expansion of its infrastructure, delivery and product
systems.
Consumer research, innovations in product offerings
& technology, building infrastructure and expansion of
restaurant network shall continue to be major thrust areas
for your Company for enhancing consumer connect and
sustainable long-term success. This connect shall be further
strengthened and deepened as the Company moves forward
on its growth trajectory. The focus shall be on creation of
long-term value for consumers and stakeholders through
responsive and responsible strategic decisions based
on the Company’s deep-rooted understanding of the
market dynamics.
Domino’s Pizza - The thrust on growth and expansion, in terms
of addition of new markets and deeper penetration in existing
markets, shall be further augmented in the coming years.
The Company plans to open 150 restaurants in FY2015, all on
Pizza Theatre concept. Further, the Company is also planning
to open more restaurants at transit locations such as
Metro Stations and airports.
Dunkin’ Donuts - With a new, more dynamic positioning to
drive growth in its target audience, Dunkin’ Donuts shall
continue to adapt to the Indian consumer tastes to move
towards greater expansion and growth. Geographical expansion,
based on insights into what works for the business, remains
high on the future agenda. The plan is to roll out 25 new
restaurants in FY2015. Following Mumbai, several other
western and southern cities are on the map for expanding this
brand over the next year or so. The brand is still in nascent
stage and the Company shall continue to invest in strengthening
it while foraying into new markets across other parts of
the country.

Annual Report 2013-1432
Directors' Report
Dear Members,
Your Directors have pleasure in presenting the Nineteenth Annual Report, together with the Audited Financials of the Company for the Financial Year ended March 31, 2014 (“FY2014”).
FINANCIAL PERFORMANCE
Standalone Financial Summary(` in Million)
Particulars FY2014 FY2013Sales & Other Income 17,328 14,153Profit before Interest, Depreciation & Tax
2,644 2,522
Less: Interest - 1Less: Depreciation 767 547Profit / (Loss) before Tax 1,877 1,974Less: Tax Expense 619 623Profit / (Loss) after Tax 1,258 1,351
Consolidated Financial Summary(` in Million)
Particulars FY2014 FY2013Sales & Other Income 17,457 14,222Profit before Interest, Depreciation & Tax
2,590 2,496
Less: Interest - 1Less: Depreciation 787 556Profit / (Loss) before Tax 1,803 1,939Less: Tax Expense 620 628Profit / (Loss) after Tax 1,182 1,311
BUSINESS PERFORMANCE
The Company’s growth plan continued during FY2014 despite difficult economic conditions coupled with growing competition and high inflationary market conditions. During the year, the Company continued its focus on product innovation, cost consciousness, technology, employee development, consumer connect and loyalty. The Company leveraged its strengths to achieve the operational excellence for both the brands i.e. Domino’s Pizza India and Dunkin’ Donuts India.
Domino’s Pizza - IndiaAligning itself to the Company’s principles and values, and steered by its deep-rooted strengths, Domino’s Pizza India continued to make rapid strides in transforming the Indian FSI landscape. Domino’s Pizza has taken its tally to 726 restaurants in 150 cities as of March 31, 2014 (749 restaurants in 152 cities as of May 19, 2014). During the year, 150 new Domino’s Pizza restaurants were successfully launched as against 111 restaurants in the previous year. Product innovations remained high on the Company’s agenda, as showcased by the new
offerings and launches. During the year, the Company captured the consumers’ interest and market by launching the new indulgent Fresh Pan Pizzas, Spicy Baked Chicken, Lebanese rolls and Calzone Pockets. The Company continued to work towards rejuvenating its brand with innovative initiatives like launch of Pizza Theatre and strengthened its consumer connect.
Domino’s Pizza - Sri LankaThe Company’s Sri Lankan subsidiary, Jubilant FoodWorks Lanka (Pvt.) Ltd. (subsidiary) expanded its base by opening 5 (five) restaurants during FY2014, taking its total restaurant count to 11 as on March 31, 2014. The year was a challenging one for Sri Lanka market with increased competition and entry of new food brands. Consumer preference and acceptance for the brand increased with strategic marketing communication. During FY2014, 3 (three) new products, Pepper Chicken Drumsticks, Rice and Fresh Pan Pizza, were also launched which received encouraging response from the consumers. Operationally, the subsidiary continued delivering efficiency on the back of several cost management initiatives. Though the overall sales grew, the subsidiary continued to incur losses. Raw material cost continued to be high due to inflation and increased duty on cheese. Decisions and strategic choices continued to be guided by the principle of systematic expansion backed by strong infrastructure.
Sri Lankan subsidiary shall continue to be one of the focus markets for the Company.
Dunkin’ Donuts - IndiaDunkin’ Donuts’ restaurants offering a wide variety western, all day part food menu including donuts, coffee, burgers, sandwiches, snacks and more, continued its expansion plans. The Company successfully launched 16 new Dunkin’ Donuts restaurants during the year, taking the total number to 26 restaurants as on March 31, 2014. Mumbai marked another important milestone in the geographical expansion of Dunkin’ Donuts, thereby taking the total restaurant count to 29 as on May 19, 2014.
The Company is continuously reinvigorating its menu by offering various new products. During the year, the Company launched “Get Your Mojo Back” positioning, aimed to get Dunkin’ Donuts better placed in the sweet spot between the QSR and the Café markets.
With its focus on innovation and strong consumer insight and understanding, Jubilant FoodWorks continues to chart its growth story for the future across both its brands. A detailed analysis and insight into the operations & business performance of the Company for the year is appearing in the Management Discussion & Analysis which forms part of Annual Report.

Jubilant FoodWorks Limited 33
Writing on Tom
orrow’s Tim
eline Strategic Review Statutory Reports Financial Statem
ents
CONSOLIDATED FINANCIAL STATEMENTS
The Consolidated Financials, in terms of Clause 32 of the Listing Agreement and prepared in accordance with AS - 21 as specified in Companies (Accounting Standards) Rules, 2006 form part of the Annual Report. In terms of the general exemption granted by the Government of India vide its General Circular No. 2/2011 dated February 8, 2011, from attaching the Directors’ Reports, Balance Sheets, Statement of Profit & Loss and other particulars of the subsidiary Companies subject to fulfillment of certain conditions mentioned therein, the same have not been attached to this Report.
The audited annual financial statements and other related information of the subsidiary Company, wherever applicable, will be made available to shareholders of the Company on request. Further, these documents will also be available for inspection during business hours at the Registered Office of the Company and the subsidiary Company.
HUMAN RESOURCE DEVELOPMENT
Our employees are custodians of both our brands – Domino’s Pizza & Dunkin’ Donuts. The Company aims at constantly upgrading the strength of its employees through focused skill building, ongoing Learning and Professional Development programmes for employees at all levels and across functions. The Company invests in various programs like Executive Coaching for next level leaders, strategic thinking workshops, management development programs & seminars for senior and middle level management, performance management workshops, business communication workshops for people managers which is a step in the direction to build talent pipeline and creating future leaders.
At the restaurant level, the focus is to map job specific competencies and provide them functional training for enhanced consumer service and experience.
Further, a dedicated operations training team extends a systematic product/systems/processes training across all levels of operations. The training team uses multiple modes of training like Learning Management System (LMS), Class Room Training and On the Job Training to ensure requisite information and integrated career progression to the employees at restaurant.
The Company encourages a culture which combines work with fun. The all India event “Dance Dominos Dance” was re-launched as “Dance Domino’s Dunkin’ Dance”-(DDD-Season II), where more than 500 employees participated.
All the above factors have made the Company a great place to work by being recognised and ranked 9th in the Great Places to Work India survey in retail sector (a survey conducted by GPWI and RAI).
As on March 31, 2014, the total numbers of employees on the records of the Company were 24,969. A detailed note on human resources is appearing in the Management Discussion & Analysis which forms part of Annual Report.
Employees at all levels are assured a work place free of harassment irrespective of their gender, race, social class, caste, creed, religion, place of origin, sexual orientation, disability or economic status. The employees have the right to work in an environment free from any form of discrimination and conduct which can be considered harassing, coercive, or disruptive particularly behaviors that tantamount to sexual harassment.
In view of above, the Company has adopted a policy on prevention of sexual harassment at workplace. The Company has not received any complaint for the calendar year 2013.
DIVIDEND
Keeping in view, the Company’s requirement of capital for its expansion plans, the Board has not recommended any dividend.
MANAGEMENT DISCUSSION AND ANALYSIS REPORT
Pursuant to Clause 49 of the Listing Agreement with the Stock Exchanges, the Management Discussion & Analysis Report including Risk Review is presented in a separate section forming part of the Annual Report.
SHARE CAPITAL
During the year, the Company issued 148,100 Equity Shares of ` 10/- each on the exercise of stock options under Employees Stock Option Plan, 2007 and 7,540 Equity Shares of ` 10/- each on the exercise of stock options under JFL Employees Stock Option Scheme, 2011. As a result, the issued, subscribed and paid-up equity share capital increased from 65,283,390 Equity Shares as at March 31, 2013 to 65,439,030 Equity shares as at March 31, 2014.
EMPLOYEES STOCK OPTION SCHEMES
The Company has two Employees Stock Option Schemes in operation at present:
• EmployeesStockOptionPlan,2007• JFLEmployeesStockOptionScheme,2011
Compensation Committee of the Company administers and monitors both ESOP Schemes. Compensation Committee was merged with Remuneration Committee and re-constituted as Nomination, Remuneration and Compensation Committee w.e.f. May 19, 2014. During the year, the employees were allotted equity shares upon exercise of stock options under both the schemes. The applicable disclosures under the Securities and Exchange Board of India (Employee Stock Option Scheme and Employee Stock Purchase Scheme) Guidelines, 1999, as at March 31, 2014 are given in Annexure A.
Certificate from S. R. Batliboi & Co. LLP, Chartered Accountants, Statutory Auditors, with respect to the implementation of the JFL Employees Stock Option Scheme, 2011 and Employees Stock Option Plan, 2007 would be placed before the shareholders at the ensuing Annual General Meeting and a copy of the same shall be available for inspection at the Registered Office of the Company.

Annual Report 2013-1434
CORPORATE GOVERNANCE REPORT
The corporate governance philosophy of the Company is driven by the interest of stakeholders and business needs of the organisation. Aligning itself to this philosophy, and in order to sustain the stakeholder’s trust, the Company has placed corporate governance on a high priority.
Pursuant to Clause 49 of the Listing Agreement with the Stock Exchanges, the Corporate Governance Report alongwith Certificate from M/s. Chandrasekaran Associates, Company Secretaries confirming compliance with the conditions of Corporate Governance forms part of the Annual Report.
DEPOSITS
The Company has not accepted any public deposits and as such, no amount on account of principal or interest was outstanding as at March 31, 2014.
DIRECTORS
In terms of Articles of Association of the Company, Mr. Hari S. Bhartia, Director of the Company, is liable to retire by rotation at the ensuing Annual General Meeting and being eligible, offer himself for re-appointment. The Board of Directors recommend his re-appointment.
Pursuant to Clause 49 of the Listing Agreement with the Stock Exchanges, the Company had appointed Ms. Ramni Nirula, Mr. Arun Seth, Mr. Vishal Kirti Keshav Marwaha, and Mr. Phiroz Adi Vandrevala as Independent Directors of the Company, liable to retire by rotation.
Now, in terms of Section 149, 150, 152, Schedule IV and other applicable provisions, if any, of the Companies Act, 2013 read alongwith rules made thereunder, the Independent Directors can hold office for a term of upto 5 (five) consecutive years on the Board of the Company and are not liable to retire by rotation. Accordingly, it is proposed to appoint Ms. Ramni Nirula, Mr. Arun Seth, Mr. Vishal Kirti Keshav Marwaha and Mr. Phiroz Adi Vandrevala as Independent Directors of the Company, not liable to retire by rotation, from the date of ensuing Annual General Meeting till March 31, 2019.
A brief resume of the aforesaid Directors and other information have been detailed in the Notice of ensuing Annual General Meeting.
AUDITORS AND THEIR REPORT
S. R. Batliboi & Co. LLP, Chartered Accountants, Statutory Auditors of the Company (bearing ICAI Regn. No. 301003E), retire at the conclusion of the ensuing Annual General Meeting of the Company and being eligible, have offered themselves for re-appointment as Statutory Auditors. Further, the Company has received the consent & eligibility certificate from S. R. Batliboi & Co. LLP, vide their letter dated May 9, 2014 under Section 139(1) of the Companies Act, 2013 & rules made thereunder.
The Board of Directors recommend their re-appointment for further period of one year from the conclusion of the ensuing Annual General Meeting till the conclusion of the next Annual General Meeting.
Auditors’ Report read together with Annexure referred to in the Auditors’ Report does not contain any qualification. Members’ attention is drawn towards the comment made by the Auditors in Clause (xxi) of the Annexure referred to in the Auditors’ Report and the Directors wish to clarify that the Company has taken all necessary steps, including taking criminal action against the said employee and has fully provided for the same in the financial statements. Further, effective steps have been taken to reduce/eliminate such cases.
COST AUDITORS
The Company had appointed M/s. Jitender, Navneet and Co., Cost Accountants (Firm Regn. No. 000119), as Cost Auditors of the Company for FY2014 to conduct the audit of the cost records of the Company.
The Cost Audit Report for FY2013 was filed within the due date on September 19, 2013. The due date for submission of the Cost Audit Report for FY2014 is within 180 days from March 31, 2014.
PARTICULARS OF EMPLOYEES
In terms of the provisions of Section 217 (2A) of the Companies Act, 1956, read with the Companies (Particulars of Employees) Rules, 1975, as amended, the names and other particulars of the employees are set out in the Annexure B forming part of this Report.
ENERGY CONSERVATION, TECHNOLOGY ABSORPTION AND FOREIGN EXCHANGE EARNINGS AND OUTGO
The Company values the significance of conservation of energy and hence continuous efforts are made for judicious use of energy at all levels of operations by utilising energy efficient systems and processes. Towards achievement of this objective, steps have been initiated including use of energy efficient LED lights and energy management systems at our restaurants. Further, certain initiatives are being implemented for optimisation of electricity and LPG usage.
The information as required to be furnished in Form A pursuant to Section 217(1)(e) of the Companies Act, 1956 read with the Companies (Disclosure of Particulars in the Report of Board of Directors) Rules, 1988, for Energy Conservation is considered to be not applicable to the Company and hence have not been provided. Further, the Company has no information to furnish in Form B regarding technology absorption.
Information pertaining to Foreign Exchange Earnings and Outgo is given in Note No. 33 of the Notes forming part of the Standalone Financial Statements.

Jubilant FoodWorks Limited 35
Writing on Tom
orrow’s Tim
eline Strategic Review Statutory Reports Financial Statem
ents
DIRECTORS’ RESPONSIBILITY STATEMENT
Pursuant to the requirement under Section 217 (2AA) of the Companies Act, 1956, with respect to Statement of Profit and Loss for the year ended March 31, 2014 and the Balance Sheet as at that date, your Directors confirm that they have:
• Followed the applicable accounting standards and nomaterial departures have been made from the same;
• Selected such accounting policies and applied them consistently and made judgments and estimates that are reasonable and prudent so as to give a true and fair view of the state of affairs of the Company at the end of the financial year and of the profit of the Company for that year;
• Taken proper and sufficient care for the maintenanceof adequate accounting records in accordance with the provisions of the Companies Act, 1956 for safeguarding the assets of the Company and for preventing and detecting fraud and other irregularities; and
• Preparedtheannualaccountsona‘goingconcern’basis.
ACKNOWLEDGEMENT
Your Directors wish to extend their deep appreciation to employees at all levels for their continuing support and unstinting efforts. Your Directors also acknowledge the continued support from Domino’s International, Dunkin Donuts’ International, Government and Regulatory Authorities, bankers and other stakeholders.
Your Directors would also like to appreciate the confidence and loyalty displayed by the consumers, whom the Company always strive to serve better.
For and on behalf of the Board of Directors
(Shyam S. Bhartia)Chairman & Director
Noida, June 2, 2014
Figures have been rounded off for purpose of reporting.

Annual Report 2013-1436
ANNEXURE APARTICULARS UNDER ESOP SCHEMES AS ON MARCH 31, 2014
S. No. Particulars Employees Stock Option Plan, 2007
JFL Employees Stock Option Scheme, 2011
(a) Options granted during FY2014 Nil 2,78,500(b) Options granted upto March 31, 2014 2,631,100
{Includes re-issue of lapsed options as per (g) below}
7,13,050
(c) Pricing formula Market price of shares on the date of grant.
The price of options granted before the listing of
shares, was determined by Compensation Committee.
Market price of shares on the date of grant.
(d) Options vested upto March 31, 2014 23,18,432 1,34,380(e) Options exercised upto March 31, 2014 20,89,373
(includes 5,000 options against which allotment of shares has not been made
till March 31, 2014)
14,430
(f) Total number of shares arising as a result of exercise of options, upto March 31, 2014
20,84,373 14,430
(g) Options lapsed upto March 31, 2014 170,180(Out of these, 131,100
options have been re-issued)
40,780
(h) Variation of terms of options during FY2014 - -(i) Money realised by exercise of options upto March 31, 2014 ` 8,71,10,743 ` 96,53,670(j) Total number of options in force as on March 31, 2014 3,71,547 6,57,840(k) Employee wise details of Options granted during
FY2014 to – a) Senior Management Personnel -
List available at the request of the memberb) An employee receiving a grant in FY2014 amounting to
5% or more of options granted during that year -
c) Employees who were granted option, during FY2014, equal to or exceeding 1% of the issued capital (excluding outstanding warrants and conversions) of the Company at the time of grant
- -
(l) Diluted Earnings per share (EPS) pursuant to issue of shares on exercise of options calculated in accordance with Accounting Standard (AS) 20
` 19.12 ` 19.12
(m) The difference between the employee compensation cost under the intrinsic value method and the employee compensation cost that shall have been recognised if it had used the fair value of the options. Impact on the profits and on the EPS of the Company if the Company had followed the accounting policies specified in Clause 13 of the SEBI (ESOP) Guidelines in respect of such options.
Refer Note 29 of the Notes forming part of the standalone Financial Statements
(n) Weighted-average exercise prices and weighted-average fair values of options for options where exercise price either equals or exceeds or is less than the market price of the stock.
Refer Note 29 of the Notes forming part of the standalone Financial Statements
(o) A description of the method and significant assumptions used during the year to estimate the fair values of options, including the following weighted-average information:
Refer Note 29 of the Notes forming part of the standalone Financial Statements
•risk-freereturn•expectedlife•expectedvolatility•expecteddividends,and•thepriceoftheunderlyingshareinmarketatthetime
of option grant.

Jubilant FoodWorks Limited 37
Writing on Tom
orrow’s Tim
eline Strategic Review Statutory Reports Financial Statem
ents
ANNEXURE B
INFORMATION PURSUANT TO SECTION 217 (2A) OF THE COMPANIES ACT, 1956 READ WITH THE COMPANIES (PARTICULARS OF EMPLOYEES) RULES, 1975
A) Particulars of Employees, employed throughout FY2014 and drawing Annual Remuneration of ` 60,00,000/- or more:
S. No
Name Designation & Nature of Duties
Qualification Age (Yrs.)
Exp. (Yrs.)
Date of Joining
Remuneration (` in Lakhs)
Last Employment
1 Mr. Ravi S. Gupta President & Chief Financial Officer
FCA, ACS, ACMA
46 22 15.04.2002 115.38 Cedar Enterprise Solutions Pvt. Ltd.
2 Mr. Dev Amritesh President & Chief Operating Officer – Dunkin’ Donuts
B. E. & P.G.D.B.M.
38 16 21.11.2005 98.17 Cadbury India Ltd.
3 Mr. Tarun Bhasin President & Chief Operating Officer– Domino’s Pizza
Diploma in Public Relations and Hotel Mgmt.
43 20 19.07.1996 90.08 Wimpy’s DAL Foods
B) Particulars of Employees, employed for part of FY2014 and drawing monthly remuneration in the aggregate of ` 5,00,000/- or more: NIL
Notes:
• Remuneration comprises basic salary, allowances, taxable value of perquisites, Company’s contribution to provident andsuperannuation fund etc. In addition, employees are entitled to gratuity in accordance with the Company’s Policy.
• NoneoftheaboveemployeeisrelatedtoanyoftheDirectorsoftheCompany.
• AlltheaboveemployeesareinfulltimeemploymentoftheCompany.
• Noemployeeoutoftheabove,fallswithinthemeaningofSection217(2A)(a)(iii)oftheCompaniesAct,1956.

Annual Report 2013-1438
Exhaustive HRD Policies cover succession planning, training and development, employee grievance handling. Employee Stock Option Plans – to attract, reward and retain key senior executives.
• Regular communication with shareholders, includinge-mailing of financial performance, to enhance the trust and confidence of the shareholders.
• Endeavor to continuously contribute to social andenvironmental spheres through various CSR programs creating shared values.
BOARD OF DIRECTORS
The Board of Directors, alongwith the Committees, provides leadership and guidance to the Company’s Management, directs, supervises as well as review the performance of the Company.
The Company has a Non-Executive Chairman who is also a Promoter Director. The total Board strength is seven, of which four are Independent Directors, two are non-executive Directors and one is Whole-Time Director. As required pursuant to Section 149 of the Companies Act, 2013 & rules made thereunder, Clause 49 of the Listing Agreement, Independent Directors constitute the majority of the Board strength.
Composition, Meetings and Attendance
During the Financial Year ended March 31, 2014 (“FY 2014”), four BoardmeetingswereheldonMay9,2013,August2,2013,October31,2013andFebruary4,2014.Further,circularresolutionswerealso passed on May 22, 2013 and January 21, 2014.
Composition of the Board and category of Directors alongwith numberofDirectorships/Membership(includingChairmanship)of Committees as on March 31, 2014 and also the attendance of each Director at the Board Meetings of the Company, held duringFY2014andthelastAnnualGeneralMeetingisasbelow:
COMPANY’S PHILOSOPHY ON CORPORATE GOVERNANCEThe corporate governance philosophy of the Company is driven by the interest of stakeholders and business needs ofthe organisation. Aligning itself to this philosophy, and in order to sustain the stakeholders’ trust, the Company has placed corporate governance on a high priority.
The highlights of the Company’s Corporate Governance regime are:• At the core of the Company’s Corporate Governance
practice is Board of Directors, which oversees how the management serves and protects the long-term interests of all the stakeholders. The Company believes that anactive, well-informed and independent Board is necessary to ensure high standards of corporate governance. To ensure the independency of the Board, the majority of the Board members,fouroutofseven,areIndependentDirectors.
• ConstitutionofseveralCommittees,suchasAuditCommittee,Nomination, Remuneration and Compensation Committee, Stakeholders Relationship Committee, Sustainability andCorporate Social Responsibility Committee etc. for focusedattention, enables the Company to ensure expedientresolution of diversified matters.
• The Code of Conduct for Directors and Senior Management,along with the Code for Prevention of Insider Trading formulated in terms of the SEBI Guidelines, constitute strong parameters of the Company’s Corporate Governance philosophy.
• EstablishmentoftheWhistleBlowerPolicytoensureutmosttransparency in business. This policy acts as a neutraland unbiased forum for the Directors, Employees andBusinessPartnersoftheCompanyanditssubsidiaries(bothIndian and foreign) to voice concerns in a responsible and effective manner without fear of reprisal.
• Strongfocusonhiring,retainingandnurturingbesttalentandon promoting a culture of excellence across the organisation.
Corporate Governance Report
Name, Designation and Category of the Director
Directorships* Committee Memberships (including Chairmanship) ^
No. of Board MeetingsPresence at
Last AGMMemberships Chairmanships Held during FY2014
Attended during FY2014
PROMOTER DIRECTORSMr. Shyam S. Bhartia @Chairman
6 1 - 4 4 Yes
Mr. Hari S. Bhartia @ Co-Chairman
9 2 - 4 4 Yes
EXECUTIVE DIRECTORMr. Ajay KaulCEO cum Whole Time Director
1 2 - 4 4 Yes
INDEPENDENT DIRECTORSMr. Vishal Marwaha 2 - 1 4 4 YesMr. Arun Seth 6 2 - 4 4 YesMs. Ramni Nirula 8 5 3 4 3 NoMr. Phiroz Vandrevala 3 1 - 4 4 No* Excluding Private Companies, Section 25 Companies, Limited Liability Partnerships and Foreign Companies but including Directorship in
JubilantFoodWorksLimited.^ CommitteesforthispurposemeanAuditCommitteeandStakeholdersRelationshipCommitteeofIndianpubliccompanies,includingCommittees
ofJubilantFoodWorksLimited.@Mr.ShyamS.BhartiaandMr.HariS.Bhartiaarerelatedtoeachother,beingbrothers.

Jubilant FoodWorks Limited 39
Writing on Tom
orrow’s Tim
eline Strategic Review Statutory Reports Financial Statem
ents
Details of the remuneration paid to the Directors for FY 2014
(a) Remuneration to DirectorsTheremuneration/sittingfeespaidtotheDirectorsduringFY2014arementionedbelow:
(Amount in `)S.
No.Name of Director Salary & Allowances Perquisites Contribution to PF &
Other FundsSitting Fees* Total
1 Mr. Shyam S. Bhartia - - - 80,000 80,0002 Mr. Hari S. Bhartia - - - 95,000 95,0003 Mr. Ajay Kaul 3,07,91,927 1,65,400 26,94,113 - 3,36,51,4404 Mr. Vishal Marwaha - - - 1,55,000 1,55,0005 Mr. Arun Seth - - - 1,60,000 1,60,0006 Ms. Ramni Nirula - - - 1,22,500 1,22,500 7 Mr. Phiroz Vandrevala - - - 80,000 80,000
* Excluding Service Tax.
Mr. Ajay Kaul, CEO cum Whole time Director of the Company, is entitled to annual performance incentive, as per the Company’s policyandtheaboveremunerationofMr.AjayKaulincludestheincentivepaidduringtheyear.
(b) Service Contracts, Notice Period, Severance Fees
The appointment of the Whole Time Director is terminable by either party by giving six months’ notice in writing or six months’basicsalaryinlieuthereof.
(c) Number of Equity Shares / Stock Options held by Directors in the Company as on March 31, 2014
i. NumberofEquitySharesheld:Name of Director No. of equity shares of ` 10/- eachMr. Shyam S. Bhartia 1Mr. Hari S. Bhartia 1Mr. Ajay Kaul 1, 50,000Ms. Ramni Nirula 3,000
ii. NumberofStockOptionsheldunderEmployeesStockOptionPlan,2007:Name of Director No. of options granted No. of options exercised No. of options outstandingMr. Ajay Kaul 6,50,000 5,57,500 92,500Mr. Vishal Marwaha 15,000 10,500 4,500Mr. Arun Seth 15,000 10,500 4,500Ms. Ramni Nirula 15,000 10,500 4,500
Theoptionsvestoveraperiodoffiveyearsandshallbeexercisablewithinnineyearsfromfirstvestingdate.Eachoptionisequivalent to one equity share of `10/-each.
iii. NumberofStockOptionsheldunderJFLEmployeesStockOptionScheme,2011:Name of Director No. of options granted No. of options exercised No. of options outstandingMr. Ajay Kaul 1,09,400 - 1,09,400Mr. Phiroz Vandrevala 15,000 - 15,000
Theoptionsvestoveraperiodofthreeyearsandshallbeexercisablewithinsevenyearsfromfirstvestingdate.Eachoptionisequivalent to one equity share of `10/-each.
(d) Criteria of making payments to Non-Executive Directors
TheCompanyconsidersthetimeandeffortsputinbytheNon-ExecutiveDirectors/IndependentDirectorsindeliberationsatBoard/Committeemeetings.Theyarepaidsittingfeesforattendingthemeetingsandarenotentitledtoanyotherpayments.ThesittingfeesforattendingBoard/CommitteeMeeting,revisedonMay19,2014isasbelow:S. No. Nature of Meeting Sitting fees per meeting* (`)
1. Board 50,0002. Audit Committee 25,0003. Nomination, Remuneration and Compensation Committee 25,0004. Stakeholders Relationship Committee 15,0005. Sustainability&CorporateSocialResponsibilityCommittee 15,000
* Excluding Service Tax.

Annual Report 2013-1440
COMMITTEES OF THE BOARD
TheBoardhasconstitutedappropriatenumberofCommitteesof Directors, with adequate delegation of powers. Each Committee has its own charter setting forth the purpose, goals and responsibilities of the Committee, which ensuresexpedient resolution of diversified matters. Further, the Company Secretary of the Company acts as the Secretary to the Committees.
The various Committees are:a. Corporate Governance Committees as per Clause 49
of the Listing Agreement- Audit Committee- Nomination, Remuneration and Compensation
Committee (Erstwhile there were two separate Committees Remuneration Committee and Compensation Committee)
- Stakeholders Relationship Committee (Erstwhile known as Share Transfer and Investors’ Grievance Committee)
b. Other Committees- Regulatory & Finance Committee - Sustainability & Corporate Social Responsibility
Committee(ConstitutedonFebruary4,2014)Information pertaining to the Corporate Governance Committeesisasbelow:
(i) AUDIT COMMITTEEAllthemembersoftheCommitteehavegoodfinancialandaccounting knowledge. The Chairperson of the Committee has accounting and financial management expertise. The Statutory Auditors, Internal Auditors, Cost Auditors and other financial experts are invitees to the meetings.
The Committee oversees the audit functions, reviews Company’s financial performance, key findings of Internal Audit and risk mitigation plans, compliance with the Accounting Standards and all other matters specified under Clause 49 of the Listing Agreement of the Stock Exchange and in Section 177 of the Companies Act, 2013.
During FY 2014, six meetings were held on May 9, 2013; August 2, 2013; October 22, 2013; October 31, 2013;January 28, 2014 and February 04, 2014. Compositionof Committee as on March 31, 2014 and attendance of membersatthemeetingsheldduringFY2014isasbelow:
Name & Designation of the Member
No. of Meetings
held
No. of Meetings Attended
Mr. Vishal MarwahaChairperson, Independent
6 6
Mr. Ajay Kaul ExecutiveMember
6 6
Mr. Arun Seth IndependentMember
6 6
Ms. Ramni Nirula IndependentMember
6 5
The Chairperson of the Committee was present in the last Annual General Meeting to respond to shareholders’ queries.
(ii) NOMINATION, REMUNERATION AND COMPENSATION COMMITTEE
The Remuneration Committee and Compensation Committee of the Company were merged and re-constituted as Nomination, Remuneration and Compensation Committee w.e.f. May 19, 2014. The role of the Committee, inter alia, includes setting criteria for appointment of Directors/Sr.Management, performance evaluation of Directors and the Board, recommending to the Board, a policy, relating to the remuneration for the Directors, Key Managerial Personnel and other employees. The Committee also administers all Employee Stock Option Plans/ Schemes of the Companyincludingbutnotlimitedtograntofstockoptionsetc.
The composition of the Nomination, Remuneration and CompensationCommitteeisasbelow:S. No. Name of the Member Designation
1 Mr. Arun Seth Chairperson, Independent
2 Mr. Shyam S. Bhartia Non – executive Member
3 Mr. Hari S. Bhartia Non - executive Member
4 Mr. Vishal Marwaha IndependentMember5 Ms. Ramni Nirula IndependentMember
During FY 2014, two Remuneration Committee meetings wereheldonJune11,2013andNovember11,2013.Further,circular resolution was also passed by the Committee onJanuary 17, 2014. Composition of Remuneration Committee asonMarch31,2014andattendanceofmembersatthemeetingsheldduringFY2014isasbelow:Name & Designation of the Member
No. of Meetings
held
No. of Meetings Attended
Mr. Arun Seth Chairperson, Independent
2 2
Mr. Vishal Marwaha IndependentMember
2 2
Mr. Hari S. Bhartia Non–ExecutiveMember
2 2
During FY 2014, one Compensation Committee meeting washeldonNovember11,2013.Further,circularresolutionswerealsopassedbytheCommitteeonMay13,2013;June26,2013;October8,2013;December27,2013andMarch26, 2014. Composition of Compensation Committee as on March 31, 2014 and attendance of members at themeetingsheldduringFY2014isasbelow:
Name & Designation of the Member
No. of Meetings
held
No. of Meetings Attended
Mr. Hari S. Bhartia Chairperson, Non – Executive
1 1
Mr. Vishal Marwaha IndependentMember
1 1
Ms. Ramni Nirula IndependentMember
1 1

Jubilant FoodWorks Limited 41
Writing on Tom
orrow’s Tim
eline Strategic Review Statutory Reports Financial Statem
ents
(iii) STAKEHOLDERS RELATIONSHIP COMMITTEE
Pursuant to Section 178 of the Companies Act, 2013 and rules made thereunder the Share Transfer & Investors’ Grievance Committee of the Company was re-constituted as Stakeholders Relationship Committee w.e.f. May 19, 2014. The role of the Committee, inter alia, includes considering and resolving the grievances of security holders of the Company and handling transfer of shares, consolidation/sub-division of share certificates, issue of duplicatecertificates&dematerialisation/rematerialisationrequests.
During FY 2014, four meetings were held on May 9, 2013; August2,2013;October31,2013andFebruary04,2014.Composition of the Committee as on March 31, 2014 and attendance of the members at the meetings held duringFY2014isasbelow:
Name & Designation of the Member
No. of Meetings
held
No. of Meetings Attended
Ms. Ramni Nirula Chairperson, Independent
4 3
Mr. Arun Seth IndependentMember
4 4
Mr. Ajay Kaul ExecutiveMember
4 4
The status of shareholders’ complaints during FY 2014, isasbelow:Pending at the Beginning
Received Resolved Pending at the end
Nil 11 11 Nil
Further, information pertaining to the Sustainability &CorporateSocialResponsibilityCommitteeisasbelow:
SUSTAINABILITY AND CORPORATE SOCIAL RESPONSIBILITY COMMITTEE
Pursuant to Section 135 of the Companies Act, 2013 and rules madethereundertheCompanyconstitutedtheSustainabilityand
Corporate Social ResponsibilityCommitteeonFebruary4,2014.The role of the Committee, inter alia, includes formulation and monitoringtheimplementationofcorporatesocialresponsibilitypolicyandtolookintomattersrelatedtosustainability.
CompositionoftheCommitteeasonMarch31,2014isasbelow:
S. No. Name of the Member Designation
1 Mr. Hari S. Bhartia Chairperson, Non – Executive
2 Mr. Arun Seth IndependentMember
3 Mr. Phiroz Vandrevala IndependentMember
COMPLIANCE OFFICER
Ms. Mona Aggarwal is the Company Secretary cum Compliance Officer of the Company appointed by the Board. Hercorrespondenceaddressisasbelow:
JubilantFoodWorksLimitedB-214, Phase II, Distt. Gautam Budh Nagar, Noida – 201305, U.P., India.Phone:+91-120-4090500Fax:+91-120-4090599E-mail:[email protected]:www.jubilantfoodworks.comCIN:L74899UP1995PLC043677
The Company welcomes the shareholders to communicate with theCompanyaspertheabovedetailsorthroughtheCompany’sRegistrar and Share Transfer Agent (RTA), whose particulars are given later in this report.
GENERAL BODY MEETINGS
Information pertaining to last three Annual General Meetings
Information pertaining to the date, time and venue of the last three Annual General Meetings alongwith businessitems approved by the shareholders by means of Special Resolution,isasbelow:
Financial Year ended
Date & Time Venue Items approved by Special Resolution
March 31, 2013 August 8, 2013 11.00 A.M.
International Trade Expo Center, A – 11, Sector 62, Noida, U.P.
1. Modification of JFL Employees Stock Option Scheme, 2011
March 31, 2012 August 29, 2012 11.00 A.M.
International Trade Expo Center, A – 11, Sector 62, Noida, U.P.
None
March 31, 2011 August 20, 2011 11.00 A.M.
International Trade Expo Center, A – 11, Sector 62, Noida, U.P.
1. Approve JFL Employees Stock Option Scheme, 2011.
2.ApprovegrantofoptionstoSubsidiary/HoldingCompany Employees.
3. Grant of options to Non – Executive Directors under Employees Stock Option Plan, 2007.
4. Approve waiver of remuneration paid to Mr. Ajay Kaul, CEO cum Whole Time Director.
Special Resolutions passed through Postal Ballot
Increase in Investors Investment Limits
The Postal Ballot process was conductedbytheCompanyduring
the year for obtaining shareholders’ approval for increase inInvestors Investment Limits. Dr. S. Chandrasekaran, Practicing CompanySecretary,wasappointedasascrutiniserbytheBoard,toconduct the Postal Ballot process in a fair and transparent manner.
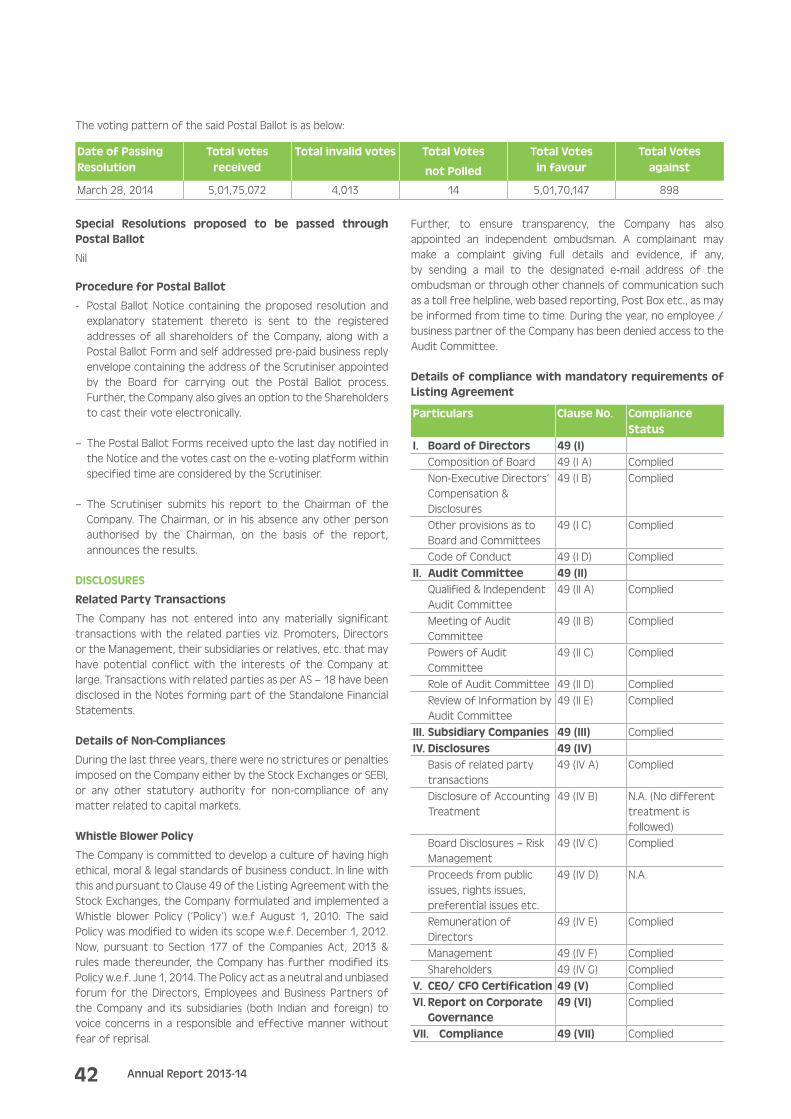
Annual Report 2013-1442
ThevotingpatternofthesaidPostalBallotisasbelow:
Date of Passing Resolution
Total votes received
Total invalid votes Total Votes
not Polled
Total Votes in favour
Total Votes against
March 28, 2014 5,01,75,072 4,013 14 5,01,70,147 898
Special Resolutions proposed to be passed through Postal Ballot
Nil
Procedure for Postal Ballot
- Postal Ballot Notice containing the proposed resolution and explanatory statement thereto is sent to the registered addresses of all shareholders of the Company, along with a PostalBallotFormandselfaddressedpre-paidbusinessreplyenvelope containing the address of the Scrutiniser appointed by the Board for carrying out the Postal Ballot process.Further, the Company also gives an option to the Shareholders to cast their vote electronically.
– The Postal Ballot Forms received upto the last day notified in the Notice and the votes cast on the e-voting platform within specifiedtimeareconsideredbytheScrutiniser.
–The Scrutiniser submits his report to the Chairman of theCompany.TheChairman,or inhisabsenceanyotherpersonauthorised by the Chairman, on the basis of the report,announces the results.
DISCLOSURES
Related Party Transactions
The Company has not entered into any materially significant transactions with the related parties viz. Promoters, Directors ortheManagement,theirsubsidiariesorrelatives,etc.thatmayhave potential conflict with the interests of the Company at large.TransactionswithrelatedpartiesasperAS–18havebeendisclosed in the Notes forming part of the Standalone Financial Statements.
Details of Non-Compliances
During the last three years, there were no strictures or penalties imposedontheCompanyeitherbytheStockExchangesorSEBI,or any other statutory authority for non-compliance of any matter related to capital markets.
Whistle Blower Policy
The Company is committed to develop a culture of having high ethical,moral&legalstandardsofbusinessconduct.Inlinewiththis and pursuant to Clause 49 of the Listing Agreement with the Stock Exchanges, the Company formulated and implemented a Whistle blower Policy (‘Policy’) w.e.f August 1, 2010. The saidPolicywasmodifiedtowidenitsscopew.e.f.December1,2012.Now, pursuant to Section 177 of the Companies Act, 2013 & rules made thereunder, the Company has further modified its Policyw.e.f.June1,2014.ThePolicyactasaneutralandunbiasedforum for the Directors, Employees and Business Partners of the Company and its subsidiaries (both Indian and foreign) tovoiceconcerns ina responsibleandeffectivemannerwithoutfear of reprisal.
Further, to ensure transparency, the Company has also appointed an independent ombudsman. A complainant maymake a complaint giving full details and evidence, if any, by sending a mail to the designated e-mail address of theombudsmanorthroughotherchannelsofcommunicationsuchasatollfreehelpline,webbasedreporting,PostBoxetc.,asmaybeinformedfromtimetotime.Duringtheyear,noemployee/businesspartneroftheCompanyhasbeendeniedaccesstotheAudit Committee.
Details of compliance with mandatory requirements of Listing Agreement
Particulars Clause No. Compliance Status
I. Board of Directors 49 (I)Composition of Board 49 (I A) CompliedNon-Executive Directors’ Compensation & Disclosures
49 (I B) Complied
Other provisions as to Board and Committees
49 (I C) Complied
Code of Conduct 49 (I D) CompliedII. Audit Committee 49 (II)
Qualified & Independent Audit Committee
49 (II A) Complied
Meeting of Audit Committee
49 (II B) Complied
Powers of Audit Committee
49 (II C) Complied
Role of Audit Committee 49 (II D) CompliedReviewofInformationbyAudit Committee
49 (II E) Complied
III. Subsidiary Companies 49 (III) Complied IV. Disclosures 49 (IV)
Basis of related party transactions
49 (IV A) Complied
Disclosure of Accounting Treatment
49 (IV B) N.A. (No different treatment is followed)
Board Disclosures – Risk Management
49 (IV C) Complied
Proceedsfrompublicissues, rights issues, preferential issues etc.
49 (IV D) N.A.
Remuneration of Directors
49 (IV E) Complied
Management 49 (IV F) CompliedShareholders 49 (IV G) Complied
V. CEO/ CFO Certification 49 (V) CompliedVI. Report on Corporate
Governance49 (VI) Complied
VII. Compliance 49 (VII) Complied

Jubilant FoodWorks Limited 43
Writing on Tom
orrow’s Tim
eline Strategic Review Statutory Reports Financial Statem
ents
Details of compliance with Non-mandatory requirements of Listing Agreement
1. The Board
- Non-Executive Chairman’s OfficeThe Chairman of the Company is a Non-Executive Director. However, the Chairman is not entitled to any compensation for holding office except to the extent of sitting fees for attending meetings of the Company.
- Tenure of Independent Directors not to exceed 9 yearsNospecifictenurehasbeenprescribedforIndependentDirectors upto March 31, 2014.
- Qualification of Independent DirectorsAll the Independent Directors of the Company are the persons of integrity and possess appropriate skills, expertise and experience which enables them tocontributeeffectivelytotheCompany
2. Remuneration Committee
The composition and other details of the Nomination, Remuneration and Compensation Committee have beengiven in the preceding pages of this report.
3. Shareholders’ Rights
The quarterly and year to date financial statements are publishedinnewspapers,uploadedonCompany’swebsitewww.jubilantfoodworks.comandalsosentthroughe-mailto shareholders who have registered their e-mail address with Depository Participants.
4. Audit Qualifications
There are no qualifications of Auditors on financial statements of the Company for FY 2014.
5. Training of Board Members
In the course of Board/ Audit Committee Meetings, theDirectorsareprovidedinformationonthebusinessmodel,risk profile of the business parameters, entry into newproducts and market.
6. Mechanism for evaluating Non - Executive Board Members
The Company does not have any mechanism for evaluation of performance of Non-Executive Directors. However, the Company is in the process to adopt the same.
7. Whistle Blower Policy
TheCompanyhasawhistleblowerpolicyinplace.Thedetailshavebeengivenintheprecedingpagesofthisreport.
MEANS OF COMMUNICATION
The quarterly/ half-yearly/ annual results are forthwithcommunicated to the Bombay Stock Exchange and theNational Stock Exchange, with whom the Company has listing arrangements, as soon as these are approved and taken on recordbytheBoardofDirectorsoftheCompany.Theresultsaregenerallypublishedinleadingnewspapers,namely,Mint(English)& Rashtriya Sahara (Hindi) in accordance with the guidelines
of the Stock Exchanges. Further, as a part of good Corporate Governance, the Company e-mails its quarterly results to its shareholders after release to Stock Exchanges.
The official news releases, including quarterly, half yearly and annual results and presentations are posted on Company’s website www.jubilantfoodworks.com. Various sections of theCompany’swebsitekeeptheinvestorsupdatedonthekeyandmaterial developments of the Company by providing timelyinformation like Board profile, financial results, annual reports, shareholding pattern, etc.
Further, the shareholders may communicate with the Company through a separate e-mail ID [email protected]. During FY 2014, the Company organised Earnings Calls after announcement of Quarterly Results, which were well attended bytheanalysts,fundmanagersandinvestors.
GENERAL SHAREHOLDER INFORMATION
Annual General Meeting:The Date, Time and Venue of the 19th Annual General Meeting (“AGM“) of the Company have been set out in the Notice convening the AGM.
Financial Calendar for FY2015 (Tentative):TheQuarterly/Half-Yearly/AnnualresultswillbetakenonrecordbytheBoardofDirectorsaspertheschedulebelow:
First Quarter Results : OnorbeforeAugust14,2014
Second Quarter/ Half Yearly Results : OnorbeforeNovember14,2014
Third Quarter Results : OnorbeforeFebruary14,2015
Fourth Quarter /Audited Annual Results : OnorbeforeMay 30, 2015
Date of Book Closure: August 23, 2014 (Saturday) to September3,2014(Wednesday),bothdaysinclusive
Dividend Payment Date:Notapplicable
Listing on Stock Exchanges:
Name and address of Stock Exchanges Stock CodeBombayStockExchange 25th Floor, P.J. Towers, DalalStreet,Mumbai–400001
533155
National Stock Exchange Exchange Plaza, Bandra Kurla Complex, Bandra(E),Mumbai–400051
JUBLFOOD
The Company has paid the listing fees for FY 2015 to the Stock Exchanges where the shares of Company are listed.
ISIN Number: INE797F01012
Market Price Data & Share price performance: Monthly High & Low during each month of FY 2014, on NSE and BSE isasbelow:

Annual Report 2013-1444
Month Bombay Stock Exchange
National Stock Exchange
High (`) Low (`) High (`) Low (`)
April 2013 1,270.00 1,044.75 1,270.90 1,044.00
May 2013 1,151.40 988.55 1,149.95 987.60
June 2013 1,138.70 928.00 1,139.90 927.10
July 2013 1,217.45 1,045.20 1,218.00 1,045.00
August 2013 1,155.00 981.00 1,157.70 980.00
September2013 1,198.00 1,000.00 1,198.00 1,001.05
October2013 1,225.00 1,098.00 1,224.95 1,098.85
November2013 1,389.95 1,161.95 1,391.90 1,164.00
December2013 1,380.00 1,228.25 1,381.95 1,228.65
January 2014 1,300.70 1,039.90 1,299.90 1,038.80
February2014 1,110.00 1,007.00 1,110.00 1,006.05
March 2014 1,076.00 978.10 1,076.80 977.30
COMPANY’S EQUITY SHARE PRICE COMPARISON WITH SENSEX
Registrar and Share Transfer Agent:
M/s.LinkIntimeIndiaPrivateLimitedistheRTAoftheCompany,to whom communications regarding change of address, transferofshares,changeofmandateetc.canbeaddressedbythe shareholders holding shares in the physical mode, as per the detailsmentionedbelow:
Link Intime India Private Limited44, Community Centre, 2nd Floor Naraina Industrial Area Phase- INear PVR Naraina, New Delhi – 110028Ph:011-41410592/93/94Fax:011-41410591
Detailed list of Link Intime Offices is available at their websitewww.linkintime.co.in.
Share Transfer System:
The Company’s shares are traded in the Stock Exchanges compulsorily in dematerialised mode. Physical Shares which are lodged with the RTA and/ or Company for transfer areprocessed and returned to the shareholders duly transferred within the time stipulatedundertheListingAgreement,subject
to documents being found valid and complete in all respects.The dematerialised shares are transferred directly to the beneficiariesbythedepositories.
Distribution of Shareholding as on March 31, 2014:
S. No.
Category No. of Share-
holders
% of Share-
holders
Amount(`)
% of Amount
Amount (`)
From To
1 1 5,000 16,680 97.81 66,59,640 1.02
2 5,001 10,000 134 0.79 10,18,580 0.16
3 10,001 20,000 60 0.35 8,83,100 0.14
4 20,001 30,000 21 0.12 5,30,280 0.08
5 30,001 40,000 23 0.14 8,45,980 0.13
6 40,001 50,000 9 0.05 4,29,440 0.07
7 50,001 1,00,000 24 0.14 17,47,450 0.27
8 1,00,001 and above
101 0.59 64,22,75,830 98.14
Total 17,052 100.00 65,43,90,300 100.00
Shareholding Pattern as on March 31, 2014:
S. No.
Category No. of Shares held
% of Shareholding
A PROMOTERS HOLDING
1 Promoters & Promoters Group
3,24,47,474 49.58
Sub-Total 3,24,47,474 49.58
B NON- PROMOTER HOLDINGS
2 Institutional Investors
a Mutual Funds and UTI 37,149 0.06
b Banks, Financial Institutions, Insurance Companies(Central/State Government Institutions/Non-Government Institutions)
7,637 0.01
c FIIs 3,05,06,516 46.62
Sub-Total 3,05,51,302 46.69
3 Others
a Corporate Bodies 9,73,318 1.49
b Resident Individuals 9,81,529 1.50
c NRIs 43,572 0.07
d Trusts - 0.00
e HUF 26,818 0.04
f ClearingMembers 4,15,017 0.63
Sub-Total 24,40,254 3.73
Grand Total 6,54,39,030 100.00
1,400.00
1,300.00
1,200.00
1,100.00
1,000.00
900.00
800.00
23,000.00
22,000.00
21,000.00
20,000.00
19,000.00
18,000.00
17,000.00
16,000.00
Apr-1
3
May
-13
Jun-
13
Jul-1
3
Aug-
13
Sep-
13
Oct-
13
Nov-
13
Dec-
13
Jan-
14
Feb-
14
Mar
-14
JUBLFOOD SENSEX

Jubilant FoodWorks Limited 45
Writing on Tom
orrow’s Tim
eline Strategic Review Statutory Reports Financial Statem
ents
Dematerialisation of Shares and Liquidity:
As at March 31, 2014, all equity shares of the Company were held in dematerialised form except 81 equity shares which were in physical form.
Outstanding GDRs/ ADRs/ Warrants or any Convertible instruments, conversion date and likely impact on equity:
As on March 31, 2014, a total of 3,71,547 options were outstanding under the Employees Stock Option Plan 2007 and 6,57,840 options under JFL Employees Stock Option Scheme 2011.Eachoptionisconvertibleintooneequityshareof`10/-each. The Company had not issued any GDRs/ADRs/Warrantsetc. during FY 2014.
Plant Locations:
The Company has 726 Domino’s Pizza Restaurants and 26 Dunkin’ Donuts Restaurants as on March 31, 2014.
Further, the Company has total 6 manufacturing locations/commissaries, out of which 3 (three) are located in north region & one each in west, south & east region.
CODE OF CONDUCT
The Board of Directors has laid down a Code of Conduct, which is applicable to all Board Members and Senior ManagementPersonneloftheCompany.TheCodehasalsobeenpostedonthe website of the Company. All Board Members and SeniorManagement Personnel have affirmed compliance with the Code of Conduct.
ThedeclarationsignedbytheCEOaffirmingcompliancetotheCodebytheBoardmembersandSeniorManagementPersonnelhasbeenplacedasAnnexure–IattheendofthisReport.
CEO/ CFO CERTIFICATION
In compliance with Clause 49(V) of the Listing Agreement, a declaration by CEO and CFO was placed before the Board,certifying the accuracy of Financial Statements and the adequacy of internal controls pertaining to Financial Reporting.
CORPORATE GOVERNANCE CERTIFICATE
In compliance with Clause 49(VII) of the Listing Agreement, a certificate from M/s. Chandrasekaran Associates, CompanySecretaries, confirming compliance with the conditions of the CorporateGovernancehasbeenplacedasAnnexure–IIattheend of this Report.
Shareholding Pattern as on March 31, 2014
49.58%
0.07%
0.74%1.50%
Promoters & Promoter
Group
MutualFunds/Banks
OthersIndianPublic
46.62%FIIs
1.49%Corporate Bodies

Annual Report 2013-1446
ANNEXURE - I
DECLARATION ON CODE OF CONDUCTItisherebydeclaredthatallBoardmembersandSeniorManagementPersonneloftheCompanyhaveaffirmedcompliancewiththeCode of Conduct for the year ended March 31, 2014.
Sd/-
Ajay Kaul
CEO cum Whole Time Director
Date: May 19, 2014Place: Noida
ANNEXURE – II
COMPLIANCE CERTIFICATE ON CONDITIONS OF CORPORATE GOVERNANCE
The Members,
Jubilant FoodWorks Limited
B-214, Phase II
District Gautam Budh Nagar
Noida – 201 305
Uttar Pradesh
WehaveexaminedallrelevantrecordsofJubilantFoodWorksLimited(theCompany)forthepurposeofcertifyingoftheconditionsof the Corporate Governance under Clause 49 of the Listing Agreement with Stock Exchanges for the financial year ended March 31, 2014.Wehaveobtainedalltheinformationandexplanationswhichtothebestofourknowledgeandbeliefwerenecessaryforthepurposes of certification.
ThecomplianceoftheconditionsofCorporateGovernanceistheresponsibilityofthemanagement.Ourexaminationwaslimitedtotheproceduresandimplementationthereof.ThiscertificateisneitheranassuranceastothefutureviabilityoftheCompanynorofthe efficacy or effectiveness with which the management has conducted the affairs of the Company.
Onthebasisofourexaminationoftherecordsproducedexplanationsandinformationfurnished,wecertifythattheCompanyhascomplied with the conditions of Clause 49 of the Listing Agreement.
For Chandrasekaran AssociatesCompany Secretaries
Sd/-Dr. S. Chandrasekaran
Senior Partner
(MembershipNo.FCS1644,CP715)
Place: Delhi Date: May 19, 2014

Jubilant FoodWorks Limited 47
Writing on Tom
orrow’s Tim
eline Strategic Review Statutory Reports Financial Statem
ents
(“the Act”) in the manner so required and give a true and fair view in conformity with the accounting principles generally accepted in India:
(a) in the case of the Balance Sheet, of the state of affairs of the Company as at March 31, 2014;
(b) in the case of the Statement of Profit and Loss, of the profit for the year ended on that date; and
(c) in the case of the Cash Flow Statement, of the cash flows for the year ended on that date.
Report on Other Legal and Regulatory Requirements
1. As required by the Companies (Auditor’s Report) Order, 2003 (“the Order”) issued by the Central Government of India in terms of sub-section (4A) of section 227 of the Act, we give in the Annexure a statement on the matters specified in paragraphs 4 and 5 of the Order.
2. As required by section 227(3) of the Act, we report that:
(a) We have obtained all the information and explanations which to the best of our knowledge and belief were necessary for the purpose of our audit;
(b) In our opinion proper books of account as required by law have been kept by the Company so far as appears from our examination of those books;
(c) The Balance Sheet, Statement of Profit and Loss, and Cash Flow Statement dealt with by this Report are in agreement with the books of account;
(d) In our opinion, the Balance Sheet, the Statement of Profit and Loss, and the Cash Flow Statement comply with the Accounting Standards notified under the Companies Act, 1956, read with General Circular 8/2014 dated April 4, 2014 issued by the Ministry of Corporate Affairs;
(e) On the basis of written representations received from the directors as on March 31, 2014, and taken on record by the Board of Directors, none of the directors is disqualified as on March 31, 2014, from being appointed as a director in terms of clause (g) of sub-section (1) of section 274 of the Companies Act, 1956.
For S.R. Batliboi & CO. LLP
Chartered AccountantsICAI Firm Registration Number: 301003E
Sd/-per Rajiv GoyalPartnerMembership Number: 94549
Place : GurgaonDate : May 19, 2014
To the Members of Jubilant FoodWorks Limited
Report on the Financial Statements
We have audited the accompanying financial statements of Jubilant FoodWorks Limited (“the Company”), which comprise the Balance Sheet as at March 31, 2014, and the Statement of Profit and Loss and Cash Flow Statement for the year then ended, and a summary of significant accounting policies and other explanatory information.
Management’s Responsibility for the Financial Statements
Management is responsible for the preparation of these financial statements that give a true and fair view of the financial position, financial performance and cash flows of the Company in accordance with accounting principles generally accepted in India, including the Accounting Standards notified under the Companies Act, 1956, read with General Circular 8/2014 dated April 4, 2014 issued by the Ministry of Corporate Affairs. This responsibility includes the design, implementation and maintenance of internal control relevant to the preparation and presentation of the financial statements that give a true and fair view and are free from material misstatement, whether due to fraud or error.
Auditor’s Responsibility
Our responsibility is to express an opinion on these financial statements based on our audit. We conducted our audit in accordance with the Standards on Auditing issued by the Institute of Chartered Accountants of India. Those Standards require that we comply with ethical requirements and plan and perform the audit to obtain reasonable assurance about whether the financial statements are free from material misstatement.
An audit involves performing procedures to obtain audit evidence about the amounts and disclosures in the financial statements. The procedures selected depend on the auditor’s judgment, including the assessment of the risks of material misstatement of the financial statements, whether due to fraud or error. In making those risk assessments, the auditor considers internal control relevant to the Company’s preparation and fair presentation of the financial statements in order to design audit procedures that are appropriate in the circumstances but not for the purpose of expressing an opinion on the effectiveness of the entity’s internal control. An audit also includes evaluating the appropriateness of accounting policies used and the reasonableness of the accounting estimates made by management, as well as evaluating the overall presentation of the financial statements. We believe that the audit evidence we have obtained is sufficient and appropriate to provide a basis for our audit opinion.
Opinion
In our opinion and to the best of our information and according to the explanations given to us, the financial statements give the information required by the Companies Act, 1956
IndependentAuditor’s Report

Annual Report 2013-1448
Annexure referred to in paragraph [1] of “Other Legal and Regulatory Requirements” in our report of even date
Re: Jubilant FoodWorks Limited
(i) (a) The Company has maintained proper records showing full particulars, including quantitative details and situation of fixed assets.
(b) All fixed assets were physically verified by the management in the previous year in accordance with a planned programme of verifying them once in two years which, in our opinion, is reasonable having regard to the size of the Company and the nature of its assets. No material discrepancies were noticed on such verification.
(c) There was no substantial disposal of fixed assets during the year.
(ii) (a) The management has conducted physical verification of inventory at reasonable intervals during the year.
(b) The procedures of physical verification of inventory followed by the management are reasonable and adequate in relation to the size of the Company and the nature of its business.
(c) The Company is maintaining proper records of inventory and no material discrepancies were noticed on physical verification.
(iii) (a) According to the information and explanations given to us, the Company has not granted any loans, secured or unsecured to companies, firms or other parties covered in the register maintained under section 301 of the Companies Act, 1956. Accordingly the provisions of clause 4(iii)(a) to (d) of the Order are not applicable to the Company and hence not commented upon.
(b) According to the information and explanations given to us, the Company has not taken any loan, secured or unsecured, from companies, firms or other parties covered under section 301 of the Companies Act, 1956. Accordingly the provisions of clause 4(iii)(e) to (g) are not applicable to the Company and not commented upon.
(iv) In our opinion and according to the information and explanations given to us, there is an adequate internal control system commensurate with the size of the Company and the nature of its business, for the purchase of inventory and fixed assets and for the sale of goods
and services. During the course of our audit, no major weakness has been noticed in the internal control system in respect of these areas. During the course of our audit, we have not observed any continuing failure to correct major weakness in internal control system of the Company in respect of these areas.
(v) In our opinion, there are no contracts or arrangements that need to be entered in the register maintained under Section 301 of the Companies Act, 1956. Accordingly, the provisions of clause 4(v)(b) of the Order is not applicable to the Company and hence not commented upon.
(vi) The Company has not accepted any deposits from the public.
(vii) In our opinion, the Company has an internal audit system commensurate with the size and nature of its business.
(viii) We have broadly reviewed the books of account maintained by the Company pursuant to the rules made by the Central Government for the maintenance of cost records under section 209(1)(d) of the Companies Act, 1956, relating to making of fast food items and are of the opinion that prima facie, the prescribed accounts and records have been made and maintained. We have not, however made a detailed examination of the same.
(ix) (a) Undisputed statutory dues including provident fund, investor education and protection fund, or employees’ state insurance, income-tax, sales-tax, wealth-tax, service tax, customs duty, excise duty, cess and other material statutory dues have generally been regularly deposited with the appropriate authorities.
(b) According to the information and explanations given to us, no undisputed amounts payable in respect of provident fund, investor education and protection fund, employees’ state insurance, income-tax, wealth-tax, service tax, sales-tax, customs duty, excise duty, cess and other undisputed statutory dues were outstanding, at the year end, for a period of more than six months from the date they became payable.
(c) According to the records of the Company, the dues outstanding of income-tax, sales-tax, wealth-tax, service tax, customs duty, excise duty and cess on account of any dispute, are as follows:
IndependentAuditor’s Report
IndependentAuditor’s Report (Contd.)

Jubilant FoodWorks Limited 49
Writing on Tom
orrow’s Tim
eline Strategic Review Statutory Reports Financial Statem
ents
Name of the statute Nature of dues Amount (` in Lakh)
Period to which the amount relates
Forum where dispute is pending
Andhra Pradesh Value Added Tax
Recovery of Incorrect input tax credit on LPG
69.45 April, 2008 to March, 2014 Deputy Commissioner of APVAT Act
Central Excise Act, 1944 Excise Demand on Chicken wings and dips
2.51 October, 2000 to March, 2005 Commissioner (Appeals) of Central Excise
Income Tax Act, 1961 Disallowance of expenses
10.36 2003-04 and 2005-06 Income Tax Appellate Tribunal referred back to Assesing Officer
Income Tax Act, 1961 Disallowance of expenses
656.88 2006-07 to 2009-10 Income Tax Appellate Tribunal
Income Tax Act, 1961 Disallowance of expenses
1,302.83 2010-11 and 2011-12 Commissioner of Income Tax (Appeals)
(x) The Company has no accumulated losses at the end of the financial year and it has not incurred cash losses in the current and immediately preceding financial year.
(xi) Based on our audit procedures and as per the information and explanations given by the management, we are of the opinion that the Company has no dues to any financial institutions, banks or debenture holders at any time during the year. Accordingly, the provisions of this clause are not applicable to the Company and hence not commented upon.
(xii) According to the information and explanations given to us and based on the documents and records produced to us, the Company has not granted loans and advances on the basis of security by way of pledge of shares, debentures and other securities.
(xiii) In our opinion, the Company is not a chit fund or a nidhi / mutual benefit fund / society. Therefore, the provisions of clause 4(xiii) of the Companies (Auditor’s Report) Order, 2003 (as amended) are not applicable to the Company.
(xiv) In our opinion, the Company is not dealing in or trading in shares, securities, debentures and other investments. Accordingly, the provisions of clause 4(xiv) of the Companies (Auditor’s Report) Order, 2003 (as amended) are not applicable to the Company.
(xv) According to the information and explanations given to us, the Company has not given any guarantee for loans taken by others from banks or financial institutions.
(xvi) The Company did not have any term loans outstanding during the year.
(xvii) According to the information and explanations given to us and on an overall examination of the balance sheet of the Company, we report that no funds raised on short-term basis have been used for long-term investment.
(xviii) The Company has not made any preferential allotment of shares to parties or companies covered in the register maintained under section 301 of the Companies Act, 1956.
(xix) The Company did not have any outstanding debentures during the year.
(xx) The Company has not raised any money by way of public issue during the year.
(xxi) We report that during the period under audit the management has noticed an instance of fraud on the Company by an employee involving misappropriation of cash during payment disbursement amounting to ` 40.53 Lakh. The Company has taken all necessary steps, including taking criminal action against the said employee and has fully provided for the same in the financial statements.
For S.R. BATLIBOI & CO. LLP
Firm registration number: 301003EChartered Accountants
Sd/-per Rajiv GoyalPartner Membership No.: 94549
Place : GurgaonDate : May 19, 2014
IndependentAuditor’s Report
IndependentAuditor’s Report (Contd.)

Annual Report 2013-1450
Balance Sheetas at March 31, 2014
(` in Lakh)Particulars Note
No.As at
March 31, 2014As at
March 31, 2013I. EQUITY AND LIABILITIES1 Shareholders’ funds
(a) Share capital 3 6,543.90 6,528.34(b) Reserves and surplus 4 49,803.07 37,093.22
2 Share application money pending allotment 5 1.75 -3 Non-current liabilities
(a) Other long term liabilities 6 891.95 602.82(b) Deferred tax liabilities (Net) 7 3,707.31 1,981.30
4 Current liabilities(a) Trade payables 8 17,176.71 13,175.49(b) Other current liabilities 9 7,942.57 5,389.25(c) Short-term provisions 10 1,142.30 718.91TOTAL 87,209.56 65,489.33
II. ASSETS1 Non-current assets
(a) Fixed assets 11 (i) Tangible assets 51,365.50 37,108.00 (ii) Intangible assets 1,509.99 1,163.56 (iii) Capital work-in-progress (Refer note 34) 1,832.95 843.98(b) Non-current investments 12 3,484.52 2,103.59(c) Long-term loans and advances 13 10,592.48 7,249.26(d) Other non-current assets 14 41.60 34.08
2 Current assets(a) Current investments 12 9,374.56 9,400.61(b) Inventories 15 3,242.33 2,344.39(c) Trade receivables 16 903.93 808.79(d) Cash and bank balances 17 2,277.78 3,707.36(e) Short-term loans and advances 18 2,569.38 719.93(f) Other current assets 19 14.54 5.78TOTAL 87,209.56 65,489.33Summary of significant accounting policies 2.1
The accompanying notes are an integral part of the financial statements.
As per our report of even date
For S. R. Batliboi & Co. LLP For and on behalf of the Board of Directors of Jubilant FoodWorks LimitedFirm Registration Number: 301003EChartered Accountants
Sd/- Sd/- Sd/- Sd/-Per Rajiv Goyal Shyam S. Bhartia Hari S. Bhartia Ajay KaulPartner Chairman Co-Chairman CEO cum Whole Time DirectorMembership No. 94549 DIN No. 00010484 DIN No. 00010499 DIN No. 00062135
Sd/- Sd/- Mona Aggarwal Ravi S. Gupta Company Secretary President & Chief Financial Officer
Place : Gurgaon Place : NoidaDate : May 19, 2014 Date : May 19, 2014

Jubilant FoodWorks Limited 51
Writing on Tom
orrow’s Tim
eline Strategic Review Statutory Reports Financial Statem
ents
Statement of Profit and Lossfor the year ended March 31, 2014
(` in Lakh)Particulars Note
No.Year E nded
March 31, 2014Year E nded
March 31, 2013
I INCOME
Revenue from operations (Net) 20 172,349.87 140,757.14
II OTHER INCOME 21 933.16 776.95
Total Revenue 173,283.03 141,534.09
III EXPENSES
Cost of materials consumed 22 38,220.50 30,626.90
Purchase of traded goods 23 6,723.13 6,038.26
(Increase)/Decrease in inventories of work-in-progress and traded goods
23 (70.74) 39.20
Employee benefit expenses 24 33,689.55 26,915.52
Depreciation and amortisation expense 11 7,666.56 5,467.17
Finance costs 26 - 6.35
Other expenses 25 68,281.71 52,697.84
Total expenses 154,510.71 121,791.24
IV PROFIT BEFORE TAX 18,772.32 19,742.85
V TAX EXPENSE
Current tax 4,434.28 4,727.61
Income Tax for earlier years 32.27 229.18
Deferred tax charge / (credit) 1,726.01 1,275.12
Total tax expense 6,192.56 6,231.91
VI PROFIT FOR THE YEAR 12,579.76 13,510.94
VII EARNINGS PER SHARE (IN `) 27
Basic 19.25 20.73
Diluted 19.12 20.55
Nominal Value per share 10.00 10.00
Summary of significant accounting policies 2.1
The accompanying notes are an integral part of the financial statements.
As per our report of even date
For S. R. Batliboi & Co. LLP For and on behalf of the Board of Directors of Jubilant FoodWorks LimitedFirm Registration Number: 301003EChartered Accountants
Sd/- Sd/- Sd/- Sd/-Per Rajiv Goyal Shyam S. Bhartia Hari S. Bhartia Ajay KaulPartner Chairman Co-Chairman CEO cum Whole Time DirectorMembership No. 94549 DIN No. 00010484 DIN No. 00010499 DIN No. 00062135
Sd/- Sd/- Mona Aggarwal Ravi S. Gupta Company Secretary President & Chief Financial Officer
Place : G urgaon Place : NoidaDate : May 19, 2014 Date : May 19, 2014

Annual Report 2013-1452
Cash Flow Statementfor the year ended March 31, 2014
(` in Lakh)Particulars Year Ended
March 31, 2014 Year Ended
March 31, 2013A) CASH FLOW FROM OPERATING ACTIVITIES
Net Profit before Tax 18,772.32 19,742.85
18,772.32 19,742.85
Adjustments for:
Depreciation 7,666.56 5,467.17
Loss/(Profit) on sale of investments - -
Loss on Disposal of Fixed Assets (net) 36.11 161.73
Lease Rent Straight-lining 315.65 216.39
Interest Income (58.17) (78.70)
Dividend Income (782.38) (683.60)
Interest Expenses - 6.35
Provision for Doubtful Debts and Advances 49.53 38.00
Operating Profit before Working Capital Changes 25,999.62 24,870.19
Adjustments for :
(Increase)/Decrease in Trade receivables (95.14) (34.74)
(Increase)/Decrease in Other Current Assets (8.76) (4.77)
(Increase)/Decrease in Loans and Advances (4,376.46) (1,455.49)
(Increase)/Decrease in Inventories (897.94) (502.79)
Increase/(Decrease) in Current Liabilities and Provisions 6,732.12 3,287.55
Cash generated from Operating Activities 27,353.44 26,159.95
Direct Taxes Paid (4,264.52) (5,183.32)
Net Cash from Operating Activities 23,088.92 20,976.63
B) CASH FLOW FROM INVESTING ACTIVITIES
Purchase of Fixed Assets (24,165.21) (18,202.30)
Proceeds from Sale of Fixed Assets 73.25 19.24
Interest Received 58.17 78.70
Dividend Received 782.38 683.60
Investment in bank deposits (3,462.33) (2,002.10)
Redemption of bank deposits 4,123.16 1,442.62
Investments in Mutual Funds (91,759.72) (85,898.76)
Proceeds from Mutual Funds 91,733.67 85,724.85
Investments in Subsidiary (1,380.93) (1,010.93)
Net Cash (used) in Investing Activities (23,997.56) (19,165.08)

Jubilant FoodWorks Limited 53
Writing on Tom
orrow’s Tim
eline Strategic Review Statutory Reports Financial Statem
ents
Cash Flow Statementfor the year ended March 31, 2014 (Contd.)
(` in Lakh)Particulars Year E nded
March 31, 2014 Year E nded
March 31, 2013C) CASH FLOW FROM FINANCING ACTIVITIES
Proceeds from Issue of Share Capital (including Share Premium) 147.40 155.41
Interest Paid - (6.35)
Net Cash from Financing Activities 147.40 149.06
Net Increase in Cash and Cash Equivalents (A+B+C) (761.23) 1,960.61
Cash and Cash Equivalents as at beginning of the Year 3,039.01 1,078.40
Cash and Cash Equivalents as at end of the Year 2,277.78 3,039.01
Components of Cash and Cash Equivalents:
Cash-in-Hand 1,471.56 1,545.20
Cheques in Hand 7.12 7.92
Balances with Scheduled Banks in
- Current Accounts* 799.10 1,085.89
- Deposits with original maturity of less than 3 months - 400.00
Cash & Cash Equivalents in Cash Flow Statement: 2,277.78 3,039.01
* Includes ` 0.29 Lakh (Previous year ` 0.29 Lakh) for IPO Refund Account and is restrictive in nature.
Notes :
1. The above Cash Flow has been prepared under the ‘Indirect Method’ as set out in the Accounting Standard-3 on Cash Flow Statements, issued by the Institute of Chartered Accountants of India.
As per our report of even date
For S. R. Batliboi & Co. LLP For and on behalf of the Board of Directors of Jubilant FoodWorks LimitedFirm Registration Number: 301003EChartered Accountants
Sd/- Sd/- Sd/- Sd/-Per Rajiv Goyal Shyam S. Bhartia Hari S. Bhartia Ajay KaulPartner Chairman Co-Chairman CEO cum Whole Time DirectorMembership No. 94549 DIN No. 00010484 DIN No. 00010499 DIN No. 00062135
Sd/- Sd/- Mona Aggarwal Ravi S. Gupta Company Secretary President & Chief Financial Officer
Place : G urgaon Place : NoidaDate : May 19, 2014 Date : May 19, 2014

Annual Report 2013-1454
1. Corporate Information
Jubilant FoodWorks Limited (the Company) is a Jubilant Bhartia Group Company. The Company was incorporated in 1995 and initiated operations in 1996. The Company is listed in India on National Stock Exchange and Bombay Stock Exchange. The Company is a food service company. The Company & its subsidiary have the exclusive rights to develop and operate Domino’s Pizza brand in India, Sri Lanka, Bangladesh and Nepal. At present it operates in India and Sri Lanka. The Company also has exclusive rights for developing and operating Dunkin’ Donuts restaurants for India.
2. Basis of Preparation
The financial statements have been prepared and presented under the historical cost convention on the accrual basis of accounting, unless stated otherwise and comply with the mandatory Accounting Standards (‘AS’) prescribed under the Companies Act, 1956 read with the General Circular 08/2014 dated April 04, 2014 issued by the Ministry of Corporate Affairs, and other accounting principles generally accepted in India. The accounting policies adopted in the preparation of financial statements are consistent with those of the previous year.
2.1 Summary of significant accounting policies
a) Use of estimates
The preparation of financial statements in conformity with Indian GAAP, requires management to make judgments, estimates and assumptions that affect the reported amounts of revenue, expenses, assets and liabilities and disclosure of contingent liabilities at the end of the reporting period. Although these estimates are based upon management’s best knowledge of current events and actions, uncertainty about these assumptions and estimates could result in the outcomes requiring a material adjustment to the carrying amounts of assets or liabilities in future periods.
b) Tangible Fixed Assets
Fixed assets are stated at cost, less accumulated depreciation and impairment losses, if any. The cost comprises purchase price, borrowing cost if capitalisation criteria are met and directly attributable cost of bringing the asset to its working condition for the intended use. Any trade discounts and rebates are deducted in arriving at the purchase price.
Subsequent expenditure related to an item of fixed asset is added to its book value only if it
increases the future benefits from the existing asset beyond its previously assessed standard of performance. All other expenses on existing fixed assets, including day-to-day repair and maintenance expenditure and cost of replacing parts, are charged to the statement of profit and loss for the period during which such expenses are incurred.
Gains or losses arising from derecognition of fixed assets are measured as the difference between the net disposal proceeds and the carrying amount of the asset and are recognised in the statement of profit and loss when the asset is derecognised.
c) Depreciation
Depreciation on fixed assets is calculated on a straight-line basis using the rates arrived at based on the useful lives estimated by the management, or those prescribed under the Schedule XIV to the Companies Act, 1956, whichever is higher. The Company is charging depreciation on fixed assets based on the following estimated useful life.
Fixed Assets Estimated Useful Life (in no. of years)
Leasehold Improvements
9 or Actual lease period, whichever is lower
Plant & Machinery 5 to 20Office Equipment 2 to 10Furniture & Fixtures 5 to 10Vehicles 5
Fixed Assets costing below ` 5,000 are depreciated @ 100% p.a.
d) Intangibles
Intangible assets acquired separately are measured on initial recognition at cost. Following initial recognition, intangible assets are carried at cost less accumulated amortisation and accumulated impairment losses, if any.
Intangible assets are amortised on a straight line basis over the estimated useful economic life. If the persuasive evidence exists to the affect that useful life of an intangible asset exceeds ten years, the Company amortises the intangible asset over the best estimate of its useful life. Such intangible assets are tested for impairment annually, either individually or at the
Notesforming part of the Financial Statements for the year ended March 31, 2014

Jubilant FoodWorks Limited 55
Writing on Tom
orrow’s Tim
eline Strategic Review Statutory Reports Financial Statem
ents
cash-generating unit level. All other intangible assets are assessed for impairment whenever there is an indication that the intangible asset may be impaired.
Gains or losses arising from derecognition of an intangible asset are measured as the difference between the net disposal proceeds and the carrying amount of the asset and are recognised in the statement of profit and loss when the asset is derecognised.
A summary of amortisation policies applied to the Company’s intangible assets is as below:
Intangible assets Estimated Useful Life (in no. of years)
Software 5Territory fees & Store opening fees
15 & 5
The territory fee has been paid to the franchisor for running and operating Dunkin’ Donuts restaurants. The period of contract is for 15 years, during which the Company shall be deriving the economic benefits, and has accordingly amortised the same.
e) Expenditure during Construction Period
Expenditure directly relating to construction activity are capitalised. Expenditure which is not directly attributable to the construction activity incurred during the construction period are capitalised as part of the indirect construction cost. Other indirect expenditure incurred during the construction period which are not related to the construction activity nor are incidental thereto, are charged to the statement of profit and loss.
f) Impairment of tangible and intangible assets
The Company assesses at each reporting date whether there is an indication that an asset may be impaired. If any indication exists, or when annual impairment testing for an asset is required, the Company estimates the asset’s recoverable amount. An asset’s recoverable amount is the higher of an asset’s or cash-generating unit’s (CGU) net selling price and its value in use. The recoverable amount is determined for an individual asset, unless the asset does not generate cash inflows that are largely independent of those from other assets
or groups of assets. Where the carrying amount of an asset or CGU exceeds its recoverable amount, the asset is considered impaired and is written down to its recoverable amount. In assessing value in use, the estimated future cash flows are discounted to their present value using a pre-tax discount rate that reflects current market assessments of the time value of money and the risks specific to the asset. In determining net selling price, recent market transactions are taken into account, if available. If no such transactions can be identified, an appropriate valuation model is used.
The Company bases its impairment calculation on detailed budgets and forecast calculations which are prepared separately for each of the Company’s cash-generating units to which the individual assets are allocated. These budgets and forecast calculations are generally covering a period of five years. For longer periods, a long term growth rate is calculated and applied to project future cash flows after the fifth year.
After impairment, depreciation is provided on the revised carrying amount of the asset over its remaining useful life.
An assessment is made at each reporting date as to whether there is any indication that previously recognised impairment losses may no longer exist or may have decreased. If such indication exists, the Company estimates the asset’s or cash-generating unit’s recoverable amount. A previously recognised impairment loss is reversed only if there has been a change in the assumptions used to determine the asset’s recoverable amount since the last impairment loss was recognised. The reversal is limited so that the carrying amount of the asset does not exceed its recoverable amount, nor exceed the carrying amount that would have been determined, net of depreciation, had no impairment loss been recognised for the asset in prior years. Such reversal is recognised in the statement of profit and loss.
g) Leases
Where the Company is a lessee
Finance Lease, which effectively transfer to the Company substantially all the risks and benefits incidental to the ownership of the leased items, are capitalised at the inception of the lease term at the lower of fair value of the leased
Notesforming part of the Financial Statements for the year ended March 31, 2014 (Contd.)

Annual Report 2013-1456
item and the present value of minimum lease payments. Lease payments are apportioned between the finance charges and reduction of the lease liability so as to achieve a constant rate of interest on the remaining balance of the liability. Finance charges are recognised as finance costs in the statement of profit and loss. Lease management fees, legal charges and other initial direct costs of lease are capitalised.
A leased asset is depreciated on a straight-line basis over the useful life of the asset or the useful life envisaged in Schedule XIV to the Companies Act, 1956, whichever is lower. However, if there is no reasonable certainty that the Company will obtain the ownership by the end of the term of hire, the capitalised asset is depreciated on a straight-line basis over the shorter of the estimated useful life of the asset, the term of hire or the useful life envisaged in Schedule XIV to the Companies Act, 1956.
Leases, where the lessor effectively retains substantially all risks and benefits of ownership of the leased item, are classified as operating leases. Operating lease payments are recognised as an expense in the Statement of Profit and Loss on a straight line basis over the lease term.
h) Inventories
Inventories are valued as follows:Raw Materials, Stores, Spares and Packing Materials, Traded Goods and Work in progress
At the lower of cost and net realisable value. The cost for this purpose has been computed on FIFO basis.
Work in progress Lower of cost and net realisable value. Cost includes direct materials and labour and a proportion of manufacturing overheads computed on FIFO basis.
Net realisable value is the estimated selling price in the ordinary course of business, less estimated costs of completion and to make the sale.
i) Investments
Investments which are readily realisable and intended to be held for not more than one year from the date on which such investments are
made, are classified as current investments. All other investments are classified as long-term investments.
On initial recognition, all investments are measured at cost. The cost comprises purchase price and directly attributable acquisition charges such as brokerage, fees and duties.
Current investments are carried in the financial statement at lower of cost and fair value determined on an individual investment basis. Long-term investments are carried at cost. However, provision for diminution in value is made to recognise a decline other than temporary in the value of the investments.
On disposal of an investment, the difference between its carrying amount and net disposal proceeds is charged or credited to the statement of profit and loss.
j) Revenue RecognitionRevenue is recognised to the extent that it is probable that the economic benefits will flow to the Company and the revenue can be reliably measured.
Sale of GoodsRevenue from the sale of goods is recognised upon passage of title to the customers which coincides with their delivery.
InterestRevenue is recognised on a time proportion basis taking into account the amount outstanding and the rate applicable.
DividendsRevenue is recognised when the right to receive the payment is established by the balance sheet date.
Franchisee Fee (Sub franchisee income)Revenue is recognised on accrual basis in accordance with the terms of the relevant agreement, if there is significant certainty as to its collectability.
k) Foreign Currency TranslationForeign currency transactions
(i) Initial RecognitionForeign currency transactions are recorded in the reporting currency, by
Notesforming part of the Financial Statements for the year ended March 31, 2014 (Contd.)

Jubilant FoodWorks Limited 57
Writing on Tom
orrow’s Tim
eline Strategic Review Statutory Reports Financial Statem
ents
applying to the foreign currency amount the exchange rate between the reporting currency and the foreign currency on the date of the transaction.
(ii) ConversionForeign currency monetary items are reported using the closing rate. Non-monetary items which are carried in terms of historical cost denominated in a foreign currency are reported using the exchange rate at the date of the transaction.
(iii) Exchange DifferencesExchange differences arising on the settlement of monetary items, or on reporting such monetary items of company at rates different from those at which they were initially recorded during the year, or reported in previous financial statements, are recognised as income or as expenses in the year in which they arise.
l) Retirement and other employment Benefits(i) Gratuity liability under the Payment of
Gratuity Act is a defined benefit obligation and is provided for on the basis of an actuarial valuation on projected unit credit method made at the end of each financial year. The gratuity plan has been funded by policy taken from a Life Insurance company. Actuarial gains and losses for defined benefit plan are recognised in full in the period in which they occur in the statement of profit and loss.
(ii) Provident Fund (administered by a Trust) is a defined benefit scheme whereby the Company deposits an amount determined as a fixed percentage of basic pay to the fund every month. The benefit vests upon commencement of employment. The interest credited to the accounts of the employees is adjusted on an annual basis to confirm to the interest rate declared by the government for the Employees Provident Fund. The Guidance Note on implementing AS-15, Employee Benefits (revised 2005) states that provident funds set up by employers, which requires interest shortfall to be met by the employer, needs to be treated as defined benefit plan. The Actuarial Society of India has issued the final guidance for
measurement of provident fund liabilities. The Company has adopted actuary valuation to arrive at provident fund liability as at the reporting date.
Retirement benefits in the form of Pension cost is a defined contribution scheme and the contributions are charged to the Statement of profit and loss for the year when the contributions to the respective funds are due. There are no other obligations other than the contribution payable to the respective trusts.
(iii) Accumulated leave, which is expected to be utilised within the next 12 months, is treated as short-term employee benefit. The Company measures the expected cost of such absences as the additional amount that it expects to pay as a result of the unused entitlement that has accumulated at the reporting date. The Company treats accumulated leave expected to be carried forward beyond twelve months, as long-term employee benefit for measurement purpose. Such long term compensated absences are provided for based on the actuarial valuation using the projected unit credit method at the year-end. Actuarial gains/losses are immediately taken to the statement of profit and loss, and are not deferred. The Company presents the entire leave as a current liability in the balance sheet, since it does not have an unconditional right to defer its settlement for 12 months after the reporting date.
(iv) Actuarial gains/losses are immediately taken to statement of profit and loss and are not deferred.
m) Income Tax
Tax expense comprises of current & deferred tax.
Current income tax is measured at the amount expected to be paid to the tax authorities in accordance with the Indian Income Tax Act, 1961. Deferred income taxes reflects the impact of current year timing differences between taxable income and accounting income for the year and reversal of timing differences of earlier years.
Notesforming part of the Financial Statements for the year ended March 31, 2014 (Contd.)

Annual Report 2013-1458
Deferred tax is measured based on the tax rates and the tax laws enacted or substantively enacted at the balance sheet date. Deferred tax assets are recognised only to the extent that there is reasonable certainty that sufficient future taxable income will be available against which such deferred tax assets can be realised. If the Company has carry forward of unabsorbed depreciation and tax losses, deferred tax assets are recognised only if there is virtual certainty supported by convincing evidence that such deferred tax assets can be realised against future taxable profits.
Unrecognised deferred tax assets of earlier years are reassessed and recognised to the extent that it has become reasonably certain or virtually certain, as the case may be that sufficient future taxable income will be available against which such deferred tax assets can be realised.
n) Earnings Per Share
Basic earnings per share is calculated by dividing the net profit or loss for the year attributable to equity shareholders by the weighted average number of equity shares outstanding during the year.
For the purpose of calculating diluted earning per share, the net profit or loss for the year attributable to equity shareholders and the weighted average number of shares outstanding during the year are adjusted for the effects of all dilutive potential equity shares.
o) Provisions
A provision is recognised when the Company has a present obligation as a result of past event and it is probable that an outflow of resources will be required to settle the obligation, in respect of which a reliable estimate can be made. Provisions are not discounted to its present value and are determined based on best management estimate required to settle the obligation at the balance sheet date. These are reviewed at each Balance Sheet date and adjusted to reflect the current best management estimates.
p) Segment Reporting Policies
As the Company’s business activity primarily falls within a single business and geographical segment, thus there are no additional disclosures to be provided under Accounting
Standard 17 - “Segment Reporting”. The management considers that the various goods and services provided by the Company constitutes single business segment, since the risk and rewards from these services are not different from one another. The Company’s operating businesses are organised and managed separately according to the nature of products and services provided, with each segment representing a strategic business unit that offers different products and serves different markets. The analysis of geographical segments is based on geographical location of the customers.
q) Cash Flow StatementCash flows are reported using indirect method, whereby profit before tax is adjusted for the effects transactions of a non-cash nature and any deferrals or accruals of past or future cash receipts or payments. The cash flows from regular revenue generating, financing and investing activities of the Company are segregated. Cash and cash equivalents in the cash flow comprise cash at bank, cash/cheques in hand and short-term investments with an original maturity of three months or less.
r) Employee Stock Compensation CostMeasurement and disclosure of the employee share-based payment plans is done in accordance with SEBI (Employee Stock Option Scheme and Employee Stock Purchase Scheme) Guidelines, 1999 and the Guidance Note on Accounting for Employee Share-based Payments, issued by the Institute of Chartered Accountants of India. The Company measures compensation cost relating to employee stock options using the intrinsic value method.
s) Contingent liabilitiesA contingent liability is a possible obligation that arises from past events whose existence will be confirmed by the occurrence or non-occurrence of one or more uncertain future events beyond the control of the Company or a present obligation that is not recognised because it is not probable that an outflow of resources will be required to settle the obligation. A contingent liability also arises in extremely rare cases where there is a liability that cannot be recognised because it cannot be measured reliably. The Company does not recognise a contingent liability but discloses its existence in the financial statements.
Notesforming part of the Financial Statements for the year ended March 31, 2014 (Contd.)

Jubilant FoodWorks Limited 59
Writing on Tom
orrow’s Tim
eline Strategic Review Statutory Reports Financial Statem
ents
(` in Lakh)Particulars As a t
March 31, 2014As a t
March 31, 20133. SHARE CAPITAL Authorised Shares 80,000,000 (PY 80,000,000) equity shares of ` 10 each. 8,000.00 8,000.00 Issued, subscribed and fully paid -up shares 65,439,030 (PY 65,283,390) equity shares of ` 10 each fully paid-up 6,543.90 6,528.34 TOTAL 6,543.90 6,528.34
(a) Reconciliation of the shares outstanding at the beginning and at the end of the reporting period
Particulars As at March 31, 2014 As at March 31, 2013No. of shares
(in Lakh)Amount
(` in Lakh)No. of shares
(in Lakh)Amount
(` in Lakh)As at beginning of the year 652.83 6,528.34 650.78 6,507.79Add: Issued during the year - - - -Add: Issued during the year - ESOP 1.56 15.56 2.05 20.55Outstanding at the end of the year 654.39 6,543.90 652.83 6,528.34
(b) Terms/rights attached to equity shares
The Company has only one class of equity shares having par value of ` 10 per share. Each holder of equity shares is entitled to one vote per share. In the event of liquidation of the Company, the holders of equity shares will be entitled to receive remaining assets of the Company, after distribution of all preferential amounts. The distribution will be in proportion to the number of equity shares held by the shareholders.
(c) Shares held by holding/ultimate holding Company and/or their subsidiaries/associates
No shares are held by the subsidary of the Company. The Company does not have holding, ultimate holding company and associates.
(d) Details of shareholders holding more than 5% shares in the Company
Particulars As at March 31, 2014 As at March 31, 2013No. of shares
(in Lakh)% age No. of shares
(in Lakh)% age
Equity shares of ` 10 each fully paid upJubilant Enpro Private Limited 320.23 48.94% 320.23 49.05%Weston Investments Limited 4.25 0.65% 35.26 5.40%Arisaig Partners (Asia) Pte Ltd A/C Arisaig India Fund Ltd
26.66 4.07% 35.24 5.40%
Copthall Mauritius Investment Limited 41.32 6.31% 10.57 1.62%
(e) Shares reserved for issue under options
For details of shares reserved for issue under the employee stock option (ESOP) plan of the Company, please refer note 29.
Notesforming part of the Financial Statements for the year ended March 31, 2014 (Contd.)

Annual Report 2013-1460
(` in Lakh)Particulars As at
March 31, 2014As at
March 31, 20134. RESERVES & SURPLUS Securities Premium Reserve: Balance as per last financial statements 9,848.16 9,713.30 Add: Premium on issue of equity shares 130.09 134.86 Closing Balance (A) 9,978.25 9,848.16 Surplus/(deficit) in the statement of profit and loss Balance as per last financial statements 27,245.06 13,734.12 Add:Profit for the year 12,579.76 13,510.94 Net surplus in the statement of profit & loss (B) 39,824.82 27,245.06 Employee Stock options outstanding* - - TOTAL (A+B) 49,803.07 37,093.22
* The outstanding options under the ESOP Plan 2007 at the end of year are 371,547 (PY 524,647) & outstanding options under the ESOP Scheme 2011 at the end of year are 657,840 (PY 411,910) (Refer note 29)
Particulars As at March 31, 2014 As at March 31, 2013
No. of shares (in Lakh)
Amount (` in Lakh)
No. of shares (in Lakh)
Amount (` in Lakh)
5. SHARE APPLICATION MONEY PENDING ALLOTMENTShare application money pending allotment represents application received from employees on exercise of stock options granted and vested under the ESOP Plan 2007.Equity shares of ` 10 each proposed to be issued
0.05 0.50 - -
Total Amount of security premium.
- 1.25 - -
0.05 1.75 - -
The equity shares are expected to be allotted against the share application money within a reasonable period, not later than three months from the Balance Sheet date. As mentioned in note no 3, the Company has sufficient authorised share capital to cover the share capital amount on allotment of shares out of share application money
(` in Lakh)Particulars As at
March 31, 2014As at
March 31, 20136. OTHER LONG TERM LIABILITIES Trade Payables 878.95 589.82 Others Security deposits 13.00 13.00 TOTAL 891.95 602.82
Notesforming part of the Financial Statements for the year ended March 31, 2014 (Contd.)

Jubilant FoodWorks Limited 61
Writing on Tom
orrow’s Tim
eline Strategic Review Statutory Reports Financial Statem
ents
(` in Lakh)Particulars As a t
March 31, 2014As a t
March 31, 20137. DEFERRED TAX ASSETS/LIABILITY Deferred tax liability:
Fixed assets: Impact of difference between tax depreciation and depreciation/amortisation charged for financial reporting
4,796.30 2,800.00
Gross deferred tax liability (A) 4,796.30 2,800.00Deferred tax assets:Impact of expenditure charged to statement of profit & loss in the current year/earlier years but allowable for tax purposes on payment basis
975.77 731.58
Other temporary disallowances 113.22 87.12Gross deferred tax asset (B) 1,088.99 818.70Net deferred tax liabilities (A-B) 3,707.31 1,981.30
8. TRADE PAYABLESCreditors for goods and services (Refer note 35 for details of dues to micro and small enterprises)
17,176.71 13,175.49
TOTAL 17,176.71 13,175.49
9. OTHER CURRENT LIABILITIESSecurity deposits 82.38 35.86Unearned Income 88.81 106.67Book overdraft 1,443.35 1,199.36Investor Education and Protection Fund shall be credited by following amounts (as and when due)- Unpaid application money received for allotment of shares and due for refund 0.29 0.29OthersCreditors for Capital goods 3,985.21 2,068.64Statutory dues 2,342.53 1,978.43TOTAL 7,942.57 5,389.25
10. SHORT TERM PROVISIONSProvision for employee benefits- Gratuity (Refer Note 32) 182.21 153.76- Leave benefits 720.88 565.15Others provisionsProvision for Income Tax (net of advance income tax) 169.76 -Provision for Contingencies (note no 28) 69.45 -TOTAL 1,142.30 718.91
Notesforming part of the Financial Statements for the year ended March 31, 2014 (Contd.)

Annual Report 2013-1462
(` in
Lak
h)
Part
icul
ars
Gros
s Bl
ock
Depr
ecia
tion
/ A
mor
tisa
tion
Net
Blo
ckA
s at
A
pril
1,
2013
Add
itio
n du
ring
the
ye
ar
Dele
tion
s du
ring
the
ye
ar
As
at
Mar
ch 3
1,
2014
As
at
Apr
il 1,
20
13
For
the
Year
Dele
tion
s du
ring
the
ye
ar
As
at
Mar
ch 3
1,
2014
As
at
Mar
ch 3
1,
2014
As
at
Mar
ch 3
1,
2013
11. F
IXED
ASS
ETS
TAN
GIBL
E A
SSET
SFr
eeho
ld L
and
3.41
--
3.41
--
--
3.41
3.41
Leas
ehol
d Im
prov
emen
ts
18,5
85.3
78,
057.4
779
.60
26,5
63.2
35,
157.5
62,
495.
9566
.25
7,58
7.28
18,9
75.9
513
,427
.81
Plan
t &
Mac
hine
ry
26,8
89.16
9,83
1.79
173.
0136
,547
.94
8,06
6.68
2,96
9.55
114.
6410
,921
.59
25,6
26.3
518
,822
.48
Offic
e Eq
uipm
ent
817.7
741
8.99
2.15
1,23
4.61
245.
8715
6.55
1.54
400.
8883
3.73
571.
90Fu
rnitu
re &
Fix
ture
s 4,
113.
042,
023.
839.
856,
127.0
22,
039.
5696
2.85
8.37
2,99
4.04
3,13
2.98
2,07
3.48
Vehi
cles
4,
205.
571,
345.
4920
6.98
5,34
4.08
1,99
6.66
746.
6119
2.27
2,55
1.00
2,79
3.08
2,20
8.91
Tota
l- A
54
,614
.32
21,6
77.5
747
1.59
75,8
20.2
917
,506
.33
7,33
1.51
383.
0724
,454
.79
51,3
65.5
037
,107
.99
INTA
NGI
BLE
ASS
ETS
Stor
e Op
enin
g Fe
es &
Te
rrito
ry F
ees
1,79
0.00
552.
29-
2,34
2.29
664.
5825
9.60
-92
4.18
1,41
8.11
1,125
.41
Soft
war
e 27
5.12
129.1
8-
404.
3023
6.97
75.4
5-
312.
4291
.88
38.15
Tota
l- B
2,06
5.12
681.
47-
2,74
6.59
901.
5533
5.05
-1,
236.
601,
509.
991,
163.
56TO
TAL
(A+B
) 56
,679
.44
22,3
59.0
447
1.59
78,5
66.8
818
,407
.88
7,66
6.56
383.
0725
,691
.39
52,8
75.4
938
,271
.55
Part
icul
ars
As
at
Apr
il 1,
20
12
Add
itio
n du
ring
the
ye
ar
Dele
tion
s du
ring
the
ye
ar
As
at M
arch
31
, 201
3A
s at
A
pril
1,
2012
For
the
Year
Dele
tion
s du
ring
the
ye
ar
As
at
Mar
ch 3
1,
2013
As
at
Mar
ch 3
1,
2013
As
at
Mar
ch 3
1,
2012
TAN
GIBL
E A
SSET
SFr
eeho
ld L
and
3.41
--
3.41
--
--
3.41
3.41
Leas
ehol
d Im
prov
emen
ts
12,11
1.51
6,66
7.15
193.
2918
,585
.37
3,60
6.84
1,69
0.25
139.
535,
157.5
613
,427
.81
8,50
4.67
Plan
t &
Mac
hine
ry
18,7
54.3
88,
818.
4668
3.68
26,8
89.16
6,51
9.21
2,15
4.31
605.1
98,
066.
6818
,822
.48
12,2
35.17
Offic
e Eq
uipm
ent
391.
4543
4.39
8.07
817.7
718
2.39
71.2
07.7
224
5.87
571.
9020
9.06
Furn
iture
& F
ixtu
res
2,76
3.84
1,40
1.14
51.9
44,
113.
041,
395.
6368
7.48
43.5
52,
039.
562,
073.
481,
368.
20Ve
hicl
es
3,30
5.66
1,07
7.08
177.1
74,
205.
571,
565.
6959
7.80
166.
831,
996.
662,
208.
911,
739.
93To
tal-
A
37,3
30.2
518
,398
.22
1,11
4.15
54,6
14.3
213
,269
.76
5,20
1.04
962.
8217
,506
.33
37,1
07.9
924
,060
.44
INTA
NGI
BLE
ASS
ETS
Stor
e Op
enin
g Fe
es &
Te
rrito
ry F
ees
1,41
6.50
373.
50-
1,79
0.00
464.
5420
0.04
-66
4.58
1,125
.41
951.
96
Soft
war
e 21
2.10
63.0
2-
275.1
217
0.88
66.0
9-
236.
9738
.1541
.22
Tota
l- B
1,62
8.60
436.
52-
2,06
5.12
635.
4226
6.13
-90
1.55
1,16
3.56
993.
18Pr
evio
us Y
ear
TO
TAL
(A+B
) 38
,958
.85
18,8
34.7
41,
114.
1556
,679
.44
13,9
05.1
85,
467.1
796
2.82
18,4
07.8
838
,271
.55
25,0
53.6
2
Notesforming part of the Financial Statements for the year ended March 31, 2014 (Contd.)

Jubilant FoodWorks Limited 63
Writing on Tom
orrow’s Tim
eline Strategic Review Statutory Reports Financial Statem
ents
Notesforming part of the Financial Statements for the year ended March 31, 2014 (Contd.)
(` in Lakh)Particulars Non-current Current
As at March 31, 2014
As at March 31, 2013
As at March 31, 2014
As at March 31, 2013
12. INVESTMENTTrade investments (Valued at cost unless stated otherwise)Unquoted equity instrumentsInvestment in subsidiary:789.22 Lakh equity shares of LKR 10 each fully paid up in Jubilant FoodWorks Lanka (Pvt) Ltd. (Previous Year 497.34 Lakh equity shares of LKR 10 each fully paid up in Jubilant FoodWorks Lanka (Pvt) Ltd.)
3,484.52 2,103.59 - -
Other than Trade investments (Valued at lower of cost and market value)Investments in Mutual Funds (Unquoted)Reliance Liquid Fund-Treasury Plan-Daily Dividend Option LFIDNil Units (Previous Year 98,182.7060) of ` Nil (Previous Year ` 15.2874) each in Reliance Liquid Fund-Treasury Plan-Daily Dividend Option LFID
- 1,500.96
Reliance Money Manager Fund-Daily Dividend Plan-LPID125,036.1690 units (Previous Year 305,194.8030) of ` 1002.0864 (Previous Year ` 1001.3715) each in Reliance Money Fund-Daily Dividend Plan-LPID
1,252.19 3,056.13
Reliance Dynamic Bond Fund-Growth Plan - Growth Option7,333,035.938 Units (Previous Year NIL) of ` 16.4408 (Previous Year NIL) each in Reliance Dynamic Bond Fund-Growth Plan - Growth Option
1,200.00 -
HDFC Liquid Fund - Dividend - Daily ReinvestNil units (Previous Year 14,433,381.3040) of ` Nil (Previous Year ` 10.1982) each in HDFC Liquid Fund-Dividend-Daily Reinvest
- 1,471.95
HDFC Floating Rate Income Fund-Short Term Plan-Wholesale Option- Dividend Reinvestment-DailyNil units (Previous Year 5,981,140.8090) of ` Nil (Previous Year ` 10.0809) each in HDFC Floating Rate Income Fund-Short Term Plan-Wholesale Option- Dividend Reinvestment-Daily
- 602.95
HDFC Cash Managment Fund - Treasury Advantage Plan - Wholesale - Daily Dividend - Reinvestment28,987,250.296 Units (Previous Year NiL) of ` 10.0315 (Previous Year ` NiL) each in HDFC Cash Managment Fund - Treasury Advantage Plan - Wholesale Daily Dividend - Reinvestment
2,907.86 -
Birla Sun Life Cash Manager - Daily Dividend - Regular Plan4,002,766.963 Units (Previous Year 2,765,422.1570) of ` 100.4264 (Previous Year ` 100.1158) each in Birla Sunlife Cash Manager - Daily Dividend - Regular Plan
4,014.51 2,768.62
TOTAL 3,484.52 2,103.59 9,374.56 9,400.61Aggregate amount of unquoted investments at cost - - 9,374.56 9,400.61Aggregate amount of unquoted investments at market value (At respective net asset values of mutual fund)
- - 9,386.27 9,403.97
Aggregate amount of unquoted investments 3,484.52 2,103.59 - -

Annual Report 2013-1464
Notesforming part of the Financial Statements for the year ended March 31, 2014 (Contd.)
(` in Lakh)Particulars As at
March 31, 2014As at
March 31, 201313. LONG TERM LOANS & ADVANCES
(Unsecured, considered good unless stated otherwise)Capital Advances - Considered good 1,165.50 348.30- Considered doubtful 49.53 -
1,215.03 348.30Less: Provision for doubtful deposits 49.53 -TOTAL 1,165.50 348.30
Advances recoverable in cash or in kind or value to be received 4.49 14.80Security and other deposits:- Considered good 9,080.11 6,511.51- Considered doubtful 74.54 74.54
9,154.65 6,586.05Less: Provision for doubtful deposits 74.54 74.54
9,080.11 6,511.51Other loans & advancesAdvance tax (Net of provision for tax) 342.38 374.65TOTAL 10,592.48 7,249.26
14. OTHER NON CURRENT ASSETSBalance with Bank:Deposits with original maturity of more than 12 months 41.60 34.08TOTAL 41.60 34.08[Fixed deposits receipts aggregating to ` 34.93 Lakh (PY ` 34.08 Lakh) are pledged with government authorities]
15. INVENTORIES(valued at lower of cost and net realisable value)Traded Goods 282.90 219.72Raw Materials {including Material in Transit ` 75.81 Lakh (Previous year ` 41.52 Lakh)}
2,072.04 1,545.64
Stores, Spares and Packing Materials 846.71 545.91Material in Process 40.68 33.12TOTAL 3,242.33 2,344.39
16. TRADE RECEIVABLES(Unsecured, considered good unless stated otherwise)Outstanding for a period exceeding six months from the date they are due for payment
0.70 0.36
Other Debts 903.23 808.43 TOTAL 903.93 808.79

Jubilant FoodWorks Limited 65
Writing on Tom
orrow’s Tim
eline Strategic Review Statutory Reports Financial Statem
ents
Notesforming part of the Financial Statements for the year ended March 31, 2014 (Contd.)
(` in Lakh)Particulars As a t
March 31, 2014As a t
March 31, 201317. CASH AND BANK BALANCES
Cash and cash equivalentsCash in hand 1,471.56 1,545.20Cheques in hand 7.12 7.92Balances with scheduled banks in: - Current accounts* 799.10 1,085.89* Includes ` 0.29 Lakh (Previous year ` 0.29 Lakh) for IPO Refund Account and is restrictive in nature.- Deposits with original maturity of less than 3 months - 400.00TOTAL (A) 2,277.78 3,039.01Other bank balancesDeposits with original maturity for more than than 12 monthsDeposits with original maturity for more than than 12 months 6.67 668.35Deposits pledged with government authorities 34.93 34.08Less: Amount disclosed under non-current assets (refer note 14) 41.60 34.08[Fixed deposits aggregating to ` 34.93 Lakh (PY ` 34.08 Lakh) are pledged with government authorities]TOTAL (B) - 668.35TOTAL (A+ B) 2,277.78 3,707.36
18. SHORT TERM LOANS AND ADVANCES(Unsecured, considered good unless stated otherwise)Advances recoverable in cash or in kind or value to be received:- Considered good 2,396.76 719.93- Considered doubtful 118.83 152.13
2,515.59 872.06Less: Provision for doubtful advances 118.83 152.13
2,396.76 719.93Service Tax recoverable 172.62 -TOTAL 2,569.38 719.93
19. OTHER CURRENT ASSETSInsurance claim recoverable 14.54 5.78TOTAL 14.54 5.78

Annual Report 2013-1466
Notesforming part of the Financial Statements for the year ended March 31, 2014 (Contd.)
(` in Lakh)Particulars Year Ended
March 31, 2014Year Ended
March 31, 201320. REVENUE FROM OPERATIONS
Sale of products:Manufactured goods 156,681.40 126,580.60Traded goods 15,638.26 14,151.39Other operating income:Sub-franchisee Income 30.21 25.15Revenue from operation 172,349.87 140,757.14Details of products sold:Manufactured goods soldPizza 134,544.94 106,577.28Others 22,136.46 20,003.32Total 156,681.40 126,580.60Traded goods soldBeverages 6,928.91 5,332.35Dessert 5,864.63 6,076.10Dips 2,471.70 2,698.67Others 373.02 44.27Total 15,638.26 14,151.39
21. OTHER INCOMEInterest Received- Bank deposits 58.17 78.70Dividend income from current investments- other than trade 782.38 683.60Miscellaneous income 92.61 14.65
TOTAL 933.16 776.95
22. COST OF MATERIALS CONSUMEDInventory at the beginning of the year 1,545.64 1,113.26Add: Purchases during the year 38,855.12 31,155.74
40,400.76 32,269.00Less: Sales during the year 108.22 96.46Less: Inventory at the end of the year {including Material in Transit ` 75.81 Lakh (Previous year ` 41.52 Lakh)}
2,072.04 1,545.64
Cost of materials consumed 38,220.50 30,626.90Details of raw materials consumedCheese 16,858.85 14,312.92Others 21,361.65 16,313.98TOTAL 38,220.50 30,626.90Details of InventoryCheese 846.40 617.01Others 1,225.64 928.63TOTAL 2,072.04 1,545.64

Jubilant FoodWorks Limited 67
Writing on Tom
orrow’s Tim
eline Strategic Review Statutory Reports Financial Statem
ents
(` in Lakh)Particulars Year E nded
March 31, 2014Year E nded
March 31, 201323. (INCREASE)/ DECREASE IN INVENTORIES
Opening StockWork in Progress 33.12 31.92Traded Goods 219.72 260.12Total (A) 252.84 292.04Less: Closing StockClosing Stock - Work in Progress 40.68 33.12Closing Stock - Traded Goods 282.90 219.72Total (B) 323.58 252.84TOTAL (A-B) (70.74) 39.20Details of Purchase of traded goodsPrepackaged Beverages 4,152.09 3,618.08Dessert 1,722.14 1,571.64Dips 848.90 848.54TOTAL 6,723.13 6,038.26Details of (increase)/decrease in inventoriesTraded Goods:Beverages (5.98) (17.72)Dessert (44.48) 62.62Dips (12.72) (4.50)Total (A) (63.18) 40.40Work in Progress Total (B) (7.56) (1.20)(INCREASE)/ DECREASE IN INVENTORIES (A+B) (70.74) 39.20Details of inventory at the end of the yearTraded Goods:Beverages 91.12 85.14Dessert 138.54 94.06Dips 53.24 40.52TOTAL 282.90 219.72Work in Process:Dough 40.68 33.12TOTAL 40.68 33.12
24. EMPLOYEE BENEFIT EXPENSESSalaries, Allowances & Bonus (Refer note 34) 29,223.24 23,141.71Gratuity (Refer note 34) 223.27 261.43Contribution to Provident and Other Funds 2,288.23 1,822.31Staff Welfare Expenses 1,954.81 1,690.07TOTAL 33,689.55 26,915.52
Notesforming part of the Financial Statements for the year ended March 31, 2014 (Contd.)

Annual Report 2013-1468
Notesforming part of the Financial Statements for the year ended March 31, 2014 (Contd.)
(` in Lakh)Particulars Year Ended
March 31, 2014Year Ended
March 31, 201325. OTHER EXPENSES
Stores Consumed 1,432.30 1,033.83Packing Materials Consumed 7,046.48 5,662.60Power & Fuel (Refer note 34) 10,233.19 7,266.52Repairs - Plant and Machinery 928.17 619.56Repairs - Others 1,804.27 1,393.25Rent (Refer note c below) (Refer note 34) 15,488.65 11,639.08Rates and Taxes 1,185.28 989.36Insurance 149.32 96.91Travelling and Conveyance 1,170.50 951.31Freight & Delivery Expenses 5,256.52 4,415.08Postage, Telephones and Telegrams 1,543.83 1,250.76Legal and Professional Charges (Refer note b below) 767.14 586.43Director's Sitting Fees 7.42 5.69Franchisee Fee 5,595.78 4,763.30Advertisement & Publicity Expenses (Refer note a below) 8,759.82 6,340.56Sundry balances written off - 13.07Provision for Doubtful Debts and Advances 49.53 38.00Loss on disposal of fixed assets (net) (including provision) 36.11 161.73Political Contribution (Refer note d below) 250.00 -Miscellaneous Expenses 6,577.40 5,470.80TOTAL 68,281.71 52,697.84
Notes:a) Advertisement and Publicity Expenses are net of amount received from business partner ` 1,455.65 Lakh (Previous Year
` 1,660.67 Lakh)b) Legal and Professional expenses include following expenses for payment to auditors
As Auditor:Audit fees 31.50 28.00Tax Audit fees 5.00 4.00Limited Review 19.50 18.00Others:Certification fees 2.50 2.50Reimbursement of expenses 11.97 12.21
(Inclusive of service Tax on entire fee, net of cenvat credit)c) The stores and office premises are obtained on operating leases. The lease term is generally for 1-28 years and the same
are generally renewable at the option of the lessee. The lease agreements have an escalation clause. There are no subleases and the leases are generally cancellable in nature. The aggregate lease rentals are charged as rent.
d) Information in respect of Political contributionDonation to Satya Electoral Trust 250.00 -
26. FINANCE COSTS Interest- Others - 6.35
TOTAL - 6.35

Jubilant FoodWorks Limited 69
Writing on Tom
orrow’s Tim
eline Strategic Review Statutory Reports Financial Statem
ents
(in Lakh)Particulars Year E nded
March 31, 2014Year E nded
March 31, 201327. EARNING PER SHARE (EPS)
Net profit after tax for calculation of Basic and Diluted EPS (` in Lakh) 12,579.76 13510.94Weighted average number of equity shares for calculation of Basic EPS 653.66 651.65Weighted average number of equity shares for calculation of Diluted EPS 657.97 657.61Basic EPS (in `) 19.25 20.73Diluted EPS (in `) 19.12 20.55Nominal value per share (in `) 10.00 10.00Reconciliation of number of shares:Weighted average number of equity shares for calculation of Basic EPS 653.66 651.65Add: Weighted number of ESOP outstanding 4.31 5.96Weighted average number of equity shares for calculation of Diluted EPS 657.97 657.61
28. CONTINGENT LIABILITY PROVIDED FOR: (` in Lakh)Particulars Opening Balance Additions Utilisation Closing Balance
VAT cases - 69.45 - 69.45
CONTINGENT LIABILITY NOT PROVIDED FOR:(` in Lakh)
Particulars March 31, 2014 March 31, 2013
Appeals filed by Tamil Nadu Sales Tax Department for various orders issued by the Appellate Assistant Commissioner (CT) in favour of the Company pertaining to the financial years 1998-99 to 2000-01.
- 114.80
The Sales Tax Appellate Tribunal has passed order in favour of the Company for the year 2001-02. The Company has received favarouable order from the Sales Tax Appellate Tribunal & the orders of 1st Appellate Authority i.e. Assistant Commissioner (CT) have been sustained by the hon'ble Tribunal.Tax demand for Excise Duty contested by the Company where the Company is confident that the ultimate decision will be in favour of the Company. it is expected that there will not be any outflow of economic resources embodying economic benefits. Hence, no provision is considered necessary against the same.
2.51 2.51
Income TaxThe ITAT has passed favouarable order except for few grounds which are referred back to the books of AO for the AY 2003-04 to 2005-06. it is expected that there will not be any outflow of economic resources embodying economic benefits. Hence, no provision is considered necessary against the same.
10.36 -
The Income Tax Department has filed appeal in ITAT against the order passed by CIT(A) in favour of the Company from AY 2006-07 to AY 2009-10. it is expected that there will not be any outflow of economic resources embodying economic benefits. Hence, no provision is considered necessary against the same.
- 361.54
The Company has filed an appeal before the ITAT against the additions upheld by the CIT(A) from AY 2006-07 to AY 2009-10. it is expected that there will not be any outflow of economic resources embodying economic benefits. Hence, no provision is considered necessary against the same.
56.64 54.97
The Company has filed an appeal before the CIT(A) against the Penalty order from AY 2007-08 to AY 2008-09. it is expected that there will not be any outflow of economic resources embodying economic benefits. Hence, no provision is considered necessary against the same.
4.94
Assessing officer has passed unfavourable order pertaining to the AY 2010-11 and 2011-12. The Company has filed appeal before CIT(A) against the order of the department.
541.72
Based on the legal opinions taken and inconsistencies in various Assessment Orders of AO coupled with the fact that the Company has already won the appeals made to CIT(A), it is expected that there will not be any outflow of economic resources embodying economic benefits. Hence, no provision is considered necessary against the same.
30.61
Notesforming part of the Financial Statements for the year ended March 31, 2014 (Contd.)

Annual Report 2013-1470
Notesforming part of the Financial Statements for the year ended March 31, 2014 (Contd.)
29 EMPLOYEE STOCK OPTION PLAN
For the financial year ended March 31, 2014, the following schemes were in operation:
a) Employees Stock Option Plan, 2007 (ESOP 2007); and
b) JFL Employees Stock Option Scheme, 2011 (ESOP 2011).
Particulars ESOP 2007 ESOP 2011Date of grant April
1, 2007April
1, 2008April
1, 2009September
29, 2009October 5, 2009
October 5, 2011
December 14, 2012
November 11, 2013
Date of Board Approval March 23, 2007 July 12, 2011Date of Shareholder’s approval
August 6, 2007 August 20, 2011
Date of Last Modification
September 3, 2009 August 8, 2013
Number of options granted
1,800,340 355,800 152,000 277,960 45,000 2,32,500 2,02,050 278,500
Method of Settlement (Cash/Equity)
Equity Equity
Vesting Period 5 years 3 years Exercise Period 9 years from first vesting date 7 years from first vesting dateVesting Conditions $ #
$ The vesting takes place on staggered basis over the respective vesting period.# Vesting of options is a function of achievement of performance criteria or any other criteria as specified by the Compensation Committee and communicated in the grant letter. Further, the vesting takes place on staggered basis over the respective vesting period.
The details of activity under the Plan have been summarised below:Particulars ESOP 2007 ESOP 2011
Year endedMarch 31, 2014
Year endedMarch 31, 2013
Year endedMarch 31, 2014
Year endedMarch 31, 2013
Number of
options
Exercise Price (`)
Number of
options
Exercise Price (`)
Number of
options
Exercise Price (`)
Number of
options
Exercise Price (`)
Outstanding at the beginning of the year
287,464 73 374,164 73 199,100 1,326 230,100 66989,500 51 155,850 51 212,810 669
147,683 35 216,653 35Granted during the year NIL NIL NIL NIL 278,500 1,260 202,050 1,326Forfeited during the year ^
NIL NIL 23,460 51 1,400 1,260 2,950 1,32611,475 1,326 10,400 66912,155 669
Exercised during the year
101,100 73 86,700 73 7,540 669 6,890 66931,000 51 42,890 51
#21,000 35 68,970 35Expired during the year NIL NIL NIL NIL NIL NIL NIL NILOutstanding at the end of the year
186,364 73 287,464 73 277,100 1,260 199,100 1,32658,500 51 89,500 51 187,625 1,326 212,810 669
126,683 35 147,683 35 193,115 669Exercisable at the end of the year
43,876 73 26,236 73 NIL 1,260 NIL 1,32658,500 51 30,220 51 33,585 1,326 37,770 669
126,683 35 147,683 35 86,365 669Remaining Contractual Life * Refer Note below * Refer Note below
^ Forfeited options include vested options not exercised within the stipulated time prescribed under the respective ESOP schemes, vested/ unvested options forfeited in accordance with terms prescribed under the respective ESOP Schemes.
# Includes 5,000 options against which allotment of shares has not been made till March 31, 2014.

Jubilant FoodWorks Limited 71
Writing on Tom
orrow’s Tim
eline Strategic Review Statutory Reports Financial Statem
ents
Notesforming part of the Financial Statements for the year ended March 31, 2014 (Contd.)
* Note: Remaining Contractual Life as on March 31, 2014, is set forth below:
ESOP 2007 ESOP 2011Date of grant April 1,
2007April 1,
2008April 1,
2009September
29, 2009October 5,
2009October 5,
2011December
14, 2012November
11, 2013As on March 31, 2014 2 years and
3 years4 years 5 years 5 years 5
months 28 days
5 years 6 months 4
days
5 years 6 months 4
days
6 years 8 months 13
days
7 years 7 months 10
daysAs on March 31, 2013 3 years & 4
years5 years 6 years 6 years 5
months 28 days
6 years 6 months 4
days
6 years 6 months 4
days
7 years 8 months 13
days
N.A.
The Company has opted for intrinsic value method for valuation of options under both the ESOP Schemes.
During the year the weighted average market price of the Company’s share was ` 1,125.84 (Previous Year ` 1,199.71)
Under ESOP 2007, as the shares were not quoted on any stock exchange prior to grant of options by the Company, hence the fair value of its shares was determined on the basis of a valuation performed by a Category I Merchant Banker.
The Compensation Committee of the Company, on November 11, 2013, granted 278,500 options to eligible Employees/Directors of the Company and its subsidiary under ESOP 2011. Each option shall entitle the holder to acquire 1 equity share of ` 10 each fully paid up at ` 1,260/- being the market price as per SEBI guidelines.
Since the Fair Market Value of shares was less than/equal to the Exercise Price at the time of grant of options, therefore no accounting is required to be done consequent to grant of options.
The weighted average fair value of stock options granted pertaining to ESOP 2007 scheme was Nil (previous year Nil).
The weighted average fair value of stock options granted during the year pertaining to ESOP 2011 scheme is ` 420.37 (previous year ` 377.17)
For both the schemes, the black scholes valuation model has been used for computing the weighted average fair value considering the following inputs:Assumptions Unit Employee Stock Option Plan - 2007 JFL Employee Stock Option
Scheme - 2011Date of grant of Option
October 05, 2009
September 29, 2009
April 01, 2009
April 01, 2008
April 01, 2007
October 05, 2011
December 14, 2012
November 11, 2013
Exercise price Current year
` 73.00 73.00 73.00 51.00 35.00 669.00 1,326.00 1260.00
(Previous year)
` (73.00) (73.00) (73.00) (51.00) (35.00) (669.00) (1,326.00) N.A
Weighted average share price
Current year
` 17.48 17.48 13.65 10.42 7.02 669.00 1,326.00 1260.00
(Previous year)
` (17.48) (17.48) (13.65) (10.42) (7.02) (669.00) (1,326.00) N.A
Expected option life
Current year
No of Years
5 years 6 months
4 days
5 years 5 months 28 days
5 years 4 years 2 years and 3 years
5 years 6 months
4 days
6 years 8 months 13 days
7 years 7 months 10 days
(Previous year)
No of Years
6 years 6 months
4 days
6 years 5 months 28 days
6 years 5 years 3 years & 4 years
6 years 6 months
4 days
7 years 8 months 13 days
N.A.
Volatility Current year
% 11.62% 11.62% 12.45% 13.53% 12.18% 52.75% 34.38% 36.99%
(Previous year)
% (11.62%) (11.62%) (12.45%) (13.53% ) (12.18%) (52.75%) (34.38%) N.A
Risk free return Current year
% 7.30% 7.30% 7.17% 7.83% 7.93% 8.45% 8.06% 9.05%
(Previous year)
% (7.30%) (7.30%) (7.17%) (7.83% ) (7.93%) (8.45%) (8.06%) N.A
Expected dividend Yield
Current year
% 0.00% 0.00% 0.00% 0.00% 0.00% 0.00% 0.00% 0.00%
(Previous year)
% (0.00%) (0.00%) (0.00%) (0.00%) (0.00%) (0.00%) (0.00%) N.A

Annual Report 2013-1472
Notesforming part of the Financial Statements for the year ended March 31, 2014 (Contd.)
The expected life of the stock is based on historical data and current market expectations and is not necessarily indicative of exercise patterns that may occur. The expected volatility reflects the assumption that the historical volatility over a period similar to the life of the options is indicative of future trends, which may also not necessarily be the actual outcome.
The Company measures the cost of ESOP using the intrinsic value method. Had the Company used the fair value method to determine compensation, its profit after tax and earning per share as reported would have changed to the amounts indicated below:
(` in Lakh)Particulars Year Ended
March 31, 2014Year Ended
March 31, 2013Profit after tax as reported 12,579.76 13,510.94Add: ESOP cost using intrinsic value method - -Less: ESOP cost using fair value method 845.88 312.63Proforma profit after tax 11,733.88 13,198.31Earnings per share (in `)Basic -As reported 19.25 20.73 -As proforma 17.95 20.25Diluted -As reported 19.12 20.55 -As proforma 17.83 20.07
30. Related Party Disclosure
(i) The list of related parties as identified by the management is as under: (with whom transactions have occurred during the year).
Name of the Party RelationshipJubilant FoodWorks Lanka (Pvt) Limited Subsidiary (A)Mr. Ajay Kaul Key Management Personnel (B)Mr. Shyam S. Bhartia Key Management Personnel (till December 23, 2013) /Individuals owning,
directly or indirectly, an interest in the voting power of the Company that gives them significant influence over the Company (from December 24, 2013) ( C)
Mr. Hari S. Bhartia
Jubilant Life Sciences Limited Enterprises over which any person described above or their relative is able to exercise significant influence (D)HT Media Limited
Jubilant Fresh Pvt LtdJubilant Agri & Consumer Products Limited

Jubilant FoodWorks Limited 73
Writing on Tom
orrow’s Tim
eline Strategic Review Statutory Reports Financial Statem
ents
Notesforming part of the Financial Statements for the year ended March 31, 2014 (Contd.)
(ii)
Tran
sact
ions
wit
h Re
late
d pa
rtie
s (`
in L
akh)
Part
icul
ars
Subs
idia
ry
(A)
Ente
rpris
e ov
er w
hich
an
y pe
rson
des
crib
ed in
(C
) abo
ve o
r the
ir re
lativ
e is
able
to e
xerc
ise
signi
fican
t inf
luen
ce.
(D)
Key
Man
agem
ent P
erso
nnel
(B
& C
)
(B)
(C)
(B
& C
)
Indi
vidu
als o
wni
ng, d
irect
ly o
r in
dire
ctly
, an
inte
rest
in th
e vo
ting
pow
er o
f the
Com
pany
that
giv
es
them
sign
ifica
nt in
fluen
ce o
ver
the
Com
pany
(fro
m D
ecem
ber 2
4,
2013
onw
ards
till
Mar
ch 3
1, 2
014)
(C)
Tota
l
Marc
h 31
, 20
14Ma
rch
31,
2013
Marc
h 31
, 20
14Ma
rch
31,
2013
Marc
h 31
, 20
14til
l Dec
23,
20
13Ma
rch
31,
2013
Marc
h 31
, 201
4Ma
rch
31,
2014
Marc
h 31
, 20
13A)
Tra
nsac
tions
Inve
stm
ent i
n Eq
uity
Cap
ital
- Jub
ilant
Foo
dWor
ks La
nka (
Pvt)
Limite
d1,3
80.93
1,010
.93-
--
--
-1,3
80.93
1,010
.93Ch
arge
s for
serv
ices
pai
d to
- HT
Media
Lim
ited
--
242.3
817
8.56
--
--
242.3
817
8.56
- Jub
ilant
Life
Scien
ces L
imite
d-
-13
6.28
59.69
--
--
136.2
859
.69- J
ubila
nt Fr
esh
Pvt L
td-
-60
9.42
--
--
-60
9.42
-- J
ubila
nt A
gri &
Con
sum
er P
rodu
cts L
imite
d-
-2.8
73.5
8-
--
-2.8
73.5
8Pa
ymen
t for
Cap
ital i
tem
s - J
ubila
nt Li
fe Sc
ience
s Lim
ited
(Adv
ance
paid
fo
r pur
chas
e of
land
)-
-
605.7
4 -
--
- -
60
5.74
-
Dire
ctor
's Si
ttin
g Fe
es- M
r. Shy
am S.
Bha
rtia
--
--
-0.6
70.8
50.2
20.8
90.8
5- M
r. Har
i S. B
hart
ia-
--
--
0.84
0.81
0.22
1.06
0.81
Rem
uner
atio
n to
Who
le T
ime
Dire
ctor
- Mr. A
jay K
aul
--
--
336.5
1-
334.8
5-
336.5
133
4.85
Allo
tmen
t of E
quity
Shar
es - M
r. Aj
ay K
aul*
re
fer n
otes
1, 2
& 3
B) B
alan
ce o
utst
andi
ng (a
dvan
ce)/
paya
bles
as a
t the
end
of t
he y
ear
Char
ges f
or se
rvic
es- H
T Me
dia Li
mite
d-
-20
.4617
.14-
--
-20
.4617
.14- J
ubila
nt Li
fe Sc
ience
s Lim
ited
(Adv
ance
)-
-(6
05.74
)-
--
--
(605
.74)
-- J
ubila
nt Li
fe Sc
ience
s Lim
ited
(Pay
able)
--
89.29
53.72
--
--
89.29
53.72
- Jub
ilant
Fres
h Pv
t Ltd
--
80.71
--
--
-80
.71-
- Jub
ilant
Agr
i & C
onsu
mer
Pro
duct
s Lim
ited
--
0.48
--
--
-0.4
8-
Inve
stm
ents
- Jub
ilant
Foo
dWor
ks La
nka (
Pvt)
Limite
d3,
484.5
22,1
03.59
--
--
--
3,48
4.52
2,103
.59
*Dur
ing
the
year
end
ed M
arch
31,
201
4, M
r. Aj
ay K
aul,
Key
Man
agem
ent P
erso
nnel
of t
he C
ompa
ny, w
as n
ot a
llott
ed a
ny e
quity
shar
es (P
revi
ous y
ear N
il) u
nder
Em
ploy
ees
Stoc
k Op
tion
Plan
, 20
07 (“
ESOP
200
7”) o
r JFL
Em
ploy
ees
Stoc
k Op
tion
Sche
me,
201
1 (“E
SOP
2011
”) of
the
Com
pany
.N
otes
:1.
No
am
ount
has
bee
n pr
ovid
ed a
s do
ubtf
ul d
ebts
or a
dvan
ces
/ w
ritte
n of
f or
writ
ten
back
in t
he y
ear i
n re
spec
t of
deb
ts d
ue f
rom
/ to
abo
ve re
late
d pa
rtie
s.2.
Du
ring
the
year
end
ed M
arch
31,
201
4, 3
0,40
0 op
tions
at
an e
xerc
ise p
rice
of `
1,2
60 p
er o
ptio
n (P
revi
ous
Year
29,
000
optio
ns a
t an
exe
rcise
pric
e of
` 1
,326
per
opt
ion)
wer
e gr
ante
d to
Mr.
Ajay
Kau
l, un
der E
SOP
2011
.3.
Th
e st
atus
of
stoc
k op
tions
pen
ding
ves
ting/
exer
cise
, gra
nted
to M
r. Aj
ay K
aul is
as
belo
w:
Empl
oyee
Sto
ck O
ptio
n Pl
an -
2007
JFL
Empl
oyee
Sto
ck O
ptio
n Sc
hem
e - 2
011
Exer
cise
Pric
e`
51`
73`
669
` 1,
326
` 1,
260
As a
t Mar
ch 3
1, 2
014
55,0
0037
,500
50,0
0029
,000
30,4
00As
at M
arch
31,
201
355
,000
37,5
0050
,000
29,0
00-

Annual Report 2013-1474
Notesforming part of the Financial Statements for the year ended March 31, 2014 (Contd.)
31 a) Estimated amount of contracts remaining to be executed on capital account (net of advances) and not provided for ` 4,172.16 Lakh (PY ` 1,137.77 Lakh).
b) The Company has a wholly owned subsidiary “Jubilant FoodWorks Lanka (Pvt) Ltd.” to which the Company has committed a continued financial support as its holding company. The subsidiary is currently at initial operating stage and is therefore not in profits. Based on business plans, the Company is confident that in future it would earn profits. Therefore the Company has not considered these losses as other than temporary diminution in the value of investments.
c) Commitment to open specified number of stores/ restaurants under respective franchisee agreements. Amount not quantifiable.
32 Gratuity and other post -employment benefit plan:
The Company has a defined benefit gratuity plan. Every employee who has completed five years or more of service gets a gratuity on departure at 15 days salary (last drawn salary) for each completed year of service. The scheme is partially funded.
The following tables summarises the components of net benefit expense recognised in the statement of profit and loss and the amounts recognised in the balance sheet.
Statement of Profit & Loss
Net employee benefit expense (recognised in Employee Cost)(` in Lakh)
Particulars GratuityMarch 31, 2014 March 31, 2013
Current service cost 258.25 199.18Past service cost - -Interest cost on benefit obligation 60.95 42.52Expected return on plan assets (54.73) -Curtailment Cost - -Settlement cost - -Net actuarial (gain)/ loss recognised in the year (82.26) (11.27)Expenses recognised in the statement of profit & loss 182.21 230.43
Present value of obligation as at the end of period 1,034.13 761.90Present value of obligation as at the beginning of the period 761.90 531.47Benefits paid - -Actual return on plan assets (90.02) -Acquisition adjustment - -Expenses recognised in the statement of profit & loss 182.21 230.43
Balance SheetDetails of provision for Gratuity:Defined benefit obligation 1,034.13 761.90Fair value of plan assets 851.92 608.14Less: Unrecognised past service cost - -Plan asset/ liability 182.21 153.76
(` in Lakh)Particulars Long term Short term
March 31, 2014 March 31, 2013 March 31, 2014 March 31, 2013Provision for Gratuity - - 182.21 153.76

Jubilant FoodWorks Limited 75
Writing on Tom
orrow’s Tim
eline Strategic Review Statutory Reports Financial Statem
ents
Notesforming part of the Financial Statements for the year ended March 31, 2014 (Contd.)
Changes in the present value of the defined benefit obligation are as follows:(` in Lakh)
Particulars March 31, 2014 March 31, 2013Present value of obligation as at the beginning of the period 761.90 531.47Acquisition adjustment - -Interest cost 60.95 42.52Past service cost - -Current service cost 258.25 199.18Curtailment cost/(Credit) - -Settlement cost/(Credit) - -Benefits paid - -Actuarial (gain)/loss on obligation (46.97) (11.27)Present value of obligation as at the end of period 1,034.13 761.90
Change in the fair value of plan assets are as follows:Fair value of plan assets at the beginning of the period 608.14 -Acquisition adjustment - -Expected return on plan assets 54.73 -Contributions 153.76 608.14Benefits paid - -Actuarial gain/(loss) on plan assets 35.29 -Fair value of plan assets at the end of the period 851.92 608.14
The Company expects to contribute ` 182.21 Lakh (PY ` 350.00 Lakh) to gratuity in the next year.
The major categories of plan assets as a percentage of the fair value of total plan assets are as follows:
Insurance policy with SBI Life Insurance 100% 100%
The principal assumptions used in determining gratuity for the Company’s plans are shown below:
Demographic Assumptions
Particulars GratuityMarch 31, 2014 March 31, 2013
Discount Rate (%) 8.50 8.00Future salary increase (%) 6.00 5.50Expected rate of return on plan assets(%) 9.00 8.00
The estimates of future salary increases, considered in actuarial valuation, take account of inflation, seniority, promotion and other relevant factors, such as supply and demand in the employment market
Particulars March 31, 2014 March 31, 2013Retirement Age 58 YearsMortality Table IALM (2006-08) LIC (1994-96) duly
modifiedAges Withdrawal Rate
(%)Withdrawal Rate
(%)Up to 30 Years 3.00 3.00From 31 to 44 years 2.00 2.00Above 44 years 1.00 1.00

Annual Report 2013-1476
Notesforming part of the Financial Statements for the year ended March 31, 2014 (Contd.)
Amounts for the current and previous years are as follows:(` in Lakh)
Particulars GratuityYear ended
March 31, 2014Year ended
March 31, 2013Year ended
March 31, 2012Year ended
March 31, 2011Year ended
March 31, 2010Defined benefit obligation 1,034.13 761.90 531.47 334.32 210.21Plan assets 851.92 608.14 302.00 - -Surplus / (deficit) (182.21) (153.76) (229.47) (334.32) (210.21)Experience loss/(gain) on plan liabilities
52.30 13.92 (25.79) (14.33) 0.92
Provident Fund
The provident fund being administered by a Trust is a defined benefit scheme whereby the Company deposits an amount determined as a fixed percentage of basic pay to the fund every month. The benefit vest upon commencement of employment. The interest credited to the accounts of the employee is adjusted on an annual basis to confirm to the interest rate declared by the government for the Employees Provident Fund. The actuary has provided a valuation based on Projected Unit Credit Method (PUCM) and based on the below provided assumptions, there is no shortfall as at March 31, 2014.
(` in Lakh)Defined benefit plan: March 31, 2014 March 31, 2013Contribution to provident and other funds 609.48 455.62
Defined contribution plan: March 31, 2014 March 31, 2013Contribution to provident fund 907.96 726.04
The detail of fund and plan asset position as at March 31, 2014 is given below:(` in Lakh)
Particulars March 31, 2014 March 31, 2013Plan assets at fair value 6,770.87 4,881.45Present value of the defined benefit obligation 6,564.49 4,793.93Surplus in fund 206.38 87.52Asset recognised in the balance sheet - -
The assumption used in determining the present value of obligation of the interest rate guarantee are:
Particulars March 31, 2014 March 31, 2013Discounting rate 8.75% 8.50%Expected guaranteed interest rate 8.75% 8.50%Expected Rate of Return on Asset 8.70% 8.50%
Particulars March 31, 2014 March 31, 2013Retirement Age 58 YearsMortality Table IALM (2006-08) LIC (1994-96) duly
modifiedAges Withdrawal
Rate (%)Withdrawal
Rate (%)Up to 30 Years 3.00 3.00From 31 to 44 years 2.00 2.00Above 44 years 1.00 1.00

Jubilant FoodWorks Limited 77
Writing on Tom
orrow’s Tim
eline Strategic Review Statutory Reports Financial Statem
ents
Notesforming part of the Financial Statements for the year ended March 31, 2014 (Contd.)
Change in the fair value of plan assets are as follows: (` in Lakh)Particulars March 31, 2014 March 31, 2013Fair value of plan assets at the beginning of the period 4,881.45 3,345.40Expected return on plan assets 427.13 284.36Employer Contributions 636.40 465.09Plan Participants / Employee Contribution 1,519.87 1,155.55Benefit Payments (807.67) (485.54)Asset Gain /(Loss) 79.90 83.46Settlements / Transfer In 33.79 33.13Fair value of plan assets at the end of the period 6,770.87 4,881.45
Changes in the present value of the defined benefit obligation are as follows
Present value of obligation as at the beginning of the period 4,793.93 3,315.58Contributions by plan participants / employees 1,519.87 1,155.55Interest cost 419.47 281.82Past service cost - -Current service cost 636.40 465.09Actuarial (Gain) / Loss due to Interest guarantee (31.30) 28.31Benefits paid (807.67) (485.55)Settlements / Transfer In 33.79 33.13Present value of obligation as at the end of period 6,564.49 4,793.93
33 Details of Raw Materials and Components Consumed
I. Aggregate Consumption of Raw Material & Components (Imported & Indigenous) as certified by the ManagementParticulars For the year Ended March 31, 2014 For the year Ended March 31, 2013
% of total (` In Lakh) % of total (` In Lakh) Imported 0.00% - 0.00% -Indigenous 100.00% 38,220.50 100.00% 30,626.90Total 100.00% 38,220.50 100.00% 30,626.90
II Aggregate Consumption of Stores & spares (Imported & Indigenous)
Imported 0.43% 6.11 0.09% 1.79Indigenous 99.57% 1,426.19 99.91% 1,995.22Total 100.00% 1,432.30 100.00% 1,997.01

Annual Report 2013-1478
Notesforming part of the Financial Statements for the year ended March 31, 2014 (Contd.)
III CIF value of Imports (accrual basis)(` in Lakh)
Particulars For the year Ended March 31, 2014
For the year Ended March 31, 2013
Raw Materials & Components - - Store& Spares 6.11 1.79 Trading Goods - - Capital Goods 1,796.77 1,760.10 TOTAL 1,802.88 1,761.89
IV Statements showing earnings in Foreign Exchange (accrual basis)
Export of Goods (FOB value basis) - -TOTAL - -
V Expenditure in Foreign Currency (accrual basis)Foreign Travel 17.79 24.56Franchisee Fees 5,201.57 4,241.30Store Opening Fees 504.53 375.89TOTAL 5,723.89 4,641.75
(` in Lakh)Particulars March 31, 2014 March 31, 2013 34 Expenditure During Construction Period:-
Opening Balance as per last accounts 41.51 38.65 Incurred during the yearEmployee benefit and Other expenses:- Salary, Allowances & Bonus 582.93 98.35 - Power & Fuel 6.95 26.57 - Rent 153.87 338.64 - Rates and Taxes 73.15 38.42 - Miscellaneous Expenses 210.29 42.55
1,068.70 583.18 Less: Allocated to Fixed Assets 928.59 541.67TOTAL 140.11 41.51
Note: The above expenses have been netted off in the respective line items in the Statement of Profit and Loss.
35 Details of due to Micro and Small Enterprise.
The Company, has during the year, not received any intimation from any of its suppliers regarding their status under the MSMED Act. Based on the above facts, there are no dues to parties registered under MSMED Act. Accordingly no disclosures relating to amounts unpaid as at the year end along with interest paid/payable have been given.
36 Expenditure on leasehold improvement incurred during the year has been considered as revenue expenditure for computing Income tax, relying upon the expert advice. However the treatment does not impact the statement of profit and loss. Accordingly deferred tax liability of ` 2,016.99 Lakh (Previous year ` 1,557.44 Lakh) has been provided in books since such item has been capitalised in the books.

Jubilant FoodWorks Limited 79
Writing on Tom
orrow’s Tim
eline Strategic Review Statutory Reports Financial Statem
ents
37 Particulars of Unhedged Foreign Currency Exposure as at Balance Sheet date Particulars Year ended
March 31, 2014
(Foreign Currency)
(In Lakh)
Currency Closing Exchange
Rate (`)
Year ended March 31,
2014 (` In Lakh)
Year ended March 31,
2013 (Foreign
Currency) (In Lakh)
Closing Exchange
Rate (`)
Year ended March 31,
2013 (` In Lakh)
Import Trade Payables
2.58 USD 60.10 154.76 1.29 54.39 70.16
38 Segment Reporting:
As the Company’s business activity primarily falls within a single business and geographical segment i.e. Food and Beverages, thus there are no additional disclosures to be provided under Accounting Standard 17 - “Segment Reporting’. The management considers that the various goods and services provided by the Company constitutes single business segment, since the risk and rewards from these services are not different from one another.
39 Previous period / year figures have been regrouped and /or re-arranged, wherever necessary.
Notesforming part of the Financial Statements for the year ended March 31, 2014 (Contd.)
As per our report of even date
For S. R. Batliboi & Co. LLP For and on behalf of the Board of Directors of Jubilant FoodWorks LimitedFirm Registration Number: 301003EChartered Accountants
Sd/- Sd/- Sd/- Sd/-Per Rajiv Goyal Shyam S. Bhartia Hari S. Bhartia Ajay KaulPartner Chairman Co-Chairman CEO cum Whole Time DirectorMembership No. 94549 DIN No. 00010484 DIN No. 00010499 DIN No. 00062135
Sd/- Sd/- Mona Aggarwal Ravi S. Gupta Company Secretary President & Chief Financial Officer
Place : G urgaon Place : NoidaDate : May 19, 2014 Date : May 19, 2014

Annual Report 2013-1480
Statementpursuant to exemption under Section 212(8) of the Companies Act, 1956, related to the Subsidiary Companies
Name of the Company Jubilant FoodWorks Lanka (Pvt.) Limited
Date from which they became subsidiary/ September 14, 2010
Financial Year of the Subsidiary ended on March 31, 2014
Shares of the subsidiary held by Jubilant FoodWorks Limited
i) Number 7,89,22,450
ii) Face Value LKR 10 each
iii) Extent of holding 100%
(in Lakh)Financial Details of Subsidiary Companies LKR INRAs on March 31, 2014*Capital 7,892.25 3,611.52Reserve & Surplus (3,214.72) (1,471.07)Total Assets 5,404.61 2,473.17Total Liability 5,404.61 2,473.17Details of Investment (except in case of investment in the subsidiaries) - -
For the year ended March 31, 2014#Turnover 2,769.24 1,281.05Profit/(Loss) before tax (1,615.77) (747.46)Provision for taxation 18.23 8.43Profit/(Loss) after tax (1,634.00) (755.89)Proposed dividend - -
Exchange Rate:-*Assets & Liabilities 1 ` = 2.19 LKR#Profit & Loss 1 ` = 2.16 LKR

Jubilant FoodWorks Limited 81
Writing on Tom
orrow’s Tim
eline Strategic Review Statutory Reports Financial Statem
entsJUBILANT FOODWORKS LIMITED (GROUP)
To the Board of Directors of Jubilant FoodWorks Limited
We have audited the accompanying consolidated financial statements of Jubilant FoodWorks Limited (“the Company”) and its subsidiary, which comprise the consolidated Balance Sheet as at March 31, 2014, and the consolidated Statement of Profit and Loss and the consolidated Cash Flow Statement for the year then ended, and a summary of significant accounting policies and other explanatory information.
Management’s Responsibility for the Consolidated Financial Statements
Management is responsible for the preparation of these consolidated financial statements that give a true and fair view of the consolidated financial position, consolidated financial performance and consolidated cash flows of the Company in accordance with accounting principles generally accepted in India. This responsibility includes the design, implementation and maintenance of internal control relevant to the preparation and presentation of the consolidated financial statements that give a true and fair view and are free from material misstatement, whether due to fraud or error.
Auditor’s Responsibility
Our responsibility is to express an opinion on these consolidated financial statements based on our audit. We conducted our audit in accordance with the Standards on Auditing issued by the Institute of Chartered Accountants of India. Those Standards require that we comply with ethical requirements and plan and perform the audit to obtain reasonable assurance about whether the consolidated financial statements are free from material misstatement.
An audit involves performing procedures to obtain audit evidence about the amounts and disclosures in the consolidated financial statements. The procedures selected depend on the auditor’s judgement, including the assessment of the risks of material misstatement of the consolidated financial statements, whether due to fraud or error. In making those risk assessments, the auditor considers internal control relevant to the Company’s preparation and presentation of the consolidated financial statements that give a true and fair view in order to design audit procedures that are appropriate in the circumstances but not for the purpose of expressing an opinion on the effectiveness of the entity’s internal control. An audit also includes evaluating the appropriateness of accounting policies used and the reasonableness of the accounting estimates made by management, as well as evaluating the overall presentation of the consolidated financial statements. We believe that the audit evidence we have obtained is sufficient and appropriate to provide a basis for our audit opinion.
Opinion
In our opinion and to the best of our information and according to the explanations given to us, the consolidated financial statements give a true and fair view in conformity with the accounting principles generally accepted in India:
(a) in the case of the consolidated Balance Sheet, of the state of affairs of the Company as at March 31, 2014;
(b) in the case of the consolidated Statement of Profit and Loss, of the profit for the year ended on that date; and
(c) in the case of the consolidated Cash Flow Statement, of the cash flows for the year ended on that date.
Other Matter
1) We did not audit total assets of ` 2,472.23 Lakh as at March 31, 2014, total revenues of ` 1,287.35 Lakh and net cash outflows amounting to ` 1,246.38 Lakh for the year then ended, included in the accompanying consolidated financial statements in respect of the subsidiary, whose financial statements and other financial information have been audited by other auditors and whose report has been furnished to us. Our opinion, in so far as it relates to the affairs of such subsidiary is based solely on the report of other auditors. Our opinion is not qualified in respect of this matter.
2) The financial statements of the Company’s subsidiary have been prepared in accordance with accounting policies generally accepted in the subsidiary Company’s country of incorporation and have been audited by other auditors under generally accepted auditing standards of that country. The management have converted these audited financial statements of the Company’s subsidiary to accounting principles generally accepted in India. Our opinion thus, in so far as it relates to amounts included in respect of this subsidiary, is based solely on reports of the other auditors under the accounting policies generally accepted in that country and our audit of the conversion process followed by the management.
For S.R. Batliboi & CO. LLP
Chartered AccountantsICAI Firm Registration Number: 301003E
Sd/-per Rajiv GoyalPartnerMembership Number: 94549
Place : GurgaonDate : May 19, 2014
IndependentAuditor’s Report

JUBILANT FOODWORKS LIMITED (GROUP)
Annual Report 2013-1482
Consolidated Balance Sheetas at March 31, 2014
(` in Lakh)Particulars Note
No.As at
March 31, 2014As at
March 31, 2013I. EQUITY AND LIABILITIES1 Shareholders’ funds (a) Share capital 3 6,543.90 6,528.34 (b) Reserves and surplus 4 48,458.99 36,448.212 Share application money pending allotment 5 1.75 -3 Non-current liabilities (a) Other long term liabilities 6 891.95 602.82 (b) Deferred tax liabilities (Net) 7 3,745.65 2,008.614 Current liabilities (a) Trade payables 8 17,374.09 13,254.12 (b) Other current liabilities 9 8,034.19 5,616.74 (c) Short-term provisions 10 1,146.73 721.27 TOTAL 86,197.25 65,180.11II. ASSETS1 Non-current assets (a) Fixed assets 11 (i) Tangible assets 53,102.27 38,325.69 (ii) Intangible assets 1,534.26 1,178.03 (iii) Capital work-in-progress (Refer note 33) 1,964.26 1,017.88 (b) Non-current investments 12 - - (c) Long-term loans and advances 13 10,771.50 7,378.82 (d) Other non-current assets 14 41.60 34.082 Current assets (a) Current investments 12 9,374.56 9,400.61 (b) Inventories 15 3,307.99 2,402.54 (c) Trade receivables 16 903.93 808.79 (d) Cash and bank balances 17 2,422.31 3,749.60 (e) Short-term loans and advances 18 2,759.43 877.43 (f) Other current assets 19 15.14 6.64 TOTAL 86,197.25 65,180.11 Summary of significant accounting policies 2.1
The accompanying notes are an integral part of the financial statements.
As per our report of even date
For S. R. Batliboi & Co. LLP For and on behalf of the Board of Directors of Jubilant FoodWorks LimitedFirm Registration Number: 301003EChartered Accountants
Sd/- Sd/- Sd/- Sd/-Per Rajiv Goyal Shyam S. Bhartia Hari S. Bhartia Ajay KaulPartner Chairman Co-Chairman CEO cum Whole Time DirectorMembership No. 94549 DIN No. 00010484 DIN No. 00010499 DIN No. 00062135
Sd/- Sd/- Mona Aggarwal Ravi S. Gupta Company Secretary President & Chief Financial Officer
Place : Gurgaon Place : NoidaDate : May 19, 2014 Date : May 19, 2014

JUBILANT FOODWORKS LIMITED (GROUP)
Jubilant FoodWorks Limited 83
Writing on Tom
orrow’s Tim
eline Strategic Review Statutory Reports Financial Statem
ents
(` in Lakh)Particulars Note
No.Year E nded
March 31, 2014Year E nded
March 31, 2013
I INCOME
Revenue from operations (Net) 20 173,630.93 141,430.71
II OTHER INCOME 21 939.44 786.97
Total Revenue 174,570.37 142,217.68
III EXPENSES
Cost of materials consumed 22 38,637.93 30,894.47
Purchase of traded goods 23 6,775.34 6,063.91
(Increase)/Decrease in inventories of work-in-progress and traded goods
23 (72.00) 37.73
Employee benefit expenses 24 34,107.76 27,145.06
Depreciation and amortisation expense 11 7,872.45 5,558.24
Finance costs 26 - 6.35
Other expenses 25 69,223.62 53,123.54
Total expenses 156,545.10 122,829.30
IV PROFIT BEFORE TAX 18,025.27 19,388.38
V TAX EXPENSE
Current tax 4,433.41 4,728.41
Income Tax for earlier years 32.27 229.18
Deferred tax charge / (credit) 1,735.39 1,320.73
Total tax expense 6,201.07 6,278.32
VI PROFIT FOR THE YEAR 11,824.20 13,110.06
VII EARNINGS PER SHARE (IN `) 27
Basic 18.09 20.12
Diluted 17.97 19.94
Nominal Value per share 10.00 10.00
Summary of significant accounting policies 2.1
Consolidated Statement of Profit and Lossfor the year ended March 31, 2014
The accompanying notes are an integral part of the financial statements.
As per our report of even date
For S. R. Batliboi & Co. LLP For and on behalf of the Board of Directors of Jubilant FoodWorks LimitedFirm Registration Number: 301003EChartered Accountants
Sd/- Sd/- Sd/- Sd/-Per Rajiv Goyal Shyam S. Bhartia Hari S. Bhartia Ajay KaulPartner Chairman Co-Chairman CEO cum Whole Time DirectorMembership No. 94549 DIN No. 00010484 DIN No. 00010499 DIN No. 00062135
Sd/- Sd/- Mona Aggarwal Ravi S. Gupta Company Secretary President & Chief Financial Officer
Place : G urgaon Place : NoidaDate : May 19, 2014 Date : May 19, 2014

JUBILANT FOODWORKS LIMITED (GROUP)
Annual Report 2013-1484
Consolidated Cash Flow Statementfor the year ended March 31, 2014
(` in Lakh)Particulars Year Ended
March 31, 2014Year Ended
March 31, 2013A) CASH FLOW FROM OPERATING ACTIVITIES
Net Profit before Tax 18,025.27 19,388.38
18,025.27 19,388.38
Adjustments for:
Depreciation 7,872.45 5,558.24
Loss/(Profit) on sale of investments - -
Loss on Disposal of Fixed Assets (net) 36.11 161.73
Lease Rent Straight-lining 315.65 216.39
Interest Income (64.45) (88.72)
Dividend Income (782.38) (683.60)
Interest Expenses - 6.35
Provision for Doubtful Debts and Advances 49.53 45.31
Operating Profit before Working Capital Changes 25,452.18 24,604.08
Adjustments for :
(Increase)/Decrease in Trade receivables (95.14) (34.74)
(Increase)/Decrease in Other Current Assets (8.50) (4.63)
(Increase)/Decrease in Loans and Advances (4,389.06) (1,528.13)
(Increase)/Decrease in Inventories (905.45) (532.20)
Increase/(Decrease) in Current Liabilities and Provisions 6,717.07 3,543.92
Cash generated from Operating Activities 26,771.10 26,048.30
Direct Taxes Paid (4,265.80) (5,177.69)
Net Cash from Operating Activities 22,505.30 20,870.61
B) CASH FLOW FROM INVESTING ACTIVITIES
Purchase of Fixed Assets (24,866.50) (19,162.71)
Proceeds from Sale of Fixed Assets 73.25 19.24
Interest Received 64.45 88.72
Dividend Received 782.38 683.60
Investment in bank deposits (3,462.33) (1,954.66)
Redemption of bank deposits 4,155.42 1,442.62
Investments in Mutual Funds (91,759.72) (85,898.76)
Proceeds from Mutual Funds 91,733.67 85,724.85
Net Cash (used) in Investing Activities (23,279.38) (19,057.10)

JUBILANT FOODWORKS LIMITED (GROUP)
Jubilant FoodWorks Limited 85
Writing on Tom
orrow’s Tim
eline Strategic Review Statutory Reports Financial Statem
ents
(` in Lakh)Particulars Year E nded
March 31, 2014Year E nded
March 31, 2013C) CASH FLOW FROM FINANCING ACTIVITIES
Proceeds from Issue of Share Capital (including Share Premium) 147.40 155.41
Interest Paid - (6.35)
Net Cash from Financing Activities 147.40 149.06
Net Increase in Cash and Cash Equivalents (A+B+C) (626.68) 1,962.57
Cash and Cash Equivalents as at beginning of the Year 3,048.99 1,086.42
Cash and Cash Equivalents as at end of the Year 2,422.31 3,048.99
Components of Cash and Cash Equivalents:
Cash-in-Hand 1,471.56 1,545.20
Cheques in Hand 7.12 7.92
Balances with Scheduled Banks in
- Current Accounts 817.79 1,095.87
- Deposits with original maturity of less than 3 months 125.84 400.00
Cash & Cash Equivalents in Cash Flow Statement: 2,422.31 3,048.99
Notes :
1. The above Cash Flow has been prepared under the ‘Indirect Method’ as set out in the Accounting Standard-3 on Cash Flow Statements, issued by the Institute of Chartered Accountants of India.
Consolidated Cash Flow Statementfor the year ended March 31, 2014 (Contd.)
As per our report of even date
For S. R. Batliboi & Co. LLP For and on behalf of the Board of Directors of Jubilant FoodWorks LimitedFirm Registration Number: 301003EChartered Accountants
Sd/- Sd/- Sd/- Sd/-Per Rajiv Goyal Shyam S. Bhartia Hari S. Bhartia Ajay KaulPartner Chairman Co-Chairman CEO cum Whole Time DirectorMembership No. 94549 DIN No. 00010484 DIN No. 00010499 DIN No. 00062135
Sd/- Sd/- Mona Aggarwal Ravi S. Gupta Company Secretary President & Chief Financial Officer
Place : G urgaon Place : NoidaDate : May 19, 2014 Date : May 19, 2014

JUBILANT FOODWORKS LIMITED (GROUP)
Annual Report 2013-1486
1. Basis of Preparation
The Consolidated Financial Statements relate to Jubilant FoodWorks Limited (Parent Company), and its wholly owned Subsidiary Company incorporated in Sri Lanka - Jubilant FoodWorks Lanka (Pvt.) Ltd. (hereinafter collectively referred as the “Group”).
The financial statements have been prepared and presented under the historical cost convention on the accrual basis of accounting, unless stated otherwise and comply with the mandatory Accounting Standards (‘AS’) prescribed under the Companies Act, 1956 read with the General Circular 08/2014 dated April 4, 2014 issued by the Ministry of Corporate Affairs, and other accounting principles generally accepted in India. The accounting policies adopted in the preparation of financial statements are consistent with those of the previous year.
2.1 Summary of significant accounting policies
a) Basis of Accounting
The Consolidated Financial Statements (CFS) have been prepared to comply in all material respects with the Accounting Standards notified by Companies (Accounting Standards) Rules, 2006 (as amended) and the relevant provisions of the Companies Act, 1956. The financial statements have been prepared under the historical cost convention on an accrual basis. The accounting policies have been consistently applied by the Group and are consistent with those used in the previous year.
Principles of Consolidation
The financial statements of the Parent Company and its Subsidiary Company have been combined on a line by line basis by adding together the book values of like items of assets, liabilities, income and expenses after fully eliminating intra group balances and intra group transactions resulting in unrealised profits or losses, if any, as per Accounting Standard - 21, Consolidated Financial Statements.
The Consolidated Financial Statements have been prepared using uniform accounting policies to the extent possible for like transactions and other events in similar circumstances and are presented in the same manner as the parent Company’s separate financial statements.
The financial statements of the subsidiary Company used in the consolidation are drawn for the same period as that of the parent Company i.e. year ended March 31, 2014.
Details of subsidiary considered for consolidation:
Name of the Company
Nature of relation- ship
Country of Incorpora-tion
Extent of Holding
(%) as on March 31,
2014
Extent of Holding
(%) as on March 31,
2013
Jubilant FoodWorks Lanka (Pvt.) Ltd.
Direct Subsidiary
Sri Lanka 100.00 100.00
b) Use of estimates
The preparation of financial statements in conformity with Indian GAAP, requires management to make judgments, estimates and assumptions that affect the reported amounts of revenue, expenses, assets and liabilities and disclosure of contingent liabilities at the end of the reporting period. Although these estimates are based upon management’s best knowledge of current events and actions, uncertainty about these assumptions and estimates could result in the outcomes requiring a material adjustment to the carrying amounts of assets or liabilities in future periods.
c) Tangible Fixed Assets
Fixed assets are stated at cost, less accumulated depreciation and impairment losses, if any. The cost comprises purchase price, borrowing cost if capitalisation criteria are met and directly attributable cost of bringing the asset to its working condition for the intended use. Any trade discounts and rebates are deducted in arriving at the purchase price.
Subsequent expenditure related to an item of fixed asset is added to its book value only if it increases the future benefits from the existing asset beyond its previously assessed standard of performance. All other expenses on existing fixed assets, including day-to-day repair and maintenance expenditure and cost of replacing parts, are charged to the statement of profit and loss for the period during which such expenses are incurred.
Gains or losses arising from derecognition of fixed assets are measured as the difference between the net disposal proceeds and the carrying amount of the asset and are recognised in the statement of profit and loss when the asset is derecognised.
Notesforming part of the Consolidated Financial Statements for the year ended March 31, 2014

JUBILANT FOODWORKS LIMITED (GROUP)
Jubilant FoodWorks Limited 87
Writing on Tom
orrow’s Tim
eline Strategic Review Statutory Reports Financial Statem
ents
d) Depreciation
Depreciation on fixed assets is calculated on a straight-line basis using the rates arrived at based on the useful lives estimated by the management, or those prescribed under the Schedule XIV to the Companies Act, 1956, whichever is higher. The Company is charging depreciation on fixed assets based on the following estimated useful life.
Fixed Assets Estimated Useful Life (in no. of years)
Leasehold Improvements
9 or Actual lease period, whichever is lower
Plant & Machinery 5 to 20Office Equipment 2 to 10Furniture & Fixtures 5 to 10Vehicles 5
Fixed Assets costing below ` 5,000 are depreciated @ 100% p.a.
e) Intangibles
Intangible assets acquired separately are measured on initial recognition at cost. Following initial recognition, intangible assets are carried at cost less accumulated amortisation and accumulated impairment losses, if any.
Intangible assets are amortised on a straight line basis over the estimated useful economic life. If the persuasive evidence exists to the affect that useful life of an intangible asset exceeds ten years, the Company amortises the intangible asset over the best estimate of its useful life. Such intangible assets are tested for impairment annually, either individually or at the cash-generating unit level. All other intangible assets are assessed for impairment whenever there is an indication that the intangible asset may be impaired.
Gains or losses arising from derecognition of an intangible asset are measured as the difference between the net disposal proceeds and the carrying amount of the asset and are recognised in the statement of profit and loss when the asset is derecognised.
A summary of amortisation policies applied to the Company’s intangible assets is as below:
Intangible assets Estimated Useful Life (in no. of years)
Software 5Territory fees & Store opening fees
15 & 5
The territory fee has been paid to the franchisor for running and operating Dunkin’ Donuts restaurants. The period of contract is for 15 years, during which the Company shall be deriving the economic benefits and has accordingly amortised the same.
f) Expenditure during Construction Period
Expenditure directly relating to construction activity are capitalised. Expenditure which is not directly attributable to the construction activity incurred during the construction period are capitalised as part of the indirect construction cost. Other indirect expenditure incurred during the construction period which are not related to the construction activity nor are incidental thereto, are charged to the statement of profit and loss.
g) Impairment of tangible and intangible assets
The Company assesses at each reporting date whether there is an indication that an asset may be impaired. If any indication exists, or when annual impairment testing for an asset is required, the Company estimates the asset’s recoverable amount. An asset’s recoverable amount is the higher of an asset’s or cash-generating unit’s (CGU) net selling price and its value in use. The recoverable amount is determined for an individual asset, unless the asset does not generate cash inflows that are largely independent of those from other assets or groups of assets. Where the carrying amount of an asset or CGU exceeds its recoverable amount, the asset is considered impaired and is written down to its recoverable amount. In assessing value in use, the estimated future cash flows are discounted to their present value using a pre-tax discount rate that reflects current market assessments of the time value of money and the risks specific to the asset. In determining net selling price, recent market transactions are taken into account, if available. If no such transactions can be identified, an appropriate valuation model is used.
The Company bases its impairment calculation on detailed budgets and forecast calculations which are prepared separately for each of the Company’s cash-generating units to which the individual assets are allocated. These budgets and forecast calculations are generally covering a period of five years. For longer periods, a long term growth rate is calculated and applied to project future cash flows after the fifth year.
After impairment, depreciation is provided on the revised carrying amount of the asset over its remaining useful life.
Notesforming part of the Consolidated Financial Statements for the year ended March 31, 2014 (Contd.)

JUBILANT FOODWORKS LIMITED (GROUP)
Annual Report 2013-1488
An assessment is made at each reporting date as to whether there is any indication that previously recognised impairment losses may no longer exist or may have decreased. If such indication exists, the Company estimates the asset’s or cash-generating unit’s recoverable amount. A previously recognised impairment loss is reversed only if there has been a change in the assumptions used to determine the asset’s recoverable amount since the last impairment loss was recognised. The reversal is limited so that the carrying amount of the asset does not exceed its recoverable amount, nor exceed the carrying amount that would have been determined, net of depreciation, had no impairment loss been recognised for the asset in prior years. Such reversal is recognised in the statement of profit and loss.
h) Leases
Where the Company is a lessee
Finance Lease, which effectively transfer to the Company substantially all the risks and benefits incidental to the ownership of the leased items, are capitalised at the inception of the lease term at the lower of fair value of the leased item and the present value of minimum lease payments. Lease payments are apportioned between the finance charges and reduction of the lease liability so as to achieve a constant rate of interest on the remaining balance of the liability. Finance charges are recognised as finance costs in the statement of profit and loss. Lease management fees, legal charges and other initial direct costs of lease are capitalised.
A leased asset is depreciated on a straight-line basis over the useful life of the asset or the useful life envisaged in Schedule XIV to the Companies Act, 1956, whichever is lower. However, if there is no reasonable certainty that the Company will obtain the ownership by the end of the term of hire, the capitalised asset is depreciated on a straight-line basis over the shorter of the estimated useful life of the asset, the term of hire or the useful life envisaged in Schedule XIV to the Companies Act, 1956.
Leases, where the lessor effectively retains substantially all risks and benefits of ownership of the leased item, are classified as operating leases. Operating lease payments are recognised as an expense in the statement of Profit and Loss on a straight line basis over the lease term.
i) Inventories
Inventories are valued as follows:
Raw Materials, Stores, Spares and Packing Materials, Traded Goods and work in progress
At the lower of cost and net realisable value. The cost for this purpose has been computed on FIFO basis.
Work in progress Lower of cost and net realisable value. Cost includes direct materials and labour and a proportion of manufacturing overheads, computed on FIFO basis.
Net realisable value is the estimated selling price in the ordinary course of business, less estimated costs of completion and to make the sale.
j) Investments
Investments which are readily realisable and intended to be held for not more than one year from the date on which such investments are made, are classified as current investments. All other investments are classified as long-term investments.
On initial recognition, all investments are measured at cost. The cost comprises purchase price and directly attributable acquisition charges such as brokerage, fees and duties.
Current investments are carried in the financial statement at lower of cost and fair value determined on an individual investment basis. Long-term investments are carried at cost. However, provision for diminution in value is made to recognise a decline other than temporary in the value of the investments.
On disposal of an investment, the difference between its carrying amount and net disposal proceeds is charged or credited to the statement of profit and loss.
k) Revenue Recognition
Revenue is recognised to the extent that it is probable that the economic benefits will flow to the Company and the revenue can be reliably measured.
Sale of Goods
Revenue from the sale of goods is recognised upon passage of title to the customers which coincides with their delivery.
Notesforming part of the Consolidated Financial Statements for the year ended March 31, 2014 (Contd.)

JUBILANT FOODWORKS LIMITED (GROUP)
Jubilant FoodWorks Limited 89
Writing on Tom
orrow’s Tim
eline Strategic Review Statutory Reports Financial Statem
ents
Interest
Revenue is recognised on a time proportion basis taking into account the amount outstanding and the rate applicable.
Dividends
Revenue is recognised when the right to receive the payment is established by the balance sheet date.
Franchisee Fee (Sub franchisee income)
Revenue is recognised on accrual basis in accordance with the terms of the relevant agreement, if there is significant certainty as to its collectability.
l) Foreign Currency Translation
Foreign currency transactions
(i) Initial Recognition
Foreign currency transactions are recorded in the reporting currency, by applying to the foreign currency amount the exchange rate between the reporting currency and the foreign currency on the date of the transaction.
(ii) Conversion
Foreign currency monetary items are reported using the closing rate. Non-monetary items which are carried in terms of historical cost denominated in a foreign currency are reported using the exchange rate at the date of the transaction.
(iii) Exchange Differences
Exchange differences arising on the settlement of monetary items, or on reporting such monetary items of company at rates different from those at which they were initially recorded during the year, or reported in previous financial statements, are recognised as income or as expenses in the year in which they arise.
Translation of integral and non-integral foreign operation
The Company classifies all its foreign operations as non-integral foreign operations.
The assets and liabilities of a non-integral foreign operation are translated into the reporting currency at the exchange rate prevailing at the reporting date. Their statement of profit and loss are translated at exchange rates prevailing at the dates of transactions or weighted average
weekly rates, where such rates approximate the exchange rate at the date of transaction. The exchange differences arising on translation are accumulated in the foreign currency translation reserve. On disposal of a non-integral foreign operation, the accumulated foreign currency translation reserve relating to that foreign operation is recognised in the statement of profit and loss.
m) Retirement and other employment Benefits
(i) Gratuity liability under the Payment of Gratuity Act is a defined benefit obligation and is provided for on the basis of an actuarial valuation on projected unit credit method made at the end of each financial year. The gratuity plan has been funded by policy taken from a Life Insurance company. Actuarial gains and losses for defined benefit plan are recognised in full in the period in which they occur in the statement of profit and loss.
(ii) Provident Fund (administered by a Trust) is a defined benefit scheme whereby the Company deposits an amount determined as a fixed percentage of basic pay to the fund every month. The benefit vests upon commencement of employment. The interest credited to the accounts of the employees is adjusted on an annual basis to confirm to the interest rate declared by the government for the Employees Provident Fund. The Guidance Note on implementing AS-15, Employee Benefits (revised 2005) states that provident funds set up by employers, which requires interest shortfall to be met by the employer, needs to be treated as defined benefit plan. The Actuarial Society of India has issued the final guidance for measurement of provident fund liabilities. The Company has adopted actuary valuation to arrive at provident fund liability as at the reporting date.
Retirement benefits in the form of Pension cost is a defined contribution scheme and the contributions are charged to the Statement of profit and loss for the year when the contributions to the respective funds are due. There are no other
Notesforming part of the Consolidated Financial Statements for the year ended March 31, 2014 (Contd.)

JUBILANT FOODWORKS LIMITED (GROUP)
Annual Report 2013-1490
obligations other than the contribution payable to the respective trusts.
(iii) Accumulated leave, which is expected to be utilised within the next 12 months, is treated as short-term employee benefit. The Company measures the expected cost of such absences as the additional amount that it expects to pay as a result of the unused entitlement that has accumulated at the reporting date. The Company treats accumulated leave expected to be carried forward beyond twelve months, as long-term employee benefit for measurement purpose. Such long term compensated absences are provided for based on the actuarial valuation using the projected unit credit method at the year-end. Actuarial gains/losses are immediately taken to the statement of profit and loss, and are not deferred. The Company presents the entire leave as a current liability in the balance sheet, since it does not have an unconditional right to defer its settlement for 12 months after the reporting date.
(iv) Actuarial gains/losses are immediately taken to statement of profit and loss and are not deferred.
n) Income Tax
Tax expense comprises of current & deferred tax.
Current income tax is measured at the amount expected to be paid to the tax authorities in accordance with the Indian Income Tax Act, 1961. Deferred income taxes reflects the impact of current year timing differences between taxable income and accounting income for the year and reversal of timing differences of earlier years.
Deferred tax is measured based on the tax rates and the tax laws enacted or substantively enacted at the balance sheet date. Deferred tax assets are recognised only to the extent that there is reasonable certainty that sufficient future taxable income will be available against which such deferred tax assets can be realised. If the Company has carry forward of unabsorbed depreciation and tax losses, deferred tax assets are recognised only if there is virtual certainty supported by convincing evidence that such deferred tax assets can be realised against future taxable profits.
Unrecognised deferred tax assets of earlier years are reassessed and recognised to the extent that it has become reasonably certain or virtually certain, as the case may be that sufficient future taxable income will be available against which such deferred tax assets can be realised.
Deferred tax assets and deferred tax liabilities are offset, if a legally enforceable right exists to set-off current tax assets against current tax liabilities and the deferred tax assets and deferred taxes relate to the same taxable entity and the same taxation authority.
o) Earnings Per Share
Basic earnings per share is calculated by dividing the net profit or loss for the year attributable to equity shareholders by the weighted average number of equity shares outstanding during the year.
For the purpose of calculating diluted earning per share, the net profit or loss for the year attributable to equity shareholders and the weighted average number of shares outstanding during the year are adjusted for the effects of all dilutive potential equity shares.
p) Provisions
A provision is recognised when the Company has a present obligation as a result of past event and it is probable that an outflow of resources will be required to settle the obligation, in respect of which a reliable estimate can be made. Provisions are not discounted to its present value and are determined based on best management estimate required to settle the obligation at the balance sheet date. These are reviewed at each Balance Sheet date and adjusted to reflect the current best management estimates.
q) Segment Reporting Policies
As the Company’s business activity primarily falls within a single business segment, thus there are no additional disclosures to be provided under Accounting Standard 17 - “Segment Reporting”. The management considers that the various goods and services provided by the Company constitutes single business segment, since the risk and rewards from these services are not different from one another. The Company’s operating businesses are organised and managed separately according to the nature of products and services provided, with each
Notesforming part of the Consolidated Financial Statements for the year ended March 31, 2014 (Contd.)

JUBILANT FOODWORKS LIMITED (GROUP)
Jubilant FoodWorks Limited 91
Writing on Tom
orrow’s Tim
eline Strategic Review Statutory Reports Financial Statem
ents
segment representing a strategic business unit that offers different products and serves different markets.
The analysis of geographical segments is based on geographical location of the customers.
The geographical segments considered for disclosure are as follows:
• Sales within India include sales to customerslocated within India
• Sales outside India include sales to customerslocated outside India
r) Cash Flow Statement
Cash flows are reported using indirect method, whereby profit before tax is adjusted for the effects transactions of a non-cash nature and any deferrals or accruals of past or future cash receipts or payments. The cash flows from regular revenue generating, financing and investing activities of the Company are segregated. Cash and cash equivalents in the cash flow comprise cash at bank, cash/cheques in hand and short-term investments with an original maturity of three months or less.
s) Employee Stock Compensation Cost
Measurement and disclosure of the employee share-based payment plans is done in accordance with SEBI (Employee Stock Option Scheme and Employee Stock Purchase Scheme) Guidelines, 1999 and the Guidance Note on Accounting for Employee Share-based Payments, issued by the Institute of Chartered Accountants of India. The Company measures compensation cost relating to employee stock options using the intrinsic value method.
t) Contingent liabilities
A contingent liability is a possible obligation that arises from past events whose existence will be confirmed by the occurrence or non-occurrence of one or more uncertain future events beyond the control of the Company or a present obligation that is not recognised because it is not probable that an outflow of resources will be required to settle the obligation. A contingent liability also arises in extremely rare cases where there is a liability that cannot be recognised because it cannot be measured reliably. The Company does not recognise a contingent liability but discloses its existence in the financial statements.
Notesforming part of the Consolidated Financial Statements for the year ended March 31, 2014 (Contd.)

JUBILANT FOODWORKS LIMITED (GROUP)
Annual Report 2013-1492
(` in Lakh)Particulars As at
March 31, 2014As at
March 31, 20133. SHARE CAPITAL Authorised Shares 80,000,000 (PY 80,000,000) equity shares of ` 10 each. 8,000.00 8,000.00 Issued, subscribed and fully paid -up shares 65,439,030 (PY 65,283,390) equity shares of ` 10 each fully paid-up 6,543.90 6,528.34 TOTAL 6,543.90 6,528.34
(a) Reconciliation of the shares outstanding at the beginning and at the end of the reporting period
Particulars As at March 31, 2014 As at March 31, 2013No. of shares
(In Lakh)Amount
(` In Lakh) No. of shares
(In Lakh)Amount
(` In Lakh) As at beginning of the year 652.83 6,528.34 650.78 6,507.79Add: Issued during the year - - - -Add: Issued during the year - ESOP 1.56 15.56 2.05 20.55Outstanding at the end of the year
654.39 6,543.90 652.83 6,528.34
(b) Terms/rights attached to equity shares
The Company has only one class of equity shares having par value of ` 10 per share. Each holder of equity shares is entitled to one vote per share. In the event of liquidation of the Company, the holders of equity shares will be entitled to receive remaining assets of the Company, after distribution of all preferential amounts. The distribution will be in proportion to the number of equity shares held by the shareholders.
(c) Shares held by holding/ultimate holding Company and/or their subsidiaries/associates
No shares are held by the subsidiary of the Company. The Company does not have holding, ultimate holding company and associates.
(d) Details of shareholders holding more than 5% shares in the Company
Particulars As at March 31, 2014 As at March 31, 2013No. of shares
(in Lakh)% age No. of shares
(in Lakh)% age
Equity shares of ` 10 each fully paid upJubilant Enpro Private Limited 320.23 48.94% 320.23 49.05%Weston Investments Limited 4.25 0.65% 35.26 5.40%Arisaig Partners (Asia) Pte Ltd A/C Arisaig India Fund Ltd
26.66 4.07% 35.24 5.40%
Copthall Mauritius Investment Limited 41.32 6.31% 10.57 1.62%
(e) Shares reserved for issue under options For details of shares reserved for issue under the employee stock option (ESOP) plan of the Company, please refer note 29.
Notesforming part of the Consolidated Financial Statements for the year ended March 31, 2014 (Contd.)

JUBILANT FOODWORKS LIMITED (GROUP)
Jubilant FoodWorks Limited 93
Writing on Tom
orrow’s Tim
eline Strategic Review Statutory Reports Financial Statem
ents
(` in Lakh)Particulars As a t
March 31, 2014As a t
March 31, 2013
4. RESERVES & SURPLUS
Securities Premium Reserve:
Balance as per last financial statements 9,848.16 9,713.30
Add: Premium on issue of equity shares 130.09 134.86
Closing Balance (A) 9,978.25 9,848.16
Surplus/(deficit) in the statement of profit and loss
Balance as per last financial statements 26,582.38 13,472.32
Add:Profit for the year 11,824.20 13,110.06
Net surplus in the statement of profit & loss (B) 38,406.58 26,582.38
Employee Stock options outstanding*
Foreign Currrency Translation Reserve
Balance as per last financial statements 17.67 (63.20)
Add:- Additions/(Adjustments) during the year 56.49 80.87
Foreign Currrency Translation Reserve (C) 74.16 17.67
TOTAL (A+B+C) 48,458.99 36,448.21
* The outstanding options under the ESOP Plan 2007 at the end of year are 371,547 (PY 524,647) & outstanding options under the ESOP Scheme 2011 at the end of year are 657,840 (PY 411,910) (Refer note 29)
5. SHARE APPLICATION MONEY PENDING ALLOTMENT Share application money pending allotment represents application received from employees on exercise of stock options
granted and vested under the ESOP Plan 2007.
Particulars As at March 31, 2014 As at March 31, 2013No. of shares
(in Lakh)Amount
(` in Lakh)No. of shares
(in Lakh)Amount
(` in Lakh)Equity shares of ` 10 each proposed to be issued
0.05 0.50 - -
Total Amount of security premium
- 1.25 - -
0.05 1.75 - -
The equity shares are expected to be allotted against the share application money within a reasonable period, not later than three months from the Balance Sheet date. As mentioned in note no 3, the Company has sufficient authorised share capital to cover the share capital amount on allotment of shares out of share application money
(` in Lakh)
Particulars As a t March 31, 2014
As a t March 31, 2013
6. OTHER LONG TERM LIABILITIESTrade Payables 878.95 589.82
OthersSecurity Deposits 13.00 13.00TOTAL 891.95 602.82
Notesforming part of the Consolidated Financial Statements for the year ended March 31, 2014 (Contd.)

JUBILANT FOODWORKS LIMITED (GROUP)
Annual Report 2013-1494
(` in Lakh)Particulars As at
March 31, 2014As at
March 31, 2013
7. DEFERRED TAX ASSETS/LIABILITY Deferred tax liability: Fixed assets: Impact of difference between tax depreciation and
depreciation/amortisation charged for financial reporting4,834.64 2,827.30
Gross deferred tax liability (A) 4,834.64 2,827.30 Deferred tax assets: Impact of expenditure charged to statement of profit & loss in the current
year/earlier years but allowable for tax purposes on payment basis975.77 731.58
Other temporary disallowances 113.22 87.12 Gross deferred tax asset (B) 1,088.99 818.70 Net deferred tax liabilities (A-B) 3,745.65 2,008.61
8. TRADE PAYABLES Creditors for goods and services 17,374.09 13,254.12 TOTAL 17,374.09 13,254.12
9. OTHER CURRENT LIABILITIES Security deposits 82.38 35.86 Unearned Income 88.81 106.67 Book overdraft 1,460.60 1,220.10 Investor Education and Protection Fund shall be credited by
following amounts (as and when due) - Unpaid application money received for allotment of shares and due for refund
0.29 0.29
Others Creditors for Capital goods 4,053.31 2,271.89 Statutory dues 2,348.80 1,981.93 TOTAL 8,034.19 5,616.74
10. SHORT TERM PROVISIONS Provision for employee benefits - Gratuity (Refer Note 32) 186.64 156.12 - Leave benefits 720.88 565.15 Others provisions Provision for Income Tax (net of advance income tax) 169.76 - Provision for Contingencies (note no 28) 69.45 - TOTAL 1,146.73 721.27
Notesforming part of the Consolidated Financial Statements for the year ended March 31, 2014 (Contd.)

JUBILANT FOODWORKS LIMITED (GROUP)
Jubilant FoodWorks Limited 95
Writing on Tom
orrow’s Tim
eline Strategic Review Statutory Reports Financial Statem
ents
(` in
Lak
h)
Part
icul
ars
GRO
SS B
LOCK
DEPR
ECIA
TIO
N /
AM
ORT
ISAT
ION
NET
BLO
CKA
s at
A
pril
1,
2013
Add
itio
n du
ring
th
e ye
ar
Dele
tion
s du
ring
th
e ye
ar
Fore
x Tr
ansl
atio
n A
djus
tmen
t
As
at
Mar
ch 3
1,
2014
As
at
Apr
il 1,
20
13
For
the
Year
Dele
tion
s du
ring
th
e ye
ar
Fore
x Tr
ansl
atio
n A
djus
tmen
t
As
at
Mar
ch 3
1,
2014
As
at
Mar
ch 3
1,
2014
As
at
Mar
ch 3
1,
2013
11. F
ixed
Ass
ets
TAN
GIBL
E A
SSET
SFr
eeho
ld L
and
3.41
--
-3.
41-
--
--
3.41
3.41
Leas
ehol
d Im
prov
emen
ts19
,243
.53
8,27
7.89
79.6
0(4
6.90
)27
,488
.72
5,21
1.91
2,57
7.07
66.2
52.
597,
725.
3219
,763
.40
14,0
31.6
2
Plan
t &
Mac
hine
ry27
,401
.1510
,127.5
017
3.01
(25.
69)
37,3
81.3
38,
098.
753,
037.7
711
4.64
0.76
11,0
26.3
426
,354
.99
19,3
02.4
1Of
fice
Equi
pmen
t83
3.95
423.
062.1
50.
491,
254.
3724
8.31
158.
551.
540.1
440
5.46
848.
9158
5.64
Furn
iture
&
Fixt
ures
4,20
9.24
2,10
8.09
9.85
(3.6
3)6,
311.1
12,
053.
3199
1.79
8.37
(0.5
2)3,
036.
213,
274.
902,
155.
93
Vehi
cles
4,24
9.70
1,38
6.65
206.
98(2
.40)
5,43
1.77
2,00
3.02
766.
2219
2.27
(1.8
6)2,
575.1
12,
856.
662,
246.
68TO
TAL-
A55
,940
.98
22,3
23.1
947
1.59
(78.
13)
77,8
70.7
117
,615
.30
7,53
1.40
383.
071.
1124
,768
.44
53,1
02.2
738
,325
.69
INTA
NGI
BLE
ASS
ETS
Stor
e Op
enin
g Fe
es &
Ter
ritor
y Fe
es
1,80
6.62
567.2
8-
(0.8
9)2,
374.
7966
6.73
265.
60-
0.08
932.
411,
442.
381,1
39.8
8
Soft
war
e27
5.12
129.1
8-
-40
4.30
236.
9775
.45
--
312.
4291
.88
38.15
TOTA
L- B
2,08
1.74
696.
46-
(0.8
9)2,
779.
0990
3.70
341.
05-
0.08
1,24
4.83
1,53
4.26
1,17
8.03
TOTA
L- (A
+B)
58,0
22.7
223
,019
.65
471.
59(7
9.02
)80
,649
.80
18,5
19.0
07,
872.
4538
3.07
1.19
26,0
13.2
754
,636
.53
39,5
03.7
2
PART
ICUL
ARS
As
at
Apr
il 1,
20
12
Add
itio
n du
ring
the
ye
ar
Dele
tion
s du
ring
the
ye
ar
Fore
x Tr
ansl
atio
n A
djus
tmen
t
As
at
Mar
ch 3
1,
2013
As
at
Apr
il 1,
20
12
For
the
Year
Dele
tion
s du
ring
th
e ye
ar
Fore
x Tr
ansl
atio
n A
djus
tmen
t
As
at
Mar
ch 3
1,
2013
As
at
Mar
ch 3
1,
2013
As
at
Mar
ch 3
1,
2012
TAN
GIBL
E A
SSET
SFr
eeho
ld L
and
3.41
--
-3.
41-
--
--
3.41
3.41
Leas
ehol
d Im
prov
emen
ts12
,308
.94
7,111
.96
193.
2915
.92
19,2
43.5
33,
615.
441,
735.
8513
9.52
0.14
5,21
1.91
14,0
31.6
28,
693.
50
Plan
t &
Mac
hine
ry18
,873
.86
9,20
1.24
683.
689.
7427
,401
.166,
523.
082,
179.
7560
5.19
0.04
8,09
8.75
19,3
02.4
112
,350
.78
Offic
e Eq
uipm
ent
398.
3044
3.20
8.07
0.52
833.
9518
3.07
72.9
57.7
20.
0124
8.31
585.
6421
5.23
Furn
iture
&
Fixt
ures
2,80
6.11
1,45
1.71
51.9
43.
364,
209.
241,
397.9
869
8.85
43.5
50.
032,
053.
312,
155.
931,
408.1
3
Vehi
cles
3,32
4.52
1,100
.88
177.1
71.
474,
249.
701,
566.
9360
2.91
166.
830.
012,
003.
022,
246.
681,
757.5
9TO
TAL-
A37
,715
.14
19,3
08.9
91,
114.
1531
.01
55,9
40.9
913
,286
.50
5,29
0.31
962.
810.
2317
,615
.30
38,3
25.6
924
,428
.64
INTA
NGI
BLE
ASS
ETS
Stor
e Op
enin
g Fe
es &
Ter
ritor
y Fe
es
1,42
1.65
384.
56-
0.40
1,80
6.61
464.
8920
1.84
--
666.
731,1
39.8
895
6.76
Soft
war
e21
2.09
63.0
2-
0.01
275.1
217
0.87
66.0
9-
0.01
236.
9738
.1541
.22
TOTA
L- B
1,63
3.74
447.
58-
0.41
2,08
1.73
635.
7626
7.93
-0.
0190
3.70
1,17
8.03
997.
98Pr
evio
us Y
ear
TOTA
L (A
+B)
39,3
48.8
819
,756
.57
1,11
4.15
31.4
258
,022
.72
13,9
22.2
65,
558.
2496
2.81
0.24
18,5
19.0
039
,503
.72
25,4
26.6
2
Notesforming part of the Consolidated Financial Statements for the year ended March 31, 2014 (Contd.)

JUBILANT FOODWORKS LIMITED (GROUP)
Annual Report 2013-1496
(` in Lakh)Particulars Current
As at March 31, 2014
As at March 31, 2013
12. INVESTMENTS Other than Trade investments (Valued at lower of cost and market value) Investments in Mutual Funds (Unquoted) Reliance Liquid Fund-Treasury Plan-Daily Dividend Option LFID Nil Units (Previous Year 98,182.7060) of ` Nil (Previous Year ` 15.2874) each
in Reliance Liquid Fund-Treasury Plan-Daily Dividend Option LFID- 1,500.96
Reliance Money Manager Fund-Daily Dividend Plan-LPID 125,036.1690 units (Previous Year 305,194.8030) of ` 1002.0864 (Previous
Year ` 1001.3715) each in Reliance Money Manager Fund-Daily Dividend Plan-LPID
1,252.19 3,056.13
Reliance Dynamic Bond Fund-Growth Plan - Growth Option 7,333,035.938 Units (Previous Year NIL) of ` 16.4408 (Previous Year NIL) each
in Reliance Dynamic Bond Fund-Growth Plan - Growth Option1,200.00 -
HDFC Liquid Fund - Dividend - Daily Reinvest Nil units (Previous Year 14,433,381.3040) of ` Nil (Previous Year ` 10.1982)
each in HDFC Liquid Fund-Dividend-Daily Reinvest- 1,471.95
HDFC Floating Rate Income Fund-Short Term Plan-Wholesale Option- Dividend Reinvestment-Daily
Nil units (Previous Year 5,981,140.8090) of ` Nil (Previous Year ` 10.0809) each in HDFC Floating Rate Income Fund-Short Term Plan-Wholesale Option- Dividend Reinvestment-Daily
- 602.95
HDFC Cash Managment Fund - Treasury Advantage Plan - Wholesale - Daily Dividend - Reinvestment
28,987,250.296 Units (Previous Year NiL) of ` 10.0315 (Previous Year ` NiL) each in HDFC Cash Managment Fund - Treasury Advantage Plan - Wholesale- Daily Dividend - Reinvestment
2,907.86 -
Birla Sun Life Cash Manager - Daily Dividend - Regular Plan 4,002,766.963 Units (Previous Year 2,765,422.1570) of ` 100.4264 (Previous
Year ` 100.1158) each in Birla Sunlife Cash Manager - Daily Dividend - Regular Plan
4,014.51 2,768.62
TOTAL 9,374.56 9,400.61 Aggregate amount of unquoted investments at cost 9,374.56 9,400.61 Aggregate amount of unquoted investments at market value (At respective
net asset values of mutual fund)9,386.27 9,403.97
Notesforming part of the Consolidated Financial Statements for the year ended March 31, 2014 (Contd.)

JUBILANT FOODWORKS LIMITED (GROUP)
Jubilant FoodWorks Limited 97
Writing on Tom
orrow’s Tim
eline Strategic Review Statutory Reports Financial Statem
ents
(` in Lakh)Particulars As a t
March 31, 2014 As a t
March 31, 201313. LONG TERM LOANS & ADVANCES (Unsecured, considered good unless stated otherwise) Capital Advances - Considered good 1,215.95 387.86 - Considered doubtful 49.53 -
1,265.48 387.86 Less: Provision for doubtful deposits 49.53 - TOTAL 1,215.95 387.86
Advances recoverable in cash or in kind or value to be received 4.49 14.80 Security and other deposits: - Considered good 9,205.33 6,601.96 - Considered doubtful 74.54 74.54
9,279.87 6,676.50 Less: Provision for doubtful deposits 74.54 74.54
9,205.33 6,601.96 Other loans & advances Advance tax (Net of provision for tax) 345.73 374.20 TOTAL 10,771.50 7,378.82
14. OTHER NON CURRENT ASSETS Balance with Bank: Deposits with original maturity of more than 12 months 41.60 34.08 TOTAL 41.60 34.08 (Fixed deposits receipts aggregating to ` 34.93 Lakh (PY ` 34.08 Lakh) are pledged with government authorities)
15. INVENTORIES (valued at lower of cost and net realisable value) Traded Goods 285.76 221.23 Raw Materials {including Material in Transit ` 75.81 Lakh
(Previous year ` 41.52 Lakh)}2,106.24 1,579.46
Stores, Spares and Packing Materials 875.31 568.73 Material in Process 40.68 33.12 TOTAL 3,307.99 2,402.54
16. TRADE RECEIVABLES (Unsecured, considered good unless stated otherwise) Outstanding for a period exceeding six months from the date they are due
for payment0.70 0.36
Other Debts 903.23 808.43 TOTAL 903.93 808.79
Notesforming part of the Consolidated Financial Statements for the year ended March 31, 2014 (Contd.)

JUBILANT FOODWORKS LIMITED (GROUP)
Annual Report 2013-1498
(` in Lakh)Particulars As at
March 31, 2014 As at
March 31, 201317. CASH AND BANK BALANCES Cash and cash equivalents Cash in hand 1,471.56 1,545.20 Cheques in hand 7.12 7.92 Balances with scheduled banks in: - Current accounts* 817.79 1,095.87 * Includes ` 0.29 Lakh (Previous year ` 0.29 Lakh) for IPO Refund Account and
is restrictive in nature. - Deposits with original maturity of less than 3 months 125.84 400.00 TOTAL (A) 2,422.31 3,048.99 Other bank balances Deposits with original maturity for more than 12 months Deposits with original maturity for more than 12 months 6.67 700.61 Deposits pledged with government authorities 34.93 34.08 Less: Amount disclosed under non-current assets (refer note 14) 41.60 34.08 (Fixed deposits aggregating to ` 34.93 Lakh (PY ` 34.08 Lakh) are pledged with government authorities) TOTAL (B) - 700.61 TOTAL (A+ B) 2,422.31 3,749.60
18. SHORT TERM LOANS AND ADVANCES (Unsecured, considered good unless stated otherwise) Advances recoverable in cash or in kind or value to be received: - Considered good 2,586.81 877.43 - Considered doubtful 118.83 152.13
2,705.64 1,029.56 Less: Provision for doubtful advances 118.83 152.13
2,586.81 877.43 Service Tax recoverable 172.62 - TOTAL 2,759.43 877.43
19. OTHER CURRENT ASSETS Insurance claim recoverable 14.54 6.64 Others 0.60 - TOTAL 15.14 6.64
Notesforming part of the Consolidated Financial Statements for the year ended March 31, 2014 (Contd.)

JUBILANT FOODWORKS LIMITED (GROUP)
Jubilant FoodWorks Limited 99
Writing on Tom
orrow’s Tim
eline Strategic Review Statutory Reports Financial Statem
ents
(` in Lakh)Particulars Year E nded
March 31, 2014Year Ended
March 31, 201320. REVENUE FROM OPERATIONS Sale of products: Manufactured goods 157,910.07 127,254.17 Traded goods 15,690.65 14,151.39 Other operating income: Sub-franchisee Income 30.21 25.15 Revenue from operation 173,630.93 141,430.71 Details of products sold: Manufactured goods sold Pizza 135,773.61 107,265.16 Others 22,136.46 19,989.01 TOTAL 157,910.07 127,254.17 Traded goods sold Beverages 6,981.30 5,360.69 Dessert 5,864.63 6,076.10 Dips 2,471.70 2,698.67 Others 373.02 15.93 TOTAL 15,690.65 14,151.39
21. OTHER INCOME Interest Received - Bank deposits 64.45 88.72 Dividend income from current investments- other than trade 782.38 683.60 Miscellaneous income 92.61 14.65 TOTAL 939.44 786.97
22. COST OF MATERIALS CONSUMED Inventory at the beginning of the year 1,578.48 1,143.94 Add: Purchases during the year 39,270.73 31,425.92
40,849.21 32,569.86 Less: Sales during the year 108.22 96.46 Less: Inventory at the end of the year {including Material in Transit ` 75.81
Lakh (Previous year ` 41.52 Lakh)}2,106.61 1,578.48
Adjustment for fluctuation in exchange rate 3.55 (0.45) Cost of materials consumed 38,637.93 30,894.47 Details of raw materials consumed Cheese 17,047.79 14,432.96 Others 21,590.14 16,461.51 TOTAL 38,637.93 30,894.47 Details of Inventory Cheese 870.61 628.50 Others 1,236.00 949.98 TOTAL 2,106.61 1,578.48
Notesforming part of the Consolidated Financial Statements for the year ended March 31, 2014 (Contd.)

JUBILANT FOODWORKS LIMITED (GROUP)
Annual Report 2013-14100
(` in Lakh)Particulars Year Ended
March 31, 2014Year Ended
March 31, 201323. (INCREASE)/ DECREASE IN INVENTORIES
Opening StockWork in Progress 33.12 31.92Traded Goods 221.19 260.12Adjustment for fluctuation in exchange rate 0.16 -Total (A) 254.47 292.04Less: Closing StockClosing Stock - Work in Progress 40.68 33.12Closing Stock - Traded Goods 285.79 221.19Total (B) 326.47 254.31TOTAL (A-B) (72.00) 37.73Details of Purchase of traded goodsPrepackaged Beverages 4,204.30 3,643.73Dessert 1,722.14 1,571.64Dips 848.90 848.54TOTAL 6,775.34 6,063.91Details of (increase)/decrease in inventoriesTraded Goods:Beverages (7.40) (19.19)Dessert (44.48) 62.62Dips (12.72) (4.50)Adjustment for fluctuation in exchange rate 0.16 -Total (A) (64.44) 38.93Work in Progress Total (B) (7.56) (1.20)(INCREASE)/DECREASE IN INVENTORIES (A+B) (72.00) 37.73Details of inventory at the end of the yearTraded Goods:Beverages 94.01 86.61Dessert 138.54 94.06Dips 53.24 40.52TOTAL 285.79 221.19Work in Process:Dough 40.68 33.12TOTAL 40.68 33.12
24. EMPLOYEE BENEFIT EXPENSESSalaries, Allowances & Bonus (Refer note 33) 29,593.28 23,343.34Gratuity (Refer note 32) 225.21 262.38Contribution to Provident and Other Funds 2,318.18 1,839.13Staff Welfare Expenses 1,971.09 1,700.21TOTAL 34,107.76 27,145.06
Notesforming part of the Consolidated Financial Statements for the year ended March 31, 2014 (Contd.)

JUBILANT FOODWORKS LIMITED (GROUP)
Jubilant FoodWorks Limited 101
Writing on Tom
orrow’s Tim
eline Strategic Review Statutory Reports Financial Statem
ents
(` in Lakh)Particulars Year E nded
March 31, 2014Year E nded
March 31, 201325. OTHER EXPENSES
Stores Consumed 1,468.22 1,043.99Packing Materials Consumed 7,117.32 5,690.46Power & Fuel (Refer note 33) 10,450.59 7,357.66Repairs - Plant and Machinery 932.51 620.50Repairs - Others 1,811.77 1,395.27Rent (Refer note c below) (Refer note 33) 15,649.72 11,706.61Rates and Taxes 1,192.03 994.41Insurance 162.20 105.27Travelling and Conveyance 1,207.55 978.77Freight & Delivery Expenses 5,289.26 4,431.03Postage, Telephones and Telegrams 1,591.67 1,268.29Legal and Professional Charges (Refer note b below) 785.86 598.49Director's Sitting Fees 7.42 5.69Franchisee Fee 5,634.21 4,783.51Advertisement & Publicity Expenses (Refer note a below) 8,903.15 6,381.14Sundry balances written off - 13.07Provision for Doubtful Debts and Advances 49.53 45.31Loss on disposal of fixed assets (net) (including provision) 36.11 161.73Political Contribution (Refer note d below) 250.00 -Miscellaneous Expenses 6,684.50 5,542.34TOTAL 69,223.62 53,123.54
Notes:a) Advertisement and Publicity expenses are net of amount received from business partner ` 1,455.65 Lakh
(Previous Year ` 1,660.67 Lakh)b) Legal and Professional expenses include following expenses for payment to auditors
(` in Lakh)Particulars Parent Company Subsidiary
Year E nded March 31, 2014
Year E nded March 31, 2013
Year E nded March 31, 2014
Year E nded March 31, 2013
As Auditor:Audit fees 31.50 28.00 3.58 2.59Tax Audit fees 5.00 4.00 - 0.43Limited Review 19.50 18.00 - -Others:Certification fees 2.50 2.50 0.27 -Reimbursement of expenses 11.97 12.21 - -
(Inclusive of service Tax on entire fee, net of cenvat credit)c) The stores and office premises are obtained on operating leases. The lease term is generally for 1-28 years and the same are
generally renewable at the option of the lessee. The lease agreements have an escalation clause. There are no subleases and the leases are generally cancellable in nature. The aggregate lease rentals are charged as rent.
d) Information in respect of Political contribution(` in Lakh)
Particulars Year E nded March 31, 2014
Year E nded March 31, 2013
Donation to Satya Electoral Trust 250.00 -
26. FINANCE COSTS Interest - Others - 6.35 TOTAL - 6.35
Notesforming part of the Consolidated Financial Statements for the year ended March 31, 2014 (Contd.)

JUBILANT FOODWORKS LIMITED (GROUP)
Annual Report 2013-14102
(in Lakh)Particulars Year Ended
March 31, 2014Year Ended
March 31, 201327. EARNING PER SHARE (EPS)
Net profit after tax for calculation of Basic and Diluted EPS (` in Lakh) 11,824.20 13,110.06Weighted average number of equity shares for calculation of Basic EPS 653.66 651.65Weighted average number of equity shares for calculation of Diluted EPS 657.97 657.61Basic EPS (in `) 18.09 20.12Diluted EPS (in `) 17.97 19.94Nominal value per share (in `) 10.00 10.00Reconciliation of number of shares:Weighted average number of equity shares for calculation of Basic EPS 653.66 651.65Add: Weighted number of ESOP outstanding 4.31 5.96Weighted average number of equity shares for calculation of Diluted EPS 657.97 657.61
28 CONTINGENT LIABILITY PROVIDED FOR: (` in Lakh)Particulars Opening Balance Additions Utilisation Closing Balance
VAT cases - 69.45 - 69.45
CONTINGENT LIABILITY NOT PROVIDED FOR:(` in Lakh)
Particulars March 31, 2014 March 31, 2013Appeals filed by Tamil Nadu Sales Tax Department for various orders issued by the Appellate Assistant Commissioner (CT) in favour of the Company pertaining to the financial years 1998-99 to 2000-01.
- 114.80
The Sales Tax Appellate Tribunal has passed order in favour of the Company for the year 2001-02. The Company has received favarouable order from the Sales Tax Appellate Tribunal & the orders of 1st Appellate Authority i.e. Assistant Commissioner (CT) have been sustained by the hon'ble Tribunal.Tax demand for Excise Duty contested by the Company where the Company is confident that the ultimate decision will be in favour of the Company. it is expected that there will not be any outflow of economic resources embodying economic benefits. Hence, no provision is considered necessary against the same.
2.51 2.51
Income TaxThe ITAT has passed favouarable order except for few grounds which are referred back to the books of AO for the AY 2003-04 to 2005-06. it is expected that there will not be any outflow of economic resources embodying economic benefits. Hence, no provision is considered necessary against the same.
10.36 -
The Income Tax Department has filed appeal in ITAT against the order passed by CIT(A) in favour of the Company from AY 2006-07 to AY 2009-10. it is expected that there will not be any outflow of economic resources embodying economic benefits. Hence, no provision is considered necessary against the same.
- 361.54
The Company has filed an appeal before the ITAT against the additions upheld by the CIT(A) from AY 2006-07 to AY 2009-10. it is expected that there will not be any outflow of economic resources embodying economic benefits. Hence, no provision is considered necessary against the same.
56.64 54.97
The Company has filed an appeal before the CIT(A) against the Penalty order from AY 2007-08 to AY 2008-09. it is expected that there will not be any outflow of economic resources embodying economic benefits. Hence, no provision is considered necessary against the same.
4.94
Assessing officer has passed unfavourable order pertaining to the AY 2010-11 and 2011-12. The Company has filed appeal before CIT(A) against the order of the department.
541.72
Based on the legal opinions taken and inconsistencies in various Assessment Orders of AO coupled with the fact that the Company has already won the appeals made to CIT(A), it is expected that there will not be any outflow of economic resources embodying economic benefits. Hence, no provision is considered necessary against the same
30.61
Notesforming part of the Consolidated Financial Statements for the year ended March 31, 2014 (Contd.)

JUBILANT FOODWORKS LIMITED (GROUP)
Jubilant FoodWorks Limited 103
Writing on Tom
orrow’s Tim
eline Strategic Review Statutory Reports Financial Statem
ents
29 EMPLOYEE STOCK OPTION PLAN
For the financial year ended March 31, 2014, the following schemes were in operation:
a) Employees Stock Option Plan, 2007 (ESOP 2007); and
b) JFL Employees Stock Option Scheme, 2011 (ESOP 2011).
Particulars ESOP 2007 ESOP 2011Date of grant April 1,
2007April 1,
2008April 1,
2009September
29, 2009October 5,
2009October 5,
2011December
14, 2012November
11, 2013Date of Board Approval March 23, 2007 July 12, 2011Date of Shareholder’s approval
August 6, 2007 August 20, 2011
Date of Last Modification
September 3, 2009 August 8, 2013
Number of options granted
1,800,340 355,800 152,000 277,960 45,000 2,32,500 2,02,050 278,500
Method of Settlement (Cash/Equity)
Equity Equity
Vesting Period 5 years 3 years Exercise Period 9 years from first vesting date 7 years from first vesting dateVesting Conditions $ #
$ The vesting takes place on staggered basis over the respective vesting period.
# Vesting of options is a function of achievement of performance criteria or any other criteria as specified by the Compensation Committee and communicated in the grant letter. Further, the vesting takes place on staggered basis over the respective vesting period.
The details of activity under the Plan have been summarised below:
Particulars ESOP 2007 ESOP 2011Year ended
March 31, 2014Year ended
March 31, 2013Year ended
March 31, 2014Year ended
March 31, 2013Number
of options
Exercise Price (`)
Number of
options
Exercise Price (`)
Number of
options
Exercise Price (`)
Number of
options
Exercise Price (`)
Outstanding at the beginning of the year
287,464 73 374,164 73 199,100 1,326 230,100 66989,500 51 155,850 51 212,810 669
147,683 35 216,653 35Granted during the year NIL NIL NIL NIL 278,500 1,260 202,050 1,326Forfeited during the year ^
NIL NIL 23,460 51 1,400 1,260 2,950 1,32611,475 1,326 10,400 66912,155 669
Exercised during the year
101,100 73 86,700 73 7,540 669 6,890 66931,000 51 42,890 51
#21,000 35 68,970 35Expired during the year NIL NIL NIL NIL NIL NIL NIL NILOutstanding at the end of the year
186,364 73 287,464 73 277,100 1,260 199,100 1,32658,500 51 89,500 51 187,625 1,326 212,810 669
126,683 35 147,683 35 193,115 669Exercisable at the end of the year
43,876 73 26,236 73 NIL 1,260 NIL 1,32658,500 51 30,220 51 33,585 1,326 37,770 669
126,683 35 147,683 35 86,365 669Remaining Contractual Life * Refer Note below * Refer Note below
^ Forfeited options include vested options not exercised within the stipulated time prescribed under the respective ESOP schemes, vested/ unvested options forfeited in accordance with terms prescribed under the respective ESOP Schemes.
# Includes 5,000 options against which allotment of shares has not been made till March 31, 2014.
Notesforming part of the Consolidated Financial Statements for the year ended March 31, 2014 (Contd.)

JUBILANT FOODWORKS LIMITED (GROUP)
Annual Report 2013-14104
* Note: Remaining Contractual Life as on March 31, 2014, is set forth below:
ESOP 2007 ESOP 2011Date of grant April 1,
2007April 1,
2008April 1,
2009September
29, 2009October 5,
2009October 5,
2011December
14, 2012November
11, 2013As on March 31, 2014 2 years and
3 years4 years 5 years 5 years 5
months 28 days
5 years 6 months 4
days
5 years 6 months 4
days
6 years 8 months 13
days
7 years 7 months 10
daysAs on March 31, 2013 3 years & 4
years5 years 6 years 6 years 5
months 28 days
6 years 6 months 4
days
6 years 6 months 4
days
7 years 8 months 13
days
N.A.
The Company has opted for intrinsic value method for valuation of options under both the ESOP Schemes.
During the year the weighted average market price of the Company’s share was ` 1,125.84 (Previous Year ` 1,199.71)
Under ESOP 2007, as the shares were not quoted on any stock exchange prior to grant of options by the Company, hence the fair value of its shares was determined on the basis of a valuation performed by a Category I Merchant Banker.
The Compensation Committee of the Company, on November 11, 2013, granted 278,500 options to eligible Employees/Directors of the Company and its subsidiary under ESOP 2011. Each option shall entitle the holder to acquire 1 equity share of ` 10 each fully paid up at ` 1,260/- being the market price as per SEBI guidelines.
Since the Fair Market Value of shares was less than/equal to the Exercise Price at the time of grant of options, therefore no accounting is required to be done consequent to grant of options.
The weighted average fair value of stock options granted pertaining to ESOP 2007 scheme was Nil (previous year Nil).
The weighted average fair value of stock options granted during the year pertaining to ESOP 2011 scheme is ` 420.37 (previous year ` 377.17)
For both the schemes, the black scholes valuation model has been used for computing the weighted average fair value considering the following inputs:Assumptions Unit Employee Stock Option Plan - 2007 JFL Employee Stock Option
Scheme - 2011Date of grant of Option
October 5, 2009
September 29, 2009
April 1 2009
April 1, 2008
April 1, 2007
October 5, 2011
December 14, 2012
November 11, 2013
Exercise price Current year
` 73.00 73.00 73.00 51.00 35.00 669.00 1,326.00 1260.00
(Previous year)
` (73.00) (73.00) (73.00) (51.00) (35.00) (669.00) (1,326.00) N.A
Weighted average share price
Current year
` 17.48 17.48 13.65 10.42 7.02 669.00 1,326.00 1260.00
(Previous year)
` (17.48) (17.48) (13.65) (10.42) (7.02) (669.00) (1,326.00) N.A
Expected option life
Current year
No of Years
5 years 6 months 4
days
5 years 5 months 28
days
5 years 4 years 2 years and 3 years
5 years 6 months 4
days
6 years 8 months 13
days
7 years 7 months 10
days(Previous year)
No of Years
6 years 6 months 4
days
6 years 5 months 28
days
6 years 5 years 3 years & 4 years
6 years 6 months 4
days
7 years 8 months 13
days
N.A.
Volatility Current year
% 11.62% 11.62% 12.45% 13.53% 12.18% 52.75% 34.38% 36.99%
(Previous year)
% (11.62%) (11.62%) (12.45%) (13.53% ) (12.18%) (52.75%) (34.38%) N.A
Risk free return Current year
% 7.30% 7.30% 7.17% 7.83% 7.93% 8.45% 8.06% 9.05%
(Previous year)
% (7.30%) (7.30%) (7.17%) (7.83% ) (7.93%) (8.45%) (8.06%) N.A
Expected dividend Yield
Current year
% 0.00% 0.00% 0.00% 0.00% 0.00% 0.00% 0.00% 0.00%
(Previous year)
% (0.00%) (0.00%) (0.00%) (0.00%) (0.00%) (0.00%) (0.00%) N.A
Notesforming part of the Consolidated Financial Statements for the year ended March 31, 2014 (Contd.)

JUBILANT FOODWORKS LIMITED (GROUP)
Jubilant FoodWorks Limited 105
Writing on Tom
orrow’s Tim
eline Strategic Review Statutory Reports Financial Statem
ents
The expected life of the stock is based on historical data and current market expectations and is not necessarily indicative of exercise patterns that may occur. The expected volatility reflects the assumption that the historical volatility over a period similar to the life of the options is indicative of future trends, which may also not necesssarily be the actual outcome.
The Company measures the cost of ESOP using the intrinsic value method. Had the Company used the fair value method to determine compensation, its profit after tax and earning per share as reported would have changed to the amounts indicated below:
(` in Lakh)Particulars Year E nded
March 31, 2014Year E nded
March 31, 2013Profit after tax as reported 11,824.20 13,110.06Add: ESOP cost using intrinsic value method - -Less: ESOP cost using fair value method 845.88 312.63Proforma profit after tax 10,978.32 12,797.43Earnings per share (in `)Basic
-As reported 18.09 20.12-As proforma 16.80 19.64
Diluted-As reported 17.97 19.94-As proforma 16.69 19.46
30 Related Party Disclosure
(i) The list of related parties as identified by the management is as under: (with whom transactions have occurred during the year).
Name of the Party RelationshipMr. Ajay Kaul Key Management Personnel (A)Mr. Shyam S. BhartiaMr. Hari S. Bhartia
Key Management Personnel (till December 23, 2013) /Individuals owning, directly or indirectly, an interest in the voting power of the Company that gives them significant influence over the Company (from December 24, 2013) (B)
Jubilant Life Sciences Limited Enterprises over which any person described above or their relative is able to exercise significant influence (C)HT Media Limited
Jubilant Fresh Pvt LtdJubilant Agri & Consumer Products Limited
Notesforming part of the Consolidated Financial Statements for the year ended March 31, 2014 (Contd.)

JUBILANT FOODWORKS LIMITED (GROUP)
Annual Report 2013-14106
Notesforming part of the Consolidated Financial Statements for the year ended March 31, 2014 (Contd.)
(ii)
Tran
sact
ions
wit
h Re
late
d pa
rtie
s (`
in L
akh)
Part
icul
ars
Ente
rpris
e ov
er w
hich
any
pe
rson
des
crib
ed in
(B)
abov
e or
thei
r rel
ativ
e is
able
to e
xerc
ise si
gnifi
cant
in
fluen
ce.
(C)
Key
Man
a gem
ent P
erso
nnel
(A
& B
)
(A)
(B)
(A
& B
)
Indi
vidu
als o
wni
ng,
dire
ctly
or i
ndire
ctly,
an
inte
rest
in th
e vo
ting
pow
er o
f the
Com
pany
th
at g
ives t
hem
sign
ifica
nt
influ
ence
ove
r the
Co
mpa
ny (f
rom
Dec
embe
r 24
, 201
3 o
nwar
ds ti
ll M
arch
31, 2
014)
( B)
Tota
l
Marc
h 31
, 201
4Ma
rch
31, 2
013
Marc
h 31
, 201
4til
l Dec
23,
201
3Ma
rch
31, 2
013
Marc
h 31
, 201
4Ma
rch
31, 2
014
Marc
h 31
, 201
3A)
Tra
nsac
tions
Char
ges f
or se
rvic
es, p
aid
to- H
T Me
dia Li
mite
d24
2.38
178.5
6-
--
-24
2.38
178.5
6- J
ubila
nt Li
fe Sc
ience
s Lim
ited
136.2
859
.69-
--
-13
6.28
59.69
- Jub
ilant
Fres
h Pv
t Ltd
609.4
2-
--
--
609.4
2-
- Jub
ilant
Agr
i & C
onsu
mer
Pro
duct
s Lim
ited
2.87
3.58
--
--
2.87
3.58
Paym
ent f
or C
apita
l ite
ms
- Jub
ilant
Life
Scien
ces L
imite
d (A
dvan
ce p
aid
for p
urch
ase
of la
nd)
60
5.74
--
- -
-
605.7
4 -
Dire
ctor
's Si
ttin
g Fe
es- M
r. Shy
am S.
Bha
rtia
--
-0.
670.8
50.2
20.8
90.8
5- M
r. Har
i S. B
hart
ia-
--
0.84
0.81
0.22
1.06
0.81
Rem
uner
atio
n to
Who
le T
ime
Dire
ctor
- Mr. A
jay K
aul
--
336.5
1-
334.8
5-
336.5
133
4.85
Allo
tmen
t of E
quity
Shar
es - M
r. Aj
ay K
aul*
re
fer n
otes
1, 2
& 3
B) B
alan
ce o
utst
andi
ng (a
dvan
ce)/
paya
bles
as
at t
he e
nd o
f the
yea
rCh
arge
s for
serv
ices
- HT
Media
Lim
ited
20.46
17.14
--
--
20.46
17.14
- Jub
ilant
Life
Scien
ces L
imite
d (A
dvan
ce)
(605
.74)
--
--
-(6
05.74
)-
- Jub
ilant
Life
Scien
ces L
imite
d (P
ayab
le)89
.2953
.72-
--
-89
.2953
.72- J
ubila
nt Fr
esh
Pvt L
td80
.71-
--
--
80.71
-- J
ubila
nt A
gri &
Con
sum
er P
rodu
cts L
imite
d0.4
8-
--
--
0.48
-
*Dur
ing
the
year
end
ed M
arch
31,
201
4, M
r. Aj
ay K
aul,
Key
Man
agem
ent P
erso
nnel
of t
he C
ompa
ny, w
as n
ot a
llott
ed a
ny e
quity
shar
es (P
revi
ous y
ear N
il) u
nder
Em
ploy
ees
Stoc
k Op
tion
Plan
, 20
07 (“
ESOP
200
7”) o
r JFL
Em
ploy
ees
Stoc
k Op
tion
Sche
me,
201
1 (“E
SOP
2011
”) of
the
Com
pany
.
Not
es:
1.
No a
mou
nt h
as b
een
prov
ided
as
doub
tful
deb
ts o
r adv
ance
s /
writ
ten
off
or w
ritte
n ba
ck in
the
yea
r in
resp
ect
of d
ebts
due
fro
m/
to a
bove
rela
ted
part
ies.
2.
Durin
g th
e ye
ar e
nded
Mar
ch 3
1, 2
014,
30,
400
optio
ns a
t an
exe
rcise
pric
e of
` 1
,260
per
opt
ion
(Pre
viou
s Ye
ar 2
9,00
0 op
tions
at
an e
xerc
ise p
rice
of `
1,3
26 p
er o
ptio
n) w
ere
gran
ted
to M
r. Aj
ay K
aul,
unde
r ESO
P 20
11.
3.
The
stat
us o
f st
ock
optio
ns p
endi
ng v
estin
g/ex
erci
se, g
rant
ed to
Mr.
Ajay
Kau
l is a
s be
low
:
Empl
oyee
Sto
ck O
ptio
n Pl
an 2
007
JFL
Empl
oyee
s St
ock
Opt
ion
Sche
me
2011
Exer
cise
Pri
ce`
51`
73`
669
` 1,
326
` 1,
260
As
at M
arch
31,
201
455
,000
37,5
0050
,000
29,0
0030
,400
As
at M
arch
31,
201
355
,000
37,5
0050
,000
29,0
00-

JUBILANT FOODWORKS LIMITED (GROUP)
Jubilant FoodWorks Limited 107
Writing on Tom
orrow’s Tim
eline Strategic Review Statutory Reports Financial Statem
ents
31 a) Estimated amount of contracts remaining to be executed on capital account (net of advances) and not provided for ` 4,172.16 Lakh (PY ` 1,137.77 Lakh).
b) The Company has a wholly owned subsidiary “Jubilant FoodWorks Lanka (Pvt) Ltd.” to which the Company has committed a continued financial support as its holding company. The subsidiary is currently at initial operating stage and is therefore not in profits. Based on business plans, the Company is confident that in future it would earn profits.
c) Commitment to open specified number of stores/ restaurants under respective franchisee agreements. Amount not quantifiable.
32 Gratuity and other post -employment benefit plan:
The Company has a defined benefit gratuity plan. Every employee who has completed five years or more of service gets a gratuity on departure at 15 days salary (last drawn salary) for each completed year of service. The scheme is partially funded.
The following tables summarises the components of net benefit expense recognised in the statement of profit and loss and the amounts recognised in the balance sheet.
Statement of Profit & Loss
Net employee benefit expense (recognised in Employee Cost)
(` in Lakh)Particulars Gratuity
March 31, 2014 March 31, 2013Current service cost 260.33 199.93Past service cost - -Interest cost on benefit obligation 61.22 42.40Expected return on plan assets (54.73) -Curtailment Cost - -Settlement cost - -Net actuarial (gain)/ loss recognised in the year (82.67) (11.15)Expenses recognised in the statement of profit & losses 184.15 231.18
Particulars GratuityMarch 31, 2014 March 31, 2013
Present value of obligation as at the end of period 1,034.13 761.90Present value of obligation as at the beginning of the period 761.90 531.47Benefits paid - -Actual return on plan assets (90.02) -Acquisition adjustment - -Expenses recognised in the statement of profit & loss 182.21 230.43
Balance SheetDetails of provision for Gratuity:Particulars Gratuity
March 31, 2014 March 31, 2013Defined benefit obligation 1,038.56 764.26Fair value of plan assets 851.92 608.14Less: Unrecognised past service cost - -Plan asset/liability 186.64 156.12
(` in Lakh)Particulars Long term Short term
March 31, 2014 March 31, 2013 March 31, 2014 March 31, 2013Provision for Gratuity - - 186.64 156.12
Notesforming part of the Consolidated Financial Statements for the year ended March 31, 2014 (Contd.)

JUBILANT FOODWORKS LIMITED (GROUP)
Annual Report 2013-14108
Changes in the present value of the defined benefit obligation are as follows(` in Lakh)
Particulars March 31, 2014 March 31, 2013Present value of obligation as at the beginning of the period 764.26 532.82Acquisition adjustment - -Interest cost 60.98 42.66Past service cost - -Current service cost 260.33 199.93Curtailment cost/(Credit) - -Settlement cost/(Credit) - -Benefits paid - -Actuarial (gain)/loss on obligation (47.38) (11.15)Present value of obligation as at the end of period 1,038.19 764.26
Change in the fair value of plan assets are as follows:Particulars March 31, 2014 March 31, 2013Fair value of plan assets at the beginning of the period 608.14 302.00Acquisition adjustment - -Expected return on plan assets 54.73 -Contributions 153.76 306.14Benefits paid - -Actuarial gain/(loss) on plan assets 35.29 -Fair value of plan assets at the end of the period 851.92 608.14
The Company expects to contribute ` 186.64 Lakh (PY ` 350.00 Lakh) to gratuity in the next year.
The major categories of plan assets as a percentage of the fair value of total plan assets are as follows:
Particulars March 31, 2014 March 31, 2013Insurance policy with SBI Life Insurance 100% 100%
The principal assumptions used in determining gratuity for the Company’s plans are shown below:
Demographic AssumptionsParticulars Gratuity
March 31, 2014 March 31, 2013Discount Rate (%) 8.50 8.00Future salary increase (%) 6.00 5.50Expected rate of return on plan assets (%) 9.00 8.00
The estimates of future salary increases, considered in actuarial valuation, take account of inflation, seniority, promotion and other relevant factors, such as supply and demand in the employment market
Particulars March 31, 2014 March 31, 2013Retirement Age 58 YearsMortality Table IALM (2006-08) LIC (1994-96) duly
modifiedAges Withdrawal
Rate (%)Withdrawal
Rate (%)Up to 30 Years 3.00 3.00From 31 to 44 years 2.00 2.00Above 44 years 1.00 1.00
Notesforming part of the Consolidated Financial Statements for the year ended March 31, 2014 (Contd.)

JUBILANT FOODWORKS LIMITED (GROUP)
Jubilant FoodWorks Limited 109
Writing on Tom
orrow’s Tim
eline Strategic Review Statutory Reports Financial Statem
ents
Amounts for the current and previous years are as follows:(` in Lakh)
Particulars GratuityYear e nded
March 31, 2014Year e nded
March 31, 2013Year e nded
March 31, 2012Year e nded
March 31, 2011Year e nded
March 31, 2010Defined benefit obligation 1,038.56 764.26 531.47 334.32 210.21Plan assets 851.92 608.14 302.00 - -Surplus / (deficit) (186.64) (156.12) (229.47) (334.32) (210.21)Experience loss/(gain) on plan liabilities
52.30 13.92 (25.79) (14.33) 0.92
Provident Fund
The provident fund being administered by a Trust is a defined benefit scheme whereby the Company deposits an amount determined as a fixed percentage of basic pay to the fund every month. The benefit vest upon commencement of employment. The interest credited to the accounts of the employee is adjusted on an annual basis to confirm to the interest rate declared by the government for the Employees Provident Fund. The actuary has provided a valuation based on Projected Unit Credit Method (PUCM) and based on the below provided assumptions, there is no shortfall as at March 31, 2014.
(` in Lakh)Defined benefit plan: March 31, 2014 March 31, 2013Contribution to provident and other funds 633.46 455.62
Defined contribution plan: March 31, 2014 March 31, 2013Contribution to provident fund 907.96 726.04
The detail of fund and plan asset position as at March 31, 2014 is given below:(` in Lakh)
Particulars March 31, 2014 March 31, 2013Plan assets at fair value 6,770.87 4,881.45Present value of the defined benefit obligation 6,564.49 4,793.93Surplus in fund 206.38 87.52Asset recognised in the balance sheet - -
The assumption used in determining the present value of obligation of the interest rate guarantee are:
Particulars March 31, 2014 March 31, 2013Discounting rate 8.75% 8.50%Expected guaranteed interest rate 8.75% 8.50%Expected Rate of Return on Asset 8.70% 8.50%
Particulars March 31, 2014 March 31, 2013Retirement Age 58 YearsMortality Table IALM (2006-08) LIC (1994-96) duly
modifiedAges Withdrawal
Rate (%)Withdrawal
Rate (%)Up to 30 Years 3.00 3.00From 31 to 44 years 2.00 2.00Above 44 years 1.00 1.00
Notesforming part of the Consolidated Financial Statements for the year ended March 31, 2014 (Contd.)

JUBILANT FOODWORKS LIMITED (GROUP)
Annual Report 2013-14110
Change in the fair value of plan assets are as follows: (` in Lakh)Particulars March 31, 2014 March 31, 2013Fair value of plan assets at the beginning of the period 4,881.45 3,345.40Expected return on plan assets 427.13 284.36Employer Contributions 636.40 465.09Plan Participants / Employee Contribution 1,519.87 1,155.55Benefit Payments (807.67) (485.54)Asset Gain /(Loss) 79.90 83.46Settlements / Transfer In 33.79 33.13Fair value of plan assets at the end of the period 6,770.87 4,881.45
Changes in the present value of the defined benefit obligation are as follows
Present value of obligation as at the beginning of the period 4,793.93 3,315.58Contributions by plan participants / employees 1,519.87 1,155.55Interest cost 419.47 281.82Past service cost - -Current service cost 636.40 465.09Actuarial (Gain) / Loss due to Interest guarantee (31.30) 28.31Benefits paid (807.67) (485.55)Settlements / Transfer In 33.79 33.13Present value of obligation as at the end of period 6,564.49 4,793.93
(` in Lakh)Particulars March 31, 2014 March 31, 2013 33 Expenditure During Construction Period:-
Opening Balance as per last accounts 41.51 38.65Incurred during the yearEmployee benefit and Other expenses:- Salary, Allowances & Bonus 582.93 98.35- Power & Fuel 8.47 26.57- Rent 153.87 368.02- Rates and Taxes 133.67 50.40- Miscellaneous Expenses 211.41 49.99
1,131.86 631.98Less: Allocated to Fixed Assets 991.75 590.47TOTAL 140.11 41.51
Note: The above expenses have been netted off in the respective line items in the Statement of Profit and Loss.
34 Expenditure on leasehold improvement incurred during the year has been considered as revenue expenditure for computing Income tax, relying upon the expert advice. However the treatment does not impact the statement of profit and loss. Accordingly deferred tax liability of ` 2,016.99 Lakh (Previous year ` 1,557.44 Lakh) has been provided in books since such item has been capitalised in the books.
Notesforming part of the Consolidated Financial Statements for the year ended March 31, 2014 (Contd.)

JUBILANT FOODWORKS LIMITED (GROUP)
Jubilant FoodWorks Limited 111
Writing on Tom
orrow’s Tim
eline Strategic Review Statutory Reports Financial Statem
ents
35 Particulars of Unhedged Foreign Currency Exposure as at Balance Sheet date
Particulars Year ended March 31,
2014 (Foreign
Currency) (In Lakh)
Currency Closing Exchange
Rate (`)
Year ended March 31,
2014 (` In Lakh)
Year ended March 31,
2013 (Foreign
Currency) (In Lakh)
Closing Exchange
Rate (`)
Year ended March 31,
2013 (` In Lakh)
Import Trade Payables
2.58 USD 60.10 154.76 1.29 54.39 70.16
36 Segment Reporting:
As the Company’s business activity primarily falls within a single business segment i.e. Food and Beverages, thus there are no additional disclosures to be provided under Accounting Standard 17 - “Segment Reporting”. The management considers that the various goods and services provided by the Company constitutes single business segment, since the risk and rewards from these services are not different from one another.
Information about secondary segment
The geographical segments considered for disclosure are as follows:
• SaleswithinIndiaincludesalestocustomerslocatedwithinIndia • SalesoutsideIndiaincludesalestocustomerslocatedoutsideIndia
Revenue, Trade Receivables, Fixed Assets and Capital expenditure during the year as per Geographical Markets.
(` in Lakh)Partuiculars Revenue Trade Receivables Fixed Assets Capital Expenditure
during the year2014 2013 2014 2013 2014 2013 2014 2013
India 172,349.87 140,757.14 903.93 808.79 54,708.44 39,115.54 23,348.01 18,499.72Outside India 1,281.06 673.57 - - 1,892.35 1,406.06 618.02 920.85Total 173,630.93 141,430.71 903.93 808.79 56,600.79 40,521.60 23,966.03 19,420.57
37 Previous period / year figures have been regrouped and /or re-arranged, wherever necessary.
Notesforming part of the Consolidated Financial Statements for the year ended March 31, 2014 (Contd.)
As per our report of even date
For S. R. Batliboi & Co. LLP For and on behalf of the Board of Directors of Jubilant FoodWorks LimitedFirm Registration Number: 301003EChartered Accountants
Sd/- Sd/- Sd/- Sd/-Per Rajiv Goyal Shyam S. Bhartia Hari S. Bhartia Ajay KaulPartner Chairman Co-Chairman CEO cum Whole Time DirectorMembership No. 94549 DIN No. 00010484 DIN No. 00010499 DIN No. 00062135
Sd/- Sd/- Mona Aggarwal Ravi S. Gupta Company Secretary President & Chief Financial Officer
Place : G urgaon Place : NoidaDate : May 19, 2014 Date : May 19, 2014

Notes

Corporate Office -
Domino’s Pizza India
B – 214, Phase II, District
Gautam Budh Nagar
Noida – 201 305
(Uttar Pradesh)
Phone : +91-120-409 0500
Fax : +91-120-409 0599
Corporate Office -
Dunkin’ Donuts India
B - 24, Hosiery Complex,
Phase II
Noida – 201 305
(Uttar Pradesh)
Phone : +91-120-459 9460
Fax: +91-120-459 9489
Regional Office
Addresses
NORTH REGIONAL OFFICE
Domino’s Pizza India
AF 1-3, AF 46, 47, Aditya City
Center Mall, Plot No. C/GH - 3,
Vaibhav Khand, Indirapuram,
Ghaziabad – 201 014
(Uttar Pradesh)
Phone : +91-120-439 6900
FORWARD-LOOKING STATEMENTS
Certain statements in this document may be forward-looking statements. Such forward-looking statements are subject to certain risks and uncertainties like government actions, local political or economic developments, technological risks, and many other factors that could cause our actual results to differ materially from those contemplated by the relevant forward-looking statements. The Company assumes no responsibility to publicly amend, modify or revise any such statements to reflect subsequent developments, information or events.
EAST REGIONAL OFFICE
Domino’s Pizza India
11A, East Topsia Road, 3rd & 4th
Floor, Parama Building, Beside
Mirania Boating Complex, Kolkata
- 700 046
(West Bengal)
Ph: +91-33-4418 2200
WEST REGIONAL OFFICE
Domino’s Pizza India
Office No. 101 & 102, Ground
Floor, Timmy Arcade, Makwana
Road, Marol Naka, Andheri (E),
Mumbai – 400 059 (Maharashtra)
Ph: +91-22-4261 1500
SOUTH REGIONAL OFFICE
Domino’s Pizza India
1573, 1st Floor, Sector 1, AGARA,
HSR Layout, Bangalore – 560 102
(Karnataka)
Ph: +91-80-2572 0347, 48, 49
CENTRAL REGIONAL OFFICE
Domino’s Pizza India
7th Floor, A Wing
Shriram Shyam Tower, Kingsway,
Nagpur - 440 010 (Maharashtra)
Ph: +91-712-662 6300
Board of Directors
Chairman & Director
Mr. Shyam S. Bhartia
Co-Chairman & Director
Mr. Hari S. Bhartia
CEO-cum-Whole Time Director
Mr. Ajay Kaul
Independent Directors
Mr. Arun Seth
Mr. Phiroz Vandrevala
Ms. Ramni Nirula
Mr. Vishal Marwaha
Key Managerial Personnel
President &
Chief Financial Officer
Mr. Ravi S. Gupta
Company Secretary-cum-
Compliance Officer
Ms. Mona Aggarwal
E-mail ID for Investor
Correspondence
Websites
www.jubilantfoodworks.com
www.dominos.co.in
www.dunkinindia.com
Registrar & Share
Transfer Agent
Link Intime India Pvt. Ltd.,
44, Community Centre,
2nd Floor, Naraina
Industrial Area, Phase – I,
Near PVR Naraina,
New Delhi – 110 028
Phone: +91-11-4141 0592,
93, 94
Fax: +91-11-4141 0591
Statutory Auditors
S. R. Batliboi & Co. LLP
Golf View Corporate Tower B,
Sector 42, Sector Road
Gurgaon – 122 002 (Haryana)
Phone : +91-124-464 4000
Fax : +91-124-464 4050
Registered Office
B – 214, Phase – II, District
Gautam Budh Nagar,
Noida – 201 305,
(Uttar Pradesh)
Phone: +91-120-4090 500
Fax: +91-120-4090 599
Corporate Identification
Number
L74899UP1995PLC043677
Stock Code
National Stock Exchange :
JUBLFOOD
Bombay Stock Exchange :
533155
Bankers
Axis Bank Limited
HDFC Bank Limited
ICICI Bank Limited
Yes Bank Limited
IDBI Bank Limited
CorporateInformation

Writing ontimelinetomorrow s
Annual Report 2013-14
www.jubilantfoodworks.com

Buy a Large Pizza and get a medium pizza
for free or buy a medium pizza and get a regular pizza free
The Free Pizza Should be of the same or lesser Category.Offer not valid on simply Veg/Non veg Pizzas except
Chicken Salami Special Pizza and Pizza Mania. Offer Valid on the same order.
Conditions Apply.
Get 20% off on pizzas and breads in your order with a minimum value
of 350/-(inc. of taxes)
Offer not valid on simply Veg/Non veg Pizzas except Chicken Salami Special Pizza.
Offer Valid on the same order.Conditions Apply.
Offer Valid Till December 30, 2014 Not Valid on December 25, 2014
Coupon Code: AL20A
Get 100/- offBuy a medium /large pizza and get 100/- off on 2nd
medium/large pizza.
Offer not valid on simply Veg/Non veg Pizzas except Chicken Salami Special Pizza.
Offer Valid on the same order.Conditions Apply.
Coupon Code: DH038A
Coke FreeBuy any pizza with garlic breadsticks+Dip and get a
Coke Free.Offer not valid on simply Veg/Non veg Pizzas
except Chicken Salami Special Pizza and Pizza Mania.
Offer Valid on the same order.Conditions Apply.
Coke FreeCoke FreeCoke FreeCoke FreeCoke FreeBuy any pizza with garlic Buy any pizza with garlic Buy any pizza with garlic Buy any pizza with garlic Buy any pizza with garlic Buy any pizza with garlic Buy any pizza with garlic Buy any pizza with garlic breadsticks+Dip and get a breadsticks+Dip and get a
Offer not valid on simply Veg/Non veg Pizzas Offer not valid on simply Veg/Non veg Pizzas except Chicken Salami Special Pizza and except Chicken Salami Special Pizza and except Chicken Salami Special Pizza and except Chicken Salami Special Pizza and except Chicken Salami Special Pizza and except Chicken Salami Special Pizza and except Chicken Salami Special Pizza and except Chicken Salami Special Pizza and except Chicken Salami Special Pizza and
Offer Valid on the same order.
Coupon Code: DH100
Coupon Code: DH008
Buy a Large Pizza and
for free or buy a medium pizza for free or buy a medium pizza for free or buy a medium pizza and get a regular pizza freeand get a regular pizza free
The Free Pizza Should be of the same or lesser Category.
Coupon Code: DH100Offer Valid Till December 30, 2014 Not Valid on December 25, 2014
Offer Valid Till December 30, 2014 Not Valid on December 25, 2014
Offer Valid Till December 30, 2014 Not Valid on December 25, 2014