Embed Size (px)
Citation preview

Inflation Credibility Surveys in Inflation-Targeting Countries: Any Lessons?
Jannie Rossouw
South African Reserve Bank and
Department of Economics, University of Pretoria [email protected]
Vishnu Padayachee
School of Development Studies, University of KwaZulu-Natal [email protected]
Fanie Joubert
Department of Economics, University of South Africa [email protected]
Working Paper No 55
November 2009
ISBN 978 1 86840 691-3
The views and opinions expressed in this paper do not necessarily reflect the views and opinions of the SA Reserve Bank or any of the Universities.
INFLATION CREDIBILIY SURVEYS IN INFLATION-TARGETING COUNTRIES 1

ABSTRACT The main aim of this paper is to compare inflation credibility surveys in three countries targeting inflation. This is done by comparing the findings of such surveys in New Zealand, South Africa and Sweden. Although 261 countries targeted inflation, inflation credibility surveys are undertaken only in these three countries. The comparison shows that an acceleration in the rate of inflation between 2006 and 2008 eroded domestic and international inflation credibility. In due course the influence of a declining rate of inflation (disinflation) on inflation credibility will be tested. The final conclusion is that an international alignment of inflation credibility surveys is a requirement for a conclusive international comparison of the results of such surveys. JEL Classifications: E31, E 52, E58 Keywords: Inflation; inflation credibility; inflation credibility barometer; inflation targeting; inflation-targeting countries; monetary policy; sampling; surveys
2 INFLATION CREDIBILITY SURVEYS IN INFLATION-TARGETING COUNTRIES
1 INTRODUCTION The main aim of this paper is to compare inflation credibility surveys in three countries targeting inflation. This is done by comparing the findings of such surveys in New Zealand, South Africa and Sweden. In the cluster of 26 inflation-targeters (see Appendix I), only these three countries2 undertake inflation credibility surveys among individual respondents. This limits the scope of comparison of inflation credibility surveys in inflation-targeting countries. The comparison of these surveys will be repeated in future to ascertain whether inflation credibility differs during periods of subdued inflation, accelerating inflation and decelerating inflation (disinflation). For comparative purposes a rate of inflation within the inflation target range of the respective country will be viewed as subdued inflation. These ranges are 1 to 3 percent in the case of New Zealand, 3 to 6 percent in South Africa and 2 percent (+/- 1 percent, for an effective target of 1 to 3 percent) in Sweden. This interpretation of subdued inflation can be a matter for debate. A case in point is the South African survey undertaken in the 4th quarter of 2006. The inflation rate had a lower turning point of 3,3 percent in April 2006, and accelerated to 5,4 percent in August 2006 (Rossouw and Padayachee, 2009: 328). The interpretation implies subdued inflation, but it can also be viewed as accelerating inflation. This paper is structured as follows: The next section reviews available literature on inflation credibility. Section 3 highlights surveys of South African inflation credibility. Section 4 compares the methodologies and results of the inflation credibility surveys in South Africa, with similar surveys in New Zealand and Sweden. The conclusions follow in Section 5 while Section 6 provides recommendations for future inflation credibility surveys.
2 LITERATURE REVIEW OF INFLATION CREDIBILITY From the onset a few important distinctions need to be made between the credibility of monetary institutions in general, the measurements of inflation expectations and inflation credibility. The credibility of statements and policy changes made by monetary institutions from the view of economic agents are of utmost importance, for effective monetary policy transmission through the economy. The expected effectiveness can be analysed with the help of game theory (and particular non-zero-sum games) based on the theory developed by John Nash (Parkin, 1999:296, Shubik, 1955:310). This provides some insight into the
INFLATION CREDIBILITY SURVEYS IN INFLATION-TARGETING COUNTRIES 3
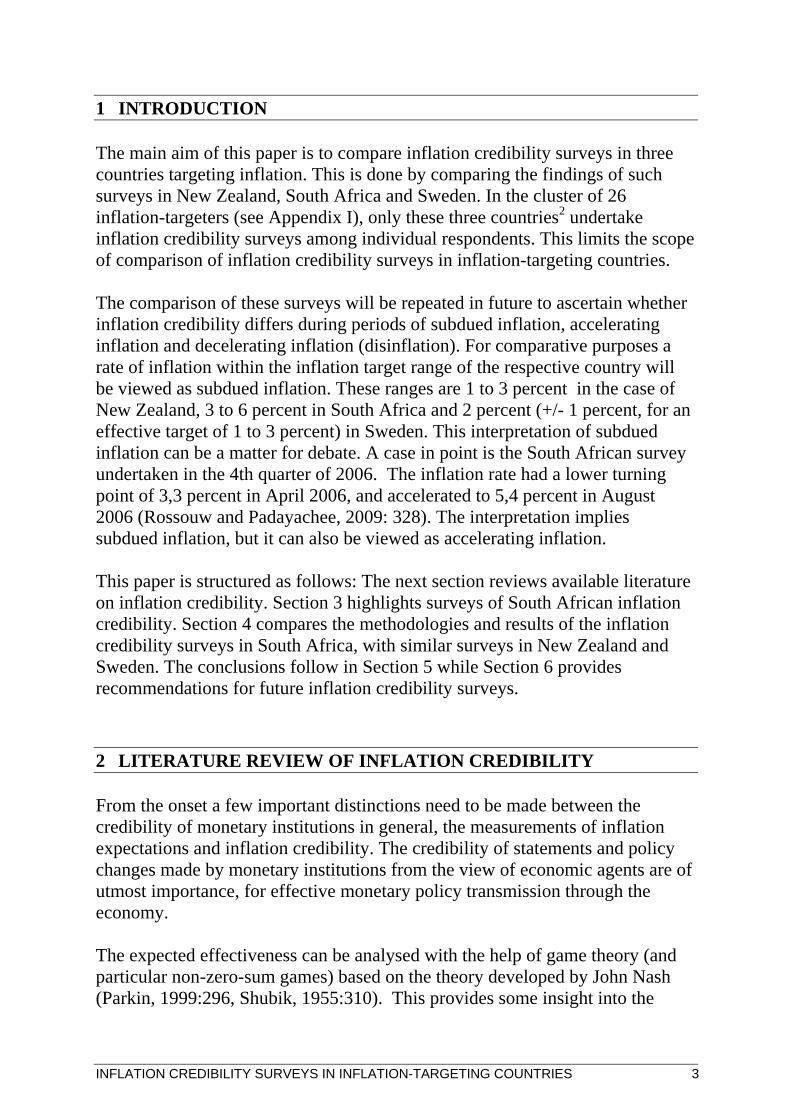
situation when the central bank is left to act upon its own discretion, rather than entrusted with a monetary policy goal. The resultant game between the central bank and private economic agents shows that the two players would permanently try to outsmart each other with respect to what future inflation levels will be. To estimate actual inflation levels under discretion, it is necessary to consider simultaneously the Lucas supply curve and the preference function of the central bank. This implies that the central bank aims at maximising its utility, , subject to the Lucas supply curve
2ttt byz ∏−=
( )*1−∏−∏+= ttftt ayy , where:
ty is output, is the full-employment level of output, fty t∏ is the inflation rate
and is the expectations at t-1 of what the inflation rate is going to be at time t.
*1−∏ t
By substituting into : ty tz
( ) 2*1 tttftt bayz ∏−∏−∏+= −
From here the first order conditions (FOC):
02 =∏−=∏ t
t
t baZ
σσ
Thus ba
t 2=∏
, with a being marginal benefit (MB) and marginal cost (MC). b Kydland and Prescott (1977) observe that if expected inflation is low, so that the marginal cost of additional inflation is low, policymakers will pursue expansionary policies to push output temporarily above its normal level. However, if the public has knowledge that policymakers have this incentive, low inflation will in fact not be expected (De Wet, 2003:796). The end result is that policymakers’ ability to pursue discretionary policy results in inflation without any increase in output (Romer, 2001:479). Depending on the actions of the central bank and the expectations of private economic agents, the possible outcomes to game theory highlighted below in Table 1 can evolve.
4 INFLATION CREDIBILITY SURVEYS IN INFLATION-TARGETING COUNTRIES
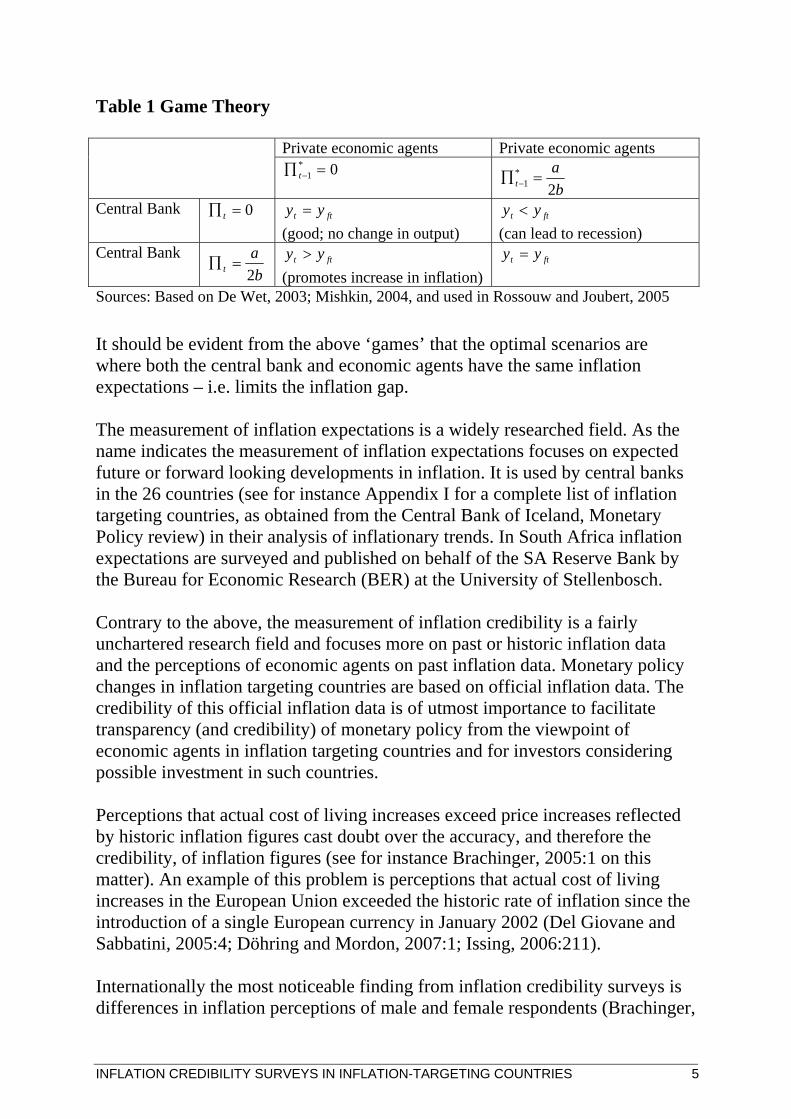
Table 1 Game Theory Private economic agents Private economic agents 0*
1 =∏ −t b
at 2*
1 =∏ −
Central Bank 0=∏ t ftt yy = (good; no change in output)
ftt yy < (can lead to recession)
Central Bank b
at 2=∏
ftt yy >
(promotes increase in inflation) ftt yy =
Sources: Based on De Wet, 2003; Mishkin, 2004, and used in Rossouw and Joubert, 2005
It should be evident from the above ‘games’ that the optimal scenarios are where both the central bank and economic agents have the same inflation expectations – i.e. limits the inflation gap. The measurement of inflation expectations is a widely researched field. As the name indicates the measurement of inflation expectations focuses on expected future or forward looking developments in inflation. It is used by central banks in the 26 countries (see for instance Appendix I for a complete list of inflation targeting countries, as obtained from the Central Bank of Iceland, Monetary Policy review) in their analysis of inflationary trends. In South Africa inflation expectations are surveyed and published on behalf of the SA Reserve Bank by the Bureau for Economic Research (BER) at the University of Stellenbosch. Contrary to the above, the measurement of inflation credibility is a fairly unchartered research field and focuses more on past or historic inflation data and the perceptions of economic agents on past inflation data. Monetary policy changes in inflation targeting countries are based on official inflation data. The credibility of this official inflation data is of utmost importance to facilitate transparency (and credibility) of monetary policy from the viewpoint of economic agents in inflation targeting countries and for investors considering possible investment in such countries. Perceptions that actual cost of living increases exceed price increases reflected by historic inflation figures cast doubt over the accuracy, and therefore the credibility, of inflation figures (see for instance Brachinger, 2005:1 on this matter). An example of this problem is perceptions that actual cost of living increases in the European Union exceeded the historic rate of inflation since the introduction of a single European currency in January 2002 (Del Giovane and Sabbatini, 2005:4; Döhring and Mordon, 2007:1; Issing, 2006:211). Internationally the most noticeable finding from inflation credibility surveys is differences in inflation perceptions of male and female respondents (Brachinger,
INFLATION CREDIBILITY SURVEYS IN INFLATION-TARGETING COUNTRIES 5
2005:1; Bryan and Ventaku, 2001:1; Del Giovane and Sabbatini, 2007:1; Issing, 2006:214; Jonung, 1981:968; Palmqvist and Stromberg, 2004:28). Female respondents report higher inflation perceptions than male respondents. There are differences of opinion on factors contributing to these divergent inflation perceptions. Bryan and Ventaku state that ‘ … it does not appear that women have a higher perception of inflation than men because of the things they buy, the frequency of their shopping, or their knowledge of officially reported statistics’ (2001:4). To the contrary, Brachinger (2005:1), Del Giovane and Sabbatini (2007:1), Issing (2006:214) and Jonung (1981:968) attribute these differences to variation in the spending and consumption patterns of males and females. Surveys of inflation credibility are undertaken in New Zealand and Sweden and by the European Commission (EC). Such surveys were undertaken twice before in South Africa (2006 and 2008), although some data of historic inflation perceptions has been recorded since 1995. The Swedish Riksbank has surveyed ‘… households’ perspectives on current and future price developments’ (Palmqvist and Stromberg, 2004:23) since 1978. Respondents are requested to indicate whether they perceive prices to be the same, higher or lower than a year before, and to provide a numerical estimate of their perceived inflation. The Swedish Riksbank reports inflation credibility survey results (albeit not survey results of individual respondents) in its Monetary Policy Report (Swedish Riksbank, 2008) The EC samples monthly 21 000 respondents on their perceptions of the accuracy of inflation data (European Central Bank, 2005:30) over the preceding twelve months (Bechtold and Linz, 2005:5). Respondents select an answer from one of six options on price movements, i.e. prices have risen a lot (PP); stayed about the same (M); risen moderately (P); fallen (MM); risen slightly (E); or don’t know (N) (Bechtold and Linz, 2005:8). Based on a percentage distribution of answers, a qualitative indicator is calculated which represents perceived inflation (Bechtold and Linz, 2005:8). In the calculation of the indicator, the responses of respondents reporting perceptions of constant or falling prices are deducted from assessments of rising prices. The measured score is calculated as (PP + 0,5 ¥ P) - (0,5 ¥ M + MM) and reported as a score between +100 and -100, with +100 indicating that all respondents believe that prices have risen a lot (Bechtold and Linz, 2005:8). As the European Central Bank is not reported as an inflation-targeting jurisdiction, the inflation surveys of the European Central Bank are not considered in this paper. The Reserve Bank of New Zealand’s quarterly J5 Marketscope Survey – Expectations of inflation questionnaire on inflation expectations, distributed to a
6 INFLATION CREDIBILITY SURVEYS IN INFLATION-TARGETING COUNTRIES
sample of 1,000 respondents, includes the question ‘Based on your own opinions and what you’ve seen and heard, what do you think the inflation figure is now?’ (Reserve Bank of New Zealand, 2005). The Reserve Bank of New Zealand publishes the mean and median of perceived inflation reported by the respondents (Reserve Bank of New Zealand, 2005). This highlights deviations between perceived inflation of respondents and the actual rate of inflation. Inflation credibility has been surveyed twice before in South Africa (see Rossouw and Padayachee, 2009 for detailed reporting of some of these results). This research was undertaken independently from the central bank. In addition, Ipsos-Markinor, a South African market research company, launched its bi-annual Government Performance Barometer survey in its current format in May 1995. The survey samples performance and delivery of the government in 23 critical areas, one of which pertains to inflation. Government is described as the President; the Deputy President; the National Government; the nine provincial premiers; the nine provincial governments and local authorities. To date no attempts have been made to compare the results of inflation credibility surveys in inflation-targeting countries. The Bank of Iceland (2003) and Fracasso et al. (2003) analysed certain aspects of the monetary policy reports (i.e. Inflation Reports, Monetary Bulletins or Monetary Policy Reviews) of central banks in 20 countries targeting inflation by 2003, but did not consider surveys of inflation credibility. Blinder et al. (2008) assessed the anchoring of the public’s long-run inflation expectations in inflation targets, but did not consider inflation credibility. Likewise, the Bank for International Settlements (2008), Blinder and Wyplosz (2005), Ehrmann and Fratzscher (2005) and Leeper (2003) considered various aspects of inflation targeting and its reporting by selected central banks in the cluster of inflation targeting countries, but made no mention of inflation credibility surveys. As a result no generally accepted measure to compare the results of surveys of inflation credibility over time or between countries has been developed.
INFLATION CREDIBILITY SURVEYS IN INFLATION-TARGETING COUNTRIES 7
3 COMPARISON OF SOUTH AFRICAN INFLATION CREDIBILITY SURVEYS This section considers the findings of two domestic inflation credibility surveys undertaken in 2006 and 2008, respectively, and reports related research commencing in 1995. The survey results are reported by means of inflation credibility barometers, measuring inflation credibility out of 100. The main aim of the comparison is to ascertain whether the most recent trend of inflation at the time of the survey had any pronounced influence on the credibility of inflation figures. It also provides a brief analysis of the differences in responses received by various income groups. 3.1 Inflation credibility barometer Ipsos-Markinor (known as Markinor in 2006) was used to survey the respondents (Markinor, [S.a.], Markinor, 2006). A challenge that had to be overcome in conducting the field work for this representative study was to obtain responses on inflation credibility from a representative sample of the South African population. The decision to use Markinor was informed by two factors. First, Markinor conducts biannual sampling, known as its M-bus, which covers a broad number of questions on consumer behaviour and perceptions. This survey comprises sampling by means of personal interviews (thereby avoiding the possible sampling bias of telephone interviews) and does not only provide a broad sample of responses from respondents, but a minimum of 20 percent of each interviewer’s work is back-checked on each project (Markinor, [S.a.]b, Markinor, 2006). Secondly, the sample size is 3 500 and it can be split in terms of gender, income, employment status, etc. Markinor applies a statistically-based sampling procedure, in which each qualifying person in South Africa (i.e. 16 years and older) has a measurable chance for selection, which ensures a nationally representative sample. (Rossouw and Padayachee, 2009) The questions used in the surveys are highlighted in Appendix A, with the main difference that the first survey was undertaken during a period of subdued inflation and the second during a period of accelerating inflation. The actual results are reported in Appendices B to F. In respect of the rate of inflation at the time of the first survey undertaken in 2006: 52,9 percent of respondents did not know whether it was a true reflection of
average price increases; 18,5 percent of the respondents accepted that it was a true reflection of
average price increases; and
8 INFLATION CREDIBILITY SURVEYS IN INFLATION-TARGETING COUNTRIES

28,6 percent of respondents believed that it was not a true reflection of average price increases.
The inflation credibility barometer reading for all respondents was 18,5 in 2006, but 22,4 among male and 14,6 among female respondents. Similar difference in perceptions was revealed by the above review of the literature. Figure 1 Summary survey results of biennial inflation credibility surveys in South Africa
Inflation Credibility Barometer
0102030405060
2006 2008
%
YesNoDon'know
Sources: Markinor, 2006; Ipsos-Markinor 2008; Rossouw, 2008 The second biennial survey in 2008 shows that: 59,0 percent of respondents did not know whether the prevailing rate of
inflation was a true reflection of average price increases; 15,2 percent of the respondents indicated that the inflation rate was a true
reflection of average price increases; and 25,8 percent of respondents believed that the inflation rate was not a true
reflection of average price increases. The inflation credibility barometer reading deteriorated to 15,2 for all respondents, to 16,8 for male respondents and to 13,7 for female respondents. The main findings of the two surveys are summarised in Figure 1. 3.2 Comparison based only on ‘Yes’ and ‘No’ answers received To try and eliminate the lack of knowledge by households of actual inflation developments compared to their specific buying patterns (i.e. possibility of sampling errors) only ‘Yes’ and ‘No’ answers were analysed (i.e. exclude ‘don’t know’ answers).
INFLATION CREDIBILITY SURVEYS IN INFLATION-TARGETING COUNTRIES 9
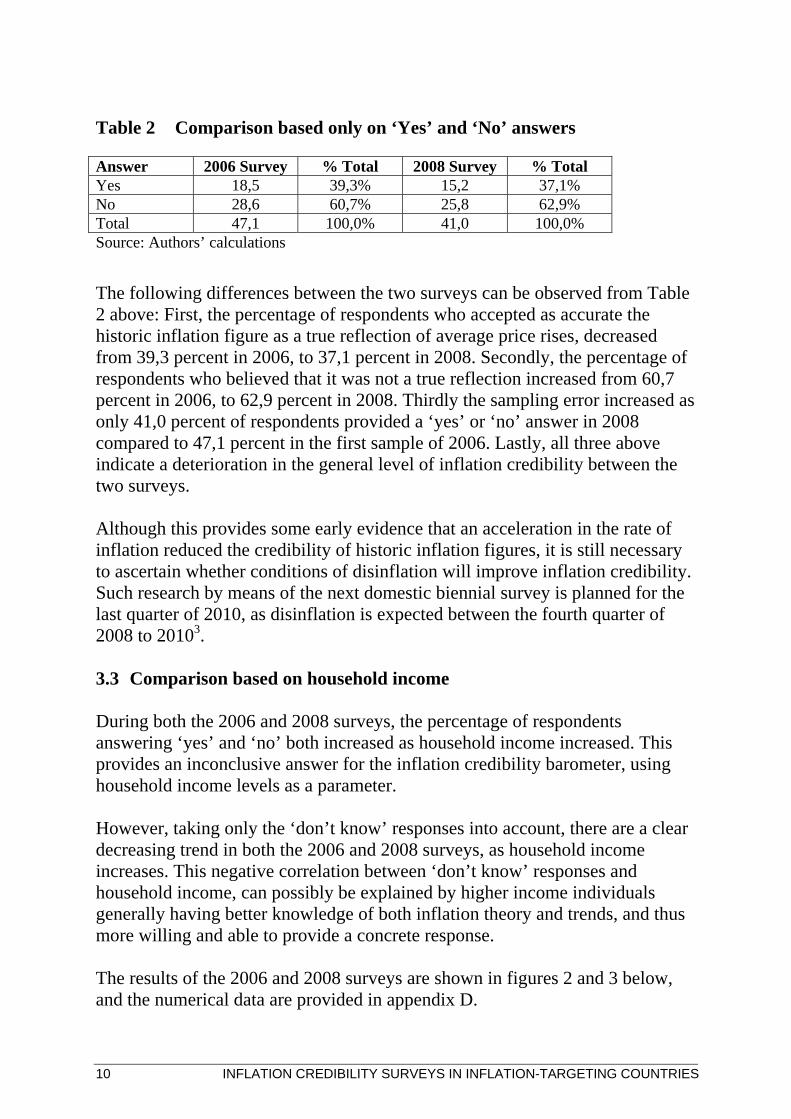
Table 2 Comparison based only on ‘Yes’ and ‘No’ answers Answer 2006 Survey % Total 2008 Survey % Total Yes 18,5 39,3% 15,2 37,1% No 28,6 60,7% 25,8 62,9% Total 47,1 100,0% 41,0 100,0% Source: Authors’ calculations
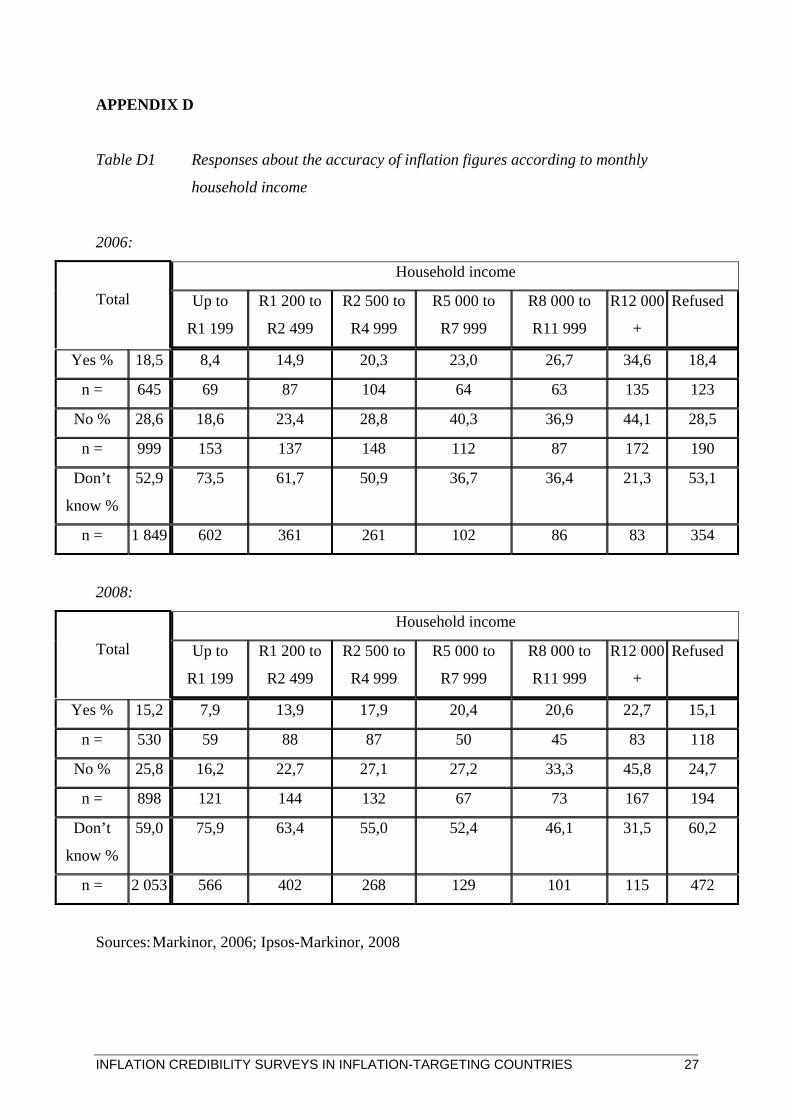
The following differences between the two surveys can be observed from Table 2 above: First, the percentage of respondents who accepted as accurate the historic inflation figure as a true reflection of average price rises, decreased from 39,3 percent in 2006, to 37,1 percent in 2008. Secondly, the percentage of respondents who believed that it was not a true reflection increased from 60,7 percent in 2006, to 62,9 percent in 2008. Thirdly the sampling error increased as only 41,0 percent of respondents provided a ‘yes’ or ‘no’ answer in 2008 compared to 47,1 percent in the first sample of 2006. Lastly, all three above indicate a deterioration in the general level of inflation credibility between the two surveys. Although this provides some early evidence that an acceleration in the rate of inflation reduced the credibility of historic inflation figures, it is still necessary to ascertain whether conditions of disinflation will improve inflation credibility. Such research by means of the next domestic biennial survey is planned for the last quarter of 2010, as disinflation is expected between the fourth quarter of 2008 to 20103. 3.3 Comparison based on household income During both the 2006 and 2008 surveys, the percentage of respondents answering ‘yes’ and ‘no’ both increased as household income increased. This provides an inconclusive answer for the inflation credibility barometer, using household income levels as a parameter. However, taking only the ‘don’t know’ responses into account, there are a clear decreasing trend in both the 2006 and 2008 surveys, as household income increases. This negative correlation between ‘don’t know’ responses and household income, can possibly be explained by higher income individuals generally having better knowledge of both inflation theory and trends, and thus more willing and able to provide a concrete response. The results of the 2006 and 2008 surveys are shown in figures 2 and 3 below, and the numerical data are provided in appendix D.
10 INFLATION CREDIBILITY SURVEYS IN INFLATION-TARGETING COUNTRIES

Figure 2 Barometer for inflation credibility according to monthly
household income, for 2006 2006 Barometer
0
20
40
60
80
Up to R1 199 R1 200 to R2499
R2 500 to R4999
R5 000 to R7999
R8 000 toR11 999
R12 000+
Monthly household income
% o
f inc
ome
brac
ket
Yes % No % Don't know %
Sources: Markinor, 2006; Ipsos-Markinor 2008; Rossouw, 2008
Barometer for inflation credibility according to monthly household income, for 2008
2008 Barometer
0
20
40
60
80
Up to R1 199 R1 200 to R2499
R2 500 to R4999
R5 000 to R7999
R8 000 toR11 999
R12 000+
Monthly household income
% o
f inc
ome
brac
ket
Yes % No % Don't know %
Sources: Markinor, 2006; Ipsos-Markinor 2008; Rossouw, 2008 3.4 Other South African research on inflation credibility Other than the inflation credibility surveys described above in sections 3.1 and 3.2, Ipsos-Markinor also conducts a Government Performance Barometer
INFLATION CREDIBILITY SURVEYS IN INFLATION-TARGETING COUNTRIES 11

survey. This survey launched in its current format in May 1995. The survey samples performance and delivery of the government in 23 critical areas, one of which pertains to inflation. Government is described as the President; the Deputy President; the National Government; the nine provincial premiers; the nine provincial governments and local authorities. Figure 2 summarises perceptions of respondents in the Ipsos-Markinor survey on how well the South African Government controls inflation since 1995. An overall declining trend in the domestic CPI since 1995 improved perceptions about the successful control of inflation. However, with an acceleration in inflation since 2006, perceptions on Government’s success in controlling inflation declined rapidly. Figure 4 Perceptions on how well government is controlling inflation
compared with actual rate of South African inflation, 1995 to 20084
Sources: Markinor, [S.a.]a; SA Reserve Bank, [S.a.]; Statistics SA, [S.a.] This analysis confirms that perceptions of inflation control improved during periods of disinflation (decelerating inflation) and deteriorated during periods of accelerating inflation. It is therefore necessary to consider a similar comparison of inflation credibility surveys and inflation trends in countries targeting inflation.
12 INFLATION CREDIBILITY SURVEYS IN INFLATION-TARGETING COUNTRIES

4 A COMPARISON OF INFLATION CREDIBILITY SURVEY METHODOLOGIES AND RESULTS IN NEW ZEALAND, SOUTH AFRICA AND SWEDEN
Other than in South Africa, inflation credibility is surveyed among individual respondents in only two of the 26 countries targeting inflation, i.e. New Zealand and Sweden. This section highlights their survey methodologies and results for the last quarters of 2006 and 2008, respectively, thereby aligning the results with the biennial domestic surveys. The survey results in New Zealand and Sweden are not presented in a format that allows comparison by means of inflation credibility barometers. However, the authors believe there is much to learn in comparing the methodologies used in surveying inflation perceptions in these countries and by taking into account the various qualitative results obtained despite the fact that they are not quantitatively comparable. 4.1 Comparison of survey methodologies The aim of this section is to highlight similarities and/or differences between inflation credibility measurements in these three countries. Due to the extensive analysis on the South African results, in section 3 above, much of the focus in this section will be on methodologies used in New Zealand and Sweden, and in the comparison of these to the survey conducted in South Africa. Table 3 Comparison of survey methodologies Variables South Africa New Zealand Sweden
Periodicity Biennial Quarterly Monthly Coverage characteristics
Face-to-face interviews
Telephone omnibus survey
CATI (Computer Assisted Telephone Interviews)
Sample size 3 500 households (16 years and older)
750 households (18 years and older)
1 500 households (ages 16 – 84)
Time period focused on
Current perception of inflation (assume 12 months)
Current perception of inflation (assume 12 months)
Previous 12 months (stated explicitly)
Answer required Qualitative (yes, no, don’t know)
Quantitative (numerical estimate)
Qualitative (higher, lower, etc.) and quantitative (numerical estimate)
Source: Authors’ calculations
INFLATION CREDIBILITY SURVEYS IN INFLATION-TARGETING COUNTRIES 13

4.1.1 New Zealand In the case of New Zealand the Reserve Bank contracts a company to ask respondents three question relating to inflation credibility. For the period 1995 to September 2008, the company responsible for this survey was ACNielsen, which conducted a Marketscope telephone survey of 1 000 people aged 15 and older. Since December 2008, the data is sourced from UMR Research’s nationwide omnibus telephone survey of 750 people aged 18 years and older (this change is noted as a series break during the December 2008 quarter, due to a change in the sample). Interviews are carried out with one person per household and telephone numbers are randomly generated within known Telecom ranges. Individual respondent answers are weighted so as to replicate the demographic characteristics of a fully national survey. For the purpose of this paper, the focus is on the first of the three questions asked of respondents, which measures their perception of current inflation (Reserve Bank of New Zealand, [S.a.]). The Reserve Bank of New Zealand publishes the mean and median expectations of current inflation perspectives, as is highlighted in Appendix G. 4.1.2 Sweden The measurement of inflation perceptions in Sweden forms part of the Consumer Tendency Survey (GfK Sverige AB). The survey has been conducted since October 1973 by Statistics Sweden (SCB) and initially consisted of 10 000 households. It started as a quarterly survey, but has been conducted on a monthly basis since 1993. Starting in January 2002, the survey has been carried out by GfK Sverige AB, on behalf of the National Institute of Economic Research (NIER). It is performed on a monthly basis and includes individuals aged between 16 and 84. The total sample consists of 1500 interviews. The purpose of the survey is to ascertain household opinions on personal finances and the Swedish economy, and is used as a basis for economic forecasts. The Consumer Tendency Survey is conducted according to the international ESOMAR (European Society for Opinion and Market Research) standards for marketing surveys and is carried out in conformity with provisions of the Swedish Information Act (PUL), including those related to personal information. The interviews are conducted by telephone according to the CATI (Computer Assisted Telephone Interview) method, CATI is a computer program for telephone interviews. The program allows for logical checks of the interview
14 INFLATION CREDIBILITY SURVEYS IN INFLATION-TARGETING COUNTRIES

responses. Also included is SMS (Sample Management System), which manages all automatic call backs. The sample used is based on a priori stratification of municipalities according to a set of variables considered particularly relevant for marketing surveys. Using factor analysis, these variables are described in terms of underlying factors such as income, education, household size, political views etc. Swedish municipalities are first grouped according to urban or rural stance and then segmented by the above mentioned factors to produce homogenous groupings. In total seven geographic areas were defined. For each of these, municipalities with similar factor structures were clustered together. This resulted in the formation of 20 clusters. The aim of this is to create a ‘Sweden in miniature’. Thereafter there is a random selection of households within each cluster to make up the sampling base. The RDD (Random Digit Dial) technique is used. After random selection of households, an individual respondent is chosen by the birthday method (the person selected is the next individual, 16 years or older, in the household to celebrate a birthday). In total the Consumer Tendency Survey consists of 16 sections, but this paper focuses on section five, which consists of six (variable) sub-sections. Respondents are requested to indicate whether they perceive prices to be the same, higher or lower than 12 months before. Depending on the answer provided, respondents are then requested (as follow up question) to provide a numerical estimate (in percentage terms) of their perceived rate of inflation (GfK Sverige AB). Please see appendix H for additional information on the questionnaire used in Sweden. 4.2 Comparison of survey results Form the onset it becomes clear that a quantitative (numerical) comparison between inflation credibility surveys in the three countries cannot be drawn, due to the lack of comparative data on inflation perceptions in South Africa. The survey results are summarised in Table 3. The table highlights the lack of data for numerous measurements on inflation credibility between the countries. Taking only the results for New Zealand and Sweden into account, it is evident that the acceleration in actual inflation between 2006 and 2008 translated to a deterioration in inflation perceptions of respondents. This can be seen from the increase in the median inflation perceptions in New Zealand and Sweden, from 3,4 percent and 1,4 percent respectively in the 2006 surveys, to 4,0 percent and 5,5 percent respective as at the time of the 2008 survey. Also interesting to notice is the difference in magnitude of these deviations, which rose 0,6 percentage points (i.e. 3,4 percent to 4,0 percent) for New Zealand compared to
INFLATION CREDIBILITY SURVEYS IN INFLATION-TARGETING COUNTRIES 15

4,1 percentage points (i.e. 1,4 percent to 5,5 percent) for Sweden, over the same period. Using basic elasticity theory the differences between inflation perceptions in New Zealand and Sweden (for which we have actual and perceived data) can be analysed further. The elasticity of one variable y with respect to a second variable x is defined as the percentage change in for a percentage change in yx (Baldani et al, 2001). Because elasticities are measured in terms of percentage changes, they are invariant with respect to actual units of measurement. Let specify the relationship between two economic variables. Then the elasticity of y with respect to x is defined as:
( )xfy =
,
//
yx
dxdy
xdxydyelasticity ==
………………………………………………..equation 1 Where the change in the variable divided by the initial level of the variable is, by definition, the percentage change in the variables. Since the change in a variable and the level of a variable are measured in the same units, the actual units of measurement drop out of the formula (Baldani et al, 2001). To compared the responsiveness (or sensitivity) of inflation perceptions (symbol p ), given a change in the actual inflation (symbol π ), equation 1 can be used to calculate:
pddp
dpdpelasticity π
πππ==
//
For the period between the fourth quarter of 2006 and 2008, actual inflation in New Zealand rose by 114,3 percent, while inflation perceptions rose by only 17,6 percent. This provides an elasticity of 0,154. For the period between the fourth quarter of 2006 and 2008, actual inflation in Sweden rose by 193,3 percent, while inflation perceptions rose by 292,9 percent. This provides an elasticity of 1,515. This provides some evidence that the acceleration in actual inflation between 2006 and 2008 had a much larger impact on inflation perceptions in Sweden than in New Zealand. However, this is a very limited analysis using only two time periods, making it statistically insignificant to use this as a general rule for the two countries. Similar elasticity analysis should be conducted between various time periods and during periods of accelerating and deceleration
16 INFLATION CREDIBILITY SURVEYS IN INFLATION-TARGETING COUNTRIES

inflation to provide better estimates of overall sensitivity of inflation perceptions to changes in actual inflation. It does however provide interesting short term trends which can be analysed further (although this is not the aim of this paper). On a qualitative basis, some comparisons between the surveys can be made. First, there was an acceleration in actual inflation between the two surveys in all three relevant countries. This in turn led to a deterioration in inflation credibility in all three countries over the period between the two surveys. Comparison of survey results Period South Africa New Zealand Sweden 4th quarter 2006 - Actual inflation - Median perception - True reflection Yes No Don’t know
5,4* n/a 18,5% 28,6% 52,9%
0,7 3,4 n/a n/a n/a
1,5 1,4 n/a n/a n/a
4th quarter 2008 - Actual inflation - Median perception - True reflection Yes No Don’t know
13,7* n/a 15,2% 25,8% 59,0%
1,5 4,0 n/a n/a n/a
4,4 5,5 n/a n/a n/a
Elasticity of inflation perceptions to actual inflation
n/a
0.154**
1.515**
Trend in actual inflation (between two periods)
Acceleration Acceleration Acceleration
Inflation perception (between two periods)
Deterioration in inflation credibility barometer
Deterioration (increase in median perception)
Deterioration (increase in median perception)
Source: Authors’ calculations *August of relevant year. Used for proxy of 4th quarter, for purpose of comparison **Note that this is a single elasticity calculation, between the time points of 2006Q4 to 2008Q4 only.
INFLATION CREDIBILITY SURVEYS IN INFLATION-TARGETING COUNTRIES 17
5 CONCLUSIONS Inflation credibility cannot be compared in any detail, between New Zealand, South African and Sweden on the basis of current surveys and published data, or assessed in terms of an inflation credibility barometer. Conclusions that can be drawn is that an acceleration of the rate of inflation in all three countries between 2006 and 2008 resulted in deteriorating inflation credibility. Deteriorating credibility might result in consumers concluding that higher interest rates bring only the pain of higher monetary policy without tangible benefits in the form of lower inflation. However, a complete picture will emerge only once a similar survey has been conducted after a period of disinflation. Another conclusion is that by using elasticity analysis there are also some evidence that the accelerating trend in actual inflation had a more severe impact on inflation perceptions in Sweden than in New Zealand. As noted above, similar elasticity analysis should be conducted between various time periods and during periods of accelerating and deceleration inflation to provide better estimates of overall sensitivity of inflation perceptions to changes in actual inflation. Although not the main purpose of this paper, the results for the South African survey also indicate that the majority of households were unable to differentiate between trends in their specific inflation baskets and the level of price rises in general. This becomes evident in the large percentage of respondents who provided a ‘don’t know’ answer, when asked if the inflation figure provided, was a true reflection of average price rises. An alignment of surveys and reporting of inflation credibility will be required before perceptions of price increases can be compared between the limited number of inflation-targeting countries assessing inflation credibility. From the comparison of methodologies used in measuring inflation credibility, it seems evident that South African researchers (and institutions) can learn from the experience of New Zealand and Sweden. South African surveys can be expanded to cover techniques used in New Zealand and Sweden. The authors were especially impressed by the monthly Consumer Tendency Survey conducted in Sweden, providing a huge variety of important and relevant data on a consistent basis.
18 INFLATION CREDIBILITY SURVEYS IN INFLATION-TARGETING COUNTRIES

6 RECOMMENDATIONS Due to the general lack of data on inflation credibility in South Africa it is recommended that South Africa use surveys similar to the Consumer Tendency Survey in Sweden as a benchmark for possible future surveys. The M-bus study conducted by Ipsos-Markinor is a step in the right direction, however, the fact that the survey is only conducted biennially is problematic as up to date data for trend analysis is not readily available. The aim of this paper is not to compare the details of the entire Consumer Tendency Study (Sweden) versus the M-bus study (South Africa), but only the sections relevant to inflation credibility measurements. From this point, it is thus only relevant to make recommendations for the inclusion of questions measuring inflation credibility in such a survey, as well as to shorten the interval between surveys (a monthly survey being the ultimate goal). A second recommendation is that future South African surveys should aim to measure inflation credibility on a qualitative as well as quantitative basis. This provides much greater insight into consumer perceptions of inflation and also facilitates data analysis from a statistical point of view. This is turn will assist policy makers in their attempt to control inflation as they will have better insight into consumer perceptions of recent developments as well as some ability to foresee inflation expectations given trends in actual inflation. ENDNOTES
1 In addition, inflation credibility was measured in Ohio by the Federal Reserve Bank of Cleveland between 1998 and 2002 (Bryan, 2006; Bryan and Ventaku, 2001).
2 This increased to 26 countries from 24 at the time of the 2006 paper by Rossouw and Padayachee
3 Between the fourth quarter of 2008 and the third quarter of 2009 disinflation did in fact occur. Based on the forecasts of the central bank (South African Reserve Bank, 2009:35), this trend should continue.
4 One of the authors (Rossouw) purchased these results from Markinor and holds copyright to it.
INFLATION CREDIBILITY SURVEYS IN INFLATION-TARGETING COUNTRIES 19

REFERENCES Bank for International Settlements (2008) Monetary policy decisions: preparing
the inputs and communicating the outcomes, BIS papers No. 37, Bank for International Settlements, February.
Bank of Iceland (2003) Monetary Bulletin, 5(3) August. Baldani j, Bradfield J and Turner R (2001) Mathematical Economics, South-
Western Thomson Learning, p31. Bechtold S and Linz s (2005) Enhancing the credibility of the consumer price
index, [Online] http://www.oecd.org/dataoecd/22/46/35281409.pdf [Accessed on various occasions].
Blinder A S, Ehrmann M, Fratzscher M, De Haan J and Jansen D-J (2008) Central bank communication and monetary policy: A survey of theory and evidence. Working Paper Series No 898. European Central Bank. May.
Blinder A S and Wyplosz C (2005) Central bank talk: Committee structure and communication policy, Paper presented at the session ‘Central Bank Communication’ at the ASSA meetings, Philadelphia, 9 January.
Brachinger H W (2005) Measuring perceived inflation: a prospect theory approach, International Statistical Institute, Voorburg, The Netherlands. 55th session in Sydney, 5 to 12 April.
Bryan M F (2006) E-mails received from Mr Michael Bryan, Vice President and Economist of the Federal Reserve Bank of Cleveland at [email protected] on various dates – and Ventaku G (2001) The demographics of inflation opinion surveys, Economic Commentary, Federal Reserve Bank of Cleveland, October.
Del Giovane P and Sabbatini R (2005) The introduction of the euro and divergence between officially measured and perceived inflation: the case of Italy, Paper read at the OECD seminar on Inflation Measures: Too High - Too Low - Internationally Comparable? Paris. 21 and 22 June.
Central Bank of Iceland (2007) Monetary Bulletin, 9(2) July. De Wet, W A (2003) Thinking like a Governor: Central banking under an
inflation target, The South African Journal of Economics, 71(4) December.
Döhring B and Mordon A (2007) What drives inflation perceptions?: A dynamic panel data analysis, Economic Papers. No 284, Directorate-General for Economic and Financial Affairs of the European Commission, July.
Ehrmann M and Fratzcher M (2004) Central Bank Communication: Different Strategies, Same Effectiveness? ECB Working Paper No 557, European Central Bank: Frankfurt.
20 INFLATION CREDIBILITY SURVEYS IN INFLATION-TARGETING COUNTRIES

European Central Bank (ECB) (2005) Monthly Bulletin, April. Fracasso A, Genberg H and Wyplosz C (2003) How do Central Banks Write?
ICMB: Geneva. GfK Sverige AB, Consumer Tendency Survey. http://www.gfksverige.se Ipsos-Markinor (2008) Project Inflation Credibility: Results Presentation. Issing O (2006) Einführung in die Geldtheorie, 14, Auflage, Verlag Franz
Vahlen: München, Translation assistance by Mr H H van Gass, SA Reserve Bank.
Jonung L (1981) Perceived and expected rates of inflation in Sweden, American Economic Review, 71(5) December.
Leeper E M (2003) An Inflation Reports report, Economic Review 3, Swedish Riksbank.
Markinor ([S.a.]) Webpage [Online] http://www.markinor.co.za/index.html [Accessed on various dates] (2006) Project Inflation Credibility: Results Presentation.
Mishkin F S (2004) The Economics of Money, Banking and Financial Markets, 7th edition, United States of America: Addison-Wesley Publishing Company, Inc.
Palmqvist S and Stromberg L (2004) Households’ inflation opinions – a tale of two surveys, Economic Review 4, Swedish Riksbank.
Parkin M (1999) Economics, 5th edition, United States of America. Addison-Wesley Publishing Company, Inc.
Reserve Bank of New Zealand, ([S.a.]) J5 Marketscope Survey - Expectations of inflation. Various issues. Online], http//www.rbnz.govt.nz [Accessed on various dates].
Romer D (2001) Advanced Macroeconomics, 2nd edition, United States of America: McGraw Hill Irwin.
Rossouw J (2008) Inflation in South Africa: 1921 to 2006, History, measurement and credibility, Unpublished PhD thesis, University of KwaZulu-Natal: Durban.
Rossouw J (2009) Why household surveys are not: assessing surveys in inflation-targeting countries, International Advances in Economic Research, 15(4) November.
Rossouw J and Padayachee V (2009) Measuring inflation credibility: Results of a first representative South African sample, SA Journal of Economics, 77(2), June.
Rossouw J and Joubert F (2005) Supporting an inflation-targeting policy with the measurement of inflation credibility, South African Journal of Economics, 73(2): 321-336.
Shubik M (1955) The uses of game theory in management science. Article reprinted in Mansfield E (1975) Microeconomics selected readings, 2nd edition, United States of America, WW Norton and Company, Inc.
INFLATION CREDIBILITY SURVEYS IN INFLATION-TARGETING COUNTRIES 21
South African Reserve Bank (2009) Monetary Policy Review May, SA Reserve Bank: Pretoria.
Swedish Riksbank (2008) Monetary Policy Report (2008/2). National Institute of Economic Research ([S.a.]) Tendency Surveys.
Kungsgatan 12-14, Stockholm: Sweden Van Heerden C and Styger P (2009) A note on Rossouw and Padayachee:
measuring inflation credibility: results of a first representative South African sample, Research note of the School of Economics, North-West University: Potchefstroom.
22 INFLATION CREDIBILITY SURVEYS IN INFLATION-TARGETING COUNTRIES

APPENDIX A
Inflation credibility in South Africa
INTERVIEW QUESTIONS
Interviews commenced with the statement:
"Hello, I am ... [insert name of interviewer]... from Markinor, an independent market
research company. We are carrying out a national study on various issues and products and
would greatly appreciate your time. Your name has been selected at random as part of a
representative sample of the South African public. I'd like to ask your views on a number of
different subjects. Your input will be treated strictly confidentially and at no time will your
name be connected to your responses".
First survey:
SECTION H – PROJECT INFLATION CREDIBILITY
ASK MALES AND FEMALES
METRO/NON METRO
INTRODUCTION: Now I would like to talk to you about your opinion regarding inflation in South Africa.
INFLATION CREDIBILIY SURVEYS IN INFLATION-TARGETING COUNTRIES 23

1. Yes
2. No
H1. South Africa’s official rate of
inflation (CPI) was 5,4% in August
2006. Do you think this is a true
reflection of average price increases? 3. Don’t
know
-1
-2
-3
Second survey:
SECTION H – PROJECT INFLATION CREDIBILITY
ASK MALES AND FEMALES
METRO/NON METRO
INTRODUCTION: Now I would like to talk to you about your opinion regarding inflation in South Africa.
1. Yes
2. No
H1. South Africa’s official rate of
inflation (CPI) was 13,7 % in August
2008. Do you think this is a true
reflection of average price increases? 3. Don’t
know
-1
-2
-3
24 INFLATION CREDIBILITY SURVEYS IN INFLATION-TARGETING COUNTRIES

APPENDIX B
Table B1 Responses about the accuracy of inflation figures according to gender and age
in terms of Asians, Blacks,
Coloureds and Whites
2006:
Gender Age Population group
Total Male Female 16-24 25-34 35-49 50+ Black White Coloured Asian
Yes % 18,5 22,4 14,6 18,3 20,7 19,0 16,0 14,8 30,7 24,6 19,6
n = 645 391 254 151 158 196 140 364 180 70 31
No % 28,6 31,0 26,2 25,5 28,2 29,7 30,5 22,7 48,0 32,6 41,1
n = 999 542 457 211 215 306 267 559 282 93 65
Don’t know
%
52,9 46,6 59,3 56,2 51,1 51,2 53,4 62,5 21,3 42,8 32,9
n = 1 849 815 1 034 465 390 527 467 1 540 125 122 62
2008:
Gender Age Population group
Total Male Female 16-24 25-34 35-49 50+ Black White Coloured Asian
Yes % 15,2 16,8 13,7 18,1 12,6 15,6 14,3 14,2 21,0 17,0 14,5
n = 530 292 238 155 101 155 119 370 79 64 17
No % 25,8 26,5 25,1 23,7 25,8 29,6 23,5 20,3 43,9 39,5 46,2
n = 898 460 438 203 207 292 196 530 165 149 54
Don’t know
%
59,0 56,7 61,2 58,2 61,6 54,8 62,2 65,5 35,1 43,5 39,3
n = 2 053 985 1 068 499 493 541 520 1 711 132 164 46
Sources: Markinor, 2006; Ipsos-Markinor, 2008
INFLATION CREDIBILIY SURVEYS IN INFLATION-TARGETING COUNTRIES 25

APPENDIX C
Table C1 Responses about the accuracy of inflation figures according to employment
and education
2006:
Employed Education
Total Yes No Up to/some
high school
Matric Tertiary/ot
her
Yes % 18,5 23,5 15,1 14,9 24,6 30,1
n = 645 331 314 298 218 123
No % 28,6 32,8 25,9 24,0 35,6 42,6
n = 999 461 538 479 315 174
Don’t know
%
52,9 43,7 59,2 61,1 39,8 27,2
n = 1 849 615 1 234 1 218 353 111
2008:
Employed Education
Total Yes No Up to/some
high school
Matric Tertiary/ot
her
Yes % 15,2 16,3 14,5 13,1 18,9 24,3
n = 530 226 304 264 178 80
No % 25,8 29,8 23,1 21,4 30,7 42,1
n = 898 415 483 452 290 139
Don’t know
%
59,0 53,9 62,4 64,6 50,4 33,6
n = 2 053 750 1 303 1 304 476 111
Sources: Markinor, 2006; Ipsos-Markinor, 2008
26 INFLATION CREDIBILITY SURVEYS IN INFLATION-TARGETING COUNTRIES
APPENDIX D
Table D1 Responses about the accuracy of inflation figures according to monthly
household income
2006:
Household income
Total Up to
R1 199
R1 200 to
R2 499
R2 500 to
R4 999
R5 000 to
R7 999
R8 000 to
R11 999
R12 000
+
Refused
Yes % 18,5 8,4 14,9 20,3 23,0 26,7 34,6 18,4
n = 645 69 87 104 64 63 135 123
No % 28,6 18,6 23,4 28,8 40,3 36,9 44,1 28,5
n = 999 153 137 148 112 87 172 190
Don’t
know %
52,9 73,5 61,7 50,9 36,7 36,4 21,3 53,1
n = 1 849 602 361 261 102 86 83 354
2008:
Household income
Total Up to
R1 199
R1 200 to
R2 499
R2 500 to
R4 999
R5 000 to
R7 999
R8 000 to
R11 999
R12 000
+
Refused
Yes % 15,2 7,9 13,9 17,9 20,4 20,6 22,7 15,1
n = 530 59 88 87 50 45 83 118
No % 25,8 16,2 22,7 27,1 27,2 33,3 45,8 24,7
n = 898 121 144 132 67 73 167 194
Don’t
know %
59,0 75,9 63,4 55,0 52,4 46,1 31,5 60,2
n = 2 053 566 402 268 129 101 115 472
Sources: Markinor, 2006; Ipsos-Markinor, 2008
INFLATION CREDIBILITY SURVEYS IN INFLATION-TARGETING COUNTRIES 27
Province
Total KwaZulu
-Natal
Gauteng Eastern
Cape
Western
Cape
Limpopo North
West
Free
State
Mpuma-
langa
Northern
Cape
Yes
%
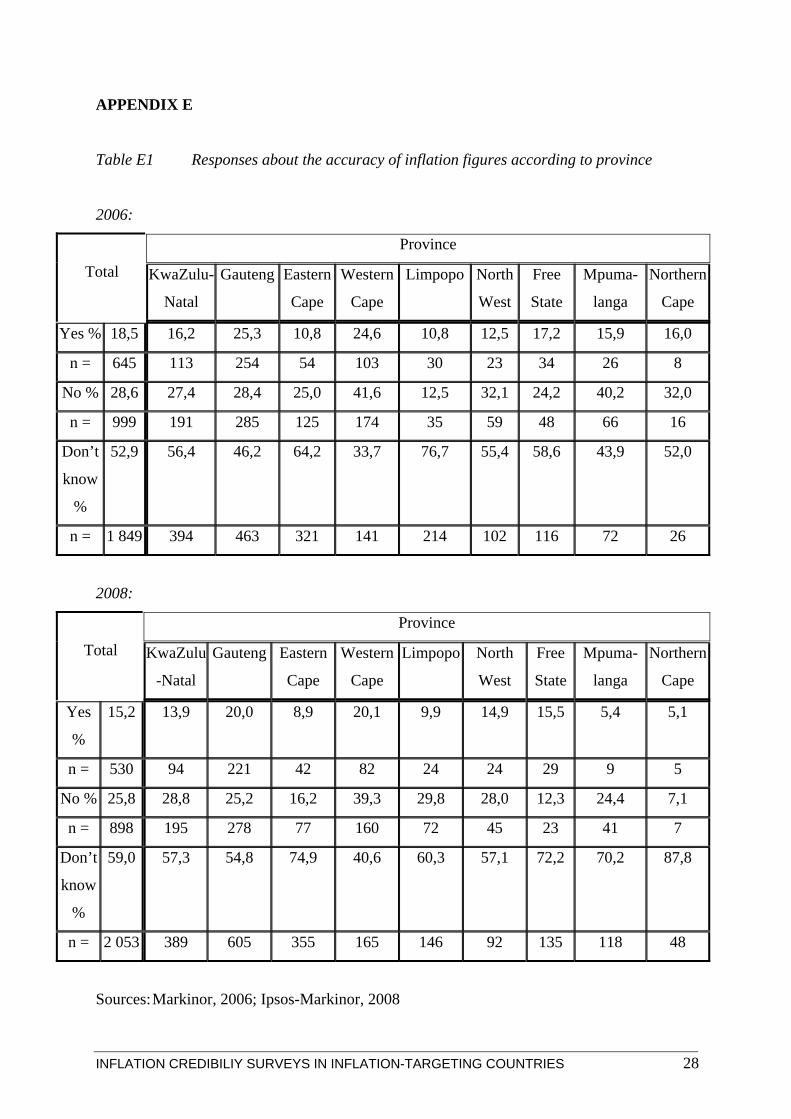
15,2 13,9 20,0 8,9 20,1 9,9 14,9 15,5 5,4 5,1
n = 530 94 221 42 82 24 24 29 9 5
No % 25,8 28,8 25,2 16,2 39,3 29,8 28,0 12,3 24,4 7,1
n = 898 195 278 77 160 72 45 23 41 7
Don’t
know
%
59,0 57,3 54,8 74,9 40,6 60,3 57,1 72,2 70,2 87,8
n = 2 053 389 605 355 165 146 92 135 118 48
Province
Total KwaZulu-
Natal
Gauteng Eastern
Cape
Western
Cape
Limpopo North
West
Free
State
Mpuma-
langa
Northern
Cape
Yes % 18,5 16,2 25,3 10,8 24,6 10,8 12,5 17,2 15,9 16,0
n = 645 113 254 54 103 30 23 34 26 8
No % 28,6 27,4 28,4 25,0 41,6 12,5 32,1 24,2 40,2 32,0
n = 999 191 285 125 174 35 59 48 66 16
Don’t
know
%
52,9 56,4 46,2 64,2 33,7 76,7 55,4 58,6 43,9 52,0
n = 1 849 394 463 321 141 214 102 116 72 26
INFLATION CREDIBILIY SURVEYS IN INFLATION-TARGETING COUNTRIES 28
Sources: Markinor, 2006; Ipsos-Markinor, 2008
2008:
2006:
Table E1 Responses about the accuracy of inflation figures according to province
APPENDIX E
APPENDIX F
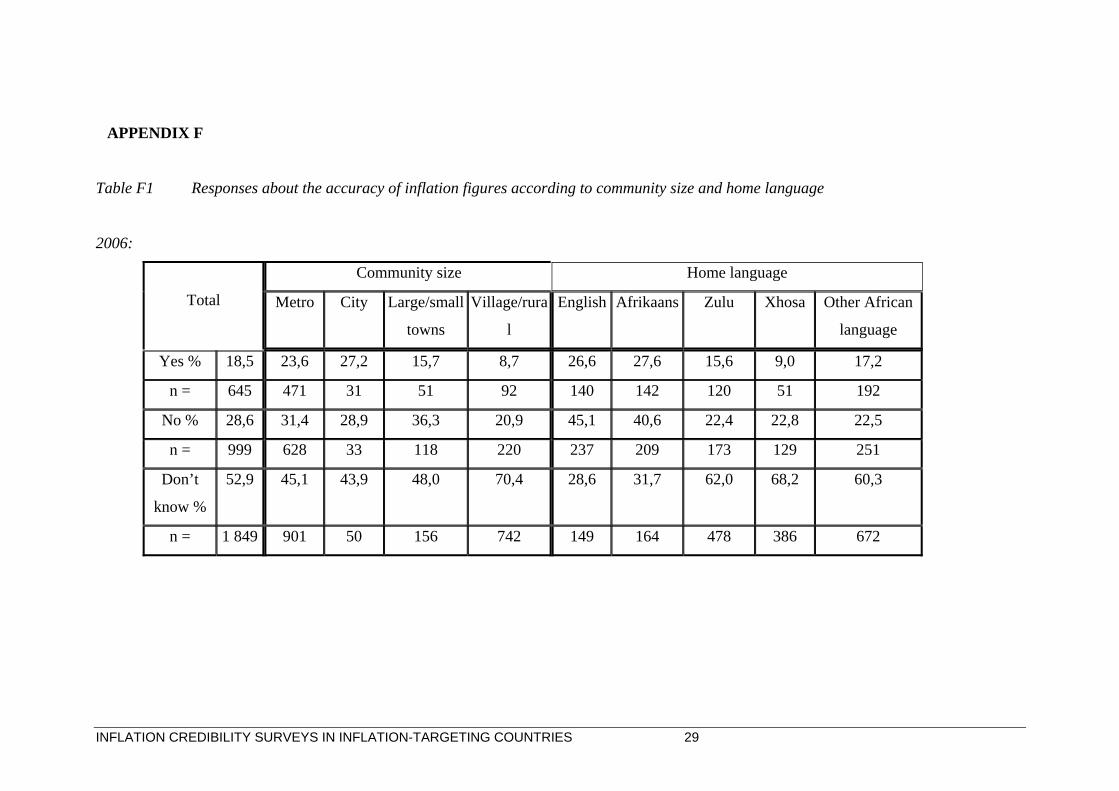
Table F1 Responses about the accuracy of inflation figures according to community size and home language
2006:
Community size Home language
Total Metro City Large/small
towns
Village/rura
l
English Afrikaans Zulu Xhosa Other African
language
Yes % 18,5 23,6 27,2 15,7 8,7 26,6 27,6 15,6 9,0 17,2
n = 645 471 31 51 92 140 142 120 51 192
No % 28,6 31,4 28,9 36,3 20,9 45,1 40,6 22,4 22,8 22,5
n = 999 628 33 118 220 237 209 173 129 251
Don’t
know %
52,9 45,1 43,9 48,0 70,4 28,6 31,7 62,0 68,2 60,3
n = 1 849 901 50 156 742 149 164 478 386 672
INFLATION CREDIBILITY SURVEYS IN INFLATION-TARGETING COUNTRIES 29

INFLATION CREDIBILITY SURVEYS IN INFLATION-TARGETING COUNTRIES
Community size Home language
Total Metro City Large/small
towns
Village/rura
l
English Afrikaans Zulu Xhosa Other African
language
Yes % 15,2 17,8 20,4 17,5 8,2 17,1 19,2 13,5 10,5 16,8
n = 530 357 38 54 81 69 93 118 66 184
No % 25,8 28,1 31,2 30,2 18,7 50,0 36,2 21,3 15,2 22,0
n = 898 563 58 93 184 202 175 186 95 240
Don’t
know %
59,0 54,1 48,4 52,3 73,1 32,9 44,6 65,2 74,3 61,2
n = 2 053 1 082 90 161 720 133 216 570 466 668
Sources: Markinor, 2006; Ipsos-Markinor, 2008
30
2008:
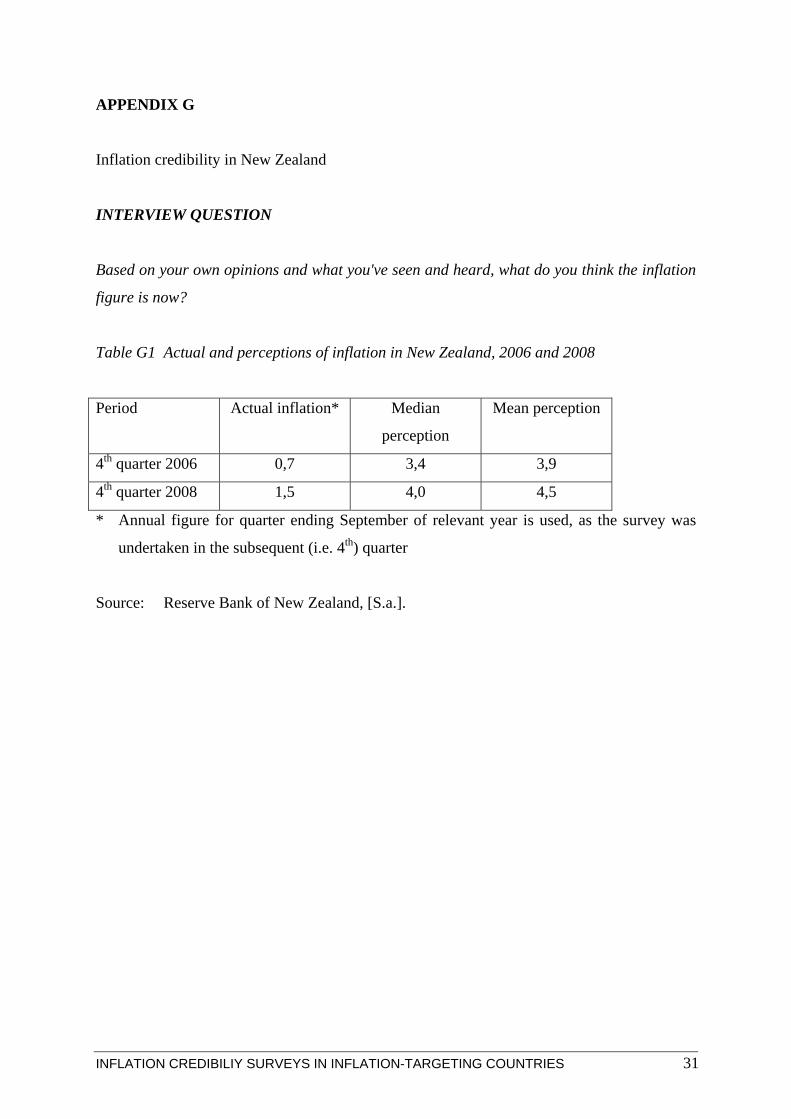
APPENDIX G
Inflation credibility in New Zealand
INTERVIEW QUESTION
Based on your own opinions and what you've seen and heard, what do you think the inflation
figure is now?
Table G1 Actual and perceptions of inflation in New Zealand, 2006 and 2008
Period Actual inflation* Median
perception
Mean perception
4th quarter 2006 0,7 3,4 3,9
4th quarter 2008 1,5 4,0 4,5
* Annual figure for quarter ending September of relevant year is used, as the survey was
undertaken in the subsequent (i.e. 4th) quarter
Source: Reserve Bank of New Zealand, [S.a.].
INFLATION CREDIBILIY SURVEYS IN INFLATION-TARGETING COUNTRIES 31

APPENDIX H
Inflation credibility in Sweden
INTERVIEW QUESTION
Compared with 12 months ago, do you find that prices in general are very much higher; quite
a bit higher; a little higher; about the same; lower; or don’t know; and provide a numerical
estimate of your view.
Table H1 Actual and perceptions of inflation in Sweden, 2006 and 2008
Period Actual inflation* Average
perception
including extreme
values
Average
perception
excluding
extreme values**
4th quarter 2006 1,5 1,87 1,44
4th quarter 2008 4,4 4,06 5,48
* Annual figure for preceding 12 months to September is used, as survey was undertaken in
subsequent (i.e. 4th) quarter.
** Extreme values are very high or very low perceptions of inflation that are excluded for the
purpose of calculating an average inflation perception. This explains why the average
perception excluding extreme values are lower than the average value including extreme
values in 2006 and lower in 2008. The calculation methodology is explained below.
Source: National Institute of Economic Research, [S.a.].
32 INFLATION CREDIBILITY SURVEYS IN INFLATION-TARGETING COUNTRIES

Calculation of extreme values in Swedish inflation credibility surveys
A boxplot (example below) is used to describe the spread of values in a dataset and highlights
responses that differ extremely (extreme values) from the average. :
A
Q3 = third quartile
Median
Q1 = first quartile
B
The upper edge is the third quartile Q3. About 75% of the respondents has a value less or
equal to Q3. The lower edge is Q1, the first quartile. About 25% of the sample lies below Q1.
The centre line is the median. This average splits the dataset into two equal sized groups. The
length of the box (Q3 - Q1) is called quartile-distance (QR), which covers 50% of the
observations.
Values that lie more than 1,5 quartile-distances higher than Q3 or equally far lower than Q1
are called outliers. If the distance exceeds 3 quartile-distances these observations are extreme
values. Points A and B are the biggest and smallest values, respectively, not classified as
outliers in this boxplot. Extreme values for exclusion are calculated by:
• identifying the ten largest and the ten smallest values;
INFLATION CREDIBILITY SURVEYS IN INFLATION-TARGETING COUNTRIES 33

• count Q3, Q1 and QR; and
• excluding observations exceeding the value Q3 + 3QR or lying below Q1 - 3QR.
Source: National Institute of Economic Research, [S.a.].
34 INFLATION CREDIBILITY SURVEYS IN INFLATION-TARGETING COUNTRIES
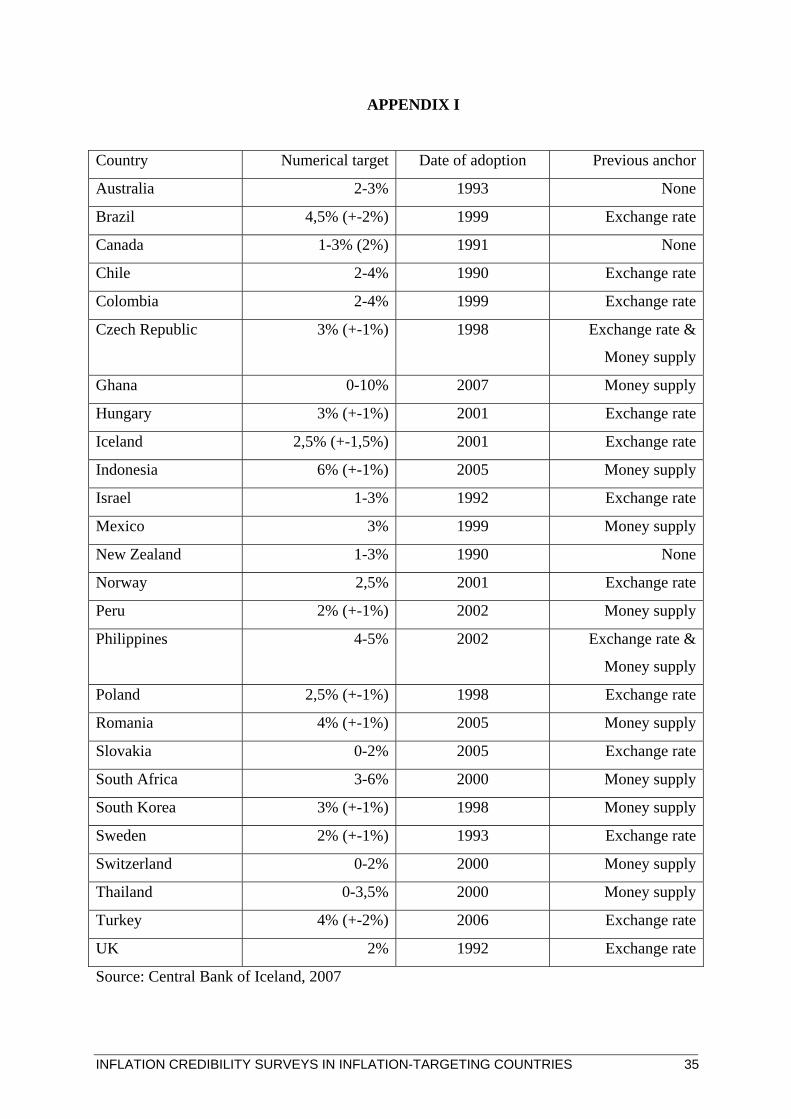
APPENDIX I
Country Numerical target Date of adoption Previous anchor
Australia 2-3% 1993 None
Brazil 4,5% (+-2%) 1999 Exchange rate
Canada 1-3% (2%) 1991 None
Chile 2-4% 1990 Exchange rate
Colombia 2-4% 1999 Exchange rate
Czech Republic 3% (+-1%) 1998 Exchange rate &
Money supply
Ghana 0-10% 2007 Money supply
Hungary 3% (+-1%) 2001 Exchange rate
Iceland 2,5% (+-1,5%) 2001 Exchange rate
Indonesia 6% (+-1%) 2005 Money supply
Israel 1-3% 1992 Exchange rate
Mexico 3% 1999 Money supply
New Zealand 1-3% 1990 None
Norway 2,5% 2001 Exchange rate
Peru 2% (+-1%) 2002 Money supply
Philippines 4-5% 2002 Exchange rate &
Money supply
Poland 2,5% (+-1%) 1998 Exchange rate
Romania 4% (+-1%) 2005 Money supply
Slovakia 0-2% 2005 Exchange rate
South Africa 3-6% 2000 Money supply
South Korea 3% (+-1%) 1998 Money supply
Sweden 2% (+-1%) 1993 Exchange rate
Switzerland 0-2% 2000 Money supply
Thailand 0-3,5% 2000 Money supply
Turkey 4% (+-2%) 2006 Exchange rate
UK 2% 1992 Exchange rate
Source: Central Bank of Iceland, 2007
INFLATION CREDIBILITY SURVEYS IN INFLATION-TARGETING COUNTRIES 35


![BENJAMIN ROSSOUW First Appellant SANDRA WILSON … · Neutral citation: Rossouw v First Rand Bank Ltd (640/09) [2010] ZASCA 130 (30 September 2010) Coram: MPATI P, NAVSA, CLOETE,](https://img.dokumen.tips/doc/110x75/5fa25be1c284a0196a3c670e/benjamin-rossouw-first-appellant-sandra-wilson-neutral-citation-rossouw-v-first.jpg)