Embed Size (px)
Citation preview
ASX271
WOTIF.COM HOLDINGS LIMITED ABN 41 093 000 456 | 7 Baroona Road Milton QLD 4064 Australia | Phone: +61 7 3512 9965 Fax: +61 7 3512 9914 Email: [email protected]
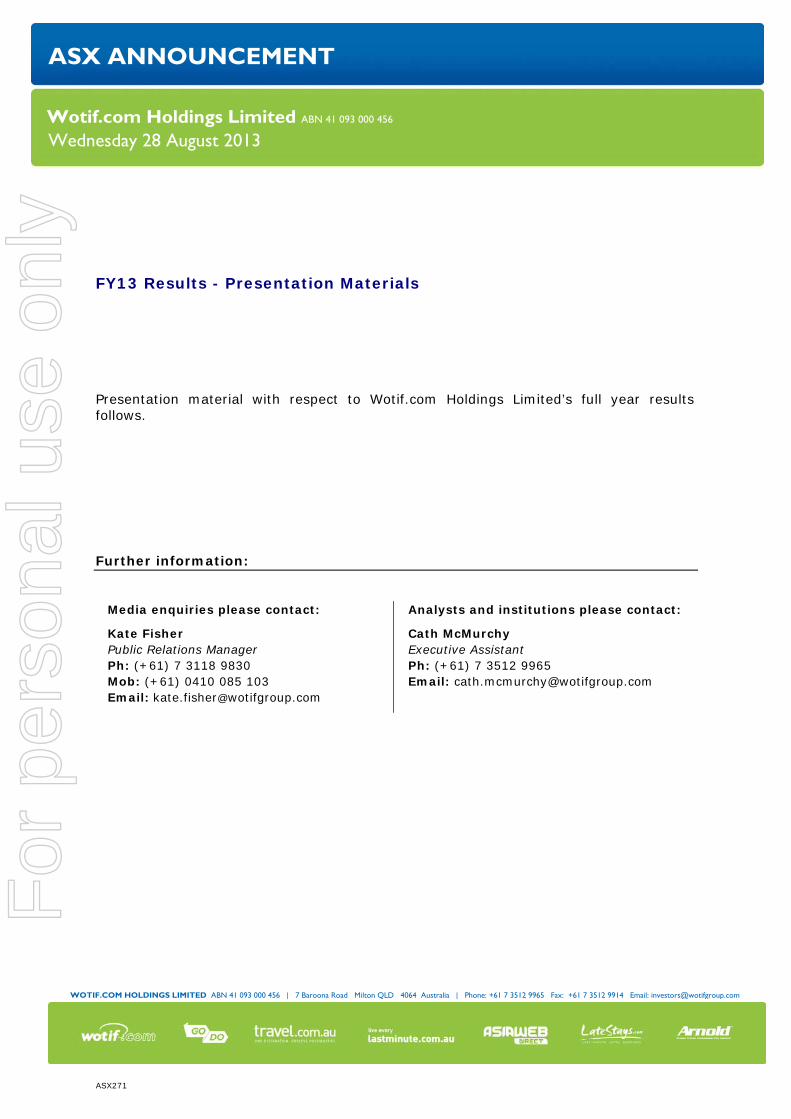
ASX ANNOUNCEMENT
Wotif.com Holdings Limited ABN 41 093 000 456
Wednesday 28 August 2013
FY13 Results - Presentation Materials Presentation material with respect to Wotif.com Holdings Limited’s full year results follows. Further information:
Media enquiries please contact: Analysts and institutions please contact:
Kate Fisher Public Relations Manager Ph: (+61) 7 3118 9830 Mob: (+61) 0410 085 103 Email: [email protected]
Cath McMurchy Executive Assistant Ph: (+61) 7 3512 9965 Email: [email protected]
For
per
sona
l use
onl
y

For
per
sona
l use
onl
y

2
Company Background FY13 Results Key Achievements and Financial Overview Market Position Business Focus and Outlook Strategy Update
Agenda
For
per
sona
l use
onl
y
3
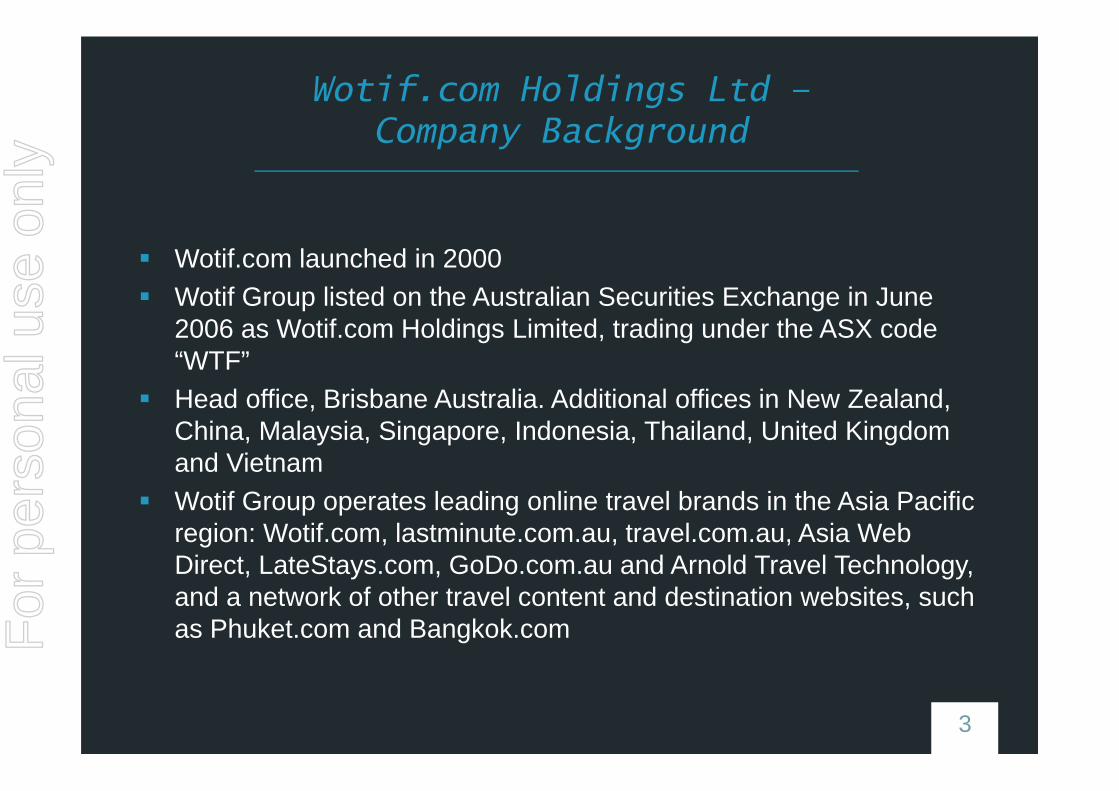
Wotif.com launched in 2000 Wotif Group listed on the Australian Securities Exchange in June
2006 as Wotif.com Holdings Limited, trading under the ASX code “WTF”
Head office, Brisbane Australia. Additional offices in New Zealand, China, Malaysia, Singapore, Indonesia, Thailand, United Kingdom and Vietnam
Wotif Group operates leading online travel brands in the Asia Pacific region: Wotif.com, lastminute.com.au, travel.com.au, Asia Web Direct, LateStays.com, GoDo.com.au and Arnold Travel Technology, and a network of other travel content and destination websites, such as Phuket.com and Bangkok.com
Wotif.com Holdings Ltd –Company Background
For
per
sona
l use
onl
y

4
FY13 Results
Record TTV* of $1.166b, up 0.4% (FY12: $1.161b) Record revenue of $146.6m, up 0.9% (FY12: $145.3m) Total costs up $9.1m including one-off write-offs of $2.3m Net profit after tax (NPAT) $51.0m, down 12% (FY12: $58.0m)
*Total Transaction Value (TTV) represents the price at which accommodation and flights and other travel services have been sold across the Group’s operations. TTV is stated net of any GST/VAT payable. TTV does not represent revenue in accordance with Australian Accounting Standards. For
per
sona
l use
onl
y

5
FY13 Key Achievements
Strategic review completed and projects underway Hotel commission increase to 11% successfully
implemented Maintained sales of one-in-ten accommodation nights in
Australia*
Mobile now provides 33% of all traffic across the Group Mobile devices and apps deliver 36% of traffic to
Wotif.com and 17% of Wotif.com room nights Accommodation reviews total almost 800,000 with a
market leadership position for hotels in Australia
*Australian Bureau of Statistics 8635.0 Tourist Accommodation, Australia March 2013.
For
per
sona
l use
onl
y

6
FY13 Key Achievements
Successful release of flights growth initiative, including mobile and cross-sell
Flights TTV up 17.5% Dynamic packaging (DP) beta-launched on Wotif.com and
plans to finalise the release of DP for domestic and international in FY14
27,830 properties directly contracted (up 18%) Wotif.com brand awareness 63.7% in Australia and 35.6%
in New Zealand, customer “stickiness” still a strong USP Wotif.com accommodation inventory integrated into Arnold
Corporate platformFor
per
sona
l use
onl
y

7
FY13 Group Financial Overview
Operating profit* $79.9m, down 7.4% (FY12: $86.3m) Profit before tax $73.6m, down 9.6% (FY12: $81.3m) Net profit after tax $51.0m, down 12.2% (FY12: $58.0m) Group accommodation revenue margin 12.3% (FY12: 12.1%) Group operating profit* margin 54% (FY12: 59%) 95% dividend payout ratio (FY12: 91%) 100% fully franked dividend per share 11.5c final and 11.5c
interim (FY12: 25c)
*Being profit before depreciation, amortisation and taxation (not being an IFRS measure and unaudited) as a percentage of total revenueF
or p
erso
nal u
se o
nly

8
FY13 Group Financial Overview
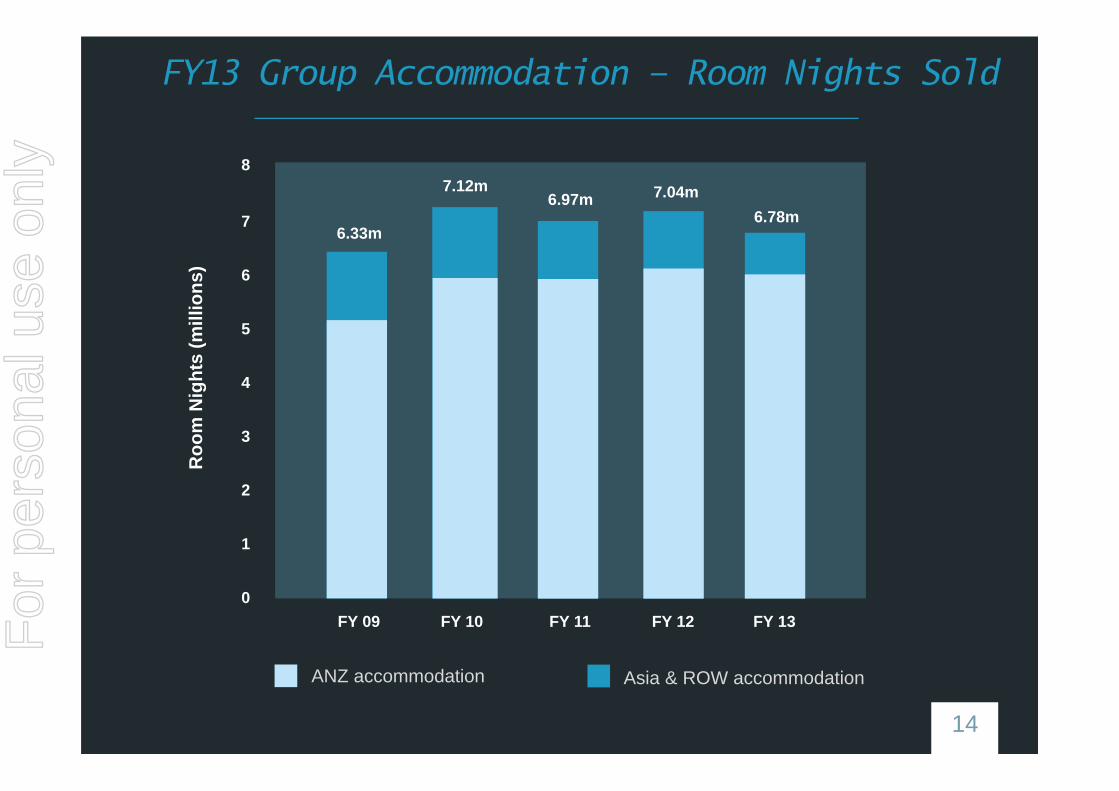
6.78m room rights sold (FY12: 7.04m) ANZ: 6.0m flat Asia/Rest of World (ROW): 0.8m, down 22.0% (accounts for shortfall)
Group room rates up 2.3% Wotif.com rates up 1.5% Asia Web Direct rates up 7.7%
ANZ hotel booking numbers slightly up YoY 186,000 flight transactions (FY12: 167,000)
For
per
sona
l use
onl
y
9
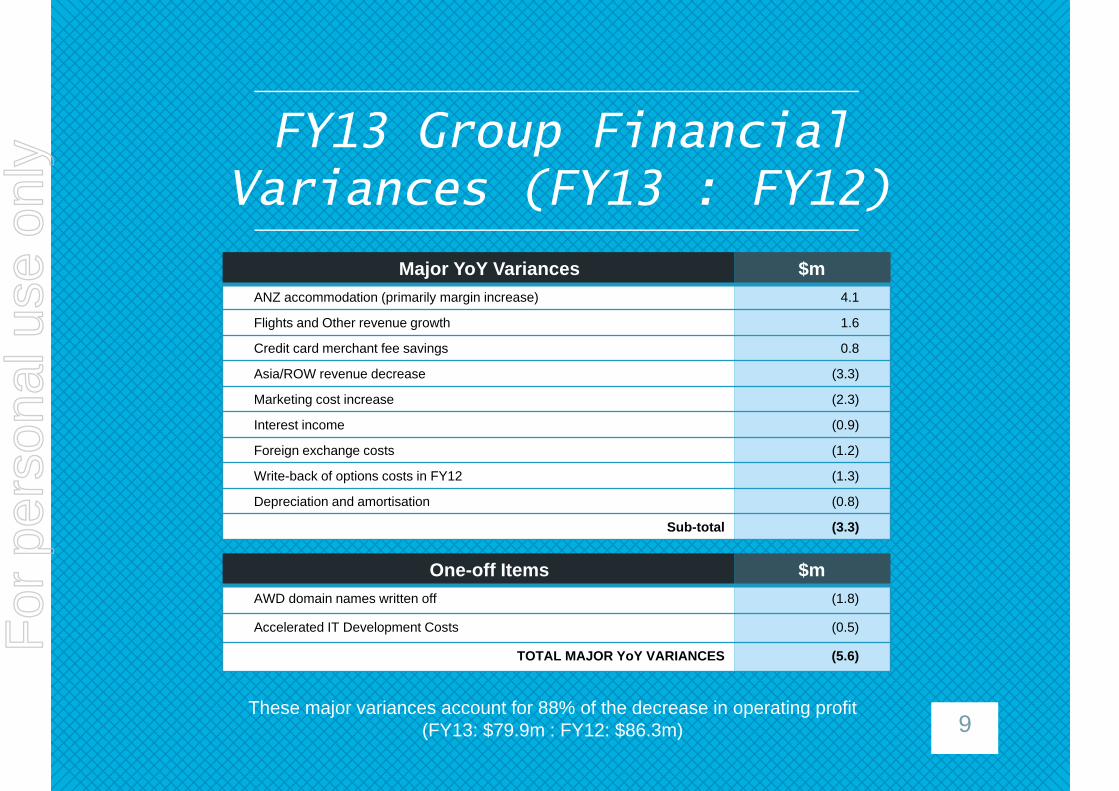
Major YoY Variances $mANZ accommodation (primarily margin increase) 4.1
Flights and Other revenue growth 1.6
Credit card merchant fee savings 0.8
Asia/ROW revenue decrease (3.3)
Marketing cost increase (2.3)
Interest income (0.9)
Foreign exchange costs (1.2)
Write-back of options costs in FY12 (1.3)
Depreciation and amortisation (0.8)
Sub-total (3.3)
FY13 Group Financial Variances (FY13 : FY12)
One-off Items $mAWD domain names written off (1.8)
Accelerated IT Development Costs (0.5)
TOTAL MAJOR YoY VARIANCES (5.6)
These major variances account for 88% of the decrease in operating profit (FY13: $79.9m : FY12: $86.3m)
For
per
sona
l use
onl
y

10
Margin FY13 Actual FY12 Actual
Accommodation revenue % of accommodation TTV 12.3% 12.1%
Total revenue % of TTV 12.6% 12.5%
Operating profit margin* 54.5% 59.4%
FY13 Group Margins
*Being profit before depreciation, amortisation and taxation (not being an IFRS measure and unaudited) as a percentage of total revenue.
For
per
sona
l use
onl
y

11
FY13 Group Balance Sheet
11
FY13 FY12
CURRENT ASSETSCash and cash equivalentsTrade and other receivables
132,00010,851
140,8718,481
TOTAL CURRENT ASSETS 142,851 149,352
NON-CURRENT ASSETSReceivablesInvestment in joint ventureProperty, plant and equipmentInvestment propertyDeferred tax assetsIntangible assets and goodwill
149523
17,3463,4437,411
95,359
138163
18,1403,5797,222
89,797
TOTAL NON-CURRENT ASSETS 124,231 119,039
TOTAL ASSETS 267,082 268,391
CURRENT LIABILITIESTrade and other payablesIncome tax payableProvisions
156,5625,9781,860
157,3307,7341,399
TOTAL CURRENT LIABILITIES 164,400 166,463
NON-CURRENT LIABILITIESInterest bearing loans and borrowingsDeferred tax liabilitiesProvisions
1122,189
483
1122,685
649
TOTAL NON-CURRENT LIABILITIES 2,784 3,446
TOTAL LIABILITIES 167,184 169,909
NET ASSETS 99,898 98,482
EQUITYContributed equityRetained earningsReserves
30,00164,6335,264
30,00166,5301,951
TOTAL EQUITY 99,898 98,482
For
per
sona
l use
onl
y

12
FY13 Group Capex
Capex FY13 Actual FY12 Actual
Property, plant and equipment $3.0m $3.2m
IT Development Costs* $6.9m $5.9m
Total $9.9m $9.1m
*IT development costs that relate to the acquisition of an asset are capitalised, to the extent that they represent probable future economic benefits, are controlled by the Group and can be reliably measured (referred to as IT Development Costs). The capitalised cost is amortised over the period of expected benefit, generally between 1 and 5 years. IT costs incurred in the management, maintenance and day-to-day enhancement of all IT applications are charged as an expense in the period in which they are incurred.
For
per
sona
l use
onl
y

10 20 30 40 50 60 70 80 90 100 110 120 130 140 150
13
FY13 Group Performance
FY13
FY12
FY11
FY10
FY09
145.3
138.3
136.0
121.3
58.0
51.0
53.0
43.5
Revenue NPAT
AUD millions
51.0146.6
For
per
sona
l use
onl
y
14
FY13 Group Accommodation – Room Nights Sold
6.33m
7.12m6.97m 7.04m
FY 09 FY 10 FY 11 FY 12 FY 13
Roo
m N
ight
s (m
illio
ns)
8
7
6
5
4
3
2
1
0
6.78m
ANZ accommodation Asia & ROW accommodation
For
per
sona
l use
onl
y

14%
12%
10%
8%
6%
4%
2%
0%
15
Wotif Group Room Night Sales versus Total Australian Room Night Sales
Source: Australian Bureau of Statistics 8635.0 Tourist Accommodation, Australia March 2013
60
50
40
30
20
10
0
Shar
e of
Acc
omm
odat
ion
Segm
ents
(%)
CY 09 CY 10 CY 11 CY 12
Calendar YearQ1 13
Q1 10.1%
Q1 9.6%
Wotif Group Rest of market Wotif Group segment share
0.5 PPUPLIFT
Acc
omm
odat
ion
Roo
m N
ight
s (m
illio
ns)
9.9% 9.7% 9.9% 9.9%
For
per
sona
l use
onl
y

16
lastminute.com.au Mobile - Hotels
For
per
sona
l use
onl
y

17
Wotif.com App on iPad - Hotels
For
per
sona
l use
onl
y

18
Flights on Mobile Devices – Wotif.com
For
per
sona
l use
onl
y

19
Mobile Visits – Wotif.com
0
1,000,000
2,000,000
3,000,000
4,000,000
5,000,000
6,000,000
7,000,000
8,000,000
Q1 Q2 Q3 Q4 Q1 Q2 Q3 Q4
FY12 FY13For
per
sona
l use
onl
y

20
Mobile Bookings – Wotif.com
0
20,000
40,000
60,000
80,000
100,000
120,000
140,000
160,000
180,000
Q1 Q2 Q3 Q4 Q1 Q2 Q3 Q4
FY12 FY13
For
per
sona
l use
onl
y

21
Visits on Mobile Devices – Wotif.com
FY12 FY13
82.33%
10.23%
7.19%
0.25%
Desktop Mobile Phone Tablet Other
64.14%
20.45%
15.25%
0.16%
Desktop Mobile phone Tablet OtherFor
per
sona
l use
onl
y

22
Wotif.com Customer Reviews
For
per
sona
l use
onl
y

23
Wotif.com Customer Reviews
Reviews widget released in May 2013 for suppliers to display their verified Wotif.com reviews on their own website.
For
per
sona
l use
onl
y
24
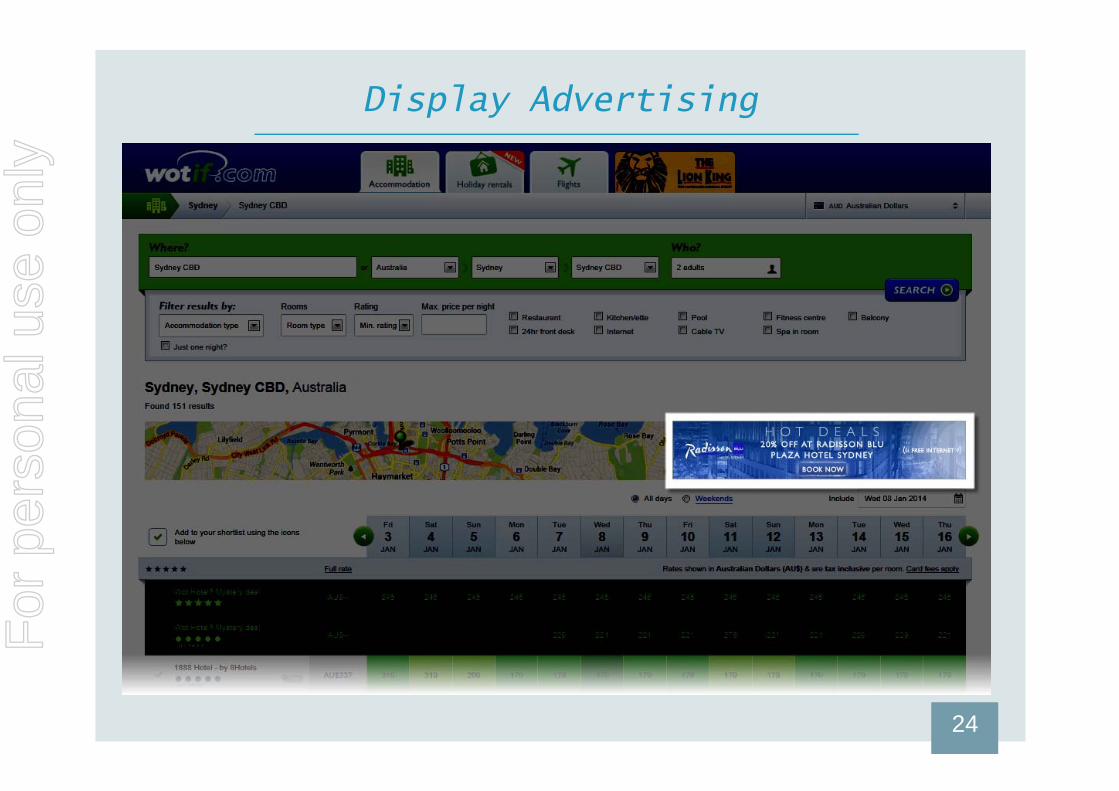
Display Advertising
For
per
sona
l use
onl
y

25
Properties Directly Represented
Num
ber
of P
rope
rtie
s
FY 09 FY 10 FY 11 FY 12 FY 13
16,04517,599
19,635
23,539
30,000
25,000
20,000
15,000
10,000
5,000
0
27,830
For
per
sona
l use
onl
y

26
Properties Directly Represented
FY13 Properties FY12 Properties % PCP
Australia & New Zealand 11,750 10,205 15.1%
Asia 9,689 7,484 29.5%
Rest of World 6,391 5,850 9.2%
Total 27,830 23,539 18.2%
For
per
sona
l use
onl
y
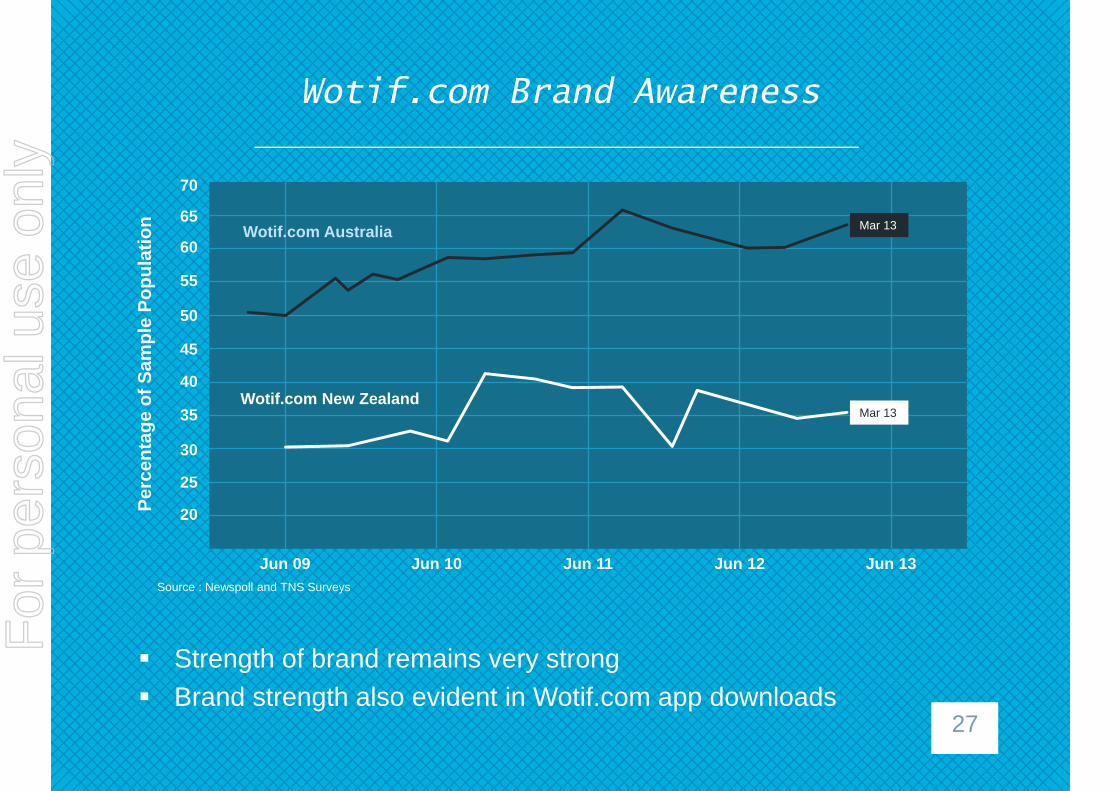
Jun 09 Jun 10 Jun 11 Jun 12 Jun 13
27
Wotif.com Brand Awareness
Strength of brand remains very strong Brand strength also evident in Wotif.com app downloads
Source : Newspoll and TNS Surveys
Perc
enta
ge o
f Sam
ple
Popu
latio
n
70
65
60
55
50
45
40
35
30
25
20
Wotif.com Australia
Wotif.com New ZealandMar 13
Mar 13
For
per
sona
l use
onl
y

28
Business Focusand Outlook
Domestic ANZ retail outlook remains challenging Business ‘strategic pillar’ project groups underway, focus
will move to execution phase Protect and grow ANZ accommodation business around
strategy outcomes, including marketing Continue to grow flights and packages share Regain Asia and ROW revenue share Implement next round of commission increases of 1% in
January 2014 No initial indication of shift to domestic travel (Australia) as
a result of AU$ decreaseFor
per
sona
l use
onl
y
29
Strategy Update
Monetisation of traffic Content Marketing Asia Technology
For
per
sona
l use
onl
y

30
Questions?
Scott BlumeChief Executive Officer
Gordon TimmChief Financial Officer
For
per
sona
l use
onl
y