Embed Size (px)
Citation preview

World EnergyInvestment
2016

World EnergyInvestment
2016

INTERNATIONAL ENERGY AGENCY
The International Energy Agency (IEA), an autonomous agency, was established in November 1974. Its primary mandate was – and is – two-fold: to promote energy security amongst its member
countries through collective response to physical disruptions in oil supply, and provide authoritative research and analysis on ways to ensure reliable, affordable and clean energy for its 29 member countries and beyond. The IEA carries out a comprehensive programme of energy co-operation among its member countries, each of which is obliged to hold oil stocks equivalent to 90 days of its net imports. The Agency’s aims include the following objectives:
n Secure member countries’ access to reliable and ample supplies of all forms of energy; in particular, through maintaining effective emergency response capabilities in case of oil supply disruptions.
n Promote sustainable energy policies that spur economic growth and environmental protection in a global context – particularly in terms of reducing greenhouse-gas emissions that contribute to climate change.
n Improve transparency of international markets through collection and analysis ofenergy data.
n Support global collaboration on energy technology to secure future energy suppliesand mitigate their environmental impact, including through improved energy
efficiency and development and deployment of low-carbon technologies.
n Find solutions to global energy challenges through engagement and dialogue with non-member countries, industry, international
organisations and other stakeholders.IEA member countries:
Australia Austria
Belgium Canada
Czech RepublicDenmark
EstoniaFinland
FranceGermany
GreeceHungary
Ireland Italy
JapanKoreaLuxembourgNetherlandsNew Zealand NorwayPolandPortugalSlovak RepublicSpainSwedenSwitzerlandTurkey
United KingdomUnited States
The European Commission also participates in
the work of the IEA.
© OECD/IEA, 2016International Energy Agency
9 rue de la Fédération 75739 Paris Cedex 15, France
www.iea.org
Please note that this publication is subject to specific restrictions that limit its use and distribution.
The terms and conditions are available online at www.iea.org/t&c/
Together
SecureSustainable

Foreword 3
Foreword
Investment is the lifeblood of the global energy system. Money invested today in our energy systems, in large-scale power plants and transmission lines, home energy efficiency upgrades or innovative low-carbon technologies will have a lasting influence on energy supply and demand for decades to come. A sustainable, prosperous and healthy future for the world depends on these investment decisions, which are shaped by market frameworks and ultimately determined by government policies.
One year ago, I began my new role as Executive Director of the International Energy Agency (IEA) by presenting a new vision for the Agency that is founded on three pillars: opening the doors of the IEA to emerging economies, a strengthened and broadening commitment to energy security, and bolstering the role of the IEA as an international hub for clean energy technology and energy efficiency. The need for timely and cost-effective investments underpins policy goals across these three pillars.
With World Energy Investment 2016 we are taking a big step forward. We hope this new annual series will provide a unique benchmark of all the main energy-related investments happening around the world today. It also shines a light on the implications of these investments for energy security, low-carbon energy and energy markets. It is critically important to properly measure and understand what is happening in boardrooms, banks, or construction sites around the world to make sure that the right decisions are made by public and private actors. By moving closer to what is happening on the ground, our aim is to provide decision makers with a tool to assess current trends and identify opportunities.
This work on investment complements our other regular IEA publications and is enabled by our close work with governments and businesses, whose insights and contributions have been invaluable.
The critical importance of energy investment to global prosperity will grow as countries look for ways to meet their climate goals and hundreds of millions of people gain access to modern energy services. Whether the objective is to build systems that are resilient to supply shocks or to deploy low-carbon technologies in a timely manner, the ability to mobilise investment is ultimately the key determinant of the success or failure of an energy policy. As we continue to implement the three pillars of our new vision, measuring investment flows and assessing their implications for the global energy system will be priorities for the IEA.
Dr Fatih Birol Executive Director International Energy Agency


Acknowledgements 5
Acknowledgements
This report was prepared by the Economics and Investment Office of the International Energy Agency (IEA). It was designed and directed by Laszlo Varro, Chief Economist of the IEA. The lead authors were Simon Bennett (investment in energy end use and efficiency), Alessandro Blasi (investment in oil, gas and coal) and Michael Waldron (investment in electricity and renewables). Principal contributors to the report were Alfredo Del Canto, Tomi Motoi and Yoko Nobuoka. Other key contributors were Ingrid Barnsley, Carlos Fernandez Alvarez, Thomas Giehm, Christopher Gully, Kristine Petrosyan, Andrew Wilson and Yang Lei. Trevor Morgan edited the manuscript and Janet Pape provided essential support.
The report is indebted to the high standard of investment data production across all parts of the IEA. In particular, the work of the Energy Supply Outlook Division (Tim Gould, Chris Besson, Ian Cronshaw, Christophe McGlade and Pawel Olejarnik), the Energy Efficiency Division (Brian Motherway, Tyler Bryant, Brian Dean and Samuel Thomas), the Energy Demand Outlook Division (Laura Cozzi, Marco Baroni, Timur Gül, Brent Wanner, David Wilkinson and Shuwei Zhang) and the Renewable Energy Division (Paolo Frankl, Yasmina Abdelilah, Heymi Bahar, Pharoah Le Feuvre and Megan Mercer) was invaluable to the analysis.
We would like to thank the following organisations that gave their time to answer questions and respond to cost surveys covering different parts of the energy value chain: Banpu, Barclays, BP, Chevron, Citigroup, Enel, Eni, ExxonMobil, European Solar Thermal Electricity Association (ESTELA), GE, Goldman Sachs, Iberdrola, J-Power, Morgan Stanley, Navigant, OMV, Petrofac, Philips, Repsol, Schlumberger, Shell, Statoil, Total and WindEurope.
The report benefited from valuable inputs, comments and feedback from other experts within the IEA, including Manuel Baritaud, Kamel Ben Naceur, David Benazeraf, Mariano Berkenwald, Pierpaolo Cazzola, Loïc Coent, Karolina Daszkiewicz, John Dulac, Marc-Antoine Eyl-Mazzega, Duarte Figueira, Nathan Frisbee, Jean-François Gagné, Costanza Jacazio, Joerg Husar, Alexander Keeley, Simon Keeling, Florian Kitt, Markus Klingbeil, Vladimir Kubecek, Sonja Lekovic, Raimund Malischek, Duncan Millard, David Morgado, Noor Miza Muhamad Razali, Luis Munuera, Roberta Quadrelli, Uwe Remme, Keisuke Sadamori, Jesse Scott, Paul Simons, Tristan Stanley, Johannes Trueby, Kevin Tu, Aad Van Bohemen, Matthew Wittenstein. Thanks also go to Muriel Custodio, Astrid Dumond, Rebecca Gaghen, Jad Mouawad, Bertrand Sadin, Robert Stone and Therese Walsh of the IEA Communication and Information Office for their help in producing the report.

6 Acknowledgements
Many experts from outside of the IEA provided input, commented on the underlying analytical work and reviewed the report. Their comments and suggestions were of great value. They include:
Géraldine Ang Organisation for Economic Co-operation and Development (OECD)
Marco Annunziata GE
Alexander Antonyuk European Investment Bank (EIB)
Jean-Paul Bouttes EDF
Barbara Buchner Climate Policy Initiative (CPI)
Prach Chongkittisakul Banpu
Carlo Crea Terna
Giles Dickson WindEurope
Szilvia Doczi Arup
Jonathan Elkind Department of Energy, Government of the United States
Paolo Falcioni European Committee of Domestic Equipment Manufacturers
Mark Finley BP
Nikki Fisher AngloAmerican
Benjamin Freas Navigant
Jaejoo Ha Nuclear Energy Agency
Michael Hackethal Federal Ministry for Economic Affairs and Energy, German Government
Tom Howes European Commission, Directorate-General for Energy
Anil Jain National Institution for Transforming India (NITI) Aayog, Government of India
Christopher Kaminker OECD
Ken Koyama Institute of Energy Economics, Japan (IEEJ)
Alex Körner Consultant
Jochen Kreusel ABB
Ross Lambie Department of Industry, Innovation and Science, Australian Government

Acknowledgements 7
Richard Lavergne Ministère de l'Environnement, de l'énergie et de la mer, Government of France
Benoit Lebot International Partnership for Energy Efficiency Cooperation (IPEEC)
Mark Lewis Barclays
Michael de la Mothe Natural Resources Canada, Government of Canada
Steve Nadel American Council for an Energy-Efficient Economy (ACEEE)
Gilles de Noblet Schlumberger
Nick Norton Foreign and Commonwealth Office, UK Government
Hokuto Otsuka OECD
Gregor Pett E.ON
Andrew Prag OECD
Geoffrey Rothwell OECD Nuclear Energy Agency
Felix Rüsch OMV
Pierre Sigonney Total
Filipe Silva OECD
Manpreet Singh KPMG India
Konstantin Staschus ENTSO-E
James Steel Department for Business, Energy and Industrial Strategy, UK Government
Kuniharu Takemata J-Power
Cecilia Tam Asia Pacific Energy Research Centre (APERC)
Michael Taylor International Renewable Energy Agency
Jakob Thomä 2 Degrees Investing Initiative
Wim Thomas Shell
Rick Truscott CLP Power
Graham Weale RWE
Carlos Salle Alonso Iberdrola
Mark Shores ExxonMobil
Michael Sinocruz Asia Pacific Energy Research Centre (APERC)

8 Acknowledgements
Kazushige Tanaka Government of Japan
Julien Touati Meridiam Infrastructure
Eirik Wærness Statoil
Robert Youngman OECD
Yongping Zhai Asian Development Bank (ADB)
Liyang Zhang State Grid Corporation of China (SGCC)
Xiuli Zhang UC Davis
The individuals and organisations that contributed to this study are not responsible for any opinions or judgements it contains. All errors and omissions are solely the responsibility of the IEA.
Comments and questions are welcome and should be addressed to:
Mr. Laszlo Varro, Chief Economist
Economics and Investment Office, International Energy Agency
31-35 rue de la Fédération, 75739 Paris Cedex 15, France
Telephone: (33-1) 4057 6670; Email: [email protected]
More information about the report and the methodologies is available at www.iea.org/investment.

Table of contents 9
Table of contents
Executive summary ...................................................................... 13
Introduction ................................................................................. 19
A new annual report on global energy investment...................................... 19
Defining and measuring energy investment ................................................ 19
1. Energy investment trends ......................................................... 21
Highlights .................................................................................................. 21
Global energy investment trends ............................................................... 22
A slump in capital spending on energy, mainly due to lower costs ......... 22
Changes in relative costs will reshape markets and investment .............. 24
Energy market, macroeconomic and financing trends ................................. 26
A mixed year for the world economy ....................................................... 30
Unorthodox monetary policy continues to affect investment ................. 32
Sources of energy finance are becoming increasingly diverse ................. 34
2. Investment in end use and efficiency ........................................ 37
Highlights .................................................................................................. 37
Overview ................................................................................................... 38
Investment in energy-using assets .............................................................. 38
Investment in industrial capacity is on the wane ..................................... 39
A huge wave of construction begins to break .......................................... 41
Household energy demand in OECD countries has peaked ..................... 42
Investment in energy efficiency .................................................................. 43
Spending on efficiency continues to grow ................................................ 43
Energy performance standards are driving efficiency investment .......... 45
Energy efficiency investment closely linked to consumer spending ........ 46

10 Table of contents
New sources of energy efficiency financing are emerging ....................... 47
Focus on transport ..................................................................................... 47
Low oil prices are encouraging people to drive more… ........................... 47
… and buy thirstier cars ............................................................................. 49
New measures are needed to accelerate fuel economy gains ................ 51
Are electric cars coming of age? ............................................................... 53
New airplanes are more fuel-efficient than ever before .......................... 56
Energy service price index .......................................................................... 57
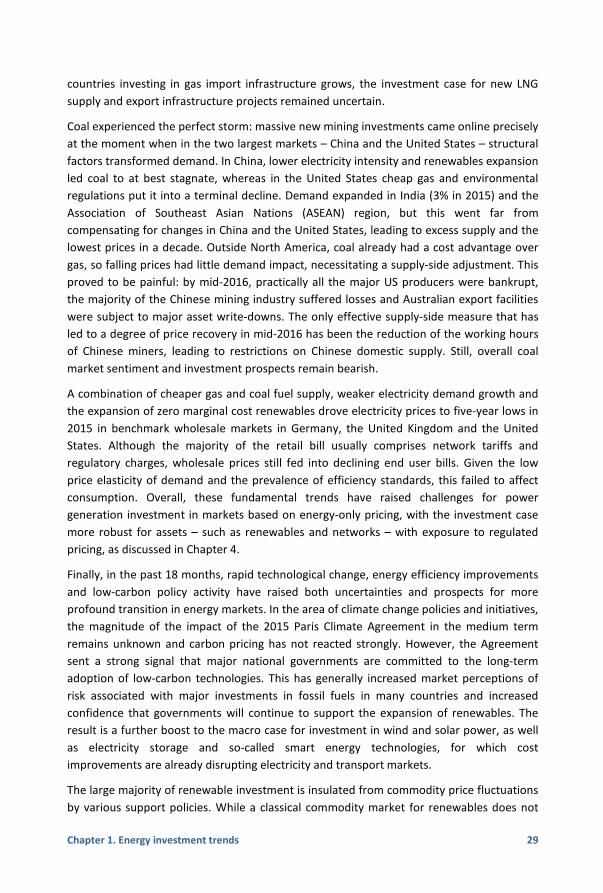
The cost of lighting declines despite higher power prices........................ 58
Fuel prices matter more than efficiency to water heating costs.............. 59
Driving costs fall with lower fuel prices and more efficient cars .............. 60
3. Investment in oil, gas and coal .................................................. 65
Highlights .................................................................................................. 65
Overview ................................................................................................... 66
Upstream oil and gas ................................................................................. 69
Upstream operators slash spending as prices plunge .............................. 69
Exploration investment is hit hardest ....................................................... 71
Oil and gas companies slash spending across the board .......................... 73
The extent of spending cutbacks varies widely across regions ................ 75
Upstream oil and gas costs down 30% since 2014 ................................... 79
Lower costs are the biggest contributors to lower investment ............... 84
Investments in oil midstream infrastructure ............................................... 86
Oil transport and storage investment prove to be sticky ......................... 86
North America sees a boom in oil infrastructure building ....................... 86
Oil storage attracts financing globally ....................................................... 87
Demand growth drives investment in the emerging economies ............. 88
Investment in oil refining ........................................................................... 89
Asia dominates refining investment ......................................................... 90

Table of contents 11
Financing in the oil and gas sector .............................................................. 91
Upstream ................................................................................................... 91
Financing midstream and refinery projects .............................................. 95
LNG chains ................................................................................................. 95
Spending on liquefaction falls back as projects reach completion .......... 96
Regasification capacity rises steadily ........................................................ 98
Coal ......................................................................................................... 100
4. Investment in electricity and renewables ............................... 105
Highlights ................................................................................................ 105
Overview ................................................................................................. 106
Low-carbon sources and networks dominate investment ..................... 106
Asia absorbs more and more investment ............................................... 110
Regulation plays a bigger role in managing market risk ......................... 110
Divergent financing trends shape power companies’ capacity to invest115
Renewables-based power generation ...................................................... 122
Lower costs drive investment ................................................................. 123
A diverse regional investment picture for renewables .......................... 127
Renewables asset financing dips in 2016 ................................................ 132
Fossil fuel power generation .................................................................... 134
The economics of fossil-based generation diverge regionally ............... 135
Fossil fuel power investment trends in key regions and countries ........ 138
Nuclear power ......................................................................................... 146
Electricity networks ................................................................................. 148
Replacing old distribution lines takes a rising share of grid spending .... 148
Network investment trends in key regions and countries ..................... 150
Smart grids, electricity storage and electric vehicle charging infrastructure152
5. Implications of current investment trends .............................. 159
Highlights ................................................................................................ 159

12 Table of contents
Energy commodity markets ..................................................................... 160
Energy security and access ....................................................................... 160
The transition to low-carbon electricity .................................................... 161
Meeting energy security, sustainable development and climate goals ...... 165
Lists of figures and tables ........................................................... 167
Abbreviations and acronyms ...................................................... 171
Units of measurement ............................................................................. 172
List of boxes Box 2.1 • Measuring investments in energy efficiency ......................................44 Box 2.2 • Money is power: vehicle pricing and efficiency .................................51 Box 2.3 • Low-speed electric vehicles, 2-wheelers and electric buses ..............54 Box 2.4 • Government policy has driven electric vehicle sales in Norway ........55 Box 3.1 • Measuring investment in oil, gas and coal .........................................68 Box 3.2 • Separating out oil and gas in upstream investment ...........................70 Box 3.3 • Is the upstream industry heading towards a shortage of skilled
personnel? ..........................................................................................85 Box 3.4 • Was North America’s shale gas and tight oil revolution a
financial bubble? .................................................................................93 Box 3.5 • The expansion of Chinese gas infrastructure .....................................99 Box 3.6 • Transportation infrastructure is key to understanding the economics
of coal- and gas-fired power generation ..........................................102 Box 4.1 • Guide to the electricity investment estimates .................................107 Box 4.2 • New York reforms foresee greater role for decentralised
energy ...............................................................................................114 Box 4.3 • The role of public financial institutions in clean energy
financing .........................................................................................121 Box 4.4 • Corporate buying a growing driver of renewables investment ........131 Box 4.5 • Is divestment of coal-fired generating assets impacting
the ability to finance new plants? .....................................................141 Box 4.6 • A difficult climate for conventional power investment in
Europe ...............................................................................................144 Box 4.7 • Could decentralised renewables and batteries make future
network investment redundant? ......................................................154 Box 5.1 • Just one new CCS project is commissioned in 2015 .........................165

Executive summary 13
Executive summary
Global energy investment in 2015 amounted to United States dollar (USD) 1.8 trillion, down 8% (in real terms) from 2014 mainly due to a sharp fall in upstream oil and gas investment. After three years during which the United States was the largest destination for investment in energy supply, the People’s Republic of China (hereafter, “China”) retook the top position in 2015, largely due to the record level of electricity sector investment in China and the decline of US oil and gas investment. The rebalancing and slowdown of the Chinese economy, which are curbing the country’s energy needs, are having a major impact on energy investment globally, largely as a result of lower demand growth for oil, gas and coal. In mature economies such as Europe, Japan and the United States the dominance of the services sector is weakening the link between energy demand and growth in gross domestic product (GDP). These structural changes are reinforced by investment in energy efficiency, which reached USD 220 billion globally in 2015. Given that the majority of upstream oil and gas and almost 40% of electricity sector investment is aimed at replacing ageing assets, substantial investment is essential to maintaining supply security even as macroeconomic and energy policy developments slow demand growth globally. Oil and gas still represent the largest single category of global energy investment, accounting for over 45% of the total. Investment in the electricity sector rose to a record USD 680 billion, or over 37% of the total, despite a marked slowdown in demand growth, driven primarily by the expansion of renewables and networks.
Fossil fuels continue to dominate energy supply, but the composition of investment flows points towards a reorientation of the energy system. Oil, the largest primary energy source, slightly increased its share of the global energy mix, but its share of global energy investment declined as the industry reacted to a sharp fall in prices since late 2014 with cuts in capital expenditure, most notably in North America. Unlike oil, gas demand growth remained subdued due to the slowdown of electricity demand and the expansion of renewables that contributed to a fall in gas-fired power generation investment. In addition, low oil and gas prices have also led to cuts in investment in upstream and transportation infrastructure, with most major gas infrastructure projects in East Africa and the Eurasian region facing delays. Coal demand has declined, largely because of China and the United States, but coal has retained its position as the world’s second-largest primary fuel. China continued the restructuring of its mining industry, which represents half of global supply, in order to reduce excess capacity. Investment in coal globally is increasingly affected by climate policy, which is expected to drive down demand especially in Europe and the United States. On the other hand, Indian coal production continues to be supported by strong investment. Renewables are expanding rapidly but asymmetrically: wind, solar and hydropower and are reshaping the electricity system. In USD terms

14 Executive summary
renewable investment has remained relatively stable since 2011, but investment supports an accelerated production expansion due to declining technology costs. On the other hand, with the exception of solar heat in China, the investment in biofuels and renewable heat remains minor.
Upstream oil investment remained robust in the Russian Federation (hereafter, “Russia”) and the Middle East, helping to push up the share of national oil companies (which dominate production in those regions) in oil and gas upstream investment to an all-time high of 44%. The relatively low cost of developing reserves in these regions and currency movements that mitigated the fall in the dollar oil price helped to support investment there. While the Middle East produces over one-third of the world’s oil, it accounted for only 12% of global upstream investment due to exceptionally low drilling costs. In Russia, capital spending even increased in ruble terms, helping to stabilise Russian production at a post-Soviet high.
The impact of low oil prices on cash flow tested the debt-financed investment model of the US shale oil industry, leading to a particularly sharp fall in investment of 52% in that sector in the past two years. The shorter investment cycle of shale projects and the widespread use of futures hedging has enabled independent shale producers to rely on a highly leveraged business model, in contrast to major oil and gas companies that rely predominantly on internal cash flow for investment. Access to bond markets for US shale companies and the cost of capital are directly influenced by oil prices. While financial pressures in the shale industry remain widespread, despite a recent partial recovery in oil prices, the operators that have filed for bankruptcy represent only a minor proportion of total US non-conventional production.
Unit capital costs of supply declined across the energy spectrum, with average cost reductions in 2015 ranging from 3% in the case of onshore wind to 30% for US shale oil and gas. These cost changes are reshaping competition between fuels and technologies. Projects representing over half of total energy investment experienced significant cost declines, notably solar photovoltaic (PV), upstream oil and gas, and electricity storage. While technology improvements and learning-by-doing effects were the dominant drivers, excess capacity in the supply chain also played a major role in pushing down costs, especially for upstream oil and gas. Upstream costs may rebound if investment experiences a cyclical upturn. Some other technologies, such as nuclear power, carbon capture and storage (CCS) and energy-efficient building renovations – whose costs are benefiting less from modularity and learning by doing, risk falling behind in the future, especially if project management risks affect financing.
Cost deflation, efficiency improvements and reduced activity levels are the key contributors to the steep fall of upstream oil and gas costs, but this trend may not be sustainable in the case that demand for services and equipment picks up rapidly. Globally, cost reductions explain almost two-thirds of the fall in investment spending, with reduced activity accounting for the rest. At its current level, investment may be insufficient to maintain oil and gas production, indicating tighter markets ahead with different time

Executive summary 15
horizons. Given that the impact of wind and solar investment on gas-fired generation is far stronger than the competition to oil in transport from alternative technologies, oil markets are likely to rebalance before gas markets, with low-carbon investment putting a lid on gas demand. Nevertheless, the looming collapse in investment in liquefied natural gas (LNG) from 2017, which will result from a lack of final investment decisions on new projects, points to a tightening of LNG markets and potential supply security concerns in the coming years.
Energy efficiency investment increased by 6% in 2015 despite falling energy prices. Nevertheless, low oil prices risk derailing fuel efficiency improvements in the transport sector, especially in countries with low taxes. Lower oil prices have had a visible impact on vehicle markets in some regions. The rate of fuel economy improvements in new light-duty vehicle sales slowed by two-thirds in the United States and stagnated in India although it continued to accelerate in China. Reaching fuel economy targets will require robust efficiency standards, which can be reinforced by price incentives such as excise taxes and reduced fossil fuel subsidies. Despite lower oil prices, sales of electric cars (and investment in recharging infrastructure) continue to increase rapidly, driven by government policies in a growing number of countries. They are helping to offset the slowdown in fuel economy in the United States. Investment in other types of energy efficiency is proving resilient to declining fossil fuel prices. Investment in more energy-efficient appliances and equipment is driven mainly by standards and mandates as well as dedicated sources of financing. For energy services such as residential lighting standards have improved the efficiency of lightbulbs so much that the cost of lighting has generally fallen since 2005, despite increases in electricity prices of up to 50% in some countries.
A major shift in investment towards low-carbon sources of power generation is underway. New low-carbon generation – renewables and nuclear – from capacity coming online in 2015 exceeds the entire growth of global power demand in that year. Renewables investment, primarily in wind, solar PV and hydropower was almost USD 290 billion. Technological progress and economies of scale are driving down the cost of renewables. The average carbon intensity of power generation from new capacity worldwide continued to fall, reaching 420 kilogrammes of carbon dioxide (CO2) per megawatt-hour in 2015. While this decline has been a factor in the stagnation of global CO2 emissions over the past two years, the current pace of decarbonisation of power generation remains insufficient to meet the climate goal of keeping average temperature increases below 2°C, necessitating stronger policy support. This can draw on recent experience with ramping up investment in and mobilising cheap financing sources for low-carbon energy sources such as long-term contract auctions for renewable energy capacity. Nuclear power investment reached its highest level for two decades in 2015, largely due to the expansion in China, where new nuclear capacity is reducing the need for coal-fired generation. But low wholesale prices, weak carbon price signals and project management problems continue to hinder nuclear investment in Europe and North America, sometimes making even lifetime extension investment uneconomical.

16 Executive summary
Higher fuel transportation costs and infrastructure bottlenecks are limiting the competitiveness of gas-fired power generation compared to that of coal in Asia. In most importing countries, LNG infrastructure to a gas-fired power plant requires twice as much investment as the plant itself. Coal-to-power supply chains are considerably less capital-intensive. Coal mining and transportation infrastructure absorbs only 4% of global energy investment, yet coal meets 28% of global primary energy demand. Given Asia’s reliance on long-distance imports, high transportation costs put gas at a competitive disadvantage to coal across the region. Rapid growth in electricity demand, as well as energy security and cost considerations, are continuing to drive large investments in coal-fired capacity in India and the region of the Association of Southeast Asian Nations (ASEAN). On the other hand, gas is the preferred generating option in areas with abundant low-cost resources, such as North America, the Middle East and Russia. In the United States, its cost advantage is reinforced by environmental and climate regulations.
With recent investment in renewables-based and nuclear power capacity now largely covering electricity demand growth, signs of overinvestment in coal-fired generation have emerged in China. Macroeconomic restructuring and large-scale energy efficiency investments have put Chinese electricity demand on a structurally slower growth trajectory. Despite a decline in the average utilisation of coal-fired plants, over 70 GW of new projects started construction in 2015. With nearly 200 GW of capacity under construction in the first half of 2016, some coal-fired generators may face further reductions in operating hours and increased difficulty in recovering their capital costs. The Chinese government has since introduced measures to prevent further overinvestment.
Around 95% of power generation investments rely on vertical integration, long-term contracts or price regulation to manage risks. The role of wholesale price signals in driving investment in power generation is declining. Utility-scale renewables benefiting from long-term fixed-price contracts or regulated pricing is the largest and fastest-growing component of power generation investment worldwide, representing over half of the total. Consumer-led spending under new business models – including distributed solar PV for households and businesses and corporate buying of renewable power – accounted for over USD 50 billion of renewable investment, led by the United States, Europe and Japan. In North America, low gas prices and the retirement of coal-fired stations are still supporting market-based investment in new conventional generating capacity. Liberalisation is driving investment in Japan. On the other hand, conventional power generation investment has essentially come to a halt in Europe, where the effect of low wholesale prices is being reinforced by the financial weakness of many utilities. Given the looming decommissioning of a large amount of coal, nuclear and even gas capacity in the European Union, energy security concerns are on the rise. Investment in electricity storage is growing but, at USD 10 billion in 2015, remains nowhere near big enough to allay fears of a shortfall in dispatchable capacity. In non-OECD countries, investment in conventional generation generally remains strong, dominated by state-owned utilities and independent power producers contracting with them. The growth in coal-fired capacity remained strong in developing Asia, with over 75 GW starting operation in 2015 – as much as all renewable

Executive summary 17
capacity additions in the region combined. In sub-Saharan Africa, however, investment remains wholly inadequate to eliminate energy poverty: with 15% of global population and more than half the people without access to electricity, this region represents only 1.5% of global electricity investment. In all regions, a credible investment framework is critical to ensure enough investment to maintain system adequacy and ramp up low-carbon production.
The growing role of decentralised renewables production does not eliminate the need for continuing investment in the electricity network, given the limited prospects for large-scale electricity storage in the medium term. In fact, renewables investment often requires additional network investments in order for it to be integrated effectively into the system. The over USD 260 billion invested in electricity networks globally in 2015 is a crucial component of energy security. Almost all of this is subject to regulation, reinforcing the importance of a stable and transparent regulatory environment to maintain adequate investment.
Although energy markets around the world are generally well supplied at present, investment trends warn against complacency about energy security. The cuts in upstream oil and gas investment disproportionately affect regions where geopolitical risk is low. While there have been major improvements in project management that have helped to lower costs, there are concerns about the industry’s ability to quickly ramp up investment should market conditions warrant it. Investment in inter-regional LNG chains and major pipelines is falling rapidly, in part a result of geopolitical constrains. Given the long lead times of these projects, this decline raises concerns about the adequacy of supply infrastructure in the years to come. In the electricity sector, wind and solar are now meeting a substantial proportion of the growth in demand in annual production volumes, but integrating them effectively into the power system requires additional investment and changing operational methods across the electricity system. In many countries, there is a policy debate about the ability of the current regulatory institutions to achieve this. Investment in flexible types of electricity generation, such as gas power, is crawling to a halt in Europe and there are emerging uncertainties about its prospects in North America. In emerging markets such as Mexico and India, long-term contracts are helping to mobilise investment in renewables, but difficulties in upgrading the grid in order to integrate them into the system persist. Investment in transmission lines is critically dependent on the regulatory framework and often faces licencing obstacles. For systems where variable renewables account for a large and growing share of the power generation mix, investment in both electricity storage and smart demand-response solutions will need to expand substantially. A consistent, investment-friendly policy and regulatory environment remains crucial for maintaining energy security.
Globally, energy investment is not yet consistent with the transition to a low-carbon energy system envisaged in the Paris Climate Agreement reached at the end of 2015. While wind, solar PV and electric-vehicle investments are broadly on a trajectory consistent with limiting the increase in global temperature to 2°C, investment in other low-carbon

18 Executive summary
technologies is falling behind. In several countries, nuclear capacity is ageing with little investment going to replacement capacity, and renewables are struggling to compensate for reduced nuclear output. Large-scale investment in CCS has yet to take off. On the demand side, economically viable alternatives to oil have yet to emerge in aviation, heavy-duty transport and shipping, which collectively account for the bulk of oil consumption. And large investments are still being made in highly inefficient subcritical coal plants, which risk locking in carbon emissions for decades. A combination of accelerated technological innovation and an investment framework aimed at encouraging rapid, large-scale deployment of low-carbon technologies will be essential to steer the transformation of the energy system in a timely way in order to jointly achieve climate and energy security objectives.

Introduction 19
Introduction
A new annual report on global energy investment
This new International Energy Agency (IEA) report, World Energy Investment, quantifies in a comprehensive manner the state of investment in the energy system across technologies, sectors and regions. It also assesses the drivers and challenges of financing this investment and considers the implications for some key energy market themes confronting today’s decision makers. The report complements the projections and analysis of the annual IEA World Energy Outlook and Energy Technology Perspectives, as well as its series of annual medium-term reports for the major energy sectors. The aim is to help policy makers formulate cost-effective energy policies that are compatible with energy security and sustainability objectives and assist businesses and private individuals to make informed investment decisions.
The focus of the discussion in this report is on what happened in 2015 and how that compared with previous years. The report also highlights key trends observed in 2016 to the extent that reliable data are available.
The report is organised as follows:
Chapter 1: summary of the overall findings for energy investment and recent energy market trends, and the macroeconomic and financial backdrop influencing investment activity.
Chapter 2: energy end use, including new infrastructure; more efficient goods; transport efficiency and electric vehicles; and price trends for energy services.
Chapter 3: fossil fuel supply, including upstream oil and gas; pipelines, refining and infrastructure for liquefied natural gas (LNG); and coal mining.
Chapter 4: the power sector, including renewables; fossil fuel generation; nuclear generation; and electricity networks and storage.
Chapter 5: assessment of the potential impact of investment on energy markets and the implications for meeting energy security and climate change objectives.
Defining and measuring energy investment
The way investment is measured across the energy spectrum varies, largely because of differences in the availability of data and the nature of expenditures. This report aims to ensure that estimates are consistent and comparable across sectors. In most cases, investment is defined as overnight capital expenditures (“capex”) on new assets. For some

20 Introduction
sectors, such as power generation, this investment is attributed to the year in which a new plant or the upgrade of an existing one becomes operational. For other sources, such as upstream oil and gas and LNG projects, where sufficient capex data are available, investment reflects the capital spending incurred over time as production from a new source ramps up to maintain output from an existing asset.
For energy efficiency, the measurement task is more complex. Much of the expenditure is by consumers for whom purchases of more efficient goods are not investments per se. In this report, investment in energy efficiency includes incremental spending by companies, governments and individuals to acquire equipment that consumes less energy than that which they would otherwise have bought. Due to the different methodologies available, this estimate of energy efficiency investment is not definitive but is included to provide a comparison with the scale of investment in energy supply. Fossil fuel and power sector investments are those that raise or replace energy supply, while energy efficiency investments are counted as those that reduce energy demand.
Investment estimates are derived from IEA data for energy demand, supply and trade, and estimates of unit capacity costs, IEA analysis of which benefits from extensive interaction with industry experts. By default, investment data are given in year 2015 US dollars, adjusted using country-level gross domestic product (GDP) deflators and 2015 exchange rates. Unless otherwise stated, all time series and historical comparisons are presented in real dollar terms, adjusted for inflation.
Overall, this approach to investment represents an approximation of real-world practice. In reality, varying time lags and spending patterns characterise the period between the final investment decision and the operation of an energy project. As such, where available, estimates of capital spending and financing activity are also provided to give a more complete picture of the turnover of the energy asset base as well as decisions to commit new capital, for example, to projects that will come online in 2016 or later. While other areas of spending – including operation and maintenance, research and development, financing costs, mergers and acquisitions or public markets transactions – remain important for energy sector development, they are not included in the investment methodology of this report.
A more detailed explanation of the methodology used in each sector can be found at the start of each chapter (2-4).1
1 A discussion of the methodology can also be found at www.iea.org/investment.

Chapter 1. Energy investment trends 21
1. Energy investment trends
Highlights
Global energy investment amounted to USD 1.8 trillion in 2015, making up 2.4 % of global GDP. Investment in real dollar terms was 8% lower than in 2014, mainly due to a 25% plunge in capital spending in upstream oil and gas.
The oil and gas sector remained by far the largest recipient of investment, accounting for 45% of total energy investment. The upstream sector alone absorbed more than USD 580 billion – almost one-third of the total – and the rest of oil and gas sector USD 250 billion, or 14%. Coal mining and infrastructure investment was USD 70 billion, or 4%.
Investment in power generation totalled USD 420 billion, of which renewables accounted for nearly 70%. Investment in transportation and distribution networks was USD 460 billion, with the majority – USD 260 billion – going to electricity and USD 195 billion to pipelines and LNG facilities. Coal, nuclear, renewable heat and biomass accounted for the rest of supply-side investment.
USD 220 billion, or 12%, was invested into energy efficiency. Just over 50% of this was spent on improving building efficiency including household appliances, an area where the increasing coverage of regulatory standards is curbing demand growth in mature markets. Spending on efficient transport increased to over USD 60 billion. While the impact of low oil prices on new vehicle efficiencies was noticeable, it did not derail the trend towards better fuel economy.
Investment costs in 2015 declined across the energy spectrum, heavily in some cases, moderating the impact from capacity additions. Upstream oil and gas costs fell on average by 15%, negating much of the drop in dollar spending. Renewable cost reductions were comparable though varied greatly by technology, with onshore wind costs falling 3% and utility solar photovoltaic costs by 19%. Initial data point to further cost deflation in 2016. Big differences in the pace of cost declines across sectors and technologies are reshaping inter-fuel competition.
The vast majority of oil and gas upstream investment is directed at replacing natural production declines while almost 40% of electricity investment was directed to the replacement of ageing assets. As a result, the investment needed to maintain supply security is only weakly affected by changes in demand growth. Investment in new capacity to meet rising demand is declining as a share of the total with a deceleration of energy demand growth – primarily the result of declining energy intensity and slower growth, especially in China. A structural shift towards services and rapid improvements in energy efficiency are holding down Chinese energy demand. India is the only major economy where accelerating economic growth has boosted energy demand. Loose monetary conditions and low interest rates continue to support investment across the energy system.

22 Chapter 1. Energy investment trends
Global energy investment trends
A slump in capital spending on energy, mainly due to lower costs
Total energy investment worldwide in 2015 is estimated to have amounted to just over United States dollar (USD) 1.8 trillion,2 accounting for 2.4% of global gross domestic product (GDP) (Figure 1.1). Investment in real dollar terms was 8% lower than in 2014, mainly due to a sharp decline in capital spending in upstream oil and gas.
Figure 1.1 • Global energy investment in 2015
Excluding energy efficiency, global investment in energy supply totalled over USD 1.6 trillion, down nearly 10% (Figure 1.2, Table 1.1). Oil, gas and coal supply remained the biggest recipient of supply-side investment, totalling USD 900 billion, though its share of total energy investment dropped to 55% from over 60% in 2014. In absolute terms, the largest declines took place in the North American upstream oil and gas sector. Investment in the power sector, including generation capacity, transmission and distribution (T&D) networks and storage, reached a record USD 680 billion in 2015, up 4% on 2014 and 80% higher than a decade prior. Electricity’s share of total energy supply investment rose to 42% in 2015, compared with less than 40% during the past five years. This trend partly reflects the rising role of electricity in total final energy consumption, but also underlying cost and activity changes in both power and fossil fuel supply. Renewable energy investment
2 Unless otherwise stated, economic and investment numbers cited in this report are presented in real USD (2015), converted at market exchange rates.
Coal
Oil & GasUpstreamDownstream and infrastructure
Electricity networks
Energy efficiency
Power generationConventional generationRenewables generation
Renewables transport and heat
USD 1.8 trillion
1%
32%
14%
7%
16%
4%
46%
14%
12%
23%

Chapter 1. Energy investment trends 23
reached nearly USD 315 billion, 17% of the total. Over 90% of this investment went to power generation technologies, the rest going to solar thermal heating installations and biofuels for transport.
Figure 1.2 • Global investment in energy supply over time
On the demand side, investments in improving energy efficiency reached USD 220 billion in 2015. At USD 118 billion, buildings efficiency occupied the largest share, driven mainly by regulations such as minimum performance standards. While total investments aimed at improving efficiency are equivalent to just 14% of total investment in energy supply, their impact is larger given that a significant proportion of supply-side investments simply replace obsolete or retired capacity, while efficiency gains are more durable.
The pronounced drop in investments in energy supply in 2015 to their lowest level since 2010 was largely due to big declines in unit costs – especially for upstream oil and gas, renewables and some major demand-side technologies. Upstream oil and gas costs fell on average by 15%. Renewable cost reductions were also big in some cases, though varied greatly by technology; for example, onshore wind costs fell by 3%, while utility solar photovoltaic (PV) costs plunged by 19%. Cost deflation, which resulted from both technological advances and competitive pressures, continued into 2016 (Figure 1.3).
The IEA estimates that cost deflation accounted for approximately two-thirds of the overall decline in upstream investment (See Chapter 3). In addition, in some cases, such as the Russian Federation (hereafter “Russia”) and Japan, investment was lower in 2015 dollar terms due to depreciation of the local currency; as a result, each dollar of investment generally yielded a greater amount of supply capacity, offsetting to some degree the impact of the overall decline in investment.
As a result of cost deflation and the relative strength of the US dollar, the investment data in nominal terms for 2015 overestimate the impact of oil and gas upstream capital
0%
10%
20%
30%
40%
50%
60%
70%
80%
0
200
400
600
800
1 000
1 200
1 400
1 600
1 800
2 000
2000 2003 2006 2009 2012 2015
USD
(201
5) b
illio
n T&D networks
Nuclear
Renewables
Fossil fuel powergeneration
Oil, gas, coal (supply)
Oil, gas, coal in totalinvestment (%)
Right axis:

24 Chapter 1. Energy investment trends
expenditure cuts and underestimate the growth of renewables spending on productive capacity (see Chapters 3 and 4). For example, in real dollar terms 2015 solar PV investment was lower than in 2011, but 60% more capacity was added. Furthermore, the investment totals that include major projects, such as liquefied natural gas (LNG) projects in Australia, Canadian oil sands, and coal- and gas-fired power plants in Europe, reflect spending committed to long lead time projects that were launched under market conditions that were much more optimistic with respect to the price outlook and investment returns than when those projects were finally completed. In those sectors, investment is likely to fall in the coming years in the absence of a marked change in market conditions or government policies, as ongoing projects are completed and few new ones are being developed.
Figure 1.3 • Cost developments across the energy spectrum
Changes in relative costs will reshape markets and investment
The causes of cost deflation vary according to the type of technology and sector. In some cases, the factors that have pushed down costs are likely to be permanent, such as technology improvements and economies of scale. This is the case for light-emitting diodes (LEDs) used for lighting, for grid-scale batteries and for solar PV, which have benefited from learning by doing. In other cases, notably upstream oil and gas, cost deflation has resulted partly from overcapacity and competitive pressures. As a result, if (or when) oil and gas investment picks up, upstream costs may increase somewhat as service companies and suppliers of material and equipment regain pricing power. In general, IEA medium-term analyses foresee lower costs in renewables, lighting and electricity storage and eventually modest cost increases in upstream oil and gas.
0
20
40
60
80
100
120
2008 2009 2010 2011 2012 2013 2014 2015 2016
2008
= 1
00
Upstreamoil and gas
Onshorewind
Grid-scalebatteries
Solar PV -utility scale
LEDs
g

Chapter 1. Energy investment t25
Table 1.1 • Investment in fossil fuel and electricity supply by region
Note: Investment is defined as overnight capital expenditures on new assets. See Introduction section. Renewables for transport and heat include biofuels for transport and solar thermal heating installations.
USD 2015 billion
Oil and gas Coal Power generation Renewables
transport and heat
Electricity networks
TOTAL
Upstream Downstream
and infrastructure
Mining and infrastructure
Coal, gas and
oil Nuclear Renewables
OECD 246 109 17 22 2 153 7 113 669
Americas 193 62 6 7 0 52 1 58 380
United States 136 46 4 5 0 39 1 49 281
Europe 46 19 3 11 0 64 6 39 187
Asia Oceania 7 28 8 4 2 36 0 15 102
Japan 0 4 1 1 0 30 0 7 43
Non-OECD 337 117 46 89 19 136 17 150 911
Europe/Eurasia 67 23 6 3 5 2 0 16 122
Russia 44 18 5 2 5 1 0 9 83
Non-OECD Asia 87 30 36 73 15 110 15 108 473
China 51 9 26 43 15 90 15 66 315
India 7 4 7 18 0 10 0 20 66
Southeast Asia 22 11 3 11 0 7 0 10 64
Middle East 73 44 0 5 0 2 0 8 132
Africa 49 8 2 5 0 4 1 7 77
Latin America 61 13 1 1 0 17 1 11 107
Brazil 33 5 0 0 0 10 1 6 55
World 583 249 68 111 21 288 39 262 1607
European Union 15 17 2 9 0 56 3 39 141
Chapter 1. Energy investment trends
25

26 Chapter 1. Energy investment trends
As some key technologies do not directly compete on price, it is difficult to predict the impact of trends in cost deflation on inter-fuel competition. It is plausible that technologies that have not experienced cost declines in recent years could lose market share, leading to lower investment. For example, major improvements have yet to be seen in cost expectations for carbon capture and storage (CCS), nuclear energy and some renewable technologies, such as biofuels. Similarly, renovations of buildings that result in improved energy efficiency (building retrofits) have not experienced a big fall in costs. Modularity and standardisation are important drivers of learning by doing, but achieving them is hard in the case of complex individual projects. The investment outlooks for CCS, nuclear and building retrofits may be further weakened by competition from renewables, storage and new sources of gas that have recently become much cheaper.3 Equally, some renewable technologies with higher capital costs, such as solar thermal electricity or offshore wind, may be disadvantaged by cost declines in solar PV, onshore wind and other established renewable energy technologies, increasing the need for policy support.
On the demand side, changes in costs and market prices could have a knock-on effect on prospects for investment in energy efficiency. For example, the fall in oil prices since 2014 has triggered a shift in consumer demand towards more powerful and thirstier cars in some countries, driving up oil consumption. Lower prices and changing consumer attitudes could also lead carmakers to scale back efforts to develop and market more efficient vehicles.
Energy market, macroeconomic and financing trends Investment trends in 2015 were shaped by underlying shifts in energy market and macroeconomic variables, which influence both the demand for energy and the ability to finance capital spending. Among the most important drivers were the plunge in oil prices, which dragged down consumer spending on energy and reduced sharply the earnings of the major oil and gas exporters, the rebalancing of the economy of the People’s Republic of China (hereafter, “China”) and the resulting impact on energy demand, the continuation of unorthodox monetary policy and resulting very low interest rates.
Market developments in 2015 to mid-2016: Is cheap energy back with a vengeance?
After several years in which price increases were the dominant expectation, the most influential development in energy markets in 2015 and 2016 was the continuation and acceleration of price declines across fuels and regions. Oil, gas, coal and wholesale electricity prices in some markets all reached multi-year lows over the past 18 months (Figure 1.4). The fact that the price declines took place in a relatively benign
3 This will be analysed in detail in the forthcoming World Energy Outlook 2016 and in Energy Technology Perspectives 2017.

Chapter 1. Energy investment trends 27
macroeconomic environment rather than a financial or economic crisis reinforced their impact on investment since it increases the likelihood that the changes driving the price declines are structural rather than driven by the macroeconomic cycle.
Figure 1.4 • Key energy fuel and electricity price benchmarks (January 2010-June 2016)
Note: NBP = National Balancing Point; MBtu = million British thermal units.
Source: Bloomberg LP (2016), Bloomberg Terminal.
Price declines were very pronounced for oil and fell below USD 30 per barrel in January 2016, a level previously associated with a deep financial crisis. While a demand slowdown during the period of high prices did play a role, there is little doubt that the price collapse unfolding from mid-2014 was primarily supply-driven: key factors include the high level of investment undertaken in new projects over the previous years, the ramp up and resilience of US light tight oil production and the decision of the Organization of the Petroleum Exporting Countries (OPEC) to prioritise market share being the dominant factors. Excess production led to a significant stock accumulation in countries of the Organisation for Economic Co-operation and Development (OECD). Among the energy commodities whose price declined, only the oil market experienced a significant upturn in demand over the course of few months. During 2015, successive IEA Oil Market Reports revised the 2015 demand assessment up by 1.3 million barrels per day (mb/d) or 1.4% of global oil demand (IEA, 2016). The largest component of the demand reaction was gasoline in North America and predominantly came from the utilisation of the existing car fleet. There was also a visible impact on the composition of new cars sold, as explained in Chapter 2, but this will have a longer-term impact on demand and would take a decade of cheap oil to negatively affect the entire fleet. It seems that by 2016 the demand stimulus impact of low prices weakened. On the supply-side, the industry reacted with major investment cuts (Chapter 3) of which only the investment decline in US tight oil production had an impact during the
0
4
8
12
16
20
24
Jan-10 Jul-11 Jan-13 Jul-14 Jan-16
USD
/MBt
u
Oil, gas and coal prices
Brent Henry Hub NBP
Asian LNG (spot) Qinhuangdao
0
20
40
60
80
100
120
140
Jan-10 Jul-11 Jan-13 Jul-14 Jan-16
USD
/MW
h Wholesale electricity prices
United States (PJM) Germany United Kingdom

28 Chapter 1. Energy investment trends
year. US oil production peaked in April 2015 and declined by over 1 mb/d by the summer of 2016. The rest of the investment cuts resulted in delays of long lead time projects and higher decline rates of already-producing assets, neither of which will have a major impact on markets before the end of the decade.
Infrastructure barriers segment natural gas markets. Given that the very first US LNG cargo only left the US Gulf Coast around the end of 2015, North American gas markets were effectively disconnected from the rest of the world in 2015 and the first part of 2016. LNG arbitrage creates a certain link between Europe and Asia, the two major importing regions, but due to contract rigidities and market imperfections this is much less smooth than inter-regional oil arbitrage.
In North America, prices in 2015 and the first half of 2016 were close to record lows, at around or below 2 USD per MBtu. While cheap gas in North America is not a new phenomenon, what surprised many market participants was the ability of the industry to maintain supply when oil and gas prices declined simultaneously. In previous episodes of below 2 USD per MBtu prices, US gas production strongly benefited from high oil prices by shifting drilling to formations with associated liquids. This resilience was due to a combination of cost declines and the concentration of drilling in the uniquely favourable Marcellus shale. Low gas prices triggered a sizeable coal to gas switch in power generation – 200 terawatt-hours (TWh) or an additional 20% of gas generation – increasing US gas demand by 2%. Despite its remarkable resilience, US gas production eventually started to decline in the first half of 2016, calling the sustainability of the current market situation into question.
In Europe and Asia, cheap gas is a much more recent phenomenon and has so far failed to trigger a measurable demand response. Until recently, the very large gap between regional gas prices was a major competitiveness concern in Europe and particularly Asia. Declining prices in the importing regions are partly a result of lower oil prices due to the still widespread use of oil indexation. Nevertheless, gas prices started to decline in 2014 before the collapse of oil prices, driven by regional supply-demand fundamentals, primarily weak electricity demand and the robust expansion of renewables in China, Europe and Japan. The competitiveness of cheap coal in the face of low or non-existent carbon prices also contributed to limiting the gas demand upswing. As a result of the constraints on gas demand from both coal and renewables, the sentiment on natural gas being the “fuel of transition” in the global energy mix has cooled down rapidly over the past two to three years. Chinese LNG imports stalled in 2015 despite lower prices, although in 2016 partly due to stronger environmental policies favouring gas, an increase was observed. The conflict in Ukraine has not had any measurable impact on Russian exports to Europe, presently near a record high. The looser market conditions were evident even before the big wave of Australian and US LNG under construction started to come online and heralding abundant supply ahead. While the prospect of lower prices has increased the confidence of potential buyers and some new markets for gas will potentially open as the number of
Chapter 1. Energy investment trends 29
countries investing in gas import infrastructure grows, the investment case for new LNG supply and export infrastructure projects remained uncertain.
Coal experienced the perfect storm: massive new mining investments came online precisely at the moment when in the two largest markets – China and the United States – structural factors transformed demand. In China, lower electricity intensity and renewables expansion led coal to at best stagnate, whereas in the United States cheap gas and environmental regulations put it into a terminal decline. Demand expanded in India (3% in 2015) and the Association of Southeast Asian Nations (ASEAN) region, but this went far from compensating for changes in China and the United States, leading to excess supply and the lowest prices in a decade. Outside North America, coal already had a cost advantage over gas, so falling prices had little demand impact, necessitating a supply-side adjustment. This proved to be painful: by mid-2016, practically all the major US producers were bankrupt, the majority of the Chinese mining industry suffered losses and Australian export facilities were subject to major asset write-downs. The only effective supply-side measure that has led to a degree of price recovery in mid-2016 has been the reduction of the working hours of Chinese miners, leading to restrictions on Chinese domestic supply. Still, overall coal market sentiment and investment prospects remain bearish.
A combination of cheaper gas and coal fuel supply, weaker electricity demand growth and the expansion of zero marginal cost renewables drove electricity prices to five-year lows in 2015 in benchmark wholesale markets in Germany, the United Kingdom and the United States. Although the majority of the retail bill usually comprises network tariffs and regulatory charges, wholesale prices still fed into declining end user bills. Given the low price elasticity of demand and the prevalence of efficiency standards, this failed to affect consumption. Overall, these fundamental trends have raised challenges for power generation investment in markets based on energy-only pricing, with the investment case more robust for assets – such as renewables and networks – with exposure to regulated pricing, as discussed in Chapter 4.
Finally, in the past 18 months, rapid technological change, energy efficiency improvements and low-carbon policy activity have raised both uncertainties and prospects for more profound transition in energy markets. In the area of climate change policies and initiatives, the magnitude of the impact of the 2015 Paris Climate Agreement in the medium term remains unknown and carbon pricing has not reacted strongly. However, the Agreement sent a strong signal that major national governments are committed to the long-term adoption of low-carbon technologies. This has generally increased market perceptions of risk associated with major investments in fossil fuels in many countries and increased confidence that governments will continue to support the expansion of renewables. The result is a further boost to the macro case for investment in wind and solar power, as well as electricity storage and so-called smart energy technologies, for which cost improvements are already disrupting electricity and transport markets.
The large majority of renewable investment is insulated from commodity price fluctuations by various support policies. While a classical commodity market for renewables does not

30 Chapter 1. Energy investment trends
exist, an indirect price marker started to emerge: several countries run auctions for wind and solar capacity and the results are increasingly incorporated into investment and policy decisions. These auctions delivered a consistent price decline in 2015 and 2016. As discussed in Chapter 4, this is due to a combination of technology improvements, locations with better natural resources and a low cost of capital.
A mixed year for the world economy
The year 2015 saw a significant deterioration in global economic conditions. Global GDP growth dropped from 3.3% in 2014 to just 2.9% – its lowest level since 2009 (OECD, 2016). In the past four years, the near-term outlook for growth has been consistently revised downwards, reflecting persistent uncertainties over future macroeconomic conditions (Figure 1.5). Uncertainty typically discourages investment in capital-intensive projects with long lives.
Figure 1.5 • GDP projections by region, 2012-16
Note: Each dotted line represents the projection for GDP growth published in the given year in constant currency. Last year of actual data is 2015. Dynamic Asian Economies is a country grouping comprising Chinese Taipei; Hong Kong, China; Indonesia; Malaysia; the Philippines; Singapore; and Thailand.
Source: OECD (2016), Global Economic Outlook and Interim Economic Outlook.
Households in certain member countries of the OECD saw significantly reduced energy burdens due to a combination of energy efficiency gains and lower prices (Figure 1.6). With generally lower fossil fuel and electricity prices, annual energy spending fell in the United States, Japan and Germany. Electricity demand has low price elasticity, so as lower gas and coal prices helped reduce generation costs, consumer spending on electricity declined somewhat. The fall in total energy spending is dominated by motor fuel and thus reflects lower oil prices. At the same time, there was more evidence of a
100
110
120
130
2010 2012 2014 2016
GD
P in
201
0 =
100
OECD
Jun-12 Jun-13 May-14 Jun-15 Jun-16 Actual
100
110
120
130
2010 2012 2014 2016
Dynamic Asian Economies
100
110
120
130
2010 2012 2014 2016
World

Chapter 1. Energy investment trends 31
rebound of demand for transport fuels than for gas or electricity, which offset some of the reduction in motor fuel expenditure. Declining energy costs did help stimulate overall consumer spending, though weak consumer confidence and a preference for reducing debt levels mitigated this effect.
Figure 1.6 • Household spending on energy before and after the oil price decline
Sources: Adapted from US BEA (2016), National Income and Product Accounts, Personal Consumption Expenditures by Type of Product, dataset; Ministry of Internal Affairs and Communications Japan (2016), Annual Report on the Family Income and Expenditure Survey 2015; Agora Energiewende (2016), “The energy transition in the power sector: State of affairs 2015”.
In China, a sharp drop in economic growth and a shift in the economy away from heavy industry and towards less energy-intensive services, together with improvements in energy efficiency, drove down the rate of expansion in energy demand. At 6.9%, China registered its lowest annual rate of GDP growth this century. The impact on electricity demand was particularly marked: according to China’s National Bureau of Statistics, consumption grew by a mere 0.5% in 2015, compared with growth of between 6% and 18% annually between 2003 and 2013. The growth in household and service sector energy demand was largely offset by a slump in industrial demand (see Chapter 2). To the extent that the drop in demand in 2015 was to a large extent cyclical, energy demand would be expected to rebound in the coming years, albeit at a lower rate than in the previous decade with continuing structural economic adjustment. The rebalancing of the Chinese economy is far from over, given the persistence of excess industrial capacity, falling margins across most sectors and continuing expansion of the service sector.
Several major energy and commodity producers experienced a recession or an abrupt slowdown in economic growth in 2015 as a result of weaker energy prices and export revenues (Figure 1.7). In some cases, such as Russia, Brazil and especially Venezuela,
0
1 000
2 000
3 000
4 000
5 000
6 000
2013 2015 2013 2015 2013 2015
United States Japan Germany
USD
(201
5) p
er h
ouse
hold
Gas
Electricity
Motorfuel

32 Chapter 1. Energy investment trends
the impact of falling commodity prices was reinforced by political uncertainty and financial strains. Generally, however, investment across the oil and gas exporters remained robust, thanks to currency depreciation, which reduced the dollar cost of local inputs to production and offset to some degree the impact of lower oil and gas prices on profitability (see Chapter 3).
Figure 1.7 • Decline in oil and gas export revenues in 2015 as a percentage of 2014 GDP for six
major exporting countries
Source: Adapted from United Nations (2016), Comtrade Database; IMF (2016), World Economic Outlook Database; national statistical sources.
The impact of macroeconomic trends on low-carbon investment varies across sectors and countries. In the past, weaker macroeconomic prospects and fiscal pressures have tended to lead countries to pare back support schemes for renewables, as witnessed in Europe in 2012. However, there have also been cases where countries have reacted to weaker economic growth by introducing or expanding green stimulus programmes. As renewable investments are heavily influenced by government policies, they are generally less affected by the macroeconomic cycle. Some large economies, such as China and Japan, have so far sustained investment in low-carbon energy despite the economic slowdown thanks to attractive feed-in tariffs and other measures (see Chapter 4).
Unorthodox monetary policy continues to affect investment
Unusually low interest rates, combined with technological changes in energy production, continue to have a profound impact on investment in energy. Major central banks reacted to the 2008 financial crisis with a policy of monetary easing that was unprecedented in both its scale and duration. In the low interest rate environment that followed and that persists today, “search for yield” became one of the main characteristics of financial
-30%
-25%
-20%
-15%
-10%
-5%
0%Venezuela Iraq Saudi Arabia Algeria Russia Nigeria

Chapter 1. Energy investment trends 33
markets. This has had an important impact on investment in the energy sector, notably in North America; in 2014, upstream oil and gas investment in the region peaked at around USD 300 billion, an amount equivalent to 40% of the capital spending of companies that make up Standard and Poor’s 500 index. Solar PV investment was also boosted. Unlike conventional hydrocarbon and power generation projects, shale oil and gas and solar PV technologies have significantly shorter lead times and are generally smaller in scale, modular and suitable for standardisation. These characteristics reduce project management risks and make them suitable for high rates of leverage and new investors. Investment in these areas has been dominated by new entrants needing to raise capital.
In the case of the North American shale industry, high leverage was enabled by hedging production and diversifying through large numbers of individual wells. During 2014, of all non-investment grade corporate bonds issued by US companies, about 10% (in terms of the USD amount issued) were from oil and gas companies. Those companies also borrowed heavily from banks.
In the case of solar PV, in countries where solar policies are regarded as credible, government-guaranteed feed-in tariff (FIT) or attractive net metering schemes mean that investment is seen as an alternative to a Treasury bill or savings account, with a significantly more attractive return and with the additional non-financial benefit of expressing environmental consciousness. Third-party project developers are increasingly financing residential solar PV installations, enabling rapid investment at low financing costs (see Chapter 4). For utility-scale projects, long-term power purchase agreements (PPAs) are facilitating investments from outside the utility sector. A large part of solar PV investment in 2014 and 2015 was not on the balance sheet of traditional utilities, reflecting not only their weak financing position (especially in Europe), but also policy design which helped secure a lower cost of external capital. On the other hand, retroactive changes in FITs or in net metering rules had a detrimental impact on the cost of capital in markets where they took place.
Monetary policy has had a weaker impact in other market segments. None of the major international oil companies (IOCs) have publicly revised their hurdle internal rate of return (IRR) for new projects, which remains at 10-15%. In any case, the bulk of their investment continues to be financed from retained earnings.
There are signs that the period of exceptionally low interest rates may be coming to end. In late 2015, the US Federal Reserve raised interest rates for the first time since the financial crisis. While a 0.25 percentage point increase in the risk-free rate does not have a large impact in itself, it has modified financial market expectations, increased risk premiums and tightened financing conditions for highly leveraged companies. A combination of higher interest rates and higher risk premiums make it harder for third-party solar PV project developers to maintain high rates of leverage or for renewable developers generally to raise finance from “yieldcos” – companies that bundle renewables-based and/or conventional long-term contracted operating assets in order to generate predictable cash flows. As a result, some solar companies have started to come under financial pressure,

34 Chapter 1. Energy investment trends
despite the generally promising outlook for the technology (see Chapter 4). In the shale industry, fundamentals have been under particular strain during the period of very low oil and gas prices seen in the first quarter of 2016; the high-yield corporate bond market essentially shut down in early 2016 for shale companies, contributing to a sharp drop in investment, although companies continued to have access to financial resources mainly in form of equity raising (see Chapter 3).
The future pace of monetary tightening still remains uncertain, even in the United States. Both the euro area and Japan maintain a policy of quantitative easing, resulting in negative interest rates. This historically unprecedented monetary stance will shape the investment environment for energy for years to come.
Sources of energy finance are becoming increasingly diverse
The USD 1.8 trillion invested across the energy sector in 2015 came from a variety of financing sources (Table 1.2).4 The single most important source of investment finance for energy is retained earnings from an already-producing asset base. This is the main source for electricity networks and power generation capacity owned by utilities, as well as oil and gas investment outside North America. Due to cuts in capital spending, IOCs were still generally able to cover new investments from retained earnings, but they nonetheless increased their leverage by nearly USD 100 billion from 2014 in order to maintain dividend payments. North American shale gas and light tight oil investment continues to rely heavily on debt and equity financing. While equity continue to remain available, bond markets and bank lending have become much harder to access for the more leveraged oil and gas Independents. Project financing increased its share of total investment due to its importance in renewables, LNG liquefaction terminals and conventional power plants in single-buyer electricity systems.
While the investment model of fossil fuels has been largely unchanged for decades, the way in which electricity investment is financed is evolving rapidly (see Chapter 4). The most innovative changes are occurring in countries that allow open access to the grid and foster retail competition. Conventional utilities represent a declining share of electricity investment. Independent power producers, often relying on project finance, are now playing a major role in renewables globally as well as for conventional generation in non-OECD countries. Successful renewables policies have created a virtuous cycle: cheap financing cuts the cost of delivered electricity, which helps maintain the policy and investment momentum, leading to learning by doing and further cost declines. However, this cycle can be broken by regulatory uncertainty or the corporate problems of overleveraged operators. A small, but dynamic proportion
4 While this report does not track energy-sector financing from a bottom-up perspective, it does integrate a mix of insights to paint a picture of the major financing trends shaping the sector.

Chapter 1. Energy investment trends 35
of renewables investment is coming from outside the conventional energy industry, including decentralised investment out of household savings or third-party financing as well as corporate procurement of renewable energy. New business models are emerging based on the concept of selling energy services, rather than the fuel itself.
Table 1.2 • Sources of finance for energy investments
Source of financing Areas in which it typically plays a major role
Household spending, including bank loans and third-party financing deals
Residential solar PV; efficient cars and appliances
Direct investments by governments and state-owned enterprises
Power generation and fossil fuel supply in countries with high public ownership; CCS projects
Corporate retained earnings and cash flow (on balance sheet)
Oil and gas upstream; electricity T&D
Project finance from banks and other financial institutions
Utility-scale PV and wind; independent conventional power plants; gas infrastructure
Direct investment by institutional investors
Utility-scale renewables; fossil fuel power plants; efficiency programmes in developing countries
Development banks and export credit agencies
Large-scale renewables; electricity networks; off-grid electrification; conventional generation in non-OECD economies; gas pipelines
Government budgetary support via tax credits or conditional grants
Fiscal incentives for electric vehicles; energy efficiency programmes for buildings
Bank borrowing, bond markets Oil and gas Independents; unbundled network companies; vertically integrated utilities; distributed energy resources
Equity markets and venture capital North American oil and gas Independents; electricity storage; early-stage renewables technologies
Investment in energy efficiency and demand-side management relies on a combination of household savings, funding by the owners of buildings and direct budgetary support, such as tax credits for hybrid cars or energy efficiency funding by specialised institutions. Energy Service Companies (ESCOs) have expanded their activities especially in China, focusing on large energy users with a well verifiable savings potential.
References
Agora Energiewende (2016), “The energy transition in the power sector: State of affairs 2015”, www.agora-energiewende.de/fileadmin/Projekte/2016/Jahresauswertung_2016/Agora_Jahresauswertung_2015_Slides_web_EN.pdf (accessed 26 July 2016).
Bloomberg LP (2016), Bloomberg Terminal (accessed 6 September 2016).

36 Chapter 1. Energy investment trends
IEA (International Energy Agency) (2016), Oil Market Report, www.iea.org/oilmarketreport/omrpublic/ (accessed 2 August 2016).
International Monetary Fund (IMF) (2016), World Economic Outlook Database, www.imf.org/external/pubs/ft/weo/2016/01/weodata/index.aspx (accessed 26 July 2016).
Ministry of Internal Affairs and Communications of Japan (2016), Annual Report on the Family Income and Expenditure Survey 2015, Tokyo, www.stat.go.jp/english/data/kakei/156index.htm (accessed 26 July 2016).
OECD (Organisation for Economic Co-operation and Development) (2016), Global Economic Outlook and Interim Economic Outlook, OECD Publishing, Paris, www.oecd.org/eco/economicoutlook.htm (accessed 26 July 2016).
United Nations (2016), Comtrade Database, www.comtrade.un.org/data/ (accessed 26 July 2016).
US BEA (United States Bureau of Economic Analysis) (2016), “National Income and Product Accounts: Personal Consumption Expenditures by Type of Product,” U.S. Department of Commerce, Washington, D.C., www.bea.gov/national/consumer_spending.htm (accessed 26 July 2016).

Chapter 2. Investment in end use and efficiency 37
2. Investment in end use and efficiency
Highlights
Investments in energy efficiency exceeded USD 220 billion in 2015, making up 12% of total energy investments. Buildings, including the appliances used within them, accounted for the largest and fastest-growing share of the total, at USD 120 billion. Energy efficiency standards, which now cover 30% of energy consumption, are the main driver. Investment in efficient transport amounted to USD 65 billion and in industry USD 40 billion.
The world appears to be entering a period of slower energy demand growth. Investments in industrial capacity and urban infrastructure in China and other emerging economies, which drove rapid growth in energy demand after 2003, have slowed down markedly. OECD demand is stagnating, largely thanks to efficiency improvements. In 2015, the energy intensity of the world economy improved by 1.8%, two and a half times the average annual change from 2004 to 2014.
Lower fuel prices have slowed the trend towards more fuel-efficient vehicles in the United States, by far the world’s largest market for transport fuel. Average fuel economy improvements since 2013 are only one-third of what they would have been had oil prices not fallen, resulting in over 8 000 barrels per day of additional US oil demand. This offsets around 90% of the global reduction in oil demand brought about by sales of electric cars. The average fuel economy of new cars in India worsened slightly despite rising standards and taxes, indicating an opportunity to further develop policy in this growing market.
The price of lighting is being kept in check by energy efficiency. For example, household electricity prices in Germany have increased 50% since 2005, but the price of lighting services is largely unchanged, with similar trends unfolding in Japan. Water heating, the second-largest source of household energy demand in many OECD countries after space heating, is not getting more efficient as quickly as lighting and countries with rising fuel costs are paying more for hot water.
Gas demand is being moderated by two areas of energy efficiency investment: in industry and building retrofits. At around USD 40 billion, spending on both is of the same order of magnitude, but the drivers differ markedly. Gas demand growth in the OECD is being constrained by policy-driven spending on building retrofits, whereas energy prices and competitive pressures play a larger role in industry.
Global sales of electric cars increased by 70% to 550 000 in 2015, an investment of the order of USD 4 billion. Government spending is responsible for much of this investment, which is estimated to reduce oil demand by around 10 000 barrels per day (0.01% of global demand) and increase electricity demand by 1 TWh per year (0.005% of global demand).

38 Chapter 2. Investment in end use and efficiency
Overview This chapter starts with a summary of trends in investment in energy-related capital stock – the set of buildings, vehicles, equipment and appliances that directly or indirectly require energy inputs. It then reviews investment in more energy-efficient capital stock to replace or augment existing goods, with a focus on the transport sector. The chapter closes with a look at trends in prices for energy services, combining fuel price and efficiency effects.
Investment in energy-using assets Investment by public institutions, private corporations or individuals in energy-using assets shapes future energy demand and the mix of fuels used. Almost all physical assets – be they buildings, vehicles, equipment or appliances – require or involve energy inputs, either directly or indirectly. A television cannot work without electricity; a car cannot be driven without fuel; a building may not be habitable without heating or air-conditioning. The stock of energy-using capital determines the amount and types of energy services demanded and the quantity and type of fuel consumed to meet that demand. The use of energy is simply a means to an end; the end user cares not about the use of fuel as such, rather the quality and amount of energy services that fuel can provide. Owners of capital invest in the means of producing and delivering energy to end users in order to meet consumer demand for energy services and, in so doing, turn a profit. In competitive markets, the price mechanism provides the means of balancing investments in supply with the demand for energy generated by investments in energy-using assets.
The impact of investment in energy-using assets can endure for decades due to the long-lived nature of most of them. Appliances have lifetimes of 5 to 20 years; cars have lifetimes exceeding ten years; industrial facilities can have lifetimes of 40 years or more; and buildings and roads generally last far longer. The slow pace of stock turnover means that investment decisions today can lock in energy use for many years or decades unless there is a shift in demand for energy services or renovation of the assets. In mature economies with stagnating energy demand, that means that there is less scope for introducing new technologies. By contrast, in the emerging economies, investment in modern, often much more efficient and cleaner technologies, is frequently bigger as much of it is intended to meet demand growth rather than replace or upgrade assets.
Estimating precisely the amount of investment in all types of energy-using assets is a next-to-impossible task as macroeconomic data do not distinguish between those assets that involve energy use and those that do not. Nonetheless, it is reasonable to assume that the overwhelming majority of fixed capital formation – which made up just under one-quarter of world gross domestic product (GDP) or roughly United States dollar (USD) 18 trillion in 2015 – can be categorised as energy-related. On top of this, a significant share of household spending includes the purchase of consumer durables that also use energy.

Chapter 2. Investment in end use and efficiency 39
Investment in demand-side infrastructure such as new industrial capacity and building stock is a leading indicator of future energy demand. For example, industrial energy demand in the People’s Republic of China (hereafter “China”) is slowing as a result of a shift in investment away from heavy manufacturing. The rate of Chinese building construction is also slowing, but energy demand within buildings will most likely continue to grow as more affluent urban populations access a wider range of energy services – unless that factor is offset by improved energy efficiency. Declining household energy demand growth in many countries of the Organisation for Economic Co-operation and Development (OECD) reflects the impact of improved efficiency across a range of appliances and equipment and better building insulation, coupled with weak economic growth and near-universal ownership of major appliances (see Chapter 1).
Investment in industrial capacity is on the wane
The period since the start of the current century was characterised by a rapid expansion of the stock of energy-related assets in emerging markets making the transition to modern industrial economic structures. Industrial expansion has been phenomenal. Since 2000, worldwide capacity of steel and cement production has more than doubled and the capacity of steam crackers for bulk chemicals grew by over 50%, with that expansion almost entirely in non-OECD countries (Figure 2.1). These investments led to higher industrial energy demand worldwide, which increased by an estimated 55% between 2000 and 2015. Investment was particularly rapid in China; as a result, it accounted for three-quarters of the growth in world industrial energy demand from 2000 to 2015 (Figure 2.2).
The rapid industrialisation of the emerging economies is now starting to wane. Export-led industrial production in China has slowed, its economic growth falling to just 6.9% in 2015 – its lowest level for 25 years. As a result of strong investment in recent years, driven by expectations of continuing strong growth in export demand, a large overhang of industrial capacity has emerged. In parallel with the slowdown in manufacturing, the contribution of the service sector is becoming more important to the Chinese economy. The proposed 13th Five-Year Plan targets consumer-led growth and an increase in the added value of the service sector from 50% in 2015 to 56% of GDP in 2020, as well as limiting the rise in energy consumption to 16% over 2015 levels (compared with around 18% between 2010 and 2015). Continued energy efficiency improvements are expected to play as important a role in limiting energy use as structural change.
In contrast with China, India’s economy is continuing to grow strongly, a trend that is expected to persist through to 2020: GDP is projected to grow by between 7.5% and 7.7% per year up to 2020 (OECD, 2016b; IMF, 2016). The Indian government’s “Make in India” campaign, launched in 2014, aims to increase the share of manufacturing in GDP from 17% in 2013 to 25% by 2020. However, industrial investment currently falls short of what is required to achieve this target, suggesting that India will not replace China as the motor of global industrialisation in the near future

40 Chapter 2. Investment in end use and efficiency
Figure 2.1 • World industrial energy demand and production capacity in selected industries
Note: The steel capacity projection includes the 150 million tonnes per year (Mt/year) of announced closures in China. The ethylene capacity projection includes 10.2 Mt/year of US capacity that is scheduled to be added by 2020.
Source: US Geological Survey (2016), Cement Statistics; Oil & Gas Journal (1997-2016a), International Survey of Ethylene from Steam Crackers; Oil & Gas Journal (2016b), US to see hike in foreign-funded ethylene capacity in second wave of projects; OECD (2016a), World Crude Steelmaking Capacity.
Figure 2.2 • Growth in industrial energy demand by country/region
Note: Industrial energy demand is total final consumption on an energy-equivalent basis.
Source: IEA (2016a), World Energy Balances.
75
100
125
150
175
200
225
250
1990 1995 2000 2005 2010 2015
2000
= 1
00
Steel capacity
Cementcapacity
Steamcracking(ethylene)
Industrialenergydemand
-2%
-1%
0%
1%
2%
3%
4%
5%
Ann
ual a
vera
ge g
row
th in
indu
stri
al
ener
gy d
eman
d
Rest of world
OECD
India
China
World
Contribution

Chapter 2. Investment in end use and efficiency 41
More modest economic growth, resulting in part from a slowdown in output of energy-intensive industries, is starting to curb energy demand growth in major emerging markets. This trend is set to continue in the coming years in view of the weaker prospects for steel demand – a leading indicator of how many energy-using assets are likely to be added or replaced in the near future (steel is a significant component of infrastructure in all sectors, including industry, construction, transport and appliances). World steel demand has underperformed industry expectations in the last two years, falling 2.4% since 2014, and is not expected to grow significantly in the near term (Figure 2.3). In China, steel demand is expected to fall below 2011 levels by 2017.
Figure 2.3 • Steel consumption
Note: Each dotted line represents the two-year outlook for demand growth published in the given year. Includes finished steel products. Last year of actual data is 2015.
Source: World Steel Association (2010-16), Worldsteel Short Range Outlook.
A huge wave of construction begins to break
Growing urban populations and rising incomes in the emerging economies have underpinned a construction boom in recent years. Building floor space worldwide has risen by an average of around 3% per year, with the urban population growing by 2.2% per year since 2000, adding 1.1 billion people (UN ESA, 2014). The availability of cheap credit in the property market has helped to fuel the surge in demand, notably in China. Fixed investment in Chinese urban real estate grew by between 15% and 25% per year in real
90
100
110
120
130
2010 2012 2014 2016
2010
= 1
00
2011 2012 2013 2014 2015 2016 Actual demand
Europe and North America (2010 = 256 Mt)
90
100
110
120
130
2010 2012 2014 2016
China (2010 = 598 Mt)
90
100
110
120
130
2010 2012 2014 2016
World (2010 = 1 312 Mt)

42 Chapter 2. Investment in end use and efficiency
terms from 2005 to 2013 (NBS, 2016). This construction boom was accompanied by a 32% increase in total residential and services energy demand in China.5
There are clear signs that the construction boom across the developing world is slowing. In China, where there is a potential overhang of property credit and a high rate of unoccupied urban residences, fixed investment in real estate grew by just 2.6% in 2015 (NBS, 2016). The rate of growth of the global building stock, measured in floor area, is projected to fall from 3% at present to around 2.5% per year by 2020 and decline further after 2030, despite strong anticipated construction activity in India and regions such as sub-Saharan Africa and Latin America (IEA, 2016b). Even if replacement and refurbishment increased from the current rate of 0.5% to 1% of the building stock (McKinsey Global Institute, 2012), it would be unlikely to compensate for the decline in new building construction. Yet despite the expected slowdown in construction investment, it will remain at historically high levels.
The recent wave of construction will have important implications for future energy use. It is estimated that 140 million adults joined the global middle class between 2000 and 2015, an increase of around 30% (Credit Suisse, 2015).6 This increase in wealth places these households on a trajectory of rapidly rising energy demand as access to services becomes affordable. Energy-intensive services, such as air-conditioning, personal transport, refrigeration and laundry services, are often among the first to be acquired. Given that many of these assets last for several years, their acquisition effectively locks in energy use in the medium term. This makes it all the more important that buildings and the equipment and appliances used within them are as energy-efficient as possible, in order to meet energy security, climate and broader environmental goals. In particular, robust building codes in developing countries are of vital importance for the achievement of climate targets, as outlined in Energy Technology Perspectives 2016 (IEA, 2016c).7
Household energy demand in OECD countries has peaked
Household demand for energy has been declining in many OECD countries over the last few years, especially in Europe. In 2014, European Union (EU) residential gas demand dropped to its lowest level since the mid-1990s. This decline was preceded by an annual fall of over 3% per household and per unit of floor area on average between 2004 and 2011 in France, Germany, Italy and the United Kingdom combined. EU residential electricity demand declined for the second year in a row in 2014 to a level last seen in 2003. Demand growth is
5 Such rapid growth is not unprecedented. Total US residential and services energy demand also grew by around 5 EJ over the eight-year period to 1972, a 50% increase. However, US growth subsequently slowed and no eight-year period since 1977 saw growth as high as that in China between 2005 and 2013. 6 Credit Suisse defines a middle class adult as one with net wealth between USD 50 000 and USD 500 000 on a purchasing power parity basis. In India, for example, this is USD 13 700 at market exchange rates. 7 More information on modernising building codes to improve efficiency can also be found in IEA (2013)

Chapter 2. Investment in end use and efficiency 43
also absent in North America where annual residential gas demand peaked in 1996 and has been relatively stable since, while residential electricity demand has been essentially flat since the start of the economic and financial crisis in 2007, an outcome that is all the more remarkable given low gas prices in recent years.8
The fall in household energy use is largely the result of improvements in energy-efficient appliances and air-conditioning and heating systems, as well as better insulation of buildings. In addition, saturation effects mean that rising incomes do not necessarily lead to increased use of energy: almost all households across OECD countries now own basic appliances such as a refrigerator, a washing machine and a cooker. The acquisition of more energy-efficient equipment and appliances has a significant cumulative impact on energy demand: electricity consumption in IEA member countries would have been 430 terawatt-hours (TWh), or 5%, higher in 2014 than it actually was, had it not been for improvements in the energy efficiency of electric appliances since 1990 (IEA, 2015).
Efficiency gains are currently offsetting the impact of purchases of additional goods, such as second refrigerators and diverse digital devices, on overall household energy demand. While these and other new sources of residential electricity demand, such as electric vehicles, air conditioning and heat pump heating could become significant, it is not expected to counter the trend towards greater efficiency and reverse the downward trend in energy demand in the medium term.
Investment in energy efficiency
Spending on efficiency continues to grow
We estimate that USD 221 billion was invested by businesses, households9 and the public sector in improving energy efficiency in 2015, an increase of around 6% on 2014. This investment corresponds to the incremental spending on equipment that consumes less energy than would otherwise have been used had the purchaser opted for a less efficient model or continued using their existing equipment (Box 2.1). Improvements in building efficiency, primarily insulation, accounted for USD 120 billion, or almost 55%, of the total, with transport and industry making up the remainder (Figure 2.4).
Building envelopes and heating and cooling systems make up the bulk of building efficiency investment, half of which is for retrofits (the renovation or installation of new equipment in existing building structures) that have higher unit costs associated with improving the
8 Although 2014 was a warm year, the average number of heating and cooling degree days has not changed significantly over the last decade. 9 For the purposes of this report, incremental spending by households on more efficient consumer durables is defined as investment (see Chapter 1).

44 Chapter 2. Investment in end use and efficiency
thermal efficiency of old buildings compared with new ones. The higher costs of retrofitting existing buildings are part of the reason why the two regions that spent the most on energy efficiency in buildings – Western Europe (41% of the total) and North America (26%) – have relatively low levels of new construction. Most of the USD 39 billion spent on energy efficiency in industry was direct company spending, but one-fifth – an increasing share – was invested via contracts with energy service companies (ESCOs) (IEA, 2016b).
Box 2.1 • Measuring investments in energy efficiency
Defining and measuring investment in energy efficiency, as applied in this report, is far less straightforward than for investment in energy supply. There is no standardised approach and data is hard to obtain, because investment is carried out by billions of households and firms, often without external financing. It often represents but a small share of the total spending on a particular energy-related good or service.
The IEA estimates energy efficiency investment using bottom-up and top-down approaches (IEA, 2014a; IEA, 2014b). We define an energy efficiency investment as the incremental spending to acquire equipment that consumes less energy than would otherwise have been used to provide the service, such as lighting, heating or mobility, had the consumer not bought a more efficient option. This report presents numbers from the Energy Efficiency Market Report 2016 (IEA, 2016b), which uses a mostly bottom-up approach.
If we take the case of a car, it is assumed that the buyer of a relatively efficient car would have otherwise chosen a less efficient model of similar same size and power. The incremental investment is calculated for each country as the additional price paid for the 25% most efficient cars sold in each size and power class, compared with the average price of cars in that class in the country.10 In the case of lighting, it is assumed that the average efficiency of lightbulbs sold in 2015 is what would have been purchased instead of the energy-efficient bulbs, such as compact fluorescents and light-emitting diodes (LEDs) that were bought in each region. For some types of spending, such as that by electric utilities to comply with regulations, the full investment is included. For industrial energy efficiency investments, the counterfactual for new capacity is the average efficiency in the sector. More detailed information on how the methodology is applied at the sectoral and sub-sectoral level can be found online at www.iea.org/investment.
10 This price-based approach differs from cost-based approaches that estimate the total cost of the improving efficiency of the car fleet rather than the incremental consumer spending only. Cost-based approaches are commonly used in modelling exercises and aim to quantify the additional costs to manufacturers associated with improved fuel economy in future years.

Chapter 2. Investment in end use and efficiency 45
Figure 2.4 • Energy efficiency investment by sector, 2015
Note: HVAC = heating, ventilation and air-conditioning.
Source: Adapted from Navigant Research (2016), “Annual Sales of Electric and Hybrid Medium and Heavy Duty Buses are Expected to Exceed 52,000 in 2025”; IHS Polk; IEA (2016b).
Energy performance standards are driving efficiency investment
Energy performance requirements, such as minimum performance standards are a critical driver of efficiency investment. Today, 27% of the energy consumed worldwide is by equipment that has had to meet a mandatory energy performance standard, up from just 14% ten years ago, as highlighted in the World Energy Outlook 2015 (IEA, 2015d). In the buildings sector, the proportion is around 30%. For appliances alone, the share is above two-thirds in the European Union and China. Three-quarters of new vehicles are sold in countries with minimum fuel economy standards.
Energy performance standards generally tighten over time, incentivising manufacturers to stay ahead of the curve. While some efficiency investments can be price-induced, especially in industry and in years of rising fuel prices, much of today’s market for buildings, cars and appliances that exceed minimum standards can be attributed to the cumulative impact of regulations that induce technological change. For example, US refrigerator prices have fallen consistently in real terms since the first standards were introduced in the late 1970s, while their energy use has dropped by two-thirds (IEA, 2016b). Around 70% of energy consumption for lighting is now covered by standards. Through mass production and technology improvements, LED lightbulb costs have fallen by 90% since 2009. Such cost reductions make more ambitious standards easier to introduce.
26%
12%
6%10%
9%
9%
15%
13%
54%
18%
28% Envelope
HVAC and controls
Appliances
Lighting
Energy-intensive industry
Other industry
Light-duty vehicles
Freight and other transport
USD 221 billion
Buildings
Transport
Industry

46 Chapter 2. Investment in end use and efficiency
Spending on energy-efficient appliances can have a big impact on energy use. For example, in the United Kingdom, refrigeration and washing appliances11 rated A+ or greater have grown from 1% of the installed stock to 23% in the last ten years, with at least 4 million such appliances sold in 2015. Consumption per appliance has fallen on average by almost 3% per year over the last ten years, leading to a total cumulative reduction of 23%, or 9 TWh saved per year by 2015, compared to 2005. This saving for refrigeration and washing appliances alone is equivalent to one-fifth of the United Kingdom’s wind and solar generation in 2015 (BEIS, 2016).
Energy efficiency investment closely linked to consumer spending
Purchases of new or replacement cars, appliances and buildings represented over two-thirds of total energy efficiency investment worldwide in 2015. Overall consumer spending on durable goods grew by 7% in the United States in 2015 and consumer confidence in OECD countries is close to pre-financial crisis levels (OECD, 2016c). The increase in overall spending has boosted the size of the component that is invested in energy-efficient goods. Generally, spending by households is either self-financed using savings or via unsecured loans, including overdrafts and credit cards (IEA, 2014b). Household transactions are generally not accessible to debt and equity investors but there are efforts to link institutional investors and other sources of capital with the steady revenue streams that can accrue to small-scale projects by aggregating them into multi-million dollar bonds sold on liquid markets (see next section).
The public sector accounts for a relatively small component of energy efficiency investment. For example, direct investment in the buildings sector amounted to around USD 6 billion, or 5%, in 2015. However, the overall impact of this spending on energy use is significantly greater as it can leverage private investment. In addition, it can be a key stimulus for investment in improving existing equipment that would not otherwise have been replaced. This type of energy efficiency spending is different to the purchase of a more efficient version of a product that would have been acquired or replaced anyway, and it is generally less readily undertaken by consumers or businesses absent policy incentives.
A case in point is the retrofit of existing buildings to enhance their energy performance, something that is often not undertaken by property owners due to a lack of capital, high personal discount rates, uncertainty about how long their occupancy will last, or weak incentives to reduce bills for third-party tenants. Moreover, retrofits tend to have higher unit costs for efficiency installations than new buildings. Yet improving poorly performing building stock is a key component of reducing greenhouse-gas emissions in mature economies. Policy instruments, including grants, tax credits, public procurements and
11 Refrigerators, freezers, washing machines, dishwashers and tumble dryers.

Chapter 2. Investment in end use and efficiency 47
loans, energy audit requirements and labelling programmes, played a major role in mobilising USD 42 billion of energy efficiency investment in building retrofits in 2015.
New sources of energy efficiency financing are emerging
The sources of finance for energy efficiency improvements are becoming more diverse. For example, cost declines for technologies such as solar PV, LEDs and system controls have increased the attractiveness of energy service packages, whereby commercial building owners or tenants contract with energy service companies for the provision and maintenance of more energy-efficient equipment, the financing of which is paid back via subsequent cost savings. In addition, markets for involving third-party investors in financing energy efficiency investments on the basis of foregone future costs are emerging, but their expansion depends on approaches that can make efficiency investments similar to familiar financial products and so attract new sources of capital, such as institutional investors.
Progress in aggregating small projects, managing risks and monitoring performance helped to open up new sources of finance in 2015. The Warehouse for Energy Efficiency Loans (WHEEL) became the first asset-backed security transaction for efficiency in June 2015, totalling USD 12.6 million, comprising unsecured home energy efficiency loans up to USD 20 000. In April 2016, California utility PG&E submitted plans for a residential pay-for-performance pilot programme that measures results at the meter and rewards customers for savings. These are just two examples in a market that is starting from a low base.
A market for so-called intelligent energy efficiency in buildings, involving the installation of electricity control systems, is also growing. The global market for energy-efficient controls, such as building management systems and smart devices that can adapt energy use to the occupants’ needs, stood at around USD 15 billion in 2015 and is increasing at a rate of around 10% per year. Electricity generally accounts for a higher share of energy use in new buildings in warm-climate emerging economies, and is a good sign that just under half of the energy efficiency controls market is in new buildings in non-OECD Asia, compared with 15% in existing buildings in North America and Europe.
Focus on transport
Low oil prices are encouraging people to drive more…
The collapse of international oil prices since 2014 has not just had a major impact on oil and gas upstream investments (see Chapter 3); it has also helped lift end-use consumption – especially in markets where the drop in retail prices has not been cushioned by high tax rates. In the transport sector, oil demand has been boosted by lower pump prices. For

48 Chapter 2. Investment in end use and efficiency
example, in the United States, the national average retail price of gasoline fell by a remarkable 50% in real terms between mid-2014 and early 2016 (Figure 2.5). As of July 2016, prices were still 27% below the average over 2010-15 in real terms. The annual number of miles driven increased by 6% between mid-2014 and mid-2016,12 raising US gasoline demand by 5% and crude oil demand by 0.07 million barrels per day (mb/d) (0.4% of US oil supply and 5% of global oil demand growth in 2016). This has reversed the downward trend in US consumption since 2010. Increased fuel demand resulting from lower prices is one reason why global oil demand growth is currently above the trend of the last five years, potentially contributing to a tightening of oil markets in coming years (see Chapter 5). However, despite increased consumption, total US spending on gasoline has fallen to a level last seen in 2004. Lower gasoline bills are responsible for virtually all of the fall in total energy expenditures for US households since 2013 (see Chapter 1). 13
Figure 2.5 • US gasoline prices and consumption by season
Note: Summer months are April to September inclusive. Summer 2016 consumption is estimated.
Source: US EIA (2016a), Weekly Retail Gasoline and Diesel Prices; US EIA (2016b), U.S. Weekly Product Supplied.
12 In 13 of the months since July 2014, monthly US mileage rose by more than 3% year-on-year, compared with only 10 of the months between 2001 and mid-2014 (US FHA, 2016). Between 2001 and mid-2014 the average annual increase in monthly mileage was just 0.7%. 13 While this chapter mostly discusses passenger transport, freight transport is also important for energy-efficiency investments. Freight transport is responsible for 40% of road-transport energy consumption worldwide. However, much more data on light-duty vehicle (LDV) sales is available. In addition, the turnover of LDVs is higher and their utilisation rates are lower, making their annual sales higher in dollar terms and more responsive to changes in oil prices. The fuel efficiency of freight transport is improving slowly and standards for freight transport are in place in the United States, Canada, Japan and China, and are being finalised in India.
0.0
0.2
0.4
0.6
0.8
1.0
1.2
7.8
8.0
8.2
8.4
8.6
8.8
9.0
9.2
9.4
9.6
9.8
2009 2010 2011 2012 2013 2014 2015 2016
USD
(201
5) p
er li
tre
Mill
ion
barr
els
per d
ay Wintergasolineconsumption
Summergasolineconsumption
Averagewinter pumpprice (rightaxis)
Averagesummerpump price(right axis)

Chapter 2. Investment in end use and efficiency 49
Outside North America, many countries have higher fuel taxes that dampen fuel price changes and demand responses. In the United Kingdom, the price of gasoline fell by 23% and that of diesel fell by 26% between mid-2014 and early 2016 in real terms, while combined United Kingdom (UK) consumption of gasoline and diesel grew by 3%. The tax component of UK pump prices in 2016 is over 70%, compared with around 25% in the United States.
… and buy thirstier cars
Oil prices do not only influence the patterns of use of existing vehicles, they can also affect investments in new vehicles. Some countries have seen the rate of improvement in fuel economy slow in 2014 and 2015 (Figure 2.6). The United States, by far the world’s largest oil consumer for road transport, improved fuel economy of new LDVs in 2015 at just one-third of the rate experienced between 2008 and 2013. The slowdown will result in more than 8 000 barrels per day (b/d) of additional oil demand during the lifetime of the new LDVs registered in 2015 in the United States. This offsets most of the impact of global electric car sales (see next section). In India, the average fuel economy of new cars actually worsened in 2015, despite the shift in government policy over the last two years from subsidising to taxing transport fuels. This is largely explained by a jump in the purchases of larger cars with rising incomes and a growing middle-class population. Because the car market and mileage are smaller than in the United States and fuel economy is higher on average, the worsening average fuel economy in 2015 will be much smaller, raising oil demand by just 700 b/d. However, low global oil prices have not derailed fuel economy improvements in all countries, especially where fuel economy standards are complemented by measures that cushion pump price changes, such as taxes.
Figure 2.6 • Average fuel economy of new light-duty vehicles in selected countries
Note: Fuel economy is estimated on a Worldwide Harmonised Light vehicles Test Procedure (WLTP) WLTP basis. Dashed lines show continuation of 2008 to 2013 trend.
Source: Adapted from IHS Polk.
5
6
7
8
9
10
11
12
2005 2007 2009 2011 2013 2015
Lge/
100k
m
United States
China
Japan
Germany
India
France

50 Chapter 2. Investment in end use and efficiency
Figure 2.7 • Sales of new light-duty vehicles by efficiency classes in selected countries
Note: Lge = litres of gasoline-equivalent; SUVs = sports utility vehicles. Fuel economy is estimated on a WLTP basis.
Source: Adapted from IHS Polk.
Fuel economy has been improving despite an increasing share of larger vehicles in many markets (Figure 2.7). The trend towards larger vehicles reflects consumer preferences and, when fuel prices decline, even more consumers tend to take the opportunity to buy bigger, less fuel-efficient vehicles. Added to this trend, in 2015 the total new vehicle market grew 5% in OECD countries, in line with the rise in OECD consumer spending generally. Thus, in the United States, sales of SUVs and trucks, which generally consume much more fuel than other cars, grew by around 1 million vehicles in 2015, a 12% increase compared with a 6% increase in total LDV sales. Sales of hybrids and diesel cars, which are more fuel-efficient than their gasoline equivalents, fell by 20% and 29% respectively in the United States (sales of the latter were also undermined by revelations about violations of diesel emission regulations).
Changes in vehicle purchases are as yet less pronounced in the main European markets. Diesel sales rose more slowly than those of LDVs generally (5% growth compared with 8%), and their share of total car sales are liable to drop further following the emissions revelations. Sales of hybrids and electric vehicles increased 24% in Europe and the average efficiencies of new car sales continued to improve in 2015, demonstrating that sales are less sensitive to global oil prices than in the United States. The principal exception is France, which boasts one of the most fuel-efficient fleets in the world, but where the share of larger cars increased.
4
5
6
7
8
9
10
11
0%
20%
40%
60%
80%
100%
2011
2012
2013
2014
2015
2011
2012
2013
2014
2015
2011
2012
2013
2014
2015
United States China France
Lge/
100k
m
Shar
e of
new
car
sal
es SUVs/vans
Large cars
Medium
Small
Sales-weightedaverage efficiency(right axis)

Chapter 2. Investment in end use and efficiency 51
New measures are needed to accelerate fuel economy gains
To maintain improvements in fuel economy, governments need to act to compensate for the effects of oil price declines and consumer preferences for larger, more powerful vehicles.14 A portfolio approach to tightening fuel economy standards can account for such changes. The United States has expressed an ambition to improve average fuel economy to 4.3 Lge per 100 km (kilometres) for new car sales by 2025.15 However, the Corporate Average Fuel Economy (CAFE) standard is adjusted according to the relative shares of smaller and larger vehicles, such as SUVs. Unless the methodology of the standard is modified, or the efficiency of large vehicles improves markedly, the recent shift to larger vehicles in the United States could mean the 2025 target is not met. Fortunately, for a given size of vehicle, greater efficiency may not come at a higher price, but does currently involve a trade-off with power output (Box 2.2).
Box 2.2 • Money is power: Vehicle pricing and efficiency
Many models of cars are available in variants that have differing fuel economy, power and price tags. For example, there are 22 different engine options across the 89 versions of the Volkswagen Golf hatchback available in France despite all of them having a similar size and position in the market. Today, in addition to internal combustion engine (ICE) variants, several models of cars have variants with electric drivetrains and lower liquid fuel consumption: hybrids; plug-in electric hybrids (PHEVs) or battery electric vehicles (BEVs). They are generally a lot more expensive.
However, that is not the case for gasoline cars, where prices are generally inversely correlated to fuel economy, largely because more expensive cars have bigger, more powerful engines. Comparing list prices for different variants of a model, the cheapest gasoline variants tend to be those with lowest gasoline consumption and lowest power output (Figure 2.8). This means that selecting a more expensive variant almost always brings lower fuel economy, but a car with double the price is in general nearly three times more powerful. Fuel economy can be improved by up to 12% by selecting a diesel variant, especially in Europe, but the popularity of diesel vehicles has dropped in relation to their contribution to local air pollution. Cars with electric drivetrains are the exception. They can be 15% to 105% more expensive but deliver 30% to 100% less oil consumption. Vehicles with electric drivetrains are not such outliers on a power basis as they are for gasoline consumption, but there is some trade-off in terms of lower power output.
This analysis suggests that ICE car buyers do not consciously invest in fuel economy as such, as they do not seem to value fuel economy very highly in choosing between different variants of a given
14 This is a similar policy problem to so-called rebound effect, where it is efficiency, not fuel prices, that reduces energy service costs and stimulates more demand for the service. 15 The CAFE test cycle is not equivalent to the WLTP methodology used elsewhere in this report, which would result in a higher estimated oil consumption than that of the CAFE target.

52 Chapter 2. Investment in end use and efficiency
model. Both higher efficiency and higher power output generally require modifications to a car that raise its production cost and price. But power is apparently valued more than efficiency. During times of low fuel prices, consumers often opt for a more expensive variant of a given car model since they know that the cost of running it will be lower than before. Unless they select a model with an electric drivetrain, it will almost certainly have higher fuel economy than a less powerful variant. Buyers of hybrids and electric cars are an exception: they are prepared to spend more on buying the car in return for lower fuel costs.
Figure 2.8 • Gasoline consumption, power and sales price for variants of five car models with
electric drive versions
Notes: Each dot represents one variant of a car model relative to the cheapest variant of that model. HEV = hybrid-electric vehicle (excluding PHEV). 2016 list prices incorporating relevant purchase incentives and disincentives. Models: Audi A3/S3 in Germany; Fiat 500 in California; Ford Fusion in the United States; Kia Soul in Canada; VW Golf in France.
0%
40%
80%
120%
160%
-100% -80% -60% -40% -20% 0% 20% 40% 60%
Incr
ease
in p
rice
from
che
apes
t in
rang
e
Difference in oil consumption from cheapest in range (Lge/100km)
Diesel ICE
Gasoline ICE
HEV
PHEV
BEV
0%
40%
80%
120%
160%
-50% 0% 50% 100% 150% 200% 250% 300%
Incr
ease
in p
rice
from
che
apes
t in
rang
e
Difference in horsepower from cheapest in range
Diesel ICE
Gasoline ICE
HEV
PHEV
BEV

Chapter 2. Investment in end use and efficiency 53
Are electric cars coming of age?
New registrations of electric cars – BEVs and PHEVs – increased by 70% between 2014 and 2015, with 550 000 cars sold worldwide in 2015 (EVI, 2016) (Figure 2.9). They made up 0.8% of total light-duty vehicle sales and 0.1% of the total fleet at the end of 2015. On the assumption that these cars displaced sales of oil-based ones, they reduced oil demand by around 10 000 b/d, or 0.01% of global demand, and increased electricity demand by about 1 TWh per year, or 0.005%. These figures do not include sales of low-speed electric vehicles and electric buses (Box 2.3)
The world’s two biggest car markets, the United States and China, accounted for more than half of global new electric car registrations in 2015. While electric car sales declined 4% between 2014 and 2015 to 110 thousand in the United States with the fall in gasoline prices, they increased almost threefold to over 200 000 in China, which overtook the United States as the largest national market. Policies aimed at reducing urban vehicle pollution and stimulating Chinese manufacturing continue to support electric car sales in China despite a 30% drop in gasoline and diesel prices since mid-2014. Outside China and the United States, the year-on-year growth rate of sales in 2015 was 72% – just slightly higher than in 2014. Sales in the first half of 2016 are estimated to be about 60% higher than in the first half of 2015 (BNEF, 2016), thanks to strong sales in Europe and China.
Figure 2.9 • Electric car sales and market share in selected countries/regions
Note: Includes PHEVs and BEVs. Market shares are for a total of 40 leading markets.
Source: EVI (2016), Global EV Outlook 2016.
Electric vehicle car sales in 2015 represent an investment in energy efficiency of over USD 4 billion given that such vehicles are considerably more fuel-efficient than the conventional cars they are assumed to have displaced. Fiscal incentives provided by
0.0%
0.1%
0.2%
0.3%
0.4%
0.5%
0.6%
0.7%
0.8%
0
100
200
300
400
500
600
2010 2011 2012 2013 2014 2015
Shar
e of
new
car
sal
es
Thou
sand
sal
es Others
Canada
Germany
United Kingdom
France
Norway
Netherlands
Japan
China
United States
BEV (right axis)
PHEV (right axis)

54 Chapter 2. Investment in end use and efficiency
governments to bridge the price gap between ICE and electric cars represent the vast majority of this total; the rest was made by the car buyers themselves. The estimate does not include investments by public and private entities in public charging outlets worldwide, which grew by over 70% in 2015 to 190 000 and are a key precondition to electric car ownership for many drivers, nor the billions of dollars that are spent by automakers on bringing electric cars to market each year, including building battery and vehicle-assembly factories.
Box 2.3 • Low-speed electric vehicles, 2-wheelers and electric buses
In addition to highway-capable electric cars, it is reported that China produced over 600 000 low-speed electric vehicles in 2015, most of which were sold domestically. Output is projected to rise to 2 million in 2020. These smaller vehicles are popular with city-dwellers in China seeking an affordable means of personal transport. Worldwide sales of e-bikes, totalled about 40 million in 2015, of which 1.4 million pedal-assisted bicycles were sold in Europe in 2014, mostly in Germany, the Netherlands and Belgium (CONEBI, 2016); most of the rest were sold in China. It is hard to assess their impact on energy demand, as it depends on whether they displace scooter, car, foot or public transport journeys. Close to 37 000 electric and hybrid buses are estimated to have been sold in 2016 (Navigant, 2016).
There has been speculation about the role of lower oil prices in driving down electric car sales, especially in the United States. Other things being equal, lower prices clearly reduce the financial attractiveness of buying an electric vehicle. Were pump gasoline prices to remain at current levels, the payback period for an urban Californian buyer of a BEV would be around nine years; whereas at mid-2014 gasoline prices the payback would be three to four years.16 However there are two countervailing factors to be taken into account. First, sales of BEVs and PHEVs are still mostly in a comparatively luxury segment of the market, where fuel prices have the least impact on car choices. In addition, US sales in 2015 were undermined by the prospect of cheaper models with longer driving ranges coming onto the market in 2016 and 2017.
Continued rapid growth in electric vehicle sales remains heavily dependent on public policy support in the medium term, especially if oil prices do not rise significantly (Box 2.4). Cost reductions and range increases are also needed. Average prices in the United States have been relatively stable since 2011, even though the number of models on the market has risen from five to more than 25 BEVs and PHEVs (Figure 2.10). In addition, although the price of vehicles per km of driving range halved between General Motors’ 1996 launch of the EV1 and 2008, it has not declined further, suggesting that either battery-cost reductions have not been passed onto consumers or that automakers are adding other
16 Based on the price of the Fiat 500e, including the charger and subsidy, compared with a Fiat 500 Turbo.

Chapter 2. Investment in end use and efficiency 55
features and targeting a more upmarket customer segment. However, with several new models to be launched in 2016 and 2017 with longer ranges and announced prices that are not dramatically higher, another 50% drop, to below USD 130 per km of range, could occur in just the next few years.
Box 2.4 • Government policy has driven electric vehicle sales in Norway
Norway, where almost one in every four cars sold in 2015 was an electric vehicle, provides a good example of how strong policy support can drive rapid deployment of electric vehicles. Incentives there include registration-tax reductions, exemption from value-added tax, waivers on road tolls and ferries, and access to bus lanes. Tax exemptions are particularly attractive in Norway, where vehicle taxes are among the world’s highest. In addition, 1 372 public charging points have been installed and subsidies provided for private charging points. Electric cars represent just 2.5% of all cars on the road in Norway today, but sales have been growing at 200%. It would take annual growth of only 17% for electric car sales to reach 150 000 by 2025, cumulatively this would equal 50% of the on-road stock in 2015.
Figure 2.10 • Sales price of the top five best-selling BEVs in the United States
Note: Calculated from the advertised list price in each year for the top five best-selling BEVs on sale in the United States and the maximum range published by the Environment Protection Agency (EPA). In 1996, only the GM EV1 was available; in 2008 and 2009, only the Tesla Roadster was available; in 2010, the Think City became available. The average list price per maximum range is calculated to reflect the longer driving ranges of newer BEVs, something that provides more consumer utility.
0
100
200
300
400
500
600
0
20
40
60
80
100
120
1996 2008 2009 2010 2011 2012 2013 2014 2015
USD
(201
5) p
er k
m
USD
(201
5) th
ousa
nd
Averagelist price
Averagelist pricedivided bymaximumrange(right axis)

56 Chapter 2. Investment in end use and efficiency
New airplanes are more fuel-efficient than ever before
The expansion and gradual turnover of the world’s fleet of airplanes are generating savings in energy per passenger kilometre flown as new planes become more fuel-efficient. Orders for new planes fell by 40% to around 2 000 planes in 2015,17 a significant drop from the levels of sales in recent years, which have led to a considerable backlog of 10 000 ordered aircraft to be delivered during the next decade. Net orders for Airbus and Boeing, who together account for the overwhelming bulk of the world’s production of commercial planes, totalled USD 237 billion in 2015, a fall of 26% compared with 2014.18 These manufacturers received over 1 000 net orders for their new ranges of more fuel-efficient narrow-body planes,19 13% of their total orders. The new planes are 12% more expensive and expected to be 15% to 20% more fuel-efficient than their predecessors. Ascribing the price premium to fuel economy benefits, these orders represent USD 15 billion of investment by commercial airlines in energy efficiency.
While a decline in sales is not uncommon in a cyclical industry such as aviation, low oil prices may have contributed to a dip in orders in 2015. Lower prices can reduce aircraft orders in multiple ways: older planes become more profitable and are not retired; fuel costs reduce the incentives for operators to seek out ways of saving fuel; and oil-revenue-dependent national airlines may reduce capital spending. On the other hand, airlines are typically able to make bigger profit margins, which help to finance orders for new planes. The regions that saw the greatest proportionate falls in new orders in 2015 compared with previous years were Africa, the Middle East and North America. North America and Africa have the biggest backlogs of undelivered aircraft, while the drop in the Middle East may relate to financial pressures following the decline in oil prices.
The planes ordered in 2015 are the most fuel-efficient ever (Figure 2.11). For passenger aircraft, which make up over 95% of new commercial planes, improvements in fleet and passenger management, such as more seats per plane and higher passenger load factors, have also helped to save fuel per passenger kilometre flown. Efficiency improvements have helped to offset an increase in the average range of new planes, which tends to raise fuel consumption due to additional weight on board. Planes entering service in 2015 will consume roughly 9% less fuel than those delivered in 2005.
Airlines are coming under increasing competition from high-speed trains over certain medium-distance routes, increasing the incentive to save fuel in order to lower operating costs. High-speed trains are around three times more efficient than planes per passenger kilometre (ADEME, 2016). For journeys up to around four hours by train, trains can directly compete with aviation. Investments in high-speed train infrastructure can raise overall fuel economy and reduce CO2 emissions. Among the ten busiest airline routes in the world in 2015, four routes are already served
17 Net of cancellations. 18 Based on list prices. 19 The Airbus new engine option (NEO) and Boeing 737-MAX.

Chapter 2. Investment in end use and efficiency 57
by high-speed trains, including the Tokyo to Sapporo connection that opened in March 2016. The opening of the high-speed rail connection between Madrid and Barcelona cut airline passengers on the same route by 1 million in two years, while prices fell and total passengers on the route increased by several million. Likewise, the rail connection between Wuhan and Guangzhou in China reduced the number of airline passengers on that route by around 14 million (IRJ, 2015).
Figure 2.11 • Average fuel economy of new airplanes worldwide
Note: By year in which planes are delivered. Fuel economy estimated as a function of maximum range and fuel capacity. Actual fuel consumption is probably lower.
Source: Adapted from manufacturers’ websites; ICAO (2016).
Energy service price index Natural gas, gasoline and electricity are consumed in order to provide a particular energy service, such as mobility, lighting, heating and cooling. Despite the attention that is given to changes in fuel prices, it is the price of the energy service – lighting, heating, transport – that matters to the consumer. The price of these energy services changes with fuel prices (including taxation and subsidy) and the efficiency with which the service is provided, which is a function of technology used. This section looks at how the effective prices of lighting, hot water and passenger car travel services have evolved in recent years, using an energy service price index that takes account of retail prices and efficiency. 20
20 The index does not reflect the lifetime cost of providing the service, which includes capital costs.
15
17
19
21
23
25
27
29
2000 2005 2010 2015
Pass
enge
r km
per
litr
e

58 Chapter 2. Investment in end use and efficiency
The cost of lighting declines despite higher power prices
Lighting accounts for only 10% of household electricity bills in the OECD, but its share is declining rapidly as a result of the replacement of traditional incandescent lightbulbs with more efficient compact fluorescent bulbs and far more efficient LED bulbs. In most countries, the real cost of providing light has fallen since 2005, with the exception of Japan and Germany (Figure 2.12). In Germany, although household electricity prices fell slightly in 2015, they rose by more than 50% in real terms over the ten prior years, pushed up by taxes and levies, in part to support renewables. Yet, the cost of lighting has fallen 5% from 2005 levels thanks to the displacement of incandescent bulbs (Figure 2.13). In Japan, the real cost of electricity rose nearly 40% over the same period, but lighting efficiency gains offset half of that. Elsewhere, the cost of lighting has fallen, including in Austria, France, the Czech Republic, Portugal and the United Kingdom (electricity prices increased by more than 45% in the United Kingdom between 2005 and 2015). Costs have fallen most – by 25% – in the United States, where electricity prices have not risen as much as in other countries.
Figure 2.12 • Household energy services price index for lighting
Note: Ten million lumen-hours of light represent the consumption of an average household per year.
The general downward trend in the cost of lighting is set to continue as remaining incandescent bulbs are replaced and the share of LEDs increases. Thereafter, efficiency gains are likely to be much smaller, with the price of lighting following more closely the price of electricity. Rebound effects from lower lighting costs – an increase in demand due to lower prices – are small in most countries at present, though the falling costs of LEDs may eventually lead to rising consumption in non-lighting applications such as devices with screens, which can be made larger at lower cost.
0
20
40
60
80
100
120
140
2005 2007 2009 2011 2013 2015
USD
(201
5) p
er 1
0 m
illio
n lu
men
-hou
rs Japan
Germany
United Kingdom
Australia
France
Mexico
United States
China
India
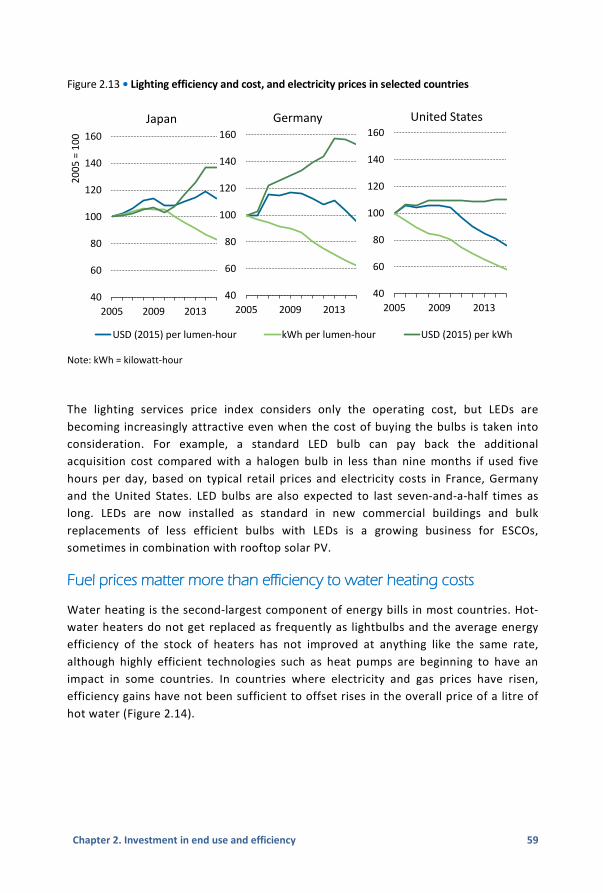
Chapter 2. Investment in end use and efficiency 59
Figure 2.13 • Lighting efficiency and cost, and electricity prices in selected countries
Note: kWh = kilowatt-hour
The lighting services price index considers only the operating cost, but LEDs are becoming increasingly attractive even when the cost of buying the bulbs is taken into consideration. For example, a standard LED bulb can pay back the additional acquisition cost compared with a halogen bulb in less than nine months if used five hours per day, based on typical retail prices and electricity costs in France, Germany and the United States. LED bulbs are also expected to last seven-and-a-half times as long. LEDs are now installed as standard in new commercial buildings and bulk replacements of less efficient bulbs with LEDs is a growing business for ESCOs, sometimes in combination with rooftop solar PV.
Fuel prices matter more than efficiency to water heating costs
Water heating is the second-largest component of energy bills in most countries. Hot-water heaters do not get replaced as frequently as lightbulbs and the average energy efficiency of the stock of heaters has not improved at anything like the same rate, although highly efficient technologies such as heat pumps are beginning to have an impact in some countries. In countries where electricity and gas prices have risen, efficiency gains have not been sufficient to offset rises in the overall price of a litre of hot water (Figure 2.14).
40
60
80
100
120
140
160
2005 2009 2013
2005
= 1
00
Japan
USD (2015) per lumen-hour kWh per lumen-hour USD (2015) per kWh
40
60
80
100
120
140
160
2005 2009 2013
Germany
40
60
80
100
120
140
160
2005 2009 2013
United States

60 Chapter 2. Investment in end use and efficiency
Figure 2.14 • Water heating efficiency and cost, and energy prices in selected countries
Note: Electric, gas and fuel oil heaters are weighted according to shares of energy consumed. The energy price is weighted by the type of fuel consumed in each country. Other sources of hot water are not considered here due to lack of available price data.
In the United Kingdom, the average cost of heating 60 000 litres of hot water per year – being average household consumption – is, in real terms, around 45% higher than in 2005. This is largely due to an 80% increase in the retail price of natural gas, which is used for water heating in 80% of UK households. In the United States, where fuel prices have not risen in real terms, efficiency gains have reduced the cost of hot water a little. Since 2005, energy consumption per household for water heating has been declining in OECD member countries, as a result of improved efficiency and rising prices, despite rising populations and incomes.
Driving costs fall with lower fuel prices and more efficient cars
The average cost of driving a passenger car one kilometre in most OECD countries was lower in real terms in 2015 than it was in 2005, taking account of improvements in fuel efficiency described in the previous section and changes in fuel prices (Figure 2.15). Fuel prices generally finished the period slightly lower, after rising between 2006 and 2008, and 2009 and 2011. Since mid-2014, fuel price declines have dramatically reduced driving costs, most significantly in the United States, providing a USD 750, or 41%, annual cost saving to drivers (based on 18 500 km per year). In absolute terms, driving costs in Norway fell less than in other OECD countries.
80
90
100
110
120
130
140
150
160
2005 2009 2013
2005
= 1
00
United Kingdom
USD (2015) per litre hot water kWh per litre hot water USD (2015) per kWh
80
90
100
110
120
130
140
150
160
2005 2009 2013
Germany
80
90
100
110
120
130
140
150
160
2005 2009 2013
United States

Chapter 2. Investment in end use and efficiency 61
In Europe, much of the cost decline since 2005 can be explained by the dieselisation of the car fleet, which has increased average efficiencies and reduced fuel prices in a number of countries (diesel cars are generally more fuel-efficient than equivalent gasoline-powered cars, and taxes on diesel are in most cases lower than on gasoline). But efficiency through dieselisation can come at the cost of air pollution and ill health (IEA, 2016d). Russia now has the lowest price in US dollars among the countries surveyed (those shown in Figure 2.15), partly as a result of the depreciation of the ruble. In the United States, driving costs have followed closely fuel prices, as the efficiency of the vehicle stock improved by around only 2% between 2005 and 2015 (Figure 2.16). By contrast, in both France and Turkey, average fuel economy improved by over 20%; driving costs would have been lower in 2015 than in 2005 even if fuel prices had remained at mid-2013 levels.
Figure 2.15 • Passenger car travel energy services price index
Note: Based on weighted average fuel economies and prices for gasoline, diesel and electric passenger cars, including hybrids.
The dramatic declines in the effective price of car travel since 2013 in most countries owe more to the fall in oil prices than efficiency improvements. But, the continuing efficiency improvements described earlier in this chapter mean that a rebound in driving costs to 2013 levels would now be dependent on fuel prices rising more than they have declined over the past two years. While this is good news for drivers, policymakers must consider whether the lower cost of driving will undermine efforts to curb energy use through efficiency improvements as a result of rebound effects. The recent increase in popularity of larger vehicles in the United States in 2015 is evidence that this may be the case.
5
10
15
20
Q1 2005 Q1 2009 Q1 2013
USD
(201
5) p
er 1
00 k
m
5
10
15
20
Q1 2005 Q1 2009 Q1 2013
NorwayUnited KingdomKoreaItalyTurkeyGermanyFranceSpainAustraliaChinaSouth AfricaCanadaMexicoUnited StatesRussia
In order of fuel price:
leftright

62 Chapter 2. Investment in end use and efficiency
Figure 2.16 • Passenger car fuel efficiency and cost, and fuel prices in selected countries
References
ADEME (Agence de l’Environnement et de la Maîtrise de l’Energie) (2016), Comparateur Eco Déplacements, www.quizz.ademe.fr/eco-deplacements/comparateur (accessed 26 July 2016).
BNEF (Bloomberg New Energy Finance) (2016), Q3 2016 Global Electrified Transport Market Outlook, BNEF, London.
CONEBI (2016), European Bicycle Market 2016 Edition, Confederation of the European Bicycle, Brussels.
Credit Suisse (2015), The Global Wealth Databook 2015, Credit Suisse, Zürich.
EVI (Electric Vehicles Initiative) (2016), Global EV Outlook 2016, OECD/IEA, Paris, www.cleanenergyministerial.org/Portals/2/pdfs/EVI-Global_EV_Outlook_2016.pdf (accessed 26 July 2016).
FHA (United States Federal Highway Administration) (2016), Travel Monitoring: Travel Volume Trends, United States Department of Transport, Washington, D.C., http://www.fhwa.dot.gov/%20policyinformation/travel_monitoring/tvt.cfm (accessed 26 July 2016).
ICAO (International Civil Aviation Organization) (2016), Facts & Figures 2016, http://www.icao.int/sustainability/pages/factsfigures.aspx (accessed 26 July 2016).
60
80
100
120
140
160
180
Q1 2005 Q1 2009 Q1 2013
Q1
2005
= 1
00
France
USD (2015) per 100 km Lge per 100 km USD (2015) per Lge
60
80
100
120
140
160
180
Q1 2005 Q1 2009 Q1 2013
United States
60
80
100
120
140
160
180
Q1 2005 Q1 2009 Q1 2013
Turkey

Chapter 2. Investment in end use and efficiency 63
IEA (2016a), World Energy Balances 2016, OECD/IEA, Paris, www.iea.org/statistics/.
IEA (2016b), Energy Efficiency Market Report 2016, OECD/IEA, Paris.
IEA (2016c), Energy Technology Perspectives 2016, OECD/IEA, Paris.
IEA (2016d), World Energy Outlook Special Report on Energy and Air Pollution, OECD/IEA, Paris.
IEA (2015), Energy Efficiency Market Report 2015, OECD/IEA, Paris.
IEA (2014a), Energy Efficiency Market Report 2014, OECD/IEA, Paris.
IEA (2014b), World Energy Investment Outlook 2014, OECD/IEA, Paris.
IEA (2013), Policy Pathways: Modernising Building Codes, OECD/IEA, Paris.
IMF (International Monetary Fund) (2016), World Economic Outlook Database, www.imf.org/external/pubs/ft/weo/2016/01/weodata/index.aspx (accessed 26 July 2016).
IRJ (International Railway Journal) (2015), “Chinese High-Speed: An Evaluation of Traffic,” Simmons-Boardman Publishing, New York, www.railjournal.com/index.php/high-speed/chinese-high-speed-an-evaluation-of-traffic.html (accessed 26 July 2016).
McKinsey Global Institute (2012), Urban World: Cities and the Rise of the Consuming Class, McKinsey & Company, New York.
Navigant (2016), “Annual Sales of Electric and Hybrid Medium and Heavy Duty Buses are Expected to Exceed 52,000 in 2025,” Navigant Research, Boulder, Colorado, ww.navigantresearch.com/newsroom/annual-sales-of-electric-and-hybrid-medium-and-heavy-duty-buses-are-expected-to-exceed-52,000-in-2025 (accessed 26 July 2016).
NBS (National Bureau of Statistics China) (2016), National Data: Monthly Data, National Bureau of Statistics, Beijing. www.data.stats.gov.cn/english (accessed 26 July 2016).
OECD (2016), World Crude Steelmaking Capacity, http://www.oecd.org/sti/ind/steelcapacity.htm (accessed on 6 September 2016).
OECD (2016b), Global Economic Outlook and Interim Economic Outlook, OECD Publishing, Paris.
OECD (2016c), Consumer confidence index (CCI), OECD Publishing, Paris.
Oil & Gas Journal (1997-2016a), International Survey of Ethylene from Steam Crackers, http://www.ogj.com/index.html (accessed 6 September 2016).
Oil & Gas Journal (2016b), US to see hike in foreign-funded ethylene capacity in second wave of projects, http://analysis.petchem-update.com/engineering-and-construction/us-see-hike-foreign-funded-ethylene-capacity-second-wave-projects (accessed 7 September 2016).

64 Chapter 2. Investment in end use and efficiency
UN ESA (United Nations Department of Economic and Social Affairs) (2014), World Urbanisation Prospects, the 2014 revision, https://esa.un.org/unpd/wup/cd-rom (accessed 26 July 2016).
US EIA (US Energy Information Agency) (2016b), US Weekly Product Supplied database, US Department of Energy, Washington, D.C., www.eia.gov/dnav/pet/pet_cons_wpsup_k_w.htm (accessed 26 July 2016).
US EIA (US Energy Information Agency) (2016a), Weekly Retail Gasoline and Diesel Prices, US Department of Energy, Washington, D.C., www.eia.gov/dnav/pet/pet_pri_gnd_dcus_nus_w.htm (accessed 26 July 2016).
United States Geological Survey (2016), Cement Statistics and Information, USGS, Reston, www.minerals.usgs.gov/minerals/pubs/commodity/cement/index.html#mcs (accessed 26 July 2016).
World Steel Association (2010-16), Worldsteel Short Range Outlook: Table by Region, World Steel Association, Brussels, www.worldsteel.org/media-centre/press-releases.html (accessed 26 July 2016).

Chapter 3. Investment in oil, gas and coal 65
3. Investment in oil, gas and coal
Highlights
USD 900 billion was invested in oil, gas and coal supply in 2015, 18% less than in 2014 – the peak year in real terms. Investment in upstream oil and gas plunged the most. It still made up 65% of total fossil fuel investment, down from more than 70%. Transportation and downstream investment fell less because of the long lead times of projects, many of which were launched several years ago.
Upstream oil and gas investment plunged by 25% in 2015 to USD 583 billion and is set to fall by a further 24% to about USD 450 billion in 2016 (in 2015 dollars). For the first time in 30 years, investment will have declined for two consecutive years. The Middle East and Russia represent the most resilient regions, leading national oil companies to reach an all-time high of 44% of global upstream investment, while North American shale and other high development costs areas have seen the biggest reductions.
Upstream costs fell heavily in 2015 and 2016 after having more than doubled between 2000 and 2014. The IEA Upstream Capital Cost Index dropped by 15% in 2015; a further 17% decline is expected in 2016. Costs fell most in North America, where the IEA Shale Upstream Cost Index dropped 30% in 2015 and an estimated 22% in 2016.
LNG investment reached historic highs in 2014 and 2015 with spending around USD 35 billion per year, mainly due to the conversion and completion of liquefaction plants in the United States and Australia. However, as projects are completed, 2016 investment is expected to be about 30% lower. Only one final investment decision for a new LNG project has been taken in 2016 so far. An overhang of gas supply capacity has emerged with slower demand growth.
Reduced cash flow has forced most of the oil and gas companies to increase debt in order to finance capital spending and dividends. Net debt to equity ratios have almost doubled across private oil and gas companies in the last two years, with North American Independents coming under severe financial pressures.
Investment in coal supply declined by 9% in 2015, a trend that is expected to continue in the near future. Poor growth prospects for global coal demand and massive overinvestment in Chinese coal mining over the last decade underpin the trend.

66 Chapter 3. Investment in oil, gas and coal
Overview Fossil fuels continue to attract the bulk of global energy investment, reflecting their dominance of the energy mix. They account for around 80% of total primary energy demand, barely lower than a decade ago despite increasing efforts to decarbonise the global energy system. Oil, gas and coal together made up almost two-thirds of total investment in energy supply in 2015. Since 2000, capital expenditure on fossil fuel supply has increased steadily, interrupted only in 2009 by the financial crisis and more recently by the steep drop in global energy prices (Figure 3.1). Between 2000 and 2014, investment more than tripled in real terms (adjusted for general inflation),1 reaching United States dollar (USD) 1 100 billion (in 2015 dollars) in 2014, before declining to USD 900 billion (Table 3.1).
Figure 3.1 • Global investment in fossil fuel supply by sector
Note: LNG = liquefied natural gas.
The upstream oil and gas sector still accounts for the lion’s share of fossil fuel supply investments, even though this share fell to 65% in 2015 from a peak of over 70% in 2013. The share had been generally rising since the early 2000s due to higher unit costs and increased spending on resources that are more expensive to develop. This is particularly the case with tight oil and shale gas in North America. Elsewhere, costs rose as a result of the shift towards more technologically complex projects (including deepwater projects), often located far from existing infrastructure. The competitive landscape of the
1 Unless stated otherwise, all investment numbers are presented in constant 2015 USD.
0
200
400
600
800
1 000
1 200
2000
2001
2002
2003
2004
2005
2006
2007
2008
2009
2010
2011
2012
2013
2014
2015
USD
(201
5) b
illio
n
Coal
LNG
Pipelines
Oil refining
Upstream oil and gas

Chapter 3. Investment in oil, gas and coal 67
North American oil and gas industry, combined with relatively easy access to technology and financial resources, enabled a proliferation of small- and medium-sized operators, especially in unconventional plays such as shale. As a result, the share of global upstream spending taken by independent US companies has increased markedly, peaking at 16% in 2014 before declining in 2015 and 2016 as a result of financial difficulties in the US shale industry.
Table 3.1 • Fossil fuel supply investment by key region and sector, 2015
USD 2015 billion Oil and gas upstream
Oil refining Midstream oil and gas
Coal Total
OECD 246 27 82 17 372
Americas 193 16 46 6 261
United States 136 6 40 4 187
Europe 46 5 14 3 67
Asia Oceania 7 6 22 8 44
Japan 0 1 3 1 5
Non-OECD 337 27 91 46 500
E. Europe/Eurasia 67 5 18 6 96
Russia 44 4 14 5 66
Non-OECD Asia 87 12 18 36 153
China 51 4 5 26 86
India 7 3 1 7 17
Southeast Asia 22 2 9 3 35
Middle East 73 3 41 0 116
Africa 49 1 7 2 59
Latin America 61 6 7 1 76
Brazil 33 1 4 0 38
World 583 53 196 68 900
European Union 15 5 12 2 34
Note: World total for pipelines includes shipping, which is not included in the regional data.
The rapid growth of North America’s oil and gas production over the last decade has spurred a wave of investment in the midstream, including the construction of oil and gas transportation and distribution lines, oil and gas tankers, gathering and processing facilities and the export terminals needed to accommodate the changing geography of production. In the case of natural gas, the construction of transportation infrastructure, including transmission and distribution pipelines, LNG liquefaction plants and regasification terminals, has historically represented the bulk of gas investment globally, given the necessity of developing a widespread system of networks to bring fuel to final consumers.

68 Chapter 3. Investment in oil, gas and coal
Spending on LNG chains has risen sharply with the rapid expansion of liquefaction capacity, which almost doubled over the ten years to 2015, and the construction of new regasification terminals. The number of countries having access to large-scale LNG supplies reached 33 in 2015 – exactly three times more than in 2000.
Most of the capital spending on coal supply facilities goes to the development of existing and new coal mines, and the rest to transportation infrastructure, including railways, roads and ports. Coal supply grew rapidly through the first decade or so of the current century, underpinned by robust demand growth in China and India (which accounted for almost the entire net increase in global demand between 2000 and 2010) and heavy investments in the People’s Republic of China (hereafter “China”) and Indonesia. Globally, coal investment jumped from around USD 30 billion in 2000 to almost USD 90 billion in 2012. Slowing coal consumption in China and the United States – the two biggest markets – coupled with ample supply capacity and a deteriorating outlook for demand due to weaker economic prospects in China and tougher environmental policies led to a reduction in coal investment worldwide in 2015. The main exception was India, where government programmes are expected to push coal demand higher (see below).
Box 3.1 • Measuring investment in oil, gas and coal
In line with capital spending in the other energy sectors, the investment estimates for oil, gas and coal represent overnight spending, i.e. the total amount invested in the capacity needed to meet supply in any given year. They are derived from International Energy Agency (IEA) data for demand, supply and trade, plus industry data on investment costs, where available. In the case of upstream oil and gas investment, the announced spending of over 70 leading oil and gas companies representing 75% of global oil and gas production has been surveyed and the results adjusted to correspond to overnight investment in order to be consistent with the estimates for the downstream sectors. This follows the methodology of the World Energy Model, used to produce the projections in the annual IEA World Energy Outlook.2 The more detailed estimates we present for investment in LNG liquefaction terminals are an exception: they are based on reported annual spending, not overnight spending, for 46 projects that reached final investment decision (FID) between 2000 and mid-2016. Analyses throughout the chapter rely on a wide range of publicly available sources. IEA estimates have been made where detailed information is not available, such as disaggregated spending by type of activity and capital spending plans by unlisted companies.
2 Available online at www.worldenergyoutlook.org/model.

Chapter 3. Investment in oil, gas and coal 69
Upstream oil and gas
Upstream operators slash spending as prices plunge
The biggest story in fossil-energy investment in 2015 and in the first half of 2016 was in upstream oil and gas, where both investment levels and costs collapsed, triggered by the drop in oil prices. This came on the heels of a prolonged and rising wave of investment. Between 2000 and 2014, investments in the upstream oil and gas sector increased almost fivefold, driven by higher oil and gas prices and rising unit costs. Capital spending grew by 12% on average per year in 2015 prices, from about USD 160 billion in 2000 to almost USD 780 billion in 2014.3 The cost of materials used in building and developing upstream facilities, and of services, equipment and drilling rigs, all increased steadily over this period, usually at double-digit rates.
North America was the main contributor to rising spending, due mainly to the surging production of unconventional oil and gas, which is typically more capital-intensive than conventional fields per unit of energy produced. Between 2010 and 2014, US tight oil production increased eightfold to an average of around 3.6 million barrels per day (mb/d). Over the same period, shale gas production more than doubled, reaching 380 billion cubic metres (bcm). This was underpinned by a doubling of oil and gas upstream spending in the region, taking North America’s share of global oil and gas investment close to 40%, about twice its share in 2000. The region accounted for nearly half of the total increase in upstream investment between 2000 and 2014. All other regions saw increases in spending too, though at widely differing rates, given the regional variability in finding and development costs (Box 3.2).
Global upstream investment fell dramatically following the oil price collapse in the second half of 2014. The drop amounted to 25% in 2015 and 24% in 2016 based on current plans (Figure 3.3). The total fall exceeds USD 300 billion over the two years – an unprecedented occurrence. Indeed, two consecutive years of reduced upstream investment had not been seen for 30 years. Furthermore, there are no signs that companies plan to increase their upstream capital spending in 2017. Many operators have revised downwards their 2016 capital spending guidance throughout the year and, as of September 2016, they plan to maintain 2017 investment at 2016 levels or even reducing it further, taking advantage of the sector’s cost deflation and efficiency gains.
3 Adjusted for general inflation. The impact of the sector’s cost trends is explored in a later section.

70 Chapter 3. Investment in oil, gas and coal
Box 3.2 • Separating out oil and gas in upstream investment
There is no recognised method for separating out oil and gas in capital spending on exploration or production, which is usually reported by companies as a total. Oil fields can produce associated gas and gas fields can produce natural gas liquids, which are classified as oil. However, the IEA World Energy Model enables the breakdown to be estimated on the basis of historic resources and their unit costs by country and asset type. Accordingly, we estimate that oil accounts for 70% of total upstream investment, a share which has remained roughly constant over the last 15 years (Figure 3.2).
The smaller share for natural gas reflects its more modest contribution to global energy supply (21% compared to 31% for oil) and the fact that 15% of global gas production is associated gas from oil fields, which requires very little additional investment. In addition, a significant portion of total gas supply comes from super-giant gas fields in Russia, Qatar, the Islamic Republic of Iran (hereafter, “Iran”) and Turkmenistan, where economies of scale keep investment per unit of output low.
Figure 3.2 • World upstream oil and gas investment by fuel
Although upstream spending is down in almost all countries, the intensity of the drop varies by region and project type. Cuts have been most pronounced in regions with high development costs and where production is dominated by small projects that can adapt more flexibly to changing market conditions. Tight oil and shale gas projects, for example, have significantly shorter investment cycles than traditional projects and operations can be adjusted more quickly. By comparison, complex multi-year and multi-billion dollar projects, for which FIDs have already been taken and a portion of total investment has already been made, typically go ahead in the short to medium term, regardless of changes in the oil price. However, for these projects, deliberate delays can be used to reduce expenditure.
0
100
200
300
400
500
600
700
800
900
2000
2001
2002
2003
2004
2005
2006
2007
2008
2009
2010
2011
2012
2013
2014
2015
2016
USD
(201
5) b
illio
n Gas
Oil

Chapter 3. Investment in oil, gas and coal 71
Figure 3.3 • World upstream oil and gas investment
Note: 2016 is estimated based on announced company spending plans and guidance as of September 2016.
Exploration investment is hit hardest
In the upstream sector, capital spending is concentrated in oil and gas exploration activities – including surveys, geological studies, seismic data gathering and analysis and well drilling – and in production – which includes all drilling and post-exploration activities aimed at the production of oil and gas. The latter can be also split into two different categories: spending for the development of already-producing assets and spending for new fields that have not yet commenced operations. The weight of the three components varies by company and type of asset. Overall, the vast bulk of upstream spending is concentrated in production activities, which are responsible for about 85% of the total, of which around 60% is directed at sustaining output from already-producing assets; it is estimated that natural decline rates – the rates at which production from oilfields decline once they have passed their initial peak in the absence of any capital investment – globally average around 9% globally. Due to continuing investment, the observed decline rate is significantly smaller, at an average of around 6%.
In line with the rise in total upstream spending generally, investment in exploration increased significantly in the years leading up to 2014, even though its share of total spending had been in steady decline. While detailed data are not available, there is evidence that – as a first response to the oil and gas price downturn – the industry prioritised cuts in exploration spending. Early estimates suggest spending on exploration in 2015 declined to less than USD 90 billion, a fall of around 30%, and dropped further in 2016 to around USD 65 billion. Its share of total upstream spending is now down to 14%, the lowest share in a decade (Figure 3.4).
0
100
200
300
400
500
600
700
800
900
2000
2001
2002
2003
2004
2005
2006
2007
2008
2009
2010
2011
2012
2013
2014
2015
2016
USD
(201
5) b
illio
n
-24%
-25%

72 Chapter 3. Investment in oil, gas and coal
Figure 3.4 • World investment in oil and gas exploration
The falling share of exploration is the result of several factors. Companies are putting more effort into developing proven reserves in order to sustain cash flows that had already been hit severely by lower oil prices. The impact of reduced spending on exploration usually materialises only several years later, while delaying or cancelling an ongoing development project can have a more immediate impact on an oil company’s finances. And the oil and gas industry is emerging from a period of relatively intensive exploration activity, reducing the incentive to explore further, especially given the weaker long-term outlook for prices.
For the first time since 2010, spending on exploration by the seven major oil companies4 declined in 2015, by around USD 6 billion, or 25%, compared with 2014. Preliminary indications emerging from their 2016 half-year financial results confirm a continuation and even acceleration of this trend, with exploration spending estimated to have plunged by around 40% compared with the same period in 2015. There is evidence that cuts in exploration activities have already resulted in a dramatic decline in new oil discoveries, dropping to levels not seen in the last 60 years.5 Preliminary indications point to a further decline in oil discoveries in 2016.
4 ExxonMobil, Shell, BP, Chevron, Total, Eni and ConocoPhillips. 5 Discoveries outside North America in 2015 totalled 2.8 billion barrels of crude oil and other liquids, according to data compiled by Rystad Energy – an oil and gas consulting firm, the lowest amount since 1952 and far below yearly consumption, which exceeds 35 billion barrels.
12%
13%
14%
15%
16%
17%
18%
19%
20%
0
20
40
60
80
100
120
140
2009 2010 2011 2012 2013 2014 2015 2016
USD
(201
5) b
illio
n
Exploration
Exploration(% of total)
Right axis:

Chapter 3. Investment in oil, gas and coal 73
Oil and gas companies slash spending across the board
Companies have generally cut upstream spending most, reacting promptly to the slump in the oil price in late 2014 and 2015 (Figure 3.5). Many were able to lower their break-even costs, thanks to cost reductions, a focus on more profitable assets, efficiency measures, capital discipline and, in some cases, new forms of collaboration with partners and suppliers. Operators focusing on unconventional plays and deepwater fields have cut investment most.
Figure 3.5 • Oil and gas upstream investment cuts by selected listed companies in 2016 compared
with 2014
Note: The chart includes investment spending as announced by companies. Some companies typically present their budgets in local currency. In those cases announced spending is converted to US dollars.
-100%-80%-60%-40%-20%0%
ONGCWoodside Petroleum
RosneftSuncor Energy Inc.
BPTotal
Gazprom NeftWintershall Holding
StatoilPTT E&PChevron
MOL GroupShell (Shell + BG)
PetrochinaGazprom
PetrobrasSinopec
ExxonMobilCNOOC
EniOMV
TullowLukoil
Hess CorpCanadian Natural Resources
RepsolEnCana
NovatekAnadarko
ConocoPhillipsKazMunaiGas EP
EOG ResourcesOccidental
Ecopetrol SAChesapeake
MarathonDevon Energy Corp
Murphy Oil CorpApache
US-focused independent Other private NOC Majors

74 Chapter 3. Investment in oil, gas and coal
The Majors, after a cut of 19% in 2015, have announced a further reduction of aggregate upstream spending of 21% in 2016. Only a few companies, especially in the Middle East, are maintaining upstream investment levels, while a smaller number, including Russia’s Rosneft and Algeria’s Sonatrach, intend to increase spending, albeit in local currency terms. The eventual fall in spending in 2016 may turn out to be even bigger, or possibly smaller, as some companies have not yet unveiled detailed plans and others – especially shale and light tight oil operators – can respond quickly to a change in oil price, adjusting their capital spending accordingly.6
Reduced budgets have forced companies to review, delay and, in some cases, cancel FIDs on planned projects. In 2015, only a few major new projects were sanctioned, representing just more than 6 billion barrels of oil, or only about one-third of the average of the previous five years. This trend appears to be continuing in 2016, with several companies postponing the development of new projects. Unsurprisingly, projects that have been hit the hardest include those with the highest break-even prices, including deep-water projects in several parts of the world and Canadian oil sands. In Brazil, Petrobras announced a 26% cut in its upstream investment plan for 2015-19, following a similar reduction in spending in 2015 – a cumulative reduction of about USD 29 billion; oil production targets for 2016-20 have been cut accordingly.7 In the North Sea, another region with high-cost resources, exploration and production activity has fallen off sharply despite significant improvements in cost efficiency by operators. Oil and Gas UK, an industry body, expects less than British pound (GBP) 1 billion (USD 1.3 billion) to be spent on new projects in 2016 compared with an average of GBP 8 billion (USD 10.4 billion) per year over the past five years. The United Kingdom government has reacted by significantly reducing levies on oil and gas operations in an attempt to stimulate investment. In April 2016, the Canadian Association of Petroleum Producers (CAPP) predicted that the country’s upstream capital spending would fall to USD 31 billion in 2016, a fall of 62% from 2014.
Upstream companies are now focusing on reducing costs and optimising operations as a way of maintaining their development activity in the face of a potential “lower for longer” oil price environment. Several companies are looking to adjust the timing of their investments to capture the full benefits of cost deflation along the entire supply chain (see below). Whether or not companies increase spending or choose to spend only part of what is planned will depend on the outlook for prices.
6 Several US exploration and production companies have stated in 2016 half-year financial reports that they stand ready to expand operations if the oil price recovers. Majors have further reduced their 2016 capital spending budget compared to the first quarter of the year. 7 Petrobras’ upstream spending actually increased by 5% in 2015 in local currency terms. However, throughout 2015, the real depreciated by almost 30% against the dollar. In August 2016, Petrobras announced a new revision of its strategic plan to be unveiled later in the year.

Chapter 3. Investment in oil, gas and coal 75
The extent of spending cutbacks varies widely across regions
The impact of lower oil prices on investment and output varies considerably across regions. In general, investment in regions characterised by large, long lead time projects unsurprisingly tends to be less responsive to large and sudden price swings, while regions with shorter lead times and less capital-intensive oil and gas fields have been more responsive. This section describes key investment trends in four important producing area – North America, the Middle East, Russia, and sub-Saharan Africa.
While quantification of the impacts of changes in investment on future production is beyond the scope of this report,8 effects in some regions are already evident. For example, US production dropped by 0.76 mb/d between its April 2015 peak and June 2016. By contrast, Middle East production actually increased, though this reflects the decision by the Organization of the Petroleum Exporting Countries (OPEC) in December 2014 to maintain output and defend oil market share. The postponement of and delays in completing new large projects, coupled with reduced investment in existing fields, are likely to lead to falls in capacity across most regions in the coming months and years.
North America leads cuts in upstream spending
North America experienced the steepest decline in upstream capital spending between 2014 and 2016 in absolute terms, yet still accounts for about one-third of the world total – the largest share of any region (Figure 3.6). As a result, the region’s upstream spending in 2016 is expected to be less than half that of 2014. The shorter investment cycles involved in developing the region’s unconventional resources, which account for a significant share of total output, explain why investment there has fallen so quickly. Shale projects generally have much shorter lead times and have a much steeper decline profile than conventional wells, with about 80% of total output concentrated in the first three years of production. This latter characteristic means that maintaining a certain level of production requires continuous investment in new drilling in order to compensate for the decline in producing fields. Consequently, output responds quickly to fluctuations in oil prices.
Many operators with predominantly US assets, such as Chesapeake, Devon Energy and Continental Resources, have announced spending cuts in excess of 50% – and in some cases reaching 70% – in 2016. The number of operating rigs fell by over 80% between the beginning of 2012 and May 2016 to 450 units – the lowest level ever experienced. Yet, the investment cuts only partially translated into reduced activity, as unit costs have also fallen rapidly, especially in unconventional operations. Well productivity has also increased substantially, tempering the drop in production.
8 More detailed analysis for oil market prospects are included in the IEA Medium-Term Oil Market Report 2016 (IEA, 2016a) and World Energy Outlook 2016 (IEA, 2016bc) (to be released on 16 November 2016).

76 Chapter 3. Investment in oil, gas and coal
Figure 3.6 • Upstream oil and gas investment by region
Middle East investment holds up for now
Over the last ten years, the Middle East’s share of global upstream oil and gas investment has remained relatively constant, on average at just over 10%, despite the region being responsible for about one-third of global oil production and around 15% of gas supply. The region has among the lowest finding and development costs in the world, averaging well below USD 10 per barrel. As a result, the region’s upstream spending has been less affected by lower oil prices, with national oil companies (NOCs) for the most part maintaining their longer-term investment plans. The long lead times of some major projects have also deterred spending cutbacks. Rig counts in the Middle East remain close to record levels, while they have fallen steeply in all other regions (Figure 3.7).
In July 2016, the number of active rigs in the region was only 10% lower than the peak reached in July 2014. In Saudi Arabia, United Arab Emirates and Kuwait, the number of active rigs has not substantially changed over the last couple of years. A notable exception is Iraq, where drilling activity has halved since mid-2014. Iraq’s federal budget relies extensively on oil revenues and has been hit severely by lower prices. As a result, Iraq asked operators, in particular those in southern Iraq’s super-giant fields, to focus investment on maintaining current production levels rather than developing new sources to save money.9
9 Most of Iraq’s oil production in the southern part of the country is covered by Technical Service Contracts, which include guarantees of 100% cost recovery backed up by the federal budget.
0
50
100
150
200
250
300
350
2000
2001
2002
2003
2004
2005
2006
2007
2008
2009
2010
2011
2012
2013
2014
2015
2016
USD
(201
5) b
illio
n North America
Latin America
Europe
sub-Saharan Africa
Middle East
Russia & Caspian
Asia
Other

Chapter 3. Investment in oil, gas and coal 77
Figure 3.7 • World rig counts by type and region (January 2014-July 2016)
Most of the large NOCs in the region are also successfully capturing the benefit of current cost deflation by renegotiating contracts with major suppliers and service companies, such as Halliburton and Schlumberger. This is the main factor behind the modest reductions expected in the region’s upstream investment in 2015 and 2016.
A weaker ruble and lower taxes helps maintain Russian spending
The country remains one of the top oil producers in the world, together with the United States and Saudi Arabia, and is the second-largest gas producer – only recently overtaken by the United States. Russia’s oil and gas industry is traditionally dominated by domestic operators – Rosneft in oil and Gazprom in gas – with limited participation from international companies, mainly in frontier projects, such as Sakhalin and Yamal LNG.10 Upstream investment in Russia is focused on two areas: maintaining or expanding production of old fields in West Siberia and the Volga-Urals through the application of new technologies, including horizontal drilling and hydraulic fracturing; and developing greenfield projects, notably in East Siberia.
Upstream investment has been far less affected by the precipitous fall of oil prices, as it was accompanied by a collapse of the Russian currency: the ruble lost nearly 40% of its value in 2015. Given that the vast majority of Russian projects have a largely local currency-
10 Rosneft has recently stepped up efforts to attract foreign investors, especially from China and India, to develop its oil fields in East Siberia.
0
500
1 000
1 500
2 000
2 500
3 000
3 500
4 000Ja
n 20
14
May
201
4
Sep
2014
Jan
2015
May
201
5
Sep
2015
Jan
2016
May
201
6
Num
ber
Gas rigs
Oil rigs
0
20
40
60
80
100
120
140
Jan
2014
May
201
4
Sep
2014
Jan
2015
May
201
5
Sep
2015
Jan
2016
May
201
6
Jan
2014
= 1
00
Middle East
Europe
Asia Pacific
Latin America
Africa
North America
Left Chart: GlobalRig Count
Right Chart: Regional Rig Count Index

78 Chapter 3. Investment in oil, gas and coal
denominated cost base and given the country’s current tax system,11 the ruble profitability of upstream investments has held up well. Indeed, some Russian companies have announced plans to increase upstream spending despite an uncertain outlook for oil prices and taxation. For example, Rosneft recently announced a more than 30% increase in upstream spending in ruble terms in 2016, mainly due to the start-up of production from new fields in East Siberia, Yamal-Nenets and Timan-Pechora.12 For other Russian companies, the situation is mixed: Bashneft is increasing spending, while Novatek has announced cutbacks. Both companies more than doubled their capital spending in ruble terms over the period 2010-15.
In the case of Gazprom, upstream spending has fallen with an overall decline in investment since the launch of the super-giant Bovanenkovo gas field in the Yamal region in 2012, though cuts have been heavier in the gas downstream sector.13 Since 2011, total investment has been halved in ruble terms, including a 30% cut in 2016. While a firm investment level is expected for projects with longer time horizons, such as the continuation of the Yamal megaproject and the Power of Siberia project, the company is cutting back its spending in response to lower prices, at least for the short term.
Sub-Saharan African producers scale back their deepwater plans
Since the early 2000s, sub-Saharan Africa has seen a strong upswing in investment in the upstream oil and gas sector, thanks to rising prices, growing domestic demand and technological progress that has rendered offshore developments technically and commercially viable. But, in keeping with most other regions, upstream spending has been scaled back in response to lower prices since the second half of 2014. Nigeria and Angola, the leading producing countries, have experienced a wave of cuts. Both countries have several deepwater projects in the pre-FID stage, a number of which have been deferred or cancelled. In Nigeria, Shell announced in early 2016 that it has postponed the FID on its USD 12 billion Bonga South West project until 2018 as part of its global cost-cutting programme, while in Angola several projects are under scrutiny due to depreciation of the local currency against the US dollar, making imported components expensive and keeping costs high. Elsewhere in the region, most investments were to take place for the development of East African resources, but deteriorated energy market conditions have significantly slowed down progress and company plans.
11 Given the country’s tax system, the collapse of oil prices in the second half of 2014 and through 2015 hit mainly the government budget rather than operators. At the time of writing, Russia is considering the introduction of a new profit-tax system. 12 Rosneft has benefited over the past three years of multi-billion dollars prepayments by China National Petroleum Corporation as part of a long-term oil-supply deal. 13 The oversupply of gas in the Eurasian region has been apparent for some years, prior to the oil price fall.

Chapter 3. Investment in oil, gas and coal 79
Upstream oil and gas costs down 30% since 2014
The fluctuations in upstream spending in recent years have been accompanied by similar swings in unit costs.14 Averaged across all regions, upstream costs fell by 15% in 2015 and are expected to fall by 17% in 2016, according to the IEA Upstream Investment Cost Index (UICI) – an indicator that the IEA has developed to monitor cost trends in the upstream sector (Figure 3.8). The index measures the weighted average annual change of capital costs for exploration and development incurred by operating companies for the entire upstream sector across all regions and assets.15
Figure 3.8 • IEA Upstream Investment Cost Index (UICI)
Note: y-o-y = year-on-year.
Between 2000 and 2014, the almost fivefold rise in upstream spending resulted in an increase in global oil and gas production of just 25% – largely because of cost increases, though a growing portion of this investment went to offsetting declines at existing fields. With the exception of 2009, when the sector was affected by the financial crisis, upstream costs rose steadily throughout this period, in line with rising oil prices and increasing demand for a range of equipment and services. This trend also resulted partly from a progressive shift to more complex and inherently costly projects, as well as the broader economic cycle that contributed to rising material costs across all sectors.
14 This section reviews trends in upstream costs based on information obtained from the largest oil and gas companies and service providers. The aim is to quantify the sources of cost deflation since 2014 and identify which activities have been most affected. 15 More information on the IEA UICI can be found online at www.iea.org/investment.
0
25
50
75
100
125
150
175
200
225
-20%
-15%
-10%
-5%
0%
5%
10%
15%
20%
25%
2000
2001
2002
2003
2004
2005
2006
2007
2008
2009
2010
2011
2012
2013
2014
2015
2016
2000
= 1
00
y-o-
y ch
ange
(%) UICI (%)
Exploration (%)
Production (%)
Series4
Series5
UICI
Right axis:

80 Chapter 3. Investment in oil, gas and coal
Just as rising prices dragged costs higher up to 2014, the recent fall in prices has led to lower costs by exerting pressure on contractors and service companies and prompting a focus on operational efficiency. Exchange rate changes have also played a role. In recent years, the US dollar strengthened significantly against currencies in several producing countries, such as Russia, Kazakhstan, Angola and Brazil, automatically lowering the cost of locally-sourced material and services in dollar terms. Since 2013, in Brazil, the real has declined 37% against the US dollar while Kazakhstan’s tenge has dropped by 55% (Figure 3.9).
Figure 3.9 • Exchange rate of selected currencies against the US dollar
Source: Adapted from Bloomberg LP (2016), Bloomberg Terminal.
Our analysis shows that unit costs have fallen across all cost categories, although the timing and intensity of that cost deflation varies by region and sector. Costs of land-drilling services and equipment are typically very responsive to energy price movements, reflecting the relatively short lead times involved and the sensitivity of the financial returns from onshore drilling to near-term price movements. Offshore drilling costs, on the other hand, are on average subject to a bigger time lag due to the longer lead times associated with larger projects with significant upfront capital needs and investment decisions heavily influenced by expectations on commodity prices.
Facility construction costs, covering equipment, materials, logistical and labour inputs, are typically a function of general economic conditions, but can be significantly influenced by specific market factors. For example, the simultaneous development of several new LNG facilities in Australia led to severe tightening of labour and construction markets, driving costs up (see the LNG section below). Overall, between mid-2014 and mid-2016, all key components of the upstream industry registered double-digit declines, with drilling costs and raw materials prices falling the most (Figure 3.10).
30
40
50
60
70
80
90
100
110
Jan
13
Apr
13
Jul 1
3
Oct
13
Jan
14
Apr
14
Jul 1
4
Oct
14
Jan
15
Apr
15
Jul 1
5
Oct
15
Jan
16
Apr
16
Jul 1
6
Janu
ary
2013
= 1
00 Yen (Japan)
Euro
Real (Brazil)
Kwanza (Angola)
Ruble (Russia)
Tenge (Kazakhstan)

Chapter 3. Investment in oil, gas and coal 81
Drilling is the most costly upstream activity, accounting for around half of the upstream capital cost structure of a well. Drilling costs peaked in 2014 after several years of sustained increase, more than doubling since 2003. Weak demand from oil and gas field operators has led to a 35% slump in onshore spot day-rates for rigs from the peak at the end of 2014. For example, horizontal rig rates dropped from over USD 25 000 per day to USD 16 000 per day in early 2016.
In the offshore sector, particularly deep water, costs rose steeply for a decade. For major projects in West Africa and Brazil, a lack of infrastructure, underdeveloped supply chains and local-content requirements contributed to higher costs. Conditions in the offshore industry have changed considerably with spending cutbacks, which have led to postponements in sanctioning new projects, in particular those in deep water: over 40% of pre-FID projects were delayed in 2015 with only a limited number of new offshore projects sanctioned over the last 12 months, such as Shell's Appomattox development in the Gulf of Mexico and Statoil's Johan Sverdrup field in the North Sea.
Figure 3.10 • Change in global average upstream costs compared with 2014 by component
The offshore sector is coming out of a period during which prolonged high oil prices and strong expectations of a rising number of projects stimulated a big increase in the construction of offshore equipment including jack-ups, semi-submersibles and drillships.16 During this period, most offshore equipment operated at close to full capacity most of the time and key components, such as offshore rigs, were tied up under multi-year contracts. This helped to dampen the rate of cost deflation in 2015. However, the accumulation of
16 Jack-ups are fixed platforms utilised mainly for drilling operation in shallow water; semisubmersibles are floating vessels with structures below sea level; drillships are used for drilling in deep water.
-60% -50% -40% -30% -20% -10% 0%
Support costs
Base metals/raw materials
Engineering services
Subsea equipment
Completion services and equipment
Onshore drilling
Offshore drilling2015
2016

82 Chapter 3. Investment in oil, gas and coal
offshore-project delays and cancellations is now increasing competition among service companies and pushing offshore rates down. Rig utilisation rates in mid-2016 were running below 70%, down from about 90% two years earlier (Figure 3.11). Similarly, the backlog of subsea orders supported activity levels in 2015, but that backlog is disappearing rapidly as the number of awarded projects has declined dramatically in the last 18 months. The industry is expecting a further fall in orders and rates, which could drop by one-third in 2016 compared with 2014.
The global jack-up utilisation rate declined from 86% to 60%, down from a 2013 high that exceeded 90%, while the global semi-submersible working utilisation rate dropped from 91% to below 60%, from a high of 97% in 2013. Average day-rates for jack-up rigs plunged from USD 150 000 per day to below USD 100 000 per day during the first half of 2016. In mid-2008, ultra-deepwater drill ships were under contract for more than USD 650 000 per day, but as of today the daily rate is below USD 400 000. Rates for semi-submersible rigs were approaching USD 500 000 per day in 2008, compared with USD 350 000 daily in the first semester of 2016. As of August 2016, the global offshore rig fleet stands at 900 units, yet only half of those are currently operating.
Figure 3.11 • World offshore rigs utilisation rates
Raw materials prices, especially those of steel and other base metals, have also contributed significantly to deflationary pressure. On average, the cost of raw materials is estimated to account for 20-30% of total upstream costs. In 2015, steel prices plunged by up to 30% due to: a slowdown in overall steel demand in major consuming centres such as Brazil, Russia and China (see Chapter 1); overcapacity in steel production, which has expanded at an average annual rate of 6.2% (OECD, 2016) over the last ten years; and a fall in steelmaking costs, caused by an oversupply of iron ore.
50%
60%
70%
80%
90%
100%
110%
Jan-
2013
May
-201
3
Sep-
2013
Jan-
2014
May
-201
4
Sep-
2014
Jan-
2015
May
-201
5
Sep-
2015
Jan-
2016
May
-201
6
Drillship
Semisubmersibles
Jackp-up

Chapter 3. Investment in oil, gas and coal 83
US shale costs plummet
Costs in the US tight oil and shale industry have fallen further than those in the rest of the upstream sector. According to the IEA Upstream Shale Investment Cost Index (USICI), a new indicator developed for this report to assess trends in underlying costs incurred directly by companies operating in shale plays, average costs in that sector plunged by about 30% in 2015 and a further 22% is estimated in 2016 as drilling activity nose-dived (Figure 3.12).17 This represented a sharp reversal of previous trends. Between 2010 and 2014, high oil prices and expectations of continued increasing production, coupled with an unprecedented low cost of capital and rapid technology improvements, created opportunities for the US tight oil industry to benefit from continuous easy access to financing (see below).
Figure 3.12 • IEA US Shale Investment Cost Index (USICI)
Well completion, mostly hydraulic fracturing activities, represents the most relevant share (over 55%) of costs for the US shale industry. Activity data suggests that completion rates became more resilient in the first half of 2016 compared to continued declines experienced in 2015 when the average number of wells completed per day more than halved. Pricing of completion services have fallen on average between 40% and 65% since the end of 2014 given the steep decrease in demand. As a result, an increasing proportion of hydraulic fracturing capacity was stacked, reaching 9.1 million horsepower by the end of 2015, equivalent to half of the total capacity in the United States.
17 The USICI aims to track changes in capital costs associated with the drilling and completion of shale wells, as well as the construction of required facilities for production across the US shale industry. More information can be found online at www.iea.org/investment.
-
25
50
75
100
125
150
175
-40%
-30%
-20%
-10%
0%
10%
20%
30%
2005
2006
2007
2008
2009
2010
2011
2012
2013
2014
2015
2016
2005
= 1
00
y-o-
y ch
ange
(%)
USICI (%)
Drilling (%)
Completion (%)
Right axis:

84 Chapter 3. Investment in oil, gas and coal
Drilling activity in the US shale sector is also influenced by the increasing exploitation of wells that were previously drilled but not completed and unconnected to the oil infrastructure. Estimates show that the Drilling Uncompleted (DUC) wells inventory peaked at just less than 6 000 wells in the second half of 2014 and since then has declined by 30% falling to levels not seen since 2011. A key reason for this trend is the incentive for operators to bring into production wells where a significant component of the overall cost has already been spent, hence allowing for minimal additional investment with an attractive economic return. Following the partial recovery of oil prices from their January 2016 low, an emerging shift in the sentiment of the North American industry is perceptible, as illustrated by the 2016 half-year results of US Independents and as also reflected in a modest increase in the rig count since its low point in May 2016.
Lower costs are the biggest contributors to lower investment
The headline reductions in upstream investment spending seen in 2015 and 2016 are therefore not only a function of declining activity levels but also of plunging costs. We have estimated to what extent the two single components – upstream costs and activity levels – have contributed to the decline of overall investment. While a firm split is not possible as cost deflation varies by type of asset, region and the status of single projects, we estimate that lower costs accounted for just less than two-thirds of the total fall in upstream investment between 2014 and 2016, with reduced activity levels covering the remainder (Figure 3.13).
Figure 3.13 • Impact of cost deflation and reduced activity on global upstream investment
We anticipate that cost deflation is set to constrain the total level of investment in upstream projects in 2017, and possibly beyond, but the highly cyclical nature of the oil and gas industry means that upstream investment is likely to rebound at some point in the future, leading to

Chapter 3. Investment in oil, gas and coal 85
higher unit costs as demand for services and equipment picks up. As was the case during past cyclical dips in investment, the industry has reacted by cutting personnel, including highly qualified staff. Replacing them during the next upturn may be problematic as many laid-off workers may have left the industry for good, which could cause delays in moving projects forward and also contribute to a rebound in costs (Box 3.3). At the same time, there is evidence that the industry is also enhancing the technical efficiency, including process and operation optimisation, and standardisation of practices, which could help keep cost pressures down in the future.
Box 3.3 • Is the upstream industry heading towards a shortage of skilled personnel?
While the upstream oil and gas sector is a very capital-intensive industry involving complex technology, it remains dependent on a highly skilled and experienced workforce able to deal with difficult technical issues and manage complex projects. Investment cycles over past decades have shaped the current age demographics of the industry, as each successive downturn led to cuts in staff numbers and the ensuing upturn new recruitment. Low oil prices and the resulting pressure on profit margins that affected the industry during downturns in the late 1980s and through the 1990s led to a significant number of job losses and an effective freeze on hiring from universities for almost a decade. The supply of well-educated engineers was also constrained by a pervasive perception of the industry as being “old-fashioned” and less attractive to students as concerns about the impact of fossil fuels on the environment grew. The emergence of new industries in the late 1990s and early 2000s, such as internet, telecommunications and financial services, added to the difficulties faced by the oil industry in attracting large numbers of talented workers.
Recruiting sufficient numbers of skilled personnel may be particularly hard in the coming years. A huge demographic imbalance has already developed, with a large share of the upstream workforce worldwide now approaching retirement age. According to different sources, highly specialised staff is concentrated among the over 55 or under 35 age groups, with a lack of mid-career professionals having 10 to 20 years of experience and able to quickly replace retiring professionals. A recent report by the Independent Petroleum Association of America shows that about 70% of the global workforce is 50 years old or older (IPAA, 2014). This imbalance was partly created by a recent wave of lay-offs, which are particularly evident in the US oil and gas industry. According to recent data released by the US Energy Information Administration, employment in US oil and gas production and support activities has declined by 26% since peaking in the second half of 2014, representing a loss of over 140 000 jobs.18 As many of those who have left the industry are unlikely to return, having found work elsewhere or retired, the industry may find it hard to recruit individuals with the required skills in the future. This translates into a further challenge for companies that need to find the balance between keeping staff costs low while ensuring that the right talent is secured to address the ongoing skills gap.
18 According to data presented by U.S. Energy Information Administration, based on U.S. Bureau of Labor Statistics (2016), Current Employment Statistics (CES).

86 Chapter 3. Investment in oil, gas and coal
Investments in oil midstream infrastructure
Oil transport and storage investment prove to be sticky
Over the decade to 2014, spending in the oil midstream19 broadly followed the upward trend in the upstream and downstream sectors as the main underlying drivers of investment were similar: the changing geography of crude production towards new basins, notably in North America; the continuing eastward shift of the centre of oil demand growth; and government efforts to improve energy security. Midstream investment was both a cause and effect of investment along the rest of the supply chain. Midstream projects encouraged additional investment upstream and downstream by allowing access to previously isolated resources, such as in the Bakken formation and by incentivising refinery upgrades thanks to new connections to additional sources of supply. The economics of oil storage has also improved significantly since mid-2014, boosting investment. The low cost of capital continues to support investment across the sector.
North America sees a boom in oil infrastructure building
The largest increase in midstream spending during the last decade occurred in North America. Before the rapid rise of tight oil output, the bulk of North American crude oil production was located in regions with well-established transport links, such as the Gulf of Mexico, Texas, California and Alaska. The boom in tight oil production, which is concentrated in states and regions that are less well-connected, brought a need to invest in new connections. Over 100 pipeline and storage projects have been undertaken in North America over the last few years with spending amounting to tens of billions of dollars. The largest of these are included in Table 3.2. As a result of these investments, the vast majority of crude oil in North America now drains southward to refineries in the midcontinent and Gulf Coast. This is a marked reversal from the turn of the decade, when refiners in both regions relied upon crude imported via terminals on the Gulf Coast which saw oil move from south to north via pipelines.
Increased North American oil production has brought new opportunities for exporting. In mid-2014, the export of non-licensed US condensate was approved by the US Department of Commerce. Docks, pipelines and storage tanks have since been constructed at several ports, including Brownsville and Corpus Christie. Further legislative changes permitting the export of US crude oil will most likely encourage more investment in the medium term.
19 The term midstream covers transportation by pipeline, rail, barge, oil tanker or truck, storage and wholesale marketing of crude or refined petroleum products.

Chapter 3. Investment in oil, gas and coal 87
Table 3.2 • Selected global midstream investment projects
Project Location Cost
(USD million) Completion
year Operator
Longhorn Pipeline reversal US 375 2013 Magellan Midstream Partners
BridgeTex Pipeline US 1 000 2014
Magellan Midstream Partners / Plains All
Gulf Coast Pipeline Project US 2 300 2014 Transcanada
China – Myanmar crude oil pipeline
China 2 500 2015 CNPC
Line 9 Pipeline reversal Canada 800 2015 Enbridge
Fort Saskatchewan Terminal Canada 80 2015 Keyera Energy
Yangpu Terminal China 1 100 2016 Vopak/SDIC
Jurog Rock Cavern storage terminal
Singapore 1 000 2016 Vopak
Heartland Energy Center Canada 200 2016 Petrogas / ATCO
Rubis Terminal expansion Netherlands 150 2016 Rubis
Funadhoo oil product storage terminal
Maldives 35 2016 Government
Paranagua Terminal Brazil 60 2016 Cattalini Terminals
Jubail Terminal Saudi Arabia 400 2017 Vopak / SABIC
Raz Markaz storage terminal Oman >300 2017 Oman Tank Terminal
Oil storage attracts financing globally
The economics of oil storage have improved significantly due to high, non-exportable tight oil output in North America and lower oil prices globally. For example, working storage capacity at the Cushing, Oklahoma terminal – the delivery point of the West Texas Intermediate futures contract on the New York Mercantile Exchange – was expanded by 30 million barrels between 2010 and 2016. In other OECD countries, investment levels have

88 Chapter 3. Investment in oil, gas and coal
been maintained in storage to benefit from the prolonged period of contango,20 as well as to respond to energy security concerns. Examples include the 2.3-mb/d increase in capacity at the Gdansk terminal in Poland and the expansion of storage at the Amsterdam-Rotterdam-Antwerp oil complex.
Demand growth drives investment in the emerging economies
Midstream investment in the emerging regions over the past decade has essentially been driven by a need to expand supply chains to meet rising demand, notably in Asia – the main engine of the world oil market. This trend is expected to persist over the medium term. Infrastructure has been built in the vicinity of the Malacca Straits through which approximately 15 mb/d of oil transits daily. Singapore was the main location of this investment initially, but due to the high cost of land in that country, storage terminals have been built in neighbouring Indonesia and Malaysia. The most recent – and probably last – storage site in Singapore is the ongoing expansion of the underground Jurong Rock Caverns. By the time the site opens, expected at the end of 2016, it will be capable of holding 7.5 million barrels of oil and will have cost close to USD 1 billion. Planned storage terminals in the region include 16.3 million barrels of capacity in Indonesia’s Batam Free Trade Zone costing in excess of USD 850 million and a new 10 million barrels project on Nipah Island, which is expected to cost around USD 500 million.21 In Malaysia, an expansion of VTTI’s Tanjung Pelepas facility is due to be completed shortly.
China’s largest projects form part of the country’s programme to establish a Strategic Petroleum Reserve. Initially reported to involve 500 million barrels, the capacity of facilities dedicated to hold the reserve is now expected to total over 600 million barrels. This includes around 130 million barrels of capacity in hard rock caverns that are due to be commissioned over the next five years. Vast commercial storage tanks have also been built above ground at Yangpu, Tianjin and Zhengzhou. Others are planned in Guangdong, Shandong, Zhejiang and Jiangsu. China has also invested in new pipeline links. The USD 2.5 billion, 700-km China-Myanmar crude oil pipeline was inaugurated in 2015, enabling Middle Eastern crude to bypass the Malacca Straits.
In the Middle East, little midstream investment, save for the expansion of a small number of storage terminals in Iran, Iraq and Saudi Arabia, has been made in the Persian Gulf. The United Arab Emirates and Oman have built some pipeline and storage facilities, taking advantage of having coastline outside the Straits of Hormuz. The largest project is Oman’s 200-million barrel Ras Markaz terminal, which is expected to
20 In contango, contracts for prompt delivery trade at a discount to those for delivery at a later date. 21 In July 2016, media sources reported that Indonesia Energy Ministry is currently planning to develop its Strategic Petroleum Reserves covering 30 days of emerging stocks, equivalent to about 45 million barrels.

Chapter 3. Investment in oil, gas and coal 89
cost over USD 300 million. When it opens in 2017, it will be one of the world’s largest oil storage hubs. Other smaller projects in Oman include the USD 75 million Salah terminal, which opened in 2015 and the USD 80 million Al Jifnain terminal in Muscat, commissioned in 2017. Additionally, to bypass the Straits, the United Arab Emirates built the 400-km 1.5-mb/d Abu Dhabi Crude Oil Pipeline, which was inaugurated in 2012 at a cost of USD 3.3 billion.
Investment in oil refining Most of the upstream investments arise from the sheer necessity to replace output of fields that decline naturally at 9% per year on average. Only a relatively small amount is invested in increasing production to meet incremental demand. In refining, there is no equivalent to the natural decline of oil and gas fields. Once built, a refining complex can continue operating essentially forever, with necessary maintenance and upgrades, and provided its economics are positive. As refining assets are not depletable, and because of the current overcapacity, downstream investment has even more pronounced cycles than that for upstream. Global investment declined from the peak reached in 2008, as the refining industry is trying to absorb the build-up of the new capacity (Figure 3.14).
Figure 3.14 • Investment in oil refining by region
Note: Estimated overnight investments into new refinery sites and secondary units at existing refineries (about 80% and 20% respectively, of the cumulative total for 2000-15). Figure includes distillation and secondary processing units. MENA = Middle East and North Africa; FSU includes Former Soviet Union states.
80
85
90
95
0
10
20
30
40
50
60
2000
2001
2002
2003
2004
2005
2006
2007
2008
2009
2010
2011
2012
2013
2014
2015
mb/
d
USD
(201
5) b
illio
n
Asia
Russia/FSU
MENA
sub-Saharan Africa
Europe
Latin America
North America
Global capacity
Right axis:
Investment

90 Chapter 3. Investment in oil, gas and coal
Investments in oil refining have been driven mainly by the need to meet rising demand in emerging economies.22 Traditionally, refineries have been built closer to consumers, rather than to crude oil production, so as simplify downstream logistics and to exploit feedstock sourcing flexibility. This is why the shift in the centre of oil demand towards Asia has had such profound implications for the refining sector. Existing oil refineries require continuous maintenance (including replacement of physical assets) and are subject to upgrades in order to adapt to feedstock qualities and evolving environmental standards, which has supported investment in all regions.
Asia dominates refining investment
Since 2000, developing Asian countries accounted for half of all the investment in new refining capacity. They contributed more than 60% of global demand growth over that period. China alone has been responsible for a third of both total refinery investments and global demand growth. In the Middle East, Saudi Aramco has been the main investor in refining over the last few years. As completion of their major refining expansion programme approaches, the focus is expected to shift to Iran, where the removal of sanctions has raised hopes for two major projects to install condensate splitters.
OECD countries have accounted for only a small fraction of global investment in refining in recent years. In most of them, demand has been in decline for about a decade, so there is, in principle, no need to build new refining capacity such that operators have been closing down unprofitable sites or converting them to storage, terminal operations or bio-refineries (for example, at Total-La Mede in France). In Europe, new investments are now rare, as the region’s refineries are struggling to compete with better-placed US, Middle Eastern and Russian rivals. Since 2007, over 2 mb/d of Europe’s refining capacity has been shut down. Although some investment has gone into upgrading units, only a single new refinery is being built – a 200 kb/d plant in Turkey, scheduled for completion in 2018. By contrast, in the United States, the rapid growth in the availability of domestic feedstock has sparked a downstream renaissance, despite the contraction of domestic demand since 2007. Many operators started building condensate splitters, topping units and upgrader units to adjust to the new feedstocks and to comply with tighter specifications for sulphur content in transport fuels. The US Gulf Coast now has the biggest concentration of refining capacity in the world with about 9 mb/d of distillation capacity – 10% of the world total. Refineries there process both domestic and imported crude oil, taking advantage of access to the world’s biggest national market and to export outlets in Europe, South America and West Africa.
22 Non-OECD countries account for the majority of the 14 mb/d of excess capacity globally, but this is mainly because of insufficient secondary processing units, the poor condition of some equipment, non-optimal locations or complicated logistics.

Chapter 3. Investment in oil, gas and coal 91
In Russia, refiners embarked on a government-mandated large-scale upgrading capacity expansion programme a few years ago in order to lower the relatively high fuel oil yields and produce more higher-value diesel and gasoline. The slide in oil prices has postponed some of these projects, while sanctions have also complicated construction and technology acquisition. In Brazil, Petrobras has had to limit its ambitious downstream expansion plans due to cash flow constraints.
While new refining projects constitute the bulk of the total investment number, refinery operations also demand constant spending on maintenance to ensure process safety and reliability. Even in Europe, where few new refining units are being built, there is still a large need for spending on maintaining existing units. Globally, over the last decade and a half, refiners spent USD 370 billion on maintenance, equal to over 40% of total capital spending in refining. Annually, some USD 25-30 billion is spent on seasonal maintenance programmes. The United States is the largest market for maintenance, accounting for a quarter of global spending, while Europe absorbs 16%.
Financing in the oil and gas sector
Upstream
The rise of the North American shale industry led to a big increase in the share of global upstream investment taken by Independents and a corresponding drop in that of the Majors and NOCs, which previously accounted collectively for over two-thirds of total spending. The share of Independents share jumped from 10% in 2007 to about 16% in 2014, but has fallen back to just 8% in 2016 (Figure 3.15). The contribution of NOCs increased from 36% to 44% between 2014 and 2016, an all-time high, as a result of spending cuts by others.
Figure 3.15 • World upstream oil and gas investment by company type
Note: Investment figures are in 2015 dollars.
24%
44%
8%
24%21%
36%16%
27%27%
36%10%
27%
Majors NOCs US independents Other private companies
2007400 USD billion
2014780 USD billion
2016440 USD billion

92 Chapter 3. Investment in oil, gas and coal
Majors and Independents
The spending plans of the oil Majors have been reduced in line with the drop in own cash flow and all, with the exception of Eni, have maintained their dividends. This has been achieved by reducing operating costs and share buybacks and scaling back capital investment. Nevertheless, the net debt of the Majors and large private oil companies has increased sharply since 2014 as they have sought to maintain dividends (Figure 3.16).
Figure 3.16 • Sources of finance for world upstream oil and gas investment by type of company
Note: The estimates shown for Majors and other private categories are for the top 20 listed companies by market capitalisation excluding NOCs (such as PetroChina and Statoil) and US-based E&P Independents. US E&P Independents consist of 30 companies heavily involved in light tight oil with their market capitalisation ranging from large (e.g. Anadarko and EOG resources) to small (e.g. Bill Barrett and Comstock). Other comprises mostly asset sales. Net debt is total debts minus cash and cash equivalents. Source: Analysis based on company disclosures and Bloomberg LP (2016), Bloomberg Terminal.
US exploration and production (E&P) Independents do not have the magnitude of financial market access that the Majors enjoy. For many US E&P Independents with heavy exposure to tight oil, negative earnings have squeezed cash flows, requiring them to increasingly raise equity and debt, as well as sell assets to compensate for lower cash flow (Figure 3.17). Preliminary analysis of earnings in the first quarter of 2016, when oil prices reached their lowest levels, indicates that the net debt/equity ratios of these companies stayed high. Given the shorter tight oil investment cycle, Independents were able to cut back spending by 45% between 2015 and 2016 as their cash flow was squeezed.
Since the beginning of 2015, the credit ratings of over 130 US E&P Independents have been downgraded by major credit agencies, leaving many of them at non-investment grade. This has raised their cost of debt, further reducing the profitability of investments already hit by lower oil prices. This is exacerbating volatility in the US shale industry, which has demonstrated some characteristics of a financial bubble (Box 3.4).
0%
10%
20%
30%
40%
50%
60%
70%
80%
90%
100%
2010-13 2015 2010-13 2015
Majors and other private companies US E&P independents
Other
Net debt
Equity
Operatingcash flow

Chapter 3. Investment in oil, gas and coal 93
Figure 3.17 • Net debt/equity ratio of upstream oil and gas companies by company type
Note: See explanation under Figure. 3.16.
Source: Analysis based on company disclosures and Bloomberg LP (2016), Bloomberg Terminal.
Box 3.4 • Was North America’s shale gas and tight oil revolution a financial bubble?
History shows that the emergence of new technologies and their large-scale deployment has often been accompanied by euphoria, over-optimism and debt-fuelled growth, in some cases triggering a financial bubble. The North American revolution in shale gas and light tight oil has displayed some of these characteristics. High and stable oil prices between 2012 and 2014, exceptionally low interest rates and rapid technological improvements together helped to sustain a strong flow of investment into the industry. As production ramped up between 2010 and 2014, the importance of cash flow and so the exposure to oil prices increased, enhancing vulnerability to fluctuations in market and financing conditions.
Fracking technology also led to new business models. Shale projects are typically not well suited to the organisational structure of large oil companies that are geared mainly towards large projects with long lead times. As a result, production growth has been led by smaller Independents with much more limited financial capabilities. These companies rely more on new external capital sources to finance their own projects. Their spending exceeded cash flow even at high oil prices, as production and drilling increased. While some production was hedged, the extent and duration of the hedging was considerably less than that of the liabilities. The collapse of oil prices has caused many investors to lose large amounts of money.
These characteristics, coupled with investor willingness to accept a high level of risk, are typical of financial bubbles. Nevertheless, as with internet and the railroads before it,
0.0
0.2
0.4
0.6
0.8
1.0
2013 2014 2015 Q1 2016 2013 2014 2015 Q1 2016
Majors and other private companies US independents

94 Chapter 3. Investment in oil, gas and coal
unconventional oil and gas technology will continue to have a major long-term impact on the broader industry.23 Over the last two years, the shale industry has continued to improve technology and has lowered costs considerably, as our USICI shows (see above). Despite 90 bankruptcies in the US oil and gas sector between January 2015 and July 2016, and an expectation of more to come, the physical assets often continue to produce under new ownership and without the previous debt overhang. Indeed, investor interest in pooling capital to buy distressed oil and gas assets has emerged in the first half of 2016. In addition, several companies that were subject to strained financial conditions filed for Chapter 11 bankruptcy, thereby restructuring their debt and maintaining operations.
National oil companies
As with private companies, there are big differences in the financial conditions faced by NOCs around the world. Listed NOCs with similar operations to those of the Majors have generally cut capital spending and asset acquisitions in line with reduced cash flow. They have also made use of external financing, but to a lesser extent than the Majors. In countries such as Russia, this is partly explained by the depreciation of the local currency.
For unlisted NOCs, including Saudi Aramco, the Abu Dhabi National Oil Company, Mexico’s Pemex, Venezuela’s PDVSA and the Nigerian National Petroleum Corporation, spending is controlled by the government, with differing domestic economic and political priorities. In Saudi Arabia, United Arab Emirates and Qatar, governments have moved to raise capital via international bond issues to fill the gap in public finances caused by lower oil revenues in order to maintain NOC investment and their share of global oil output. Sovereign wealth funds have also provided a source of buffer financing to assist the dominant strategy of maintaining the country’ share of global oil markets.
Other countries, having high structural economic dependence on the oil sector and lacking any significant fiscal buffers to counterbalance oil price decline, have been more severely hit, with repercussions for their economic growth, current accounts and national currency evaluations. For example, Iraq has come under pressure to maintain public spending on security, but is struggling to pay the salaries and pensions of government officials who were hired when oil prices were higher, forcing it to take out loans from international financial institutions. Capital spending in the oil sector has been cut to reduce the budget deficit. As a result, the planned expansion of oil production capacity is unlikely to be achieved for now, though output should hold up. Venezuela and Nigeria are also experiencing severe financial difficulties.
23 For the projected contribution of North America’s tight oil and shale gas to future supply, please see IEA Medium-Term Gas Market Report 2016 and World Energy Outlook series.
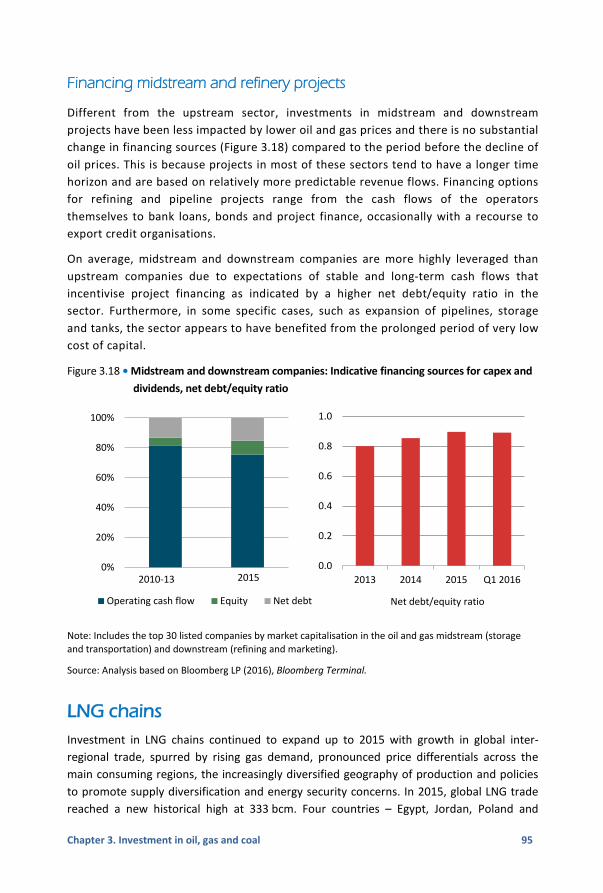
Chapter 3. Investment in oil, gas and coal 95
Financing midstream and refinery projects
Different from the upstream sector, investments in midstream and downstream projects have been less impacted by lower oil and gas prices and there is no substantial change in financing sources (Figure 3.18) compared to the period before the decline of oil prices. This is because projects in most of these sectors tend to have a longer time horizon and are based on relatively more predictable revenue flows. Financing options for refining and pipeline projects range from the cash flows of the operators themselves to bank loans, bonds and project finance, occasionally with a recourse to export credit organisations.
On average, midstream and downstream companies are more highly leveraged than upstream companies due to expectations of stable and long-term cash flows that incentivise project financing as indicated by a higher net debt/equity ratio in the sector. Furthermore, in some specific cases, such as expansion of pipelines, storage and tanks, the sector appears to have benefited from the prolonged period of very low cost of capital.
Figure 3.18 • Midstream and downstream companies: Indicative financing sources for capex and
dividends, net debt/equity ratio
Note: Includes the top 30 listed companies by market capitalisation in the oil and gas midstream (storage and transportation) and downstream (refining and marketing).
Source: Analysis based on Bloomberg LP (2016), Bloomberg Terminal.
LNG chains
Investment in LNG chains continued to expand up to 2015 with growth in global inter-regional trade, spurred by rising gas demand, pronounced price differentials across the main consuming regions, the increasingly diversified geography of production and policies to promote supply diversification and energy security concerns. In 2015, global LNG trade reached a new historical high at 333 bcm. Four countries – Egypt, Jordan, Poland and
0%
20%
40%
60%
80%
100%
Operating cash flow Equity Net debt
2010-13 2015
Net debt/equity ratio
0.0
0.2
0.4
0.6
0.8
1.0
2013 2014 2015 Q1 2016

96 Chapter 3. Investment in oil, gas and coal
Pakistan – began to import LNG for the first time, bringing to 33 the total number of importers. The emergence of major new producing regions, notably in the United States, Canada, Australia and East Africa, has driven a wave of liquefaction projects over the last few years, although several of those are currently on hold in light of the slowing down of global gas demand growth. Since 2009, seven projects in Australia and five in the United States have obtained FIDs for a total nominal capacity exceeding 170 bcm – equal to one-third of current global capacity.
Spending on liquefaction falls back as projects reach completion
Between 2005 and 2016, cumulative investment in LNG liquefaction plants worldwide amounted to USD 260 billion (in 2015 dollars).24 Australia alone accounted for about 45%, a massive amount considering the size of its economy, with Qatar and the United States accounting for 20%. Annual spending rose from about USD 15 billion in 2005 to a peak of more than USD 35 billion in 2014, falling back slightly in 2015 to USD 34 billion (Figure 3.19). Initially, the increase was driven mainly by higher unit costs after 2009 (largely related to the development of several Australian projects – see section below). Projects in the United States, which are now contributing a growing share of new capacity, were the exception, as the redevelopment of LNG receiving terminals as export facilities has lowered costs. Capacity additions were broadly constant from 2010 to 2013, but since 2014 have picked up as several projects are commencing operations.
Figure 3.19 • World LNG liquefaction investment
Note: The investment estimates shown here correspond to actual capital spending in the year that it occurs and not overnight spending. Source: Analysis based on Goldman Sachs and Cedigaz data.
24 As described in Box 3.1, investment estimates for LNG liquefaction terminals differ from other estimates in the chapter. Reported annual project spending is presented, rather than overnight spending. Upstream components of integrated projects are not included.
50
125
200
275
350
425
500
575
650
0
5
10
15
20
25
30
35
40
2005
2006
2007
2008
2009
2010
2011
2012
2013
2014
2015
2016
2017
2018
2019
2020
bcm
per
yea
r
USD
(201
5) b
illio
n Australia
Africa
Middle East
North America
Russia
Europe
Others
CapacityRight axis:

Chapter 3. Investment in oil, gas and coal 97
Nine new projects with total nominal capacity of over 70 bcm/year entered, or are set to enter, operation in 2015 and 2016, which will boost global capacity by about one-fifth compared to 2014. Four plants account for around 80% of total additional capacity, with Australia together with the first US export plant at Sabine Pass covering most of the rest. Only in 2009 has such a large amount of capacity come onstream over such a short period. This highlights the long lead times and cyclical nature of LNG investment that typically tends to materialise in waves following gas discoveries, periods of relatively high prices and expectations of demand growth, regardless of market conditions that might have changed significantly in the meantime. Moreover, the distribution of capital spending in new LNG infrastructure over the last ten years shows that LNG investment tends to concentrate in specific locations. Following a wave of investment in the mid-2000s in Qatar, still the world’s largest LNG exporter, the bulk of spending moved to Australia and is now shifting towards the United States.
The cost of building liquefaction plants depends on location and local cost factors. The Qatari projects built in the early 2000s benefited from their location in already industrialised areas with access to established infrastructure, relatively low-cost materials and equipment, and very competitive labour costs. The cost of those projects averaged USD 450-500 per tonne in 2015 prices. In contrast, average Australian plant costs have been around USD 2 000-2 500 per tonne. Costs were increased by simultaneous projects increasing competition for resources and labour, remote locations far from established construction centres and, in some cases, in environmentally sensitive areas, and the appreciation of the Australian dollar between 2011 and 2014. In the United States, the majority of LNG projects under construction are set to benefit from infrastructure already in place, including pipelines, storage tanks and mooring facilities for vessels, reducing costs and speeding up construction times. The cost of projects launched over the last four years are estimated to average around USD 750-800 per tonne (Figure 3.20).25
Investment in liquefaction is set to fall sharply over the next few years as a result of fewer projects and lower unit costs, thanks to the predominance of cheaper US export facilities. Fifteen LNG projects (including expansion phases) with a combined capacity exceeding 135 bcm are due to be completed over the next few years. With the exception of Yamal LNG in Russia, Cameroon floating LNG, Petronas’s FLNG 2 and the recently announced expansion of Indonesia’s Tangghu 3 (the only FID taken in 2016 at the time of writing), all are based in the United States and Australia. The United States alone accounts for about 60% of forthcoming capacity additions. The rapidly emerging oversupply of LNG and lower gas prices has undermined the prospects for new LNG projects. According to the IEA Medium-Term Gas Market Report 2016, 13 new LNG projects with an overall capacity exceeding 140 bcm were delayed or cancelled in 2015 and in the first half of 2016 (IEA, 2016c).
25 Excluding the Corpus Christi terminal.

98 Chapter 3. Investment in oil, gas and coal
Figure 3.20 • LNG liquefaction plant investment costs by FID date
Source: Analysis based on Cedigaz and Goldman Sachs data.
Regasification capacity rises steadily
Global regasification capacity expanded at over 5% per year on average over the last five years. Regasification capacity surpassed 1 000 bcm worldwide for the first time in 2013 and grew to almost 1 100 bcm by 2015 (Figure 3.21). Japan and Korea hold the largest and third-largest regasification capacity in line with their entire dependence on LNG imports to meet domestic gas consumption. The United States ranks second, with an overall capacity close to 200 bcm per year although the utilisation rate of its fleet is at extremely low levels due to large domestic gas production. Regasification capacity has grown fastest in China, which was responsible for about 20% of the total increase since 2010 (Box 3.5).
An emerging trend over the last years has been the rising deployment of Floating Storage Regasification Units (FSRUs) as a way for new countries to enter the LNG market or to expand existing regasification capacity. There are 18 FSRUs currently in operation in 14 countries, with the vast bulk of floating terminals having entered into operation in the last five years. Key elements that have supported the diffusion of FSRUs include significantly lower investment per unit of energy compared with traditional onshore terminals, a higher degree of flexibility to accommodate seasonal needs or the benefit of upswings in price movements. Moreover, FSRUs can be realised in a much shorter period of time, as new ships or reconversion of LNG vessels, and can sometimes avoid long and time-consuming permitting procedures. However, FSRUs have also some limitations including the potential exposure to adverse meteorological conditions, limited storage capabilities and operating expenses on average higher than onshore terminals. While the number of FSRUs is expected to grow over time, in the near future their share of total regasification capacity is not expected to increase dramatically above the current range of 12% to 14%.
0
500
1000
1500
2000
2500
2000 2002 2004 2006 2008 2010 2012 2014 2016
USD
(201
5) p
er to
nne Australia
Middle East
North America
Others

Chapter 3. Investment in oil, gas and coal 99
Figure 3.21 • World LNG regasification terminal capacity
Box 3.5 • The expansion of Chinese gas infrastructure
Although the contribution of natural gas to the Chinese primary energy mix remains modest, at about 6% in 2015, its consumption has been increasing rapidly. In the five years to 2015, the country’s gas use almost doubled to 190 bcm,26 underpinned by policies aimed at diversifying away from coal and improving urban air quality, penetration in the residential heating sector in large parts of China and switching from oil in the industrial sector. The growing role of gas has been accompanied by the development of related gas infrastructure, including import facilities and domestic pipeline networks. In the early 1990s, China began building major pipelines, including the 12 bcm per year West-East Pipeline-1, the 12 bcm per year Sichuan-East Pipeline and the 3 bcm per year Shaanxi-Beijing-1 to transport gas from remote production areas to centres of demand on the coast and in the Lower Yangtze River and Bohai Bay Rim regions. In 2011, China completed its first international pipeline, with 30 bcm per year capacity, to bring gas in from Turkmenistan; in 2013, the 12 bcm per year Sino-Myanmar pipeline bringing offshore Myanmar gas to south-western China was completed. China has also expanded its LNG regasification capacity. Imports only starting in 2006. At the end of 2015, China’s total regasification capacity had reached 56 bcm per year, a fivefold increase over 2010. As of June 2016, seven new terminals had been approved, which will add almost 28 bcm to the country’s capacity – equal to 40% of all the capacity under construction globally.
26 Data for 2015 are preliminary.
0
200
400
600
800
1 000
1 20020
00
2001
2002
2003
2004
2005
2006
2007
2008
2009
2010
2011
2012
2013
2014
2015
bcm
per
yea
r
Others
Turkey
France
India
United Kingdom
China
Spain
Korea
United States
Japan

100 Chapter 3. Investment in oil, gas and coal
The availability of competitively priced gas supplies, coupled with a large potential for demand growth and the expansion of natural gas infrastructure, could facilitate faster than expected penetration of natural gas use in the country. But big uncertainties remain. Chinese NOCs have traditionally played the leading role in the development of gas infrastructure in China. The expected reform of NOCs, including the creation of a national pipeline grid operator and implementation of third-party access to LNG terminals, might enhance the efficiency of China’s gas system and significantly increase the poor utilisation rates of some existing terminals. In that case, some of the proposed new terminals might be delayed or cancelled.
Coal Worldwide investment in coal supply dropped by 9% in 2015, to less than USD 70 billion, a level not seen since 2005. China accounted for the vast majority of the decline. According to data reported by the National Bureau of Statistics, investment in China’s coal mines fell by 14% in 2015 and 34% in the first half of 2016 (compared with the same period the year before).
Figure 3.22 • Coal investment in selected regions and thermal coal price
The downward trend in coal investment is similar in most other parts of the world. As in the case of oil and gas, investment in coal has followed the downward trend in coal prices with a lag of about a year or so (Figure 3.22). A spike in coal prices in 2011 and strong growth in domestic coal demand led to a surge in investment in China and the main exporting countries in 2012, but lower prices dragged investment lower thereafter. Chinese
01-01-2007 27-09-2009 23-06-2012 20-03-2015
40
60
80
100
120
140
160
180
200
220
0
50
100
150
200
250
300
350
400
450
2007
2008
2009
2010
2011
2012
2013
2014
2015
USD
per
tonn
e
2007
= 1
00
export-oriented companies
Main US companies
China
Thermal Coal
Coal investments index
Coal price (right axis):
Thermal coal

Chapter 3. Investment in oil, gas and coal 101
investment in 2012 was three times the level of 2007, but then fell back to little more than the level of 2010. Investment by export-oriented companies27 increased even faster, but also declined more quickly after 2012. By contrast, US investment remained flat in 2012, but then fell sharply. More than 50 US companies, including the largest producers, have filed for bankruptcy protection since that time, with the number accelerating since 2014. Capital spending by coal companies around the world is now focused on projects aimed at improving productivity and lowering operating costs.
China’s coal industry dominates global investment. China increased production by 1.7 Gt between 2010 and 2014, with heavy investment in new mines and maintaining or ramping up production at existing mines. Investment more than doubled between 2006 and 2012 to around USD 65 billion. This compensated for the closure of over 10 000 small mines for safety and environmental reasons. Domestic coal demand has unexpectedly slowed since then, leading to a large amount of overcapacity. The current capacity of active or mothballed mines currently stands at almost 5.5 Gt/year, while demand is running at about 4 Gt, of which 200 Mt is met by imports. This overcapacity would have been avoided had investments in the early 2010s not been so large: we estimate that China was overinvesting in coal by about 50% at its peak in 2012 (Figure 3.23). To address overcapacity, the government has introduced controls on new investment and has stepped up efforts to eliminate inefficient and unsafe capacity. Investment already fell to less than USD 30 billion in 2015, which is much more in line with what is required to keep supply in balance with demand.
Figure 3.23 • Coal investment in China
27 AngloAmerican, BHP Billiton, Glencore and Rio Tinto.
0
10
20
30
40
50
60
70
2006
2007
2008
2009
2010
2011
2012
2013
2014
2015
USD
bill
ion China investment in
demand-supply balance
China "actual"investment

102 Chapter 3. Investment in oil, gas and coal
The main exception to the decline in coal investment since 2012 is India. The government’s “round-the-clock energy for all” and “Make in India” policies are helping to push up coal demand, with the majority of new coal supplies coming from domestic production. The government is targeting 1.5 billion tonnes (Gt) of output by 2020. Investment by coal producers, especially state-owned Coal India, which accounts for 80% of the country’s production, is rising accordingly. Coal India increased capital expenditure in coal mining by around 20% to over USD 800 million in 2015 and plans to spend even more in 2016. Together with India, coal output has grown significantly in Australia, the largest coal exporter. While new greenfield investment almost halted in response to changes in market expectations, significant investments had been sanctioned before 2012. Capacity totalling 21 million tonnes (Mt) started in 2015, and 60 Mt started between 2013 and 2014.
Box 3.6 • Transportation infrastructure is key to understanding the economics of coal- and gas-
fired power generation
Investment in gas-fired power generation in many developing Asian countries has remained at modest levels (see Chapter 4) despite recent falls in LNG prices and the environmental and flexibility benefits of gas power. In many case, preference is still given to coal-fired plants. This is mainly because of economic and energy security considerations. Another reason is the much larger investment needs associated with gas-fired power when the outlays required for the full supply chain are taken into account. Midstream infrastructure, in the form of pipelines, liquefaction and regasification terminals, typically represents 40% of the capital costs of developing gas-fired power generation capacity in Asia, compared with only 10% for coal-based power (Figure 3.24). The upstream component for gas, at 25% of total investment needs, is also double that for coal power. As such, gas, more so than coal, requires greater co-ordination in terms of matching upstream development with contracted gas off takers in the power sector as well as an appropriate market framework and financing for infrastructure development. These factors have been generally more supportive in the United States and the Middle East, the two largest destinations for gas power investment in 2015. And, as described in Box 3.5, the rise of gas infrastructure in China has started to facilitate greater uptake there. Still, this capital structure signals a challenge for newer markets in Asia and other developing countries where gas infrastructure remains relatively underdeveloped.

Chapter 3. Investment in oil, gas and coal 103
Figure 3.24 • Investment needs related to new gas and coal-fired power generation in importing Asian countries by component
Note: Calculation assumes a 1 GW mid-merit, Asian-based power plant running on imported coal and LNG.
Coal mining typically has much lower capital expenditure (capex) and higher operational costs than that for production of other fossil fuels. However, for surface mines, the accounting distinction between investment and operating costs is often blurred. Notwithstanding this challenge, the investment needed to maintain production in an active mine is typically more than an order of magnitude lower than oil on an energy-based comparison. One of the impacts of this split of capital and operational spending, combined with the lower upfront investment needs of coal transport infrastructure, is that the share of the upfront infrastructure investment costs for bringing coal-fired electricity to market are significantly lower than for bringing gas-fired electricity to market (Box 3.6). Energy investment accounting that groups upstream and power sector spending in different categories hides this, but when considered together they help to explain the general preference for coal-fired power generation value chains in countries where fuel is generally imported (see Chapter 4).
0%
10%
20%
30%
40%
50%
60%
70%
80%
90%
100%
Coal Gas
Upstream
Infrastructure
Power plant

104 Chapter 3. Investment in oil, gas and coal
References
Bloomberg LP (2016), Bloomberg Terminal (accessed 10 July 2016).
IEA (2016a), Medium-Term Oil Market Report 2016, OECD/IEA, Paris.
IEA (2016c), World Energy Outlook 2016, OECD/IEA, Paris, forthcoming.
IEA (International Energy Agency) (2016c), Medium-Term Gas Market Report 2016, OECD/IEA, Paris.
IPAA (2014), Profile of Independent Producers, Independent Petroleum Association of America, www.ipaa.org/wp-content/uploads/downloads/2014/07/2012-2013ProfileOfIndependentProducers.pdf (accessed 5 September).
OECD (Organisation for Economic Co-operation and Development) (2016), OECD Steelmaking Capacity Portal, available at: www.oecd.org/sti/ind/steelcapacity.htm (accessed 5 September).
US Department of Labor, Bureau of Labor Statistics (2016), Current Employment Statistics, www.data.bls.gov/cew/apps/data_views/data_views.htm#tab=Tables (accessed 10 July 2016).
US EIA (United States Energy Information Administration (2016), “Oil and natural gas production jobs in May were 26% lower than in October 2014,” U.S. Energy Information Administration, www.eia.gov/todayinenergy/detail.cfm?id=27392 (accessed 5 September).

Chapter 4. Investment in electricity and renewables 105
4. Investment in electricity and renewables
Highlights
Global electricity sector investment rose 4% to a record USD 682 billion in 2015. Generation accounted for over 60% of the total, and networks for the rest. Nearly 55% of investment went to countries in Asia, notably China (31%) and India (7%). North America and Europe took one-third of investment, driven by renewables policies, replacement of retired coal-fired plants and ageing network assets.
Investment in renewables-based generating capacity edged down by 2% to USD 288 billion, or 70% of total generation investment and over two-and-one-half times that of fossil fuel generation. Renewables investment has remained stable since 2011, but will generate one-third more electricity on an annualised basis thanks to technological progress and unit cost reductions. Globally, the capital cost of onshore wind has fallen by 20% and that of utility-scale solar PV by more than 60% since 2010. For the first time, investment in renewables-based capacity generates enough power to cover global electricity demand growth in 2015.
Fossil fuel generation investment fell 8% to USD 111 billion, the lowest level in over five years, due to fewer gas-fired capacity additions. While gas power expanded in the United States, weak fundamentals and insufficient market design in Europe and underdeveloped infrastructure in developing countries have constrained investment globally. China continued to add a lot of coal-fired capacity, contributing to the emergence of generating overcapacity as electricity demand growth weakened.
Nuclear capacity additions, at over 10 GW, reached their highest level in over two decades, representing investment of USD 21 billion. China comprised most of this and most of the over 65 GW in construction globally at the end of 2015. Neither the United States nor Europe is on track to renew their ageing fleets.
Electricity networks investment grew to over USD 260 billion in 2015. Some 55% of spending on transmission and distribution was to meet new demand, 35% to upgrade ageing assets and 10% to integrate variable renewables. At USD 1 billion, grid-scale battery investment was ten times higher than in 2010 and was 10% of electricity storage investment, with the rest mostly from pumped hydro storage.
Around 95% of electricity generation investment took place under business models based on regulations that alleviate the risk of revenue shortfalls for generators. Since 2010, the share of investment in competitive wholesale markets has fallen, while that in single-buyer structures, mostly within non-OECD countries, and under renewables-support schemes has risen.

106 Chapter 4. Investment in electricity and renewables
Overview
Low-carbon sources and networks dominate investment
Global investment in electricity generation capacity, networks and storage, as measured by the cost of new assets that came online, reached a record United States dollar (USD) 680 billion in 2015, up 4% on the previous year and 80% on 2005 in inflation-adjusted terms (Figure 4.1).1 Electricity investment has been broadly stable since 2011 after a period of rapid growth over the previous seven years. The slowdown reflects fewer fossil fuel generation capacity additions and falling costs for solar photovoltaics (PV) and wind. In 2015, the power sector accounted for 42% of energy supply investment, up from 39% in 2005, as a result of the growth of electricity in the energy mix as well as changes in relative cost (see Chapter 1).
Figure 4.1 • Global investment in power generation, electricity networks and demand growth
The results of our analysis of electricity investment reveal three important trends. First, a major
shift in investment towards low-carbon sources of generation is underway. At USD 288 billion in
2015, or over 40% of the total, renewables are firmly established as the largest source of power
investment. Rapid cost deflation in wind and solar PV, technology progress and more widespread
deployment have led to a 40% jump in capacity additions and a one-third increase in annualised
output since 2011. Easier financing, new business models and clearer long-term price signals,
underpinned by supportive policies, have driven investment despite low fossil fuel prices. The
investment in renewables-based capacity generates more than enough electricity to cover global
electricity demand growth in 2015. When combined with the power expected from the new
1 Unless stated otherwise, all investment numbers are presented in constant 2015 USD. See Box 4.1.
-1%
0%
1%
2%
3%
4%
5%
6%
7%
8%
0
100
200
300
400
500
600
700
800
2000
2001
2002
2003
2004
2005
2006
2007
2008
2009
2010
2011
2012
2013
2014
2015
USD
(201
5) b
illio
n
Fossil fuel Nuclear Renewables Networks Annual electricity demand growth (right axis)

Chapter 4. Investment in electricity and renewables 107
nuclear plants brought online, and after accounting for nuclear retirements, the low-carbon
generation investment in 2015 produces around 400 TWh on an annualised basis. While this signals
progress in meeting climate objectives, it is not yet consistent with the transition to a low-carbon
energy system envisaged in the Paris Climate Agreement reached at the end of 2015 (Chapter 5).
Second, investment in fossil fuel generation fell by nearly USD 10 billion in 2015 to
USD 111 billion – its lowest level since 2008. A slowdown in the commissioning of gas-fired power
plants more than offset a rise in new coal-fired capacity. Because of the time lags between
investment decisions and commissioning, this trend reflects the market conditions faced by
investors several years ago. Global electricity demand growth in 2015 fell to its lowest level in over
a decade (see Chapters 1 and 2), leading to overcapacity in some markets, including Europe and
the People’s Republic of China (hereafter, “China”).
Third, electricity network investment reached a new record of over USD 260 billion. Some 55% of
spending on transmission and development (T&D) was to meet new demand, 35% to upgrade
ageing assets and 10% to integrate variable renewables.2 Over 80% of the USD 10 billion of grid-
based power storage investment went to pumped hydro storage (included in the hydropower
investment data). Grid-scale battery investment has grown very rapidly and was ten times higher in
2015 than in 2010, but comprised only 0.4% of networks spending. Providing adequate incentives
for network owners to scale up investment in order to meet system objectives, such as expanding
access to the grid in developing countries, integrating more renewables and boosting the use of
electricity in transport, while ensuring grid reliability and adequacy, is a major challenge for
regulators.
Box 4.1 • Guide to the electricity investment estimates
Unless otherwise noted, the electricity investment estimates presented here correspond to overnight capital spending on new power plants and network assets, or the replacement of old assets; i.e. investment outlays are counted in the year that an asset becomes operational. Thus, the investment for 2015 actually reflects spending carried out in previous years too. The estimates are shown in 2015 USD prices, adjusted using country-level gross domestic product (GDP) deflators and 2015 exchange rates. Investment does not include operating and maintenance expenditures, financing costs, research and development, mergers and acquisitions or debt and equity market transactions. The methodology is the same as that employed for the IEA medium-term forecasts and long-term scenario analysis in the World Energy Outlook and Energy Technology Perspectives series. It represents an approximation of real-world practice. In reality, capital outlays on new plants will be spread over the years preceding installation. Data and information on financing and investment decisions, where available, are also shown to give a more complete market picture.
2 These shares are indicative. In reality, investment may serve multiple purposes, such as the simultaneous refurbishment of assets and integration of variable renewables.

108 4. Investment in electricity and renewables
Table 4.1 • Electricity sector investment by region and technology
Note: Electricity networks include grid-scale battery storage.
USD (2015) billion Thermal power generation Renewable generation Electricity networks Total
Coal Gas Oil Nuclear Hydro Wind Solar
PV Other
renewables Transmission Distribution Power sector
OECD 9 13 0 2 14 54 68 16 28 84 289
Americas 0 6 0 0 6 19 24 4 21 37 117
United States 0 5 0 0 1 15 21 2 18 31 93
Europe 9 2 0 0 7 34 12 11 5 34 114
Asia Oceania 0 4 0 2 1 2 32 2 2 14 58
Japan 0 1 0 0 1 1 27 1 1 6 38
Non-OECD 69 18 2 19 45 53 29 8 31 118 393
Europe/Eurasia 2 1 0 5 1 1 1 0 4 12 26
Russia 1 1 0 5 0 0 0 0 3 7 17
Non-OECD Asia 65 8 0 15 34 45 26 4 21 87 306
China 38 5 0 15 25 41 22 2 15 51 214
India 18 1 0 0 3 4 3 1 4 17 48
Southeast Asia 9 2 0 0 4 1 1 1 1 9 28
Middle East 0 5 0 0 2 0 0 0 2 6 15
Africa 1 3 1 0 1 2 1 1 1 6 17
Latin America 0 1 0 0 8 5 1 3 3 7 29
Brazil 0 0 0 0 4 4 0 2 2 4 15
World 78 31 2 21 59 107 98 24 60 202 682
European Union 7 1 0 0 2 33 11 10 5 30 99
108Chapter 4. Investm
ent in electricity and renewables

Map 4.1 • Investment in the electricity generation and networks by region and type, 2015 (USD [2015] billion)
North America
Europe and Eurasia China
Middle East & N. Africa
Latin America
115
3110
23
Sub-Saharan Africa149
Rest of Asia-Pacific
214141
Coal
Gas
Oil
Nuclear
Hydropower
Wind
Solar PV
Other renewables
Transmission
Distribution
This map is without prejudice to the status of or sovereignty over any territory, to the delimitation of international frontiers and boundaries and to the name of any territory, city or area.
Chapter 4. Investment in electricity and renew
ables109

110 Chapter 4. Investment in electricity and renewables
Asia absorbs more and more investment
Electricity investment trends vary starkly by region. China, India, and other countries in Asia and the Pacific have been taking a growing share of global investment, reflecting expectations of rapidly growing consumption in some countries and the impact of renewables policies in countries such as Japan. Their collective share reached nearly 55% in 2015, up from 45% in 2010 (Table 4.1, Map 4.1). But this trend may change with a dramatic slowdown in Chinese demand to just 0.5% in 2015 (compared with over 12% just five years ago) and uncertainties across the region surrounding the regulation of fossil fuel and low-carbon sources.
In non-member countries of the Organisation of Economic Co-operation and Development (OECD), outside Asia – including Africa, Eurasia, Latin America and the Middle East – investment fell in 2015; together they accounted for less than 15% of the total. Nevertheless, the Middle East and North Africa region was the largest market for gas-fired power investment. Renewables investment has accelerated in recent years in a number of emerging economies with open market frameworks and auction systems for long-term contracts, for example Brazil, Jordan and South Africa, and has lagged in countries with relatively closed markets, less developed polices and less attractive financing.
Despite sluggish demand growth, countries in Europe and North America accounted for one-third of total electricity investment in 2015. Investment in those regions is driven largely by policies to promote renewables and other low-carbon energy sources, as well as by the need to replace ageing assets and to upgrade the grid to accommodate more solar PV and wind. In Europe, fossil fuel power plants that came online in 2015 included three coal plants in Germany, whose investment decisions were all made prior to 2009 when market conditions were very different. Now, few final investment decisions (FIDs) are being made in Europe, even in countries that have introduced capacity mechanisms (see below). The United States was the second-largest market for gas-fired power investment, which benefited from low gas prices, partly offsetting a big wave of coal plant retirements.
Regulation plays a bigger role in managing market risk
Electricity market frameworks have been evolving in two broad ways: first, the organisational restructuring of power systems based on open access to the grid and, in some cases, competition at the retail level; and second, the evolution of business models within those organisational structures. As described in the recent IEA Re-powering Markets report, categorising markets as either liberalised, wholesale electricity markets or regulated, vertically integrated markets no longer suffices in view of the diversity of business models that are developing in the transition to a low-carbon electricity system (IEA, 2016a).
With respect to the organisation of the electricity sector, which describes how investment and operational decisions are coordinated in different business areas, nearly 40% of power

Chapter 4. Investment in the electricity sector 111
generation investment took place in countries with open, wholesale markets and retail price competition, though the majority of this was insulated from wholesale competition due to the role of renewables policies. This share of wholesale markets is much higher than 20 years ago as vertically integrated utility (VIU) monopolies have been broken up, generation, T&D unbundled, and access to the grid granted for independent power producers (IPPs) (Figure 4.2). But the share and level is less than in 2010, as more investment has gone to countries with a single-buyer system, whereby IPPs are obliged to sell their output at regulated prices to the company that owns and operates all grid assets, while investment in countries with competitive wholesale markets and retail competition has remained stable. In 2015, single-buyer systems characterised a number of non-OECD countries, such as China and India, and some OECD markets, such as Korea and regions of the United States. The number of countries introducing reforms to adopt more competitive organisational structures has continued to rise (see below).
Figure 4.2 • Global power generation investment by type of sectoral organisation
Note: VIU = vertically integrated utility.
Power generation investment is also changing with respect to the type of business model – how assets create and capture value within these organisational structures – as policies play an increasingly important role in the pricing of electricity. In 2015, around 95% of global power generation investment occurred under business models with fully regulated revenues or with mechanisms to manage revenue risk from wholesale market pricing, i.e. the risk generators’ revenues may not be sufficient to cover the full cost of generation; in 2010, the share was below 90% (Figure 4.3). This trend reflects problems faced by generators in recovering investments in capital-intensive assets solely through the market price of the electricity generated. In the case of Europe, these problems, for gas-fired power and low-carbon generators (renewables and nuclear), have been exacerbated by the
44%52%
4%
Wholesale market with
retailcompetition
Single buyer with
IPPs
VIUonly
38%
59%
3%Wholesale
market with retail
competitionSingle buyer with IPPs
VIUonly
2010: USD 380 billion 2015: USD 420 billion

112 Chapter 4. Investment in electricity and renewables
low price of carbon. The fall in investment under distributed generation business models, which are determined by the design of retail electricity tariffs, over the five years to 2015 was due to lower costs of solar PV, which more than outweighed the increase in capacity additions. The vast majority of investment in electricity networks occurs in countries where regulated network operators or VIUs are responsible for planning investment (see below).
Figure 4.3 • Global power generation investment by main business model
On a regional basis, the picture is more complex. In OECD countries, where the electricity sector is usually organised around wholesale electricity markets and retail competition, the business models involve varying degrees of exposure to market prices. Investment based solely on wholesale market pricing, determined most of the time by coal- and gas-fired plants, has declined from one-fifth of OECD spending on generation in 2010 to 10% in 2015. Investment in utility-scale low-carbon generation with relatively high upfront capital costs but low operating costs, accounted for nearly two-thirds of investment in 2015, compared with less than 40% in 2010. Business models for such investment depend on long-term power purchase agreements (PPAs), which provide fixed pricing over the duration of the contract, and instruments such as feed-in-tariffs (FITs), which guarantee a price for the generator that covers the cost of generation over a specified period, and other measures that provide more variable remuneration1 (including green certificates and tax credits). Such mechanisms reallocate some revenue risks from investors to governments and consumers. While this can lower the cost of capital by reducing exposure to market pricing, unexpected changes to policies can raise investment risks.
1 Fixed pricing mechanisms may not provide fixed remuneration over an asset’s entire lifetime, with part of the remuneration variable in nature. The degree to which this occurs depends on the duration of the support and associated marketing requirements, among other factors.
11%2%
43%17%
27%Utility-scale renewables
(fixed or variable pricing)
Wholesalepricing
Distributed generation
Fossil fuel regulated (fixed pricing or VIU)
Nuclear (fixed pricing)
5% 5%
58%
11%
21%
Utility-scale renewables (fixed or variable pricing)
Wholesalepricing
Distributed generation
Fossil fuel regulated (fixed pricing or VIU)
Nuclear (fixed
pricing)
2010: USD 380 billion 2015: USD 420 billion

Chapter 4. Investment in the electricity sector 113
The expansion of renewables-based generating capacity with very low marginal costs of generation is making it hard for coal- and gas-based generators in some markets with competitive wholesale markets to recover the cost of new investments (see below). This is jeopardising future investment and is prompting regulators and policymakers to consider modifying the design of the market in a way that strikes a balance between allowing the market to set the price and providing some guarantees that investors will be able to recover their investment costs.
In non-OECD countries, which account for 60% of global investment in power generation, the bulk of investment occurs in markets organised around a single buyer with IPPs and, to a lesser extent, those with a VIU monopoly. Business models based on wholesale pricing play a negligible role. Nonetheless, the drivers of generation investment have shifted. In 2015, only 35% of investment went to fossil fuel generation remunerated via regulated tariffs, PPAs or VIUs, compared with nearly 45% in 2010. Utility-scale low-carbon power plants, with measures to manage revenue risk, accounted for over 60% of generation investment in 2015, up from just over half of the total in 2010. But, as in the OECD, the new regulatory environment has also led to financial difficulties for some generators. In China, for example, high levels of investment in both coal-fired generation and low-carbon sources, coupled with the slowdown in demand, have led to overcapacity and underutilisation of coal plants, as well as high levels of curtailment of wind and solar output. Meanwhile, the regulatory structures in place in most non-OECD countries have not tended to encourage distributed generation, in part due to a lack of open access to the grid and, in many cases, the persistence of subsidised retail prices. Nonetheless, some markets in Africa are pioneering new ways of encouraging small-scale, off-grid solar lighting and home solutions.
In 2015 and 2016, four trends characterised the global evolution of electricity market frameworks, which are likely to shape future investment:
Some markets previously organised around vertically integrated, single-buyer models have seen moves towards more competition. In the OECD, Japan has introduced reforms involving the full liberalisation of the retail market and Mexico is developing a wholesale power market. Korea has announced that power sector restructuring will begin in 2017.
For renewables, policies are moving away from fixed remuneration set administratively, such as through FITs, and towards auctions, incorporating some exposure to market prices in order to incentivise investment in more system-friendly capacity. Examples of this market exposure include the market premium system in Germany, whereby generators receive a top-up payment in addition to the wholesale

114 Chapter 4. Investment in electricity and renewables
price; and contracts-for-difference (CfD) in the United Kingdom, which provide a long-term PPA, but require generators to sell on the wholesale market.2
To guarantee the adequacy of generation capacity in the face of low wholesale prices, some United States, Latin American and European markets have introduced capacity markets – mechanisms that pay generators for making capacity available to deliver electricity at specific periods. In Europe, these mechanisms have so far helped maintain existing capacity rather than stimulate new investment.
Debates continue over the design of retail electricity tariffs and the role of distributed generation. Interest in the participation of consumer-owned distributed energy in electricity markets, procurement of renewable electricity by non-energy companies and community solar projects is growing in North America and Europe. Reforms under discussion in New York State are aimed at responding to this trend (Box 4.2).
Box 4.2 • New York reforms foresee greater role for decentralised energy
Since 2014, the state of New York – home to one of the world's first centralised power stations – has been working on reforming the regulation of its power sector. The proposed reforms, called Reforming the Energy Vision (REV), seek to balance traditional cost of service, centralised power with greater participation by consumers in both supply and demand-side management, and reward utilities for avoided investments and meeting system efficiency goals. The market design that is envisaged is intended to support the state’s target of 50% renewables-based power by 2030, compared with 23% in 2015. In May 2016, regulators approved new rules that would motivate future investments, by incumbents and new players, under a bi-directional “transactive” grid, whereby distribution utilities would earn revenues from administering market platforms for the trade of distributed power by third parties. In addition, utilities would be granted a rate of return by regulators for operational spending (such as integrating third-party distributed solar PV, heat pumps and batteries) that reduce the need for more costly capital investments that would normally be recovered through the regulated portion of retail electricity tariffs. A return would also be offered for meeting outcome-based metrics, such as system efficiency, interconnection and customer engagement. To spur demand-side flexibility and, notably, reduce consumers’ peak load, future retail tariff design would favour demand charges over fixed charges and move to dynamic time-of-use pricing.
What could be the implications of market designs such as REV on electricity sector investment? In New York, the Brooklyn-Queens Demand Management Program approved in 2014, which is facilitating deferral of a substation investment (estimated at around USD 1 billion) by the distribution utility, offers an example of how more a cost-effective mixture of capital and operational spending (budgeted by the utility at USD 200 million) on the integration of distributed solar PV, behind-the-
2 When market revenues fall short of the PPA strike price under a CfD, generators receive a premium so that their total remuneration equals that price; when revenues exceed the strike price, generators reimburse that difference to the contract counterparty.

Chapter 4. Investment in the electricity sector 115
meter battery storage and energy efficiency can reduce overall investment needs to meet peak demand, improve customer participation and support a transition to a cleaner electricity system. But in practice, stimulating the necessary spending patterns, by utilities, consumers and third parties, to meet such objectives will depend in large part on how regulators determine a market value for distributed energy (a major source of debate), as well as the incentive structure for continued network investment. REV’s broad-based stakeholder engagement is expected to help advance solutions to these questions.
Divergent financing trends shape power companies’ capacity to invest
The ownership of power generation assets is changing
Over the past decade, investment in power generation has shifted from relatively large-scale projects financed through the retained earnings of well-capitalised utilities and power producers to more diverse sources. Once the exclusive domain of VIUs, owners of generating assets now range from very large, long-standing companies with investment around the world to small local companies and individual households with rooftop solar PV.
Figure 4.4 • Ownership of global power generation capacity commissioned in 2015
Note: Plants with mixed ownership are fully attributed to the majority owner.
Sources: Calculations based on Platts (2016), World Electric Power Plants Database; Bloomberg LP (2016), Bloomberg Terminal; Bloomberg New Energy Finance (BNEF) (2016a), Renewable Energy Projects.
Listed companies, public and private firms traded on stock exchanges, accounted for nearly 60% of total new power capacity in 2015, similar to the share in 2010. State-owned enterprises (SOEs), those with majority state ownership, comprised nearly half of new plant ownership, again similar to the 2010 share. But the share of listed SOEs rose, reflecting the increase in capacity in China. In general, ownership of wind, solar and other non-hydro
18%
43%15%
20%
4%
10%
21%
22%
31%
16%Private companies
(listed)
Private companies (unlisted)
Households, communities, autoproducers
SOEs(listed)
SOEs (unlisted)
Private companies (unlisted)
Private companies
(listed)
SOEs (unlisted)
SOEs(listed)
Fossil fuel, nuclear, hydropower176 GW
Wind, solar, other renewables122 GW
Households, communities, autoproducers

116 Chapter 4. Investment in electricity and renewables
renewables-based assets is more diverse fossil fuel, nuclear and hydropower projects, with a greater role for private power companies and those outside the energy sector (Figure 4.4). With respect to fossil fuel, nuclear and hydropower, which tend to be larger scale projects, SOEs accounted for over 60% of new capacity in 2015, with state-owned listed entities accounting for nearly 45%. The role of non-listed private power companies has also increased, for both conventional generation and renewables, accounting nearly one-fifth of total new plant ownership in 2015. This trend largely stems from the rising activity of institutional investors and privately held companies, often in India and other developing regions.
Regional policy and market trends impact power companies’ ability to mobilise finance
The financial health of utilities worldwide in recent years has generally been more robust for those with assets remunerated by regulated tariffs and selling to financially healthy buyers of electricity. In some cases, power companies operating in competitive markets have run into financial difficulties. This has been the case for several companies in Europe, where utilities with generating assets have experienced large swings in their financial performance (Figure 4.5).
Figure 4.5 • Financial indicators for listed European power companies
Note: Includes the top 20 European utilities by market capitalisation and four listed grid companies.
Source: IEA and 2° Investing Initiative calculations based on Bloomberg LP (2016), Bloomberg Terminal.
After an investment run-up before the economic crisis, fuelled by rising operating cash flow and debt, profits margins for European utilities were reduced by a combination of slowing demand, increased competition from independent renewables-based generators, lower revenues from thermal generation and network assets, which had been offloaded over
0
50
100
150
200
250
2006 2009 2012 2015
2006
= 1
00
Europe - utilities
Net debt Operating cash flow Capital expenditures2006 2009 2012 2015
Europe - grid companies

Chapter 4. Investment in the electricity sector 117
time in reaction to increased regulatory burden and to expectations of limited profitability under pre-crisis market conditions. As a result, most utilities have been forced to cut capital expenditures in order to reduce their burden of debt. The picture for network companies with regulated assets is different. Their regulated revenues have enabled these companies to maintain cash flows and raise debt to finance investment. Capital spending has been broadly flat since 2010, in large part the result of problems in obtaining licenses and local resistance to the construction of new transmission lines.
The financial performance of electricity utilities in the United States, which comprise a mixture of companies with network assets and large IPPs, investing both in conventional and renewable power, has been generally more robust than that of European utilities over the past decade, despite low wholesale power prices (Figure 4.6). In part, this represents the large contribution of regulated cash flows, both from regulated state markets and renewables, as well as the low cost of gas-fired generation due to low gas prices. There are, nonetheless, question marks about the durability of cash flows and investment for conventional generation and networks in some areas under business models reliant on low wholesale prices. Debt, which remains cheap, has outpaced capital expenditures in recent years, and utilities are retiring coal-fired capacity (and nuclear in some cases) that is struggling to compete against gas and renewables. Meanwhile, the implementation of the federal government’s Clean Power Plan, which foresees reductions in carbon dioxide and other emissions from power generation, remains an uncertainty for investment. In February 2016, the US Supreme Court suspended its implementation, but some states and utilities have continued to move forward in meeting its obligations in anticipation that the suspension will be lifted.
Figure 4.6 • Financial indicators for listed US power companies
Note: Includes the top 30 US power companies by market capitalisation.
Source: IEA and 2° Investing Initiative calculations based on Bloomberg LP (2016), Bloomberg Terminal.
0
50
100
150
200
250
2006 2007 2008 2009 2010 2011 2012 2013 2014 2015
2006
= 1
00
Capital expenditures Net debt Operating cash flow

118 Chapter 4. Investment in electricity and renewables
In Asian countries, the financing picture is also complex. The majority of network assets and a significant portion of generation are owned by unlisted state-owned firms; listed power companies are mostly IPPs, investing in both conventional generation and renewables. In China, where IPPs are largely state-owned, operating cash flows have strongly risen since 2011. This is thanks to the profitability of coal-fired plants, which dramatically improved as coal prices fell and regulated tariffs for wholesale power remained elevated, as well as attractive returns on renewables (Figure 4.7). These factors, combined with good availability of cheap financing, gave Chinese power companies a strong incentive to invest heavily. This has started to change with the emergence of overcapacity: capital spending trended downward in 2015. In India, stagnant cash flows and falling capital expenditures reflect the increased risk of not being able to recover investments; retail electricity tariffs are not always high enough to fully cover costs and some state T&D companies continue to face severe financial problems, undermining the reliability of the network and the ability of generators to sell their output.
Figure 4.7 • Financial indicators for listed power companies in selected Asian countries
Note: Leading power companies by market capitalisation in China (30), India (10) and other South and Southeast Asian countries (10).
Source: IEA and 2° Investing Initiative calculations based on Bloomberg LP (2016), Bloomberg Terminal.
A broadening pool of options for financing renewables
The renewables sector has generally been able to expand its access to more diversified pools of financing in recent years. While the majority of funding for new renewable projects traditionally came from the balance sheets of project developers, IPPs and utilities,
0
50
100
150
200
250
300
2010
= 1
00
China
Net debt Operating cash flow Capital expenditures
South and Southeast AsiaIndia

Chapter 4. Investment in the electricity sector 119
an increased emphasis on non-recourse debt from project finance structures3 has emerged in recent years (Figure 4.8). Lending from public financial institutions also plays an important role (Box 4.3). This trend towards project finance partly reflects the constrained cash flows of a relatively new industry, with limited earnings from an already operating asset base, as well as the reduced ability of utilities in some markets, such as in Europe, to self-finance projects. It is also because projects that are largely based on regulated cash flows are better able to increase leverage and tap into larger pools of bank financing.
Financial innovations have helped increase financing for renewables via the debt and equity markets, in a similar fashion to energy efficiency investments (see Chapter 2). While such innovations potentially allow renewables to tap into much larger pools of cheaper finance, they require further development. For example, the bond market provided just 3% of finance for renewable assets in 2015, though the share has risen from a low base (Figure 4.8). In the past 18 months, the first bond financing of an in-construction offshore wind farm (the 330 MW Gode Wind 1 in 2015) was issued and renewable project bonds were also issued in Chile, Europe, Japan, Pakistan, United States and Uruguay.
Figure 4.8 • Source of finance for new utility-scale renewables-based power projects
Source: CEP (2016), dataset provided to the IEA.
Bonds for direct finance of renewable projects represent a subset of the larger green bonds market, which were valued at USD 48 billion in 2015, up 15% from 2014 (Figure 4.9). Most green bonds fund corporate activities and re-finance existing assets, including in
3 Non-recourse debt refers to loans for the development of a project based on the project’s future cash flows; the lender does not have recourse to the parent company’s capital.
0%
10%
20%
30%
40%
50%
60%
70%
2009 2010 2011 2012 2013 2014 2015
Projectfinance
Balancesheet
Projectbonds

120 Chapter 4. Investment in electricity and renewables
renewables and energy efficiency, enabling developers to recycle funds at lower cost of capital. In response to the greater availability of green bonds, a dozen institutional investors have made commitments or targets for green bond investments in excess of USD 15 billion (OECD, 2016a). Lack of a global standard for “green” assets raises uncertainty over their impact, though progress is occurring in standardisation of the green bond market. While much activity is centred on United States and Europe, where debt markets are relatively liquid, a Chinese bank issued its first green bond in 2015. In 2016 to date, Chinese institutions had issued seven green bonds of a combined USD 8 billion with some backed by solar PV and wind assets. US-distributed solar PV developers have begun issuing asset-backed securities, bonds that pay interest based on cash flows of existing projects. In the past three years, seven securitisations collectively refinanced 0.5 gigawatts (GW) of capacity, or the annual consumption of 60 000 US households. The cost of capital for these bonds, (i.e. the spreads to benchmark interest rates), initially fell, but increased in 2016 due to regulatory changes, such as new fixed charges for net metering in Nevada (Figure 4.9).
Figure 4.9 • Green bond market size and solar PV securitisation metrics
Note: SCTY = SolarCity; RUN = Sunrun
Source: CEP (2016), dataset provided to the IEA; Company filings; Board of Governors of the Federal Reserve System (US) (2016), FRED.
Equity investors play an important role in financing renewables through project ownership and shares in renewable companies. Institutional investors, such as asset managers, pension funds and insurance companies, increased their equity share of wind projects in
0 5
10 15 20 25 30 35 40 45 50
2010 2011 2012 2013 2014 2015 Q12016
USD
(201
5) b
illio
n
Green bond issuance
MDBs CorporatesGovernments/municipalities Investment/commercial banksProject bonds Asset-backed securities
0%
1%
2%
3%
4%
5%
6%
Nov
-13
Apr
-14
Jul-1
4
Aug
-15
Aug
-15
Jan-
16
Mar
-16
SCTY SCTY SCTY SCTY RUN SCTY SCTY
Solar PV securitisations - cost of capital
Spread to benchmark interest rate (7-yr swap)Securitisation yield (A tranche)

Chapter 4. Investment in the electricity sector 121
Europe from 6% in 2010 to over 35% in 2015 (OECD, 2016b). This participation served mostly to re-finance existing projects. Annual equity issuance from so-called yield companies, or yieldcos,4 primarily in North America and Europe accelerated from low levels in 2012 to reach around USD 7 billion in 2015 (BNEF, 2016b). Some yieldcos in North America experienced rapid share price growth and, to maintain dividend yields, increased acquisitions, funded through equity and debt, but this model proved unsustainable. Those yieldcos could no longer raise cheap funding via public markets. Other yieldcos have established sustainable cash flow and dividend models that may increase in importance.
Finally, several innovations have also been made in expanding financing options for distributed generation – particularly rooftop solar PV – in markets with retail competition. Successful approaches depend on electricity tariff designs that promote self-consumption, place an appropriate value on surplus generation (beyond that consumed by the household itself) and allows adequate recovery of fixed network costs. In the United States, third-party service, leasing and PPAs account for around 60% of the residential distributed solar PV market. Property-assessed clean energy (PACE) programmes, which facilitate the financing of distributed generation through property taxes, have been introduced in 20 US states. Seven US states allow community choice aggregation, whereby consumers can pool purchases from community-scale solar projects. Moreover, some business models for distributed generation have begun to emerge, such as the aggregation of assets to provide grid services to wholesale markets and peer-to-peer energy exchanges on micro-grids.
Box 4.3 • The role of public financial institutions in clean energy financing
Multilateral developments banks (MDBs) and members of the International Development Finance Club (IDFC) financed nearly USD 30 billion of renewables, or 10% of total renewable investment worldwide, in 2014 (Figure 4.10).5 They provide an important source of finance in countries with underdeveloped banking sectors. Since 2011, the financing for renewables has remained stable. Most financing is provided through loans, with much smaller amounts coming as grants, debt guarantees and equity. The value of non-loan instruments, such as guarantees, in making projects financially viable can, nonetheless, be very important. In 2014, IDFC bank lending was evenly split between concessional debt – which includes softer interest terms and longer maturities and grace periods compared with market loans – and non-concessional debt. This use of non-concessional debt can enhance the viability of projects merely through the presence of development bank finance, by giving confidence to other investors.
Along with other development and export credit agencies, international public finance for
4 Yieldcos are listed companies that provide distributions for investors based on the cash flows of their portfolio of operating assets, often purchased from the renewable developer who created the yieldco. While this discussion focuses on equity, yieldcos also fundraised via sizeable issuance of debt. 5 Such institutions also finance investment in energy efficiency, grids (for example, India’s Green Energy Corridor) and other “green” assets under the designation of “climate finance”.

122 Chapter 4. Investment in electricity and renewables
renewables was near USD 50 billion in 2014 (CPI, 2015). Domestic public finance also plays a role. Recently, a number of public green investment banks (GIBs) have emerged in countries not served by development banks, such as Malaysia, the United Arab Emirates and some US states. China announced in 2015 its intention to set up a National Green Development Fund. GIB strategies focus on lending and reducing risk for newer technologies with less attractive risk return profiles (OECD, 2016c). While they are not yet a large capital source, their impact in commercialising new technologies could prove to be significant.
Figure 4.10 • Development bank financing of renewables and energy efficiency
Source: IDFC (2012-15); World Bank et al. (2012-15).
Renewables-based power generation
Investment in new renewables power capacity was USD 288 billion in 2015, down USD 5 billion, or 2%, from a record high in 2014.6 While in inflation-adjusted terms annual investment was virtually unchanged compared to 2011 due to unit cost declines and technological progress, investment in 2015 resulted in nearly 40% more capacity, and will generate one-third more electricity than that in 2011 (Figure 4.11). This generation covers global electricity demand growth in 2015. Wind power comprised the largest share of total investment in 2015, at 37%, followed by solar PV at 34%; hydropower accounted for over 20% (down from over 30% in 2013), while other sources (bioenergy, solar thermal electricity, geothermal) made up nearly 10%.
6 Total investment in renewables, including biofuels for transport and solar thermal heating installations, amounted to nearly USD 315 billion in 2015. For further details, please see Chapter 1.
0%
10%
20%
30%
40%
50%
60%
70%
0
10
20
30
40
50
60
70
80
2011 2012 2013 2014
USD
(201
5) b
illio
n
Energy efficiency Renewables % of total climate finance from IDFC and MDBs (right axis)

Chapter 4. Investment in the electricity sector 123
In addition to lower costs, the attractiveness of investing in renewables has been boosted by more supportive government policies. Momentum was enhanced with the national pledges made under the 2015 Paris Climate Agreement. Financing has also become easier with the increased availability of low-cost debt, the emergence of new financial instruments to manage risk and new business models, such as corporate procurement and distributed financing schemes. But investment challenges persist. National pledges need to be backed up by effective policies and measures. Appropriate electricity market design, such as auctions for long-term contracts, remains important for momentum. Although cost reductions have led to low announced contract prices for solar PV and onshore wind, progress across markets and technologies remains uneven. One reason is that in countries with large shares of variable renewable energy, the investment case for renewables is increasingly dependent on their system value, itself linked to market design and the flexibility of the energy system, as described in The Power of Transformation (IEA, 2014a).
Figure 4.11 • Global renewables-based power generation investment, annualised generation
from investment and gross capacity additions
Note: Annualised power generation is estimated based on output from invested capacity using 2015 capacity factor assumptions.
Lower costs drive investment
Technological improvements, learning by doing and increased supply chain efficiency continue to drive cost reductions for wind and solar PV globally,7 though depreciation of
7 In-depth discussion of renewables technology and economics is found in several IEA reports: Energy Technology Perspectives, the Medium-Term Renewable Energy Market Report, The Power of Transformation, Technology Roadmaps and the World Energy Outlook.
0
20
40
60
80
100
120
140
160
180
2011 2013 2015
GW
Capacity additions
0
50
100
150
200
250
300
350
2011 2013 2015
USD
(201
5) b
illio
n
Investment
Hydropower Solar PV Wind Other renewables
0
50
100
150
200
250
300
350
400
2011 2013 2015
TWh
Generation
+33%
0% +40%

124 Chapter 4. Investment in electricity and renewables
the national currency has raised the cost of imported components in some countries, such as wind power in Brazil. Globally, the weighted average unit investment cost of onshore wind fell by 20% between 2010 and 2015, while that of utility-scale solar PV dropped by more than 60% (Figure 4.12).
Cost trends vary by country, technology and type of project. For example, in China, unit capital costs for both onshore wind and utility-scale solar PV are around 15% lower than the global average (in line with other generating technologies). In the United States, utility-scale solar PV costs remain almost 35% higher than the global average, owing in part to higher project “soft” costs, i.e. non-hardware costs, such as those for project development, permitting and engineering. In some countries, such as Germany and India, the repowering of existing onshore wind assets is a growing area of focus, for economic reasons; the costs associated with such investments vary with wind farm size, location and available infrastructure. Although offshore wind capital costs have remained relatively high, favourable wind resources and technology developments have had a deflationary impact on cost of electricity from this source, according to Medium-Term Renewable Energy Market Report 2015 (IEA, 2015a).
Figure 4.12 • Global average investment cost for wind and solar PV
Source: Calculations for solar PV based on IRENA (2016), Renewable Costing Alliance, dataset.
For renewables other than wind and solar PV, the impact of cost reductions on investment is more challenging to interpret. The cost of new hydropower projects is site specific, and varies widely according to environmental requirements and lead times for development and construction. The market for operational lifetime extensions of several existing hydropower plants, especially in developing countries, is large. This costs on average around 60% of a new project and upgrading about 90% (Goldberg and Lier, 2011). It is difficult to generalise about investment cost trends of bioenergy power, owing to the wide
0
1
2
3
4
5
6
2010 2011 2012 2013 2014 2015
USD
(201
5) p
er w
att Wind
Offshore wind Onshore wind
0
1
2
3
4
5
6
2010 2011 2012 2013 2014 2015
Solar PV
Residential scale Utility-scaleCommercial scale

Chapter 4. Investment in the electricity sector 125
diversity of projects. Investment in such plants amounted to over USD 20 billion in 2015 – a significant component of the renewables total. More detailed cost analysis of bioenergy will be featured in the Medium-Term Renewable Energy Market Report 2016 (IEA, forthcoming).
The headline data on investment masks complex trends in the attractiveness of renewables to investors, the electricity industry and the system operator. Some technology improvements can increase the overall investment cost of a project (Figure 4.13). For example, wind turbines with higher hub heights and larger rotors and nameplates can raise the cost of a megawatt (MW) of capacity. In the case of solar PV, modern plants with tracking systems and larger inverters can raise costs. But such advances also raise utilisation factors and lower the cost per unit of energy output, as well as enhance the value of electricity output to the system depending on when and where it is generated.
Figure 4.13 • Average parameters of new wind turbines in the United States
Source: US DOE (2016), 2015 Wind Technologies Market Report.
As the renewable industry continues to mature and globalise, project developers are employing leaner structures and seeking cost reductions throughout the lifetimes of projects. Examples include reducing construction time, improving the measurement of the energy resource and optimising the layout of solar and wind farms. Operational expenses are also being reduced by optimising spare parts warehouses, maintenance and personnel, and through digital performance and maintenance systems, such as those being deployed by several original equipment manufacturers.
The prices paid for renewables-based power under PPAs have followed the downward trend in investment and generating costs, driven in part by supportive policies and favourable financing conditions. In the United States, reported PPA prices have fallen even faster than capital costs, thanks to financing conditions, technology and load factor
0.0
0.5
1.0
1.5
2.0
2.5
0
20
40
60
80
100
120
2005 2006 2007 2008 2009 2010 2011 2012 2013 2014 2015M
W
Met
ers
Rotor diameter Nameplate capacity (right axis)

126 Chapter 4. Investment in electricity and renewables
improvements and better siting of solar plants and wind farms (Figure 4.14). Elsewhere, publicly announced PPAs in 2016 have revealed prices below USD 40/megawatt-hour (MWh) for wind power in Peru, below USD 50/MWh for solar PV in Peru and Mexico, and USD 30/MWh for solar PV in Chile and Dubai. In sub-Saharan Africa, where IPP investments have increased less due to country and risks associated with the utility buyers of electricity, solar PV was awarded under USD 70/MWh in South Africa and near USD 60/MWh in Zambia, the latter benefiting from advisory services, concessional loans and risk guarantees from the World Bank’s Scaling Solar Program. While such PPA data may not fully represent the true cost of delivered projects, integration costs, or system value, they signal price levels that were not attainable two years ago.
Figure 4.14 •Wind and solar PV average investment costs and PPA prices in the United States
Note: Average PPA prices correspond to contract signing dates and may not fully represent samples for average capital costs.
Source: Calculations based on LBNL (2016), Utility-Scale Solar 2015; US DOE (2016), 2015 Wind Technologies Market Report; IRENA (2016), Renewable Costing Alliance, dataset.
Despite the rapid expansion in renewables around the world, some project developers and manufacturers have faced financial problems. This may signal some divergence between the investment case for renewables as a whole and that for parts of the industry developing it, particularly in industry’s ability to generate sustainable margins amid cost deflation. For example, in 2016, SunEdison, a US company with a development pipeline valued at nearly USD 1 billion, declared bankruptcy due to debts to fund acquisitions and aggressive project bids, aided by access to cheap financing, in part through the yieldco it created. The Spanish company Abengoa was forced to restructure in the face of a shortfall in cash flow that resulted from aggressive expansion. Meanwhile, the Chinese manufacturer and developer Yingli Solar has been plagued by weak financial performance
0
20
40
60
80
100
120
2010 2011 2012 2013 2014 2015
2010
= 1
00
Utility scale solar PV, capital costs Onshore wind, capital costs
Utility scale solar PV, contracted PPA prices Wind, contracted PPA prices

Chapter 4. Investment in the electricity sector 127
and large debts. These upheavals are more the consequence of aggressive growth and pricing strategies, fuelled by cheap liquidity, than of any fundamental failing of the renewable sector itself. But this volatility may create problems in attracting more diversified financing and raising capital from the debt and equity markets in the future.
A diverse regional investment picture for renewables
China, India, Japan and the rest of Asia and the Pacific accounted for half of 2015 investment in renewables power capacity (Figure 4.15). Renewable investment in China, the largest destination for investment, was USD 90 billion, or 60% of its total investment in generation. Wind and solar PV accounted for 70% of China’s renewable total. For the first time, investment in wind in China was larger than that in hydropower (Figure 4.16). The construction of hydropower facilities remains high by global standards, but has declined in China due to high regulatory and environmental costs. Strong momentum continued in the first half of 2016, with over 17 GW of new solar capacity connected to the grid, according to China Electricity Council, greater than the additions for all of 2015. However, new wind capacity additions slowed and curtailment rates were higher than the same period in 2015.
Figure 4.15 • Renewables investment by country/region
The Chinese government has set more ambitious goals for renewables for 2020 in the draft 13th Five-Year Plan: 250 GW for wind (up from 200 GW in the previous target) and 150 GW for solar PV (up from 100 GW), though these are pending final approval. Although FITs have remained high relative to costs, the rapid recent growth in capacity, which outpaced the capacity of the grid, delays in incentive payments and high rates of curtailment of wind (15%) and solar PV (10%) output in 2015, partly due to preference being given to coal-fired plants, have undermined the attractiveness of investing in renewables in some cases. In June 2016, the National Development and Reform Commission (NDRC) issued a rule to guarantee the purchase of a certain number of hours for wind and solar PV. The long-term
0
25
50
75
100
125
2000
2001
2002
2003
2004
2005
2006
2007
2008
2009
2010
2011
2012
2013
2014
2015
USD
(201
5) b
illio
n
China European Union United States JapanIndia Rest of OECD Rest of non-OECD

128 Chapter 4. Investment in electricity and renewables
impact of this rule on renewables output depends on how it is implemented, as it gives some leeway for interpretation by grid companies. Investment in distributed solar PV remains small, due to bank concerns over the creditworthiness of potential investors and uncertainties over the recovery of assets in the event of default.
Renewables investment in India increased by over 20% to just under USD 10 billion in 2015 Hydropower accounted for one-quarter of the total. Some 10 GW is still under construction, though India has faced local acceptance and environmental impact concerns in northeast states where the best sites are located. Ambitious targets (100 GW of solar PV and 60 GW of wind capacity by 2022) and improved economics are driving an expansion of onshore wind and solar PV. In June 2016, the government signalled it would tender PPAs for onshore wind, which had relied on inconsistent generation incentives and state schemes. These tenders together with falling costs have led to a sharp decline in PPA prices for utility-scale solar PV. Renewables-based producers – including traditional fossil fuel generators such as Adani, NTPC and Tata Power – have become more diverse, with projects sometimes bundled with coal-fired power. Uncertainties remain over the deliverability of some low solar PV bids, the regulatory framework and how new projects will be integrated in the electricity system given the financial health of the state distribution companies and needed grid investment.
Figure 4.16 • Investment in renewables-based power by technology in selected countries/regions
In Southeast Asia, investment in renewables generation declined in 2015 to its lowest level in five years. Part of this relates to the timeline of construction of hydropower projects in Viet Nam and Lao People’s Democratic Republic (hereafter, “Lao PDR”). Outside hydropower, support for renewables has been strongest in Thailand, driven by long-term targets in bioenergy and solar PV. Policies in the Philippines, including a FIT for wind, have attracted investment. Despite strong electricity demand, policies in Indonesia and Viet Nam are not yet conducive to attracting significant new financing.
0
20
40
60
80
100
120
140
2007
2009
2011
2013
2015
2007
2009
2011
2013
2015
China India and other non-OECD Asia
USD
(201
5) b
illio
n
Hydropower Wind Solar PV Other renewables
2007
2009
2011
2013
2015
2007
2009
2011
2013
2015
European Union United States

Chapter 4. Investment in the electricity sector 129
Investment in Japan, at USD 30 billion, accounted for 10% of global renewables investment, though fell by 8% in 2015, with more spending on utility-scale solar PV outweighed by declines in spending in the commercial and residential sectors. In May 2016, the government announced an incentive change for new plants, moving away from administrative FITs to long-term contracts awarded by auction.
Outside Asia, non-OECD countries in Africa, Latin America and the Middle East accounted for only 8% of renewables investment in 2015, but they have some of the world’s lowest global power purchase prices. Latin America saw growth of 14%, with newer markets like Peru growing in recent years. In Brazil, investment increased by 10%, but electricity demand growth declined in 2015 and the timing of two planned auctions has created some uncertainty. In Argentina, tenders for 1 GW of renewable capacity have been announced for 2016, which are likely to attract investment. The Middle East saw a threefold increase in renewables investment in 2015, albeit from a low base, mostly hydropower in Iran. In addition, some of the first onshore wind under Jordan’s tendering scheme came online, while tenders expanded the project pipeline for solar PV in the United Arab Emirates. Renewables investment in Africa declined by nearly 40% in 2015 to under USD 5 billion. This was partly due to commissioning timing of hydropower and utility-scale solar PV projects under development in South Africa and onshore wind in Morocco, with higher additions expected in the next few years. In July, state utility Eskom, which is the single buyer of power generation in South Africa, triggered a public discussion following reports over its willingness to sign further PPAs beyond preferred projects selected under South Africa’s auction scheme. This may raise some uncertainties over future investment. Nevertheless, in general, the appetite for financing renewables projects remains strong across the continent. Outside South Africa and Morocco, most activity is in those few markets with established or emerging regulatory support, including Egypt, Ethiopia, Kenya and Senegal.
Renewable investment in the European Union has followed a downward trend in recent years, reflecting lower costs and slower rates of deployment. It nonetheless remains high relative to other regions in 2015, at around USD 55 billion, or over 85% of Europe’s generation investment. Wind accounted for over half of the total, with offshore wind investment reaching an all-time high. A geographical dichotomy characterises the investment environment. In northern European countries with less regulatory risk, the cost of capital for onshore wind remains lower than in eastern and southern European countries with weaker demand and greater policy risks (Figure 4.17). In part, this difference represents country risk priced into the cost of debt. But it also reflects specific risks related to renewable developments, due to policy design, progress in system integration and overall power market fundamentals.

130 Chapter 4. Investment in electricity and renewables
Figure 4.17 • Cost of capital estimates for onshore wind in Europe by country, 2015
Note: Midpoints are shown for reported equity and debt data. Weighted average cost of capital is calculated using country-specific debt/equity ratios and does not account for the tax-deductibility of interest on debt.
Source: Cost of debt, cost of equity and debt/equity ratios adapted from DiaCore (2016), “The impact of risks in renewable energy investments and the role of smart policies”. Bond yields from Bloomberg LP (2016) Bloomberg Terminal.
According to Medium-Term Renewable Energy Market Report 2016 (IEA, forthcoming), changing policies and economic incentives in several countries are impacting the investment landscape for Europe. Future spending will be driven by France’s ambitious renewables targets announced in April 2016 and Germany’s transition to transparent auctions as outlined by the latest amendment to the Renewable Energy Act. However, uncertainty over the timing and rules of the United Kingdom’s next CfD auction and Poland’s newly enacted regulations for siting wind farms may raise some investment uncertainties going forward.
In the United States, investment increased by 4% to nearly USD 40 billion in 2015, with more spending on solar PV and a 75% increase of wind investment. Utility-scale projects were mostly covered by PPAs with utilities or corporations (Box 4.4) that benefited from tax equity financing. At the end of 2015, the production and investment tax credits were unexpectedly renewed and extended until 2022, which should enhance investment in the future. In Canada, investment fell by 20%, but remained high at USD 10 billion, driven by hydropower and onshore wind. In Mexico, investment declined by over 40% to under USD 2 billion in 2015, though spending on both wind and solar PV continued to expand. The country held its long-awaited first auction in 2016 under its new electricity market design, whereby projects receive adjustments to long-term PPA prices based on the anticipated time and location of generation.
0%
2%
4%
6%
8%
10%
12%
14%
16%
Weighted average cost of capital (mid) Cost of debt (mid)Cost of equity (mid) Germany (10-y government bond yield)Spain (10-y government bond yield)

Chapter 4. Investment in the electricity sector 131
Box 4.4 • Corporate buying a growing driver of renewables investment
While non-traditional players are driving small-scale renewable growth, a diverse set of companies outside the energy sector, including in retail, information technology and manufacturing, are now procuring power directly from large-scale, offsite renewables-based generating plants. In 2015, North American corporate buyers contracted over 3 GW of solar and wind capacity, nearly three times that in 2014 (Figure 4.18). So far, the cumulative investment associated with these assets totals over USD 10 billion, with expected annual output over one-and-a-half times the power demand of the state of Hawaii.
Figure 4.18 • Renewables capacity contracted by non-energy corporations in North America
Source: Rocky Mountain Institute (2016), dataset provided to the IEA.
Traditionally, large companies have procured electricity under contracts with utilities, PPAs with conventional generators and green certificates from existing renewables. Now, corporations are increasingly contracting renewables-based power under financial PPAs.8 Such procurement strategies provide them with a potentially attractive financial hedge and allow companies to more flexibly pursue energy goals without onsite resources and enhance their green credentials. These factors, together with the availability of renewables tax credits, drove a number of recent decisions, such as General Motors procurement of wind power for a Texas truck factory, MGM Resorts payment of USD 87 million to exit a utility contract for its casinos and Google’s 300 MW investment in wind to cover the needs of its data centre demand in Oklahoma. Furthermore, some companies, such as Apple, Google and Walmart, have received approval to sell their power on wholesale markets.
8 In some cases, such as mining in Chile, contracts involve direct consumption of renewable power.
0.0
0.5
1.0
1.5
2.0
2.5
3.0
3.5
2010 2011 2012 2013 2014 2015
GW Philips Corning
Salesforce Bloomberg
Owens Corning Equinix
HPE Switch
Cisco Amazon
Dow Chemical Kaiser Permanente
General Motors Procter & Gamble
Yahoo Mars
IKEA Facebook
BD Microsoft
Apple Google
Walmart

132 Chapter 4. Investment in electricity and renewables
From an electricity system perspective, corporate buying represents a more decentralised and flexible way of buying power than grid defection. But in many cases, the demand profile of the corporate buyer does not match that of renewables-based generation, and the real-time matching of supply and demand continues to be provided by a grid operator. As such, a robust T&D network, as well as stable renewables policies and regulatory rules that allow third-party contracting are crucial to the development of corporate buying. These conditions have been generally supportive in the United States, where most activity has occurred to date. There has also been some corporate buying in Europe and India.
Corporate buying could expand the sources of finance and offtake for renewables. As part of The Climate Group’s RE100 campaign, a collaborative initiative of 69 major companies around the world, with annual demand exceeding that of Portugal, have adopted a goal of sourcing all of their electricity from renewables. The global impact of meeting this goal would be small, but it could grow if more companies sign up. Other initiatives, such as the new Corporate Sourcing of Renewables Campaign under the Clean Energy Ministerial, seek to enhance enabling policies to spur more activity. Changes in the rules governing third-party contracting could boost buying and, therefore, the prospects for investment in renewables worldwide. Such efforts are already underway in China. Regulations that facilitate pooling and marketing of smaller projects and aggregation of small business purchases would reduce transaction costs and risk, and allow a greater diversity of players to participate. More robust and flexible networks would also encourage growth.
Renewables asset financing dips in 2016
Asset financing9 for renewables rose during 2014 and 2015 – despite plunging coal and gas prices (Figure 4.19). Yet, in the first quarter of 2016, financing plummeted to its lowest level since 2010, before rebounding to some degree in the second quarter. Part of the first-quarter decline was attributable to the United States, where uncertainty over the renewal of key tax credits in late 2015 caused new projects to dry up. The decision to renew the credits facilitated the re-emergence of new projects, helping to boost asset financing in the second quarter. The drop in financing was also due to China, where expected changes in feed-in tariffs led to a run-up in late 2015 and then sharp drop in new project financing. Declining financing in wind power in Latin America, where electricity demand has slowed, also depressed overall activity. Early 2016 trends also reflected the timing of large financing deals. For example, the financial closure of two large offshore wind farms in the
9 Asset financing, which is not adjusted for general inflation, refers to the commitment of debt and equity capital for new projects. This discussion of recent trends in asset financing is intended to complement the investment estimates. The asset financing data cover new projects and are expressed in nominal dollar terms; they exclude hydropower above 50 MW. Asset financing is a forward-looking indicator as it represents the potential value of renewable power that is expected to be commissioned one to four years after financing has been arranged, rather than the actual turnover of the capital stock.

Chapter 4. Investment in the electricity sector 133
United Kingdom (1.2 GW Hornsea Phase 1 and 588 MW Beatrice), which are among the first developments under the United Kingdom’s new CfD scheme, contributed significantly to global financing in early 2016.
Figure 4.19 • World renewables asset financing by type and power generation fuel cost
Note: IEA Power Generation Fuel Cost Index is described in the fossil fuel generation section below.
Source: CEP (2016), dataset provided to the IEA.
While solar PV and onshore wind dominate renewables asset financing trends, the financing of other technologies, including offshore wind and solar thermal electricity plants, comprised the largest financing deals in 2015 (Table 4.2). Given the scale of such transactions, they can involve complex financial structures and diverse investor consortiums, including utilities and developers, commercial banks, public finance institutions and institutional investors, facilitated by long-term contracts with a credit worthy off-taker. In general, changes in government policy play a significant role in guiding short-term financing activity.
Table 4.2 • Top five disclosed renewable asset financings in 2015
Project Country Size Approximate value (USD million)
Race Bank offshore wind United Kingdom 580 MW 2 600
Galloper offshore wind United Kingdom 336 MW 2 291
Veja Mate offshore wind Germany 400 MW 2 108
Rampion offshore wind United Kingdom 400 MW 2 044
Noor 2 and 3 solar thermal electricity
Morocco 350 MW 2 000
Source: CEP (2016), dataset provided to the IEA.
0.0
0.2
0.4
0.6
0.8
1.0
1.2
1.4
0
20
40
60
80
100
Q1 Q2 Q3 Q4 Q1 Q2 Q3 Q4 Q1 Q2 Q3 Q4 Q1 Q2 Q3 Q4 Q1 Q2 Q3 Q4 Q1 Q2 Q3 Q4 Q1 Q2
2010 2011 2012 2013 2014 2015 2016
Q1
2010
= 1
USD
bill
ion
Other Small-scale Utility-scale solar Wind IEA power generation fuel cost index (right axis)
134 Chapter 4. Investment in electricity and renewables
Fossil fuel power generation Investment in fossil fuel power generation fell by 8% to USD 111 billion in 2015, with an increase in coal investment more than outweighed by a decline in gas investment. Spending on coal-fired plant rose by almost a quarter to USD 78 billion, yielding gross capacity additions of 84 GW (Figure 4.20). Investment in gas-fired stations declined by 40% to USD 31 billion and boosted capacity by 46 GW. Overall investment was dampened by a fall in the average cost of building fossil fuel power stations, albeit less than that of renewables, due to a shift in spending to countries where costs are lower and exchange rate effects and falling prices for commodity inputs, such as steel.
There are growing doubts about the sustainability of investment in coal-fired power in view of its impact on local pollution and its incompatibility with climate goals. The global fleet of coal-fired power stations is relatively young; more than 35% is less than ten years old, compared with a technical lifetime of 50 years (Figure 4.21). Most of this capacity is in Asia. Investment remained high in China, India and other non-OECD Asia countries in 2015. Around half of the coal capacity under construction around the world is in China, but growth in electricity demand there has stalled and the authorities have taken measures to limit the building of new coal plants. Had it not been for China, the growth in global coal-fired capacity would have slowed in 2015, partly due to a large spate of retirements in the United States and Europe. Most other plants under construction are in the rest of Asia, where finance for new coal plants is still available. Divestment initiatives, which seek to reduce investor financing of coal power, have focused mostly on equity investors and have had less impact on global availability of debt, a larger component of coal finance (Box 4.5).
Figure 4.20 • Global fossil fuel power investment
0
10
20
30
40
50
60
70
80
90
100
2000
2001
2002
2003
2004
2005
2006
2007
2008
2009
2010
2011
2012
2013
2014
2015
USD
(201
5) b
illio
n
Coal Coal (China) Gas Oil (utility scale)
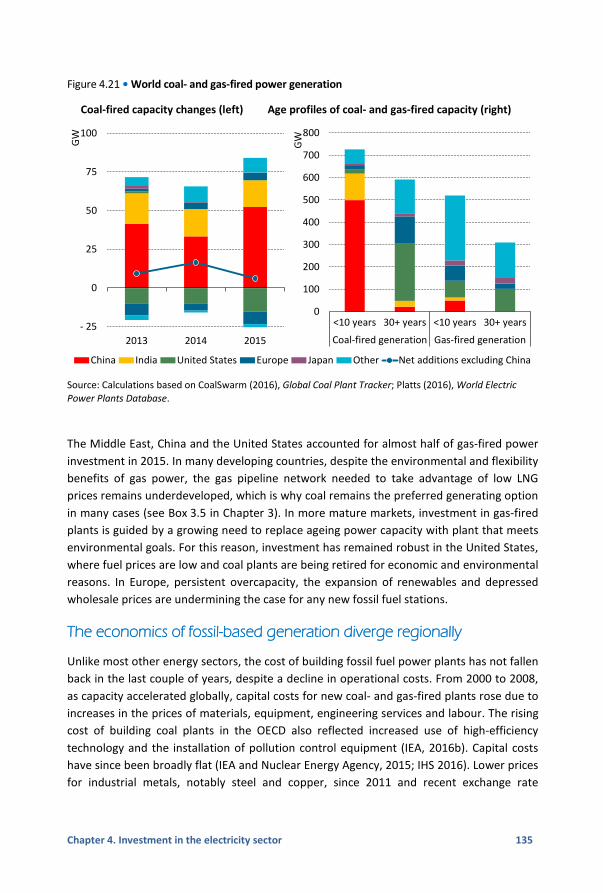
Chapter 4. Investment in the electricity sector 135
Figure 4.21 • World coal- and gas-fired power generation
Coal-fired capacity changes (left) Age profiles of coal- and gas-fired capacity (right)
Source: Calculations based on CoalSwarm (2016), Global Coal Plant Tracker; Platts (2016), World Electric Power Plants Database.
The Middle East, China and the United States accounted for almost half of gas-fired power investment in 2015. In many developing countries, despite the environmental and flexibility benefits of gas power, the gas pipeline network needed to take advantage of low LNG prices remains underdeveloped, which is why coal remains the preferred generating option in many cases (see Box 3.5 in Chapter 3). In more mature markets, investment in gas-fired plants is guided by a growing need to replace ageing power capacity with plant that meets environmental goals. For this reason, investment has remained robust in the United States, where fuel prices are low and coal plants are being retired for economic and environmental reasons. In Europe, persistent overcapacity, the expansion of renewables and depressed wholesale prices are undermining the case for any new fossil fuel stations.
The economics of fossil-based generation diverge regionally
Unlike most other energy sectors, the cost of building fossil fuel power plants has not fallen back in the last couple of years, despite a decline in operational costs. From 2000 to 2008, as capacity accelerated globally, capital costs for new coal- and gas-fired plants rose due to increases in the prices of materials, equipment, engineering services and labour. The rising cost of building coal plants in the OECD also reflected increased use of high-efficiency technology and the installation of pollution control equipment (IEA, 2016b). Capital costs have since been broadly flat (IEA and Nuclear Energy Agency, 2015; IHS 2016). Lower prices for industrial metals, notably steel and copper, since 2011 and recent exchange rate
- 25
0
25
50
75
100
2013 2014 2015
GW
China India United States Europe Japan Other Net additions excluding China
0
100
200
300
400
500
600
700
800
<10 years 30+ years <10 years 30+ years
Coal-fired generation Gas-fired generation
GW

136 Chapter 4. Investment in electricity and renewables
depreciation against the US dollar across a number of markets have helped to offset increases in the price of some other inputs, including labour (see Chapter 3).
There have been pronounced shifts in the financial attractiveness of investing in new coal- and gas-fired plants over the past five years, primarily due to relative changes in capital costs, particularly vis-à-vis renewables, and fuel and power prices. During the first half of 2016, the IEA Power Generation Fuel Cost Index, a composite of global fuel prices, averaged less than half that of five years prior (Figure 4.22).
Figure 4.22 • Selected fuel prices indicators for power generation
Note: The IEA Power Generation Fuel Cost Index is based on a basket of regional coal and natural gas prices, weighted as follows: 40% Qinhuangdao coal, 10% Amsterdam-Rotterdam-Antwerp (ARA) coal, 20% Henry Hub gas, 15% Japan spot LNG, 15% Title Transfer Facility (TTF) gas.
There are, unsurprisingly, big differences in the relative economics of fossil fuel-based generation across regions. In some markets, such as China, where regulated electricity tariffs remained high relative to coal prices, coal-fired generation was very profitable. In the large PJM wholesale market10 in the United States, low gas prices and higher utilisation rates have improved the attractiveness of investing in and operating gas-fired plants (Figure 4.23). Gas-fired generation has also benefited from a steady retirement of coal power, as well as the relatively low penetration of renewables and the way the PJM market operates.
10 The PJM Interconnection is a regional transmission organisation that coordinates the movement of wholesale electricity in all or parts of Delaware, Illinois, Indiana, Kentucky, Maryland, Michigan, New Jersey, North Carolina, Ohio, Pennsylvania, Tennessee, Virginia, West Virginia and the District of Columbia.
0
50
100
150
200
250
300
Janu
ary
2010
= 1
00 Qinhuangdao(coal)
ARA (coal)
Henry hub (gas)
Asian LNG spot
TTF (gas)
Brent (oil)
IEA powergeneration fuelcost index

Chapter 4. Investment in the electricity sector 137
Figure 4.23 • Capital cost recovery for a new gas-fired power plant in the PJM market
Note: Modelled economic dispatch of a 500-MW plant with 55% efficiency, capital cost of USD 1 200/kW and a pre-tax cost of capital of 6.4%.
Source: Calculations based on IEA and NEA (2015), Monitoring Analytics (2016) and Bloomberg LP (2016), Bloomberg Terminal.
Figure 4.24 • Capital cost recovery for a new gas-fired power plant in Germany and the
United Kingdom
Note: Modelled economic dispatch of a 500 MW plant with 55% efficiency, capital cost of USD 850/kW and a pre-tax cost of capital of 6.9% (Germany) and 7.5% (United Kingdom).
Source: Calculations based on IEA and NEA (2015) and Bloomberg LP (2016), Bloomberg Terminal.
0
20
40
60
80
100
120
140
160
180
200
220
240
260
2010 2011 2012 2013 2014 2015
Interest and equitypayments
Plant capital cost
Fixed O&M costs
Variable costs
Revenues (energyonly)
Revenues (energy +capacity)
USD
(201
5) m
illio
n
0
50
100
150
200
250
300
2010 2011 2012 2013 2014 2015
USD
(201
5) m
illio
n
Germany
Variable costs Fixed O&M costs Plant capital costInterest and equity payments Series1 Revenues
2010 2011 2012 2013 2014 2015
United Kingdom

138 Chapter 4. Investment in electricity and renewables
Fossil fuel generation is proving less attractive in Germany, where big falls in capacity utilisation and low wholesale prices mean that new plants have been unable to recover their capital cost, and, sometimes, fixed operation and maintenance costs for the past few years (Figure 4.24). This has undermined the investment case for new gas-fired plants and led to the mothballing of some existing plants whose capital costs have not been depreciated. However, current low gas prices, as well as revenues earned from system services, which are not transparent, are helping some generators. In the United Kingdom, gas-fired generators are just about able to cover capital costs at present, thanks to a higher wholesale electricity price and carbon prices that favour switching from coal. UK carbon prices, which are determined under the European emissions trading scheme, are subject to a floor, introduced by the government in 2013.
Fossil fuel power investment trends in key regions and countries
Has China overinvested in coal-fired power generation?
China is far and away the biggest investor in fossil fuel power generation, accounting for nearly 40% of the world total in 2015 (Figure 4.25). Chinese coal power investment jumped by 60% in 2015, reflecting a huge wave – 52 GW – of new plants coming online that year, but investment was still 15% lower than in 2010. Since 2010, around 30% of China’s total investment in power generation has gone to coal-fired power. Investment in new gas-fired capacity accelerated in 2015, but was less than 15% that of coal power. The 12th Five-Year Plan targets a rising share of natural gas in energy through 2020 and gas infrastructure is expanding (see Chapter 3), but relatively high gas prices compared to international benchmarks and fewer policy incentives compared to low-carbon generation are holding back investment in gas-fired power generation.
Figure 4.25 • Investment in fossil fuel power generation by country/region, 2015
Note: MENA = Middle East and North Africa
0
5
10
15
20
25
30
35
40
45
China India Rest ofAsia
EuropeanUnion
MENA NorthAmerica
OtherEuropeEurasia
OECDAsia
Oceania
sub-Saharan
Africa
LatinAmerica
USD
(201
5) b
illio
n
Oil Gas Coal

Chapter 4. Investment in the electricity sector 139
With nearly 200 GW of coal-fired plants under construction11 and with electricity demand slowing abruptly, it is becoming apparent that China has overinvested in new fossil fuel capacity (Figure 4.26). In the period 2000 to 2013, electricity demand grew rapidly, driving huge investments in coal- and renewables-based generation, and nuclear power. However, the past two years of slowing demand growth has resulted in a narrowing of the energy gap to be filled by fossil fuel power generation. Paradoxically, new investment decisions in coal power accelerated in 2015 even though utilisation rates were declining. Signs of overinvestment persisted in the first half of 2016 – electricity demand growth grew by 2.7% compared to the first half of 2015 and coal power plant utilisation continued to fall to 46%, compared to around 50% in all 2015, as over 21 GW of new plants came online. Based on IEA projections, low-carbon sources are expected to be able to cover annual demand growth of at least 2-2.5% through 2020, leaving little scope for an expansion in fossil fuel generation.
The boom in investment in coal-fired capacity has been driven by a number of factors:
Project profitability: Regulated electricity tariffs have not followed down costs, making generation very profitable. Though state operators determine dispatch and plants are not guaranteed to run, operating guarantees from local authorities can support new projects. Electricity offtake prices for generators are two-thirds higher than average European wholesale prices, but a new ultra-supercritical plant costs only USD 800/kilowatt (kW) to build – less than half that in Europe. With an average load factor of 50% and a carbon price of USD 10/tonne, such a plant would recover its investment in ten years, while a new plant in Europe would not recover its costs in the absence of capacity payments.
Provincial governments: The delegation of licencing to provincial governments resulted in a rapid acceleration of approvals in the northern and western provinces. These areas have large coal deposits, but are less prosperous than coastal provinces, and the approvals reflect expectations of continuing rapid economic development.
Attractive financing: China’s economy is continuing to experience rapid expansion in credit, allowing SOEs to borrow money to maintain investment levels (Hervé-Mignucci et al., 2015).
Industrial structure: Coal mining and transport companies, facing overcapacity and falling prices, have sought to diversify into power as a way of protecting their assets.
District heating: More than a quarter of new coal-fired power plants built in the past decade supply district heating networks, underpinning utilisation rates and protecting returns on investment.
11 As of April 2016.

140 Chapter 4. Investment in electricity and renewables
Figure 4.26 • China’s power generation growth vs demand growth
Source: 2016-20 renewables and nuclear growth are from IEA (2015a), Medium-Term Renewable Energy Market Report 2015; IEA (2015b), World Energy Outlook 2015.
Several factors will influence the future development of the market:
New plants could replace older, less efficient ones: Under China’s “Large Substitutes for Small” initiative, close to 100 GW of old capacity was retired between 2006 and 2014 (IEA, 2014b). But plants older than 30 years, the age of most plants in Europe and the United States, represent only 2% of China’s fleet, suggesting relatively little scope for replacement ahead.
Overinvestment could slow with permitting restrictions and more renewables: In April 2016, the NDRC and the National Energy Administration announced measures to revise permitting decisions for planned projects. NDRC’s recent rule guaranteeing purchase hours for wind and solar PV from 2016 may also slow coal investment.
Coal power pricing changes: The proposed move to wholesale pricing, as well as administrative changes to regulated tariffs could undercut current attractive remuneration levels.
Together with these factors, measures on permitting, renewables and the pricing of coal-fired power could make it more difficult for generators to recover the capital costs of coal plants. Were the rate of commissioning coal-fired plant at that of 2015 to continue, overcapacity would most likely worsen.
Coal power dominates in Asia, but gas investment strong in MENA
Outside of China, other non-OECD Asia countries accounted for nearly 30% of global fossil fuel power investment in 2015. India comprised over half the regional total, and was the
-100
0
100
200
300
400
500
60020
05
2006
2007
2008
2009
2010
2011
2012
2013
2014
2015
2016
2017
2018
2019
2020
Ann
ual g
row
th (T
Wh)
Thermal generation Renewables Nuclear Demand growth

Chapter 4. Investment in the electricity sector 141
world’s second-largest destination for investment after China. After accelerating over 2007-14, annual coal-fired capacity additions in India levelled off in 2015. The growth in expansion of supercritical capacity reversed while that of cheaper, less efficient subcritical plants, which accounted for two-thirds of additions in 2015, increased. Low regulated power prices, which do not always allow the full recovery of investment costs, problems with power purchase from financially-strained distribution companies, problems with the delivery of fuel and rising renewables capacity, which can back out coal plants, are undermining interest in building new coal- and gas-fired capacity. LNG imports could help boost investment in gas-fired power, if the required regasification plants and pipelines can built and gas prices are low enough (IEA, 2016c).
Although coal remains the cheapest generating option in India, the financial case for building new plants, particularly the 4 GW of ultra-mega power projects (UMPPs) that are being encouraged via auctions for long-term contracts, is unclear. Since the scheme’s launch in 2005, tariffs have fallen, but only two of the 16 UMPP plants that are planned have so far been built due to construction delays and difficulties in enforcing PPAs (Prayas, 2015). The amount of coal power capacity under construction has remained at around 70-75 GW over the past year.
Southeast Asia took over 10% of total fossil fuel power investment in 2015. Several large coal plants were commissioned in Indonesia, Lao PDR (serving load in Thailand) and Viet Nam. A lack of pipeline infrastructure hinders the growth of gas-fired power outside of Malaysia, Singapore and Thailand. As a result, gas comprised less than 20% of regional fossil fuel power investment. Coal plants are benefiting from the availability of international financing (see Box 4.5) and are featured prominently in power sector planning in Indonesia, Thailand and Viet Nam, because of the relative economic attractiveness of coal power and concerns about gas supply security and availability. Investment in renewables has grown only modestly. But the investment case for coal-fired power is coming under scrutiny in these countries. Thailand’s 2015 Power Development Plan foresees 4.4 GW of new domestic coal power in the next decade, but, outside of the replacement of some units at existing plants, no new plants are under construction because of local resistance. Viet Nam revised its Power Development Plan in March, reducing the targets for coal power in favour of gas and renewables, though coal would still account for the majority of generation in 2030. In 2015, Indonesia announced a 35 GW capacity addition plan (20 GW from coal) for 2019, though recent reports indicate the government is reviewing the programme. Overall, nearly 25 GW of coal power is under construction region-wide.
Box 4.5 • Is divestment of coal-fired generating assets impacting the ability to finance new
plants?
Initiatives around the world to reduce investor exposure to fossil fuels (known as divestment campaigns) – usually motivated by concerns about climate change – are gathering momentum. The number of investment bodies with divestment commitments rose from 180 in 2014, representing USD 50 billion of total financial holdings, to more than 500 (USD 3.4 trillion) in 2016 (The Electricity

142 Chapter 4. Investment in electricity and renewables
Journal, 2016). But divestment campaigns do not yet appear to be having a significant impact on the overall availability of finance for coal-fired power. Indeed, investors with such commitments continued to invest in new coal power, to the tune of USD 78 billion in 2015.
Divestment can help investors reduce their exposure to assets that may fail to produce adequate returns because of the impact of climate policies. So far, most divestment has concerned coal mining (see Chapter 3), but it may shift to coal-fired power. Large-scale divestment could raise the cost of capital, constrict loans or reduce access to capital markets for project developers. In developing countries with underdeveloped capital markets, reduced international financing could undermine projects. But a bigger factor is the availability of equity relative to debt. Divestment campaigns largely involve equity investors, who are likely to have only indirect impact on the availability of finance (Baron and Fischer, 2015). The bulk of international coal power finance comes from lending by commercial and public banks, especially in developing Asia.
Commercial bank debt for the 30 largest coal-fired power producers (as measured by capacity) amounted to almost USD 75 billion in 2014, down from near USD 90 billion in 2013 (Collins et al., 2015). Among the 20 largest commercial bank lenders in 2014, over half were from China. Few of them have any divestment initiatives that would impact lending to coal-fired power projects. Public finance for coal power from development banks and export credit agencies (ECAs) is a much smaller source of finance, averaging USD 7 billion per year, over 2007-14 and peaking in 2009 at almost USD 11 billion (Bast et al., 2015). But public finance has contracted recently, coinciding with divestment campaigns. Since 2013, the United States, some development banks and several national bodies have announced restrictions on lending to coal-related projects. In late 2015, OECD members of the Arrangement on Export Credits agreed to no longer support large super and subcritical coal-fired plants without carbon capture and storage (OECD, 2015).
The overall impact of divestment campaigns globally is difficult to gauge. Market conditions in Europe and North America have already weakened the case for new coal power. There, divestment may represent the proverbial nail in the coffin for financing new plants. But the picture is different in Asia, which accounts for 90% of all coal plants under construction and where there is still ample debt for domestic development. Indeed, Chinese debt and equity financing for new coal power is rising in Asia, Africa and Eastern Europe (Hervé-Mignucci et al, 2015). Chinese policy bank lending remains important in Indonesia, Viet Nam and India (Ueno, Yanagi, and Nakano, 2014). While China’s president pledged in 2015 to control finance for high-carbon projects, China’s manufacturing strength in coal-fired power, overcapacity in the domestic market and international development strategies could continue to provide strong support for financing coal projects internationally (IEA, 2016d). In addition, divestment may not cover all cases. The OECD export credit rules allow support for “up to medium-size super-critical plants in countries facing energy poverty challenges” and do not cover non-official credit. Ultra-super critical plants, 45% of new coal-fired power investment worldwide in 2015, are also excluded from restrictions on support. New MDBs, such as the New Development Bank and the Asian Infrastructure Investment Bank, whose strategies do not rule out coal financing, are growing in importance, though their energy lending to date has focused on renewables.

Chapter 4. Investment in the electricity sector 143
Fossil fuel power investment in the Middle East and North Africa amounted to USD 8 billion in 2015, reflecting a wave of gas-fired power financing that occurred in 2013-14. Current construction data indicates sustained investment for several years. In 2016, 14.4 GW (nearly 7 billion) of new gas-fired power in Egypt was financed by an international bank consortium. Some countries, such as Saudi Arabia, continue to build large-scale oil-fired plants. Future investment in the region depends on electricity demand growth, which may slow in countries facing a sharp drop in hydrocarbon export revenues, the rate at which renewables expand, nuclear power in the United Arab Emirates (UAE), proposals to build coal plants in Egypt and fuel subsidies across the region. For example, in January 2016, the UAE government announced that gas subsidies for power would be phased out.
Other developing regions in Africa, Eurasia and Latin America comprised around 5% of fossil fuel power investment in 2015. Around 20% of this was in South Africa, where one 800 MW unit of the 4.8 GW Medupi coal plant was commissioned in 2015. Nearly 10 GW of coal-fired power, capacity, at the Medupi and Kusile megaprojects, is under construction there. Still, the investment outlook has some uncertainty due to regulated power tariffs that can impede full cost recovery, cost inflation affecting current projects, domestic coal availability, a lack of grid connections and strong growth in renewables. Foreign investment is playing a stronger role in the development of sub-Saharan Africa’s electricity sector. Chinese companies are increasing investments in the region, contracting almost 30% of generation from new plants. In gas-rich countries such as Nigeria, most new capacity is being built by Chinese companies (IEA, 2016d). International initiatives, such as Power Africa, are also channelling funds into new generation, with some 4 GW of gas power already developed.
In Latin America, fossil fuel power investment has slowed over the past decade. This reflects both weaker electricity demand growth as well as a rise in renewables investment. Brazil’s goals for gas-fired power in 2024 were recently raised to over 10 GW, in part for reasons of energy diversification. In 2015, 1.5 GW of new gas power, to be fuelled by LNG, was contracted under auction, though little was contracted in 2016. The weak prospects for power demand, the drop in the value of the real, which has raised costs for imported equipment, growing investment in wind power and a lack of regional gas pipelines could continue to hold back investment in gas-fired power.
A more challenging climate for fossil fuel generators in OECD countries
OECD regions accounted for 20% of fossil fuel power investment in 2015, compared with around 45% just five years earlier. In OECD Europe, weak electricity demand, overcapacity and expanding renewables production have deterred investment in new capacity where investment costs are recovered solely through the price of the electricity generated (Box 4.6). The investment in 2015 relates mainly to the commissioning of three coal power plants in Germany, whose investment decisions were all made prior to 2009 when market conditions were more favourable than today. Gas-fired capacity was also added in Greece and Ireland from projects with financing that was completed in 2012. Some 8 GW of coal-fired capacity was retired or

144 Chapter 4. Investment in electricity and renewables
converted in 2015 due to the unprofitability of coal-fired generation and environmental regulations. Only Poland (4.4 GW), Turkey (3.0 GW) have any significant amount of coal-fired power capacity under construction; a 1.1 GW coal plant with biomass co-firing came online in the Netherlands in 2016.
In North America, fossil fuel power investment declined by 40% in 2015, to under USD 7 billion. As in Europe, some conventional generators are encountering financial difficulties caused by weak electricity demand, low wholesale prices and increased competition from renewables. But investment in gas-fired generation remains attractive, thanks to low gas prices, current and planned coal plant retirements and favourable regulatory frameworks. In 2015, for the first time ever, the average capacity factor for US combined-cycle gas-fired plants exceeded that for coal. Over each of the next three years, between 7 and 11 GW of gas plants currently being built are due to come online in the United States – close to last decade’s average rate and well up on 2015 (Figure 4.28)
Box 4.6 • A difficult climate for conventional power investment in Europe
There are growing concerns about the prospects for electricity investment in Europe. Investment is needed to upgrade or replace ageing power station, integrate variable renewables and meet climate goals. But the utilities that would normally be responsible for much of this investment are facing enormous financial difficulties as a result of a slump in wholesale power prices and competition from new renewables-based generators. New gas-fired capacity is needed and some 6 GW is under construction in the European Union, with needs to replace as much as 70 GW of coal-fired capacity and near 30 GW of nuclear capacity that is due to be decommissioned over the next decade (IEA, 2015c). But no FIDs on new gas generation plants have been made since 2013. Even if new projects are expected to be profitable, the utilities are struggling to obtain financing. Several European utilities have taken large losses on unprofitable coal and gas-fired generation. In 2015, asset write-downs by the 20 leading utilities were equivalent to one-third of EU power investment (Figure 4.27). Though asset impairments – the sharp fall in the value of their operating assets – reflect losses from global operations, including outside the power sector, they are in large part the result of unfavourable market conditions in Europe.
Some utilities have started restructuring their operations to separate out their regulated activities, such as renewables and network services, from those more exposed to wholesale pricing. And regulators have introduced measures aimed at ensuring the adequacy of power supplies, including capacity mechanisms and, in some cases, prohibitions on closing unprofitable plants. The impact of capacity mechanisms, which remunerate generators for making available capacity regardless of whether it is used, on investment has so far been mixed. In the United Kingdom, for example, two capacity market auctions in 2014 and 2015 resulted in awards going mostly to existing capacity (over 10% in GBP terms to existing coal plants) and some to new diesel power. However, it also brought forth some new investment in cleaner, more flexible assets, such as gas-fired generation, and demand response.
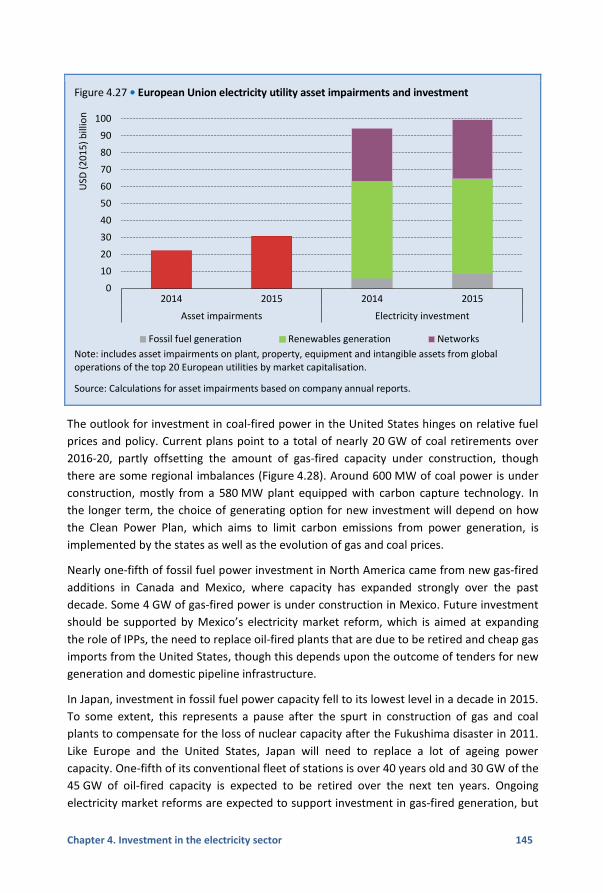
Chapter 4. Investment in the electricity sector 145
Figure 4.27 • European Union electricity utility asset impairments and investment
Note: includes asset impairments on plant, property, equipment and intangible assets from global operations of the top 20 European utilities by market capitalisation.
Source: Calculations for asset impairments based on company annual reports.
The outlook for investment in coal-fired power in the United States hinges on relative fuel prices and policy. Current plans point to a total of nearly 20 GW of coal retirements over 2016-20, partly offsetting the amount of gas-fired capacity under construction, though there are some regional imbalances (Figure 4.28). Around 600 MW of coal power is under construction, mostly from a 580 MW plant equipped with carbon capture technology. In the longer term, the choice of generating option for new investment will depend on how the Clean Power Plan, which aims to limit carbon emissions from power generation, is implemented by the states as well as the evolution of gas and coal prices.
Nearly one-fifth of fossil fuel power investment in North America came from new gas-fired additions in Canada and Mexico, where capacity has expanded strongly over the past decade. Some 4 GW of gas-fired power is under construction in Mexico. Future investment should be supported by Mexico’s electricity market reform, which is aimed at expanding the role of IPPs, the need to replace oil-fired plants that are due to be retired and cheap gas imports from the United States, though this depends upon the outcome of tenders for new generation and domestic pipeline infrastructure.
In Japan, investment in fossil fuel power capacity fell to its lowest level in a decade in 2015. To some extent, this represents a pause after the spurt in construction of gas and coal plants to compensate for the loss of nuclear capacity after the Fukushima disaster in 2011. Like Europe and the United States, Japan will need to replace a lot of ageing power capacity. One-fifth of its conventional fleet of stations is over 40 years old and 30 GW of the 45 GW of oil-fired capacity is expected to be retired over the next ten years. Ongoing electricity market reforms are expected to support investment in gas-fired generation, but
0
10
20
30
40
50
60
70
80
90
100
2014 2015 2014 2015
Asset impairments Electricity investment
USD
(201
5) b
illio
n
Fossil fuel generation Renewables generation Networks

146 Chapter 4. Investment in electricity and renewables
stagnant electricity demand, the rapid expansion of renewables and the restart of nuclear capacity may mean that little new capacity is needed. Meanwhile, Korea remains one of the few OECD countries with a VIU monopoly and significant amounts of coal-fired plants and nuclear reactors still being built. Investment was dominated by gas in 2015, but both gas and coal plants are under construction. The government recently announced reforms to begin restructuring the power sector from 2017.
Figure 4.28 • US gas- and coal-fired power generation capacity additions and retirements
Note: Regions correspond to major US independent system operators. ERCOT = Electric Reliability Council of Texas; MISP = Midcontinent Independent System Operator; PJM = PJM Interconnection.
Source: US EIA (2016), “Monthly Update to Annual Electric Generator”.
Nuclear power The 10 GW12 of new nuclear power capacity connected to the grid in 2015 corresponded to over USD 21 billion of investment (Figure 4.29). Factoring in estimated investment of USD 10.5 billion in upgrades and lifetime extensions at existing plants, total investment may have exceeded USD 31 billion.13 Upgrades and extensions, which were mainly carried out at old plants in Europe and North America, are considerably cheaper than building new reactors from scratch.
12 Nuclear capacity additions are measured as the gross electrical size of the plants that were connected to the grid. 13 The investment associated with upgrades and life extensions is very hard to measure and the figure shown is indicative only. Only new plant investment is included in this overall investment data shown in this report.
- 15
- 10
- 5
0
5
10
15
2010 2011 2012 2013 2014 2015 2016 2017 2018 2019 2020
GW
ERCOT
Southeast
MISO
PJM
OtherPlanned retirement of coal capacity
Under construction gas capacity
Historic coal power retirements
Historic gas power additions

Chapter 4. Investment in the electricity sector 147
Figure 4.29 • World investment in new nuclear power plants
Note: Investment estimates reflect cost assumptions in 2010, reflecting an average construction lead time of around five years.
Source: IEA and NEA calculations based on IEA and NEA (2010) and IAEA (2016), Power Reactor Information System (PRIS).
Figure 4.30 • Global nuclear power plant construction starts
Source: IAEA (2016), Power Reactor Information System (PRIS).
In China, 8 GW of nuclear capacity was commissioned in 2015 (Figure 4.30). Nuclear power represents a major component of the government’s strategy in building a low-carbon energy system, benefiting from a preferential regulated tariff. During 2016 through July, 3.9 GW more nuclear capacity came online; another 23 GW is under construction. Russia
0
5
10
15
20
25
2000 2001 2002 2003 2004 2005 2006 2007 2008 2009 2010 2011 2012 2013 2014 2015
USD
(201
5) b
illio
n
China Rest of the world
0
2
4
6
8
10
12
14
16
18
20
2000
2001
2002
2003
2004
2005
2006
2007
2008
2009
2010
2011
2012
2013
2014
2015
GW
Rest of world China

148 Chapter 4. Investment in electricity and renewables
added one new plant, with a capacity of 0.9 GW, in 2015. Russia’s draft energy strategy envisions an increase in the share of nuclear power in total generation from 17% in 2015 to 19-21% in 2035. Elsewhere outside the OECD, the largest amount of capacity under construction is in India (3.3 GW) and the United Arab Emirates (5.6 GW).
Among OECD countries, Korea saw a 1 GW plant connected to the grid in 2015. The government’s Second National Energy Plan calls for 29% of electricity supply by 2035 to come from nuclear power; 4.2 GW is under construction. In the United States, the first new reactor in two decades was connected to the grid in 2016. While around 5 GW remain under construction, all in southeast states with regulated, single-buyer markets, six reactors with a combined capacity of over 5.7 GW are due to close during the period 2017-19. Most of these closures are in states in the Northeast and Midwest and are motivated by economic reasons. Some states are considering regulatory reforms to try to avoid these closures. For example, New York’s recently enacted Clean Energy Standard for 50% renewable power by 2030 includes a requirement for investor-owned utilities to purchase zero-emission credits (ZEC) from nuclear generation during the transition, which could improve economics for some operating plants.
Electricity networks
Replacing old distribution lines takes a rising share of grid spending
Investment in electricity T&D and battery storage worldwide in 2015 reached over USD 260 billion, equal to nearly 40% of total power sector investment (Figure 4.31). T&D accounted for over 99% of electricity networks spending. The average investment cost of distribution lines per kilometre is much lower than that of transmission lines, but given the scale of the system distribution investment, at over USD 200 billion still represents over three-quarters of the total network investment.
Figure 4.31 • World investment in electricity T&D
40%
50%
60%
70%
80%
90%
100%
0
50
100
150
200
250
300
2000
2001
2002
2003
2004
2005
2006
2007
2008
2009
2010
2011
2012
2013
2014
2015
USD
(201
5) b
illio
n Distribution
Transmission
Share of distribution(right axis)

Chapter 4. Investment in the electricity sector 149
Replacement of ageing lines accounted for 50% of OECD network investment in 2015. In most OECD countries, the rollout of the electricity network peaked in the 1960s and 1970s, and much of it now needs replacing. A lot of the network is in need of replacement in Russia and other non-OECD European countries as well. Replacement investment generally improves the quality of supply, reduces grid losses and cuts operating costs. In contrast,
spending on networks in non-OECD countries is primarily to accommodate rising demand and expand access to electricity to those not yet connected to the grid (Figure 4.32 For example, some 80% of the expansion of electricity networks in Africa serves new demand and access. Around 12 million people worldwide have been connected to a centralised electricity grid each year on average between 2000 and 2012 (IEA, 2014c).
A growing share of investment in networks is linked to the integration of variable renewable energy sources, essentially wind and solar PV. Some of the production from variable renewables is fed into the distribution grid, such as in the case of rooftop solar PV. The multidirectional and dynamic power flows associated with them often means that the distribution grid has to be reinforced. Renewable power plants often require the extension of transmission from remote locations, where the quality of the wind or solar energy resource is particularly good; for example, wind in northern Germany, and wind in the midwest and solar in the southwest of the United States. Improving interconnectivity between previously segmented power systems was already a policy objective before the recent ramp up of wind and solar. While interconnections between independent power systems can help improve supply security and integrate electricity markets, they are also recognised as an important component of successfully even out the variability of renewable energy.
Figure 4.32 • World investment in electricity transmission and distribution by region and driver,
2015
0%
10%
20%
30%
40%
50%
60%
70%
80%
90%
100%
Global OECD Non-OECD
D - Renewables
D - Replacement
D - New lines
T - Renewables
T - Replacement
T - New lines
Distribution:
Transmission:

150 Chapter 4. Investment in electricity and renewables
From the point of view of sectoral organisation and regulatory structure, three models exist for network investment:
The first is as part of the integrated investment budget of monopoly utilities that have an obligation to serve consumers. This integrated investment budget is approved by a government entity. If retail prices are kept below the cost recovery level, the utilities are often forced to pay non-controllable costs such as fuel imports or power purchase contracts. In this situation, network investment typically gets squeezed by the burden of consumer subsidies. This phenomenon has led to grid quality and supply security problems in countries such as India and South Africa.
In countries that have an unbundled grid, network operators undertake the large majority of investment. An investment plan is approved by the regulator and costs are incorporated into the network tariffs. Network costs, especially at the distribution level, are spread across a broad range of consumers. Regulators aim to allow the operator to make a reasonable rate of return and minimise the cost of service while ensuring reliability and adequacy. Depending on the regulatory regime, investment risk can remain in the form of unexpected demand changes and decentralised generation, which can reduce consumption from the grid. This situation is exacerbated by the mismatch between fixed cost allocation and tariff design, where grid companies only recover a portion of their costs through the variable part of electricity bills.
Merchant network investment represents a small portion of the total, but accounts for some of the highest profile transmission projects. In this case, a point-to-point transmission tariff is established, either through negotiation or an auction of capacity contracts. This approach is well suited to direct current (DC) transmission projects that link separate networks. This is the most common model for onshore projects in North America and undersea DC cables in Europe, where new regulatory regimes such as the cap-and-floor regime, which provides a floor for revenues for investments but caps the level of returns, recently introduced by Ofgem in the United Kingdom are unlocking investment by reducing risk for developers.
Public private partnerships (PPPs) are sometimes used for new transmission investments as a means of limiting the need for public funding where the network is owned by the state and profiting from the technical know-how of the private sector. PPS have been used to finance network investments in Latin America. The Offshore Transmission Owner (OFTO) model that was launched in the United Kingdom in 2009 is comparable to PPPs, but involves tighter regulation of revenue streams to investors.
Network investment trends in key regions and countries
China is the largest investor in electricity networks in the world. Under the 12th Five-Year Plan covering the period to 2015, the transmission network was expanded at the rate of 40 000 kilometres (km) per year. Given the recent slowdown of electricity demand growth, network investment is also increasingly driven by the development of renewables. Investment in solar PV and wind power has occurred mainly in remote provinces with the

Chapter 4. Investment in the electricity sector 151
best resources, such as Inner Mongolia and Ganshu. Getting the power from there to the main markets in the east has required major reinforcement of the transmission system. The rapid ramp up of wind and solar ran ahead of the network to some degree, leading to large-scale curtailment of generation. Similarly, hydropower developments in southwest China were accompanied by long-distance transmission projects. The large, modern coal-fired plants that are being built in the coal-rich but sparsely populated northern and western provinces will require additional transmission capacity to supply power to eastern cities, where such “coal by wire” projects are seen as a way of improving air quality.
China is a global leader in the development of long-distance, ultra-high voltage (UHV) transmission (Table 4.3). Recent projects have a combined capacity of 8 GW, covering a distance of over 2 000 km. In 2015, the State Grid Corporation of China (SGCC) invested in the construction of around 27 000 km of lines in order to integrate renewable resources. Eight long-distance UHV projects under development were listed in the Action Plan for Air Pollution Prevention and Control of China, representing a further 12 000 km of transmission lines.
T&D investment has been rising in North America in line with initiatives to enhance reliability, an increase in renewables generation and the need to replace ageing infrastructure. US market designs are typically based on locational marginal pricing, which provides a transparent price signal of the value of transmission services. In 2015, 3 550 km of new transmission lines were brought into service in the United States and 16 440 km more are under development, although licencing obstacles routinely cause delays. The Competitive Renewable Energy Zones (CREZ) programme in Texas is a clear example of how a new grid infrastructure can facilitate renewables. The USD 7 billion investment in approximately 5 800 km of transmission lines over the period 2009-14 is designed to serve 18.5 GW of wind energy from windy, but remote regions, whose production would represent around 10% of state electricity peak demand.
In Europe, network investment is primarily driven by the need to replace obsolete assets and integrate renewables. The European Union has set an interconnection target 10% of installed electricity production capacity by 2020 and has proposed to extend this to 15% by 2030, which is coordinated through European Network of Transmission System Operators’ Ten-Year Network Development Plan (TYNDP) that identifies and tracks Projects of Common Interest that are considered necessary to meet EU energy policy goals. This initiative aims to streamline permitting and financing. EU funding via the Connecting Europe Facility is playing an increasing role. Progress towards meeting the target remains slow due to local objections and difficulties in co-ordinating licencing.
In spite of these problems, several interconnections came online in the past two years including a line between Sicily and Mainland Italy, EstLink2 between Finland and Estonia, and NordBalt between Sweden and Lithuania. Several projects are under construction including the high-voltage direct current (HVDC) subsea cable between Italy and Montenegro, HVDC interconnection Piemonte (Italy)-Savoia (France), the Nemo Link Project between the United Kingdom and Belgium, the COBRAcable project between the

152 Chapter 4. Investment in electricity and renewables
Netherlands and Denmark or NORD Link between Norway and Germany. In addition, the relatively new cap-and-floor regulatory regime in the United Kingdom has attracted alone new investment projects in the United Kingdom which are expected to be completed in the next 5 years (Nemo Link, FAB Link, IFA2, Viking, Greenlink).
Table 4.3 • Selected UHV transmission lines in China
Project Type Voltage (kV) Length (km) Completion
year
Huainan – Nanjing – Shanghai UHVAC 1000 2 x 780 2016
Xilingol League – Shandong UHVAC 1000 2 x 730 2016
Western Inner Mongolia – Southern Tianjin
UHVAC 1000 2 x 608 2016
Yuheng–Weifang UHVAC 1000 2 x 1049 2017
Ningdong–Zhejiang UHVDC ±800 1720 2016
Jinbei–Jiangsu UHVDC ±800 1119 2017
Xilingol League–Jiangsu UHVDC ±800 1620 2017
Shanghaimiao–Shandong UHVDC ±800 1238 2017
Note: kV = kilovolt.
Source: SGCC (2015), Corporate Report.
In India, network investment continues to be hindered by the weak financial position of distribution companies caused by subsidised electricity tariffs that do not allow the companies to recover their costs. This leads to frequent reliability problems and high distribution losses. The government is trying to tackle this problem by offering grants to states that have implemented pricing and governance reforms. This policy aims to unlock around USD 60 billion in new network investment. At the transmission level, mine-mouth coal-fired plants in the east of the country and solar developments located far from demand centres are the main drivers of investment. A notable project under construction is the ±800 kV North-East Agra UHV direct current line crossing northern India.
Smart grids, electricity storage and electric vehicle charging infrastructure
Smart grids and electricity storage are expected to play a crucial role in integrating large shares of variable renewables, by facilitating greater demand side flexibility and more resilient networks. Smart grid technologies include a wide variety of information and communication technologies and equipment deployed along the T&D network that enable

Chapter 4. Investment in the electricity sector 153
the real-time monitoring of electricity flows from generators to end users. Smart grids are used to reduce operational costs, by enhancing remote meter reading, remote service connection and disconnection, and improving fault detection and the management of outages. They could help improve network efficiency and accelerate the penetration of renewable resources.
Global investment in smart grids grew to USD 21 billion in 2015, a rise of 12% compared to 2014. Smart meters accounted for 21% of the smart grid programmes implemented in 2015, the rest being mostly distribution automation, substation upgrades and supporting information technology infrastructure. China remains the largest investor in smart grid technologies and is committed to a major expansion in the number of smart meters in the coming years; through 2015, over 400 million meters were contracted through tenders in 2015 (BNEF, 2016c).
Investment in electricity storage worldwide in 2015 totalled over USD 10 billion, compared with an average of USD 8.5 billion (in 2015 prices) over 2010-14 (Figure 4.33). In 2015, 4 GW of electricity storage were commissioned globally, boosting installed capacity to over 150 GW. These estimates cover grid-scale storage only, as consumer investments in behind-the-meter residential storage has not yet reached a measurable scale. Pumped hydro storage, whose investment is included in the hydropower data of this report, remains the largest component of global storage investment, accounting for 97% of total cumulative capacity in 2015. Compressed air storage, power to gas (mostly hydrogen) and batteries make up the rest. Grid-scale battery investment, at 1 USD billion, remains relatively small, at only 0.4% of networks spending, but has grown ten-fold since 2010.
Figure 4.33 • Global electricity storage investment, 2015 (USD 2015 million)
Note: CAES = compressed air energy storage.
Source: Calculations based on US DOE (2015), Global Energy Storage Database.
Pumped hydro storage, 8 330
Lithium-ion, 130
Lead-acid, 13
Nickel-cadmium, 4
Flywheel, 3Redox-flow, 209
Sodium-sulphur, 48
CAES, 2
Other batteries, 620
Thermal storage, 715
Other, 1 740

154 Chapter 4. Investment in electricity and renewables
Notable new storage projects that came online in 2015 include the Tehri Pumped Storage Plant in India, the 40MW deployed by Kokam to Korean Electric Power Corporation becoming one of the world’s largest battery storage system and E.ON’s power to gas plant in Reintbrook, Germany. Historically, the load management strategies of VIUs have driven most deployment of storage systems, but new system-specific requirements such as integration of variable renewables, operational support, system planning are now encouraging investment in these technologies (Box 4.7).
Worldwide investment in electric car charging infrastructure, included in distribution spending, reached nearly USD 2 billion in 2015 – a small fraction of total network investment. Some 600 000 charging points were added around the world, 550 000 electric vehicles were sold (see Chapter 2). Only 13% of the charging points installed at the end of 2015 were open to the public. During 2015, slow and fast public charging outlets experienced similar growth rates (73% and 63% respectively), in line with the 78% growth rate for the global electric vehicle stock (EVI, 2016).
Box 4.7 • Could decentralised renewables and batteries make future network investment
redundant?
Recent technology improvements and cost reductions for renewables and batteries have prompted a debate about the future of the electric grid. Some argue that electricity networks based on large, centralised generating plants could be become a stranded asset as an increasing share of power is obtained from decentralised sources. This debate is particularly pertinent in countries in Africa and south Asia that are still investing heavily in expanding their grids. Comparisons have been made with the leap frogging of fixed line telecommunications by mobile phones.
While distributed generation is facilitating a more flexible and decentralised electricity system, their continued development still relies on a robust network supported by an effective regulatory framework (IEA, 2016a), for the following reasons:
Wind farms are typically multi-megawatt size and rely on a centralised grid to deliver to end users, rather than decentralised self-consumption. The direction of technological innovation for wind has been towards larger turbines with higher hub heights. Because wind power generally benefits from economies of scale, its emergence as a major source is enabled by increased investment in networks.
While solar PV can support small-scale decentralised generation, large-scale ground-based utility-scale solar farms currently represent the majority of solar investment in China, the United States and India. Those solar farms act as power plants from the point of view of the electricity network and in some cases such as the southwest United States or Rajasthan in India require significant network investments.
Distributed solar PV without storage or demand shifting is unlikely to reduce network investment needs unless there is large midday consumption, for example, for air-conditioning. However, even in warm climates such as in California, peak load is often in late afternoon whereas in moderate climates like Germany it is usually after sunset. Peak consumption still requires supply from the grid; distributed generation that peaks around midday typically requires network reinforcement to avoid

Chapter 4. Investment in the electricity sector 155
congestion.
Paired with demand-side response, batteries appear to be the most efficient way of reducing the need for such network reinforcement. However, in temperate climates, the winter-summer discrepancy of solar production is so large that complete disconnection from the network is not practical. The value of consumer-owned batteries is enhanced if there is an ability to sell storage services back to the grid.
Solar PV with batteries and light-emitting diodes (LED) lights will undoubtedly play an important role in both India and Africa, especially in remote areas. However, with rapid urbanisation in both regions and major cities accounting for up to 70% of power demand, a centralised system will still be needed. Some communities currently supplied by decentralised solar projects will eventually be connected to the centralised system.
Networks are crucial to supporting transactions between distributed resources. Those transactions may involve distribution system operators, aggregators or the buying and selling of power at the distribution level. Distributed business models, such as net metering, are only feasible in the presence of a network.
References
Baron, R. and D. Fischer (2015), Divestment and Stranded Assets in the Low-carbon Transition, OECD Publishing, Paris, www.oecd.org/sd-roundtable/papersandpublications/Divestment%20and%20Stranded%20Assets%20in%20the%20Low-carbon%20Economy%2032nd%20OECD%20RTSD.pdf (accessed 26 July 2016).
Bast, E. et al. (2015), Under the Rug: How Governments and International Institutions are Hiding Billions in Support to the Coal Industry, NRDC/Oilchange International/WWF, Washington D.C.
Bloomberg LP (2016), Bloomberg Terminal, (accessed 28 July 2016).
BNEF (Bloomberg New Energy Finance) (2016a), Renewable Energy Projects, www.bnef.com/ (accessed 28 July 2016).
BNEF (2016b), “Yieldcos: A new source of liquidity in renewable energy,” www.bnef.com/ (accessed 28 July 2016).
BNEF (2016c), “Q1 2016 Digital Energy Market Outlook”, www.bnef.com/ (accessed 09 September 2016).
Board of Governors of the Federal Reserve System (US) (2016), 7-Year Swap Rate retrieved from FRED, Federal Reserve Bank of St. Louis, https://fred.stlouisfed.org/series/WSWP7 (accessed 04 September 2016).

156 Chapter 4. Investment in electricity and renewables
CEP (Clean Energy Pipeline) (2016), dataset provided to the IEA.
CoalSwarm (2016), Global Coal Plant Tracker, CoalSwarm, San Francisco. www.bit.ly/1UCQKwg (accessed 26 July 2016).
Collins, B. et al. (2015), The End of Coal? Coal Finance Report Card 2015, www.actu-environnement.com/media/pdf/news-24476-the-end-of-coal-2015.pdf (accessed on 5 September).
CPI (Climate Policy Initiative) (2015), Global Landscape of Climate Finance 2015, Climate Policy Initiative, http://climatepolicyinitiative.org/publication/global-landscape-of-climate-finance-2015/ (accessed 26 July 2016).
DiaCore (2016), “The impact of risks in renewable energy investments and the role of smart policies”, DiaCore, www.diacore.eu/ (accessed 26 July 2016).
Goldberg, J. and O. Lier (2011), Rehabilitation of Hydropower, An introduction to economic and technical issues, World Bank, Washington D.C., openknowledge.worldbank.org/handle/10986/17251 (accessed 26 July 2016).
Hervé-Mignucci, M. et al. (2015), Slowing the Growth of Coal Power Outside China: The Role of Chinese Finance, Climate Policy Initiative, San Francisco.
IAEA (2016) Power Reactor Information System (PRIS), International Atomic Energy Agency, Vienna, Austria, www.iaea.org/pris/ (accessed 26 July 2016).
IEA (2016a), Re-powering Markets, OECD/IEA, Paris.
IEA (2016b), World Energy Outlook Special Report 2016: Energy and Air Quality, OECD/IEA, Paris.
IEA (2016c), Medium-Term Renewable Energy Market Report 2016, OECD/IEA, Paris, forthcoming.
IEA (2016d), Boosting the Power Sector in Sub-Saharan Africa: China’s Involvement, OECD/IEA, Paris.
IEA (2015a), Medium-Term Renewable Energy Market Report 2015, OECD/IEA, Paris.
IEA (2015b), World Energy Outlook Special Report: India Energy Outlook, OECD/IEA, Paris.
IEA (2015c), World Energy Outlook, OECD/IEA, Paris.
IEA (2014a), The Power of Transformation, OECD/IEA, Paris.
IEA (2014b), Emissions Reduction through Upgrade of Coal-Fired Power Plants Learning from Chinese Experience, OECD/IEA, Paris.
IEA (2014c), World Energy Outlook Special Report: Africa Energy Outlook, OECD/IEA, Paris.
IEA and NEA (Nuclear Energy Agency) (2015), Projected Cost of Generating Electricity, OECD/IEA, Paris.

Chapter 4. Investment in the electricity sector 157
IEA and NEA (2010), Projected Cost of Generating Electricity, OECD/IEA, Paris.
IHS (2016), IHS Indexes, IHS Markit, www.ihs.com/info/cera/ihsindexes/(accessed 26 July 2016).
IDFC (International Development Finance Club) (2012-15), www.idfc.org (accessed 27 July 2016).
IRENA (2016), IRENA Renewable Costing Alliance, dataset, http://costing.irena.org/irena-renewable-costing-alliance.aspx.
LBNL (Lawrence Berkeley National Laboratory) (2016), Utility-Scale Solar 2015, LBNL/DOE, Berkeley, www.emp.lbl.gov/sites/all/files/lbnl-1000917.pdf (accessed 30 August 2016).
Monitoring Analytics (2016), PJM State of the Market – 2015, Monitoring Analytics. Eagleville, Pennsylvania, www.monitoringanalytics.com/reports/PJM_State_of_the_Market/2015.shtml
OECD (Organisation for Economic Co-operation and Development) (2016a), Green Bonds: Mobilising the Debt Capital Markets for a Low-Carbon Transition, OECD Publishing, Paris.
OECD (2016b), OECD Business and Finance Outlook 2016, OECD Publishing, Paris.
OECD (2016c), OECD Policy Perspectives: Green Investment Banks, OECD Publishing, Paris.
OECD (2015), Statement from Participants to the Arrangement on Officially Supported Export Credits, OECD Publishing, Paris.
Platts (2016), World Electric Power Plants Database, Platts, Washington, D.C., www.www.platts.com/products/world-electric-power-plants-database (accessed 27 July 2016).
Prayas (2015), Prayas submission to the Expert Committee on Model Bidding Documents for UMPP and other location specific projects, Prayas Energy Group, Pune, www.prayaspune.org/peg/publications/item/308.html (accessed 26 July 2016).
Rocky Mountain Institute (2016), dataset provided to the IEA.
SGCC (State Grid Corporation of China) (2015), Corporate Social Responsibility Report, www.www.sgcc.com.cn/csr/images/reports/2016/02/22/C0F6696460C59686CFA54B9C11EFCB06.pdf (accessed 27 July 2016).
Ueno, T., M. Yanagi and J. Nakano (2014), Quantifying Chinese Public Financing for Foreign Coal Power Plants, The University of Tokyo, Tokyo.
The Electricity Journal (2016), Fossil fuel Divestments Begin to Bite, The Electricity Journal, www.elsevier.com/ (accessed 26 July 2016).
US DOE (United States Department of Energy) (2016), 2015 Wind Technologies Market Report, US Department of Energy, Washington D.C.,

158 Chapter 4. Investment in electricity and renewables
https://emp.lbl.gov/sites/all/files/2015-windtechreport.final_.pdf, (accessed 30 August 2016).
US DOE (2015), Global Energy Storage Database, www.energystorageexchange.org/, (accessed 26 July 2016).
US EIA (United States Energy Information Administration)(2016), Monthly Update to Annual Electric Generator, www.eia.gov/electricity/data/eia860M/, (accessed 26 July 2016).
World Bank et al. (2012-15), website, www.worldbank.org (accessed 27 July 2016).

Chapter 5. Implications of current investment trends 159
5. Implications of current investment trends
Highlights
Cuts in investment in oil supply point to tighter markets in the future. Although the sector is benefiting from massive cost reductions and efficiency improvements, the decline in upstream investment is so severe as to suggest a rebalancing of the market in spite of transport efficiency gains and the emergence of electric cars.
Gas markets might remain well supplied for a considerably longer period than oil markets, in view of recent changes in supply- and demand-side investments. Collapsing spending in new liquefaction terminals may have a limited impact on LNG supply in the medium term due to recent large-scale investments in long life assets. The outlook for gas demand has been affected by strong investment in alternatives to gas-fired power generation. Demand for gas has also been dampened by policies to enhance electricity efficiency and other energy-efficient demand-side technologies.
Overinvestment in coal mining and weakening Chinese demand, together with the recent boom in coal mining investment in China, Indonesia and Australia, point to a bearish outlook for coal markets. A rebalancing of coal markets would require painful supply adjustments and several years of low investment in mining facilities. Investment in inefficient subcritical coal plants, at USD 22 billion in 2015, remains excessive and threatens to lock in carbon emissions in the future.
Policy and regulatory drivers play a dominant role in electricity investment and thus electricity security. The majority of power generation investment is based on a contract with a single buyer or a renewable policy. In these cases, investment is driven by policy decisions not prices. As such, appropriate market design can enable a large-scale mobilisation of capital but necessitates consistent regulatory attention to capacity adequacy.
Investment in energy continues to shift in the direction of low-carbon sources and technologies, but not fast enough to meet energy security and climate goals. Completing the required energy transition will call for more investment. The low-carbon power capacity coming online in 2015 was more than sufficient to cover the entire increase in electricity demand worldwide, but this is not enough. To achieve a low-carbon transition consistent with the goal of limiting global temperature increase to well below 2°C, investment in energy efficiency, renewables and other low-carbon technologies will need to increase rapidly from the 2020s.

160 Chapter 5. Implications of current investment trends
Energy commodity markets Energy markets are shaped by investments in both supply infrastructure and end use, including energy efficiency. In both energy and financial terms, oil remains the most important energy commodity. Following price-driven declines in upstream investment, a rebalancing and tightening of oil markets appears likely in the medium term. Increasing vehicle penetration, lower fuel prices and transport-intensive GDP growth are expected to drive annual oil demand growth of over 1 million barrels per day (mb/d) to 2020 (IEA, 2016a). To some extent, this reflects the lack of commercially attractive alternatives to oil in transport: the electric vehicles sold in 2015 will displace around 10 000 barrels per day, equal to a mere 0.01% of global oil demand.
Gas markets might remain well supplied for a considerably longer period than oil in view of recent changes in supply- and demand-side investments (IEA, 2016b). The outlook for gas demand has been affected by strong investment in alternatives to gas in power generation. The wind farms and solar projects that came online in 2015 are equivalent to around 40 bilion cubic metres (bcm) of gas not burned in power plants, or a full 1% of global gas demand. Demand for gas has also been dampened by government policies to enhance electricity efficiency and other energy-efficient demand-side technologies. While these factors have also displaced coal power, especially in China, a significant share of avoided electricity consumption would have been met by gas-fired plants.
Outside North America, coal markets are less affected by competition from gas. But the declining energy intensity of the Chinese economy combined with large low-carbon investments has created a global coal demand shock, given China’s importance in global coal demand. With coal-fired power plant investment in China accelerating in 2015, weak electricity demand has translated into a sharp drop in load factors for thermal power generation. The current investment trend in China’s power sector is inconsistent with market fundamentals and China is now implementing policies to avoid further overinvestment. Other developments point to a bearish outlook for coal markets. These include the decommissioning of coal-fired generation in the United States and Europe and the recent boom in coal mining investment in China, Indonesia and Australia. As a result, a rebalancing of coal markets would require painful supply adjustments and several years of low investment in mining facilities.
Energy security and access
A cyclical downturn of upstream oil and gas investment does not in itself pose an energy security risk. But the scale and speed of cuts in the sector is unprecedented and there are signs that costs could rebound in the future while investment might be constrained. The loss of human capital and cannibalisation of existing equipment, together with the fact that upstream cost declines were partly driven by underutilisation of service sector capabilities, suggest that recent cost reductions could be partly reversed (see Chapter 3). The prospects for companies making new final investment decisions (FID) in inter-regional infrastructure

Chapter 5. Implications of current investment trends 161
that has long lead times, such as LNG and major pipelines, have been especially hard hit. The longer this situation persists, the more difficult it will be to ramp up investment again in response to a tightening of the market or a supply disruption.
Upstream investment is increasingly concentrated in regions exposed to geopolitical and security risks. In the absence of a strong policy-driven upswing in investment in energy efficiency and low-carbon supply, there is no doubt that a big increase in upstream investment would be needed to maintain supply security, first for oil, somewhat later for gas. Excess supply of coal could persist for longer, but coal mining is equal to only 6% of upstream investment in financial terms, so the total investment in energy supply can easily increase despite persistent coal market weakness.
Electricity investment trends and their implications vary greatly by region. From an energy security standpoint, the most significant potential effects are in Europe, where investments in conventional power generation capacity have almost come to a complete standstill. Just over 5 GW of flexible gas generation capacity is under construction in the European Union, but even with improvements in electricity storage and demand response, the region needs to replace as much as 70 GW of coal-fired capacity and near 30 GW of nuclear capacity that is due to be decommissioned over the next decade (IEA, 2015) (see Chapter 4). There are growing concerns about the ability of the European electricity market as it is currently structured to deliver the necessary investments in a timely fashion. Initiatives at both the national and EU levels are seeking to complement energy-only markets with capacity-remuneration mechanisms to ensure a sufficient degree of adequacy.
Electricity network investment worldwide grew steadily in 2015, but the current mismatch between electricity tariff design and the cost structure of the electricity network in many countries hinders momentum, particularly in systems with large amounts of decentralised generation and a need to integrate high levels of variable renewables (see Chapter 4). Underinvestment in networks in emerging economies has hindered the expansion of energy access. In particular, persistent licencing difficulties remain a major barrier to grid development. In Africa, growing investment in renewables, including off-grid systems, and conventional generation, underpinned by new sources of financing, has helped expand access and improve the quality of supply in many countries. But, overall, investment in expanding electrification has remained inadequate to achieve universal access in the near future. While sub-Saharan Africa accounts for nearly 15% of the global population, the region represents just over 1% of investment in electricity networks.
The transition to low-carbon electricity Investment in low-carbon electricity is crucial to achieving the goal of the 2015 Paris Climate Agreement to reduce emissions fast enough in order to limit the global increase in temperature to well below 2°C. Electricity generation is the largest single emitter of greenhouse gases and its evolution will determine whether that goal will be achieved, as well as affecting energy access and economic development in emerging countries. A low-

162 Chapter 5. Implications of current investment trends
carbon electricity transition could enable the decarbonisation of transport – with electric vehicles – and buildings with electrified heating applications such as heat pumps. The annual IEA Tracking Clean Energy Progress report (IEA, 2016c) concluded that the deployment of the majority of low-carbon technologies will need to significantly accelerate to put the global energy system on track to achieve a low-carbon transition consistent with the overall climate goal. The analysis was based on a comparison with the IEA Energy Technology Perspectives 2°C Scenario (2DS) (IEA, 2016d).
The good news is that the level of investment in low-carbon electricity generation that came online in 2015 was broadly consistent with the annual requirements of the 2DS in the period to 2020 (Figure 5.1). Technological progress – for example, from higher hub heights and larger and more advanced turbines – are helping to increase load factors for onshore wind, while deployment in sunnier locations is improving the energy output of solar PV (see Chapter 4). In fact, the level of generation expected from the new low-carbon capacity – renewables and nuclear power – brought online in 2015 was more than sufficient to cover global demand growth in 2015, a result that is not sensitive to nuclear retirements in 2015.
Nonetheless, deployment of all types of low-carbon electricity generation will need to increase significantly to stay in line with global climate targets in the 2020s. This is especially the case for nuclear power, which requires long lead times and for which construction activity is not currently at a level that would permit capacity to expand as quickly as that required after 2020 in the 2DS.
Figure 5.1 • World low-carbon electricity generation (annualised) from investment
Note: Historical annualised power generation is estimated based on output from invested capacity using 2015 capacity factor assumptions.
0
50
100
150
200
250
Nuclear Hydro Wind Solar PV Solarthermal
CCS
TWh
Annualisedadditions 2010-15
2015
2DS annualisedadditions 2015-20
2DS annualisedadditions 2020-25
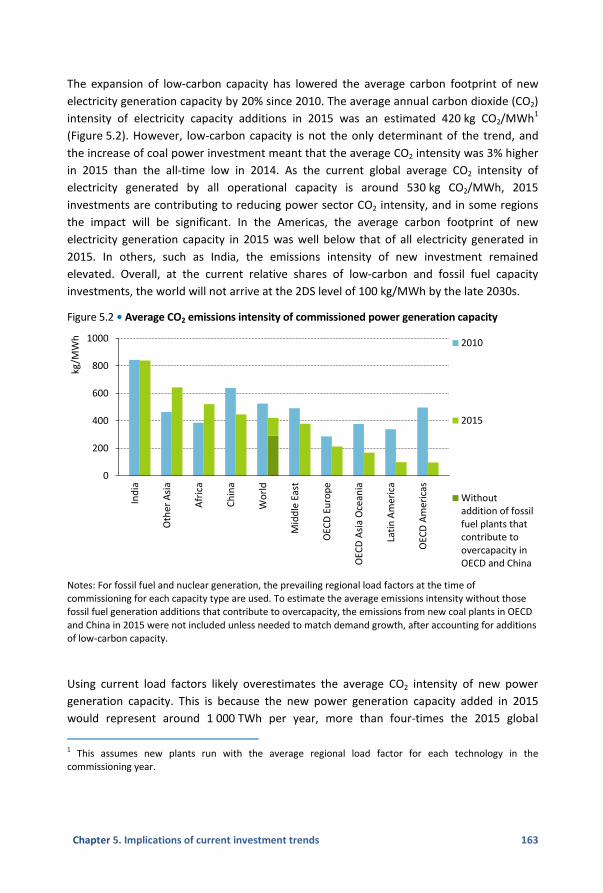
Chapter 5. Implications of current investment trends 163
The expansion of low-carbon capacity has lowered the average carbon footprint of new electricity generation capacity by 20% since 2010. The average annual carbon dioxide (CO2) intensity of electricity capacity additions in 2015 was an estimated 420 kg CO2/MWh1 (Figure 5.2). However, low-carbon capacity is not the only determinant of the trend, and the increase of coal power investment meant that the average CO2 intensity was 3% higher in 2015 than the all-time low in 2014. As the current global average CO2 intensity of electricity generated by all operational capacity is around 530 kg CO2/MWh, 2015 investments are contributing to reducing power sector CO2 intensity, and in some regions the impact will be significant. In the Americas, the average carbon footprint of new electricity generation capacity in 2015 was well below that of all electricity generated in 2015. In others, such as India, the emissions intensity of new investment remained elevated. Overall, at the current relative shares of low-carbon and fossil fuel capacity investments, the world will not arrive at the 2DS level of 100 kg/MWh by the late 2030s.
Figure 5.2 • Average CO2 emissions intensity of commissioned power generation capacity
Notes: For fossil fuel and nuclear generation, the prevailing regional load factors at the time of commissioning for each capacity type are used. To estimate the average emissions intensity without those fossil fuel generation additions that contribute to overcapacity, the emissions from new coal plants in OECD and China in 2015 were not included unless needed to match demand growth, after accounting for additions of low-carbon capacity.
Using current load factors likely overestimates the average CO2 intensity of new power generation capacity. This is because the new power generation capacity added in 2015 would represent around 1 000 TWh per year, more than four-times the 2015 global
1 This assumes new plants run with the average regional load factor for each technology in the commissioning year.
0
200
400
600
800
1000
Indi
a
Oth
er A
sia
Afr
ica
Chin
a
Wor
ld
Mid
dle
East
OEC
D E
urop
e
OEC
D A
sia
Oce
ania
Latin
Am
eric
a
OEC
D A
mer
icas
kg/M
Wh 2010
2015
Withoutaddition of fossilfuel plants thatcontribute toovercapacity inOECD and China

164 Chapter 5. Implications of current investment trends
demand growth, if it operated at current load factors, and so much of it will displace existing capacity. This will either lead to decommissioning of older plants or a reduction of average load factors. In a few cases the result can be an increase of average CO2 intensity, for example if new coal plants replace old oil-fired generation. But, in general, the impact is a reduction of average CO2 intensity because low-carbon capacity tends to have low marginal costs and will drive out higher marginal cost fossil fuel-fired generation. Figure 5.2 indicates the global average CO2 intensity that would have resulted if 2015 fossil fuel generation additions contributing to overcapacity had been excluded in China and the OECD.
Reducing CO2 intensity by displacing higher-carbon generation comes at the price of potential value destruction as the unneeded higher-carbon assets, that have not yet been fully depreciated, become stranded. However, as the average intensity of power generation in the world needs to decline rapidly over the next two decades to be in line with the 2DS, some displacement of higher-carbon generation by investments in renewables, nuclear and possibly CCS-equipped capacity will be essential. Moreover, displacement of operational coal and gas generation by new coal and gas capacity would exacerbate the stranded asset problem. A particular concern is that inefficient subcritical coal plants are still being added and could lock in emissions for decades.
In order to achieve a low-carbon transition consistent with 2DS, the current rate of investment in energy efficiency, renewables and other low-carbon technologies needs to be maintained up to 2020 then increased rapidly in the following decade. But achieving this requires overcoming several hurdles. First, while any improvements in costs or load factors would reduce the amount of investment needed for wind and solar, continued technological progress and deep reforms of electricity regulation and system operation would be necessary to effectively integrate these technologies into the power system as their penetration of the overall generating mix reaches high levels. Second, while nuclear investments reached their highest level in over two decades in 2015, they are concentrated in China. In OECD countries, planned investments are insufficient to maintain production levels from this source given foreseen retirements. Low wholesale electricity prices, depressed or non-existent carbon prices and persistent project management problems are deterring investment in both new reactors and lifetime extensions. Third, while seven CCS projects are under construction, the outlook for CCS has been clouded by the diminished appeal of enhanced oil recovery (on which five of these projects depend for their revenue) due to low oil prices. This is exacerbated by continued uncertainty about how quickly CO2 capture costs can be reduced.
To date, most investment decisions for CCS projects have been closely tied to the prospects of the oil and gas sector and this relationship looks set to continue (Box 5.1). For both nuclear power and CCS, the major ramp up of investment envisaged by 2DS is unlikely to be delivered under current carbon-pricing policies and electricity market frameworks.

Chapter 5. Implications of current investment trends 165
Box 5.1 • Just one new CCS project is commissioned in 2015
CCS projects are currently being realised at a rate of one per year, with almost all of them based on enhanced oil recovery. Only one new CCS project came online in 2015, at the Scotford oil sands upgrader in Canada. The carbon footprint of hydrogen production at the facility has been reduced by around 1 million tonnes of CO2 per year (Shell, 2015). Capital costs are estimated at over USD 750 million, with the CO2 capture equipment accounting for more than twice as much of the cost as CO2 transport and storage. The Alberta government is meeting around 60% of anticipated total CCS costs for ten years of operation, while the Canadian federal government funds around 10%. Other costs are to be covered by revenues from Alberta’s carbon pricing system and members of the project consortium.
This CCS project comes on the heels of the Boundary Dam facility, also in Canada, which began operating with CCS in 2014. Mississippi Power’s Kemper County will be the second major CCS project at a power plant when it begins operation later in 2016. Both of these projects capture the CO2 emissions from coal-fired power plants and sell it to oil drillers for use in enhanced oil recovery. Meanwhile, the Gorgon LNG facility in Australia, which is expected to be completed in 2017, will capture over 3 million tonnes of CO2 per year from the gas processed at the plant. The CCS component increased the investment costs of Gorgon by around 4% and will reduce emissions by two-fifths, but current LNG prices are significantly below the estimated cost recovery for the full LNG project.
Outside the oil and gas industry, the USD 200 million Decatur project at a bioethanol mill in Illinois is due to start full-scale operation in late 2016 with financial assistance from a federal grant and tax credits.
Meeting energy security, sustainable development and climate goals Despite strong activity in some sectors, overall energy investment activity in 2015 fell short of the level needed to meet the energy security and climate goals described above. A rise in investment may be on the horizon, possibly involving a combination of a cyclical upswing in fossil fuel supply investment and a policy-led jump in spending on efficiency and low-carbon sources. With oil markets expected to tighten in the medium term, any renewed investment would need to go towards oil and gas projects whose lifetimes and contribution to the energy system are consistent with decarbonisation objectives.
Promotion of investment in energy infrastructure and clean energy technology are also envisaged under the United Nations (UN) Sustainable Development Goal (SDG) 7 on universal access to energy, adopted in 2015. The data presented in this report show the level of investment in electricity networks to be around USD 265 billion and investment in efficiency and renewables to be USD 555 billion in 2015, a total of USD 720 billion. Tracking the evolution of investments in the coming years, and how these investments affect renewable power generation and fossil fuel displacement, will help monitor progress

166 Chapter 5. Implications of current investment trends
towards the SDG 7 objective of access to affordable, reliable, sustainable and clean energy for all by 2030. At present, the level of investment in developing regions is not on track to meet this goal.
The continued high level of investment in renewables is an encouraging sign that the energy system is moving in the right direction. In fact, the low-carbon power capacity that came online in 2015 was more than sufficient to cover the entire increase in electricity demand worldwide (see Chapter 4). But this success is fragile and several key technologies, including CCS, low-carbon freight transport and energy efficiency, do not appear to have the momentum under current policies to follow the rapid increase that is projected to be necessary to meet the long-term goal of limiting global temperature increase to 2oC. The surge in low-carbon investment should be seen as a springboard for a faster transition to a secure and sustainable energy system. This will require strong market signals, framed by government policies, as well as greater efforts to track, benchmark and analyse investment trends.
Do the coming years represent a fork in the road for energy investment? If so, it remains unclear whether the direction of travel will be towards a cyclical upswing in fossil fuel investment, or a structural reorientation towards lower-carbon energy and lower demand consistent with a more profound energy system transition. The policy and technology choices that will shape the outlook for global energy markets will be further analysed in the forthcoming World Energy Outlook 2016.
References
IEA (2016a), Medium-Term Oil Market Report 2016, OECD/IEA, Paris.
IEA (2016b), Medium-Term Gas Market Report 2016, OECD/IEA, Paris.
IEA (2016c), Tracking Clean Energy Progress 2016, OECD/IEA, Paris.
IEA (2016d), Energy Technology Perspectives, OECD/IEA, Paris.
IEA (2015), World Energy Outlook 2015, OECD/IEA, Paris.
Shell (2015), Oil Sands Performance Report 2015, Shell Canada, Calgary.

Lists of figures and tables 167
Lists of figures and tables
List of figures Figure 1.1 • Global energy investment in 2015 .................................................................... 22 Figure 1.2 • Global investment in energy supply over time .................................................. 23 Figure 1.3 • Cost developments across the energy spectrum .............................................. 24 Figure 1.4 • Key energy fuel and electricity price benchmarks (January 2010-June 2016) .. 27 Figure 1.5 • GDP projections by region, 2012-16 .................................................................. 30 Figure 1.6 • Household spending on energy before and after the oil price decline ............. 31 Figure 1.7 • Decline in oil and gas export revenues in 2015 as a percentage of 2014 GDP for
six major exporting countries .................................................................. 32 Figure 2.1 • World industrial energy demand and production capacity in selected
industries ................................................................................................. 40 Figure 2.2 • Growth in industrial energy demand by country/region................................... 40 Figure 2.3 • Steel consumption ............................................................................................. 41 Figure 2.4 • Energy efficiency investment by sector, 2015 ................................................... 45 Figure 2.5 • US gasoline prices and consumption by season ................................................ 48 Figure 2.6 • Average fuel economy of new light-duty vehicles in selected countries .......... 49 Figure 2.7 • Sales of new light-duty vehicles by efficiency classes in selected countries ..... 50 Figure 2.8 • Gasoline consumption, power and sales price for variants of five car models
with electric drive versions ...................................................................... 52 Figure 2.9 • Electric car sales and market share in selected countries/regions.................... 53 Figure 2.10 • Sales price of the top five best-selling BEVs in the United States ................... 55 Figure 2.11 • Average fuel economy of new airplanes worldwide ....................................... 57 Figure 2.12 • Household energy services price index for lighting ......................................... 58 Figure 2.13 • Lighting efficiency and cost, and electricity prices in selected countries ........ 59 Figure 2.14 • Water heating efficiency and cost, and energy prices in selected countries .. 60 Figure 2.15 • Passenger car travel energy services price index ............................................ 61 Figure 2.16 • Passenger car fuel efficiency and cost, and fuel prices in selected countries . 62 Figure 3.1 • Global investment in fossil fuel supply by sector .............................................. 66 Figure 3.2 • World upstream oil and gas investment by fuel ............................................... 70 Figure 3.3 • World upstream oil and gas investment ........................................................... 71 Figure 3.4 • World investment in oil and gas exploration .................................................... 72 Figure 3.5 • Oil and gas upstream investment cuts by selected listed companies in 2016
compared with 2014 ............................................................................... 73 Figure 3.6 • Upstream oil and gas investment by region ...................................................... 76 Figure 3.7 • World rig counts by type and region (January 2014-July 2016) ........................ 77 Figure 3.8 • IEA Upstream Investment Cost Index (UICI) ...................................................... 79

168 Chapter Lists of figures and tables
Figure 3.9 • Exchange rate of selected currencies against the US dollar .............................. 80 Figure 3.10 • Change in global average upstream costs compared with 2014
by component ......................................................................................... 81 Figure 3.11 • World offshore rigs utilisation rates ................................................................ 82 Figure 3.12 • IEA US Shale Investment Cost Index (USICI) .................................................... 83 Figure 3.13 • Impact of cost deflation and reduced activity on global upstream
investment ............................................................................................... 84 Figure 3.14 • Investment in oil refining by region ................................................................ 89 Figure 3.15 • World upstream oil and gas investment by company type ............................. 91 Figure 3.16 • Sources of finance for world upstream oil and gas investment by type of
company .................................................................................................. 92 Figure 3.17 • Net debt/equity ratio of upstream oil and gas companies by company type . 93 Figure 3.18 • Midstream and downstream companies: Indicative financing sources for
capex and dividends, net debt/equity ratio ............................................ 95 Figure 3.19 • World LNG liquefaction investment ................................................................ 96 Figure 3.20 • LNG liquefaction plant investment costs by FID date ..................................... 98 Figure 3.21 • World LNG regasification terminal capacity .................................................... 99 Figure 3.22 • Coal investment in selected regions and thermal coal price ......................... 100 Figure 3.23 • Coal investment in China ............................................................................... 101 Figure 4.1 • Global investment in power generation, electricity networks and demand
growth ................................................................................................... 106 Map 4.1 • Investment in the electricity generation and networks by region and type, 2015
(USD [2015] billion) ............................................................................... 109 Figure 4.2 • Global power generation investment by type of sectoral organisation .......... 111 Figure 4.3 • Global power generation investment by main business model ...................... 112 Figure 4.4 • Ownership of global power generation capacity commissioned in 2015 ........ 115 Figure 4.5 • Financial indicators for listed European power companies............................. 116 Figure 4.6 • Financial indicators for listed US power companies ........................................ 117 Figure 4.7 • Financial indicators for listed power companies in selected Asian countries . 118 Figure 4.8 • Source of finance for new utility-scale renewables-based power projects ..... 119 Figure 4.9 • Green bond market size and solar PV securitisation metrics .......................... 120 Figure 4.10 • Development bank financing of renewables and energy efficiency .............. 122 Figure 4.11 • Global renewables-based power generation investment, annualised
generation from investment and gross capacity additions ................... 123 Figure 4.12 • Global average investment cost for wind and solar PV ................................. 124 Figure 4.13 • Average parameters of new wind turbines in the United States .................. 125 Figure 4.14 •Wind and solar PV average investment costs and PPA prices in the United
States ..................................................................................................... 126 Figure 4.15 • Renewables investment by country/region .................................................. 127 Figure 4.16 • Investment in renewables-based power by technology in selected
countries/regions .................................................................................. 128 Figure 4.17 • Cost of capital estimates for onshore wind in Europe by country, 2015 ...... 130

Lists of figures and tables 169
Figure 4.18 • Renewables capacity contracted by non-energy corporations in North America ................................................................................................. 131
Figure 4.19 • World renewables asset financing by type and power generation fuel cost 133 Figure 4.20 • Global fossil fuel power investment .............................................................. 134 Figure 4.21 • World coal- and gas-fired power generation ................................................ 135 Figure 4.22 • Selected fuel prices indicators for power generation ................................... 136 Figure 4.23 • Capital cost recovery for a new gas-fired power plant in the PJM market ... 137 Figure 4.24 • Capital cost recovery for a new gas-fired power plant in Germany and the
United Kingdom ..................................................................................... 137 Figure 4.25 • Investment in fossil fuel power generation by country/region, 2015 ........... 138 Figure 4.26 • China’s power generation growth vs demand growth .................................. 140 Figure 4.27 • European Union electricity utility asset impairments and investment ......... 145 Figure 4.28 • US gas- and coal-fired power generation capacity additions and
retirements ............................................................................................ 146 Figure 4.29 • World investment in new nuclear power plants ........................................... 147 Figure 4.30 • Global nuclear power plant construction starts ............................................ 147 Figure 4.31 • World investment in electricity T&D ............................................................. 148 Figure 4.32 • World investment in electricity transmission and distribution by region and
driver, 2015 ........................................................................................... 149 Figure 4.33 • Global electricity storage investment, 2015 (USD 2015 million) ................... 153 Figure 5.1 • World low-carbon electricity generation (annualised) from investment ........ 162 Figure 5.2 • Average CO2 emissions intensity of commissioned power generation
capacity.................................................................................................. 163
List of tables Table 1.1 • Investment in fossil fuel and electricity supply by region................................... 25 Table 1.2 • Sources of finance for energy investments ........................................................ 35 Table 3.1 • Fossil fuel supply investment by key region and sector, 2015 ........................... 67 Table 4.1 • Electricity sector investment by region and technology .................................. 108 Table 4.2 • Top five disclosed renewable asset financings in 2015 .................................... 133 Table 4.3 • Selected UHV transmission lines in China ........................................................ 152


Abbreviations and acronyms 171
Abbreviations and acronyms
2DS 2°C Scenario ASEAN Association of Southeast Asian Nations BEV battery-electric vehicle CAFE corporate average fuel economy Capex capital expenditure CAPP Canadian Association of Petroleum Producers CCS carbon capture and storage CfD contract-for-difference CO2 carbon dioxide CREZ competitive renewable energy zones DC direct current DUC drilling uncompleted E&P exploration and production ECA export credit agencies EPA Environment Protection Agency ESCO energy service company F&D finding and development FID final investment decision FIT feed-in tariff FSRU floating storage regasification unit GDP gross domestic product GIB green investment bank HV high voltage HVDC high voltage direct current ICE internal combustion engine IEA International Energy Agency INDC intended nationally determined contribution IOC international oil company IPAA Independent Petroleum Association of America IPP independent power producer IRENA International Renewable Energy Agency IRR internal rate of return LDV light-duty vehicle LED light-emitting diode LNG liquefied natural gas NDRC National Development and Reform Commission (China) NOC national oil company OECD Organisation for Economic Co-operation and Development OFTO offshore transmission owner PACE property-assessed clean energy PCI project of common interest PHEV plug-in hybrid-electric vehicle

172 Abbreviations and acronyms
PPA power purchase agreement PPP public private partnership PV photovoltaic SDG sustainable development goal SOE state-owned enterprise SUV sports utility vehicle T&D transmission and distribution TTF title transfer facility TYNDP Ten-Year Network Development Plan UHV ultra-high voltage UICI Upstream Investment Cost Index UMPP ultra-mega power project UN United Nations USICI Upstream Shale Investment Cost Index VIU vertically integrated utility VRE variable renewable energy VW Volkswagen WHEEL Warehouse for Energy Efficiency Loans WLTP worldwide harmonised light vehicles test procedure ZEC zero-emission credits
Units of measurement Emissions kgCO2/MWh kilogramme of carbon dioxide per megawatt-hour Energy boe barrel of oil equivalent MBtu million British thermal units EJ exajoules Wh watt-hour MWh megawatt-hour GWh gigawatt-hour TWh terawatt-hour Mass g gramme kg kilogramme t tonne Mt million tonnes Gt billion tonnes Monetary USD million 1 US dollar x 106 USD billion 1 US dollar x 109 USD trillion 1 US dollar x 1012 Temperature °C degree Celsius Gas bcm billion cubic metres

Abbreviations and acronyms 173
Oil b/d barrels per day kb/d thousand barrels per day mb/d million barrels per day Mboe/d million barrels of oil equivalent per day Power kW kilowatt (1 watt x 103) MW megawatt (1 watt x 106) GW gigawatt (1 watt x 109) TW kilowatt (1 watt x 1012) Transport km kilometre Lge litre gasoline-equivalent pkm passenger kilometre

Secure Sustainable Together
Onl
in
e bookshopPDF versions at 20%
discountw
ww
.iea
.org/books
Inte
rnat
iona
l Energy Agency
Secure Sustain
able T
oget
her
World Energy Outlook series
Energy Statistics
series
Energy Policiesof IEA
Countriesseries
Energy Technology
Perspectives series
E-mail: books@
iea.org
Medium-Term Market
Reports series
Oil
Coal
Gas
RenewableEnergy
EnergyPolicies
Beyond IEA Countries
series
EnergyEfficiency
Market Report
© O
EC
D/IE
A, 2
016

This publication reflects the views of the International Energy Agency (IEA) Secretariat but does not necessarily reflect those of individual IEA member countries. The IEA
makes no representation or warranty, express or implied, in respect to the publication’s contents (including its completeness or accuracy) and shall not be
responsible for any use of, or reliance on, the publication.
This document and any map included herein are without prejudice to the status of or sovereignty over any territory, to the delimitation of international frontiers and
boundaries and to the name of any territory, city or area.
IEA Publications, 9, rue de la Fédération, 75739 Paris cedex 15
Layout in France by IEA, September 2016 61 2016 20 1E1
ISBN: 978-92-64-26283-6Cover design: IEA. Photo credits: © Graphic Obsession
IEA/OECD possible corrigenda on: www.oecd.org/about/publishing/corrigenda.htm

80€61 2016 20 1E1
ISBN: 978-92-64-26283-6 9HSTCQE*cgcidg+
World EnergyInvestment
2016
In this inaugural annual report on energy investments around the world, the International Energy Agency (IEA) looks at the lifeblood of the global energy system: investment. The ability to attract and direct capital flows is vital to transitioning to a low-carbon economy while also maintaining energy security and expanding energy access worldwide. The success or failure of energy policies can be measured by their ability to mobilise investments.
This new report measures in a detailed manner the state of investment in the energy system across technologies, sectors and regions. The analysis takes a comprehensive look at the critical issues confronting investors, policy makers and consumers over the past year.
World Energy Investment 2016 addresses key questions, including:
�� What was the level of investment in the global energy system in2015? Which countries attracted the most capital?
�� What fuels and technologies received the most investment, andwhich saw the biggest changes?
�� How is the low fuel price environment affecting spending inupstream oil and gas, renewables and energy efficiency? Whatdoes this mean for energy security?
�� Are current investment trends consistent with the transition to alow-carbon energy system?
�� How are technological progress, new business models and keypolicy drivers such as the Paris Climate Agreement reshapinginvestment?
As a unique benchmark of current investment trends, World Energy Investment 2016 serves as a complement to the forecasts and projections found in other IEA publications and provides a critical foundation for decision making by governments and industry.