Embed Size (px)
Citation preview

Worldwide Wireless Data Trends Worldwide Wireless Data Trends Mid Year UpdateMid Year Update

© Chetan Sharma Consulting, All Rights Reserved Aug 2006
2http://www.chetansharma.com
Worldwide Wireless Data Trends – Worldwide Wireless Data Trends – Mid Year UpdateMid Year Update
• Wireless industry crossed several milestones this past 6 months - 2 billion GSM subscribers and is on its way to the quickest billion subscribers within the next 2 years. 100M 3G subscribers with 66% coming from WCDMA (40% of these from Japan) and rest from EV-DO.
• Japan led the way with approximately $10B in wireless data service revenues for the first half of 2006. US and China followed with approximately $7B and $5.5B respectively.
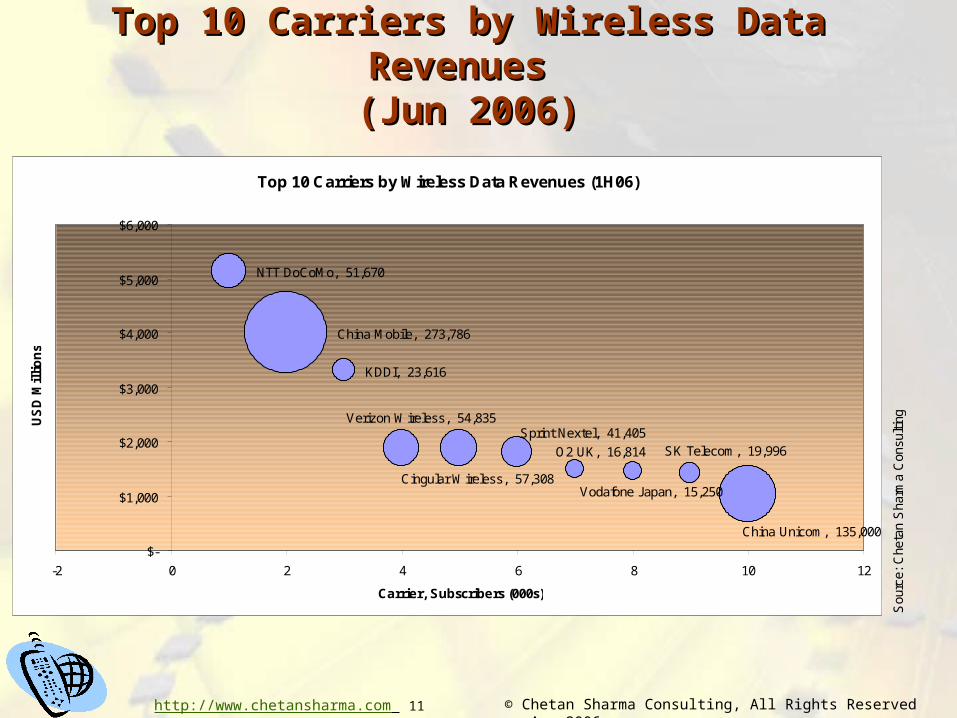
• The #1 carrier worldwide in terms of total wireless data revenues for the first six months of 2006 is NTT DoCoMo with over $5.1B in data revenues. It was followed by China Mobile ($3.9B), KDDI ($3.3B), Verizon Wireless ($1.9B), and Cingular Wireless ($1.9B). Sprint Nextel, O2 UK, Vodafone Japan, SK Telecom, and China Unicom filled the rest of the top 10 slots respectively.
• China crossed the 400M subscriber mark and is on its way to cross the half billion subscriber mark in 2007. As first discussed in our “India’s Wireless Market” report, India is rivaling China’s monthly net adds of 5M/month and crossed the 100M subscriber mark making it the fourth largest subscriber base after China, US, and Russia. India will cross Russia later this year and the US by 2008 to become the second largest wireless market.
• Western Europe officially crossed the 100% wireless subscriber penetration mark (due to multiple SIMs) with several nations reporting up to 115-120% subscriber penetration. In spite of crossing 70% penetration mark, US wireless market shows no sign of slowing down and is strongly progressing towards another record year with over 25M net adds in 2006.
• In terms of total subscribers, China Mobile with 274M subscribers is way ahead of the second ranked Vodafone, which has 187M subscribers. China Unicom, América Móvil, Telefonica, SingTel, Deutsche Telekom (T-Mobile), and Orange (France Telecom) are the next six largest telecom groups in the world. In terms of individual carriers, Cingular and Verizon now occupy the #3 and #4 spot respectively ahead of NTT DoCoMo, which is at #5. The two Chinese carriers round up the top two positions and are likely to stay perched at their lookout vistas for some years to come. Telecom groups in mature markets are under enormous pressure to either come up with a global expansion strategy or accelerate their existing plans. Carriers in Japan and Korea are the most under duress.
• Japan became the first nation to have more than 50% of its subscribers using 3G. Korea is close second. 3G is starting to pick-up steam in both western Europe and North America as discussed in our cover story article “3G: Hitting the Mass Market” published in Moconews.net and Wireless World Magazine. Since then, we have presented our research at IEEE, CINA, EMC, Carriers in US; in Japan, Korea, and Russia; and later this year in India.
• China and India represent the biggest opportunities for Infrastructure providers. China has postponed its 3G decision for the umpteenth time and is having technical and political problems to get something in place before the 2008 Olympics. India is going through its 3G spectrum policy but unlike China is likely to resolve the issues in short order. Ericsson just scored a $1B contract with Bharti. BSNL’s tender is worth 2-3 times more.

© Chetan Sharma Consulting, All Rights Reserved Aug 2006
3http://www.chetansharma.com
Worldwide Wireless Data Trends – Worldwide Wireless Data Trends – Mid Year UpdateMid Year Update
• In terms of data ARPU, Japan continues to lead the pack with 28% of its revenues coming from data services amounting to almost $17 data ARPU. Ireland, Norway, Switzerland, UK and South Korea also registered significant data ARPU. US crossed the ($5, 10%) block, where $5 is the data ARPU and 10% represents the % share of overall ARPU. As of June 2006, US stood at ($6.3, 12%). (For more details, please refer to the 9-box diagram in the ppt or the 2006 paper – “Worldwide Wireless Data Trends”; for 2005 comparative numbers, please refer to our paper from last year titled “Perspectives: Wireless Data ARPU”)
• NTT DoCoMo’s position at the top of the wireless data world has been challenged recently by several carriers esp. by its archrival KDDI which surged past DoCoMo for two straight quarters. Their data coordinates respectively stand at ($17.3, 28.9%) and ($16.5, 28%). However, it is 3 UK that is inching towards ($20, 30%) mark with $19.3 data ARPU contributing over 25% to its overall ARPU. 3 Italy with ($15.6, 34%) is also amongst the leaders.
• The biggest % contribution by data ARPU has been consistently registered (since mid 2002) by the two Philippines carriers – Smart Communications and Globe Telecom with almost 50% (or $3) contribution coming from data services.
• Even though China reported approximately $5.5B in data revenues, and the % contribution is over 20%, data ARPU is around $2, confirming what we already know – it’s a volume game. For India data ARPU is just over $1.2. Approximately same for Brazil and Russia. Actually, in 2005 the overall wireless service revenues in US were two times the overall revenues of the four BRIC (Brazil, Russia, India, and China) countries combined. So, lessons are pretty clear as to which markets to approach for what products and services.
• We will have to look at the EOY 2006 numbers but there are some indications of cooling down of data ARPU growth in mature markets of Japan, Korea, and UK. So, while % contribution will increase due to declining voice revenues, data ARPU will not make up for the loss. Most of the mature markets face the same dilemma. In fact, comparing EOY 2005 to 2004 numbers, only a handful nations registered positive increase in overall ARPU with Canada ($3), Korea ($3), Mexico ($1), Taiwan ($1), Brazil ($1), and Chile ($1) showing an increase. For majority of the other nations, the ARPU declined, for example by $2 for US, Thailand, India, Australia, and Argentina. Nigeria recorded a massive $23 decline.
• All the carriers in the top 10 wireless carriers by wireless data revenues list exceeded $1B in data revenues for the first six months of 2006. China Mobile and China Unicom benefited from their huge subscriber base of 274M and 135M respectively while DoCoMo and KDDI did well because they are generating over $17 (or 28%) in wireless data ARPU.

© Chetan Sharma Consulting, All Rights Reserved Aug 2006
4http://www.chetansharma.com
Worldwide Wireless Data Trends – Worldwide Wireless Data Trends – Mid Year UpdateMid Year Update
• Carriers with nationwide 3G networks and good distribution of handsets are seeing up tick in data ARPU. The Japanese and Korean carriers along with operator 3, Verizon, Sprint Nextel are all seeing benefits of rolling out their 3G service. Deployment of 3.5G technologies such as HSDPA and EV-DO Rev A (and B) are also gaining momentum. Networks are getting deployed and market is being seeded with some of the early handsets.
• In terms of applications, messaging accounts for lion-share of data revenues. However, other services such as Mobile Music, Mobile TV and video streaming, Mobile Games, IMS, LBS, Mobile advertising, and others have captured industry’s imagination. Though not much talked about, enterprise applications are also being adopted widely esp. in North America as more workers become mobile and corporations seek efficiencies in their operations and supply-chain.
• In Japan and Korea, consumer messaging revenue only accounts for 30% of the data revenues, rest is from multimedia applications, browser traffic, and other infotainment applications. It is almost the reverse in Europe with 70-80% (on average) of the data revenue is coming from messaging. There are some exceptions like Vodafone Spain, Telefonica Moviles Espana, and Eurotel, who have over 40% of their data revenues coming from non-messaging applications. For North America, the data revenue from non-messaging applications (excluding transport) is around 20%.
• China Mobile is challenging Vodafone’s supremacy as most valued telecom operator. For a brief period in August, it was valued higher than Vodafone and is likely to overtake the crown as China continues to add significant number of subscribers while Vodafone struggles.
• WiMax is gaining some traction both in the developed and developing world. However, the case for mobile WiMax is still quite questionable. By the time the embedded devices come to fruition, 3G devices will be quite pervasive and the WiMax services will not be able to compete on price alone. And, a sub $30 WiMax handset for the developing world is nothing short of a pipe dream at this point. WiMax for backhaul makes sense, and some niche scenarios for fixed wireless services will also be successful, but clearly, we will not be witnessing replacement of cellular anytime soon. Free Wi-Fi movement scored more deployments around the world though the business model to support them long-term stays unproven.

© Chetan Sharma Consulting, All Rights Reserved Aug 2006
5http://www.chetansharma.com
Wireless Data ARPU in different markets Wireless Data ARPU in different markets (2005)(2005)
10%
20%
30%
$5 $10 $15
Japan
South Korea
UK
China
US
Germany
Canada
Italy
SpainHongKong
Average Wireless Data ARPU (USD) for carriers in a country
Da
ta a
s a
% o
f to
tal
rev
en
ue
s (
av
era
ge
a
cro
ss
ca
rrie
rs i
n t
he
co
un
try
)
So
urc
e:
Ch
eta
n S
ha
rma
Co
nsu
ltin
g, 2
00
6
IrelandSingapore
SwitzerlandNorway
New Zealand
Belgium
Austria
FranceNetherlands
Russia GreeceDemark
Portugal
Israel
India
Sweden
Finland
Thailand
Brazil
Indonesia
Philippines (45%, $2.70)
Poland
Venezuela
Czech
Turkey
Ukraine
Mexico
Malaysia
Asia
Europe
Americas

© Chetan Sharma Consulting, All Rights Reserved Aug 2006
6http://www.chetansharma.com
Wireless Data ARPU of major carriers worldwide Wireless Data ARPU of major carriers worldwide (Jun 2006)(Jun 2006)
$10 $15 $20
10%
20%
30%
NTT DoCoMo
KDDI
Vodafone Japan
Sprint
Verizon
T-Mobile US
Cingular
Wireless Data ARPU (USD)
Da
ta a
s a
% o
f to
tal
rev
en
ue
s
SK Telecom
3 UK
So
urc
e:
Ch
eta
n S
ha
rma
Co
nsu
ltin
g, 2
00
6
Vodafone UK
KTF
Vodafone Spain
Vodafone Italy
Vodafone Germany
3 Australia
O2 UK
O2 Germany
SingTel
Rogers
China Unicom
China Mobile
RelianceBharti
Hutch
T-Mobile UKT-Mobile Germany
A
B
C
D
Asia
Europe
Americas
3 Italy
Orange France
Orange UK
Orange Spain

© Chetan Sharma Consulting, All Rights Reserved Aug 2006
7http://www.chetansharma.com
World’s biggest telecom groups World’s biggest telecom groups (Jun 2006)(Jun 2006)
World's biggest telecom groups in terms of Total Subscribers
0
50000
100000
150000
200000
250000
300000
China Mobile Vodafone China Unicom América Móvil Telefonica SingTel Deutsche Telekom Orange
Nu
mb
er o
f S
ub
s (T
ho
usa
nd
s)
Sou
rce:
Che
tan
Sha
rma
Con
sulti
ng

© Chetan Sharma Consulting, All Rights Reserved Aug 2006
8http://www.chetansharma.com
Wireless Data Revenues of Japan, US, and China Wireless Data Revenues of Japan, US, and China (1H06)(1H06)
Wireless Data Revenues: Japan vs. US vs. China (1H06)
$-
$1,000.00
$2,000.00
$3,000.00
$4,000.00
$5,000.00
$6,000.00
Q106 Q206
US
D M
illi
on
s
Japan US China Sou
rce:
Che
tan
Sha
rma
Con
sulti
ng

© Chetan Sharma Consulting, All Rights Reserved Aug 2006
9http://www.chetansharma.com
Change of Data ARPU of different nations from Change of Data ARPU of different nations from 4Q04 to 4Q054Q04 to 4Q05
Change in Data ARPU 4Q04 to 4Q05
(25)
(20)
(15)
(10)
(5)
-
5
$
Sou
rce:
Che
tan
Sha
rma
Con
sulti
ng

© Chetan Sharma Consulting, All Rights Reserved Aug 2006
10http://www.chetansharma.com
Wireless Data ARPU trends of major markets Wireless Data ARPU trends of major markets (2001-2005)(2001-2005)
Wireless Data ARPU trends of major markets 2001-2005
0.00
2.00
4.00
6.00
8.00
10.00
12.00
14.00
16.00
18.00
2001 2002 2003 2004 2005
$
Denmark Finland France Germany Ireland Japan Korea
Norway Singapore Switzerland UK US Sou
rce:
Che
tan
Sha
rma
Con
sulti
ng
© Chetan Sharma Consulting, All Rights Reserved Aug 2006
11http://www.chetansharma.com
Top 10 Carriers by Wireless Data Revenues Top 10 Carriers by Wireless Data Revenues (Jun 2006)(Jun 2006)
Top 10 Carriers by Wireless Data Revenues (1H06)
NTT DoCoMo, 51,670
China Mobile, 273,786
KDDI, 23,616
Verizon Wireless, 54,835
Cingular Wireless, 57,308
Sprint Nextel, 41,405
O2 UK, 16,814
Vodafone Japan, 15,250
SK Telecom, 19,996
China Unicom, 135,000
$-
$1,000
$2,000
$3,000
$4,000
$5,000
$6,000
-2 0 2 4 6 8 10 12
Carrier, Subscribers (000s)
US
D M
illi
on
s
Sou
rce:
Che
tan
Sha
rma
Con
sulti
ng

© Chetan Sharma Consulting, All Rights Reserved Aug 2006
12http://www.chetansharma.com
About CSCAbout CSC• Over 12 years of wireless industry
experience– Strategy, Product Planning, Intellectual
Property, R&D
• Wrote one of the first books on Wireless Internet (2000). Coauthored 2 more since then. Numerous articles and reports.
• Advisor to leading companies and startups worldwide in the wireless industry on business, product, and IP strategy.
http://www.chetansharma.com
Blog: aorta.wordpress.com
ClientsClients