Embed Size (px)
Citation preview
Worldwide prevalence of
anaemia1993–2005
WHO Global Database on Anaemia
Centers for Disease Control and PreventionAtlanta


Worldwide prevalence of anaemia
1993–2005who Global database
on anaemia
Editors
Bruno de Benoistworld health organization
Geneva, switzerland
Erin McLeanworld health organization
Geneva, switzerland
Ines EgliInstitute of food science and nutrition,
eth – Zurich, switzerland
Mary Cogswellcenters for disease control and prevention
atlanta, Georgia
© World Health Organization 2008
All rights reserved. Publications of the World Health Organization can be obtained from WHO Press, World Health Organization, 20 Avenue Appia, 1211 Geneva 27, Switzerland (tel.: +41 22 791 3264; fax: +41 22 791 4857; e-mail: [email protected]). Requests for permission to reproduce or translate WHO publications – whether for sale or for noncommercial distribution – should be addressed to WHO Press, at the above address (fax: +41 22 791 4806; e-mail: [email protected]).
The designations employed and the presentation of the material in this publication do not imply the expression of any opinion whatsoever on the part of the World Health Organization concerning the legal status of any country, territory, city or area or of its authorities, or concerning the delimitation of its frontiers or boundaries. Dotted lines on maps represent approximate border lines for which there may not yet be full agreement.
The mention of specific companies or of certain manufacturers’ products does not imply that they are endorsed or recommended by the World Health Organization in preference to others of a similar nature that are not mentioned. Errors and omissions excepted, the names of proprietary products are distinguished by initial capital letters.
All reasonable precautions have been taken by the World Health Organization to verify the information contained in this publication. However, the published material is being distributed without warranty of any kind, either expressed or implied. The responsibility for the interpretation and use of the material lies with the reader. In no event shall the World Health Organization be liable for damages arising from its use.
The named authors alone are responsible for the views expressed in this publication.
Cover photographs by Virot Pierre, Armando Waak, Carlos GaggeroDesigned by minimum graphicsPrinted in Spain
WHO Library Cataloguing-in-Publication Data
Worldwide prevalence of anaemia 1993–2005 : WHO global database on anaemia / Edited by Bruno de Benoist, Erin McLean, Ines Egli and Mary Cogswell.
1.Anemia – prevention and control. 2.Anemia – epidemiology. 3.Prevalence. I.World Health Organization.
ISBN 978 92 4 159665 7 (NLM classification: WH 155)

Contents
Preface vAcknowledgements viAbbreviations vii
1. Introduction 1 1.1 Anaemia: a public health problem 1 1.1.1 Etiology 1 1.1.2 Health consequences 1 1.1.3 Assessing anaemia 1 1.2 Control of anaemia 1 1.2.1 Correcting anaemia 1
2. Methods 3 2.1 Data sources – The WHO Global Database on Anaemia 3 2.2 Selection of survey data 3 2.2.1 Administrative level 3 2.2.2 Population groups 4 2.3 Defining anaemia 4 2.3.1 Haemoglobin threshold 4 2.3.2 Estimated anaemia prevalence for countries with no survey data 5 2.3.3 Uncertainty of estimates 5 2.3.4 Combining national estimates 5 2.3.5 Global anaemia prevalence 5 2.3.6 Classification of anaemia as a problem of public health significance 6 2.4 Population coverage, proportion of population, and the number of individuals with anaemia 6 2.4.1 Population coverage 6 2.4.2 Proportion of population and the number of individuals affected 63. Results and Discussion 7 3.1 Results 7 3.1.1. Population coverage 7 3.1.2 Proportion of population and number of individuals with anaemia 7 3.1.3 Classification of countries by degree of public health significance of anaemia 8 3.2 Discussion 8 3.2.1 Population coverage 8 3.2.2 Strengths of estimates 8 3.2.3 Limitations of estimates 8 3.2.4 Proportion of population and the number of individuals with anaemia 12 3.2.5 Classification of countries by degree of public health significance of anaemia, based on haemoglobin concentration 12 3.2.6 Comparison to previous estimates 12 3.3 Conclusion 12
References 14
iiicontents
AnnexesAnnex 1 WHO Member States grouped by WHO and UN regions 15 Table A1.1 WHO Member States grouped by WHO regions 15 Table A1.2 WHO Member States grouped by UN regions and subregions 16Annex 2 Results by UN region 18 Table A2.1 Population coverage by anaemia prevalence surveys (national or subnational) conducted between 1993 and 2005 by UN region 18 Table A2.2 Anaemia prevalence by UN region 18Annex 3 National estimates of anaemia 20 Table A3.1 Country estimates of anaemia prevalence in preschool-age children 20 Table A3.2 Country estimates of anaemia prevalence in pregnant women 25 Table A3.3 Country estimates of anaemia prevalence in non-pregnant women of reproductive age 30 Table A3.4 Country references 35
TablesTable 2.1 Haemoglobin thresholds used to define anaemia 4Table 2.2 Prediction equations used to generate anaemia estimates for countries without survey data 5Table 2.3 Classification of anaemia as a problem of public health significance 6Table 3.1 Population coverage (%) by anaemia prevalence surveys (national or subnational) conducted between 1993 and 2005 7Table 3.2 Global anaemia prevalence and number of individuals affected 7Table 3.3 Anaemia prevalence and number of individuals affected in preschool-age children, non-pregnant women and pregnant women in each WHO region 8Table 3.4 Number of countries categorized by public health significance of anaemia 8
FiguresFigure 3.1 Anaemia as a public health problem by country (a) Preschool-age children 9 (b) Pregnant women 10 (c) Non-pregnant women of reproductive age 11
worldwIde prevalence of anaemIa 1993–2005iv
Preface
Anaemia is a public health problem that affects populations in both rich and poor countries. Although the primary cause is iron deficiency, it is seldom present in isolation. More frequently it coexists with a number of other causes, such as malaria, parasitic infection, nutritional deficiencies, and haemoglobinopathies.
Given the importance of this pathology in the world, nu-merous countries conduct interventions to reduce anaemia; particularly in the groups most susceptible to its devastat-ing effects: pregnant women and young children. In order to assess the impact of these interventions, the adequacy of the strategies implemented, and the progress made in the fight against anaemia, information on anaemia preva-lence must be collected. This is the primary objective of the WHO Global Database on Anaemia. However, estimates of anaemia prevalence by themselves are only useful if they are associated with a picture of the various causal factors that contribute to the development of anaemia in specific settings. Indeed these factors are multiple and complex, and it is critical to collect accurate information about them to provide the basis for developing the best interventions for anaemia control.
In the last three decades, there have been various at-tempts to produce estimates of the prevalence of anaemia at different levels including at the global level, but until the present time, there has never been a systematic review of all of the data collected and published with the objec-tive of deriving regional and global estimates. The WHO Global Database on Anaemia has filled this gap: data from 93 countries, representing as much as 76% of the popula-tion in the case of preschool-age children, were analysed and used to develop statistical models to generate national prevalence estimates for countries with no data within the time frame specified.
It is surprising that given the public health importance of anaemia, there are numerous countries lacking national prevalence data. Moreover, most survey data are related to the three population groups: preschool-age children, pregnant women, and non-pregnant women of reproduc-tive age, which is why the report focuses on these groups.
The data available for school-age children, men, and the elderly were not sufficient to generate regional or country-level estimates for these groups, and therefore only global estimates for these groups are presented.
In addition, despite the fact that iron deficiency is con-sidered to be the primary cause of anaemia, there are few data on the prevalence of this deficiency. The likely reason is that iron assessment is difficult because the available in-dicators of iron status do not provide sufficient information alone and must be used in combination to obtain reliable information on the existence of iron deficiency. Further-more, there is no real consensus on the best combination of indicators to use. Another reason is that the role of factors other than iron deficiency in the development of anaemia has been underestimated by public health officials, because for a long time anaemia has been confused with iron defi-ciency anaemia, and this has influenced the development of strategies and programmes designed to control anaemia.
In this report, the prevalence of anaemia is presented by country and by WHO regions. Because these prevalence data may be used to identify programme needs by other United Nations agencies, we have presented the estimates classified by United Nations regions in the annexes. In ad-dition, one chapter is dedicated to the criteria used to iden-tify, revise, and select the surveys, and the methodology developed to generate national, regional, and global esti-mates.
A lesson learned from producing this report is that in order for the database to reach its full potential, data should be collected on other vulnerable population groups such as the elderly and school-age children, and surveys should be more inclusive and collect information on iron status and other causes of anaemia.
This report is written for public health officials, nutri-tionists, and researchers. We hope that readers find it useful and feel free to share any comments with us.
Bruno de Benoist Coordinator, Micronutrient UnitWorld Health Organization
vpreface

Acknowledgements
WHO wishes to thank the numerous individuals, insti-tutions, governments, non-governmental, and international organizations for providing data for the database. Without continual international collaboration in keeping the data-base up-to-date, this compilation on the global situation and trends in anaemia prevalence would not have been pos-sible. Special thanks are due to ministries of health of the WHO Member States, WHO regional offices, and WHO country offices.
worldwIde prevalence of anaemIa 1993–2005vi
The WHO Global Database on Anaemia was developed by the Micronutrient team in the Department of Nutrition for Health and Development with the financial support of the Centers for Disease Control and Prevention.
The estimates for the database were produced by Erin McLean, Mary Cogswell, Ines Egli, and Daniel Wojdyla with contributions from Trudy Wijnhoven, Laurence Grummer-Strawn, and Bradley Woodruff, under the co-ordination of Bruno de Benoist. Grace Rob and Ann-Beth Moller assisted in data management.
viiaBBrevIatIons
Abbreviations
CDC Centers for Disease Control and PreventionHb HaemoglobinHDI Human Development Index: a composite indicator of wealth, life expectancy and education developed by the United Nations Development Programme.IDA Iron deficiency anaemiaNHANES National Health and Nutrition Examination SurveyNPW Non-pregnant women (15.00–49.99 yrs)PreSAC Preschool-age children (0.00–4.99 yrs)PW Pregnant womenSD Standard deviationUN United NationsVMNIS Vitamin and mineral nutrition information system WHO World Health OrganizationCRP C-reactive protein

1
1. Introduction
1.1 Anaemia: a public health problemAnaemia is a global public health problem affecting both developing and developed countries with major conse-quences for human health as well as social and economic development. It occurs at all stages of the life cycle, but is more prevalent in pregnant women and young children. In 2002, iron deficiency anaemia (IDA) was considered to be among the most important contributing factors to the global burden of disease (1).
1.1.1 EtiologyAnaemia is the result of a wide variety of causes that can be isolated, but more often coexist. Globally, the most signifi-cant contributor to the onset of anaemia is iron deficiency so that IDA and anaemia are often used synonymously, and the prevalence of anaemia has often been used as a proxy for IDA. It is generally assumed that 50% of the cases of anaemia are due to iron deficiency (2), but the proportion may vary among population groups and in different areas according to the local conditions. The main risk factors for IDA include a low intake of iron, poor absorption of iron from diets high in phytate or phenolic compounds, and pe-riod of life when iron requirements are especially high (i.e. growth and pregnancy).
Among the other causes of anaemia, heavy blood loss as a result of menstruation, or parasite infections such as hook-worms, ascaris, and schistosomiasis can lower blood haemo-globin (Hb) concentrations. Acute and chronic infections, including malaria, cancer, tuberculosis, and HIV can also lower blood Hb concentrations. The presence of other micro-nutrient deficiencies, including vitamins A and B12, folate, riboflavin, and copper can increase the risk of anaemia. Fur-thermore, the impact of haemoglobinopathies on anaemia prevalence needs to be considered within some populations.
1.1.2 Health consequencesAnaemia is an indicator of both poor nutrition and poor health. The most dramatic health effects of anaemia, i.e., increased risk of maternal and child mortality due to severe anaemia, have been well documented (3–5). In addition,
1. IntroductIon
the negative consequences of IDA on cognitive and physi-cal development of children, and on physical performance – particularly work productivity in adults – are of major concern (2).
1.1.3 Assessing anaemiaHb concentration is the most reliable indicator of anae-mia at the population level, as opposed to clinical meas-ures which are subjective and therefore have more room for error. Measuring Hb concentration is relatively easy and inexpensive, and this measurement is frequently used as a proxy indicator of iron deficiency. However, anaemia can be caused by factors other than iron deficiency. In addition, in populations where the prevalence of inherited haemo-globinopathies is high, the mean level of Hb concentration may be lowered. This underlines that the etiology of anae-mia should be interpreted with caution if the only indicator used is Hb concentration. The main objective for assess-ing anaemia is to inform decision-makers on the type of measures to be taken to prevent and control anaemia. This implies that in addition to the measurement of Hb concen-tration, the causes of anaemia need to be identified consid-ering that they may vary according to the population.
1.2 Control of anaemia1.2.1 Correcting anaemiaGiven the multifactorial nature of this disease, correcting anaemia often requires an integrated approach. In order to effectively combat it, the contributing factors must be identified and addressed. In settings where iron deficiency is the most frequent cause, additional iron intake is usually provided through iron supplements to vulnerable groups; in particular pregnant women and young children. Food-based approaches to increase iron intake through food fortification and dietary diversification are important, sus-tainable strategies for preventing IDA in the general pop-ulation. In settings where iron deficiency is not the only cause of anaemia, approaches that combine iron interven-tions with other measures are needed.
Strategies should include addressing other causes of

worldwIde prevalence of anaemIa 1993–20052
anaemia (6,7),1.2 and should be built into the primary health care system and existing programmes. These strat-egies should be tailored to local conditions, taking into account the specific etiology and prevalence of anaemia in a given setting and population group.
1 http://www.who.int/malaria/docs/TreatmentGuidelines2006.pdf 2 http://www.who.int/wormcontrol/documents/en/Controlling%20
Helminths.pdf
3
2. Methods
2.1 Data sources – The WHO Global Database on Anaemia
The estimates presented are based on data from the WHO Global Database on Anaemia; a part of the Vitamin and Mineral Nutrition Information System (VMNIS), main-tained at WHO.
Data are collected from the scientific literature and through collaborators, including WHO regional and country offices, United Nations organizations, ministries of health, research and academic institutions, and non-governmental organizations. MEDLINE and WHO re-gional databases were searched systematically, and manual searches were conducted to find articles published in non-indexed medical and professional journals. For inclusion in the database, Hb must be measured in capillary, venous, or cord blood using quantitative photometric methods or automated cell counters. In addition, anaemia prevalence or mean Hb concentrations have to be reported. Surveys were excluded if they measured only clinical signs of anaemia or haematocrit. Data are included in the database if they are representative of any administrative level within a country, including nationally representative data and surveys repre-sentative of a region, the first administrative level bound-ary, second administrative level boundary or local surveys. As of December 31, 2005, 696 surveys were available in the database; the majority of these in women or preschool-age children.
2.2 Selection of survey dataThe time frame for the current estimates is 1993–2005 and survey data for WHO’s 1921 Member States were extracted from the database. Data on anaemia were selected for each
country using two variables: the administrative level for which the survey was representative, and the population group surveyed.
2.2.1 Administrative levelSurveys were selected based on the administrative level they represented. Surveys were classified as national when they were based on a nationally representative sample. Sub-national surveys were also available in the database and were classified according to the population that they rep-resented as regional (multiple states), state (representative of the first administrative level boundary), district (repre-sentative of the second administrative level boundary), or local surveys.
Data from the most recent national survey was used in preference to subnational surveys. For one country, where an area had been left out of a national survey because of security concerns, available data from the missing region was pooled with the national data and weighted by the gen-eral population estimate for that area to provide a national estimate for that country. This proportion was determined by using the most recent census data from the country. If two national surveys were conducted in the same year, sur-vey results were pooled into a single summary measure and weighted by the survey sample size.
In the absence of national data, surveys representative of at least the first administrative level boundary were used if two or more surveys at this level were available for the pop-ulation group and country concerned within the accept-able time frame. Results were pooled into a single summary measure, weighted by the total general population for that region or state, and based on the most recent and available census data between 1993 and 2005. Local- and district-level surveys were not used in these estimates since they have the potential for more bias.
Surveys with prevalence data based on a sample size of less than 100 subjects were excluded in most cases. This was done because with a sample size of 100 and a confi-dence level of 95%, the error around an estimate of anae-mia prevalence of 50% would be +/-10 percentage points. A smaller sample size would have an even larger error. How-
1 On 3 June 2006, the Permanent Representative of the Republic of Serbia to the United Nations and other International Organizations in Geneva informed the Acting Director-General of the WHO that “the member-ship of the state union Serbia and Montenegro in the United Nations, including all organs and the organizations of the United Nations sys-tem, is continued by the Republic of Serbia on the basis of Article 60 of the Constitutional Charter of Serbia and Montenegro, activated by the Declaration of Independence adopted by the National Assembly of Mon-tenegro on 3 June 2006”. Estimates used or referred to in this document cover a period of time preceding that communication.
2. methods

worldwide prevalence of anaemia 1993–20054
ever, a few exceptions were made. National surveys with fewer than 100 subjects but more than 50 subjects were only accepted where the results were being extrapolated to fewer than 500,000 people; or to pregnant women, since the numbers in this group are frequently small, especially in populations with a lower rate of reproduction.
2.2.2 Population groupsPopulation groups are as follows: preschool-age children (0–4.99 yrs), school-age children (5.00–14.99 yrs), preg-nant women (no age range defined), non-pregnant women (15.00–49.99 yrs), men (15.00–59.99 yrs), and elderly (both sexes >60 yrs). Wherever possible, children below 0.5 yrs were excluded from the estimate for preschool-age children since the cut-off for anaemia is not defined in this age group. However, the estimate was applied to the entire popula-tion of children less than 5 yrs of age. Occasionally, in the non-pregnant women group, pregnant women could not be excluded because all women were included in the figure pro-vided in the country report; but pregnant women were often a small proportion of the group and their exclusion would not be expected to change the figure significantly. If a sur-vey reported results by physiological status, lactating women were combined with non-pregnant non-lactating women to provide the estimate for non-pregnant women.
Data disaggregated by age closest to the defined age range for the population groups were used. If the age range overlapped two population groups, the survey was placed with the group with the greatest overlap in age. When the age range was unavailable, the mean age of the sample was used to classify the data. If this was unavailable or if the age range equally spanned two population groups, the popula-tion-specific Hb concentration threshold was used to clas-sify the data. If data represented less than 20% of the age range of a population group, the survey was excluded.
2.3 Defining anaemia2.3.1 Haemoglobin thresholdNormal Hb distributions vary with age, sex, and physiolog-ical status, e.g., during pregnancy (8). WHO Hb thresh-olds were used to classify individuals living at sea level as anaemic (Table 2.1) (2). Statistical and physiological evi-dence indicate that Hb distributions vary with smoking (9)
and altitude (10), and therefore the prevalence of anaemia corrected for these factors was used when provided by the survey. No other corrections were accepted.
Some surveys did not present data using the WHO Hb thresholds to define anaemia. When this occurred, preva-lence was estimated by assuming that the Hb concentration was normally distributed within the population and esti-mating anaemia prevalence by using one of the following methods in order of preference:
1. The mean and standard deviation (SD) of the Hb con-centration were used to estimate the proportion of in-dividuals falling below the appropriate Hb cut-off for the population group (n=20 surveys). The correlation between the estimated and predicted prevalence of anae-mia was determined using surveys from the database where a mean, an SD, and a prevalence for the WHO age- and sex-specific cut-off were provided. The relation-ship was plotted (n=508 surveys), and for most surveys, the two figures were extremely close (r2≥0.95, p<0.001) for all four Hb thresholds (110, 115, 120, 130 g/l). On average, the predicted prevalence overestimated actual prevalence by 3.8 percentage points. For 6.5% of the surveys in the analysis, actual anaemia prevalence was overestimated by 10 percentage points or more.
2. When no SD was provided, but the prevalence for a non-WHO cut-off and mean Hb concentrations were avail-able (n=3 surveys), we used these two figures to calculate the SD of the Hb concentration by assuming a normal distribution within the population and deriving the Z score in order to back calculate the SD [SD= (Provided cut-off – Mean Hb)/ Z score for proportion]. Following this calculation, the mean and SD were used as above to derive the prevalence for the WHO cut-off.
3. For surveys (n=23) that did not present the mean and SD, nor the prevalence at the recommended threshold, the prevalence of anaemia was estimated from the preva-lence at an alternative threshold. An average SD for the same population group was assumed to be similar to the actual SD in the survey. The mean SD of the Hb concentration for each population group was calculated from surveys included in the estimates, which had data available for subjects within the defined age range of the population group (preschool-age children, SD=13.8 g/l; school-age children, 11.3 g/l; non-pregnant women, 13.7 g/l; pregnant women, 14.0 g/l; and men, 14.5 g/l). The population mean Hb concentration was estimated from the prevalence at the cut-off provided in the survey and the assumed SD.
Sometimes it was necessary to make adjustments for ag-gregated or disaggregated data. For example, one estimate was sometimes provided for school-age children utilizing 1)
1 The time frame for these estimates precedes the cession of Serbia and Montenegro, and therefore estimates in this report are presented for 192 member states as they were in 2005.
Table 2.1 Haemoglobin thresholds used to define anaemia
Age or gender group Haemoglobin threshold (g/l)
children (0.50–4.99 yrs) 110children (5.00–11.99 yrs) 115children (12.00–14.99 yrs) 120non-pregnant women (≥15.00 yrs) 120pregnant women 110men (≥15.00 yrs) 130
Source: adapted from reference (2)
52. methods
one non-WHO cut-off for anaemia where two should have been used; or 2) using two non-WHO cut-offs. In the first case, the prevalence was adjusted for the WHO cut-off that applied to the group in the majority. In the second case, the prevalence was adjusted by assuming that the cut-off applied to the group in the majority had been used for the entire group.
Data provided for separate groups frequently had to be combined, such as data for women by physiological status or any other population group disaggregated by age. Prev-alence estimates were combined and weighted by sample size, and where this information was unavailable for one of the groups, it was assumed to have the average number of subjects of the other groups. If sample size information was missing from all data pooled, equal weight was given to each survey.
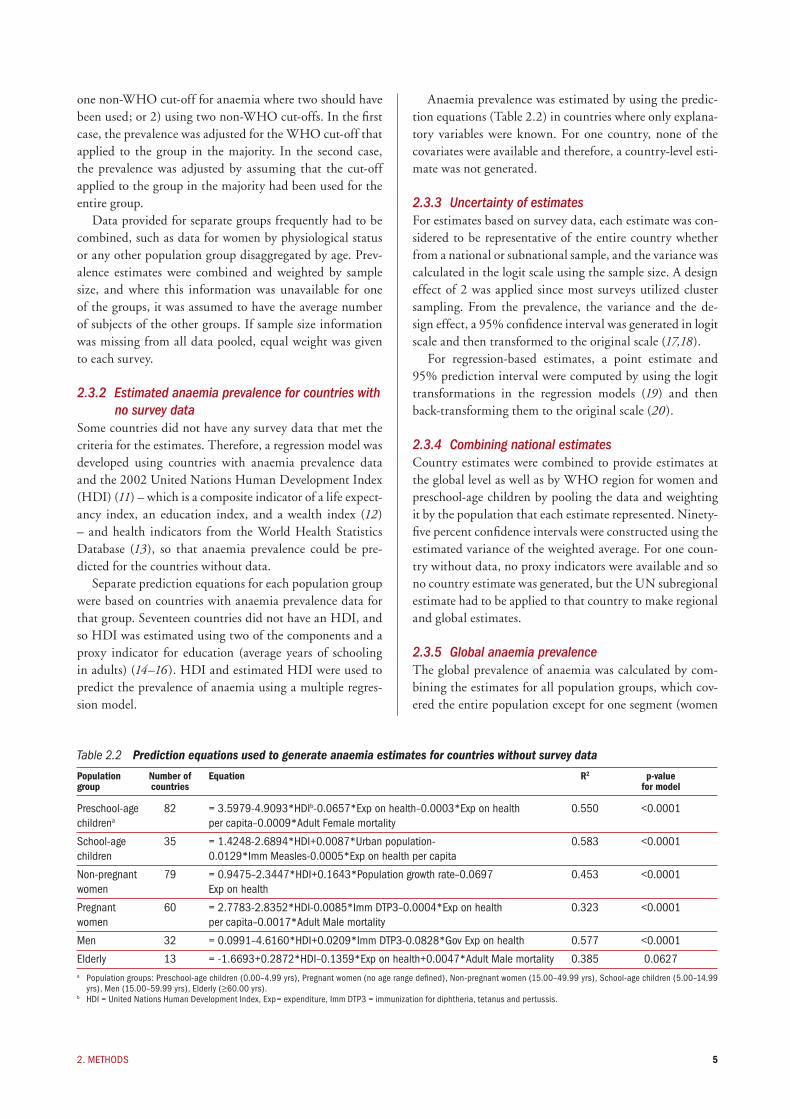
2.3.2 Estimated anaemia prevalence for countries with no survey data
Some countries did not have any survey data that met the criteria for the estimates. Therefore, a regression model was developed using countries with anaemia prevalence data and the 2002 United Nations Human Development Index (HDI) (11) – which is a composite indicator of a life expect-ancy index, an education index, and a wealth index (12) – and health indicators from the World Health Statistics Database (13), so that anaemia prevalence could be pre-dicted for the countries without data.
Separate prediction equations for each population group were based on countries with anaemia prevalence data for that group. Seventeen countries did not have an HDI, and so HDI was estimated using two of the components and a proxy indicator for education (average years of schooling in adults) (14–16 ). HDI and estimated HDI were used to predict the prevalence of anaemia using a multiple regres-sion model.
Anaemia prevalence was estimated by using the predic-tion equations (Table 2.2) in countries where only explana-tory variables were known. For one country, none of the covariates were available and therefore, a country-level esti-mate was not generated.
2.3.3 Uncertainty of estimatesFor estimates based on survey data, each estimate was con-sidered to be representative of the entire country whether from a national or subnational sample, and the variance was calculated in the logit scale using the sample size. A design effect of 2 was applied since most surveys utilized cluster sampling. From the prevalence, the variance and the de-sign effect, a 95% confidence interval was generated in logit scale and then transformed to the original scale (17,18).
For regression-based estimates, a point estimate and 95% prediction interval were computed by using the logit transformations in the regression models (19) and then back-transforming them to the original scale (20).
2.3.4 Combining national estimatesCountry estimates were combined to provide estimates at the global level as well as by WHO region for women and preschool-age children by pooling the data and weighting it by the population that each estimate represented. Ninety-five percent confidence intervals were constructed using the estimated variance of the weighted average. For one coun-try without data, no proxy indicators were available and so no country estimate was generated, but the UN subregional estimate had to be applied to that country to make regional and global estimates.
2.3.5 Global anaemia prevalenceThe global prevalence of anaemia was calculated by com-bining the estimates for all population groups, which cov-ered the entire population except for one segment (women
Table 2.2 Prediction equations used to generate anaemia estimates for countries without survey data
Population Number of Equation R2 p-value group countries for model
preschool-age 82 = 3.5979-4.9093*hdIb-0.0657*exp on health–0.0003*exp on health 0.550 <0.0001 childrena per capita–0.0009*adult female mortality
school-age 35 = 1.4248-2.6894*hdI+0.0087*urban population- 0.583 <0.0001 children 0.0129*Imm measles-0.0005*exp on health per capita
non-pregnant 79 = 0.9475–2.3447*hdI+0.1643*population growth rate–0.0697 0.453 <0.0001 women exp on health
pregnant 60 = 2.7783-2.8352*hdI-0.0085*Imm dtp3–0.0004*exp on health 0.323 <0.0001 women per capita–0.0017*adult male mortality
men 32 = 0.0991–4.6160*hdI+0.0209*Imm dtp3-0.0828*Gov exp on health 0.577 <0.0001
elderly 13 = -1.6693+0.2872*hdI–0.1359*exp on health+0.0047*adult male mortality 0.385 0.0627a population groups: preschool-age children (0.00–4.99 yrs), pregnant women (no age range defined), non-pregnant women (15.00–49.99 yrs), school-age children (5.00–14.99
yrs), men (15.00–59.99 yrs), elderly (≥60.00 yrs).b hdI = united nations human development Index, exp= expenditure, Imm dtp3 = immunization for diphtheria, tetanus and pertussis.
worldwide prevalence of anaemia 1993–20056
50.00–59.99 yrs). The estimate of anaemia prevalence in the elderly was applied to this segment of the population. Because the median age of menopause in women is approx-imately 50.5 yrs (21), menstrual iron losses have stopped for the majority of women in this age group, and we considered that the prevalence of anaemia may be more similar to the elderly than to women of reproductive age. Furthermore, the data from the National Health and Nutrition Examina-tion Survey (NHANES) in the United States of America were compared among women 20–49 yrs, 50–59 yrs, and 60+ yrs, and women 50–59 yrs had a Hb distribution more similar to women 60+ yrs than to women 20–49 yrs.1 In addition, the distribution of C-reactive protein (CRP) was most similar between women 50–59 yrs and women 60+ yrs. However, the proportion of anaemia attributable to elevated CRP in women 50–59 yrs was more similar to women 20–49 yrs.
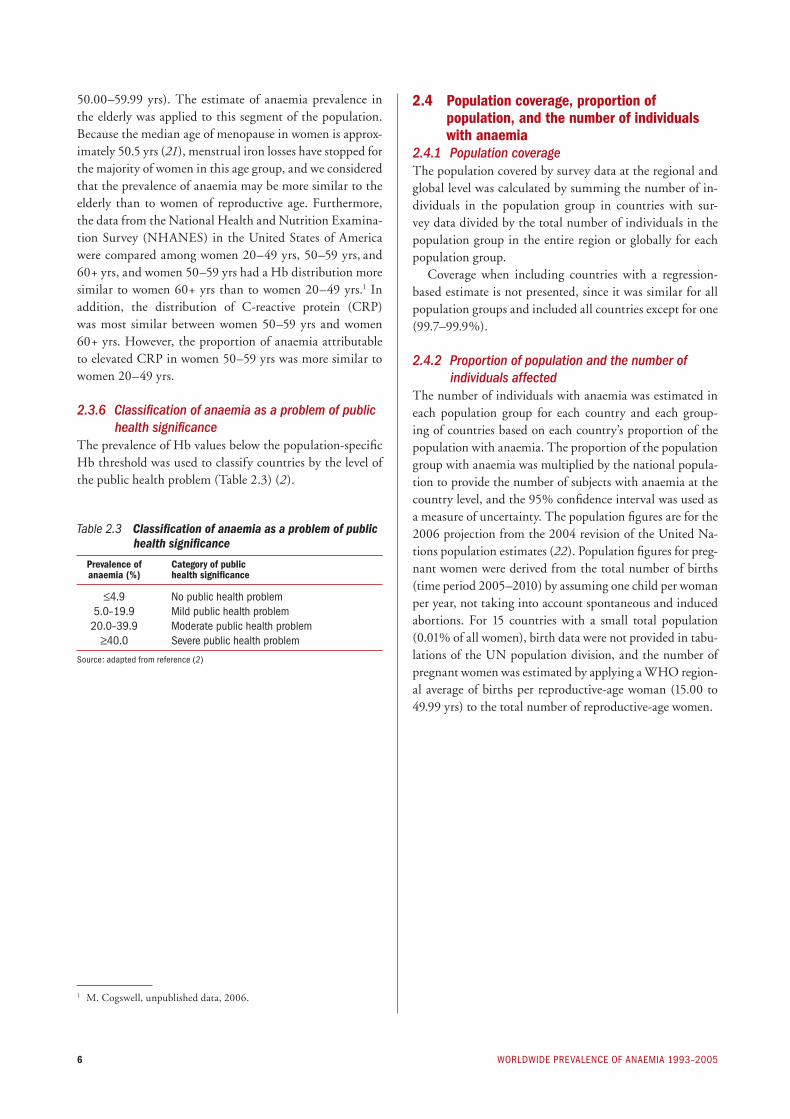
2.3.6 Classification of anaemia as a problem of public health significance
The prevalence of Hb values below the population-specific Hb threshold was used to classify countries by the level of the public health problem (Table 2.3) (2).
Table 2.3 Classification of anaemia as a problem of public health significance
Prevalence of Category of public anaemia (%) health significance
≤4.9 no public health problem 5.0–19.9 mild public health problem 20.0–39.9 moderate public health problem ≥40.0 Severe public health problem
Source: adapted from reference (2)
2.4 Population coverage, proportion of population, and the number of individuals with anaemia
2.4.1 Population coverageThe population covered by survey data at the regional and global level was calculated by summing the number of in-dividuals in the population group in countries with sur-vey data divided by the total number of individuals in the population group in the entire region or globally for each population group.
Coverage when including countries with a regression-based estimate is not presented, since it was similar for all population groups and included all countries except for one (99.7–99.9%).
2.4.2 Proportion of population and the number of individuals affected
The number of individuals with anaemia was estimated in each population group for each country and each group-ing of countries based on each country’s proportion of the population with anaemia. The proportion of the population group with anaemia was multiplied by the national popula-tion to provide the number of subjects with anaemia at the country level, and the 95% confidence interval was used as a measure of uncertainty. The population figures are for the 2006 projection from the 2004 revision of the United Na-tions population estimates (22). Population figures for preg-nant women were derived from the total number of births (time period 2005–2010) by assuming one child per woman per year, not taking into account spontaneous and induced abortions. For 15 countries with a small total population (0.01% of all women), birth data were not provided in tabu-lations of the UN population division, and the number of pregnant women was estimated by applying a WHO region-al average of births per reproductive-age woman (15.00 to 49.99 yrs) to the total number of reproductive-age women.
1 M. Cogswell, unpublished data, 2006.
7
3. Results and Discussion
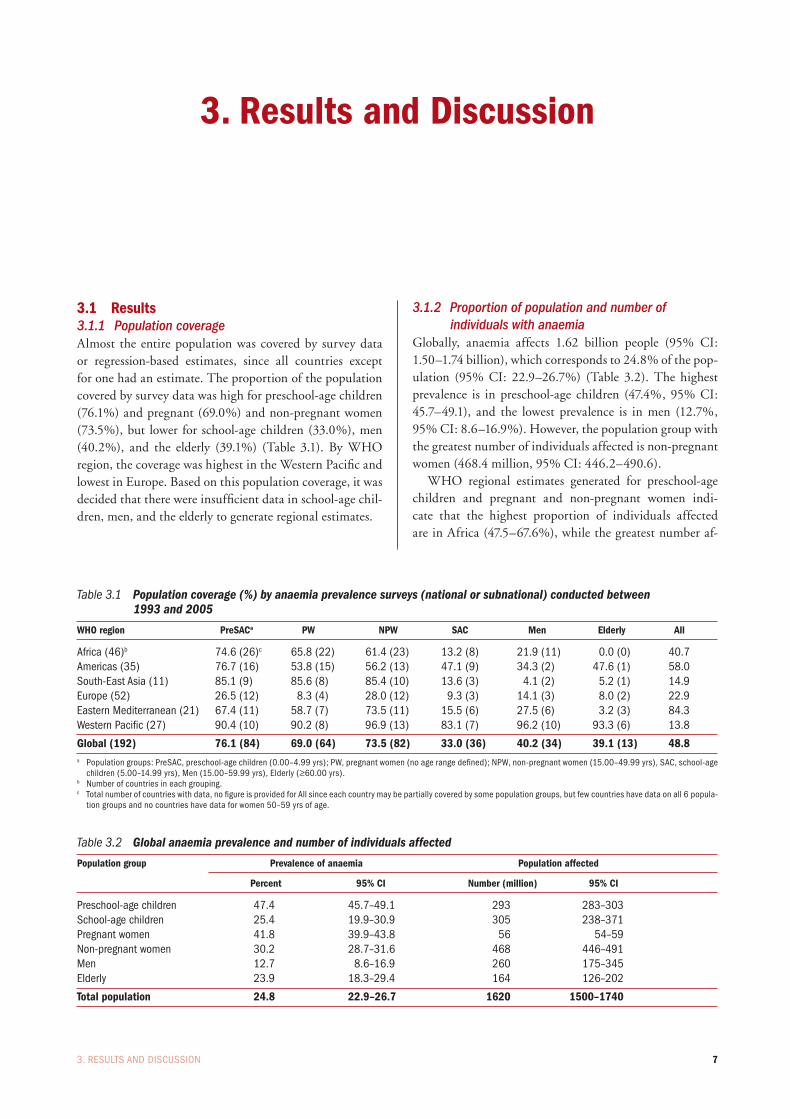
3.1 Results3.1.1 Population coverageAlmost the entire population was covered by survey data or regression-based estimates, since all countries except for one had an estimate. The proportion of the population covered by survey data was high for preschool-age children (76.1%) and pregnant (69.0%) and non-pregnant women (73.5%), but lower for school-age children (33.0%), men (40.2%), and the elderly (39.1%) (Table 3.1). By WHO region, the coverage was highest in the Western Pacific and lowest in Europe. Based on this population coverage, it was decided that there were insufficient data in school-age chil-dren, men, and the elderly to generate regional estimates.
Table 3.1 Population coverage (%) by anaemia prevalence surveys (national or subnational) conducted between 1993 and 2005
WHO region PreSACa PW NPW SAC Men Elderly All
africa (46)b 74.6 (26)c 65.8 (22) 61.4 (23) 13.2 (8) 21.9 (11) 0.0 (0) 40.7americas (35) 76.7 (16) 53.8 (15) 56.2 (13) 47.1 (9) 34.3 (2) 47.6 (1) 58.0South-east asia (11) 85.1 (9) 85.6 (8) 85.4 (10) 13.6 (3) 4.1 (2) 5.2 (1) 14.9europe (52) 26.5 (12) 8.3 (4) 28.0 (12) 9.3 (3) 14.1 (3) 8.0 (2) 22.9eastern mediterranean (21) 67.4 (11) 58.7 (7) 73.5 (11) 15.5 (6) 27.5 (6) 3.2 (3) 84.3western pacific (27) 90.4 (10) 90.2 (8) 96.9 (13) 83.1 (7) 96.2 (10) 93.3 (6) 13.8
Global (192) 76.1 (84) 69.0 (64) 73.5 (82) 33.0 (36) 40.2 (34) 39.1 (13) 48.8a population groups: preSac, preschool-age children (0.00–4.99 yrs); pw, pregnant women (no age range defined); npw, non-pregnant women (15.00–49.99 yrs), Sac, school-age
children (5.00–14.99 yrs), men (15.00–59.99 yrs), elderly (≥60.00 yrs).b number of countries in each grouping.c Total number of countries with data, no figure is provided for all since each country may be partially covered by some population groups, but few countries have data on all 6 popula-
tion groups and no countries have data for women 50–59 yrs of age.
Table 3.2 Global anaemia prevalence and number of individuals affected
Population group Prevalence of anaemia Population affected
Percent 95% CI Number (million) 95% CI
preschool-age children 47.4 45.7–49.1 293 283–303School-age children 25.4 19.9–30.9 305 238–371pregnant women 41.8 39.9–43.8 56 54–59non-pregnant women 30.2 28.7–31.6 468 446–491men 12.7 8.6–16.9 260 175–345elderly 23.9 18.3–29.4 164 126–202
Total population 24.8 22.9–26.7 1620 1500–1740
3.1.2 Proportion of population and number of individuals with anaemia
Globally, anaemia affects 1.62 billion people (95% CI: 1.50–1.74 billion), which corresponds to 24.8% of the pop-ulation (95% CI: 22.9–26.7%) (Table 3.2). The highest prevalence is in preschool-age children (47.4%, 95% CI: 45.7–49.1), and the lowest prevalence is in men (12.7%, 95% CI: 8.6–16.9%). However, the population group with the greatest number of individuals affected is non-pregnant women (468.4 million, 95% CI: 446.2–490.6).
WHO regional estimates generated for preschool-age children and pregnant and non-pregnant women indi-cate that the highest proportion of individuals affected are in Africa (47.5–67.6%), while the greatest number af-
3. reSulTS and diScuSSion
worldwIde prevalence of anaemIa 1993–20058
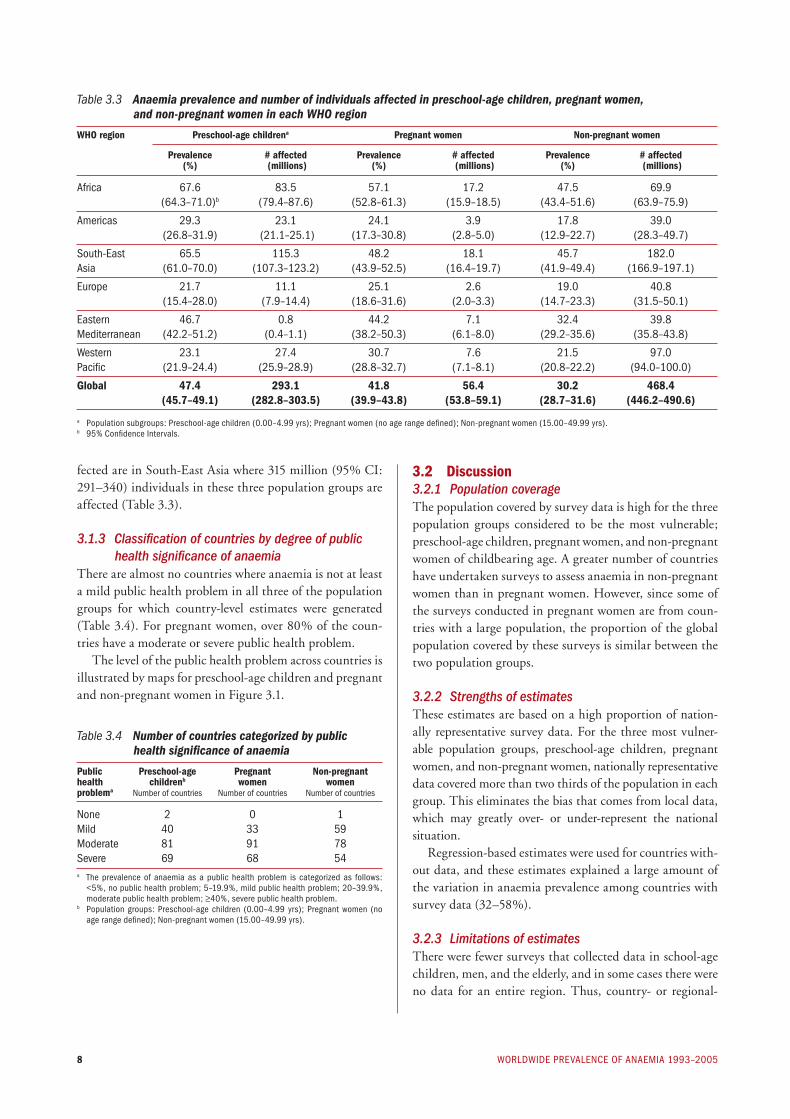
fected are in South-East Asia where 315 million (95% CI: 291–340) individuals in these three population groups are affected (Table 3.3).
3.1.3 Classification of countries by degree of public health significance of anaemia
There are almost no countries where anaemia is not at least a mild public health problem in all three of the population groups for which country-level estimates were generated (Table 3.4). For pregnant women, over 80% of the coun-tries have a moderate or severe public health problem.
The level of the public health problem across countries is illustrated by maps for preschool-age children and pregnant and non-pregnant women in Figure 3.1.
3.2 Discussion3.2.1 Population coverageThe population covered by survey data is high for the three population groups considered to be the most vulnerable; preschool-age children, pregnant women, and non-pregnant women of childbearing age. A greater number of countries have undertaken surveys to assess anaemia in non-pregnant women than in pregnant women. However, since some of the surveys conducted in pregnant women are from coun-tries with a large population, the proportion of the global population covered by these surveys is similar between the two population groups.
3.2.2 Strengths of estimatesThese estimates are based on a high proportion of nation-ally representative survey data. For the three most vulner-able population groups, preschool-age children, pregnant women, and non-pregnant women, nationally representative data covered more than two thirds of the population in each group. This eliminates the bias that comes from local data, which may greatly over- or under-represent the national situation.
Regression-based estimates were used for countries with-out data, and these estimates explained a large amount of the variation in anaemia prevalence among countries with survey data (32–58%).
3.2.3 Limitations of estimatesThere were fewer surveys that collected data in school-age children, men, and the elderly, and in some cases there were no data for an entire region. Thus, country- or regional-
Table 3.3 Anaemia prevalence and number of individuals affected in preschool-age children, pregnant women, and non-pregnant women in each WHO region
WHO region Preschool-age childrena Pregnant women Non-pregnant women
Prevalence # affected Prevalence # affected Prevalence # affected (%) (millions) (%) (millions) (%) (millions)
africa 67.6 83.5 57.1 17.2 47.5 69.9 (64.3–71.0)b (79.4–87.6) (52.8–61.3) (15.9–18.5) (43.4–51.6) (63.9–75.9)
americas 29.3 23.1 24.1 3.9 17.8 39.0 (26.8–31.9) (21.1–25.1) (17.3–30.8) (2.8–5.0) (12.9–22.7) (28.3–49.7)
south-east 65.5 115.3 48.2 18.1 45.7 182.0 asia (61.0–70.0) (107.3–123.2) (43.9–52.5) (16.4–19.7) (41.9–49.4) (166.9–197.1)
europe 21.7 11.1 25.1 2.6 19.0 40.8 (15.4–28.0) (7.9–14.4) (18.6–31.6) (2.0–3.3) (14.7–23.3) (31.5–50.1)
eastern 46.7 0.8 44.2 7.1 32.4 39.8 mediterranean (42.2–51.2) (0.4–1.1) (38.2–50.3) (6.1–8.0) (29.2–35.6) (35.8–43.8)
western 23.1 27.4 30.7 7.6 21.5 97.0 pacific (21.9–24.4) (25.9–28.9) (28.8–32.7) (7.1–8.1) (20.8–22.2) (94.0–100.0)
Global 47.4 293.1 41.8 56.4 30.2 468.4 (45.7–49.1) (282.8–303.5) (39.9–43.8) (53.8–59.1) (28.7–31.6) (446.2–490.6)
a population subgroups: preschool-age children (0.00–4.99 yrs); pregnant women (no age range defined); non-pregnant women (15.00–49.99 yrs).b 95% confidence Intervals.
Table 3.4 Number of countries categorized by public health significance of anaemia
Public Preschool-age Pregnant Non-pregnant health childrenb women women problema number of countries number of countries number of countries
none 2 0 1mild 40 33 59moderate 81 91 78severe 69 68 54a the prevalence of anaemia as a public health problem is categorized as follows:
<5%, no public health problem; 5–19.9%, mild public health problem; 20–39.9%, moderate public health problem; ≥40%, severe public health problem.
b population groups: preschool-age children (0.00–4.99 yrs); pregnant women (no age range defined); non-pregnant women (15.00–49.99 yrs).

Figure 3.1a Anaemia as a public health problem by country: Preschool-age children
Category of public health
significance (anaemia prevalence)
Normal (<5.0%)
Mild (5.0–19.9%)
Moderate (20.0–39.9%)
Severe (_>40.0%)
No data
3. results and
dIscussIo
n9
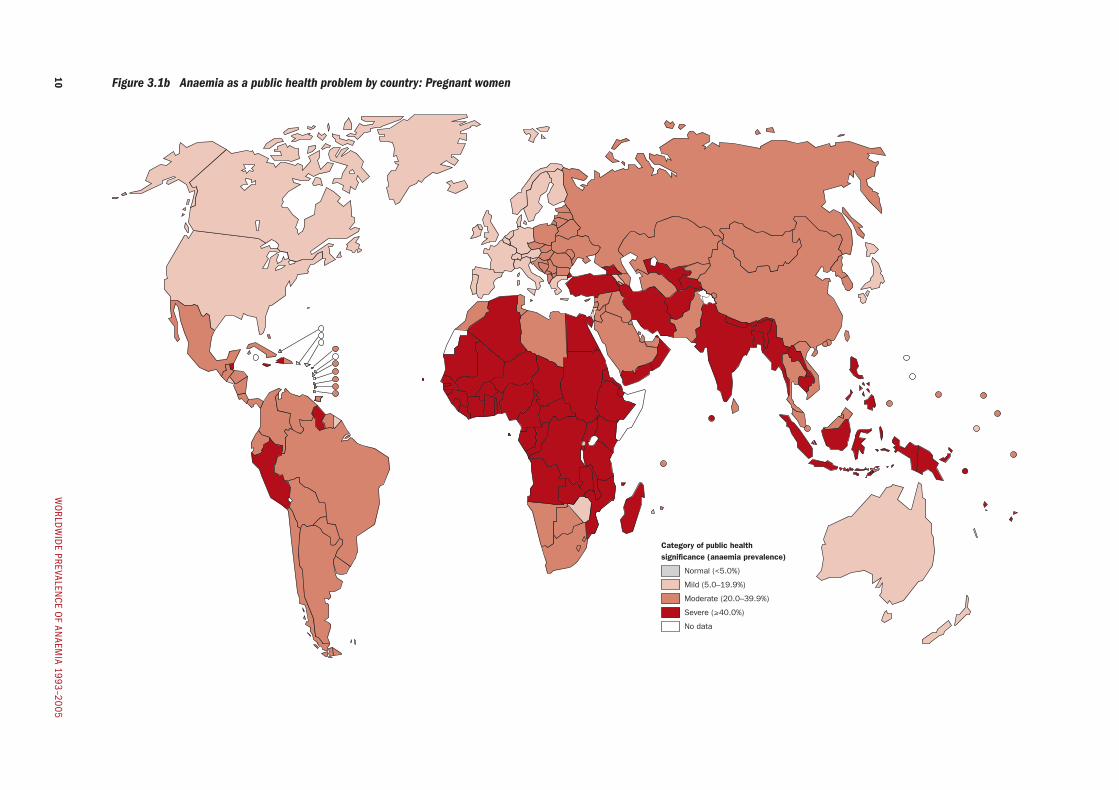
Figure 3.1b Anaemia as a public health problem by country: Pregnant women
Category of public health
significance (anaemia prevalence)
Normal (<5.0%)
Mild (5.0–19.9%)
Moderate (20.0–39.9%)
Severe (_>40.0%)
No data
wo
rldw
Ide prevalen
ce of an
aemIa 1993–2005
10

Figure 3.1c Anaemia as a public health problem by country: Non-pregnant women of reproductive age
Category of public health
significance (anaemia prevalence)
Normal (<5.0%)
Mild (5.0–19.9%)
Moderate (20.0–39.9%)
Severe (_>40.0%)
No data
3. results and
dIscussIo
n11
worldwIde prevalence of anaemIa 1993–200512
level estimates for these population groups were not pre-sented. Even the global estimates should be interpreted with caution since they are based primarily on regression-based estimates for these population groups.
Furthermore, the estimates generated for women (50–59 yrs) were not based on any data from this population group since it is not routinely collected. It is why this estimate was used for the global figure only and not as an estimate for this group of women.
These estimates were based on a number of assumptions. All surveys were treated equally, although in fact their qual-ity varied greatly. For example, some surveys used sampling proportionate to the population distribution within the country, while others did not, and in some national sur-veys, specific areas had to be left out due to security or ac-cessibility issues. Furthermore for some population groups (e.g., children 0.5–4.99 yrs), the population sampled cov-ered only a portion of the desired age range (e.g., children 1–1.99 yrs). For the purpose of our analysis, these surveys were considered equal to those that covered the entire age range. However, an estimate from children in only the low-er or higher end of the range would significantly impact the prevalence estimate, since children below two years of age are much more likely to be anaemic than those above this age.
While there were only three countries for which sub-national data were used to generate prevalence estimates in preschool-age children, these data may result in an over- or under-estimation of anaemia prevalence for those coun-tries.
In some cases, anaemia prevalence was calculated us-ing Hb concentration and assuming that it was distributed normally. This may have lead to a slight over-estimation of anaemia prevalence, since Hb distributions tend to be negatively skewed in populations with a high prevalence of deficiency.
The estimates for pregnant women did not account for the trimester of pregnancy since this information is not routinely reported in publications. Prevalence would be expected to vary by trimester, and thus the estimates for pregnant women may have been biased if there was not an even distribution of women at various stages of pregnancy. Furthermore, we do not have prevalence figures for the third trimester when anaemia is most likely to affect the risk of maternal mortality.
3.2.4 Proportion of population and the number of individuals with anaemia
One in four people is affected by anaemia, and pregnant women and preschool-age children are at the greatest risk. The WHO regions of Africa and South-East Asia have the highest risk, where about two thirds of preschool-age children and half of all women are affected. In numbers,
the main burden is concentrated in South-East Asia, where about 40% of anaemic preschool-age children and non-pregnant women, and about 30% of pregnant women re-side.
3.2.5 Classification of countries by degree of public health significance of anaemia, based on haemoglobin concentration
Anaemia is a public health problem for pregnant women in all of WHO’s Member States. Given the consequences of anaemia during pregnancy, this problem urgently needs to be addressed. The situation is similar in preschool-age children and non-pregnant women for whom only one or two countries do not have an anaemia public health prob-lem. For women and young children, the majority of WHO Member States (132 to 159, depending on the population group) have a moderate-to-severe public health problem with anaemia; meaning that over 20% of the population group in these countries is affected. This should draw the attention of the public health authorities on the need to re-evaluate current strategies to control anaemia by mak-ing sure that the various factors contributing to anaemia have been identified and addressed properly through an in-tegrated approach.
3.2.6 Comparison to previous estimatesIt is a challenge to assess global progress in the control of anaemia, since the methodology used for these estimates is so different from those used in previous estimates. Pre-vious global estimates made by DeMaeyer in 1985 indi-cated that approximately 30% of the world’s population was anaemic (23). These estimates seem to be based on an extrapolation of the prevalence in preschool-age children, school-age children, women, and men. These estimates, which excluded China where 20% of the global population resides, indicated that 43% of preschool-age children, 35% of all women, and 51% of pregnant women were anaemic. Current estimates, excluding China, are 52%, 34%, and 44%, respectively. Variations in the methods employed, and a larger proportion of nationally representative data, are more likely to account for the differences between these estimates than a change in anaemia prevalence.
In 1992, WHO estimates for the year 1988 indicated that 37%, 51%, and 35% of all women and pregnant and non-pregnant women were anaemic (24). These estimates included subnational data for China. The current estimates which use nationally representative data for China (31%, 42%, and 30%) may or may not be lower, since the meth-odologies used are substantially different.
3.3 ConclusionThe data available for these estimates are the most repre-sentative data to date, and we can consider that these esti-

133. results and dIscussIon
mates are the most accurate reflection of the global anaemia prevalence published so far. However, countries without survey data should be encouraged to collect data, since re-gression-based estimates are good at the regional and global level, but may not be the most accurate reflection of the situation for an individual country.
The generation of these estimates and the maintenance of the anaemia database provide a reliable tool to track the global progress towards the elimination of anaemia and the effectiveness of the current strategies for anaemia control. However, since information on causal factors is
not routinely collected, the database does not provide in-formation on the ability of the strategies to address these factors. Hopefully, these estimates will encourage countries to plan surveys which assess the prevalence of factors that contribute to anaemia – not only iron deficiency, but also infectious diseases and other micronutrient deficiencies. The understanding of how these factors vary by geography, level of development, and other social and economic factors will make it easier to design interventions that are more ef-fective and integrative in addressing multiple contributing factors at the same time.

References
1. World Health Organization. The World Health Report 2002: Reducing risks, promoting healthy life. Geneva, World Health Organization, 2002.
2. Iron deficiency anaemia: assessment, prevention, and con-trol. A guide for programme managers. Geneva, World Health Organization, 2001 (WHO/NHD/01.3).
3. Macgregor M. Maternal anaemia as a factor in prema-turity and perinatal mortality. Scottish Medical Journal, 1963, 8:134.
4. Scholl TO, Hediger ML. Anemia and iron-deficiency anemia: compilation of data on pregnancy outcome. American Journal of Clinical Nutrition, 1994, 59:492S–500S.
5. Bothwell T, Charlton R, eds. Iron deficiency in women. Washington DC, Nutrition Foundation, 1981.
6. Guidelines for the treatment of malaria. Geneva, Roll Back Malaria Department, World Health Organiza-tion, 2006 (WHO/HTM/MAL/2006.1108).
7. Crompton DWT et al., eds. Controlling disease due to helminth infections. Geneva, World Health Organiza-tion, 2003.
8. Koller O. The clinical significance of hemodilution during pregnancy. Obstetrical and Gynecological Survey, 1982, 37:649–652.
9. Nordenberg D, Yip R, Binkin NJ. The effect of ciga-rette smoking on hemoglobin levels and anemia screen-ing. Journal of the American Medical Association, 1990, 264:1556–1559.
10. Hurtado A., Merino C, Delgado E. Influence of anox-emia on haematopoietic activities. Archives of Internal Medicine, 1945, 75:284–323.
11. Human Development Report 2002, Deepening democ-racy in a fragmented world. New York, United Nations Development Programme, 2002.
12. Human Development Indicators. In: Cait Murphy BR-L, ed. Human Development Report 2004. New York, United Nations Development Programme, 2004: 139–250.
13. World Health Organization. World Health Statistics 2005. Geneva, World Health Organization, 2005.
14. Mathers CD, Loncar D. Projections of global mortality and burden of disease from 2002 to 2030. PLoS Medi-cine, 2006, 3:e442.
15. World Health Organization. The World Health Report 2000: Health systems: improving performance. Geneva, World Health Organization, 2000.
16. World Health Organization. The World Health Report: 2004: Changing History. Geneva, World Health Or-ganization, 2004.
17. Wackerly D, Mendenhall W, Scheaffer RL. Math-ematical Statistics with Applications, 6th edition. Pacific Grove, CA, Duxbury Press, 2001.
18. Lohr SL. Sampling: Design and Analysis, 1st edition. Pacific Grove, CA, Duxbury Press, 1998.
19. Neter J et al. Applied Linear Statistical Models, 4th edi-tion. New York, McGraw-Hill/Irwin, 1996.
20. Allison PD. Logistic Regression using the SAS System. In-dianapolis, IN, WA (Wiley-SAS), 2001.
21. Whelan EA et al. Menstrual and reproductive charac-teristics and age at natural menopause. American Jour-nal of Epidemiology, 1990, 131:625–632.
22. United Nations PD. World Population Prospects – the 2004 revision. New York, 2005.
23. DeMaeyer E, Adiels-Tegman M. The prevalence of anaemia in the world. World Health Statistics Quarterly, 1985, 38:302–316.
24. World Health Organization. The Prevalence of Anae-mia in Women: A Tabulation of Available Information. 1992 (WHO/MCH/MSM/92.2).
worldwIde prevalence of anaemIa 1993–200514
Annex 1
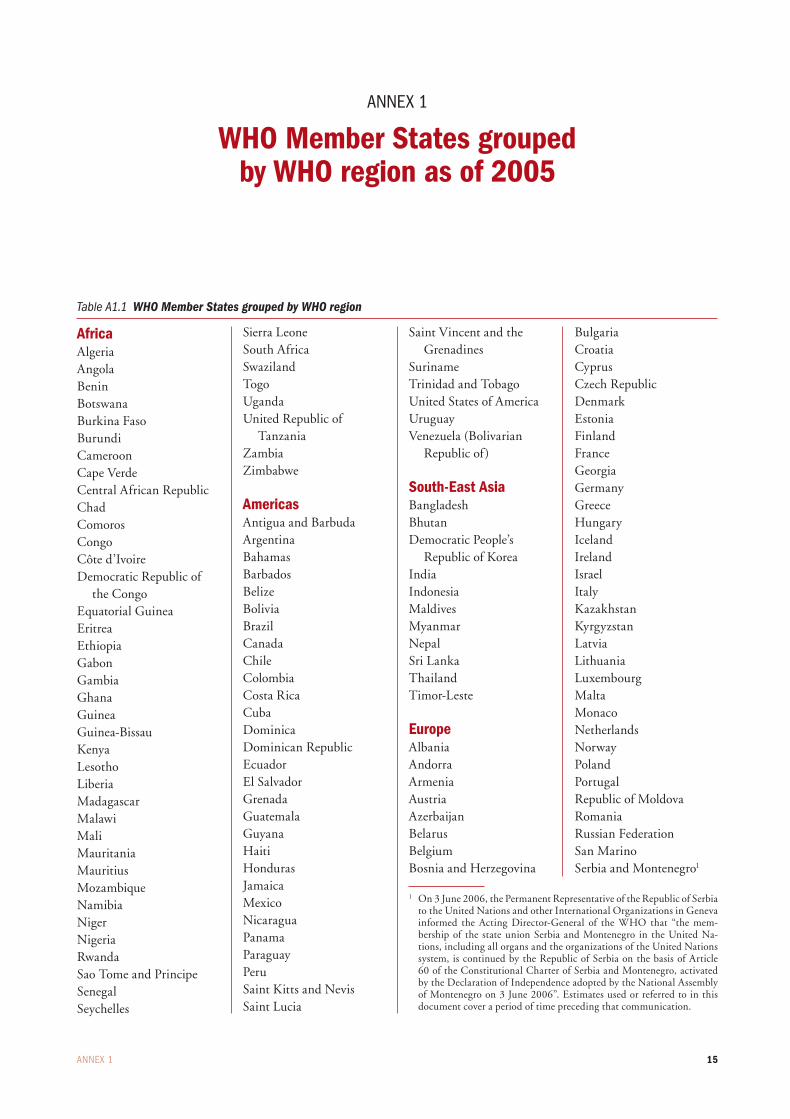
WHO Member States grouped by WHO region as of 2005
Table A1.1 WHO Member States grouped by WHO region
AfricaAlgeria Angola Benin Botswana Burkina Faso Burundi Cameroon Cape Verde Central African Republic Chad Comoros Congo Côte d’IvoireDemocratic Republic of
the Congo Equatorial Guinea Eritrea Ethiopia Gabon Gambia Ghana Guinea Guinea-Bissau Kenya LesothoLiberia MadagascarMalawi Mali Mauritania MauritiusMozambique Namibia Niger Nigeria Rwanda Sao Tome and PrincipeSenegal Seychelles
Sierra LeoneSouth Africa Swaziland Togo Uganda United Republic of
Tanzania Zambia Zimbabwe
Americas Antigua and BarbudaArgentina Bahamas Barbados Belize Bolivia Brazil Canada Chile ColombiaCosta Rica Cuba Dominica Dominican RepublicEcuador El Salvador Grenada Guatemala Guyana HaitiHonduras Jamaica Mexico Nicaragua Panama Paraguay PeruSaint Kitts and Nevis Saint Lucia
Saint Vincent and the Grenadines
Suriname Trinidad and Tobago United States of America Uruguay Venezuela (Bolivarian
Republic of)
South-East AsiaBangladesh Bhutan Democratic People’s
Republic of Korea IndiaIndonesia Maldives Myanmar NepalSri Lanka ThailandTimor-Leste
EuropeAlbania AndorraArmenia Austria Azerbaijan Belarus BelgiumBosnia and Herzegovina
Bulgaria Croatia Cyprus Czech Republic Denmark Estonia FinlandFrance Georgia Germany Greece Hungary Iceland Ireland Israel Italy Kazakhstan Kyrgyzstan Latvia Lithuania LuxembourgMalta Monaco Netherlands Norway PolandPortugalRepublic of MoldovaRomania Russian Federation San Marino Serbia and Montenegro1
1 On 3 June 2006, the Permanent Representative of the Republic of Serbia to the United Nations and other International Organizations in Geneva informed the Acting Director-General of the WHO that “the mem-bership of the state union Serbia and Montenegro in the United Na-tions, including all organs and the organizations of the United Nations system, is continued by the Republic of Serbia on the basis of Article 60 of the Constitutional Charter of Serbia and Montenegro, activated by the Declaration of Independence adopted by the National Assembly of Montenegro on 3 June 2006”. Estimates used or referred to in this document cover a period of time preceding that communication.
Annex 1 15
SlovakiaSlovenia SpainSwedenSwitzerland Tajikistan The former Yugoslav
Republic of Macedonia Turkey Turkmenistan Ukraine United Kingdom of Great
Britain and Northern Ireland
Uzbekistan
Eastern MediterraneanAfghanistan Bahrain Djibouti Egypt Iran (Islamic Republic of)Iraq Jordan Kuwait Lebanon Libyan Arab Jamahiriya MoroccoOman Pakistan Qatar Saudi Arabia Somalia Sudan
Syrian Arab RepublicTunisia United Arab EmiratesYemen
Western Pacific Australia Brunei DarussalamCambodia China Cook Islands Fiji Japan Kiribati Lao People’s Democratic
RepublicMalaysia
Marshall IslandsMicronesia (Federated
States of)Mongolia NauruNew Zealand Niue Palau Papua New GuineaPhilippines Republic of Korea Samoa SingaporeSolomon Islands Tonga Tuvalu Vanuatu Viet Nam
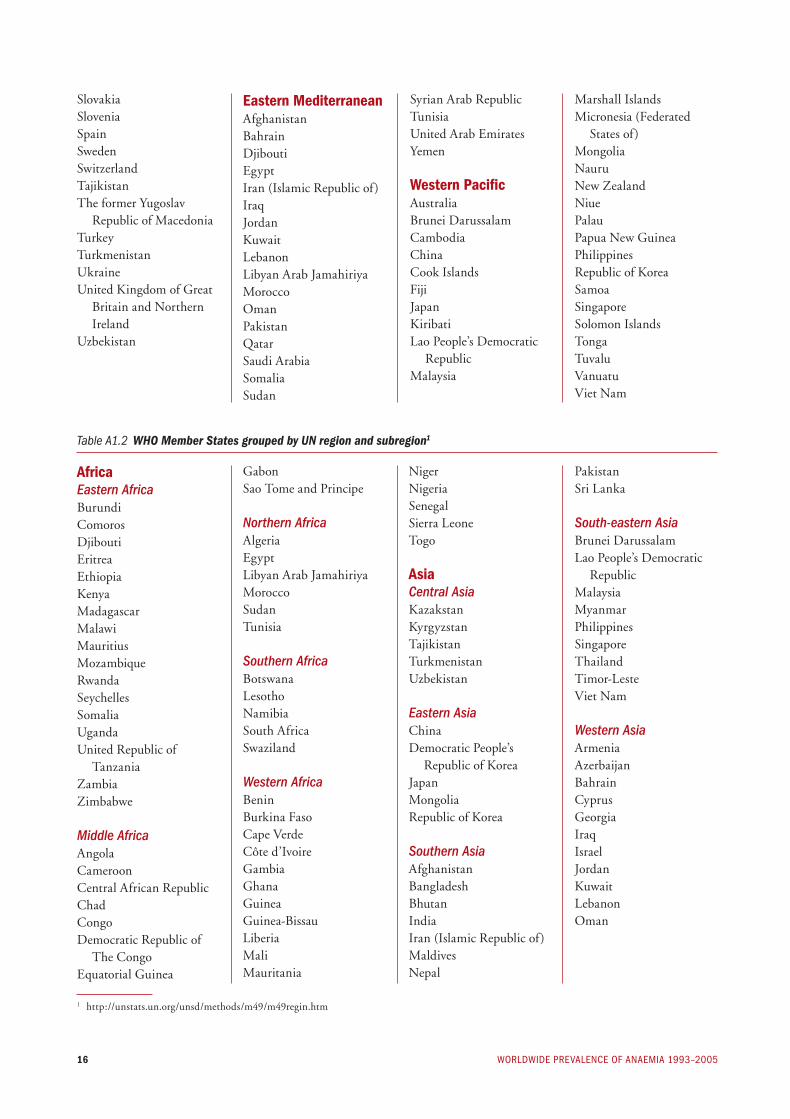
Table A1.2 WHO Member States grouped by UN region and subregion1
Gabon Sao Tome and Principe
Northern Africa Algeria EgyptLibyan Arab JamahiriyaMorocco Sudan Tunisia
Southern Africa BotswanaLesotho Namibia South Africa Swaziland
Western Africa Benin Burkina FasoCape Verde Côte d’Ivoire GambiaGhana Guinea Guinea-Bissau Liberia Mali Mauritania
Niger Nigeria Senegal Sierra Leone Togo
AsiaCentral AsiaKazakstan KyrgyzstanTajikistan TurkmenistanUzbekistan
Eastern Asia ChinaDemocratic People’s
Republic of KoreaJapan MongoliaRepublic of Korea
Southern Asia Afghanistan Bangladesh Bhutan IndiaIran (Islamic Republic of)MaldivesNepal
Pakistan Sri Lanka
South-eastern Asia Brunei DarussalamLao People’s Democratic
Republic MalaysiaMyanmarPhilippines Singapore ThailandTimor-Leste Viet Nam
Western Asia Armenia Azerbaijan Bahrain Cyprus Georgia Iraq Israel Jordan Kuwait Lebanon Oman
AfricaEastern AfricaBurundi Comoros DjiboutiEritrea Ethiopia Kenya Madagascar MalawiMauritius MozambiqueRwanda Seychelles Somalia UgandaUnited Republic of
TanzaniaZambiaZimbabwe
Middle Africa Angola Cameroon Central African Republic Chad Congo Democratic Republic of
The Congo Equatorial Guinea
1 http://unstats.un.org/unsd/methods/m49/m49regin.htm
worldwide prevAlence of AnAemiA 1993–200516
Annex 1
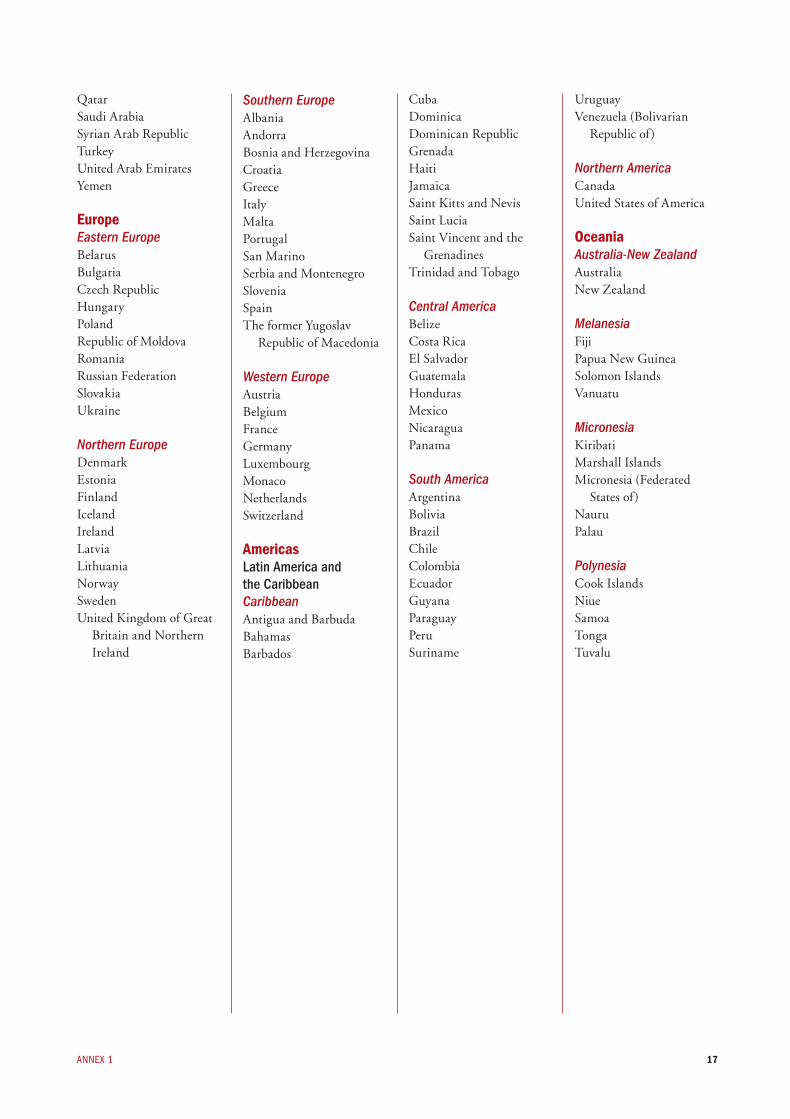
Qatar Saudi ArabiaSyrian Arab Republic Turkey United Arab Emirates Yemen
EuropeEastern EuropeBelarusBulgariaCzech RepublicHungaryPolandRepublic of MoldovaRomaniaRussian FederationSlovakiaUkraine
Northern EuropeDenmark Estonia Finland Iceland Ireland Latvia Lithuania NorwaySwedenUnited Kingdom of Great
Britain and Northern Ireland
Southern Europe Albania Andorra Bosnia and Herzegovina Croatia Greece Italy Malta Portugal San MarinoSerbia and MontenegroSlovenia Spain The former Yugoslav
Republic of Macedonia
Western Europe Austria Belgium France Germany Luxembourg Monaco Netherlands Switzerland
AmericasLatin America and the CaribbeanCaribbeanAntigua and BarbudaBahamasBarbados
Cuba DominicaDominican Republic GrenadaHaitiJamaica Saint Kitts and NevisSaint LuciaSaint Vincent and the
Grenadines Trinidad and Tobago
Central AmericaBelize Costa Rica El Salvador Guatemala HondurasMexico Nicaragua Panama
South America Argentina Bolivia Brazil Chile Colombia Ecuador Guyana Paraguay Peru Suriname
Uruguay Venezuela (Bolivarian
Republic of)
Northern AmericaCanadaUnited States of America
OceaniaAustralia-New ZealandAustraliaNew Zealand
Melanesia Fiji Papua New GuineaSolomon Islands Vanuatu
Micronesia KiribatiMarshall IslandsMicronesia (Federated
States of) Nauru Palau
Polynesia Cook IslandsNiueSamoaTonga Tuvalu
17

annex 2
Results by UN region
Table A2.1 Population coverage (%) by anaemia prevalence surveys (national or subnational) conducted between 1993 and 2005, by UN region
UN region PreSACa PW NPW SAC Men Elderly All
africa (53)b 76.7 (30)c 65.3 (25) 63.6 (26) 18.6 (10) 32.0 (14) 1.8 (1) 40.7asia (47) 82.1 (30) 80.9 (21) 88.8 (34) 37.0 (11) 47.6 (13) 54.1 (7) 58.0europe (41) 19.2 (5) 0.9 (1) 23.9 (5) 12.9 (3) 15.9 (2) 8.7 (2) 14.9l am and the caribbean (33) 70.5 (15) 38.4 (14) 37.5 (12) 28.9 (8) 0.1 (1) 0.0 (0) 22.9n america (2) 92.4 (1) 92.8 (1) 89.9 (1) 91.3 (1) 89.9 (1) 89.6 (1) 84.3oceania (16) 5.1 (3) 4.7 (2) 16.5 (4) 15.1 (3) 15.6 (3) 15.1 (2) 13.8
Global (192) 76.1 (84) 69.0 (64) 73.5 (82) 33.0 (36) 40.2 (34) 39.1 (13) 48.8a population groups: presac, preschool-age children (0.00–4.99 yrs); pw, pregnant women (no age range defined); npw, non-pregnant women (15.00–49.99 yrs), sac, school-age
children (5.00–14.99 yrs), men (15.00–59.99 yrs), elderly (≥60.00 yrs).b number of countries in each grouping.c total number of countries with data. no figure is provided for ‘all’ since each country may be partially covered by some population groups, but few countries have data on all
6 population groups and no countries have data for women 50–59 yrs of age.
Table A2.2 Anaemia prevalence and number of individuals affected in preschool-age children, pregnant women, and non-pregnant women in each UN region
UN regiona Preschool-age childrenb Pregnant women Non-pregnant women
Prevalence # affected Prevalence # affected Prevalence # affected (%) (millions) (%) (millions) (%) (millions)
africa 64.6 93.2 55.8 19.3 44.4 82.9 (61.7–67.5)c (89.1–97.4) (51.9–59.6) (18.0–20.7) (40.9–47.8) (76.5–89.4)
asia 47.7 170.0 41.6 31.7 33.0 318.3 (45.2–50.3) (161.0–178.9) (39.0–44.2) (29.7–33.6) (31.3–34.7) (302.0–334.6)
europe 16.7 6.1 18.7 1.4 15.2 26.6 (10.5–23.0) (3.8–8.4) (12.3–25.1) (0.9–1.8) (10.5–19.9) (18.4–34.9)
lac 39.5 22.3 31.1 3.6 23.5 33.0 (36.0–43.0) (20.3–24.3) (21.8–40.4) (2.5–4.7) (15.9–31.0) (22.4–43.6)
na 3.4 0.8 6.1 0.3 7.6 6.0 (2.0–4.9) (0.4–1.1) (3.4–8.8) (0.2–0.4) (5.9–9.4) (4.6–7.3)
oceania 28.0 0.7 30.4 0.2 20.2 1.5 (15.8–40.2) (0.4–1.0) (17.0–43.9) (0.1–0.2) (9.5–30.9) (0.7–2.4)
Global 47.4 293.1 41.8 56.4 30.2 468.4 (45.7–49.1) (282.8–303.5) (39.9–43.8) (53.8–59.1) (28.7–31.6) (446.2–490.6)
a un regions: africa, asia, europe, latin america and the caribbean (lac), northern america (na), and oceania.b population groups: presac, preschool-age children (0.00–4.99 yrs); pw, pregnant women (no age range defined); npw, non-pregnant women (15.00–49.99 yrs).c 95% confidence Intervals.
18 worldwIde prevalence of anaemIa 1993–2005

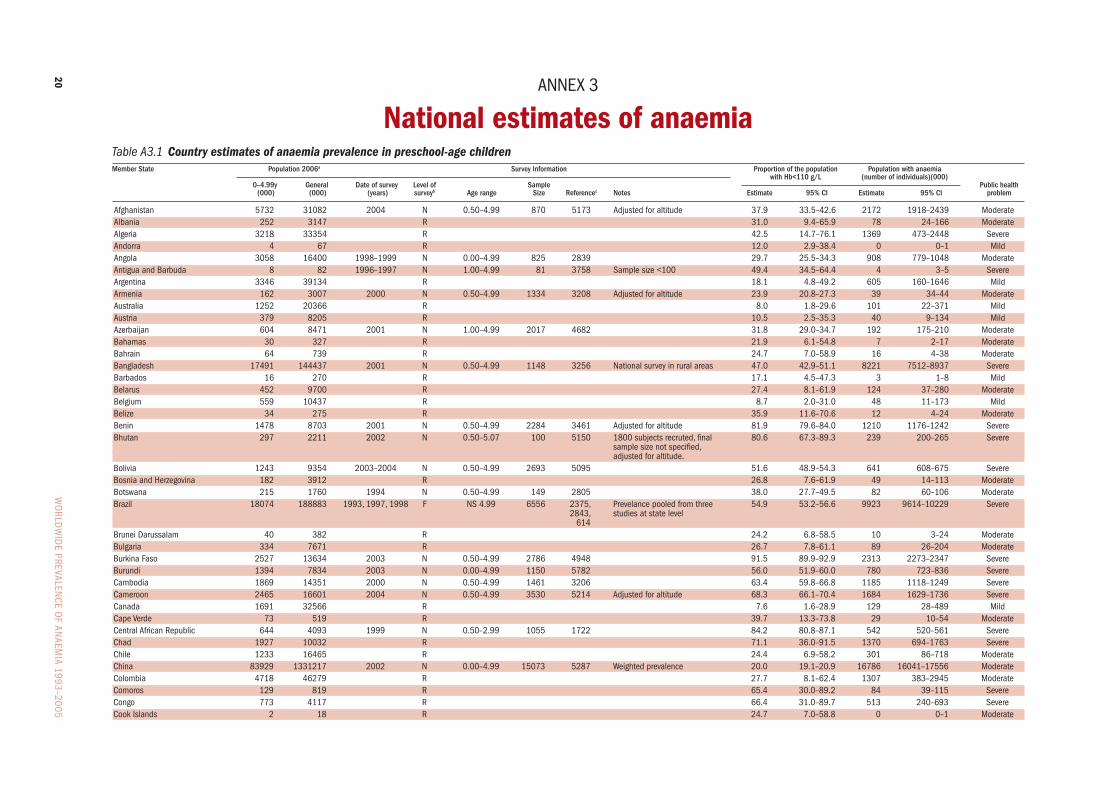
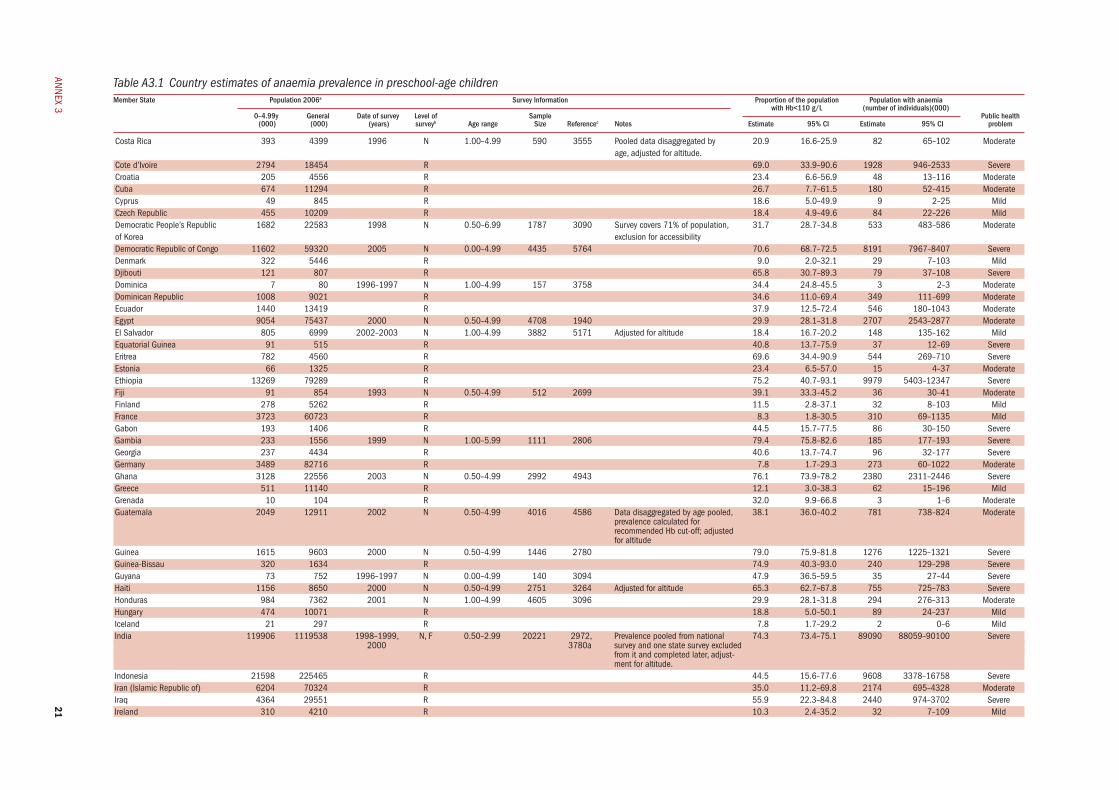
annex 3
National estimates of anaemiaTable A3.1 Country estimates of anaemia prevalence in preschool-age childrenMember State Population 2006a Survey Information Proportion of the population Population with anaemia with Hb<110 g/L (number of individuals)(000) 0–4.99y General Date of survey Level of Sample Public health (000) (000) (years) surveyb Age range Size Referencec Notes Estimate 95% CI Estimate 95% CI problem
afghanistan 5732 31082 2004 n 0.50–4.99 870 5173 adjusted for altitude 37.9 33.5–42.6 2172 1918–2439 moderatealbania 252 3147 r 31.0 9.4–65.9 78 24–166 moderatealgeria 3218 33354 r 42.5 14.7–76.1 1369 473–2448 severeandorra 4 67 r 12.0 2.9–38.4 0 0–1 mildangola 3058 16400 1998–1999 n 0.00–4.99 825 2839 29.7 25.5–34.3 908 779–1048 moderateantigua and Barbuda 8 82 1996–1997 n 1.00–4.99 81 3758 sample size <100 49.4 34.5–64.4 4 3–5 severeargentina 3346 39134 r 18.1 4.8–49.2 605 160–1646 mildarmenia 162 3007 2000 n 0.50–4.99 1334 3208 adjusted for altitude 23.9 20.8–27.3 39 34–44 moderateaustralia 1252 20366 r 8.0 1.8–29.6 101 22–371 mildaustria 379 8205 r 10.5 2.5–35.3 40 9–134 mildazerbaijan 604 8471 2001 n 1.00–4.99 2017 4682 31.8 29.0–34.7 192 175–210 moderateBahamas 30 327 r 21.9 6.1–54.8 7 2–17 moderateBahrain 64 739 r 24.7 7.0–58.9 16 4–38 moderateBangladesh 17491 144437 2001 n 0.50–4.99 1148 3256 national survey in rural areas 47.0 42.9–51.1 8221 7512–8937 severeBarbados 16 270 r 17.1 4.5–47.3 3 1–8 mildBelarus 452 9700 r 27.4 8.1–61.9 124 37–280 moderateBelgium 559 10437 r 8.7 2.0–31.0 48 11–173 mildBelize 34 275 r 35.9 11.6–70.6 12 4–24 moderateBenin 1478 8703 2001 n 0.50–4.99 2284 3461 adjusted for altitude 81.9 79.6–84.0 1210 1176–1242 severeBhutan 297 2211 2002 n 0.50–5.07 100 5150 1800 subjects recruted, final 80.6 67.3–89.3 239 200–265 severe sample size not specified, adjusted for altitude. Bolivia 1243 9354 2003–2004 n 0.50–4.99 2693 5095 51.6 48.9–54.3 641 608–675 severeBosnia and herzegovina 182 3912 r 26.8 7.6–61.9 49 14–113 moderateBotswana 215 1760 1994 n 0.50–4.99 149 2805 38.0 27.7–49.5 82 60–106 moderateBrazil 18074 188883 1993, 1997, 1998 f ns 4.99 6556 2375, prevelance pooled from three 54.9 53.2–56.6 9923 9614–10229 severe 2843, studies at state level 614 Brunei darussalam 40 382 r 24.2 6.8–58.5 10 3–24 moderateBulgaria 334 7671 r 26.7 7.8–61.1 89 26–204 moderateBurkina faso 2527 13634 2003 n 0.50–4.99 2786 4948 91.5 89.9–92.9 2313 2273–2347 severeBurundi 1394 7834 2003 n 0.00–4.99 1150 5782 56.0 51.9–60.0 780 723–836 severecambodia 1869 14351 2000 n 0.50–4.99 1461 3206 63.4 59.8–66.8 1185 1118–1249 severecameroon 2465 16601 2004 n 0.50–4.99 3530 5214 adjusted for altitude 68.3 66.1–70.4 1684 1629–1736 severecanada 1691 32566 r 7.6 1.6–28.9 129 28–489 mildcape verde 73 519 r 39.7 13.3–73.8 29 10–54 moderatecentral african republic 644 4093 1999 n 0.50–2.99 1055 1722 84.2 80.8–87.1 542 520–561 severechad 1927 10032 r 71.1 36.0–91.5 1370 694–1763 severechile 1233 16465 r 24.4 6.9–58.2 301 86–718 moderatechina 83929 1331217 2002 n 0.00–4.99 15073 5287 weighted prevalence 20.0 19.1–20.9 16786 16041–17556 moderatecolombia 4718 46279 r 27.7 8.1–62.4 1307 383–2945 moderatecomoros 129 819 r 65.4 30.0–89.2 84 39–115 severecongo 773 4117 r 66.4 31.0–89.7 513 240–693 severecook Islands 2 18 r 24.7 7.0–58.8 0 0–1 moderate
wo
rldw
Ide prevalen
ce of an
aemIa 1993–2005
20
ann
ex 3
Table A3.1 Country estimates of anaemia prevalence in preschool-age childrenMember State Population 2006a Survey Information Proportion of the population Population with anaemia with Hb<110 g/L (number of individuals)(000) 0–4.99y General Date of survey Level of Sample Public health (000) (000) (years) surveyb Age range Size Referencec Notes Estimate 95% CI Estimate 95% CI problem
costa rica 393 4399 1996 n 1.00–4.99 590 3555 pooled data disaggregated by 20.9 16.6–25.9 82 65–102 moderate age, adjusted for altitude. cote d’Ivoire 2794 18454 r 69.0 33.9–90.6 1928 946–2533 severecroatia 205 4556 r 23.4 6.6–56.9 48 13–116 moderatecuba 674 11294 r 26.7 7.7–61.5 180 52–415 moderatecyprus 49 845 r 18.6 5.0–49.9 9 2–25 mildczech republic 455 10209 r 18.4 4.9–49.6 84 22–226 milddemocratic people’s republic 1682 22583 1998 n 0.50–6.99 1787 3090 survey covers 71% of population, 31.7 28.7–34.8 533 483–586 moderateof Korea exclusion for accessibilitydemocratic republic of congo 11602 59320 2005 n 0.00–4.99 4435 5764 70.6 68.7–72.5 8191 7967–8407 severedenmark 322 5446 r 9.0 2.0–32.1 29 7–103 milddjibouti 121 807 r 65.8 30.7–89.3 79 37–108 severedominica 7 80 1996–1997 n 1.00–4.99 157 3758 34.4 24.8–45.5 3 2–3 moderatedominican republic 1008 9021 r 34.6 11.0–69.4 349 111–699 moderateecuador 1440 13419 r 37.9 12.5–72.4 546 180–1043 moderateegypt 9054 75437 2000 n 0.50–4.99 4708 1940 29.9 28.1–31.8 2707 2543–2877 moderateel salvador 805 6999 2002–2003 n 1.00–4.99 3882 5171 adjusted for altitude 18.4 16.7–20.2 148 135–162 mildequatorial Guinea 91 515 r 40.8 13.7–75.9 37 12–69 severeeritrea 782 4560 r 69.6 34.4–90.9 544 269–710 severeestonia 66 1325 r 23.4 6.5–57.0 15 4–37 moderateethiopia 13269 79289 r 75.2 40.7–93.1 9979 5403–12347 severefiji 91 854 1993 n 0.50–4.99 512 2699 39.1 33.3–45.2 36 30–41 moderatefinland 278 5262 r 11.5 2.8–37.1 32 8–103 mildfrance 3723 60723 r 8.3 1.8–30.5 310 69–1135 mildGabon 193 1406 r 44.5 15.7–77.5 86 30–150 severeGambia 233 1556 1999 n 1.00–5.99 1111 2806 79.4 75.8–82.6 185 177–193 severeGeorgia 237 4434 r 40.6 13.7–74.7 96 32–177 severeGermany 3489 82716 r 7.8 1.7–29.3 273 60–1022 moderateGhana 3128 22556 2003 n 0.50–4.99 2992 4943 76.1 73.9–78.2 2380 2311–2446 severeGreece 511 11140 r 12.1 3.0–38.3 62 15–196 mildGrenada 10 104 r 32.0 9.9–66.8 3 1–6 moderateGuatemala 2049 12911 2002 n 0.50–4.99 4016 4586 data disaggregated by age pooled, 38.1 36.0–40.2 781 738–824 moderate prevalence calculated for recommended hb cut-off; adjusted for altitudeGuinea 1615 9603 2000 n 0.50–4.99 1446 2780 79.0 75.9–81.8 1276 1225–1321 severeGuinea-Bissau 320 1634 r 74.9 40.3–93.0 240 129–298 severeGuyana 73 752 1996–1997 n 0.00–4.99 140 3094 47.9 36.5–59.5 35 27–44 severehaiti 1156 8650 2000 n 0.50–4.99 2751 3264 adjusted for altitude 65.3 62.7–67.8 755 725–783 severehonduras 984 7362 2001 n 1.00–4.99 4605 3096 29.9 28.1–31.8 294 276–313 moderatehungary 474 10071 r 18.8 5.0–50.1 89 24–237 mildIceland 21 297 r 7.8 1.7–29.2 2 0–6 mildIndia 119906 1119538 1998–1999, n, f 0.50–2.99 20221 2972, prevalence pooled from national 74.3 73.4–75.1 89090 88059–90100 severe 2000 3780a survey and one state survey excluded from it and completed later, adjust- ment for altitude. Indonesia 21598 225465 r 44.5 15.6–77.6 9608 3378–16758 severeIran (Islamic republic of) 6204 70324 r 35.0 11.2–69.8 2174 695–4328 moderateIraq 4364 29551 r 55.9 22.3–84.8 2440 974–3702 severeIreland 310 4210 r 10.3 2.4–35.2 32 7–109 mild
21
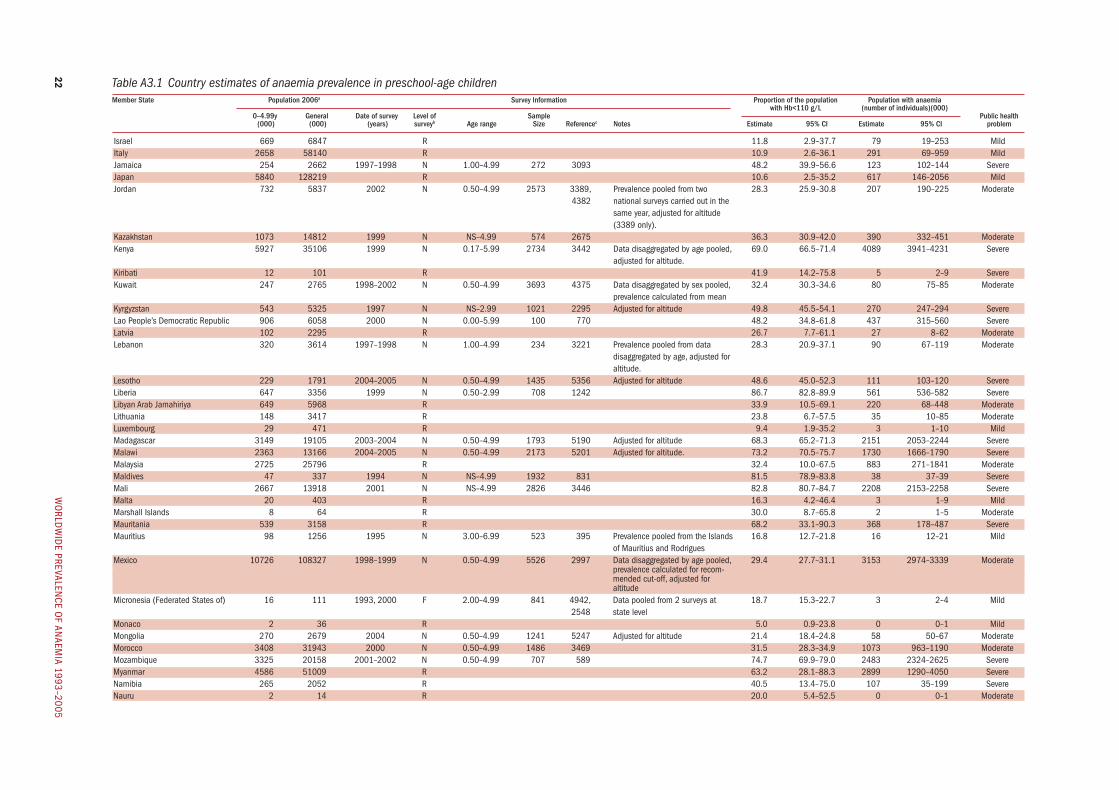
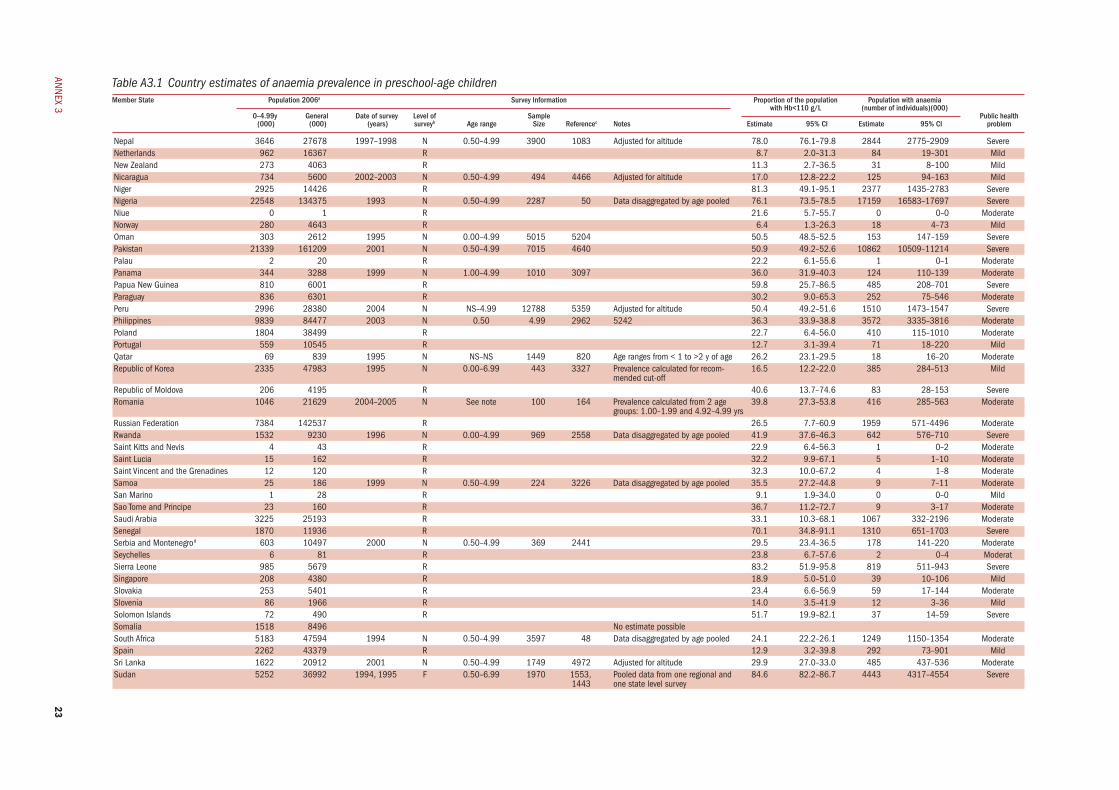
Table A3.1 Country estimates of anaemia prevalence in preschool-age childrenMember State Population 2006a Survey Information Proportion of the population Population with anaemia with Hb<110 g/L (number of individuals)(000) 0–4.99y General Date of survey Level of Sample Public health (000) (000) (years) surveyb Age range Size Referencec Notes Estimate 95% CI Estimate 95% CI problem
Israel 669 6847 r 11.8 2.9–37.7 79 19–253 mildItaly 2658 58140 r 10.9 2.6–36.1 291 69–959 mildJamaica 254 2662 1997–1998 n 1.00–4.99 272 3093 48.2 39.9–56.6 123 102–144 severeJapan 5840 128219 r 10.6 2.5–35.2 617 146–2056 mildJordan 732 5837 2002 n 0.50–4.99 2573 3389, prevalence pooled from two 28.3 25.9–30.8 207 190–225 moderate 4382 national surveys carried out in the same year, adjusted for altitude (3389 only). Kazakhstan 1073 14812 1999 n ns–4.99 574 2675 36.3 30.9–42.0 390 332–451 moderateKenya 5927 35106 1999 n 0.17–5.99 2734 3442 data disaggregated by age pooled, 69.0 66.5–71.4 4089 3941–4231 severe adjusted for altitude. Kiribati 12 101 r 41.9 14.2–75.8 5 2–9 severeKuwait 247 2765 1998–2002 n 0.50–4.99 3693 4375 data disaggregated by sex pooled, 32.4 30.3–34.6 80 75–85 moderate prevalence calculated from mean Kyrgyzstan 543 5325 1997 n ns–2.99 1021 2295 adjusted for altitude 49.8 45.5–54.1 270 247–294 severelao people’s democratic republic 906 6058 2000 n 0.00–5.99 100 770 48.2 34.8–61.8 437 315–560 severelatvia 102 2295 r 26.7 7.7–61.1 27 8–62 moderatelebanon 320 3614 1997–1998 n 1.00–4.99 234 3221 prevalence pooled from data 28.3 20.9–37.1 90 67–119 moderate disaggregated by age, adjusted for altitude. lesotho 229 1791 2004–2005 n 0.50–4.99 1435 5356 adjusted for altitude 48.6 45.0–52.3 111 103–120 severeliberia 647 3356 1999 n 0.50–2.99 708 1242 86.7 82.8–89.9 561 536–582 severelibyan arab Jamahiriya 649 5968 r 33.9 10.5–69.1 220 68–448 moderatelithuania 148 3417 r 23.8 6.7–57.5 35 10–85 moderateluxembourg 29 471 r 9.4 1.9–35.2 3 1–10 mildmadagascar 3149 19105 2003–2004 n 0.50–4.99 1793 5190 adjusted for altitude 68.3 65.2–71.3 2151 2053–2244 severemalawi 2363 13166 2004–2005 n 0.50–4.99 2173 5201 adjusted for altitude. 73.2 70.5–75.7 1730 1666–1790 severemalaysia 2725 25796 r 32.4 10.0–67.5 883 271–1841 moderatemaldives 47 337 1994 n ns–4.99 1932 831 81.5 78.9–83.8 38 37–39 severemali 2667 13918 2001 n ns–4.99 2826 3446 82.8 80.7–84.7 2208 2153–2258 severemalta 20 403 r 16.3 4.2–46.4 3 1–9 mildmarshall Islands 8 64 r 30.0 8.7–65.8 2 1–5 moderatemauritania 539 3158 r 68.2 33.1–90.3 368 178–487 severemauritius 98 1256 1995 n 3.00–6.99 523 395 prevalence pooled from the Islands 16.8 12.7–21.8 16 12–21 mild of mauritius and rodriguesmexico 10726 108327 1998–1999 n 0.50–4.99 5526 2997 data disaggregated by age pooled, 29.4 27.7–31.1 3153 2974–3339 moderate prevalence calculated for recom- mended cut-off, adjusted for altitudemicronesia (federated states of) 16 111 1993, 2000 f 2.00–4.99 841 4942, data pooled from 2 surveys at 18.7 15.3–22.7 3 2–4 mild 2548 state levelmonaco 2 36 r 5.0 0.9–23.8 0 0–1 mildmongolia 270 2679 2004 n 0.50–4.99 1241 5247 adjusted for altitude 21.4 18.4–24.8 58 50–67 moderatemorocco 3408 31943 2000 n 0.50–4.99 1486 3469 31.5 28.3–34.9 1073 963–1190 moderatemozambique 3325 20158 2001–2002 n 0.50–4.99 707 589 74.7 69.9–79.0 2483 2324–2625 severemyanmar 4586 51009 r 63.2 28.1–88.3 2899 1290–4050 severenamibia 265 2052 r 40.5 13.4–75.0 107 35–199 severenauru 2 14 r 20.0 5.4–52.5 0 0–1 moderate
wo
rldw
Ide prevalen
ce of an
aemIa 1993–2005
22
ann
ex 3
Table A3.1 Country estimates of anaemia prevalence in preschool-age childrenMember State Population 2006a Survey Information Proportion of the population Population with anaemia with Hb<110 g/L (number of individuals)(000) 0–4.99y General Date of survey Level of Sample Public health (000) (000) (years) surveyb Age range Size Referencec Notes Estimate 95% CI Estimate 95% CI problem
nepal 3646 27678 1997–1998 n 0.50–4.99 3900 1083 adjusted for altitude 78.0 76.1–79.8 2844 2775–2909 severenetherlands 962 16367 r 8.7 2.0–31.3 84 19–301 mildnew Zealand 273 4063 r 11.3 2.7–36.5 31 8–100 mildnicaragua 734 5600 2002–2003 n 0.50–4.99 494 4466 adjusted for altitude 17.0 12.8–22.2 125 94–163 mildniger 2925 14426 r 81.3 49.1–95.1 2377 1435–2783 severenigeria 22548 134375 1993 n 0.50–4.99 2287 50 data disaggregated by age pooled 76.1 73.5–78.5 17159 16583–17697 severeniue 0 1 r 21.6 5.7–55.7 0 0–0 moderatenorway 280 4643 r 6.4 1.3–26.3 18 4–73 mildoman 303 2612 1995 n 0.00–4.99 5015 5204 50.5 48.5–52.5 153 147–159 severepakistan 21339 161209 2001 n 0.50–4.99 7015 4640 50.9 49.2–52.6 10862 10509–11214 severepalau 2 20 r 22.2 6.1–55.6 1 0–1 moderatepanama 344 3288 1999 n 1.00–4.99 1010 3097 36.0 31.9–40.3 124 110–139 moderatepapua new Guinea 810 6001 r 59.8 25.7–86.5 485 208–701 severeparaguay 836 6301 r 30.2 9.0–65.3 252 75–546 moderateperu 2996 28380 2004 n ns–4.99 12788 5359 adjusted for altitude 50.4 49.2–51.6 1510 1473–1547 severephilippines 9839 84477 2003 n 0.50 4.99 2962 5242 36.3 33.9–38.8 3572 3335–3816 moderatepoland 1804 38499 r 22.7 6.4–56.0 410 115–1010 moderateportugal 559 10545 r 12.7 3.1–39.4 71 18–220 mildQatar 69 839 1995 n ns–ns 1449 820 age ranges from < 1 to >2 y of age 26.2 23.1–29.5 18 16–20 moderaterepublic of Korea 2335 47983 1995 n 0.00–6.99 443 3327 prevalence calculated for recom- 16.5 12.2–22.0 385 284–513 mild mended cut-offrepublic of moldova 206 4195 r 40.6 13.7–74.6 83 28–153 severeromania 1046 21629 2004–2005 n see note 100 164 prevalence calculated from 2 age 39.8 27.3–53.8 416 285–563 moderate groups: 1.00–1.99 and 4.92–4.99 yrsrussian federation 7384 142537 r 26.5 7.7–60.9 1959 571–4496 moderaterwanda 1532 9230 1996 n 0.00–4.99 969 2558 data disaggregated by age pooled 41.9 37.6–46.3 642 576–710 severesaint Kitts and nevis 4 43 r 22.9 6.4–56.3 1 0–2 moderatesaint lucia 15 162 r 32.2 9.9–67.1 5 1–10 moderatesaint vincent and the Grenadines 12 120 r 32.3 10.0–67.2 4 1–8 moderatesamoa 25 186 1999 n 0.50–4.99 224 3226 data disaggregated by age pooled 35.5 27.2–44.8 9 7–11 moderatesan marino 1 28 r 9.1 1.9–34.0 0 0–0 mildsao tome and principe 23 160 r 36.7 11.2–72.7 9 3–17 moderatesaudi arabia 3225 25193 r 33.1 10.3–68.1 1067 332–2196 moderatesenegal 1870 11936 r 70.1 34.8–91.1 1310 651–1703 severeserbia and montenegrod 603 10497 2000 n 0.50–4.99 369 2441 29.5 23.4–36.5 178 141–220 moderateseychelles 6 81 r 23.8 6.7–57.6 2 0–4 moderatsierra leone 985 5679 r 83.2 51.9–95.8 819 511–943 severesingapore 208 4380 r 18.9 5.0–51.0 39 10–106 mildslovakia 253 5401 r 23.4 6.6–56.9 59 17–144 moderateslovenia 86 1966 r 14.0 3.5–41.9 12 3–36 mildsolomon Islands 72 490 r 51.7 19.9–82.1 37 14–59 severesomalia 1518 8496 no estimate possiblesouth africa 5183 47594 1994 n 0.50–4.99 3597 48 data disaggregated by age pooled 24.1 22.2–26.1 1249 1150–1354 moderatespain 2262 43379 r 12.9 3.2–39.8 292 73–901 mildsri lanka 1622 20912 2001 n 0.50–4.99 1749 4972 adjusted for altitude 29.9 27.0–33.0 485 437–536 moderatesudan 5252 36992 1994, 1995 f 0.50–6.99 1970 1553, pooled data from one regional and 84.6 82.2–86.7 4443 4317–4554 severe 1443 one state level survey
23
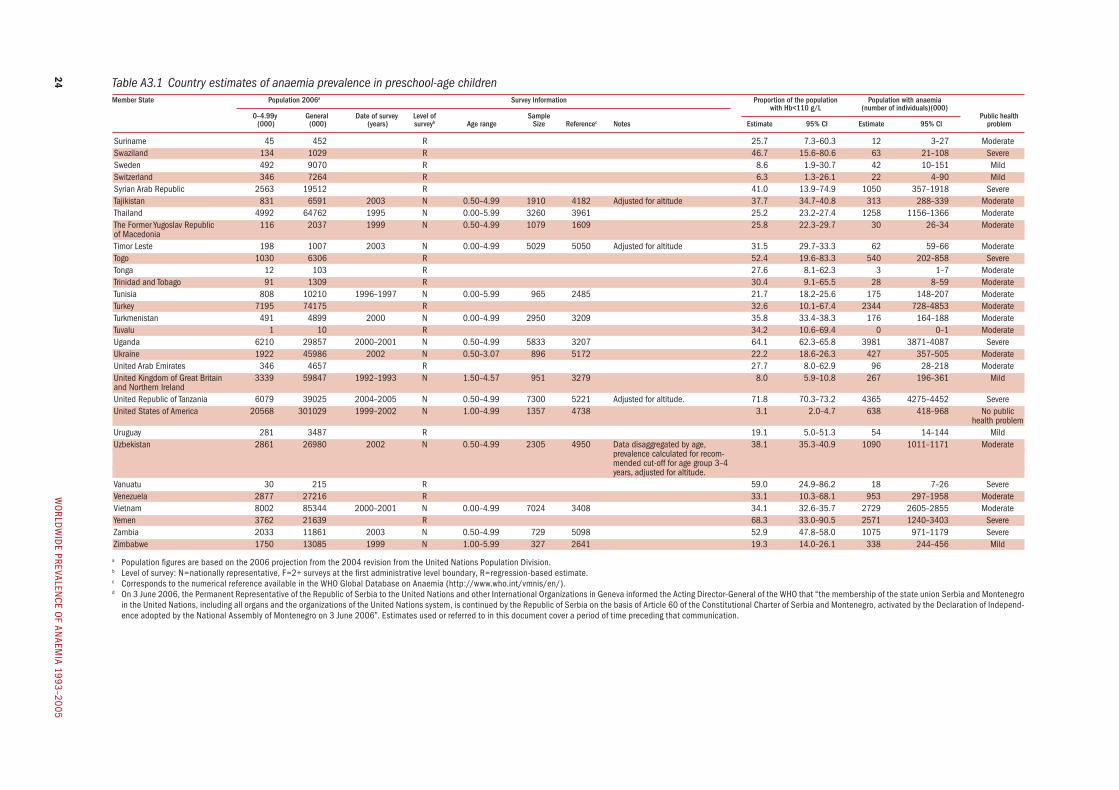
Table A3.1 Country estimates of anaemia prevalence in preschool-age childrenMember State Population 2006a Survey Information Proportion of the population Population with anaemia with Hb<110 g/L (number of individuals)(000) 0–4.99y General Date of survey Level of Sample Public health (000) (000) (years) surveyb Age range Size Referencec Notes Estimate 95% CI Estimate 95% CI problem
suriname 45 452 r 25.7 7.3–60.3 12 3–27 moderateswaziland 134 1029 r 46.7 15.6–80.6 63 21–108 severesweden 492 9070 r 8.6 1.9–30.7 42 10–151 mildswitzerland 346 7264 r 6.3 1.3–26.1 22 4–90 mildsyrian arab republic 2563 19512 r 41.0 13.9–74.9 1050 357–1918 severetajikistan 831 6591 2003 n 0.50–4.99 1910 4182 adjusted for altitude 37.7 34.7–40.8 313 288–339 moderatethailand 4992 64762 1995 n 0.00–5.99 3260 3961 25.2 23.2–27.4 1258 1156–1366 moderatethe former Yugoslav republic 116 2037 1999 n 0.50–4.99 1079 1609 25.8 22.3–29.7 30 26–34 moderateof macedonia timor leste 198 1007 2003 n 0.00–4.99 5029 5050 adjusted for altitude 31.5 29.7–33.3 62 59–66 moderatetogo 1030 6306 r 52.4 19.6–83.3 540 202–858 severetonga 12 103 r 27.6 8.1–62.3 3 1–7 moderatetrinidad and tobago 91 1309 r 30.4 9.1–65.5 28 8–59 moderatetunisia 808 10210 1996–1997 n 0.00–5.99 965 2485 21.7 18.2–25.6 175 148–207 moderateturkey 7195 74175 r 32.6 10.1–67.4 2344 728–4853 moderateturkmenistan 491 4899 2000 n 0.00–4.99 2950 3209 35.8 33.4–38.3 176 164–188 moderatetuvalu 1 10 r 34.2 10.6–69.4 0 0–1 moderateuganda 6210 29857 2000–2001 n 0.50–4.99 5833 3207 64.1 62.3–65.8 3981 3871–4087 severeukraine 1922 45986 2002 n 0.50–3.07 896 5172 22.2 18.6–26.3 427 357–505 moderateunited arab emirates 346 4657 r 27.7 8.0–62.9 96 28–218 moderateunited Kingdom of Great Britain 3339 59847 1992–1993 n 1.50–4.57 951 3279 8.0 5.9–10.8 267 196–361 mildand northern Irelandunited republic of tanzania 6079 39025 2004–2005 n 0.50–4.99 7300 5221 adjusted for altitude. 71.8 70.3–73.2 4365 4275–4452 severeunited states of america 20568 301029 1999–2002 n 1.00–4.99 1357 4738 3.1 2.0–4.7 638 418–968 no public health problemuruguay 281 3487 r 19.1 5.0–51.3 54 14–144 milduzbekistan 2861 26980 2002 n 0.50–4.99 2305 4950 data disaggregated by age, 38.1 35.3–40.9 1090 1011–1171 moderate prevalence calculated for recom- mended cut-off for age group 3–4 years, adjusted for altitude. vanuatu 30 215 r 59.0 24.9–86.2 18 7–26 severevenezuela 2877 27216 r 33.1 10.3–68.1 953 297–1958 moderatevietnam 8002 85344 2000–2001 n 0.00–4.99 7024 3408 34.1 32.6–35.7 2729 2605–2855 moderateYemen 3762 21639 r 68.3 33.0–90.5 2571 1240–3403 severeZambia 2033 11861 2003 n 0.50–4.99 729 5098 52.9 47.8–58.0 1075 971–1179 severeZimbabwe 1750 13085 1999 n 1.00–5.99 327 2641 19.3 14.0–26.1 338 244–456 mild
a population figures are based on the 2006 projection from the 2004 revision from the united nations population division. b level of survey: n=nationally representative, f=2+ surveys at the first administrative level boundary, r=regression-based estimate. c corresponds to the numerical reference available in the who Global database on anaemia (http://www.who.int/vmnis/en/).d on 3 June 2006, the permanent representative of the republic of serbia to the united nations and other International organizations in Geneva informed the acting director-General of the who that “the membership of the state union serbia and montenegro
in the united nations, including all organs and the organizations of the united nations system, is continued by the republic of serbia on the basis of article 60 of the constitutional charter of serbia and montenegro, activated by the declaration of Independ-ence adopted by the national assembly of montenegro on 3 June 2006”. estimates used or referred to in this document cover a period of time preceding that communication.
wo
rldw
Ide prevalen
ce of an
aemIa 1993–2005
24
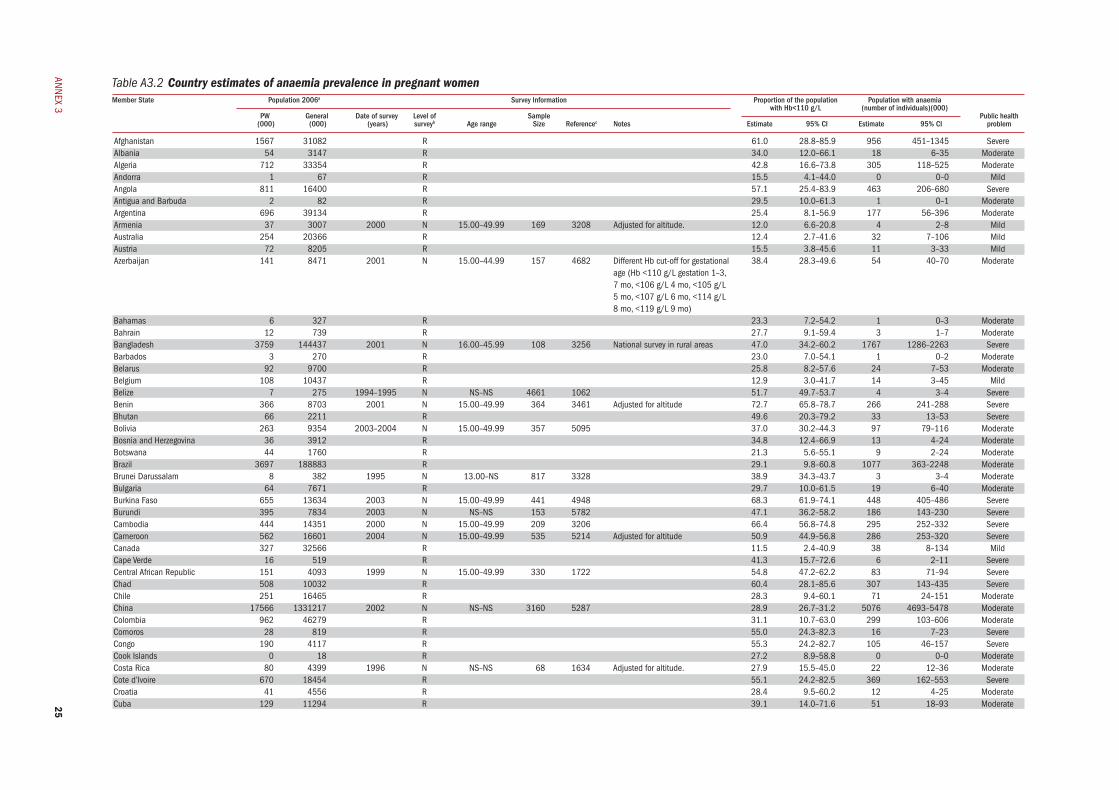
ann
ex 3
Table A3.2 Country estimates of anaemia prevalence in pregnant womenMember State Population 2006a Survey Information Proportion of the population Population with anaemia with Hb<110 g/L (number of individuals)(000) PW General Date of survey Level of Sample Public health (000) (000) (years) surveyb Age range Size Referencec Notes Estimate 95% CI Estimate 95% CI problem
afghanistan 1567 31082 r 61.0 28.8–85.9 956 451–1345 severealbania 54 3147 r 34.0 12.0–66.1 18 6–35 moderatealgeria 712 33354 r 42.8 16.6–73.8 305 118–525 moderateandorra 1 67 r 15.5 4.1–44.0 0 0–0 mildangola 811 16400 r 57.1 25.4–83.9 463 206–680 severeantigua and Barbuda 2 82 r 29.5 10.0–61.3 1 0–1 moderateargentina 696 39134 r 25.4 8.1–56.9 177 56–396 moderatearmenia 37 3007 2000 n 15.00–49.99 169 3208 adjusted for altitude. 12.0 6.6–20.8 4 2–8 mildaustralia 254 20366 r 12.4 2.7–41.6 32 7–106 mildaustria 72 8205 r 15.5 3.8–45.6 11 3–33 mildazerbaijan 141 8471 2001 n 15.00–44.99 157 4682 different hb cut-off for gestational 38.4 28.3–49.6 54 40–70 moderate age (hb <110 g/l gestation 1–3, 7 mo, <106 g/l 4 mo, <105 g/l 5 mo, <107 g/l 6 mo, <114 g/l 8 mo, <119 g/l 9 mo) Bahamas 6 327 r 23.3 7.2–54.2 1 0–3 moderateBahrain 12 739 r 27.7 9.1–59.4 3 1–7 moderateBangladesh 3759 144437 2001 n 16.00–45.99 108 3256 national survey in rural areas 47.0 34.2–60.2 1767 1286–2263 severeBarbados 3 270 r 23.0 7.0–54.1 1 0–2 moderateBelarus 92 9700 r 25.8 8.2–57.6 24 7–53 moderateBelgium 108 10437 r 12.9 3.0–41.7 14 3–45 mildBelize 7 275 1994–1995 n ns–ns 4661 1062 51.7 49.7–53.7 4 3–4 severeBenin 366 8703 2001 n 15.00–49.99 364 3461 adjusted for altitude 72.7 65.8–78.7 266 241–288 severeBhutan 66 2211 r 49.6 20.3–79.2 33 13–53 severeBolivia 263 9354 2003–2004 n 15.00–49.99 357 5095 37.0 30.2–44.3 97 79–116 moderateBosnia and herzegovina 36 3912 r 34.8 12.4–66.9 13 4–24 moderateBotswana 44 1760 r 21.3 5.6–55.1 9 2–24 moderateBrazil 3697 188883 r 29.1 9.8–60.8 1077 363–2248 moderateBrunei darussalam 8 382 1995 n 13.00–ns 817 3328 38.9 34.3–43.7 3 3–4 moderateBulgaria 64 7671 r 29.7 10.0–61.5 19 6–40 moderateBurkina faso 655 13634 2003 n 15.00–49.99 441 4948 68.3 61.9–74.1 448 405–486 severeBurundi 395 7834 2003 n ns–ns 153 5782 47.1 36.2–58.2 186 143–230 severecambodia 444 14351 2000 n 15.00–49.99 209 3206 66.4 56.8–74.8 295 252–332 severecameroon 562 16601 2004 n 15.00–49.99 535 5214 adjusted for altitude 50.9 44.9–56.8 286 253–320 severecanada 327 32566 r 11.5 2.4–40.9 38 8–134 mildcape verde 16 519 r 41.3 15.7–72.6 6 2–11 severecentral african republic 151 4093 1999 n 15.00–49.99 330 1722 54.8 47.2–62.2 83 71–94 severechad 508 10032 r 60.4 28.1–85.6 307 143–435 severechile 251 16465 r 28.3 9.4–60.1 71 24–151 moderatechina 17566 1331217 2002 n ns–ns 3160 5287 28.9 26.7–31.2 5076 4693–5478 moderatecolombia 962 46279 r 31.1 10.7–63.0 299 103–606 moderatecomoros 28 819 r 55.0 24.3–82.3 16 7–23 severecongo 190 4117 r 55.3 24.2–82.7 105 46–157 severecook Islands 0 18 r 27.2 8.9–58.8 0 0–0 moderatecosta rica 80 4399 1996 n ns–ns 68 1634 adjusted for altitude. 27.9 15.5–45.0 22 12–36 moderatecote d’Ivoire 670 18454 r 55.1 24.2–82.5 369 162–553 severecroatia 41 4556 r 28.4 9.5–60.2 12 4–25 moderatecuba 129 11294 r 39.1 14.0–71.6 51 18–93 moderate25
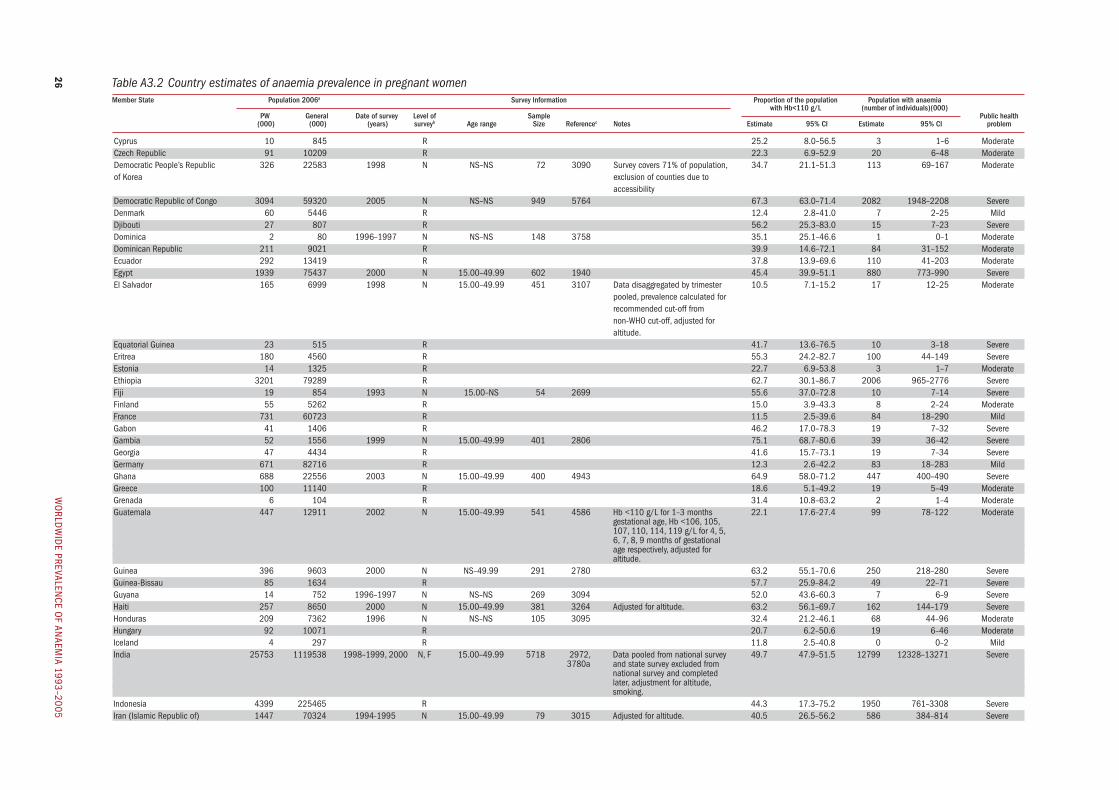
Table A3.2 Country estimates of anaemia prevalence in pregnant womenMember State Population 2006a Survey Information Proportion of the population Population with anaemia with Hb<110 g/L (number of individuals)(000) PW General Date of survey Level of Sample Public health (000) (000) (years) surveyb Age range Size Referencec Notes Estimate 95% CI Estimate 95% CI problem
cyprus 10 845 r 25.2 8.0–56.5 3 1–6 moderateczech republic 91 10209 r 22.3 6.9–52.9 20 6–48 moderatedemocratic people’s republic 326 22583 1998 n ns–ns 72 3090 survey covers 71% of population, 34.7 21.1–51.3 113 69–167 moderateof Korea exclusion of counties due to accessibilitydemocratic republic of congo 3094 59320 2005 n ns–ns 949 5764 67.3 63.0–71.4 2082 1948–2208 severedenmark 60 5446 r 12.4 2.8–41.0 7 2–25 milddjibouti 27 807 r 56.2 25.3–83.0 15 7–23 severedominica 2 80 1996–1997 n ns–ns 148 3758 35.1 25.1–46.6 1 0–1 moderatedominican republic 211 9021 r 39.9 14.6–72.1 84 31–152 moderateecuador 292 13419 r 37.8 13.9–69.6 110 41–203 moderateegypt 1939 75437 2000 n 15.00–49.99 602 1940 45.4 39.9–51.1 880 773–990 severeel salvador 165 6999 1998 n 15.00–49.99 451 3107 data disaggregated by trimester 10.5 7.1–15.2 17 12–25 moderate pooled, prevalence calculated for recommended cut-off from non-who cut-off, adjusted for altitude. equatorial Guinea 23 515 r 41.7 13.6–76.5 10 3–18 severeeritrea 180 4560 r 55.3 24.2–82.7 100 44–149 severeestonia 14 1325 r 22.7 6.9–53.8 3 1–7 moderateethiopia 3201 79289 r 62.7 30.1–86.7 2006 965–2776 severefiji 19 854 1993 n 15.00–ns 54 2699 55.6 37.0–72.8 10 7–14 severefinland 55 5262 r 15.0 3.9–43.3 8 2–24 moderatefrance 731 60723 r 11.5 2.5–39.6 84 18–290 mildGabon 41 1406 r 46.2 17.0–78.3 19 7–32 severeGambia 52 1556 1999 n 15.00–49.99 401 2806 75.1 68.7–80.6 39 36–42 severeGeorgia 47 4434 r 41.6 15.7–73.1 19 7–34 severeGermany 671 82716 r 12.3 2.6–42.2 83 18–283 mildGhana 688 22556 2003 n 15.00–49.99 400 4943 64.9 58.0–71.2 447 400–490 severeGreece 100 11140 r 18.6 5.1–49.2 19 5–49 moderateGrenada 6 104 r 31.4 10.8–63.2 2 1–4 moderateGuatemala 447 12911 2002 n 15.00–49.99 541 4586 hb <110 g/l for 1–3 months 22.1 17.6–27.4 99 78–122 moderate gestational age, hb <106, 105, 107, 110, 114, 119 g/l for 4, 5, 6, 7, 8, 9 months of gestational age respectively, adjusted for altitude. Guinea 396 9603 2000 n ns–49.99 291 2780 63.2 55.1–70.6 250 218–280 severeGuinea-Bissau 85 1634 r 57.7 25.9–84.2 49 22–71 severeGuyana 14 752 1996–1997 n ns–ns 269 3094 52.0 43.6–60.3 7 6–9 severehaiti 257 8650 2000 n 15.00–49.99 381 3264 adjusted for altitude. 63.2 56.1–69.7 162 144–179 severehonduras 209 7362 1996 n ns–ns 105 3095 32.4 21.2–46.1 68 44–96 moderatehungary 92 10071 r 20.7 6.2–50.6 19 6–46 moderateIceland 4 297 r 11.8 2.5–40.8 0 0–2 mildIndia 25753 1119538 1998–1999, 2000 n, f 15.00–49.99 5718 2972, data pooled from national survey 49.7 47.9–51.5 12799 12328–13271 severe 3780a and state survey excluded from national survey and completed later, adjustment for altitude, smoking. Indonesia 4399 225465 r 44.3 17.3–75.2 1950 761–3308 severeIran (Islamic republic of) 1447 70324 1994-1995 n 15.00–49.99 79 3015 adjusted for altitude. 40.5 26.5–56.2 586 384–814 severe
wo
rldw
Ide prevalen
ce of an
aemIa 1993–2005
26
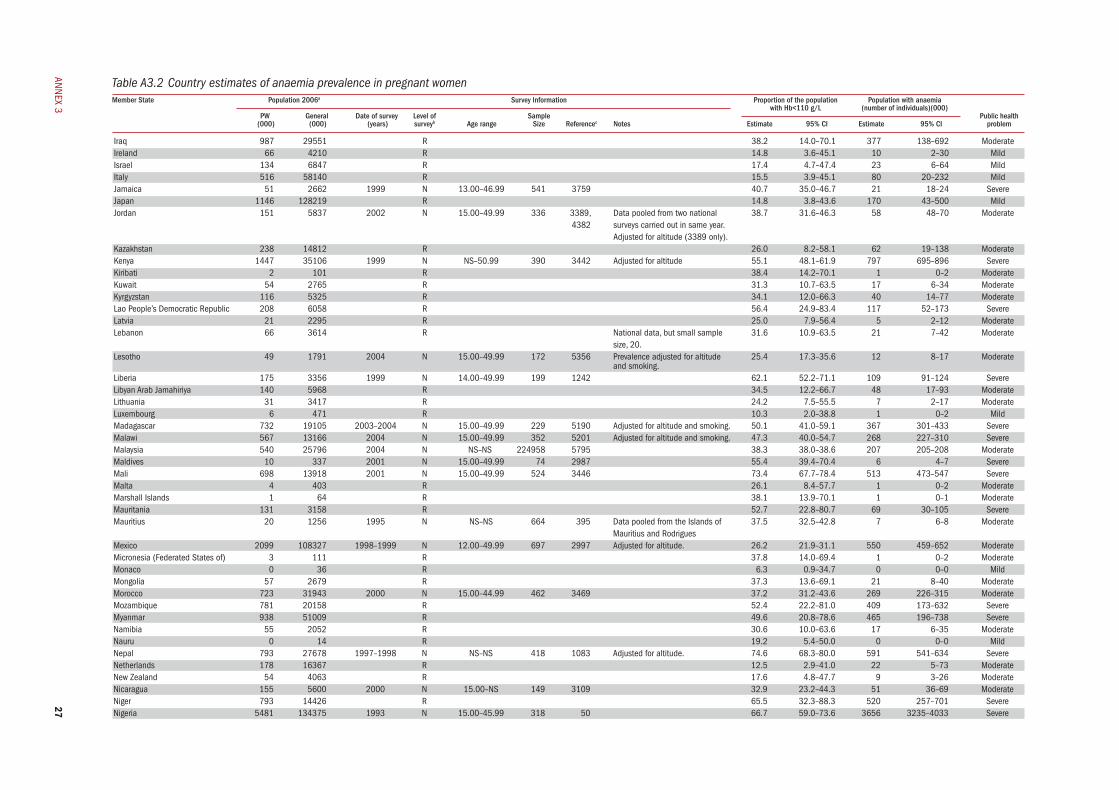
ann
ex 3
Table A3.2 Country estimates of anaemia prevalence in pregnant womenMember State Population 2006a Survey Information Proportion of the population Population with anaemia with Hb<110 g/L (number of individuals)(000) PW General Date of survey Level of Sample Public health (000) (000) (years) surveyb Age range Size Referencec Notes Estimate 95% CI Estimate 95% CI problem
Iraq 987 29551 r 38.2 14.0–70.1 377 138–692 moderateIreland 66 4210 r 14.8 3.6–45.1 10 2–30 mildIsrael 134 6847 r 17.4 4.7–47.4 23 6–64 mildItaly 516 58140 r 15.5 3.9–45.1 80 20–232 mildJamaica 51 2662 1999 n 13.00–46.99 541 3759 40.7 35.0–46.7 21 18–24 severeJapan 1146 128219 r 14.8 3.8–43.6 170 43–500 mildJordan 151 5837 2002 n 15.00–49.99 336 3389, data pooled from two national 38.7 31.6–46.3 58 48–70 moderate 4382 surveys carried out in same year. adjusted for altitude (3389 only). Kazakhstan 238 14812 r 26.0 8.2–58.1 62 19–138 moderateKenya 1447 35106 1999 n ns–50.99 390 3442 adjusted for altitude 55.1 48.1–61.9 797 695–896 severeKiribati 2 101 r 38.4 14.2–70.1 1 0–2 moderateKuwait 54 2765 r 31.3 10.7–63.5 17 6–34 moderateKyrgyzstan 116 5325 r 34.1 12.0–66.3 40 14–77 moderatelao people’s democratic republic 208 6058 r 56.4 24.9–83.4 117 52–173 severelatvia 21 2295 r 25.0 7.9–56.4 5 2–12 moderatelebanon 66 3614 r national data, but small sample 31.6 10.9–63.5 21 7–42 moderate size, 20. lesotho 49 1791 2004 n 15.00–49.99 172 5356 prevalence adjusted for altitude 25.4 17.3–35.6 12 8–17 moderate and smoking. liberia 175 3356 1999 n 14.00–49.99 199 1242 62.1 52.2–71.1 109 91–124 severelibyan arab Jamahiriya 140 5968 r 34.5 12.2–66.7 48 17–93 moderatelithuania 31 3417 r 24.2 7.5–55.5 7 2–17 moderateluxembourg 6 471 r 10.3 2.0–38.8 1 0–2 mildmadagascar 732 19105 2003–2004 n 15.00–49.99 229 5190 adjusted for altitude and smoking. 50.1 41.0–59.1 367 301–433 severemalawi 567 13166 2004 n 15.00–49.99 352 5201 adjusted for altitude and smoking. 47.3 40.0–54.7 268 227–310 severemalaysia 540 25796 2004 n ns–ns 224958 5795 38.3 38.0–38.6 207 205–208 moderatemaldives 10 337 2001 n 15.00–49.99 74 2987 55.4 39.4–70.4 6 4–7 severemali 698 13918 2001 n 15.00–49.99 524 3446 73.4 67.7–78.4 513 473–547 severemalta 4 403 r 26.1 8.4–57.7 1 0–2 moderatemarshall Islands 1 64 r 38.1 13.9–70.1 1 0–1 moderatemauritania 131 3158 r 52.7 22.8–80.7 69 30–105 severemauritius 20 1256 1995 n ns–ns 664 395 data pooled from the Islands of 37.5 32.5–42.8 7 6–8 moderate mauritius and rodriguesmexico 2099 108327 1998–1999 n 12.00–49.99 697 2997 adjusted for altitude. 26.2 21.9–31.1 550 459–652 moderatemicronesia (federated states of) 3 111 r 37.8 14.0–69.4 1 0–2 moderatemonaco 0 36 r 6.3 0.9–34.7 0 0–0 mildmongolia 57 2679 r 37.3 13.6–69.1 21 8–40 moderatemorocco 723 31943 2000 n 15.00–44.99 462 3469 37.2 31.2–43.6 269 226–315 moderatemozambique 781 20158 r 52.4 22.2–81.0 409 173–632 severemyanmar 938 51009 r 49.6 20.8–78.6 465 196–738 severenamibia 55 2052 r 30.6 10.0–63.6 17 6–35 moderatenauru 0 14 r 19.2 5.4–50.0 0 0–0 mildnepal 793 27678 1997–1998 n ns–ns 418 1083 adjusted for altitude. 74.6 68.3–80.0 591 541–634 severenetherlands 178 16367 r 12.5 2.9–41.0 22 5–73 moderatenew Zealand 54 4063 r 17.6 4.8–47.7 9 3–26 moderatenicaragua 155 5600 2000 n 15.00–ns 149 3109 32.9 23.2–44.3 51 36–69 moderateniger 793 14426 r 65.5 32.3–88.3 520 257–701 severenigeria 5481 134375 1993 n 15.00–45.99 318 50 66.7 59.0–73.6 3656 3235–4033 severe
27
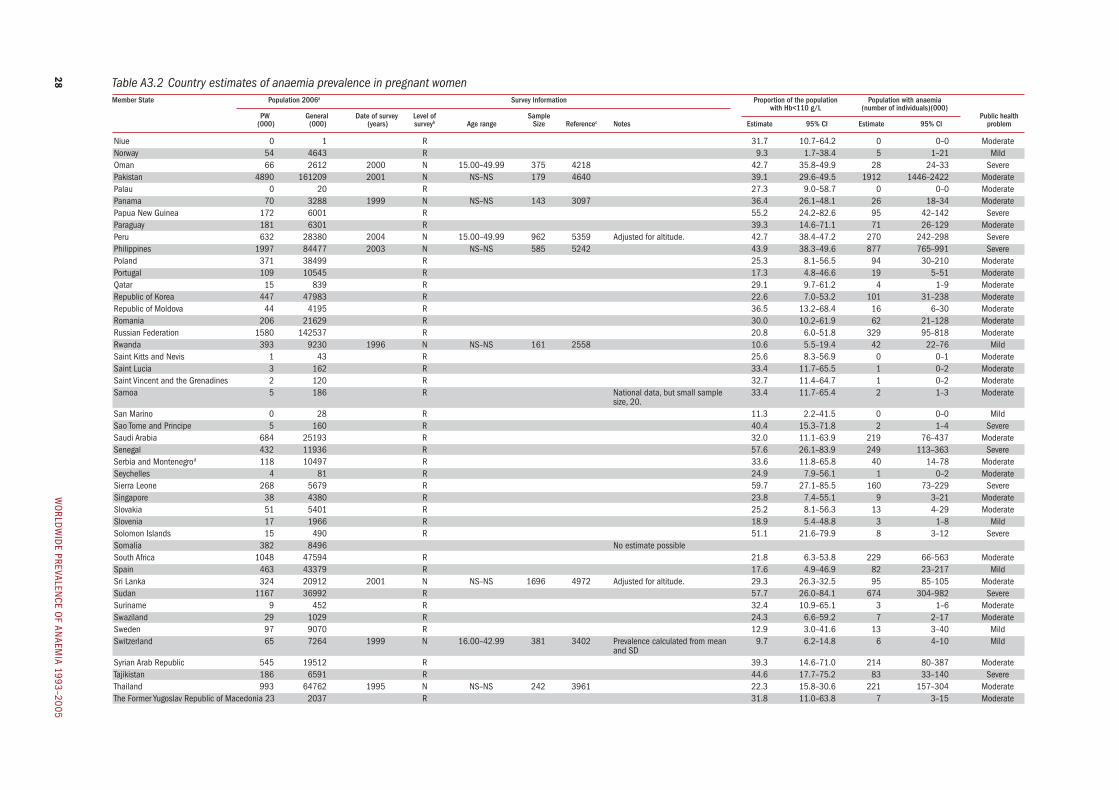
Table A3.2 Country estimates of anaemia prevalence in pregnant womenMember State Population 2006a Survey Information Proportion of the population Population with anaemia with Hb<110 g/L (number of individuals)(000) PW General Date of survey Level of Sample Public health (000) (000) (years) surveyb Age range Size Referencec Notes Estimate 95% CI Estimate 95% CI problem
niue 0 1 r 31.7 10.7–64.2 0 0–0 moderatenorway 54 4643 r 9.3 1.7–38.4 5 1–21 mildoman 66 2612 2000 n 15.00–49.99 375 4218 42.7 35.8–49.9 28 24–33 severepakistan 4890 161209 2001 n ns–ns 179 4640 39.1 29.6–49.5 1912 1446–2422 moderatepalau 0 20 r 27.3 9.0–58.7 0 0–0 moderatepanama 70 3288 1999 n ns–ns 143 3097 36.4 26.1–48.1 26 18–34 moderatepapua new Guinea 172 6001 r 55.2 24.2–82.6 95 42–142 severeparaguay 181 6301 r 39.3 14.6–71.1 71 26–129 moderateperu 632 28380 2004 n 15.00–49.99 962 5359 adjusted for altitude. 42.7 38.4–47.2 270 242–298 severephilippines 1997 84477 2003 n ns–ns 585 5242 43.9 38.3–49.6 877 765–991 severepoland 371 38499 r 25.3 8.1–56.5 94 30–210 moderateportugal 109 10545 r 17.3 4.8–46.6 19 5–51 moderateQatar 15 839 r 29.1 9.7–61.2 4 1–9 moderaterepublic of Korea 447 47983 r 22.6 7.0–53.2 101 31–238 moderaterepublic of moldova 44 4195 r 36.5 13.2–68.4 16 6–30 moderateromania 206 21629 r 30.0 10.2–61.9 62 21–128 moderaterussian federation 1580 142537 r 20.8 6.0–51.8 329 95–818 moderaterwanda 393 9230 1996 n ns–ns 161 2558 10.6 5.5–19.4 42 22–76 mildsaint Kitts and nevis 1 43 r 25.6 8.3–56.9 0 0–1 moderatesaint lucia 3 162 r 33.4 11.7–65.5 1 0–2 moderatesaint vincent and the Grenadines 2 120 r 32.7 11.4–64.7 1 0–2 moderatesamoa 5 186 r national data, but small sample 33.4 11.7–65.4 2 1–3 moderate size, 20. san marino 0 28 r 11.3 2.2–41.5 0 0–0 mildsao tome and principe 5 160 r 40.4 15.3–71.8 2 1–4 severesaudi arabia 684 25193 r 32.0 11.1–63.9 219 76–437 moderatesenegal 432 11936 r 57.6 26.1–83.9 249 113–363 severeserbia and montenegrod 118 10497 r 33.6 11.8–65.8 40 14–78 moderateseychelles 4 81 r 24.9 7.9–56.1 1 0–2 moderatesierra leone 268 5679 r 59.7 27.1–85.5 160 73–229 severesingapore 38 4380 r 23.8 7.4–55.1 9 3–21 moderateslovakia 51 5401 r 25.2 8.1–56.3 13 4–29 moderateslovenia 17 1966 r 18.9 5.4–48.8 3 1–8 mildsolomon Islands 15 490 r 51.1 21.6–79.9 8 3–12 severesomalia 382 8496 no estimate possible south africa 1048 47594 r 21.8 6.3–53.8 229 66–563 moderatespain 463 43379 r 17.6 4.9–46.9 82 23–217 mildsri lanka 324 20912 2001 n ns–ns 1696 4972 adjusted for altitude. 29.3 26.3–32.5 95 85–105 moderatesudan 1167 36992 r 57.7 26.0–84.1 674 304–982 severesuriname 9 452 r 32.4 10.9–65.1 3 1–6 moderateswaziland 29 1029 r 24.3 6.6–59.2 7 2–17 moderatesweden 97 9070 r 12.9 3.0–41.6 13 3–40 mildswitzerland 65 7264 1999 n 16.00–42.99 381 3402 prevalence calculated from mean 9.7 6.2–14.8 6 4–10 mild and sdsyrian arab republic 545 19512 r 39.3 14.6–71.0 214 80–387 moderatetajikistan 186 6591 r 44.6 17.7–75.2 83 33–140 severethailand 993 64762 1995 n ns–ns 242 3961 22.3 15.8–30.6 221 157–304 moderatethe former Yugoslav republic of macedonia 23 2037 r 31.8 11.0–63.8 7 3–15 moderate
wo
rldw
Ide prevalen
ce of an
aemIa 1993–2005
28
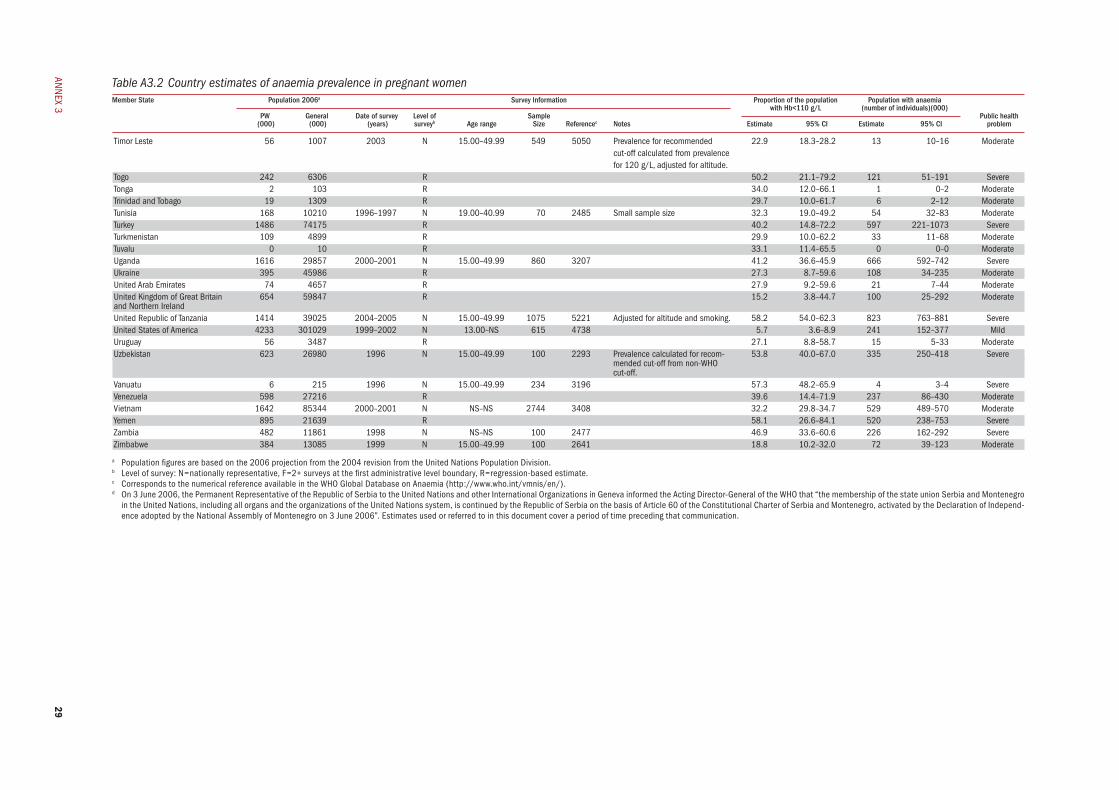
ann
ex 3
Table A3.2 Country estimates of anaemia prevalence in pregnant womenMember State Population 2006a Survey Information Proportion of the population Population with anaemia with Hb<110 g/L (number of individuals)(000) PW General Date of survey Level of Sample Public health (000) (000) (years) surveyb Age range Size Referencec Notes Estimate 95% CI Estimate 95% CI problem
timor leste 56 1007 2003 n 15.00–49.99 549 5050 prevalence for recommended 22.9 18.3–28.2 13 10–16 moderate cut-off calculated from prevalence for 120 g/l, adjusted for altitude. togo 242 6306 r 50.2 21.1–79.2 121 51–191 severetonga 2 103 r 34.0 12.0–66.1 1 0–2 moderatetrinidad and tobago 19 1309 r 29.7 10.0–61.7 6 2–12 moderatetunisia 168 10210 1996–1997 n 19.00–40.99 70 2485 small sample size 32.3 19.0–49.2 54 32–83 moderateturkey 1486 74175 r 40.2 14.8–72.2 597 221–1073 severeturkmenistan 109 4899 r 29.9 10.0–62.2 33 11–68 moderatetuvalu 0 10 r 33.1 11.4–65.5 0 0–0 moderateuganda 1616 29857 2000–2001 n 15.00–49.99 860 3207 41.2 36.6–45.9 666 592–742 severeukraine 395 45986 r 27.3 8.7–59.6 108 34–235 moderateunited arab emirates 74 4657 r 27.9 9.2–59.6 21 7–44 moderateunited Kingdom of Great Britain 654 59847 r 15.2 3.8–44.7 100 25–292 moderateand northern Ireland united republic of tanzania 1414 39025 2004–2005 n 15.00–49.99 1075 5221 adjusted for altitude and smoking. 58.2 54.0–62.3 823 763–881 severeunited states of america 4233 301029 1999–2002 n 13.00–ns 615 4738 5.7 3.6–8.9 241 152–377 milduruguay 56 3487 r 27.1 8.8–58.7 15 5–33 moderateuzbekistan 623 26980 1996 n 15.00–49.99 100 2293 prevalence calculated for recom- 53.8 40.0–67.0 335 250–418 severe mended cut-off from non-who cut-off. vanuatu 6 215 1996 n 15.00–49.99 234 3196 57.3 48.2–65.9 4 3–4 severevenezuela 598 27216 r 39.6 14.4–71.9 237 86–430 moderatevietnam 1642 85344 2000–2001 n ns–ns 2744 3408 32.2 29.8–34.7 529 489–570 moderateYemen 895 21639 r 58.1 26.6–84.1 520 238–753 severeZambia 482 11861 1998 n ns–ns 100 2477 46.9 33.6–60.6 226 162–292 severeZimbabwe 384 13085 1999 n 15.00–49.99 100 2641 18.8 10.2–32.0 72 39–123 moderate
a population figures are based on the 2006 projection from the 2004 revision from the united nations population division. b level of survey: n=nationally representative, f=2+ surveys at the first administrative level boundary, r=regression-based estimate. c corresponds to the numerical reference available in the who Global database on anaemia (http://www.who.int/vmnis/en/).d on 3 June 2006, the permanent representative of the republic of serbia to the united nations and other International organizations in Geneva informed the acting director-General of the who that “the membership of the state union serbia and montenegro
in the united nations, including all organs and the organizations of the united nations system, is continued by the republic of serbia on the basis of article 60 of the constitutional charter of serbia and montenegro, activated by the declaration of Independ-ence adopted by the national assembly of montenegro on 3 June 2006”. estimates used or referred to in this document cover a period of time preceding that communication.
29
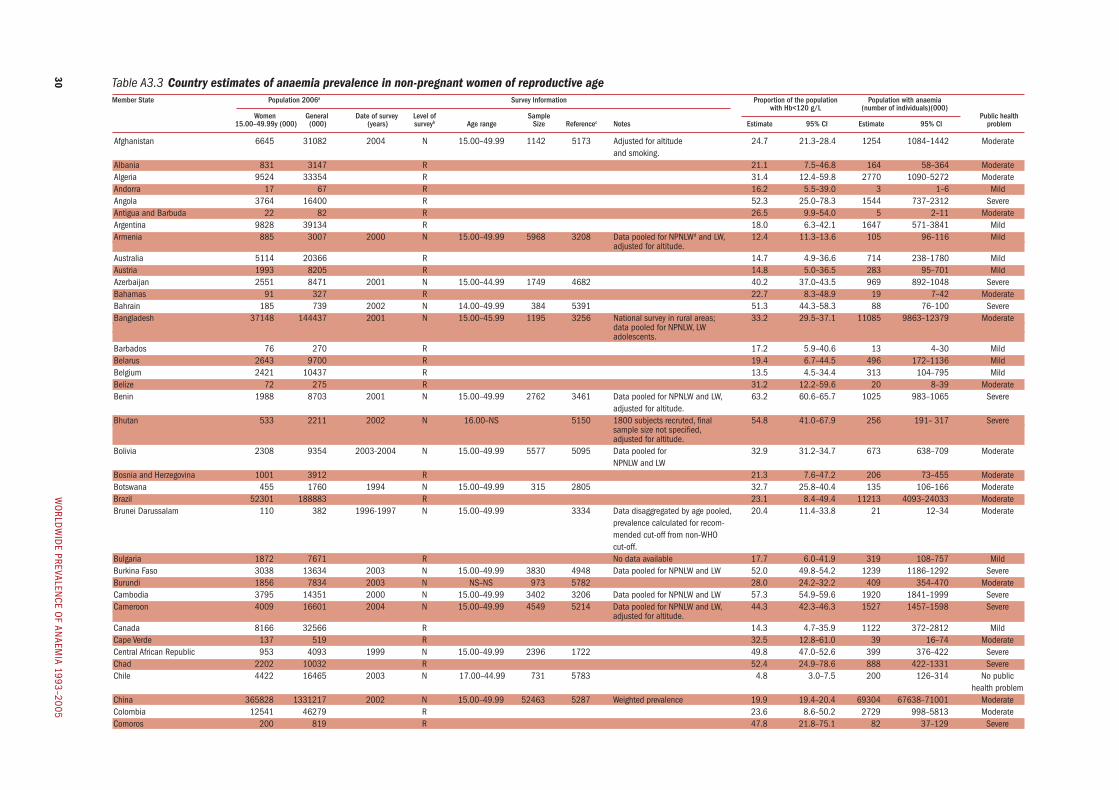
Table A3.3 Country estimates of anaemia prevalence in non-pregnant women of reproductive ageMember State Population 2006a Survey Information Proportion of the population Population with anaemia with Hb<120 g/L (number of individuals)(000) Women General Date of survey Level of Sample Public health 15.00–49.99y (000) (000) (years) surveyb Age range Size Referencec Notes Estimate 95% CI Estimate 95% CI problem
afghanistan 6645 31082 2004 n 15.00–49.99 1142 5173 adjusted for altitude 24.7 21.3–28.4 1254 1084–1442 moderate and smoking. albania 831 3147 r 21.1 7.5–46.8 164 58–364 moderatealgeria 9524 33354 r 31.4 12.4–59.8 2770 1090–5272 moderateandorra 17 67 r 16.2 5.5–39.0 3 1–6 mildangola 3764 16400 r 52.3 25.0–78.3 1544 737–2312 severeantigua and Barbuda 22 82 r 26.5 9.9–54.0 5 2–11 moderateargentina 9828 39134 r 18.0 6.3–42.1 1647 571–3841 mildarmenia 885 3007 2000 n 15.00–49.99 5968 3208 data pooled for npnlwd and lw, 12.4 11.3–13.6 105 96–116 mild adjusted for altitude. australia 5114 20366 r 14.7 4.9–36.6 714 238–1780 mildaustria 1993 8205 r 14.8 5.0–36.5 283 95–701 mildazerbaijan 2551 8471 2001 n 15.00–44.99 1749 4682 40.2 37.0–43.5 969 892–1048 severeBahamas 91 327 r 22.7 8.3–48.9 19 7–42 moderateBahrain 185 739 2002 n 14.00–49.99 384 5391 51.3 44.3–58.3 88 76–100 severeBangladesh 37148 144437 2001 n 15.00–45.99 1195 3256 national survey in rural areas; 33.2 29.5–37.1 11085 9863–12379 moderate data pooled for npnlw, lw adolescents. Barbados 76 270 r 17.2 5.9–40.6 13 4–30 mildBelarus 2643 9700 r 19.4 6.7–44.5 496 172–1136 mildBelgium 2421 10437 r 13.5 4.5–34.4 313 104–795 mildBelize 72 275 r 31.2 12.2–59.6 20 8–39 moderateBenin 1988 8703 2001 n 15.00–49.99 2762 3461 data pooled for npnlw and lw, 63.2 60.6–65.7 1025 983–1065 severe adjusted for altitude. Bhutan 533 2211 2002 n 16.00–ns 5150 1800 subjects recruted, final 54.8 41.0–67.9 256 191– 317 severe sample size not specified, adjusted for altitude. Bolivia 2308 9354 2003-2004 n 15.00–49.99 5577 5095 data pooled for 32.9 31.2–34.7 673 638–709 moderate npnlw and lwBosnia and herzegovina 1001 3912 r 21.3 7.6–47.2 206 73–455 moderateBotswana 455 1760 1994 n 15.00–49.99 315 2805 32.7 25.8–40.4 135 106–166 moderateBrazil 52301 188883 r 23.1 8.4–49.4 11213 4093–24033 moderateBrunei darussalam 110 382 1996-1997 n 15.00–49.99 3334 data disaggregated by age pooled, 20.4 11.4–33.8 21 12–34 moderate prevalence calculated for recom- mended cut-off from non-who cut-off. Bulgaria 1872 7671 r no data available 17.7 6.0–41.9 319 108–757 mildBurkina faso 3038 13634 2003 n 15.00–49.99 3830 4948 data pooled for npnlw and lw 52.0 49.8–54.2 1239 1186–1292 severeBurundi 1856 7834 2003 n ns–ns 973 5782 28.0 24.2–32.2 409 354–470 moderatecambodia 3795 14351 2000 n 15.00–49.99 3402 3206 data pooled for npnlw and lw 57.3 54.9–59.6 1920 1841–1999 severecameroon 4009 16601 2004 n 15.00–49.99 4549 5214 data pooled for npnlw and lw, 44.3 42.3–46.3 1527 1457–1598 severe adjusted for altitude. canada 8166 32566 r 14.3 4.7–35.9 1122 372–2812 mildcape verde 137 519 r 32.5 12.8–61.0 39 16–74 moderatecentral african republic 953 4093 1999 n 15.00–49.99 2396 1722 49.8 47.0–52.6 399 376–422 severechad 2202 10032 r 52.4 24.9–78.6 888 422–1331 severechile 4422 16465 2003 n 17.00–44.99 731 5783 4.8 3.0–7.5 200 126–314 no public health problemchina 365828 1331217 2002 n 15.00–49.99 52463 5287 weighted prevalence 19.9 19.4–20.4 69304 67638–71001 moderatecolombia 12541 46279 r 23.6 8.6–50.2 2729 998–5813 moderatecomoros 200 819 r 47.8 21.8–75.1 82 37–129 severe
wo
rldw
Ide prevalen
ce of an
aemIa 1993–2005
30
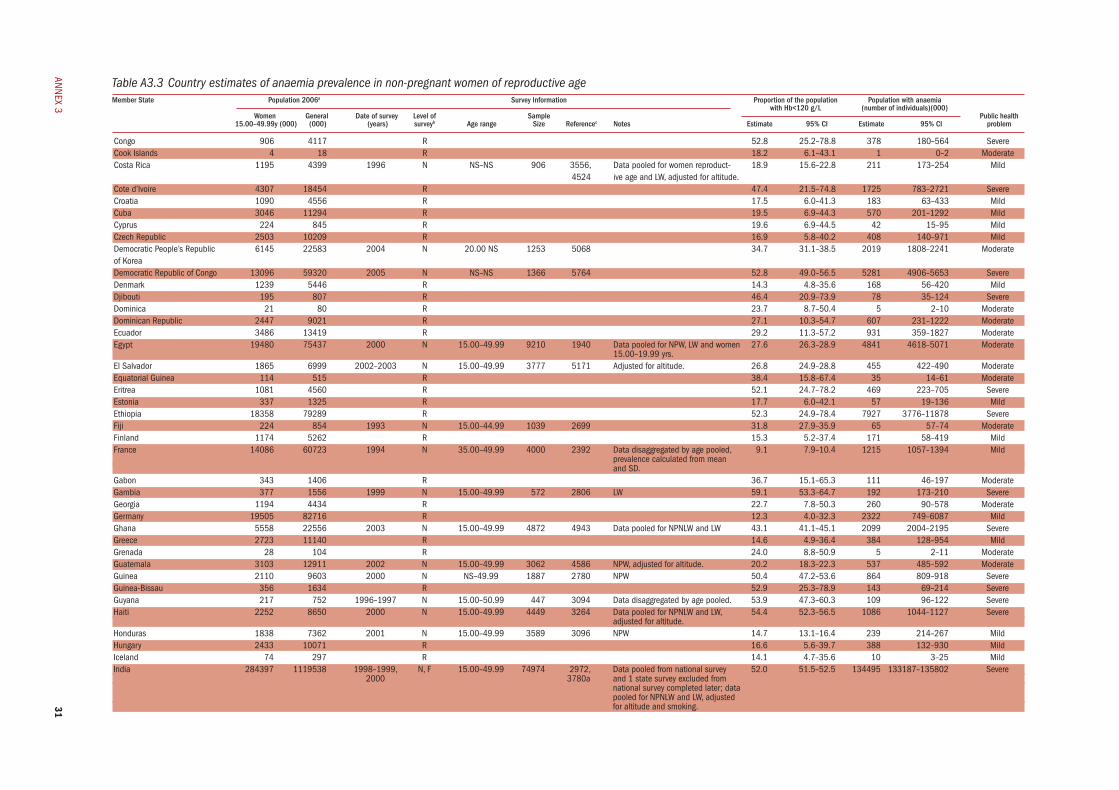
ann
ex 3
Table A3.3 Country estimates of anaemia prevalence in non-pregnant women of reproductive ageMember State Population 2006a Survey Information Proportion of the population Population with anaemia with Hb<120 g/L (number of individuals)(000) Women General Date of survey Level of Sample Public health 15.00–49.99y (000) (000) (years) surveyb Age range Size Referencec Notes Estimate 95% CI Estimate 95% CI problem
congo 906 4117 r 52.8 25.2–78.8 378 180–564 severecook Islands 4 18 r 18.2 6.1–43.1 1 0–2 moderatecosta rica 1195 4399 1996 n ns–ns 906 3556, data pooled for women reproduct- 18.9 15.6–22.8 211 173–254 mild 4524 ive age and lw, adjusted for altitude. cote d’Ivoire 4307 18454 r 47.4 21.5–74.8 1725 783–2721 severecroatia 1090 4556 r 17.5 6.0–41.3 183 63–433 mildcuba 3046 11294 r 19.5 6.9–44.3 570 201–1292 mildcyprus 224 845 r 19.6 6.9–44.5 42 15–95 mildczech republic 2503 10209 r 16.9 5.8–40.2 408 140–971 milddemocratic people’s republic 6145 22583 2004 n 20.00 ns 1253 5068 34.7 31.1–38.5 2019 1808–2241 moderateof Korea democratic republic of congo 13096 59320 2005 n ns–ns 1366 5764 52.8 49.0–56.5 5281 4906–5653 severedenmark 1239 5446 r 14.3 4.8–35.6 168 56–420 milddjibouti 195 807 r 46.4 20.9–73.9 78 35–124 severedominica 21 80 r 23.7 8.7–50.4 5 2–10 moderatedominican republic 2447 9021 r 27.1 10.3–54.7 607 231–1222 moderateecuador 3486 13419 r 29.2 11.3–57.2 931 359–1827 moderateegypt 19480 75437 2000 n 15.00–49.99 9210 1940 data pooled for npw, lw and women 27.6 26.3–28.9 4841 4618–5071 moderate 15.00–19.99 yrs. el salvador 1865 6999 2002–2003 n 15.00–49.99 3777 5171 adjusted for altitude. 26.8 24.9–28.8 455 422–490 moderateequatorial Guinea 114 515 r 38.4 15.8–67.4 35 14–61 moderateeritrea 1081 4560 r 52.1 24.7–78.2 469 223–705 severeestonia 337 1325 r 17.7 6.0–42.1 57 19–136 mildethiopia 18358 79289 r 52.3 24.9–78.4 7927 3776–11878 severefiji 224 854 1993 n 15.00–44.99 1039 2699 31.8 27.9–35.9 65 57–74 moderatefinland 1174 5262 r 15.3 5.2–37.4 171 58–419 mildfrance 14086 60723 1994 n 35.00–49.99 4000 2392 data disaggregated by age pooled, 9.1 7.9–10.4 1215 1057–1394 mild prevalence calculated from mean and sd. Gabon 343 1406 r 36.7 15.1–65.3 111 46–197 moderateGambia 377 1556 1999 n 15.00–49.99 572 2806 lw 59.1 53.3–64.7 192 173–210 severeGeorgia 1194 4434 r 22.7 7.8–50.3 260 90–578 moderateGermany 19505 82716 r 12.3 4.0–32.3 2322 749–6087 mildGhana 5558 22556 2003 n 15.00–49.99 4872 4943 data pooled for npnlw and lw 43.1 41.1–45.1 2099 2004–2195 severeGreece 2723 11140 r 14.6 4.9–36.4 384 128–954 mildGrenada 28 104 r 24.0 8.8–50.9 5 2–11 moderateGuatemala 3103 12911 2002 n 15.00–49.99 3062 4586 npw, adjusted for altitude. 20.2 18.3–22.3 537 485–592 moderateGuinea 2110 9603 2000 n ns–49.99 1887 2780 npw 50.4 47.2–53.6 864 809–918 severeGuinea-Bissau 356 1634 r 52.9 25.3–78.9 143 69–214 severeGuyana 217 752 1996–1997 n 15.00–50.99 447 3094 data disaggregated by age pooled. 53.9 47.3–60.3 109 96–122 severehaiti 2252 8650 2000 n 15.00–49.99 4449 3264 data pooled for npnlw and lw, 54.4 52.3–56.5 1086 1044–1127 severe adjusted for altitude. honduras 1838 7362 2001 n 15.00–49.99 3589 3096 npw 14.7 13.1–16.4 239 214–267 mildhungary 2433 10071 r 16.6 5.6–39.7 388 132–930 mildIceland 74 297 r 14.1 4.7–35.6 10 3–25 mildIndia 284397 1119538 1998–1999, n, f 15.00–49.99 74974 2972, data pooled from national survey 52.0 51.5–52.5 134495 133187–135802 severe 2000 3780a and 1 state survey excluded from national survey completed later; data pooled for npnlw and lw, adjusted for altitude and smoking. 31
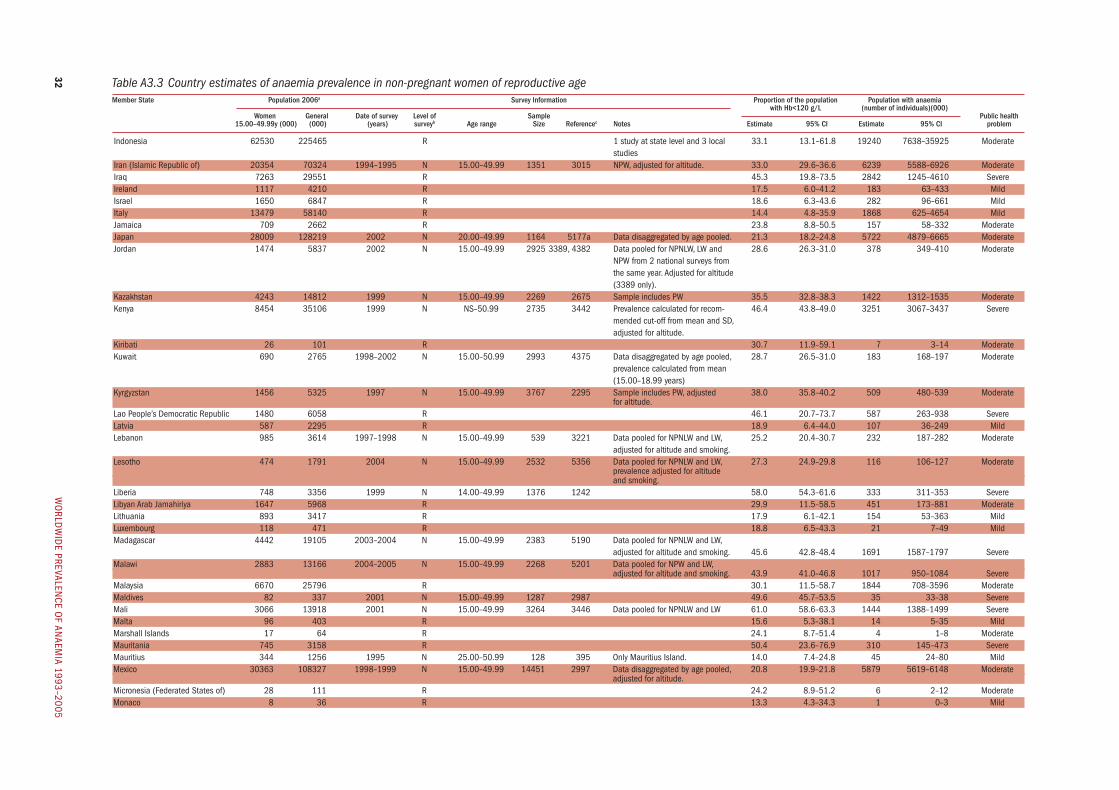
Table A3.3 Country estimates of anaemia prevalence in non-pregnant women of reproductive ageMember State Population 2006a Survey Information Proportion of the population Population with anaemia with Hb<120 g/L (number of individuals)(000) Women General Date of survey Level of Sample Public health 15.00–49.99y (000) (000) (years) surveyb Age range Size Referencec Notes Estimate 95% CI Estimate 95% CI problem
Indonesia 62530 225465 r 1 study at state level and 3 local 33.1 13.1–61.8 19240 7638–35925 moderate studiesIran (Islamic republic of) 20354 70324 1994–1995 n 15.00–49.99 1351 3015 npw, adjusted for altitude. 33.0 29.6–36.6 6239 5588–6926 moderateIraq 7263 29551 r 45.3 19.8–73.5 2842 1245–4610 severeIreland 1117 4210 r 17.5 6.0–41.2 183 63–433 mildIsrael 1650 6847 r 18.6 6.3–43.6 282 96–661 mildItaly 13479 58140 r 14.4 4.8–35.9 1868 625–4654 mildJamaica 709 2662 r 23.8 8.8–50.5 157 58–332 moderateJapan 28009 128219 2002 n 20.00–49.99 1164 5177a data disaggregated by age pooled. 21.3 18.2–24.8 5722 4879–6665 moderateJordan 1474 5837 2002 n 15.00–49.99 2925 3389, 4382 data pooled for npnlw, lw and 28.6 26.3–31.0 378 349–410 moderate npw from 2 national surveys from the same year. adjusted for altitude (3389 only). Kazakhstan 4243 14812 1999 n 15.00–49.99 2269 2675 sample includes pw 35.5 32.8–38.3 1422 1312–1535 moderateKenya 8454 35106 1999 n ns–50.99 2735 3442 prevalence calculated for recom- 46.4 43.8–49.0 3251 3067–3437 severe mended cut-off from mean and sd, adjusted for altitude. Kiribati 26 101 r 30.7 11.9–59.1 7 3–14 moderateKuwait 690 2765 1998–2002 n 15.00–50.99 2993 4375 data disaggregated by age pooled, 28.7 26.5–31.0 183 168–197 moderate prevalence calculated from mean (15.00–18.99 years) Kyrgyzstan 1456 5325 1997 n 15.00–49.99 3767 2295 sample includes pw, adjusted 38.0 35.8–40.2 509 480–539 moderate for altitude. lao people’s democratic republic 1480 6058 r 46.1 20.7–73.7 587 263–938 severelatvia 587 2295 r 18.9 6.4–44.0 107 36–249 mildlebanon 985 3614 1997–1998 n 15.00–49.99 539 3221 data pooled for npnlw and lw, 25.2 20.4–30.7 232 187–282 moderate adjusted for altitude and smoking. lesotho 474 1791 2004 n 15.00–49.99 2532 5356 data pooled for npnlw and lw, 27.3 24.9–29.8 116 106–127 moderate prevalence adjusted for altitude and smoking. liberia 748 3356 1999 n 14.00–49.99 1376 1242 58.0 54.3–61.6 333 311–353 severelibyan arab Jamahiriya 1647 5968 r 29.9 11.5–58.5 451 173–881 moderatelithuania 893 3417 r 17.9 6.1–42.1 154 53–363 mildluxembourg 118 471 r 18.8 6.5–43.3 21 7–49 mildmadagascar 4442 19105 2003–2004 n 15.00–49.99 2383 5190 data pooled for npnlw and lw, adjusted for altitude and smoking. 45.6 42.8–48.4 1691 1587–1797 severemalawi 2883 13166 2004–2005 n 15.00–49.99 2268 5201 data pooled for npw and lw, adjusted for altitude and smoking. 43.9 41.0–46.8 1017 950–1084 severemalaysia 6670 25796 r 30.1 11.5–58.7 1844 708–3596 moderatemaldives 82 337 2001 n 15.00–49.99 1287 2987 49.6 45.7–53.5 35 33–38 severemali 3066 13918 2001 n 15.00–49.99 3264 3446 data pooled for npnlw and lw 61.0 58.6–63.3 1444 1388–1499 severemalta 96 403 r 15.6 5.3–38.1 14 5–35 mildmarshall Islands 17 64 r 24.1 8.7–51.4 4 1–8 moderatemauritania 745 3158 r 50.4 23.6–76.9 310 145–473 severemauritius 344 1256 1995 n 25.00–50.99 128 395 only mauritius Island. 14.0 7.4–24.8 45 24–80 mildmexico 30363 108327 1998–1999 n 15.00–49.99 14451 2997 data disaggregated by age pooled, 20.8 19.9–21.8 5879 5619–6148 moderate adjusted for altitude. micronesia (federated states of) 28 111 r 24.2 8.9–51.2 6 2–12 moderatemonaco 8 36 r 13.3 4.3–34.3 1 0–3 mild
wo
rldw
Ide prevalen
ce of an
aemIa 1993–2005
32

ann
ex 3
Table A3.3 Country estimates of anaemia prevalence in non-pregnant women of reproductive ageMember State Population 2006a Survey Information Proportion of the population Population with anaemia with Hb<120 g/L (number of individuals)(000) Women General Date of survey Level of Sample Public health 15.00–49.99y (000) (000) (years) surveyb Age range Size Referencec Notes Estimate 95% CI Estimate 95% CI problem
mongolia 787 2679 2004 n 15.00–49.99 211 5247 adjusted for altitude. 13.6 8.3–21.5 99 60–157 mildmorocco 8839 31943 2000 n 15.00–49.99 1784 3469 32.6 29.6–35.7 2646 2403–2901 moderatemozambique 4843 20158 2001–2002 n ns–ns 707 589 48.2 43.0–53.4 1958 1748–2169 severemyanmar 14248 51009 2001 n 15.00–44.99 1200 5246 npnlw 44.9 41.0–48.9 5976 5452–6509 severenamibia 499 2052 r 35.0 14.3–63.6 156 63–283 moderatenauru 4 14 r 25.7 9.5–53.3 1 0–2 moderatenepal 6969 27678 1997–1998 n ns–ns 3437 1083 npw, adjusted for altitude. 66.7 64.4–68.9 4120 3980–4255 severenetherlands 3872 16367 r 14.2 4.8–35.6 526 176–1316 mildnew Zealand 1022 4063 1996–1997 n 15.00–44.99 1088 3192 data disaggregated by age pooled, 10.2 7.9–13.0 99 77–126 mild prevalence calculated from mean. nicaragua 1447 5600 2002–2003 n ns–ns 432 4466 adjusted for altitude. 9.0 5.8–13.6 116 76–176 mildniger 3043 14426 r 62.2 32.8–84.7 1398 739–1904 severenigeria 30591 134375 1993 n 15.00–45.99 1859 50 62.0 58.8–65.1 15568 14774–16338 severeniue 0 1 r 11.9 3.6–32.6 0 0–0 mildnorway 1078 4643 r 13.3 4.4–34.0 136 45–348 mildoman 611 2612 2000 n 15.00–49.99 2766 4218 data pooled for women and female 34.0 31.6–36.5 185 172–199 moderate adolescents 15–19 years. pakistan 39205 161209 2001 n ns–ns 1022 4640 27.9 24.2–31.9 9574 8298–10962 moderatepalau 5 20 r 21.1 7.5–46.8 1 0–2 moderatepanama 865 3288 1999 n ns–ns 1523 3097 40.3 36.9–43.8 320 293–348 severepapua new Guinea 1483 6001 r 43.1 18.9–71.1 565 248–933 severeparaguay 1580 6301 r 26.2 9.7–54.0 367 136–756 moderateperu 7469 28380 2004 n 15.00–49.99 17058 5359 data pooled for npnlw and lw, 40.4 39.4–41.4 2762 2691–2834 severe adjusted for altitude. philippines 21977 84477 2003 n ns–ns 1189 5242 only lw 42.1 38.2–46.1 8412 7631–9213 severepoland 9975 38499 r 18.7 6.5–43.1 1792 624–4138 mildportugal 2580 10545 r 15.0 5.0–36.9 370 124–912 mildQatar 165 839 r 36.2 13.7–67.0 54 21–100 moderaterepublic of Korea 13219 47983 2001 n 15.00–49.99 5249 data disaggregated by age pooled; 14.0 6.8–26.6 1788 872–3393 mild sample includes pw. republic of moldova 1193 4195 r 23.4 8.4–50.5 269 97–580 moderateromania 5611 21629 r 20.1 7.0–45.5 1085 379–2461 moderaterussian federation 39140 142537 r 19.8 6.9–45.1 7448 2605–16931 mildrwanda 2335 9230 r 59.4 29.1–83.9 1153 565–1629 severesaint Kitts and nevis 12 43 r 20.8 7.4–46.2 2 1–5 moderatesaint lucia 45 162 r 25.0 9.3–52.1 10 4–22 moderatesaint vincent and the Grenadines 33 120 r 24.1 8.9–50.9 7 3–16 moderatesamoa 42 186 1999 n ns–ns 240 3226 19.7 13.5–27.8 7 5–10 mildsan marino 7 28 r 16.5 5.7–39.5 1 0–2 mildsao tome and principe 41 160 r 26.2 9.5–54.4 9 3–19 moderatesaudi arabia 6031 25193 r 32.3 12.6–61.2 1727 673–3275 moderatesenegal 2923 11936 r 48.4 22.3–75.4 1206 555–1879 severeserbia and montenegroe 2545 10497 2000 n 15.00–49.99 1296 2441 26.7 23.4–30.2 648 569–734 moderateseychelles 22 81 r 21.1 7.6–46.8 4 1–9 moderatesierra leone 1315 5679 r 62.9 33.5–85.1 658 350–891 severesingapore 1160 4380 1998 n 18.00–69.99 2467 760 sample includes pw. 18.4 16.3–20.7 207 183–232 mildslovakia 1433 5401 r 19.4 6.8–44.2 268 94–610 mildslovenia 489 1966 r 15.1 5.1–37.1 71 24–175 mild33

Table A3.3 Country estimates of anaemia prevalence in non-pregnant women of reproductive ageMember State Population 2006a Survey Information Proportion of the population Population with anaemia with Hb<120 g/L (number of individuals)(000) Women General Date of survey Level of Sample Public health 15.00–49.99y (000) (000) (years) surveyb Age range Size Referencec Notes Estimate 95% CI Estimate 95% CI problem
solomon Islands 120 490 r 39.2 16.5–67.8 41 17–71 moderatesomalia 2000 8496 no estimate possible. south africa 12675 47594 r 26.4 9.9–54.0 3074 1151–6282 moderatespain 11200 43379 r 16.3 5.6–39.1 1751 598–4203 mildsri lanka 5665 20912 2001 n 15.00–49.99 4625 4972 adjusted for altitude. 31.6 29.7–33.5 1688 1588–1790 moderatesudan 9083 36992 r 43.5 19.1–71.5 3443 1515–5656 severesuriname 121 452 r 20.4 7.3–45.7 23 8–51 moderateswaziland 263 1029 r 36.5 14.9–65.4 85 35–153 moderatesweden 2036 9070 r 13.3 4.4–33.8 257 85–656 mildswitzerland 1759 7264 r 12.2 3.9–32.1 207 66–544 mildsyrian arab republic 5199 19512 r 33.4 13.3–62.1 1555 619–2891 moderatetajikistan 1739 6591 2003 n 15.00–49.99 2042 4182 adjusted for altitude. 41.2 38.2–44.2 640 594–687 severethailand 18156 64762 1995 n 15.00–59.99 2953 3961 data pooled for npnlw, lw and 17.8 15.9–19.8 3055 2735–3404 moderate women of working population. the former Yugoslav republic 530 2037 1999 n 15.00–45.99 1018 1609 12.2 9.6–15.3 62 49–78 mildof macedonia timor leste 230 1007 2003 n 15.00–49.99 3745 5050 adjusted for altitude. 31.5 29.4–33.6 55 51–59 moderatetogo 1494 6306 r 38.4 15.5–68.0 481 194–851 moderatetonga 24 103 r 21.5 7.7–47.2 5 2–10 moderatetrinidad and tobago 381 1309 r 24.3 8.9–51.5 88 32–187 moderatetunisia 2939 10210 1996–1997 n 17.00–59.99 1951 2485 data pooled for women and lw. 26.3 23.6–29.2 729 655–808 moderateturkey 20065 74175 r 26.3 9.9–53.6 4885 1841–9966 moderateturkmenistan 1392 4899 2000 n 15.00–49.99 7714 3209 sample includes pw. 47.3 45.7–48.9 607 586–627 severetuvalu 3 10 r 26.3 9.8–53.9 1 0–1 moderateuganda 6254 29857 2000–2001 n 15.00–49.99 5688 3207 data pooled for npnlw and lw. 28.7 27.1–30.4 1331 1255–1410 moderateukraine 12180 45986 2002 n 15.00–44.99 859 5172 9.2 6.8–12.3 1084 802–1452 mildunited arab emirates 922 4657 r 43.9 16.2–76.0 372 138–644 severeunited Kingdom of Great Britain 14426 59847 200–2001 n 19.00–49.99 486 4154 npnlw 8.8 5.8–13.1 1212 803–1800 mildand northern Irelandunited republic of tanzania 9226 39025 2004–2005 n 15.00–49.99 9065 5221 data pooled for npnlw and lw, 47.2 45.8–48.7 3687 3574–3801 severe adjusted for altitude and smoking. united states of america 74273 301029 1999–2002 n 15.00–59.99 3866 4738 data disaggregated by age pooled, 6.9 5.9–8.1 4833 4099–5686 mild weighted prevalence. uruguay 842 3487 r 16.9 5.8–40.3 133 45–317 milduzbekistan 7476 26980 1996 n 15.00–49.99 2293 prevalence calculated for recom- 64.8 50.8–76.7 4440 3478–5255 severe mended cut-off ; npnlw. vanuatu 53 215 1996 n 15.00–49.99 1685 3196 data pooled for npnlw and lw. 54.1 50.7–57.4 25 24–27 severevenezuela 7221 27216 r 28.3 10.8–56.3 1874 714–3727 moderateviet nam 24297 85344 2000–2001 n 15.00–49.99 7135 3408 24.3 22.9–25.7 5505 5193–5830 moderateYemen 4895 21639 r 51.0 24.0–77.5 2042 961–3099 severeZambia 2657 11861 2003 n 15.00–49.99 623 5098 29.1 24.3–34.4 633 529–748 moderateZimbabwe 3281 13085 1999 n 15.00–49.99 2641 994 653–1400
a population figures are based on the 2006 projection from the 2004 revision from the united nations population division. b level of survey: n=nationally representative, f=2+ surveys at the first administrative level boundary, r=regression-based estimate. c corresponds to the numerical reference available in the who Global database on anaemia (http://www.who.int/vmnis/en/). d lw = lactating women, npnlw = non-pregnant non-lactating women, pw = pregnant womene on 3 June 2006, the permanent representative of the republic of serbia to the united nations and other International organizations in Geneva informed the acting director-General of the who that “the membership of the state union serbia and montenegro
in the united nations, including all organs and the organizations of the united nations system, is continued by the republic of serbia on the basis of article 60 of the constitutional charter of serbia and montenegro, activated by the declaration of Independ-ence adopted by the national assembly of montenegro on 3 June 2006”. estimates used or referred to in this document cover a period of time preceding that communication.
wo
rldw
Ide prevalen
ce of an
aemIa 1993–2005
34
35annex 3
A3.4 Country referencesAfghanistanMinistry of Public Health of the Islamic Republic of Afgha-nistan et al. Summary Report of the National Nutrition Sur-vey, Afghanistan, 2004. Ministry of Public Health of the Islamic Republic of Afghanistan, 2005. Ref 5173.
AngolaMinistry of Health et al. Assessing vitamin A and iron de-ficiency anaemia, nutritional anaemia among children aged 0–60 months in the Republic of Angola [technical report]. Ministry of Health, 2000. Ref 2839.
Antigua and BarbudaMicronutrient Working Group. Iron and vitamin A status in five Caribbean countries. Cajanus, 2002, 35 (1): 4–34. Ref 3758.
ArmeniaNational Statistical Service et al. Armenia Demographic and Health Survey 2000. Calverton, MD, National Statistical Service, 2001. Ref 3208.
AzerbaijanSerbanescu F et al., eds. Reproductive health survey Azerbai-jan, 2001. Atlanta, Centers for Disease Control and Pre-vention, 2003. Ref 4682.
BahrainAl-Dallal ZS et al. Impact of the national flour fortification program on the prevalence of iron deficiency and anemia among women at reproductive age in the Kingdom of Bahrain. Kingdom of Bahrain, Ministry of Health, Public Health Directorate, Nutrition Section, 2003. Ref 5391.
BangladeshHelen Keller International et al. Anemia: a severe public health problem in pre-school children and pregnant women in rural Bangladesh. HKI-Nutrition Surveillance Project Bulletin, 2002. Ref 3256.
BelizeMinistry of Health et al. Study of iron deficiency anaemia among pregnant women in Belize. Belmopan, Ministry of Health, 1996. (BZ-NUT/F/003). Ref 1062.
BeninInstitut National de la Statistique et de l’Analyse Écono-mique et al. Enquête Démographique et de Santé au Bénin, 2001. Calverton, MD, Institut National de la Statistique et de l’Analyse Économique et ORC Macro, 2002. Ref 3461.
BhutanRoyal Government of Bhutan – Ministry of Health and Education. Anemia among men, women and children in Bhu-tan: How big is the problem? Bhutan, Ministry of Health and Education, 2003. Ref 5150.
BoliviaGutiérrez Sardán M et al. Bolivia Encuesta Nacional de De-mografía y Salud 2003 [Bolivia National Demographic and Health Survey 2003]. La Paz, Ministerio de Salud y Depor-tes, Instituto Nacional de Estadística, 2004. Ref 5095.
BotswanaMinistry of Health Botswana et al. Micronutrient malnu-trition in Botswana. A national survey to assess the status of iodine, iron, and vitamin A. Gaborone, Ministry of Health, 1996. Ref 2805.
BrazilGoverno de Sergipe et al. III Pesquisa de saúde materno-in-fantil e nutrição do estado de Sergipe. Pesmise 98. Brasilia, Governo de Sergipe, Secretaria de Estado da Saúde, 2001. Ref 614.
Torres MAA et al. Anemia em crianças menores de dois anos atendidas nas unidades básicas de saúde no Estado de São Paulo, Brasil [Anemia in children under 2 years in basic health care units in the State of São Paulo, Brazil]. Revista de Saúde Pública, 1994, 28 (4): 290–294. Ref 2375.
Osório MM et al. Prevalence of anemia in children 6–59 months old in the state of Pernambuco, Brazil. Revista Pa-namericana de Salud Pública, 2001, 10 (21): 101–107. Ref 2843.
Brunei DarussalamMinistry of Health. National Nutritional Status Survey, 1997. Negara, Ministry of Health, 1997. Ref 3334.
Nutritional status of children under five years old and pre-gnant women in Brunei Darussalam. A collaborative study between Institute of Medical Research, Ministry of Health, Malaysia, Ministry of Health, Brunei Darussalam, Ministry of Health, Lao PDR,1995–1996. Negara, Brunei Darussa-lam, 1996. Ref 3328.
Burkina FasoInstitut National de la Statistique et de la Démographie [Burkina Faso] et al. Burkina Faso Enquête Démographique et de Santé 2003 [Burkina Faso Demographic and Health Survey 2003]. Calverton, MD, ORC Macro, 2004. Ref 4948.
Burundi Kimboka S. Burundi National Anaemia Survey. Bujumbura, Burundi, Ministere de la Sante Publique, 2004. Ref 5782.
worldwIde prevalence of anaemIa 1993–200536
CambodiaMinistry of Health et al. Cambodia Demographic and Health Survey 2000. Phnom Penh, Ministry of Health, 2001. Ref 3206.
CameroonInstitut National de la Statistique et al. Enquête Démogra-phique et de Santé: Cameroon 2004. [Demographic Health Survey: Cameroon 2004]. Calverton, MD, ORC Macro, 2005. Ref 5214.
Central African RepublicMinistere Delegue a l’Economie au Plan et a la Coopera-tion Internationale et al. Enquête nationale sur l’avitaminose A, la carence en fer et la consommation du sel iode. Republi-que Centrafricaine, 2000. Ref 1722.
ChileMinisterio de Salud. Resultados 1: Encuesta de Salud, Chile 2003. Santiago, Departmento de Epidemiología, Ministe-rio de Salud, 2003. Ref 5783.
ChinaChinese Center for Disease Control and Prevention. The prevalence of anemia in China, 2002, by age and gender. Bei-jing, Chinese Center for Disease Control and Prevention, 2005. Ref 5287.
Costa RicaMinisterio de Salud. Encuesta Nacional de Nutrición: 2 Fascí-culo Micronutrientes [National nutrition survey: Part 2 micro-nutrients]. San José, Ministerio de Salud, 1996. Ref 1634.
Cunningham L et al. Prevalencia de anemia, deficiencia de hierro y folatos en niños menores de siete años: Costa Rica, 1996 [Prevalence of anemia, iron and folate deficiency in children smaller than seven years: Costa Rica, 1996]. Ar-chivos Latinoamericanos de Nutrición, 2001, 51 (1): 37–43. Ref 3555.
Rodriguez S et al. Prevalencia de las anemias nutricionales de mujeres en edad fértil, Costa Rica: encuesta nacional de nutrición, 1996 [Prevalence of nutritional anemia in women of reproductive age, Costa Rica: national nutrition survey, 1996]. Archivos Latinoamericanos de Nutrición, 2001, 51 (1): 19–24. Ref 3556.
Blanco A et al. Anemias nutricionales en mujeres lactantes de Costa Rica [Nutritional anemia in nursing women in Costa Rica]. Archivos Latinoamericanos de Nutrición, 2003, 53 (1): 28–34. Ref 4524.
Democratic People’s Republic of KoreaUNICEF et al. The Multiple Indicator Cluster Survey in the Democratic People’s Republic of Korea, 1998. Pyongyang, United Nations Children’s Fund, 1998. Ref 3090.
Central Bureau of Statistics et al. DPRK 2004 Nutrition assessment report of survey results. The Democratic People’s Republic of Korea, Central Bureau of Statistics, Institute of Child Nutrition, 2005. Ref 5068.
Democratic Republic of CongoMinistère du Santé, Programme National de Nutrition “PRONANUT”. Enquete sur la prevalence de l’anemie en République Démographique du Congo. République Dé-mocratique du Congo, Programme National de Nutrition “PRONANUT”, 2005. Ref 5764.
DominicaMicronutrient Working Group. Iron and vitamin A status in five Caribbean countries. Cajanus, 2002, 35 (1):4–34. Ref 3758.
EgyptEl-Zanaty F et al. Egypt Demographic and Health Survey. Calverton, MD, Ministry of Health and Population, Egypt, National Population Council and ORC Macro, 2001. Ref 1940.
El SalvadorSalvadoran Demographic Association (ADS) et al. Encuesta Nacional de Salud Familiar FESAL-98. [National Family Health Survey FESAL-98]. San Salvador, Salvadoran De-mographic Association, 2000. Ref 3107.
Salvadoran Demographic Association (ADS) et al. Encuesta Nacional de Salud Familiar FESAL 2002–2003: Informe fi-nal. San Salvador, 2004. Ref 5171.
FijiSaito S. 1993 national nutrition survey. Suva, National Food and Nutrition Committee, 1995. Ref 2699.
FranceGalán P et al. Determining factors in the iron status of adult women in the SU.VI.MAX study. European Journal of Clinical Nutrition, 1998, 52 (6): 383–388. Ref 2392.
GambiaBah A et al. Nationwide survey on the prevalence of vitamin A and iron deficiency in women and children in the Gambia. Banjul, National Nutrition Agency, 2001. Ref 2806.
37annex 3
GhanaGhana Statistical Service (GSS) et al. Ghana Demographic and Health Survey 2003. Calverton, MD, ORC Macro, 2004. Ref 4943.
GuatemalaMinisterio de Salud Publica y Asistencia Social et al. Gua-temala, Encuesta Nacional de Salud Materno Infantil 2002. Guatemala, Ministerio de Salud Publica y Asistencia So-cial, 2003. Ref 4586.
GuineaMinistère de la Santé Publique. Enquête nationale sur l’ané-mie ferriprive en Guinée. Rapport Final: résumé. Guinee, 2001. Ref 2780.
GuyanaMinistry of Health [Guyana] et al. Executive summary micro-nutrient study report – Guyana. An assessment of the vitamin A, E, beta-carotene, iron and iodine status in the population. Georgetown, Ministry of Health, 1997. Ref 3094.
HaitiRepublique d’Haiti et al. Enquête Mortalité, Morbidité et Utilisation des Services EMMUS-III Haïti 2000. Republi-que d’Haiti, 2001. Ref 3264.
HondurasMinisterio de Salud Pública et al. Encuesta Nacional de Mi-cronutrientes Honduras, 1996. Tegucigalpa, Secretaria de Salud, Ministerio de Salud Pública, 1997. Ref 3095.
Secretaría de Salud et al. Encuesta Nacional de Salud Mascu-lina ENSM-2001. Tegucigalpa, Secretaría de Salud, 2002. Ref 3096.
IndiaInternational Institute for Population Sciences et al. Na-tional Family Health Survey (NFHS-2), 1998–1999: India. Mumbai, International Institute for Population Sciences, 2000. Ref 2972.
International Institute for Population Sciences et al. Na-tional Family Health Survey (NFHS-2), India, 1998–1999, Northeastern States: Arunachal Pradesh, Manipur, Megha-laya, Mizoram, Nagaland and Tripura. Mumbai, Interna-tional Institute for Population Sciences, 2002. Ref 3780.
Iran (Islamic Republic of)Ministry of Health and Medical Education et al. Multi-centre study on iron deficiency anemia among 15 to 49 year old women in the Islamic Republic of Iran. Islamic Republic of Iran, Nutrition Department, Ministry of Health and Me-dical Education, 1995. Ref 3015.
JamaicaWHO Pan American Health Organization et al. Micronu-trient study report: an assessment of the vitamin A, E, beta-carotene, and iron status in Jamaica. Kingston, WHO, Pan American Health Organization, Caribbean Food and Nu-trition Institute, 1998 (PAHO/CFNI/98.J1). Ref 3093.
Micronutrient Working Group. Assessment of the iron sup-plementation programme for pregnant women in Jamaica. Cajanus, 2002, 35 (1): 35–49. Ref 3759.
JapanNational Institute of Health and Nutrition. National Nu-trition Survey of Japan in 2001 and 2002. Japan, National Institute of Health and Nutrition, 2002. Ref 5177.
JordanDepartment of Statistics et al. Jordan Population and Fa-mily Health Survey 2002. Calverton, MD, Department of Statistics Jordan, ORC Macro, 2003. Ref 3389.
Ministry of Health Jordan et al. National baseline survey on iron deficiency anemia and vitamin A deficiency. Amman, Ministry of Health, 2002. Ref 4382.
KazakhstanAcademy of Preventive Medicine Kazakhstan et al. Ka-zakhstan Demographic and Health Survey 1999. Calverton, MD, Academy of Preventive Medicine and Macro Interna-tional Inc, 1999. Ref 2675.
KenyaMwaniki DL et al. Anaemia and status of iron, vitamin A and zinc in Kenya. The 1999 National Survey. Nairobi, Mi-nistry of Health, 2002. Ref 3442.
KuwaitJackson RT et al. Gender and age differences in anemia prevalence during the lifecycle in Kuwait. Ecology of Food and Nutrition, 2004, 43 (1–2):61–75. Ref 4375.
KyrgyzstanResearch Institute of Obstetrics and Pediatrics et al. Kyrgyz Republic Demographic and Health Survey, 1997. Calverton, MD, Research Institute of Obstetrics and Pediatrics, Mi-nistry of Health of the Kyrgyz Republic and Macro Inter-national Inc, 1998. Ref 2295.
Lao People’s Democratic RepublicMinistry of Health, Lao People’s Democratic Republic. Re-port on national health survey: health status of the People of LAO PDR. Vientiane, Ministry of Health, 2001. Ref 770.
worldwIde prevalence of anaemIa 1993–200538
LebanonHwalla N et al. Prevalence and selected determinant of iron deficiency anemia in women and under five children in Leba-non. Beirut, 1998. Ref 3221.
LesothoMinistry of Health and Social Welfare et al. Lesotho De-mographic and Health Survey 2004. Calverton, MD, ORC Macro, 2005. Ref 5356.
LiberiaMulder-Sibanda M et al. National Micronutrient Survey. A national prevalence study on vitamin A deficiency, iron de-ficiency anemia, iodine deficiency. Monrovia, Ministry of Health and Social Welfare, Family Health Division, Uni-ted Nations Children’s Fund, 1999. Ref 1242.
MadagascarInstitut National de la Statistique et al. Enquête Démogra-phique et de Santé de Madagascar 2003–2004. Calverton, MD, ORC Macro, 2005. Ref 5190.
MalaysiaMinistry of Health Malaysia. Family Health. Sub System Health Management Information System, 2004. Malaysia, Ministry of Health, 2005. Ref 5795.
MalawiNational Statistical Office et al. Malawi Demographic and Health Survey 2004. Calverton, MD, ORC Macro, 2005. Ref 5201.
MaldivesMinistry of Health and Welfare et al. Nutritional status and child feeding practices of Maldivian children – Report of the National Nutrition Survey. Malé, 1994. Ref 831.
Minister of Health, Republic of Maldives. Multiple Indica-tor Cluster Survey (MICS 2), Maldives. Malé, Ministry of Health, 2001. Ref 2987.
MaliCellule de Planification et de Statistique du Ministère de la Santé et al. Enquête Démographique et de Santé au Mali 2001. Calverton, MD, ORC Macro, 2002. Ref 3446.
MauritiusMinistry of Health Mauritius. A survey of nutrition in Mau-ritius and Rodrigues (1995). Port Louis, Ministry of Health, 1995. Ref 395.
MexicoInstituto Nacional de Salud Publica. Encuesta Nacional de Nutrición 1999. Mexico City, Instituto Nacional de Salud Publica, 1999. Ref 2997.
Micronesia (Federated States of)Auerbach SB. Maternal-Child Health Survey: Pohnpei, Fe-derated States of Micronesia, 1993 [summary table]. Palikir, Pohnpei, US Public Health Service/Department of Health Services [Federated States of Micronesia], 1999. Ref 4942.
Socorro P et al. Results of vitamin A, anemia and blood lead survey among 2–4 year old children and reproductive-aged women in Yap proper and Kosrae State, Federated States of Micronesia. Atlanta, Centers for Disease Control and Pre-vention, 2000. Ref 2548.
MongoliaEnkhbat S. Third National Nutrition Survey 2004 [perso-nal communication]. Mongolia, Ministry of Health, 2004. Ref 5247.
MoroccoMinistère de la Santé Maroc. Enquête nationale sur la ca-rence en fer l’utilisation du sel iodé et la supplémentation par la vitamine A, 2000. Morocco, 2000. Ref 3469.
MozambiqueMinistério da Saúde et al. Inquérito nacional seovre a defi-ciência de vitamina A, prevalência de anemia e malária em crianças dos 6–59 meses e respectivas mães. Maputo, Instituto Nacional de Saúde, 2003. Ref 589.
MyanmarNational Nutrition Center et al. A study on hemoglobin status and food practices of Myanmar women. Myanmar, National Nutrition Center, Department of Health, 2001. Ref 5246.
NepalMinistry of Health Nepal et al. Nepal Micronutrient Status Survey 1998. Kathmandu, Ministry of Health, 1999. Ref 1083.
New ZealandRussell D et al. NZ Food: NZ People: key results of the 1997 National Nutrition Survey. New Zealand, Ministry of Health, 1999. Ref 3192.
NicaraguaMinisterio de Salud. Encuesta nacional de micronutrien-tes (ENM 2000) [National survey of micronutrients (ENM 2000)]. Managua, Ministerio de Salud, 2002. Ref 3109.
Ministerio de Salud. Sistema integrado de vigilancia de inter-venciones nutricionales (SIVIN): primer informe de progreso 2002–2003 [Integrated system of monitoring nutrition inter-ventions (SIVIN): first progress report 2002–2003]. Mana-gua, Ministerio de Salud, 2004. Ref 4466.

39annex 3
NigeriaFederal Ministry of Health and Social Services et al. Nige-ria National Micronutrient Survey, 1993. Nigeria, Federal Ministry of Health and Social Services, 1996. Ref 50.
OmanAl-Riyami A et al. National Health Survey, 2000. Volume II – Reproductive Health Study. Ministry of Health the Sulta-nate of Oman, 2000. Ref 4218.
Al-Riyami A et al. Genetic Blood Disorders Survey in the Sultanate of Oman. Journal of Tropical Pediatrics, 2003, 49 (Suppl 1): i1–20. Ref 5204.
PakistanPakistan Institute of Development Economics et al. Natio-nal Nutrition Survey 2001–2002. Islamabad, Government of Pakistan, Planning Commission, 2003. Ref 4640.
PanamaMinisterio de Salud, et al. Encuesta nacional de vitamina A y anemia por deficiencia de hierro [National survey of vitamin A and iron deficiency anemia]. Panama City, Ministerio de Salud, 2000. Ref 3097.
PeruMinisterio de Salud Publica et al. Monitoreo nacional de indicadores nutricionales 2004. Lima, Ministerio de Salud Publica, Instituto Nacional de Salud, 2004. Ref 5359.
PhilippinesFood and Nutrition Research Institute, Philippines. The Sixth National Survey 2003 [personal communication]. Manila, 2003. Ref 5242.
QatarAmine EK. Nutritional assessment in Qatar; 1995 Oct 20–Nov 3 [assignment report]. Qatar, WHO Regional Office for the Eastern Mediterranean, 1995. Ref 820.
Republic of KoreaWHO Regional Office for the Eastern Mediterranean. 1995 National Nutrition Survey Report. Republic of Korea, Ministry of Health and Welfare, 1997. Ref 3327.
Korean Ministry of Health and Welfare. National Health and Nutrition Survey, 2001. Seoul, Korean Ministry of Health and Welfare, 2005. Ref 5249.
Romania“Alfred Rusescu” Institute for Mother and Child Protec-tion. Nutritional status of pregnant women, children under 5 years and school children aged 6–7 years. “Alfred Rusescu” Institute for Mother and Child Protection, 2005. Ref 164.
RwandaMinistère de la Santé et al. National Nutrition Survey of Wo-men and Children in Rwanda in 1996 [final report]. Kigali, Ministère de la Santé, 1997. Ref 2558.
SamoaMackerras D et al. Samoa national nutritional survey 1999, part 1: anaemia survey [technical report]. Apia, Department of Health, 2002. Ref 3226.
Serbia and Montenegro1
Petrovic O et al. Multiple Indicator Cluster Survey II. The report for the Federal Republic of Yugoslavia. Belgrade, UNICEF, 2000. Ref 2441.
SingaporeDepartment of Nutrition et al. National Nutrition Survey 1998. Singapore, Ministry of Health, 2001. Ref 760.
South AfricaSouth African Vitamin A Consultation Group (SAVACG). Children aged 6 to 71 months in South Africa, 1994: their anthropometric, vitamin A, iron and immunisation coverage status. Johannesburg, South African Vitamin A Consulta-tive Group, 1995. Ref 48.
Sri LankaPiyasena C et al. Assessment of anaemia status in Sri Lanka 2001 [survey report]. Colombo, Ministry of Health, Nutri-tion and Welfare, Department of Health Services, Medical Research Institute, 2003. Ref 4972.
SudanFederal Ministry of Health et al. Comprehensive Nutrition Survey. Khartoum, Federal Ministry of Health, National Nutrition Department, 1997. Ref 1443.
Elnour A et al. Endemic goiter with iodine sufficiency: a possible role for the consumption of pearl millet in the etio-logy of endemic goiter. American Journal of Clinical Nutri-tion, 2000, 71 (1): 59–66. Ref 1553.
1 On 3 June 2006, the Permanent Representative of the Republic of Ser-bia to the United Nations and other International Organizations in Geneva informed the Acting Director-General of the WHO that “the membership of the state union Serbia and Montenegro in the United Nations, including all organs and the organizations of the United Na-tions system, is continued by the Republic of Serbia on the basis of Article 60 of the Constitutional Charter of Serbia and Montenegro, activated by the Declaration of Independence adopted by the National Assembly of Montenegro on 3 June 2006”. Estimates used or referred to in this document cover a period of time preceding that communica-tion.
worldwIde prevalence of anaemIa 1993–200540
SwitzerlandHess SY et al. A national survey of iron and folate status in pregnant women in Switzerland. International Journal for Vitamin and Nutrition Research, 2001, 71 (5): 268–273. Ref 3402.
TajikistanBranca F et al. Micro-nutrient status survey in Tajikistan. Rome, National Institute for Research on Food and Nutri-tion, Kazakh Academy of Nutrition, 2004. Ref 4182.
ThailandMinistry of Public Health et al. The Fourth National Nutri-tion Survey of Thailand 1995. Bangkok, Ministry of Public Health, Department of Health, 1998. Ref 3961.
The former Yugoslav Republic of MacedoniaBranca F et al. Multiple indicator cluster survey in FYR Macedonia with micronutrient component. Rome, National Institute of Nutrition, 2000. Ref 1609.
Timor-LesteMinistry of Health Timor-Leste et al. Timor Leste 2003 Demographic and Health Survey. Newcastle, Australia, Mi-nistry of Health/University of Newcastle, 2003. Ref 5050.
TunisiaMinistère de la Santé Publique et al. Rapport national: évaluation de l’ état nutritionnel de la population tunisienne [National report: evaluation of the nutritional status of the Tunisian population]. Tunis, Ministère de la Santé Publi-que, 1996. Ref 2485.
TurkmenistanGurbansoltan Eje Clinical Research Center for Maternal and Child Health et al. Turkmenistan Demographic and Health Survey 2000. Calverton, MD, ORC Macro, 2001. Ref 3209.
UgandaUganda Bureau of Statistics (UBOS) et al. Uganda Demo-graphic and Health Survey 2000–2001. Calverton, MD, ORC Macro, 2001. Ref 3207.
UkraineAcademy of Medical Science of Ukraine et al. Report of the National Micronutrient Survey Ukraine. Ukraine, Academy of Medical Science of Ukraine, 2004. Ref 5172.
United Kingdom of Great Britain and Northern IrelandGregory JR et al. National Diet and Nutrition Survey: chil-dren aged 1½ to 4½ years. Volume 1: report of the diet and nutrition survey. London, Her Majesty’s Stationery Office, 1995. Ref 3279.
Ruston D et al. The National Diet & Nutrition Survey: adults aged 19 to 64 years. Volume 4: nutritional status (an-thropometry and blood analytes), blood pressure and physical activity. London, Her Majesty’s Stationery Office, 2004. Ref 4154.
United Republic of TanzaniaNational Bureau of Statistics (NBS) Tanzania et al. Tan-zania Demographic and Health Survey 2004–05. Dar es Salaam, National Bureau of Statistics, ORC Macro. 2005. Ref 5221.
United States of AmericaCenters for Disease Control and Prevention. National Health and Nutrition Examination Survey 1999–2000, 2001–2002 [personal communication], 2002. Ref 4738.
UzbekistanInstitute of Obstetrics and Gynecology et al. Uzbekistan Demographic and Health Survey, 1996. Calverton, MD, Institute of Obstetrics and Gynecology, Macro Internatio-nal Inc, 1997. Ref 2293.
Analytical and Information Center et al. Uzbekistan Health Examination Survey 2002. Calverton, MD, Analytical and Information Center, State Department of Statistics, ORC Macro, 2004. Ref 4950.
VanuatuHarvey P et al. Report of the second national nutrition survey 1996. Port Vila, Department of Health, 1998. Ref 3196.
Viet NamKhoi HH et al. Report on Vietnam National anemia Sur-vey, 2000. Hanoi, National Institute of Nutrition, 2001. Ref 3408.
ZambiaLuo C et al. National baseline survey on prevalence and aetio-logy of anaemia in Zambia: a random cluster community sur-vey involving children, women and men. Lusaka, National Food and Nutrition Commission, 1999. Ref 2477.
Micronutrient Operational Strategies and Technologies (MOST) et al. Report of the national survey to evaluate the impact of vitamin A interventions in Zambia, July and November 2003. Zambia, Micronutrient Operational Stra-tegies and Technologies, United States Agency for Inter-national Development (USAID) Micronutrient Program, 2003. Ref 5098.
ZimbabweMinistry of Health and Child Welfare, Nutrition Unit. Zimbabwe National Micronutrient Survey: 1999. Harare, Ministry of Health and Child Welfare, 2001. Ref 2641.

WHO Global Database on Anaemia
www.who.int/vmnis
For further information about the WHO Global Database on Anaemia,
or if you would like to provide information, please contact:
ISBN 978 92 4 159665 7


![Research Article Prevalence of Anaemia among Pregnant Women …downloads.hindawi.com/journals/bmri/2014/849080.pdf · 2019-07-31 · of anaemia during pregnancy [ ]. e management](https://img.dokumen.tips/doc/110x75/5f7be4047395f42e6848e8a1/research-article-prevalence-of-anaemia-among-pregnant-women-2019-07-31-of-anaemia.jpg)