Embed Size (px)
Citation preview

World Preview 2018
A Consensus View of the Medical Device and Diagnostic Industry

Welcome to the EvaluateMedTech™ World Preview 2018
Launched in October 2012, our new EvaluateMedTech™ service is focused on the medical device and diagnostic industry. Powered by EvaluatePharma®’s proven platform and high quality data, EvaluateMedTech™ allows companies, investment banks, management consultancies and service providers to easily track and benchmark the sector in a one-stop, up-to-date online platform. In conjunction with the service launch, we are proud to debut the first edition of EvaluateMedTech™ World Preview 2018, a report that brings together many of our analyses derived from our new service, to provide top level insight into the expected performance of the medtech industry between now and 2018. Based on EvaluateMedTech™’s coverage of the world’s leading medical device and diagnostic companies, the World Preview highlights trends in medtech including sales and consensus forecasts of leading industry analysts by device area to 2018, the top 20 Companies in 2018, R&D spend current and future, FDA approvals, M&A and Venture Financing and Enterprise Value & Focus Analysis.
About EvaluatePharma®
Since 1996, EvaluatePharma® has been the premier source for life science sector analysis, delivering exclusive, trusted commercial insight into industry performance through its proprietary platform. EvaluatePharma® is staffed by a team of over 85 dedicated healthcare analysts employing rigorous methodologies to collate, organize and deliver the most up-to-date commercial performance data available. An award winning editorial team of journalists writing under the EP Vantage® name support EvaluatePharma’s analysis. EvaluateMedTech™ provides the first global consensus view of the medical device and diagnostic industry. The EvaluatePharma® services enable the life science community to make sound business decisions about value and opportunity. For more information please visit www.EvaluatePharma.com.
To find out more about this report and our family of services contact us:
� North America Debbie Paul Tel: 1-617-573-9453 Email: [email protected]
� Rest of the World Will Hau Tel: +44 (0)20 7377 0800 Email: [email protected]
� Asia Pacific Hiroshi Yamazaki Tel: +81 (0)80 1164 4754 Email: [email protected]
� General inquiries about this report Christine Lindgren Tel: 1-617-573-9458 Email: [email protected]
Disclaimer
All intellectual property rights in this report remain that of EvaluatePharma and/or its respective third party licensors. Whilst all reasonable steps have been taken to ensure that the data presented are accurate, EvaluatePharma Ltd cannot accept responsibility for errors or omissions. Neither does EvaluatePharma Ltd warrant the accuracy, merchantability or fitness for a particular purpose of the data. Nothing in the reports shall constitute investment, financial or legal advice and the contents of the reports are provided for information purposes only. The data is not intended to amount to advice and should not be used as a determining factor in any investment decision. This report may not be lent, resold, hired out or otherwise disposed of by way of trade in any form of binding or cover other than that in which it is published, without the prior written consent of EvaluatePharma Ltd. Copyright © 2012 EvaluatePharma Ltd. All rights reserved.
October 2012
2Co
pyr
igh
t ©
201
2 Ev
alu
ateP
har
ma
Ltd
. All
rig
hts
res
erve
d.

In the first edition of the EvaluateMedTech™ World Preview we can reveal the medtech market is expected to grow at 4.4% per year (CAGR) between 2011 and 2018, achieving global sales of $440bn in 2018 (page 6). The analysis is based on in-depth forecast models for the top 120 global medtech companies available within EvaluateMedTech™. This sales forecast represents the first consensus view from equity analysts of the entire medtech market.
Medtech Closing the Gap on Pharma
Previously in the shadows of the pharmaceutical sector, the medtech market is set to outperform the prescription drug market with 4.4% growth per year (CAGR) versus 2.5% growth for the prescription drug market between 2011 and 2018 (page 8). Medtech’s size relative to pharma will narrow considerably, and by 2018 is forecast to be more than half the size of the $857bn prescription drug market.
What’s Driving Medtech Growth?
Our analysis of the Top 15 device categories reveals that growth will be broadly based with virtually all recording growth in excess of 3% per year (CAGR) between 2011 to 2018 (page 6). The medtech sector is diverse but tends to have clearer value propositions than the pharmaceutical sector when it comes to convincing payers to part with their cash. Medtech will continue to benefit from emerging market invest- ment that are lifting standards of care, while cost conscious developed markets will continue to invest in more efficient machines, systems and procedures, which offer less hospital time and better patient outcomes.
Is Medtech a Friend or Foe of Pharma?
EvaluateMedTech™ finds that the in vitro diagnostics (IVD) market is the largest segment in medtech with sales set to reach $55bn in 2018, growing at 4.4% per year (CAGR) between 2011 and 2018 (page 13). IVD companies will increasingly benefit from the advent of personalized medicine, which is seeing the pharma and medtech sectors becoming increasingly linked through the introduction of companion diagnostic kits for drugs. For example diagnostic kits for the detection of the K-Ras mutation in colorectal cancer patients were developed to identify patient groups where Erbitux and Vectibix (Anti-EGFr MAbs) would be more effective.
Despite the obvious benefits for the diagnostics industry (as well as patients), the overall impact of personalized medicine on pharma is uncertain: although the potential patient population for a drug may be reduced, a more targeted approach may lead to increased R&D productivity, a higher price and reimbursement success.
Investors see the Potential
This report reveals that venture financing investment has increased over the last 3 years to $3.6bn in 2011 (page 19). This highlights continuing investor confidence in a sector with no shortage of innovative opportunities. Companies themselves are also continuing to invest, with R&D set to grow at a healthy 3.3% per year (CAGR) to $25.3bn in 2018 (page 9). M&A in the sector continued to expand in 2011 to $75bn, up 47% vs 2010 (page 18). M&A is driven by ‘Big Medtech’ continuing to source products primarily via acquisitions, but also ‘Big Pharma’ has started to pour in the cash via acquisitions; Alcon (Novartis), Genzyme (Sanofi) and Synthes (Johnson & Johnson). Given more predictable returns and tangible value of medtech assets, pharma may be advised to speed up the diversion of resources into medtech sector M&A.
Anthony Raeside Head of Research
3
EvaluateMedTech™ Foreword
Co
pyr
igh
t ©
201
2 Ev
alu
ateP
har
ma
Ltd
. All
rig
hts
res
erve
d.
In vitro diagnostics expected to be
the world’s largest
medtech segment in 2018

EvaluateMedTech World Preview 2018 – Analysis Highlights
� Worldwide medtech sales forecast to total $440bn in 2018 (CAGR 2011 to 2018: +4.4%)
� Medtech sales growth forecast to outperform prescription drug market between 2011
and 2018 with CAGR of +4.4% vs. +2.5%
� Johnson & Johnson forecast to be number one medtech company in 2018, with global
medtech sales of $37.8bn
� In Vitro Diagnostics expected to be the world’s largest medtech segment in 2018,
with sales of $54.5bn
� Global medtech R&D spend forecast to grow by 3.3% (CAGR) to $25.3bn by 2018
� Johnson & Johnson remains top medtech R&D spender in 2018, with R&D
expenditure forecast to reach $2.1bn
� Number of 1st time PMA approvals increased 95% to 43 in 2011; 510-K approvals
up 10% to 3,145
� Twenty-four 1st time PMA approvals so far in 2012, 10 in In Vitro Diagnostics
and 7 in Cardiology
� Roche expected to be clear market leader within In Vitro Diagnostics in 2018
with sales of $9.9bn and an 18% market share
� Medtronic to remain number one Cardiology company with global sales of $10.4bn
in 2018 and a market share of 21%
� Johnson & Johnson forecast to command a market share of 30% in 2018
in the Orthopedics market following Synthes acquisition in June 2012
� Medtech M&A deal value slumps 46% in H1 2012 vs H1 2011; Deal count down 42%
� Total deal value of medtech venture financing increased by 9% to $1.9bn in H1 2012
4Co
pyr
igh
t ©
201
2 Ev
alu
ateP
har
ma
Ltd
. All
rig
hts
res
erve
d.
Medtech sales growth rate forecast to outperform
prescription drug market between 2011 and 2018

Table of Contents
6 Worldwide Medtech Sales by Device Area in 2018
7 Worldwide Medtech Sales in 2018: Top 20 Companies
8 Worldwide Medtech vs. Prescription Drug Sales (2005-18)
9 Worldwide Medtech R&D Spend (2005-2018)
10 Medtech R&D Spend in 2018: Top 20 Companies
11 FDA Device Approval Analysis: 2004 to 2011
12 2012 FDA First Time PMA Approvals
13 In Vitro Diagnostics (IVD) Market to 2018
14 Cardiology Market to 2018
15 Diagnostic Imaging Market to 2018
16 Orthopedics Market to 2018
17 Ophthalmics Market to 2018
18 M&A Analysis: 2007 to H1 2012
19 Venture Financing Analysis: 2007 to H1 2012
20 Enterprise Value & Focus Analysis: 2012 Latest vs. 2011
5Co
pyr
igh
t ©
201
2 Ev
alu
ateP
har
ma
Ltd
. All
rig
hts
res
erve
d.

Worldwide Medtech Sales by Device Area in 2018
Analysis on Top 10 Therapy Sales in 2012, Market Share & Sales Growth (2007-12)
WW Medtech Sales by EvaluateMedTech™ Device Area (2011/18): Top 15 Categories & Total Market
CAGR RankDevice Area 2011 2018 % Growth 2011 2018 Chg. (+/-) Chg. (+/-)
1 In Vitro Diagnostics (IVD) 40.3 54.5 +4.4% 12.4% 12.4% +0.0% -2 Cardiology 36.1 48.3 +4.3% 11.1% 11.0% -0.1% -3 Diagnostic Imaging 35.8 45.5 +3.5% 11.0% 10.3% -0.7% -4 Orthopedics 30.2 37.5 +3.1% 9.3% 8.5% -0.8% -5 Ophthalmics 23.0 33.9 +5.7% 7.1% 7.7% +0.6% -6 Endoscopy 16.6 24.2 +5.5% 5.1% 5.5% +0.4% -7 Drug Delivery 15.6 19.9 +3.6% 4.8% 4.5% -0.3% -8 Wound Management 11.9 16.4 +4.6% 3.7% 3.7% +0.0% +19 Dental 12.1 16.4 +4.4% 3.7% 3.7% -0.0% -110 General & Plastic Surgery 10.7 15.9 +5.7% 3.3% 3.6% +0.3% +111 Diabetic Care 11.4 15.3 +4.3% 3.5% 3.5% -0.0% -112 Nephrology 10.4 12.5 +2.8% 3.2% 2.8% -0.3% -13 Ear, Nose & Throat (ENT) 6.5 9.7 +6.0% 2.0% 2.2% +0.2% -14 Healthcare IT 6.3 8.0 +3.3% 1.9% 1.8% -0.1% -15 Neurology 4.9 7.3 +6.1% 1.5% 1.7% +0.2% +1
Top 15 272 365 +4.3% 83.6% 83.0% -0.6%Other 53 75 +4.9% 16.4% 17.0% +0.6%Total WW MedTech Sales 325 440 +4.4% 100.0% 100.0%
Source: EvaluateMedTech™ (28 SEP 2012)
WW Sales ($bn) WW Market Share
Note: Analysis is based on the Top 120 medtech companies. Sales in 2011 based on company reported data. Sales forecasts to 2018 based on a consensus of leading equity analysts' estimates for product sales and segmental sales.
Worldwide Medtech Sales Forecast to Grow by 4.4% (CAGR) to $440bn by 2018; In Vitro Diagnostics No.1 in 2018EvaluateMedTech™ finds that the market for medtech products, based on the consensus forecast for the leading 120 medtech companies, will grow by 4.4% per year (CAGR) between 2011 and 2018 to $440bn.In vitro diagnostics is expected to be the world's largest medtech segment in 2018, with sales of $54.5bn, beating cardiology and diagnostic imaging to the top spot. The fastest growing segment within the Top 15 is neurology, which is set to grow at 6.1% per year (CAGR) between 2011 and 2018 to $7.3bn. Orthopedics is forecast to be the slowest growing segment within the Top 10, expanding 3.1% per year (CAGR) between 2011 and 2018.
Analysis on Top 10 Device Areas in 2018, Market Share & Sales Growth (2011-18)Source: EvaluateMedTech™ (28 SEP 2012)
In Vitro Diagnostics (IVD)
CardiologyDiagnostic Imaging
Orthopedics Ophthalmics
EndoscopyDrug Delivery
Wound Management
Dental General & Plastic Surgery
0%
2%
4%
6%
8%
10%
12%
14%
16%
+2.0% +2.5% +3.0% +3.5% +4.0% +4.5% +5.0% +5.5% +6.0% +6.5% +7.0%
% Sales Growth: CAGR 2011-18
WW
Mar
ket S
hare
%
Note: Bubble = WW Sales in 2018
6
Worldwide Medtech Sales by Device Area in 2018
6Co
pyr
igh
t ©
201
2 Ev
alu
ateP
har
ma
Ltd
. All
rig
hts
res
erve
d.
Worldwide Medtech Sales in 2018: Top 20 Companies
WW Medtech Sales (2011/18): Top 20 Companies & Total Market
RankCompany Country 2011 2018 % CAGR 11-18 2011 2018 Chg. (+/-) Chg. (+/-)
1 Johnson & Johnson USA 25.8 37.8 +6% 7.9% 8.6% +0.7% -2 Medtronic USA 16.2 20.4 +3% 5.0% 4.6% -0.3% +13 Siemens Germany 17.5 20.1 +2% 5.4% 4.6% -0.8% -14 General Electric USA 9.7 13.5 +5% 3.0% 3.1% +0.1% +15 Roche Switzerland 10.2 13.3 +4% 3.1% 3.0% -0.1% -16 Covidien USA 9.4 12.8 +4% 2.9% 2.9% +0.0% +17 Abbott Laboratories USA 9.6 12.3 +4% 2.9% 2.8% -0.1% -18 Philips The Netherlands 9.1 11.6 +4% 2.8% 2.6% -0.2% -9 Stryker USA 8.3 11.4 +5% 2.6% 2.6% +0.0% -
10 Novartis Switzerland 6.5 9.7 +6% 2.0% 2.2% +0.2% +111 Essilor International France 5.3 9.0 +8% 1.6% 2.0% +0.4% +512 B. Braun Melsungen Germany 6.4 8.4 +4% 2.0% 1.9% -0.1% +113 Danaher USA 4.7 8.3 +8% 1.5% 1.9% +0.4% +514 Boston Scientific USA 7.6 8.1 +1% 2.3% 1.8% -0.5% -415 Becton Dickinson USA 6.5 8.0 +3% 2.0% 1.8% -0.2% -316 Baxter International USA 5.9 7.4 +3% 1.8% 1.7% -0.1% -217 St. Jude Medical USA 5.6 7.2 +4% 1.7% 1.6% -0.1% -218 Olympus Japan 4.4 6.6 +6% 1.4% 1.5% +0.2% +319 3M USA 4.8 6.3 +4% 1.5% 1.4% -0.0% -220 Terumo Japan 4.3 6.1 +5% 1.3% 1.4% +0.1% +3
Total Top 20 177.7 238.4 +4% 54.6% +54.2% -0.5%Other 147.6 201.7 +5% 45.4% +45.8% +0.5%Total 325.3 440.1 +4% 100.0% 100.0%
Source: EvaluateMedTech™ (28 SEP 2012)
WW Market Share WW Medtech Sales ($bn)
WW Medtech in 2018: Top 10 Companies Source: EvaluateMedTech™ (28 SEP 2012)
37.8
20.4 20.1
13.5 13.3 12.8 12.3 11.6 11.49.7
0
5
10
15
20
25
30
35
40
John
son
&Jo
hnso
n
Med
troni
c
Siem
ens
Gen
eral
Elec
tric
Roc
he
Cov
idie
n
Abbo
ttLa
bora
torie
s
Philip
s
Stry
ker
Nov
artis
WW
Med
tech
Sal
es ($
bn)
Note: *Analysis is based on the Top 120 medtech companies. Sales in 2011 based on company reported data. Sales forecasts to 2018 based on a consensus of leading equity analysts' estimates for product sales and segmental sales.
Johnson & Johnson Set to be Clear Market Leader in Medtech Sales in 2018EvaluateMedTech™ consensus forecast finds that Johnson & Johnson is forecast to be number one, in terms of global medtech sales, with $37.8bn in sales in 2018, representing 8.6% global market share*. Johnson & Johnson's position has been bolstered by the June 2012 acquisition of Swiss orthopedics company Synthes for $19.8bn. Overall the top 20 companies in the industry are set to control 54.2% of the market in 2018, which is slightly down on the 2011 figure of 54.6%.
(-) -1 +1 -1 (-) (-) +1
Sales ($bn)CAGR 2011-18 (%)
Ranking Chg. 2011-18 +6%
+3%
+5% +5%
+4% +4% +4% +6%
+4%
1-1+1+
+2%
7
Worldwide Medtech Sales in 2018: Top 20 Companies
7Co
pyr
igh
t ©
201
2 Ev
alu
ateP
har
ma
Ltd
. All
rig
hts
res
erve
d.

Worldwide Medtech vs. Prescription Drug Sales (2005-18)
Worldwide Medtech vs. Prescription Drug Sales (2005-18)
WW Sales ($bn)Year 2005 2006 2007 2008 2009 2010 2011 2012 2013 2014 2015 2016 2017 2018
WW Medtech Sales 215 232 257 283 286 302 325 333 348 366 384 403 421 440 Growth per Year +8.0% +10.8% +10.1% +1.2% +5.6% +7.7% +2.3% +4.5% +5.1% +5.0% +4.8% +4.7% +4.5%Medtech as % of Rx 43.4% 42.8% 42.9% 43.7% 43.2% 44.2% 45.0% 47.0% 47.9% 48.7% 49.3% 49.8% 50.6% 51.3%WW Prescription (Rx) 494 541 598 647 661 683 723 708 726 751 779 808 833 857 Growth per Year +9.4% +10.5% +8.3% +2.2% +3.3% +5.9% -2.1% +2.5% +3.5% +3.7% +3.8% +3.1% +2.9%Source: EvaluateMedTech™ & EvaluatePharma® (28 SEP 2012)
CAGR 11-18WW Medtech Sales
WW Prescription Drug Sales+4.4%+2.5%
Worldwide Medtech vs Prescription Drug Sales 2005-18 Source: EvaluateMedTech™ (28 SEP 2012)
232 257 283 286 302 325 333 348 366 384 403 421
541598
647 661 683723 708 726 751 779 808 833
215
440494
857
0
100
200
300
400
500
600
700
800
900
1,000
2005
2006
2007
2008
2009
2010
2011
2012
2013
2014
2015
2016
2017
2018
WW
Med
tech
& R
x Sa
les
($bn
)
WW Medtech Sales: +4.4% CAGR 2011-18
Medtech Set to Outperform Prescription Drug Market with 4.4% (CAGR) Growth vs. 2.5% (CAGR) between 2011 to 2018EvaluateMedTech™ consensus forecast finds that the worldwide market for medtech products is set to outperform the prescription drug market growth with +4.4% per year (CAGR) between 2011 and 2018, versus a more modest +2.5% growth for the drug market. In the 12 year period from 2006 to 2018 prescription drug sales growth only exceeded medtech's performance in two years, 2006 and 2009. Because of this higher growth rate, medtech sales are forecast to equate to 51.3% of prescription sales in 2018, up from 43.4% observed in 2005.
Note: Prescription drug sales based on Top 500 pharmaceutical and biotech companies from EvaluatePharma®.Sales to 2011 based on company reported sales data. Sales forecasts to 2018 based on a consensus of leading equity analysts' estimates for company product sales and segmental sales.
WW Growth Rate: Medtech vs. Prescription Drug Sales 2006-1810%
6%
8%
2%
5% 5% 5% 5% 5% 4%
9%8%
3%
6%
-2%
3%4% 4% 4% 3% 3%
1%
8%11%
2%
11%
-4%
-2%
0%
2%
4%
6%
8%
10%
12%
2006
2007
2008
2009
2010
2011
2012
2013
2014
2015
2016
2017
2018
WW
Sal
es G
row
th %
MedTech Growth per YearPrescription (Rx) Growth per Year
WW Prescription Sales: +2.5% CAGR 2011-18
2009: World economy contracted -2.2%
2012: Euro crisis impacts euro sales converted to dollars.
8
Worldwide Medtech vs. Prescription Drug Sales (2005-18)
8Co
pyr
igh
t ©
201
2 Ev
alu
ateP
har
ma
Ltd
. All
rig
hts
res
erve
d.

Worldwide Medtech R&D Spend (2005-2018)
Worldwide Medtech R&D Spend by Medtech Companies (2005-2018)
WW Medtech R&D & Medtech Sales ($bn)Year 2005 2006 2007 2008 2009 2010 2011 2012 2013 2014 2015 2016 2017 2018
Medtech R&D Spend 12.7 14.4 16.7 18.3 18.0 18.7 20.2 20.3 20.9 21.7 22.6 23.5 24.4 25.3Growth per Year +13.2% +16.1% +9.4% -1.5% +3.7% +8.1% +0.7% +2.8% +4.0% +4.1% +3.9% +3.9% +3.6%WW Medtech Sales 215 232 257 283 286 302 325 333 348 366 384 403 421 440R&D as % of Medtech Sales 5.9% 6.2% 6.5% 6.5% 6.3% 6.2% 6.2% 6.1% 6.0% 5.9% 5.9% 5.8% 5.8% 5.8%R&D as % of Medtech Sales (Top 20 in 2018) 8.3% 7.5%Source: EvaluateMedTech™ (28 SEP 2012) CAGR 11-18 on Medtech R&D Spend
Cumulative 5 year R&D Spend (2007-11) $92bnCAGR 07-11 on Medtech R&D Spend +4.8%
+3.3%
Worldwide Total Medtech R&D Spend in 2005-18EvaluateMedTech™ (28 SEP 2012)
1314
1718 18 19
20 20 21 22 23 24 24 25+13.2%
+16.1%
+9.4%
+3.7%
+0.7%
+2.8%+4.0% +4.1% +3.9% +3.9% +3.6%
+8.1%
-1.5%0
5
10
15
20
25
30
2005
2006
2007
2008
2009
2010
2011
2012
2013
2014
2015
2016
2017
2018
WW
Med
tech
R&
D S
pend
($bn
)
-4%
-2%
0%
2%
4%
6%
8%
10%
12%
14%
16%
18%
R&
D S
pend
Gro
wth
%
Global Medtech R&D Spend Set to Grow by 3.3% (CAGR) to $25.3bn by 2018EvaluateMedTech™ consensus forecast finds that worldwide medtech R&D is expected to grow at a healthy 3.3% per year (CAGR) between 2011 and 2018 to $25.3bn . The overall R&D investment rate is expected to be around 5.8% of sales in 2018, slightly down from the 6.2% observed in 2011. Within the Top 20 companies the reinvestment rate is higher at 7.5% in 2018, versus 8.3% in 2018.
Note: Analysis is based on the Top 120 medtech companies. R&D spend in 2011 based on company reported data. Forecast medtech research and development spend based on a consensus of leading equity analysts' estimates for company level R&D spend, extrapolated to medtech R&D when a company has non-medtech R&D activity.Medtech R&D is not disclosed by a number of companies and this analysis is limited to those companies with sufficient disclosure.
+3.3% CAGR 2011-18
9
Worldwide Medtech R&D Spend (2005-2018)
9Co
pyr
igh
t ©
201
2 Ev
alu
ateP
har
ma
Ltd
. All
rig
hts
res
erve
d.

Medtech R&D Spend in 2018: Top 20 Companies
Medtech R&D Spend (2011/18): Top 20 Companies & Total Market
Rank1102ynapmoC 2018 CAGR 11-18 Chg. (+/-) 2011 2018 Chg. (+/-)
1 Johnson & Johnson 1,751 2,072 +2% - 6.8% 5.5% -1.3%2 Siemens 1,674 1,987 +2% - 9.6% 9.9% +0.3%3 Medtronic 1,490 1,814 +3% - 9.2% 8.9% -0.3%4 General Electric 949 1,166 +3% +2 9.8% 8.7% -1.1%5 Philips 986 1,101 +2% - 10.8% 9.5% -1.3%6 Roche 1,018 1,047 +0% -2 10.0% 7.8% -2.2%7 Boston Scientific 895 997 +2% - 11.7% 12.3% +0.5%8 Abbott Laboratories 851 996 +2% - 8.6% 8.1% -0.5%9 St. Jude Medical 705 873 +3% - 12.6% 12.0% -0.5%
10 Covidien 554 798 +5% - 5.8% 6.1% +0.4%11 Danaher 419 615 +6% +2 8.9% 7.4% -1.4%12 Stryker 462 589 +4% - 5.6% 5.2% -0.4%13 Becton Dickinson 476 544 +2% -2 7.3% 6.8% -0.6%14 Terumo 308 458 +6% +1 7.2% 7.5% +0.2%15 Edwards Lifesciences 246 428 +8% +3 14.7% 12.1% -2.5%16 Essilor International 211 343 +7% +7 4.0% 3.8% -0.2%17 Olympus 320 338 +1% -3 7.2% 5.1% -2.1%18 B. Braun Melsungen 250 327 +4% -1 3.9% 3.9% -0.0%19 Intuitive Surgical 122 317 +15% +18 7.0% 7.1% +0.2%20 Zimmer 239 292 +3% -1 5.4% 5.3% -0.1%
Total Top 20 13,927 17,101 +3% 8.3% 7.5% -0.8%Other 6,274 8,226 +4%Total 20,201 25,328 +3% 6.2% 5.8%
Source: EvaluateMedTech™ (28 SEP 2012)
R&D As a % of Medtech SalesMedtech R&D ($m)
Medtech R&D in 2018: Top 10 CompaniesSource: EvaluateMedTech™ (28 SEP 2012)
2,072 1,9871,814
1,166 1,101 1,047 997 996873 798
0
500
1,000
1,500
2,000
2,500
John
son
&Jo
hnso
n
Siem
ens
Med
troni
c
Gen
eral
Elec
tric
Philip
s
Roc
he
Bost
onSc
ient
ific
Abbo
ttLa
bora
torie
s
St. J
ude
Med
ical
Cov
idie
n
Med
tech
R&
D S
pend
($bn
)
Note: Forecast medtech R&D spend based on a consensus of leading equity analysts' estimates for company level R&D spend.
Johnson & Johnson Remains Top Medtech R&D Spender in 2018EvaluateMedTech™ consensus forecast finds Johnson & Johnson spending the most on medtech research and development by 2018, with a spend of $2.1bn. Of the top 20 companies, robotic surgical manufacturer Intuitive Surgical, is forecast to grow R&D spend the most, with a forecast 15% increase per year (CAGR) from $122m in 2011 to $317m in 2018.
+2% +2%
+3% 0% +2%
+3%
+2%
+3% +5%
R&D Spend ($m)CAGR 2011-18 (%)
+2%
10
Medtech R&D Spend in 2018: Top 20 Companies
10Co
pyr
igh
t ©
201
2 Ev
alu
ateP
har
ma
Ltd
. All
rig
hts
res
erve
d.

FDA Device Approval Analysis: 2004 to 2011
FDA Approval Count (1st PMAs/ HDEs/ Supplementary PMAs/ 510-Ks)
Year 2004 2005 2006 2007 2008 2009 2010 20111st Time PMA/ HDE/ PDP 53 34 44 32 30 18 22 43 % Chg. -36% +29% -27% -6% -40% +22% +95%Supplementary PMA/ PDP 589 735 1062 1117 1488 1498 1841 2192 % Chg. +25% +44% +5% +33% +1% +23% +19%510-K 3435 3207 3260 3034 3104 3044 2854 3145 % Chg. -7% +2% -7% +2% -2% -6% +10%Total 4077 3976 4366 4183 4622 4560 4717 5380 % Chg. -2% +10% -4% +10% -1% +3% +14%
2011: FDA Approval Count (1st Time PMAs/ HDEs/ PDPs/ 510-Ks) & Medtech R&D Spend
Company1 Medtronic2 Boston Scientific3 Johnson & Johnson4 Abbott Laboratories5 St. Jude Medical6 Roche7 Siemens8 Novartis9 General Electric
10 HologicTotal
74913
3,145
5044
5,380
392610423122453
1921028451
780271240226
PMA/ HDEs - First Approval
PMA/ PDPs - Suppl.
510-k Approval
Total Approvals
2 2434 737
4 1994 132
7 711 179
0 441 30
851705
1,0181,674
R&D Spend ($m)1,490895
1,751
261949117
43 2,192 9,7112 290 1
FDA Approval Count: 1st PMA/HDE/PDPs & 510-K Per Year Source: EvaluateMedTech™ (28 SEP 2012)
53
34
44
3230
1822
43
34353207 3260
3034 3104 30442854
3145
589735
1062 1117
1498
1841
2192
1488
0
10
20
30
40
50
60
2004 2005 2006 2007 2008 2009 2010 2011
No.
of 1
st P
MA
/ HD
E/ P
DP
0
500
1000
1500
2000
2500
3000
3500
4000
No.
of S
up P
MA
s/ 5
10-K
s
1st Time PMA/ HDE/ PDP 510-K Supplementary PMA/ PDP
Number of 1st Time PMAs Increases 95% to 43; 510-K Approvals Up 10% to 3,145EvaluateMedTech™ found that the FDA approved 43 new PMAs/HDEs/PDPs (1st time approvals) in 2011, an increase of 95% from the 2010 figure of 22. In 2011 Roche had the most 1st PMA/HDE approvals with 7, whilst Medtronic had the most approvals with 780.
Note: Based on Devices@FDA data to 6 September 2012. PMA (Pre-market Approval): a class III device which is a ‘life-sustaining or life-supporting implantable device'; usually require trials. 510-K: "substantially equivalent” to a legally marketed Class I,II, III (where PMA not required). HDE (Humanitarian Device Exemption): a device for treating or diagnosing a disease/condition that affects >4,000 individuals in the US per year.
11
FDA Device Approval Analysis: 2004 to 2011
11Co
pyr
igh
t ©
201
2 Ev
alu
ateP
har
ma
Ltd
. All
rig
hts
res
erve
d.
2012 FDA First Time PMA Approvals
2012 FDA First Time PMA Approvals
eciveDemaN edoC tcudorPynapmoC3 leveL2 leveL1 leveL NameCardiology Electrophysiology Cardiac Ablation
Catheters25 Jan 12 St. Jude
MedicalCatheter, Percutaneous, Cardiac Ablation, For Treatment Of Atrial Flutter
THERAPY COOL PATH DUO/ SAFIRE BLU DUO ABLATION CATHETER AND IBI 1500T9-CP V1.6 CARDIAC ABLATION GENERATOR (P110016)
Cardiology Interventional Cardiology
Drug-Eluting Coronary Stents
17 Feb 12 Medtronic Coronary Drug-Eluting Stent RESOLUTE MICROTRAC/RESOLUTE INTEGRITY ZOTAROLIMUS-ELUTING CORONARY STENT SYSTEM (P110013)
Cardiology Interventional Cardiology
Non-Drug-Eluting Coronary Stents
12 Apr 12 Medinol Stent, Coronary PRESILLION PLUS COCR CORONARY STENT RX SYSTEM (P110004)
Cardiology Interventional Cardiology
Peripheral Vascular Devices
22 Feb 12 Abbott Laboratories
Stent, Iliac ABSOLUTE PRO VASCULAR SELF-EXPANDING STENT SYSTEM (P110028)
Cardiology Interventional Cardiology
Peripheral Vascular Devices
07 Mar 12 Covidien Stent, Superficial Femoral Artery
EVERFLEX SELF-EXPANDING PERIPHERAL STENT SYSTEM (EVERFLEX) (P110023)
Cardiology Interventional Cardiology
Peripheral Vascular Devices
13 Apr 12 Boston Scientific
Stent, Iliac EPIC SELF-EXPANDING NITINOL STENT SYSTEM (P110035)
Cardiology Interventional Cardiology
Peripheral Vascular Devices
31 Jul 12 Abbott Laboratories
Stent, Iliac OMNILINK ELITE PERIPHERAL BALLOON-EXPANDABLE STENT SYSTEM (P110043)
Diagnostic Imaging Other Diagnostic Imaging
Image Analyser Systems
23 Jan 12 VuCOMP Analyzer,Medical Image M-VU ALGORITHM ENGINE (P100005)
Diagnostic Imaging Other Diagnostic Imaging
Image Analyser Systems
10 Feb 12 Almen Laboratories
Analyzer,Medical Image BREAST COMPANION SOFTWARE SYSTEM (P100007)
Drug Delivery Infusion Systems Infusion Pumps 07 Feb 12 Flowonix Medical
Pump, Infusion, Implanted, Programmable
PROMETRA PROGRAMMABLE INFUSION PUMP SYSTEM (P080012)
Gastroenterology Gastrointestinal Therapeutic Devices
Other Gastrointestinal Therapeutic Devices
22 Mar 12 TORAX Medical
Implant, Anti-Gastroesophageal Reflux
LINX REFLUX MANAGEMENT SYSTEM (P100049)
General & Plastic Surgery
Surgical Prosthetic Devices
Breast Prosthesis 09 Mar 12 Sientra Prosthesis, Breast, Noninflatable, Internal, Silicone Gel-Filled
SIENTRA SILICONE GEL BREAST IMPLANTS (P070004)
In Vitro Diagnostics (IVD)
Histology & Cytology
Other Histology & Cytology Devices
18 Apr 12 Danaher System, Test, Her-2/Neu, Ihc BOND ORACLE HER2 IHC SYSTEM (P090015)
In Vitro Diagnostics (IVD)
Immunoassays Bacterial Immunoassays
22 Feb 12 Otsuka Holdings
Test, Urea Adult And Pediatric (Breath),
BREATHTEK UBT FOR H. PYLORI KIT AND PEDIATRIC UREA HYDROLYSIS RATE CALCULATION APPLICATION (PUHR-CA), VERSION 1.0 (P100025)
In Vitro Diagnostics (IVD)
Immunoassays Oncology Immunoassays
EHT NO ASP2P HCETIRBYH SSECCAasp2PrehanaD21 nuJ 41 ACCESS IMMUNOASSAY SYSTEMS (P090026)
In Vitro Diagnostics (IVD)
Immunoassays Viral Immunoassays 03 Jan 12 Roche Test, Hepatitis B (B Core, Be Antigen, Be Antibody, B Core Igm)
ELECSYS ANTI-HBC IGM IMMUNOASSAY AND ELECSYS PRECICONTROL ANTI-HBC IGM (P110031)
In Vitro Diagnostics (IVD)
Immunoassays Viral Immunoassays 20 Jan 12 Siemens Test, Hepatitis B (B Core, Be Antigen, Be Antibody, B Core Igm)
ADVIA CENTAUR ANTI-HBS2 (AHBS2) ASSAY AND QAULITY CONTROL MATERIAL (P100039)
In Vitro Diagnostics (IVD)
Immunoassays Viral Immunoassays 12 Apr 12 Abbott Laboratories
Test, Hepatitis B (B Core, Be Antigen, Be Antibody, B Core Igm)
ARCHITECT HBSAG QUALITATIVE, QUALITATIVE CONFIRMATORY, CONFIRMATORY MANUAL DILUENT, CALIBRATORS, AND CONTROLS (P110029)
In Vitro Diagnostics (IVD)
Immunoassays Viral Immunoassays 03 Jul 12 OraSure Technologies
Unclassified ORAQUICK® IN-HOME HIV TEST (BP120001)
In Vitro Diagnostics (IVD)
Molecular Diagnostics
Infectious Disease Molecular Diagnostics
05 Jul 12 Roche Unclassified COBAS« AMPLIPREP/COBAS« TAQMAN« CMV TEST (CAP/CTM CMV TEST) (P110037)
In Vitro Diagnostics (IVD)
Molecular Diagnostics
Oncology Molecular Diagnostics
13 Feb 12 Hologic Prostrate Cancer Genes Nucleic Acid Amplification Test System
PROGENSA PCA3 ASSAY (P100033)
In Vitro Diagnostics (IVD)
Molecular Diagnostics
Oncology Molecular Diagnostics
06 Jul 12 QIAGEN Somatic Gene Mutation Detection System
THERASCREEN KRAS RGQ PCR KIT (P110030)
Ophthalmics Ophthalmic Prosthetic Devices
Other Ophthalmic Prosthetic Devices
25 Jun 12 Glaukos Intraocular Pressure Lowering Implant
GLAUKOS ISTENT TRABECULAR BYPASS STENT MODEL GTS100R/L (P080030)
Ophthalmics Ophthalmic Surgical Devices
Viscoelastics 02 Jul 12 Abbott Laboratories
Aid, Surgical, Viscoelastic HEALON ENDOCOAT OPVISCOSURGICAL OPHTHALMIC DEVICE (OVD) (3% SODIUM HYALURONATE) (P110007)
Source: Source: EvaluateMedTech™ (28 SEP 2012)
EvaluateMedTech Device Classification Decision Date
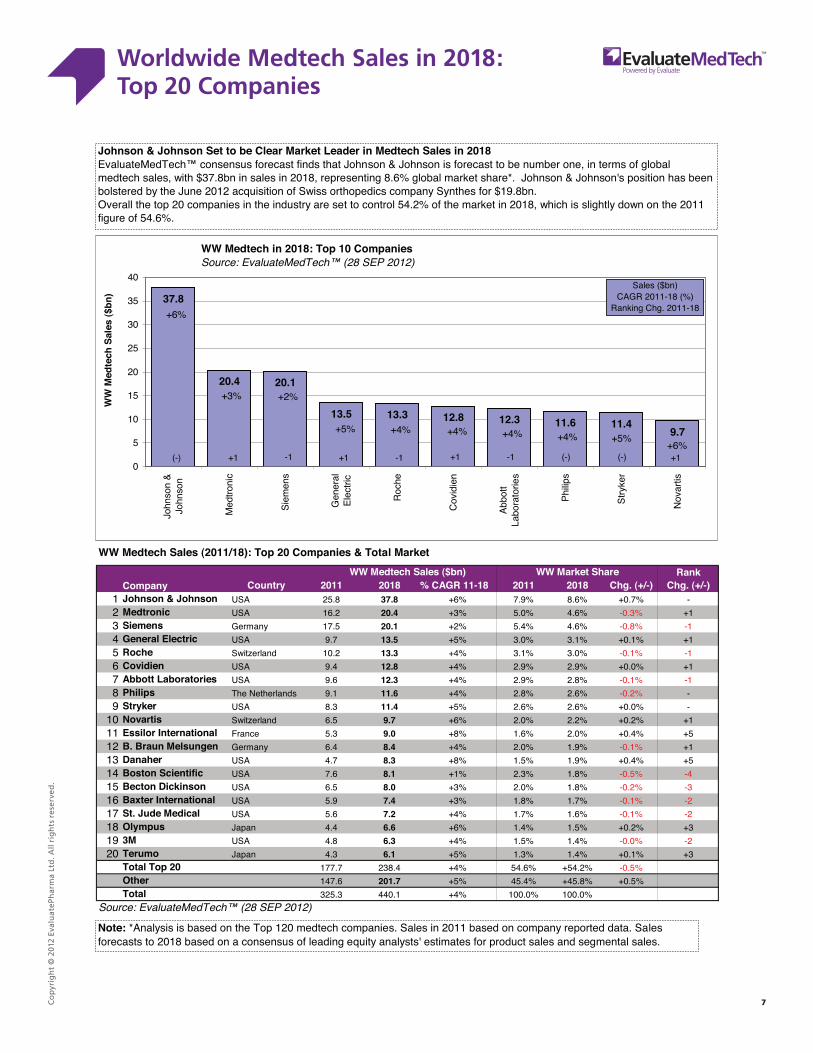
FDA Approves 24 New PMAs in 2012 to DateEvaluateMedTech™ found that the FDA had approved 24 new PMAs (pre-market approvals) in 2012 to September 6th. In vitro diagnostics had 10 approvals, ahead of cardiology with 7 approvals.
Note: *Devices@FDA data to 6 September 2012.
12
2012 FDA First Time PMA Approvals
12Co
pyr
igh
t ©
201
2 Ev
alu
ateP
har
ma
Ltd
. All
rig
hts
res
erve
d.

In Vitro Diagnostics (IVD) Market to 2018
Analysis on Worldwide Sales, Market Share & Sales Growth (2011-18)
Top 10 Companies & Total Worldwide In Vitro Diagnostics Sales 2011-18
CAGR Rank Chg. 81-11028102110281-110281021102ynapmoCknaR
1 Roche 7,149 9,908 +5% 17.7% 18.2% -2 Danaher 2,715 5,745 +11% 6.7% 10.5% +23 Siemens 5,114 5,743 +2% 12.7% 10.5% -14 Abbott Laboratories 4,126 5,646 +5% 10.2% 10.4% -15 Thermo Fisher Scientific 2,466 3,807 +6% 6.1% 7.0% +16 Becton Dickinson 2,480 3,141 +3% 6.2% 5.8% -17 Sysmex 1,615 3,077 +10% 4.0% 5.6% +48 Alere 1,814 2,776 +6% 4.5% 5.1% -9 Johnson & Johnson 2,164 2,570 +2% 5.4% 4.7% -2
10 bioMérieux 1,638 2,091 +4% 4.1% 3.8% -Top 10 31,282 44,503 +5% 77.6% 81.6%Other 9,025 10,032 +2% 22.4% 18.4%
635,45703,04yrtsudnI latoT +4.4% 100.0% 100.0%Source: EvaluateMedTech™ (28 SEP 2012); Consensus sales from equity analysts' reports
WW Sales ($m) WW Market Share
0%
20%
40%
60%
80%
100%
120%
140%
0 0.2 0.4 0.6 0.8 1 1.2 1.4
% Sales Growth: CAGR 2011-18
WW
Mar
ket S
hare
%
Takeda: Actos generic competition expected 2012.
Note: Bubble = WW Sales in 2018
Novo: Solid growth in its core insulin franchise, including Tresiba (insulin degludec), and GLP-1 Victoza (liraglutide).
Merck: Strong growth in DPP-IV i hibit f hi
Roche Clear Leader within In Vitro Diagnostics Market EvaluateMedTech® consensus forecast finds Swiss giant Roche is the clear market leader within in vitro diagnostics with sales of $9.9bn in 2018, and an 18% market share*. The USA company Danaher is expected to jump to second spot with sales of $5.7bn, boosted by the acquisition of Beckman Coulter for $6.8bn, in June 2011. Overall the in vitro diagnostics market continues to grow rapidly as emerging markets invest in healthcare infrastructure, drugs become increasingly linked to diagnostic tests and laboratories continue to invest to improve efficiency.
Abbott Laboratories
Thermo Fisher Scientific
Roche
Danaher Siemens
0%
5%
10%
15%
20%
25%
-2% +0% +2% +4% +6% +8% +10% +12% +14% +16%
% Sales Growth: CAGR 2011-18
WW
Mar
ket S
hare
%
Note: Bubble = WW Sales in 2018
Source: EvaluateMedTech™ (28 SEP 2012)
Note: *Excludes Glucose Test Systems which is included in Diabetic Care classification
Danaher: Growth impacted by Beckman Coulter acquisition in June 2011.
13
In Vitro Diagnostics (IVD) Market to 2018
13Co
pyr
igh
t ©
201
2 Ev
alu
ateP
har
ma
Ltd
. All
rig
hts
res
erve
d.

Cardiology Market to 2018
Analysis on Worldwide Sales, Market Share & Sales Growth (2011-18)
Top 10 Companies & Total Worldwide Cardiology Sales 2011-18
CAGR Rank Chg. 81-11028102110281-110281021102ynapmoCknaR
1 Medtronic 8,482 10,354 +3% 23.5% 21.4% -2 St. Jude Medical 5,193 6,555 +3% 14.4% 13.6% +13 Boston Scientific 5,460 5,122 -1% 15.1% 10.6% -14 Abbott Laboratories 2,958 3,565 +3% 8.2% 7.4% -5 Edwards Lifesciences 1,645 3,491 +11% 4.6% 7.2% +36 Johnson & Johnson 2,288 2,645 +2% 6.3% 5.5% -17 Getinge 1,700 2,605 +6% 4.7% 5.4% -8 Terumo 1,774 2,563 +5% 4.9% 5.3% -29 Covidien 1,426 2,391 +8% 4.0% 4.9% -
10 Asahi Kasei - 1,416 - 2.9% New EntryTop 10 30,927 40,708 +4% 85.7% 84.2%Other 5,173 7,627 +6% 14.3% 15.8%
533,84001,63yrtsudnI latoT +4% 100.0% 100.0%Source: EvaluateMedTech™ (28 SEP 2012); Consensus sales from equity analysts' reports.
WW Sales ($m) WW Market Share
Takeda: Actos generic competition expected 2012.
Note: Bubble = WW Sales in 2018
Merck: Strong growth in DPP-IV i hibit f hi
Takeda: Actos generic competition expected 2012.
Note: Bubble = WW Sales in 2018
Merck: Strong growth in DPP-IV i hibit f hi
Medtronic Set to Maintain Number 1 Position in Cardiology to 2018EvaluateMedTech™ consensus forecast finds that Medtronic will remain the world's number one cardiology company with global sales of $10.4bn in 2018 and a market share of 21%. Edwards Lifesciences is set to be the fastest growing cardiology company recording 11% per year growth (CAGR) between 2011 & 2018, driven by its transcatheter heart valves segment. Asahi Kasei enters the Top 10 after the April 2012 acquisition of US listed ZOLL Medical for $2.2bn.
Abbott Laboratories Edwards Lifesciences
Medtronic
St. Jude Medical
Boston Scientific
0%
5%
10%
15%
20%
25%
30%
-4% -2% +0% +2% +4% +6% +8% +10% +12% +14% +16%
% Sales Growth: CAGR 2011-18
WW
Mar
ket S
hare
%
Note: Bubble = WW Sales in 2018
Source: EvaluateMedTech™ (28 SEP 2012)
Note: *General Electric & Philips do not dislose cardiology sales.
Edwards: Solid growth in transcatheter heart valves segment.
14
Cardiology Market to 2018
14Co
pyr
igh
t ©
201
2 Ev
alu
ateP
har
ma
Ltd
. All
rig
hts
res
erve
d.

Diagnostic Imaging Market to 2018
Analysis on Worldwide Sales, Market Share & Sales Growth (2011-18)
Top 10 Companies & Total Worldwide Diagnostic Imaging Sales 2011-18
CAGR Rank Chg. 81-11028102110281-110281021102ynapmoCknaR
1 Siemens 10,242 11,928 +2% 28.6% 26.2% -2 General Electric 8,330 11,532 +5% 23.3% 25.3% -3 Philips 4,682 5,962 +4% 13.1% 13.1% -4 Toshiba 4,445 5,852 +4% 12.4% 12.8% -5 Carestream Health 1,538 2,031 +4% 4.3% 4.5% -6 Hitachi Medical 1,458 1,848 +3% 4.1% 4.1% -7 Konica Minolta 926 1,157 +3% 2.6% 2.5% +18 Agfa-Gevaert 999 918 -1% 2.8% 2.0% -19 Shimadzu 641 853 +4% 1.8% 1.9% -
10 Varian Medical Systems 469 746 +7% 1.3% 1.6% +1Top 10 33,730 42,828 +3% 94.2% 94.0%Other 2,089 2,722 +4% 5.8% 6.0%
055,54918,53yrtsudnI latoT +3.5% 100.0% 100.0%Source: EvaluateMedTech™ (28 SEP 2012); Consensus sales from equity analysts' reports
WW Sales ($m) WW Market Share
Siemens and General Electric Battle it Out for Top Spot in 2018EvaluateMedTech™ consensus forecast finds that Siemens is set to continue to be the world's leading diagnostic imaging company in 2018 based on worldwide sales of $11.9bn, and a 26% market share. General Electric is set to close the gap on Siemens with sales expected to grow by 5% per year (CAGR) to $11.5bn in 2018. Overall the diagnostic imaging market is set to grow at 3.5% per year (CAGR) to $45.6bn in 2018.
General Electric Siemens
Philips Toshiba
Carestream Health
0%
5%
10%
15%
20%
25%
30%
35%
+0% +1% +2% +3% +4% +5% +6%
% Sales Growth: CAGR 2011-18
WW
Mar
ket S
hare
%
Note: Bubble = WW Sales in 2018
Source: EvaluateMedTech™ (28 SEP 2012)
Note: Segment sales includes servicing of machines.FUJIFILM Holdings sales are not available
15
Diagnostic Imaging Market to 2018
15Co
pyr
igh
t ©
201
2 Ev
alu
ateP
har
ma
Ltd
. All
rig
hts
res
erve
d.

Orthopedics Market to 2018
Analysis on Worldwide Sales, Market Share & Sales Growth (2011-18)
Top 10 Companies & Total Worldwide Orthopedics Sales 2011-18
CAGR Rank Chg. 81-11028102110281-110281021102ynapmoCknaR
1 Johnson & Johnson 5,232 11,145 +11% 17.3% 29.8% -2 Stryker 4,764 6,081 +4% 15.8% 16.2% -3 Zimmer 4,204 5,183 +3% 13.9% 13.8% -4 Biomet 2,570 3,444 +4% 8.5% 9.2% +25 Medtronic 3,267 3,326 +0% 10.8% 8.9% -6 Smith & Nephew 2,335 2,656 +2% 7.7% 7.1% +17 NuVasive 531 902 +8% 1.8% 2.4% +18 Sanofi 385 796 +11% 1.3% 2.1% +39 Orthofix International 470 632 +4% 1.6% 1.7% +1
10 Wright Medical Group 513 588 +2% 1.7% 1.6% -1Top 10 24,271 34,752 +5% 80.3% 92.8%Other 5,964 2,703 -11% 19.7% 7.2%
554,73532,03yrtsudnI latoT +3.1% 100.0% 100.0%Source: EvaluateMedTech™ (28 SEP 2012); Consensus sales from equity analysts' reports
WW Sales ($m) WW Market Share
Johnson & Johnson
Stryker
Zimmer
Biomet Medtronic
0%
5%
10%
15%
20%
25%
30%
35%
40%
-4% -2% +0% +2% +4% +6% +8% +10% +12% +14% +16%% Sales Growth: CAGR 2011-18
WW
Mar
ket S
hare
%
Note: Bubble = WW Sales in 2018Note: Bubble = WW Sales in 2018
Johnson & Johnson Set to Dominate Orthopedics Market After Synthes AcquisitionEvaluateMedTech™ consensus forecast finds that Johnson & Johnson is now set to be the clear dominant force in orthopedics, following the acquisition of Synthes for $19.7bn in June 2012. Johnson & Johnson is set to command a market share of 30% in 2018, up from 17.3% seen in 2011. Sanofi is a surprise entrant within the Top 10 in 2018, due to the predicted strong performance of its Synvisc orthobiologics business, which it acquired as part of the acquisition of Genzyme in 2011.Overall the orthopedics market is set to grow at 3.1% per year (CAGR), slower growth than the medtech industry as a whole.
Note: Bubble = WW Sales in 2018
Source: EvaluateMedTech™ (28 SEP 2012)
JNJ: Acquired Synthes in June 2012 for $19.7bn.
16
Orthopedics Market to 2018
16Co
pyr
igh
t ©
201
2 Ev
alu
ateP
har
ma
Ltd
. All
rig
hts
res
erve
d.

Ophthalmics Market to 2018
Analysis on Worldwide Sales, Market Share & Sales Growth (2011-18)
Top 10 Companies & Total Worldwide Ophthalmics Sales 2011-18
CAGR Rank Chg. 81-11028102110281-110281021102ynapmoCknaR
1 Novartis 6,001 9,182 +6% 26.1% 27.1% -2 Essilor International 5,283 8,959 +8% 23.0% 26.4% -3 Johnson & Johnson 2,916 3,895 +4% 12.7% 11.5% -4 HOYA 1,935 2,821 +6% 8.4% 8.3% +15 Bausch + Lomb 2,060 2,649 +4% 8.9% 7.8% -16 Carl Zeiss 1,793 2,258 +3% 7.8% 6.7% -7 The Cooper Companies 1,121 1,698 +6% 4.9% 5.0% -8 Abbott Laboratories 1,111 1,445 +4% 4.8% 4.3% -9 TOPCON 413 538 +4% 1.8% 1.6% -
10 NIDEK 352 499 +5% 1.5% 1.5% -Top 10 22,985 33,944 +6% 99.9% 100.0%Other 32 0 0.1% 0.0%
449,33710,32yrtsudnI latoT +5.7% 100.0% 100.0%Source: EvaluateMedTech™ (28 SEP 2012); Consensus sales from equity analysts' reports
WW Sales ($m) WW Market Share
0%
20%
40%
60%
80%
100%
120%
140%
0 0.2 0.4 0.6 0.8 1 1.2 1.4
% Sales Growth: CAGR 2011-18
WW
Mar
ket S
hare
%
Takeda: Actos generic competition expected 2012.
Note: Bubble = WW Sales in 2018
Novo: Solid growth in its core insulin franchise, including Tresiba (insulin degludec), and GLP-1 Victoza (liraglutide).
Merck: Strong growth in DPP-IV i hibit f hi
Novartis Leads Opthalmics Market to 2018EvaluateMedTech™ consensus forecast finds that Novartis will be the leading ophthalmics company in 2018 with global sales of $9.2bn. French company Essilor is predicted to be a close second with sales of $9.0bn.Overall the ophthalmics market as a whole is set to record a brisk 5.7% per year growth (CAGR), between 2011 & 2018, with all Top 10 companies recording near market growth.
Novartis Essilor International
Johnson & Johnson
HOYA Bausch + Lomb
0%
5%
10%
15%
20%
25%
30%
35%
+0% +1% +2% +3% +4% +5% +6% +7% +8% +9% +10%
% Sales Growth: CAGR 2011-18
WW
Mar
ket S
hare
%
Note: Bubble = WW Sales in 2018
Source: EvaluateMedTech™ (28 SEP 2012)
NVS: Benefitting from strong growth from Alcon surgical division (AUG 2010: Acquired remaining 52% for $28bn).
17
Ophthalmics Market to 2018
17Co
pyr
igh
t ©
201
2 Ev
alu
ateP
har
ma
Ltd
. All
rig
hts
res
erve
d.
M&A Analysis: 2007 to H1 2012
Count of Medtech M&A Deals vs. Total Medtech M&A Value (2007 - H1 2012)
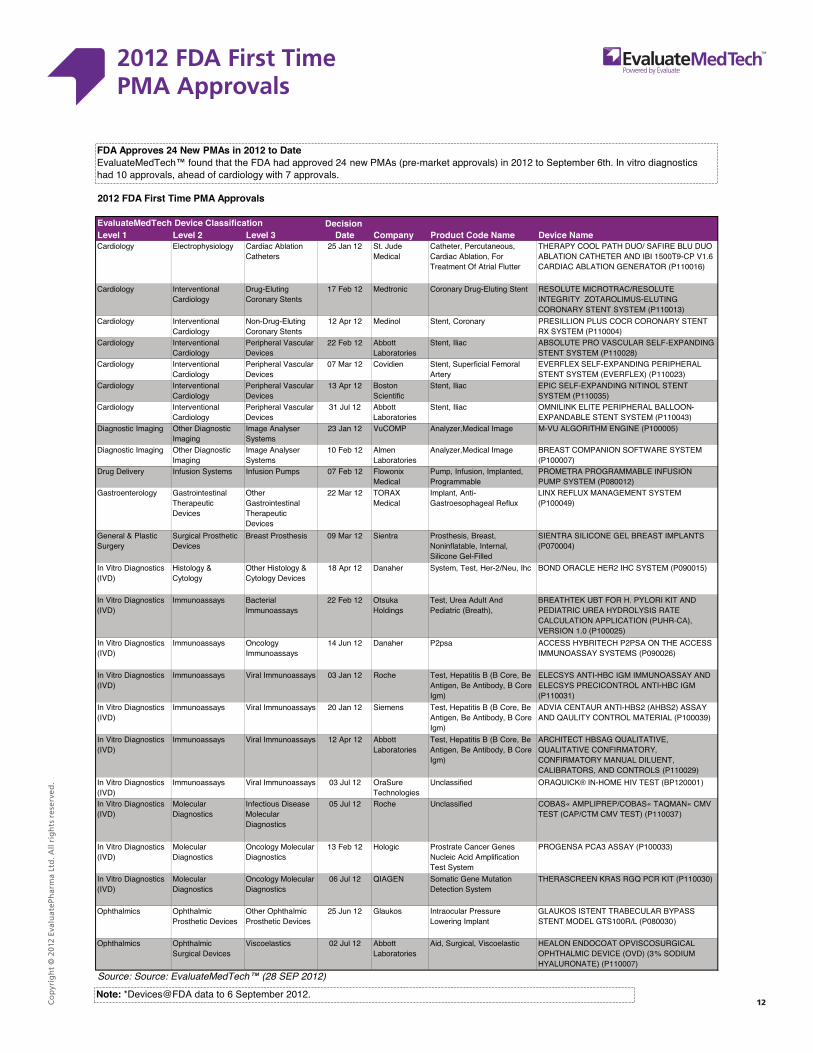
Year 2007 2008 2009 2010 2011 H1 2011 H1 2012Deal Count 173 149 127 176 184 99 57 % Chg. -14% -15% 39% 5% -42%Deal Value ($bn) 51 36 13 51 75 54 29 % Chg. -31% -64% 297% 47% -46%
Top 10 MedTech M&A Closed Deals in H1 2012: Ranked on Deal Value
Completion Deal)nb$( eulaVetaDroriuqcA)sutatS( yrtnuoCtegraT
nuJ 41nosnhoJ & nosnhoJ)detsiL( dnalreztiwSsehtnyS1 12 19.72 ZOLL Medical USA (Listed) Asahi Kasei 26 Apr 12 2.2
21 nuJ 12seigolonhceT tneligA)etavirP( kramneDokaD3 2.24 Cameron Health USA (Private) Boston Scientific 08 Jun 12 1.4
0.121 raM 92sgnidloH MLIFIJUF)detsiL( ASUetiSonoS5nuJ 62moR-lliH)etavirP( ASUstcudorP lacigruS nepsA6 12 0.4
7 Navilyst Medical USA (Private) AngioDynamics 22 May 12 0.43.021 naJ 50neidivoC)etavirP( ASUlacideM XRRÂB8
9 Synovis Life Technologies USA (Listed) Baxter International 14 Feb 12 0.33.021 nuJ 62neidivoC)detsiL( learsInoidirO01
Other 0.7Total 28.9
Source: Source: EvaluateMedTech™ (28 SEP 2012)
Count of Pharma M&A Deals vs. Total Pharma M&A Value (2005 - 2009) Source: EvaluatePharma® (30 APR 2010)
$51bn $36bn $51bn $75bn$13bn
173
149
127
176 184
0
50
100
150
200
250
300
350
2007 2008 2009 2010 2011
Dea
l Val
ue ($
bn)
0
50
100
150
200
250
300
Dea
l Cou
nt
Deal Value Deal Count
M&A Deal Value Slumps 46% in H1 2012; Deal Count Down 42%EvaluateMedTech™ found that total deal values from M&A involving the acquisition of medtech companies decreased by 46% to $29bn in H1 2012, compared with $54bn in H1 2011. The number of deals also declined significantly (-42%), with 57 deals closed in H1 2012 vs. 99 in H1 2011. In 2011 the number of medtech deals increased 5% to 184 deals, whilst the value of deals expanded 47% to $75bn. H1 2012 has been dominated by the Johnson & Johnson acquisition of Synthes for $19.7bn, but that could not make up for the two mega deals in 2011, which included Sanofi's acquisition of Genzyme for $20.1bn and Novartis buying the remaining share of Alcon it did not already own for $9.6bn, both deals closed in April 2011.
2005FUJ [YAM] ($20.8bn)SAN [DAI] ($15.4bn)
2006SCH [BAY] ($21.3bn)
PFE Cons [JNJ] ($16.6bn)
2007Organon [SGP] ($15.6bn)
MEDI [AZN] ($15.6bn)Serono [Merck] ($13.8bn)
2008Alcon [NVS] ($10.4bn)
2009WYE [PFE] ($68.0bn)
DNA [Roche] ($46.8bn)SGP [MRK] ($41.1bn)
Target [Acquiror] (Deal Value)
173% Growth
Count of Medtech M&A Deals vs. Total Medtech M&A Value (2007 - H1 2012) EvaluateMedTech™ (28 SEP 2012)
nb45$nb15$nb63$ $13bn$51bn nb92$nb57$
149
127
176
99
173
57
184
0
10
20
30
40
50
60
70
80
2007 2008 2009 2010 2011 H1 2011 H1 2012
Dea
l Val
ue ($
bn)
0
20
40
60
80
100
120
140
160
180
200
Dea
l Cou
nt
Deal Value ($bn) Deal Count
2007D Behring (SIE) $7bn
Cytyc (Hologic) $6.2bnBayer Diag. (SIE) $5.3bn
Kyphon (MDT) $3.9bn
2009 A M Optics [ABT]
$2.8bn
Target [Acquiror] (Deal Value)
Note: Analysis based on closing date of deal.*Alcon & Genzyme included in analysis as >25% of company sales are derived from medtech.
2010Alcon* [NVS] $28bnev3 [COV] $2.6bn
2011Genzyme* [SAN]:
$20.1bnAlcon* [NVS] $9.6bnBeckman C [DHR]
$6.8bnKinetic C (P. Equity)
$6.1bn
H1 2012Synthes [JNJ] $19.7bn
2008Alcon* [NVS] $10.4bn
Respironics (Philips) $5.1bnVentana (Roche) $3.4bn
S. Goldway (Philips) $3bn
18
M&A Analysis: 2007 to H1 2012
18Co
pyr
igh
t ©
201
2 Ev
alu
ateP
har
ma
Ltd
. All
rig
hts
res
erve
d.

Venture Financing Analysis: 2007 to H1 2012
Count of Medtech Venture Financing Deals & Value (2007 - H1 2012)
Year 2007 2008 2009 2010 2011 H1 2011 H1 2012Deal Count 157 189 259 292 291 155 121 % Chg. %22-%0%31%73%02Deal Value ($m) 2,684 2,618 3,316 3,415 3,614 1,785 1,946 % Chg. %9%6%3%72%2-
Top 10 Venture Financing Deals in H1 2012: Ranked on Deal Value
laeDetaDdnuoR gnicnaniFyrtnuoCynapmoCValue ($m)
9821 naJ 03E seireSASUSIMrofnoC12 SeraCare Life Sciences USA PIPE 24 Apr 12 82
5621 yaM 13F seireSsdnalrehteN ehTaidnegA35621 raM 82C seireSASUartneiS40621 nuJ 40D seireSASUralucsaVirT5
6 Ariosa Diagnostics USA Series C 09 Jan 12 537 Apollo Endosurgery USA Series B 06 Feb 12 48
5421 raM 31C seireSASUyaRweiV89 Mevion Medical Systems USA Series Undisclosed 24 Jan 12 45
10 Global Blood Resources USA Series A 14 Jun 12 41Other 1,354Total 1,946
EvaluateMedTech™ (28 SEP 2012)
Value of Venture Financing Expands 9% in H1 2012; Deal Count Down 22%EvaluateMedTech™ found that in H1 2012 the total deal value of medtech venture financing increased by 9% to $1.9bn, whilst the number of venture financing deals was down 22% to 121. The continued growth in value of venture financing deals over the last few years is a sign of investor confidence in the medtech sector.In 2011, the medtech venture financing space was almost as large as the pharma/biotech sector which recorded 298 deals, representing $4.1bn in 2011, versus 291 deals and $3.6bn of value in medtech.
Count of Venture Financing Deals vs. Total Venture Financing Value (2007 - H1 2012) EvaluateMedTech™ (28 SEP 2012)
$2,684m $2,618m
$3,415m$3,614m
$1,785m$1,946m
$3,316m
157189
259292 291
155121
0
1000
2000
3000
4000
2007 2008 2009 2010 2011 H1 2011 H1 2012
Dea
l Val
ue ($
m)
0
100
200
300
400
500
600
700
Dea
l Cou
nt
Deal Value Deal Count
Note: Includes investments in medtech companies only. Does not include pharmaceutical or biotech companies. Includes Private Investment in Public Equity (PIPE).
H1 2012 vs. H1 2011
19
Venture Financing Analysis: 2007 to H1 2012
19Co
pyr
igh
t ©
201
2 Ev
alu
ateP
har
ma
Ltd
. All
rig
hts
res
erve
d.

Enterprise Value & Focus Analysis: 2012 Latest vs. 2011
Top 20 Medtech Companies in 2012 (Sales: >$500m): Ranked by Enterprise Value
% '12 SalesCompany Country Medtech 2011 Latest % Growth 2011 Latest % Growth
1 General Electric USA 8% 509.2 558.4 +10% 17.75 22.43 +26%2 Johnson & Johnson USA 41% 166.0 182.4 +10% 65.58 68.90 +5%3 Roche Switzerland 23% 164.0 172.0 +5% 170.56 181.19 +6%4 Novartis Switzerland 12% 152.7 156.6 +3% 57.17 60.57 +6%5 Sanofi France 2% 114.8 125.2 +9% 36.54 44.11 +21%6 Abbott Laboratories USA 25% 94.9 116.7 +23% 55.75 69.86 +25%7 Siemens Germany 17% 91.5 95.1 +4% 95.61 103.14 +8%8 Bayer Germany 4% 63.2 78.3 +24% 63.80 85.49 +34%9 3M USA 17% 57.9 66.1 +14% 81.18 93.58 +15%
10 Medtronic USA 100% 47.2 52.1 +10% 37.78 43.17 +14%11 Danaher USA 46% 37.1 43.0 +16% 47.04 55.02 +17%12 Kimberly-Clark USA 8% 34.4 39.2 +14% 73.56 85.00 +16%13 Baxter International USA 42% 29.9 36.3 +22% 49.19 61.00 +24%14 Covidien USA 83% 24.4 31.3 +28% 45.01 59.63 +32%15 Toshiba Japan 6% 30.0 30.0 +0% 24.26 20.37 -16%16 Fresenius Germany 23% 27.4 29.0 +6% 11.70 14.34 +23%17 Thermo Fisher Scientific USA 23% 22.7 27.7 +22% 44.97 59.72 +33%18 Allergan USA 16% 25.8 26.8 +4% 87.74 90.30 +3%19 Philips The Netherlands 30% 22.5 25.0 +11% 20.95 24.49 +17%20 Essilor International France 93% 15.7 19.9 +27% 35.12 47.83 +36%
Total Top 20 1,731.3 1,911.1 +10% avg. +17%EvaluateMedTech™ (20 SEP 2012)
Enterprise Value ($bn) Share Price ($ ADR)
Global Ranking on Enterprise Value in 2012 (Latest)EvaluateMedTech™ (20 SEP 2012)
$125bn $117bn $78bn $66bn$172bn$558bn $52bn$157bn$182bn $95bn
+26% +25%
+34%
+14%
+8%
+15%
+21%
+6% +6%+5%
0
100
200
300
400
500
600
Gen
eral
Elec
tric
John
son
&Jo
hnso
n
Roc
he
Nov
artis
Sano
fi
Abbo
ttLa
bora
torie
s
Siem
ens
Baye
r
3M
Med
troni
c
Ente
rpris
e Va
lue
($bn
)
+0%
+5%
+10%
+15%
+20%
+25%
+30%
+35%
+40%
Shar
e Pr
ice
Perfo
rman
ce Y
TD (%
)
General Electric No.1 in Latest Enterprise Value RankingsEvaluateMedTech™ found US giant General Electric to be the largest company, by enterprise value ($558bn), operating in the medtech space. General Electric is expected to derive 8% of its 2012 revenues from its medtech segment.Our analysis includes only medtech companies forecast to have sales >$500m in 2012. The analysis reveals the extent to which large diversified companies operate within the medtech space. Only three of the top twenty companies derived more than 50% of sales from medtech; Medtronic, Covidien and Essilor. Even Johnson & Johnson, the clear market leader in medtech, only generates 41% of group sales from medtech.
Note: Includes companies with >$500m medtech sales in 2012.Valuation based on share price close & valuation on 20 September 12.
S&P 2012 YTD Return: +16%
20
Enterprise Value & Focus Analysis: 2012 Latest vs. 2011
20Co
pyr
igh
t ©
201
2 Ev
alu
ateP
har
ma
Ltd
. All
rig
hts
res
erve
d.

About EvaluatePharma® Services
Through our high quality, standardized data and online user platform we deliver integrated Life Science market intelligence and analytical services that help facilitate faster, more trusted analysis of the sector including consensus forecasts of leading financial analysts to 2018.
That’s intelligence our clients can act on to address their critical business issues around:
� Value
� Growth
� Productivity
� Competitive advantage
About Our Services
� EvaluatePharma® provides fully transparent, sourced and standardized data assets in a one-stop up-to-date platform including Sales by Indication, Consensus Forecasts to 2018, R&D pipeline data and a robust industry news stream. Along with powerful analytical tools including Merge Company tool, Calendar of Events, an Interactive NPV Analyzer and custom reporting and exports, it gives you the most accurate view of the global pharmaceutical and biotechnology market.
� EvaluateMedTech™, our newest service innovation covers the medical device and diagnostic industry providing a consensus view of the sector to 2018. It contains company financials, company and product segment sales with market share and rankings, six integrated FDA approval databases (Devices@FDA), Japan PMDA and EU CE Mark approvals, clinical intelligence from ClinicalTrials.gov and the latest sector news and commentary. It also includes evaluation tools, custom reports / exports and custom alerts.
� EvaluateClinical Trials™ simplifies complex analysis of the global clinical trials landscape with standardized, high quality data that includes EudraCT, ClinicalTrials.gov and a Japanese clinical trial data source for easy access to global clinical intelligence.
� EPVantage® is our renowned news service and provides forward looking commentary and analysis that keeps you abreast of the latest sector developments relevant to you.
Discover why EvaluatePharma® is trusted and relied upon by leaders in life science companies big and small, the investment community, leading consultancies and industry service providers.
Visit us today at www.evaluatepharma.com
21Co
pyr
igh
t ©
201
2 Ev
alu
ateP
har
ma
Ltd
. All
rig
hts
res
erve
d.

EvaluatePharma – EvaluatePharma Ltd., 11-29 Fashion Street, London E1 6PX United Kingdom
Tel: +44 (0)20 7377 0800 – Fax: +44 (0)20 7539 1801
EvaluatePharma – North America – EvaluatePharma USA, Inc., 15 Broad Street, Suite 401, Boston, MA 02109 USA
Tel: 1-617 573-9450 – Fax: 1-617 573-9542
www.evaluatepharma.com
All intellectual property rights in this report remain that of EvaluatePharma and/or its respective third party licensors. Whilst all reasonable steps have been taken to ensure that the data presented are accurate, EvaluatePharma Ltd cannot accept responsibility for errors or omissions. Neither does EvaluatePharma Ltd warrant the accuracy, merchantability or fitness for a particular purpose of the data. Nothing in the reports shall constitute investment, financial or legal advice and the contents of the reports are provided for information purposes only. The data is not intended to amount to advice and should not be used as a determining factor in any investment decision. This report may not be lent, resold, hired out or otherwise disposed of by way of trade in any form of binding or cover other than that in which it is published, without the prior written consent of EvaluatePharma Ltd. Copyright © 2012 EvaluatePharma Ltd. All rights reserved.
Complimentary copies of our EvaluateMedTech™ World Preview 2018 report can be downloaded at: www.evaluatemedtech.com/MT2018
Since 1996, EvaluatePharma® has been the premier source for life science sector analysis, delivering exclusive, trusted commercial insight into industry perfor-mance through its proprietary platform. EvaluatePharma® is staffed by a team of over 85 dedicated healthcare analysts employing rigorous methodologies to collate, organize and deliver the most up-to-date commercial performance data available. An award winning editorial team of journalists writing under the EP Vantage® name support EvaluatePharma®’s analysis. EvaluateMedTech™ provides the first global consensus view of the medical device and diagnostic industry. The EvaluatePharma services enable the life science community to make sound business decisions about value and opportunity. For more information please visit www.EvaluatePharma.com.
MT2018R
General inquires about this report: Christine Lindgren Tel: 1-617-573-9458 Email: [email protected]