Embed Size (px)
Citation preview
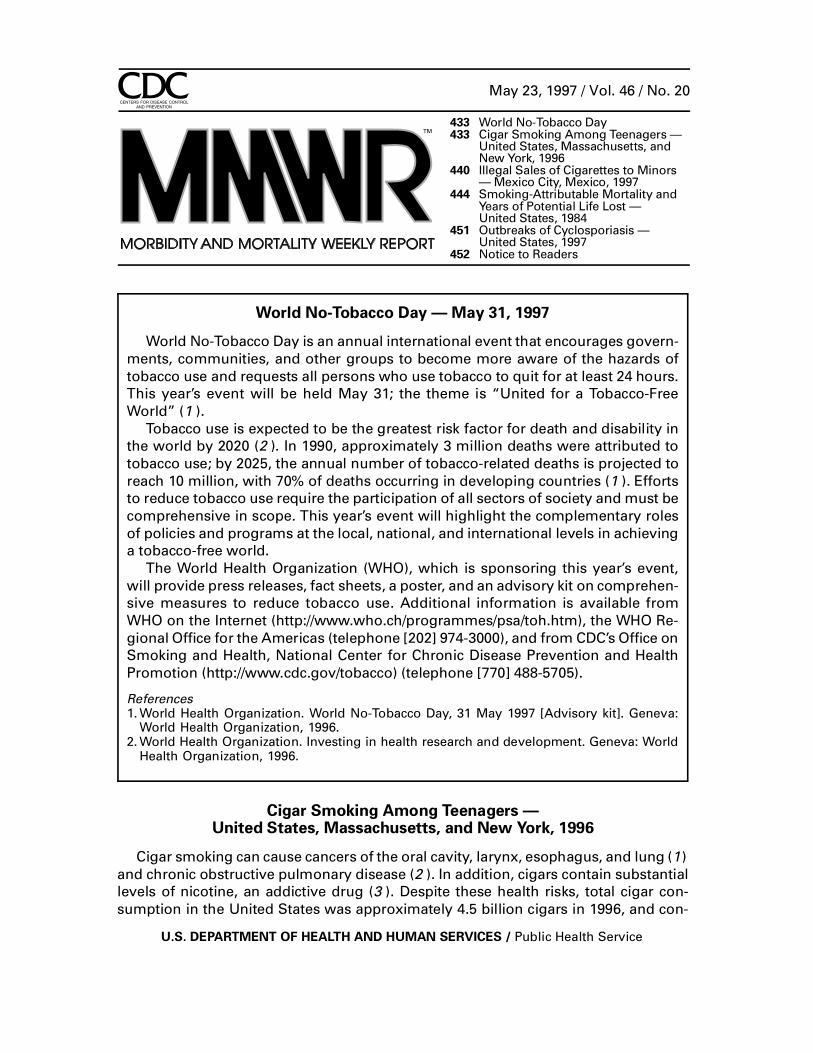
Cigar Smoking Among Teenagers —United States, Massachusetts, and New York, 1996
Cigar Smoking Among Teenagers — ContinuedCigar smoking can cause cancers of the oral cavity, larynx, esophagus, and lung (1)
and chronic obstructive pulmonary disease (2 ). In addition, cigars contain substantial
levels of nicotine, an addictive drug (3 ). Despite these health risks, total cigar con-
sumption in the United States was approximately 4.5 billion cigars in 1996, and con-
U.S. DEPARTMENT OF HEALTH AND HUMAN SERVICES / Public Health Service
433 World No-Tobacco Day433 Cigar Smoking Among Teenagers —
United States, Massachusetts, andNew York, 1996
440 Illegal Sales of Cigarettes to Minors— Mexico City, Mexico, 1997
444 Smoking-Attributable Mortality andYears of Potential Life Lost —United States, 1984
451 Outbreaks of Cyclosporiasis —United States, 1997
452 Notice to Readers
TM
May 23, 1997 / Vol. 46 / No. 20
World No-Tobacco Day — May 31, 1997
World No-Tobacco Day is an annual international event that encourages govern-
ments, communities, and other groups to become more aware of the hazards of
tobacco use and requests all persons who use tobacco to quit for at least 24 hours.
This year’s event will be held May 31; the theme is “United for a Tobacco-Free
World” (1 ).
Tobacco use is expected to be the greatest risk factor for death and disability in
the world by 2020 (2 ). In 1990, approximately 3 million deaths were attributed to
tobacco use; by 2025, the annual number of tobacco-related deaths is projected to
reach 10 million, with 70% of deaths occurring in developing countries (1 ). Efforts
to reduce tobacco use require the participation of all sectors of society and must be
comprehensive in scope. This year’s event will highlight the complementary roles
of policies and programs at the local, national, and international levels in achieving
a tobacco-free world.
The World Health Organization (WHO), which is sponsoring this year’s event,
will provide press releases, fact sheets, a poster, and an advisory kit on comprehen-
sive measures to reduce tobacco use. Additional information is available from
WHO on the Internet (http://www.who.ch/programmes/psa/toh.htm), the WHO Re-
gional Office for the Americas (telephone [202] 974-3000), and from CDC’s Office on
Smoking and Health, National Center for Chronic Disease Prevention and Health
Promotion (http://www.cdc.gov/tobacco) (telephone [770] 488-5705).
References1. World Health Organization. World No-Tobacco Day, 31 May 1997 [Advisory kit]. Geneva:
World Health Organization, 1996.2. World Health Organization. Investing in health research and development. Geneva: World
Health Organization, 1996.
sumption of larger cigars increased by 44.5% from 1993 through 1996 (from 2,138
million cigars to 3,090 million cigars, respectively) (4 ). This report presents estimates
of the prevalence of cigar smoking among youth based on analyses of data from the
Robert Wood Johnson Foundation’s (RWJF) 1996 National Study of Tobacco Price
Sensitivity, Behavior, and Attitudes Among Teenagers and Young Adults; a 1996 sur-
vey by the Massachusetts Department of Public Health (MDPH) of high school and
junior high school students; and the Roswell Park Cancer Institute’s 1996 Survey of
Alcohol, Tobacco, and Drug Use in two New York counties (5 ). The analyses indicate
that, during the year before being surveyed, 26.7% of U.S. and 28.1% of Massachu-
setts high school students reported having smoked at least one cigar and that 13%–
15% of ninth grade students in two New York counties reported having smoked cigars
during the previous 30 days.
National Survey
The RWJF survey employed a three-stage cluster sample design to produce a na-
tionally representative sample of students in grades 9–12. Within the selected sample
of 200 counties (primary sampling units), schools were randomly selected, with the
probability of selection proportional to enrollment size. Four alternate high schools
were simultaneously selected, matching the original school in size, type, location, and
the race/ethnicity and socioeconomic status of the students. An alternate was substi-
tuted when the first school chosen for the study could not participate. A total of
202 schools (representing 146 [73%] of the 200 primary sampling units) participated in
the study. Within each school, one class per grade was chosen randomly. All students
in the selected classes were eligible to participate; 80% of the students enrolled in the
sample of selected classes participated. A total of 16,556 students aged 14–19 years
completed the survey; however, 139 were excluded from these analyses because of
missing information on sex. Participants were asked, “How many cigars, if any, have
you smoked in the past year?” Annual cigar smokers were defined as any student who
reported smoking a cigar during the previous year; frequent cigar smokers were de-
fined as any student who reported smoking ≥50 cigars during the previous year. Data
were weighted by age, race/ethnicity, sex, and region* to provide national estimates.
Confidence intervals (CIs) were calculated using SUDAAN.
In 1996, an estimated 6.0 million (26.7% [95% CI=±1.7%]) 14–19-year-olds reported
having smoked a cigar during the previous year (4.3 million [37.0% (95% CI=±2.4%)]
males and 1.7 million [16.0% (95% CI=1.3%)] females) (Table 1). Cigarette smokers
were more than three times as likely as noncigarette smokers to report having smoked
a cigar (54.1% [95% CI=±2.4%], compared with 14.2% [95% CI=±1.2%], respectively).
Among the 68.8% of students who did not smoke cigarettes, males were more likely
than females to have reported smoking a cigar during the previous year (20.4% [95%
CI=±1.8%] versus 7.8% [95% CI=±1.1%], respectively). Users of smokeless tobacco
were more than three times as likely as nonusers to report having smoked cigars
*The four regions were Northeast (Connecticut, Maine, Massachusetts, New Hampshire, NewJersey, New York, Pennsylvania, Rhode Island, and Vermont), Midwest (Illinois, Indiana, Iowa,Kansas, Michigan, Minnesota, Missouri, Nebraska, North Dakota, Ohio, South Dakota, andWisconsin), South (Alabama, Arkansas, Delaware, District of Columbia, Florida, Georgia, Ken-tucky, Louisiana, Maryland, Mississippi, North Carolina, Oklahoma, South Carolina, Tennessee,Texas, Virginia, and West Virginia), and West (Alaska, Arizona, California, Colorado, Hawaii,Idaho, Montana, Nevada, New Mexico, Oregon, Utah, Washington, and Wyoming).
434 MMWR May 23, 1997
Cigar Smoking Among Teenagers — Continued
Cig
ar S
mo
kin
g A
mo
ng
Teen
ag
ers
— C
on
tinu
ed
Vo
l. 46 / N
o. 2
0M
MW
R43
5
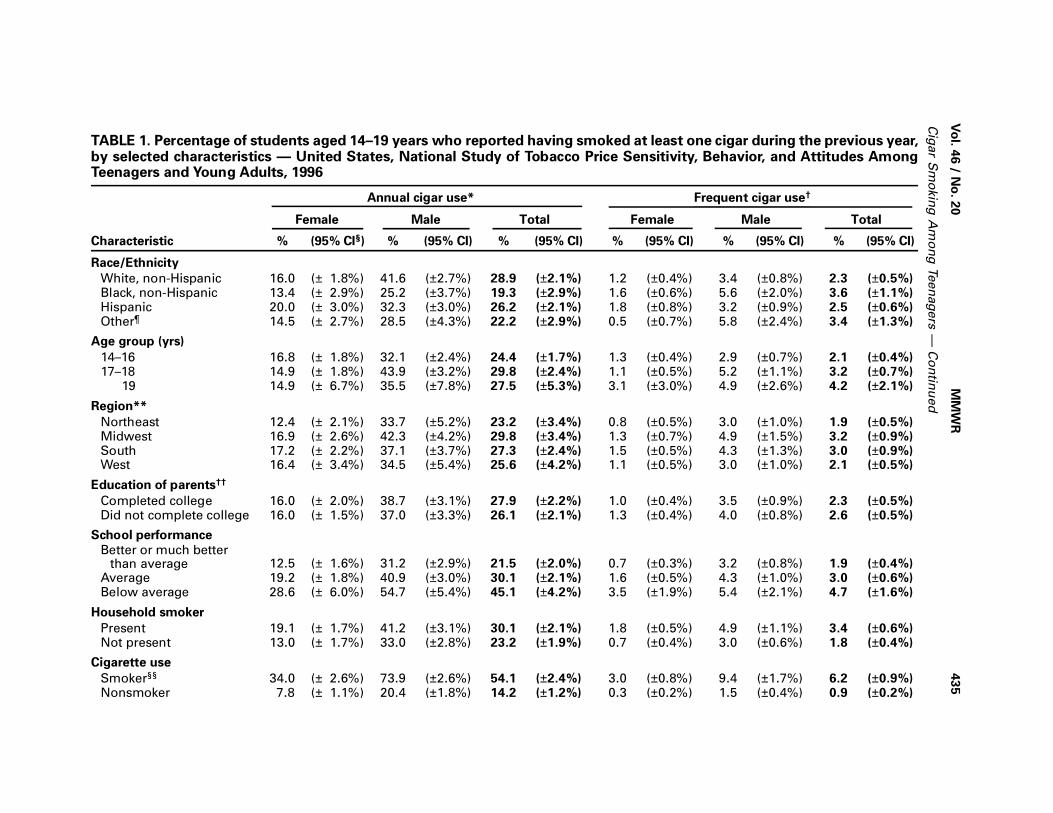
TABLE 1. Percentage of students aged 14–19 years who reported having smoked at least one cigar during the previous year,by selected characteristics — United States, National Study of Tobacco Price Sensitivity, Behavior, and Attitudes AmongTeenagers and Young Adults, 1996
Annual cigar use* Frequent cigar use†
Female Male Total Female Male Total
Characteristic % (95% CI§) % (95% CI) % (95% CI) % (95% CI) % (95% CI) % (95% CI)
Race/Ethnicity
White, non-Hispanic 16.0 (± 1.8%) 41.6 (±2.7%) 28.9 (±2.1%) 1.2 (±0.4%) 3.4 (±0.8%) 2.3 (±0.5%)Black, non-Hispanic 13.4 (± 2.9%) 25.2 (±3.7%) 19.3 (±2.9%) 1.6 (±0.6%) 5.6 (±2.0%) 3.6 (±1.1%)Hispanic 20.0 (± 3.0%) 32.3 (±3.0%) 26.2 (±2.1%) 1.8 (±0.8%) 3.2 (±0.9%) 2.5 (±0.6%)Other¶ 14.5 (± 2.7%) 28.5 (±4.3%) 22.2 (±2.9%) 0.5 (±0.7%) 5.8 (±2.4%) 3.4 (±1.3%)
Age group (yrs)
14–16 16.8 (± 1.8%) 32.1 (±2.4%) 24.4 (±1.7%) 1.3 (±0.4%) 2.9 (±0.7%) 2.1 (±0.4%)17–18 14.9 (± 1.8%) 43.9 (±3.2%) 29.8 (±2.4%) 1.1 (±0.5%) 5.2 (±1.1%) 3.2 (±0.7%) 19 14.9 (± 6.7%) 35.5 (±7.8%) 27.5 (±5.3%) 3.1 (±3.0%) 4.9 (±2.6%) 4.2 (±2.1%)
Region**
Northeast 12.4 (± 2.1%) 33.7 (±5.2%) 23.2 (±3.4%) 0.8 (±0.5%) 3.0 (±1.0%) 1.9 (±0.5%)Midwest 16.9 (± 2.6%) 42.3 (±4.2%) 29.8 (±3.4%) 1.3 (±0.7%) 4.9 (±1.5%) 3.2 (±0.9%)South 17.2 (± 2.2%) 37.1 (±3.7%) 27.3 (±2.4%) 1.5 (±0.5%) 4.3 (±1.3%) 3.0 (±0.9%)West 16.4 (± 3.4%) 34.5 (±5.4%) 25.6 (±4.2%) 1.1 (±0.5%) 3.0 (±1.0%) 2.1 (±0.5%)
Education of parents††
Completed college 16.0 (± 2.0%) 38.7 (±3.1%) 27.9 (±2.2%) 1.0 (±0.4%) 3.5 (±0.9%) 2.3 (±0.5%)Did not complete college 16.0 (± 1.5%) 37.0 (±3.3%) 26.1 (±2.1%) 1.3 (±0.4%) 4.0 (±0.8%) 2.6 (±0.5%)
School performance
Better or much betterthan average 12.5 (± 1.6%) 31.2 (±2.9%) 21.5 (±2.0%) 0.7 (±0.3%) 3.2 (±0.8%) 1.9 (±0.4%)
Average 19.2 (± 1.8%) 40.9 (±3.0%) 30.1 (±2.1%) 1.6 (±0.5%) 4.3 (±1.0%) 3.0 (±0.6%)Below average 28.6 (± 6.0%) 54.7 (±5.4%) 45.1 (±4.2%) 3.5 (±1.9%) 5.4 (±2.1%) 4.7 (±1.6%)
Household smoker
Present 19.1 (± 1.7%) 41.2 (±3.1%) 30.1 (±2.1%) 1.8 (±0.5%) 4.9 (±1.1%) 3.4 (±0.6%)Not present 13.0 (± 1.7%) 33.0 (±2.8%) 23.2 (±1.9%) 0.7 (±0.4%) 3.0 (±0.6%) 1.8 (±0.4%)
Cigarette use
Smoker§§ 34.0 (± 2.6%) 73.9 (±2.6%) 54.1 (±2.4%) 3.0 (±0.8%) 9.4 (±1.7%) 6.2 (±0.9%)Nonsmoker 7.8 (± 1.1%) 20.4 (±1.8%) 14.2 (±1.2%) 0.3 (±0.2%) 1.5 (±0.4%) 0.9 (±0.2%)
43
6M
MW
RM
ay 2
3, 1
99
7
Cig
ar S
mo
kin
g A
mo
ng
Teen
ag
ers
— C
on
tinu
ed
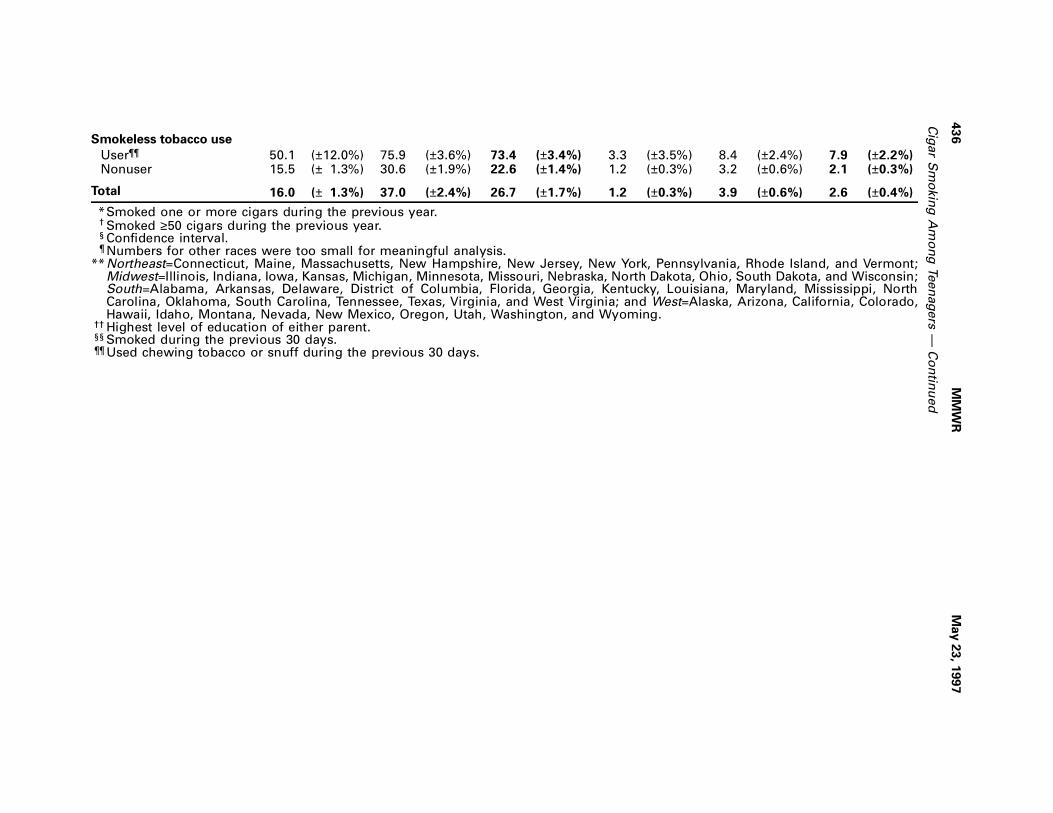
Smokeless tobacco use
User¶¶ 50.1 (±12.0%) 75.9 (±3.6%) 73.4 (±3.4%) 3.3 (±3.5%) 8.4 (±2.4%) 7.9 (±2.2%)Nonuser 15.5 (± 1.3%) 30.6 (±1.9%) 22.6 (±1.4%) 1.2 (±0.3%) 3.2 (±0.6%) 2.1 (±0.3%)
Total 16.0 (± 1.3%) 37.0 (±2.4%) 26.7 (±1.7%) 1.2 (±0.3%) 3.9 (±0.6%) 2.6 (±0.4%)
*Smoked one or more cigars during the previous year.† Smoked ≥50 cigars during the previous year.§ Confidence interval.¶ Numbers for other races were too small for meaningful analysis.
**Northeast=Connecticut, Maine, Massachusetts, New Hampshire, New Jersey, New York, Pennsylvania, Rhode Island, and Vermont;Midwest=Illinois, Indiana, Iowa, Kansas, Michigan, Minnesota, Missouri, Nebraska, North Dakota, Ohio, South Dakota, and Wisconsin;South=Alabama, Arkansas, Delaware, District of Columbia, Florida, Georgia, Kentucky, Louisiana, Maryland, Mississippi, NorthCarolina, Oklahoma, South Carolina, Tennessee, Texas, Virginia, and West Virginia; and West=Alaska, Arizona, California, Colorado,Hawaii, Idaho, Montana, Nevada, New Mexico, Oregon, Utah, Washington, and Wyoming.
†† Highest level of education of either parent.§§ Smoked during the previous 30 days.¶¶ Used chewing tobacco or snuff during the previous 30 days.
(73.4% [95% CI=±3.4%], compared with 22.6% [95% CI=±1.4%], respectively). Cigar
smoking did not vary substantially by region or race/ethnicity, although prevalence
was greatest among white, non-Hispanic males (41.6% [95% CI=±2.7%]).
Massachusetts Survey
The MDPH survey sample comprised two subsamples of students in grades 6–12: a
statewide random sample, proportionately stratified by area and grade, and a sepa-
rate random sample of five urban areas in the state, stratified by percentage of non-
white students in each grade. These five urban areas were selected to oversample
communities with racial/ethnic minorities to ensure adequate representation for
analysis. Of the 191 schools meeting eligibility criteria, 171 (90%) participated in this
survey. Of the 8236 students eligible to participate in the survey, 6844 (83.1%) partici-
pated. Data were collected during November 1996–January 1997. School and class
selection was random, participation was voluntary, and all responses were anony-
mous. The questionnaires were self-administered. All students were asked “How
often have you smoked cigars in your lifetime?”; “How often have you smoked cigars
during the last 12 months?”; and “How often have you smoked cigars during the last
30 days?” The response categories were never, one to two times, three to five times,
six to nine times, 10–19 times, 20–39 times, and ≥40 times.
Among the 1020 students in grade 6, 9.9% (95% CI=±1.8%) reported having ever
smoked a cigar, 5.0% (95% CI=±0.8%) smoked a cigar during the previous year, and
2.0% (95% CI=±0.9%) smoked a cigar during the previous month. Among 1942 stu-
dents in grades 7 and 8, 22.3% (95% CI=±1.8%) reported having ever smoked a cigar,
14.1% (95% CI=±1.5%) smoked a cigar during the previous year, and 7.6% (95%
CI=±1.2%) smoked a cigar during the previous month. Among the 3873 high school
students in grades 9–12, 38.9% (95% CI=±1.5%) reported having ever smoked a cigar,
28.1% (95% CI=±1.4%) smoked a cigar during the previous year, and 14.5% (95%
CI=±1.1%) smoked a cigar during the previous month.
High school students who had used other tobacco products during the previous
month were also more likely to have smoked cigars during the previous month.
Among students in grades 9–12, 30.3% (95% CI=±2.5%) of those who had smoked
cigarettes during the previous month also reported having smoked a cigar, compared
with 3.4% (95% CI=±6.6%) of those who had never smoked a cigarette; among those
who had used smokeless tobacco during the previous month, 60.7% (95% CI=±6.6%)
also reported having smoked a cigar during the previous month, compared with
8.3% (95% CI=±1.0%) of those who had never used smokeless tobacco.
New York Survey
The Roswell Park Cancer Institute survey was conducted in Erie (predominantly
urban) and Chautauqua (predominantly rural) counties in New York during the fall of
1996. The survey was administered to 9916 ninth grade students in 57 of the 60 public
and parochial high schools in Erie County (81% of the 12,216 ninth grade students in
the 60 schools) and to 1677 ninth grade students in 16 of the 18 public schools in
Chautauqua County (80% of the 2102 ninth grade students in the 18 schools). Of the
students who participated in the survey in Erie County, 79% were non-Hispanic white,
12% were non-Hispanic black, 3% were Hispanic, and 5% were of other racial/ethnic
groups. Of those students who participated in the survey in Chautauqua County,
89% were non-Hispanic white. The median age of all students was 14 years. Students
Vol. 46 / No. 20 MMWR 437
Cigar Smoking Among Teenagers — Continued
completed a self-administered questionnaire with three questions on cigar use and
purchasing: “In the past 30 days, did you smoke a cigar?”; “Have you ever bought
cigars for yourself?”; and “When you try to buy cigars, how often are you asked about
your age?”
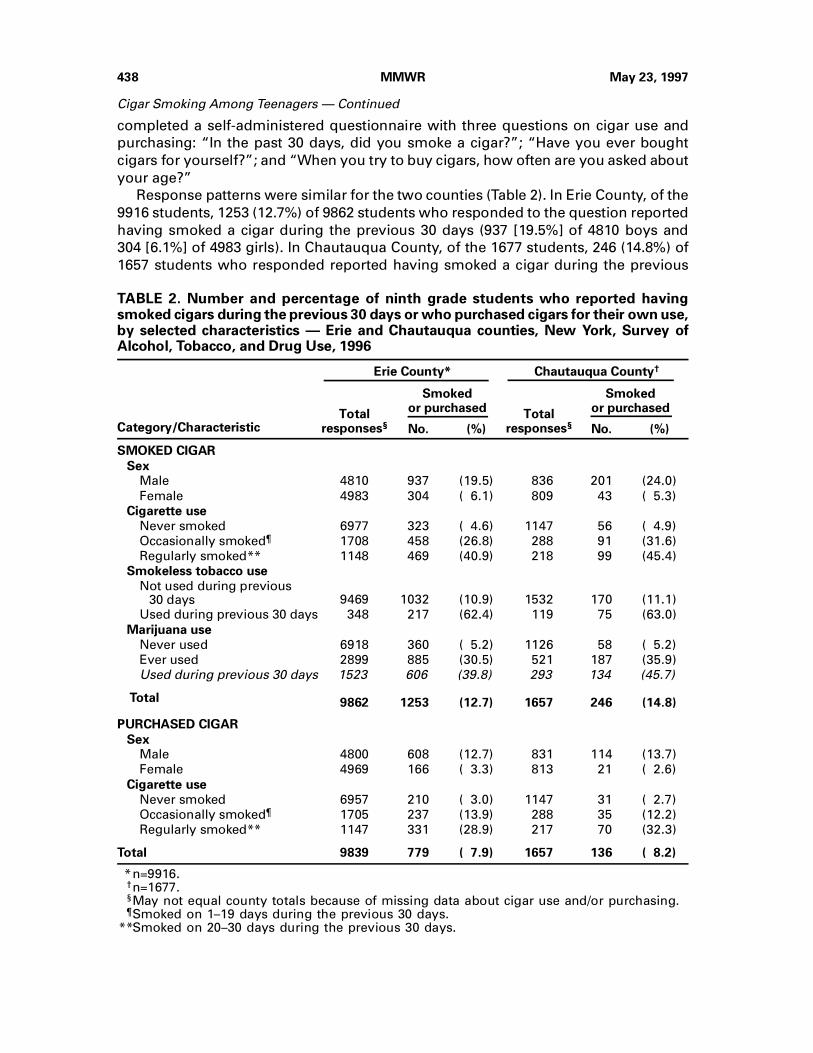
Response patterns were similar for the two counties (Table 2). In Erie County, of the
9916 students, 1253 (12.7%) of 9862 students who responded to the question reported
having smoked a cigar during the previous 30 days (937 [19.5%] of 4810 boys and
304 [6.1%] of 4983 girls). In Chautauqua County, of the 1677 students, 246 (14.8%) of
1657 students who responded reported having smoked a cigar during the previous
TABLE 2. Number and percentage of ninth grade students who reported havingsmoked cigars during the previous 30 days or who purchased cigars for their own use,by selected characteristics — Erie and Chautauqua counties, New York, Survey ofAlcohol, Tobacco, and Drug Use, 1996
Category/Characteristic
Erie County* Chautauqua County†
Totalresponses§
Smokedor purchased
Totalresponses§
Smokedor purchased
No. (%) No. (%)
SMOKED CIGAR
Sex
Male 4810 937 (19.5) 836 201 (24.0)
Female 4983 304 ( 6.1) 809 43 ( 5.3)
Cigarette use
Never smoked 6977 323 ( 4.6) 1147 56 ( 4.9)
Occasionally smoked¶ 1708 458 (26.8) 288 91 (31.6)
Regularly smoked** 1148 469 (40.9) 218 99 (45.4)
Smokeless tobacco use
Not used during previous 30 days 9469 1032 (10.9) 1532 170 (11.1)
Used during previous 30 days 348 217 (62.4) 119 75 (63.0)
Marijuana use
Never used 6918 360 ( 5.2) 1126 58 ( 5.2)
Ever used 2899 885 (30.5) 521 187 (35.9)
Used during previous 30 days 1523 606 (39.8) 293 134 (45.7)
Total 9862 1253 (12.7) 1657 246 (14.8)
PURCHASED CIGAR
Sex
Male 4800 608 (12.7) 831 114 (13.7)
Female 4969 166 ( 3.3) 813 21 ( 2.6)
Cigarette use
Never smoked 6957 210 ( 3.0) 1147 31 ( 2.7)
Occasionally smoked¶ 1705 237 (13.9) 288 35 (12.2)
Regularly smoked** 1147 331 (28.9) 217 70 (32.3)
Total 9839 779 ( 7.9) 1657 136 ( 8.2)
*n=9916.†n=1677.§May not equal county totals because of missing data about cigar use and/or purchasing.¶Smoked on 1–19 days during the previous 30 days.
**Smoked on 20–30 days during the previous 30 days.
438 MMWR May 23, 1997
Cigar Smoking Among Teenagers — Continued
30 days (201 [24.0%] of 836 boys and 43 [5.3%] of 809 girls). In comparison, 29.0% of
students in Erie County and 30.6% of students in Chautauqua County reported having
smoked cigarettes during the previous 30 days. Cigarette smokers also were more
likely than noncigarette smokers to report having smoked a cigar during the previous
30 days (Table 2). The prevalence of reported smokeless tobacco use during the pre-
vious 30 days was 3.5% in Erie County and 7.3% in Chautauqua County. Among
smokeless tobacco users, reported rates of cigar smoking were 62.4% (217 of 348 stu-
dents who responded) in Erie County and 63.0% (75 of 119 students who responded)
in Chautauqua County (Table 2).
Among students who reported ever purchasing a cigar for themselves, most
(63.7% in Erie and 77.0% in Chautauqua) also reported having smoked a cigar during
the previous 30 days. Among those who had ever purchased a cigar, 76.6% in Erie
County and 71.7% in Chautauqua County reported that they were “rarely” or “never”
asked about their age when purchasing a cigar. In comparison, 59.0% in Erie County
and 67.7% in Chautauqua County reported that they were “rarely” or “never” asked
about their age when purchasing cigarettes.Reported by: NJ Kaufman, SL Emont, CR Trimble, CT Orleans, The Robert Wood JohnsonFoundation, Princeton, New Jersey. N Briton, T Clark, M Krakow, Health and Addictions Re-search, Inc, Boston; C Celebucki, D Cullen, G Connolly, Massachusetts Dept of Public Health. AHyland, J Perla, KM Cummings, Roswell Park Cancer Institute, New York State Dept of Health,Buffalo; A Abdella, K Tippens, Chautauqua County Dept of Health, Mayville, New York.Epidemiology Br, Office on Smoking and Health, National Center for Chronic Disease Preventionand Health Promotion, CDC.
Editorial Note: This report is the first to estimate the prevalence of cigar smoking
among youth in the United States and documents the level of access to and use of
cigars. The risk for several cancers is higher for cigar smokers than for nonsmokers.
Therefore, if cigar consumption continues to increase (4 ), cigar-related morbidity and
mortality can be expected to increase.†
Although the findings from New York and from Massachusetts were from local sur-
veys, they are consistent with the results from the national survey. However, a poten-
tial limitation to these data is that they represent the cigar use of only those
adolescents attending school and, therefore, may not be representative of all adoles-
cents.
Although federal law requires states to enact laws prohibiting the sale of cigars and
other tobacco products to minors (6 ), young persons in New York reported being able
to purchase cigars easily. These findings, especially if replicated in other communities,
may warrant actions to curtail youth access to cigars that are consistent with meas-
ures for limiting access to cigarettes and smokeless tobacco (e.g., Food and Drug Ad-
ministration regulations) (7 ). The findings from the surveys in this report also indicate
that cigar smoking, once primarily an activity among older men (8 ), is now an activity
of both male and female teenagers. Therefore, priorities include the need to further
characterize the use of cigars in the United States, determine the prevalence of cigar
smoking among adults, and continue monitoring the prevalence of cigar use among
youth. Although the Surgeon General’s health warning is legally mandated for some
tobacco products, the law does not include cigars (9 ). Therefore, teenagers and other
†The National Cancer Institute has announced that it will publish a comprehensive monographon cigar smoking by the end of 1997 titled “Cigar Smoking in the U.S.: Health Effects andTrends.”
Vol. 46 / No. 20 MMWR 439
Cigar Smoking Among Teenagers — Continued
users of cigars may be unaware of the health risks of cigar smoking. Immediate efforts
should be made to publicize the health risks of cigar smoking; deglamorize the prod-
uct in magazines, movies, and television programs; and protect nonsmokers from sec-
ondhand cigar smoke.
References1. US Department of Health and Human Services. The health consequences of smoking:
cancer—a report of the Surgeon General. Rockville, Maryland: US Department of Health and
Human Services, Public Health Service, CDC, National Center for Chronic Disease Prevention
and Health Promotion, Office on Smoking and Health, 1982; DHHS publication no. (PHS)82-
50179.
2. US Department of Health and Human Services. The health consequences of smoking: chronic
obstructive lung disease—a report of the Surgeon General. Rockville, Maryland: US Depart-
ment of Health and Human Services, Public Health Service, CDC, National Center for Chronic
Disease Prevention and Health Promotion, Office on Smoking and Health, 1984; DHHS pub-
lication no. (PHS)84-50205.
3. Henningfield JE, Hariharan M, Kozlowski LT. Nicotine content and health risks of cigars. JAMA
1996;276:1857–8.
4. US Department of Agriculture. Tobacco situation and outlook report. Washington, DC: US De-
partment of Agriculture, Commodity Economics Division, Economic Research Service, April
1997; document no. TSB-238.
5. Roswell Park Cancer Institute. Survey of alcohol, tobacco, and drug use: ninth-grade students
in Erie and Chautauqua counties, 1996. Buffalo, New York: Roswell Park Cancer Institute, De-
partment of Cancer Control and Epidemiology, May 1997.
6. Substance Abuse and Mental Health Service Administration. Final regulations to implement
section 1926 of the Public Health Service Act regarding the sale and distribution of tobacco
products to individuals under the age of 18. Federal Register 1996;13:1492–500.
7. Food and Drug Administration. Regulations restricting the sale and distribution of cigarettes
and smokeless tobacco products to protect children and adolescents: final rule. Federal Reg-
ister 1996;61:41,314–75.
8. Giovino GA, Schooley MW, Zhu B-P, et al. Surveillance for selected tobacco-use behaviors—
United States, 1900–1994. MMWR 1994;43(no. SS-3).
9. US Department of Health and Human Services. Reducing the health consequences of smoking:
25 years of progress—a report of the Surgeon General. Rockville, Maryland: US Department
of Health and Human Services, Public Health Service, CDC, National Center for Chronic Disease
Prevention and Health Promotion, Office on Smoking and Health, 1989; DHHS publication no.
(CDC)89-8411.
Cigar Smoking Among Teenagers — Continued
Illegal Sales of Cigarettes to Minors — Mexico City, Mexico, 1997
Cigarette Sales to Minors — ContinuedBecause of the increasing prevalence of tobacco use among youth in the United
States and Mexico (1,2 ), in 1996 the United States-Mexico Binational Commission
(US-MBC) Health Working Group identified prevention of tobacco use, with an empha-
sis on adolescents, as one of its four priority health concerns. From 1970 to 1990,
annual death rates for the leading causes of smoking-related deaths in Mexico nearly
tripled and, in 1992, an estimated 10,253 persons in Mexico died as a result of
smoking-related diseases, 9% of all deaths that year (3 ). In addition, from 1988 to
1993, the prevalence of current smoking among minors aged 12–17 years increased
from 6.6% to 9.6%, respectively (in Mexico City, the 1993 prevalence was 12.8%), and
in 1993, 72% of adult smokers in Mexico reported becoming regular smokers before
440 MMWR May 23, 1997
Cigar Smoking Among Teenagers — Continued

age 18 years (2,4 ). Although since 1984 the General Health Law of Mexico has prohib-
ited the sale of tobacco products to minors aged <18 years, compliance with this law
has not been assessed. As part of the Mexican national program to reduce the preva-
lence of cigarette smoking among children and adolescents and in support of the
goals of the US-MBC, during 1997 the General Directorate of Epidemiology (GDE) in
the Secretariat of Health (SOH) conducted a survey of tobacco outlets in Mexico City
to assess the percentage of retailers willing to sell cigarettes to minors. This report
summarizes the results of the survey, which indicate that virtually no surveyed retail-
ers asked minors attempting to purchase cigarettes about their age and that most
retailers sold cigarettes to minors.
This survey, the first assessment in Mexico of illegal sales of cigarettes to minors,
was conducted during March 23–April 4, 1997, in the 16 districts composing Mexico
City proper (1990 population: 8.5 million, excluding the surrounding metropolitan
area). Because neither commercial business lists of tobacco outlets nor tobacco licen-
sure lists were available and because resources were not available for SOH staff to
enumerate a comprehensive list of all operational tobacco outlets in the city, stores
were selected as the survey teams visited socioeconomically diverse commercial and
residential neighborhoods in each of the 16 districts. Survey teams visited 35 stores in
each of 15 districts and 36 stores in one district. The 561 stores included in the non-
systematic sample were categorized as small neighborhood stores (302 [54%]), street
stalls (137 [24%]), pharmacies (96 [17%]), convenience stores (19 [3%]), and large su-
permarkets (seven [1%]) (gasoline stations in Mexico are government owned and do
not sell cigarettes). Chi-square tests were used to calculate statistical differences in the
sales rates associated with selected variables.
The minors who participated in the survey were recruited from the families of staff
at GDE and included eight boys aged 10–14 years and seven girls aged 11–15 years.
The adult survey escorts were medical residents from the Field Epidemiology Training
Program of GDE. Teams consisting of one medical resident, one GDE staff driver, and
two minors made one purchase attempt per store using the following protocol: the
medical resident entered the store shortly before one of the minors entered the store.
The medical resident noted whether age-of-sale warning signs were posted inside the
store and unobtrusively observed the transaction between the retailer and the minor
as the minor attempted to purchase a pack of cigarettes. If asked by the retailers, the
minors were instructed to truthfully state their age and that they carried no age iden-
tification. The purchase attempt was considered successful if cigarettes were pur-
chased and was considered unsuccessful if the sale was refused for any reason. If the
attempt was successful, the minor promptly left the store with the cigarettes and gave
them to the medical resident after the resident exited the store.
Of the 561 stores visited, 443 (79.0%) of the retailers sold cigarettes to the minors
(Table 1). Purchase attempts by the oldest minors (aged 14–15 years) were more likely
to be successful than those by the youngest minors (aged 10–11 years) (92.2% versus
66.0%, respectively [p<0.01]) and by girls than by boys (84.0% versus 72.7%, respec-
tively [p<0.01]). Sales were transacted at all types of stores. Although the proportion
of successful sales did not vary by sex of the retailer, the proportion was higher for
attempts involving male clerks and girls than for those involving male clerks and boys
(88.3% versus 68.1%, p<0.01). Age-of-sale warning signs were displayed in 64 (11.8%)
stores; the presence of a warning sign was not associated with lower sales rates. Four
Vol. 46 / No. 20 MMWR 441
Cigarette Sales to Minors — Continued
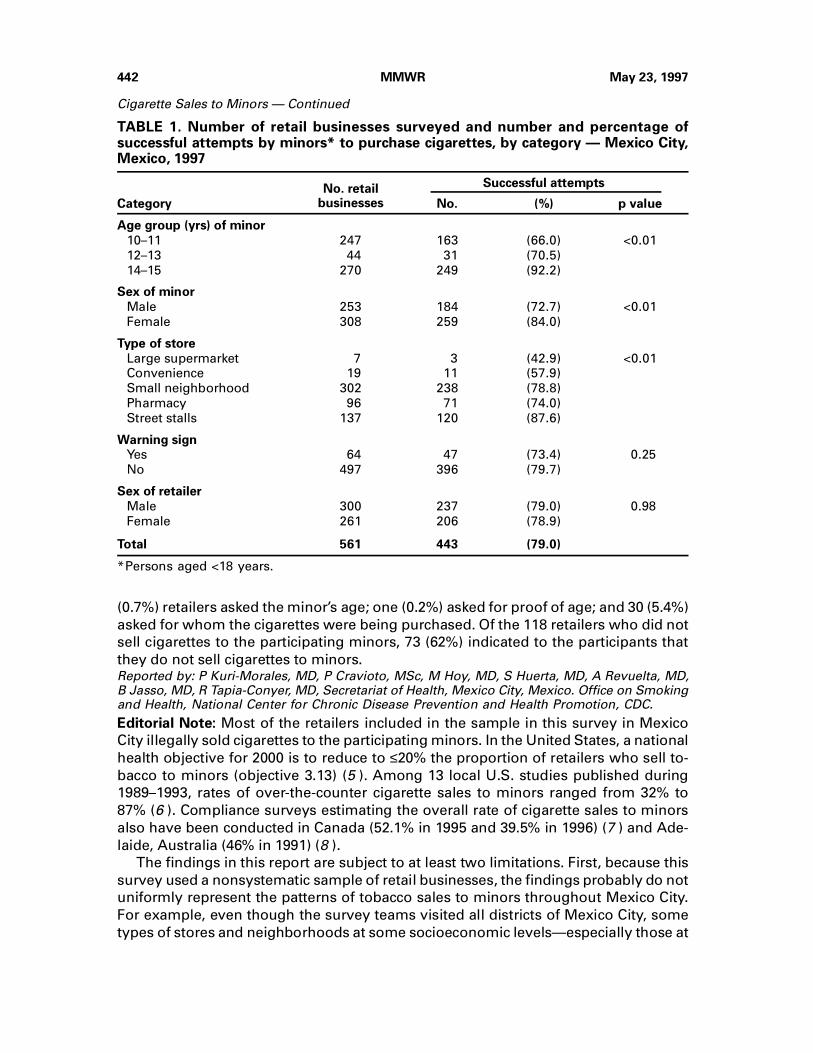
(0.7%) retailers asked the minor’s age; one (0.2%) asked for proof of age; and 30 (5.4%)
asked for whom the cigarettes were being purchased. Of the 118 retailers who did not
sell cigarettes to the participating minors, 73 (62%) indicated to the participants that
they do not sell cigarettes to minors.Reported by: P Kuri-Morales, MD, P Cravioto, MSc, M Hoy, MD, S Huerta, MD, A Revuelta, MD,B Jasso, MD, R Tapia-Conyer, MD, Secretariat of Health, Mexico City, Mexico. Office on Smokingand Health, National Center for Chronic Disease Prevention and Health Promotion, CDC.
Editorial Note: Most of the retailers included in the sample in this survey in Mexico
City illegally sold cigarettes to the participating minors. In the United States, a national
health objective for 2000 is to reduce to ≤20% the proportion of retailers who sell to-
bacco to minors (objective 3.13) (5 ). Among 13 local U.S. studies published during
1989–1993, rates of over-the-counter cigarette sales to minors ranged from 32% to
87% (6 ). Compliance surveys estimating the overall rate of cigarette sales to minors
also have been conducted in Canada (52.1% in 1995 and 39.5% in 1996) (7 ) and Ade-
laide, Australia (46% in 1991) (8 ).
The findings in this report are subject to at least two limitations. First, because this
survey used a nonsystematic sample of retail businesses, the findings probably do not
uniformly represent the patterns of tobacco sales to minors throughout Mexico City.
For example, even though the survey teams visited all districts of Mexico City, some
types of stores and neighborhoods at some socioeconomic levels—especially those at
TABLE 1. Number of retail businesses surveyed and number and percentage ofsuccessful attempts by minors* to purchase cigarettes, by category — Mexico City,Mexico, 1997
No. retailbusinesses
Successful attempts
Category No. (%) p value
Age group (yrs) of minor
10–11 247 163 (66.0) <0.01
12–13 44 31 (70.5)
14–15 270 249 (92.2)
Sex of minor
Male 253 184 (72.7) <0.01
Female 308 259 (84.0)
Type of store
Large supermarket 7 3 (42.9) <0.01
Convenience 19 11 (57.9)
Small neighborhood 302 238 (78.8)
Pharmacy 96 71 (74.0)
Street stalls 137 120 (87.6)
Warning sign
Yes 64 47 (73.4) 0.25
No 497 396 (79.7)
Sex of retailer
Male 300 237 (79.0) 0.98
Female 261 206 (78.9)
Total 561 443 (79.0)
*Persons aged <18 years.
442 MMWR May 23, 1997
Cigarette Sales to Minors — Continued
lower levels—may not have been included in the sample. However, it is not known
whether sales rates in lower socioeconomic neighborhoods differed from those in
higher socioeconomic neighborhoods. Second, the rate may have been underesti-
mated because retailers in small neighborhood stores and street stalls in particular
may have suspected that the adult team member, who entered the store or ap-
proached the stall before the minor, was accompanying the minor.
Based on current global patterns of smoking, the World Health Organization (WHO)
has projected that 200–300 million persons who are aged <20 years in 1997 will die
from smoking-related diseases later in life (9 ). In 1986, the World Health Assembly
adopted a resolution urging member states to consider a comprehensive tobacco-
control strategy containing nine elements (10 ), including one that targets the preven-
tion of smoking by children and adolescents. However, in the early 1990s, WHO
determined that only approximately 25 countries had established laws prohibiting the
sale of cigarettes to minors (the age of prohibition varied from 16 to 21 years), and that
among these, only a limited number had attempted to enforce the laws. To decrease
cigarette sales to minors, WHO recommends that countries adopt the following four
measures: 1) establish a minimum age of purchase of 18 years or older; 2) create a
tobacco-sales licensing system to identify tobacco retailers and inform them of their
legal responsibilities; 3) establish a graduated schedule of civil law penalties for illegal
sales, ranging from warnings to license revocations; and 4) enlist the assistance of
teenagers in efforts of enforcement officers to assess retailers’ compliance with the
prohibition of sale to minors. Other categories of legislation also may be effective in
decreasing sales to minors. For example, several local studies in the United States
demonstrated substantially reduced tobacco sales to minors when retailers requested
photo identification or other proof of age from persons attempting to purchase to-
bacco products (1 ).
SOH will use the results of this survey to emphasize the need for assessing compli-
ance of retailers in other cities with the federal law prohibiting tobacco sales to minors
in Mexico and to underscore the need for resources to support increased enforcement
activities. In addition to the enforcement of strong minors’ access laws, a comprehen-
sive approach for preventing initiation of smoking by youth should include provisions
that reduce the appeal of cigarettes to minors through restrictions on advertising and
promotion and through educational programs (1 ).
References 1. Food and Drug Administration. Regulations restricting the sale and distribution of cigarettes
and smokeless tobacco products to protect children and adolescents: final rule. Federal Reg-ister 1996;61:41,314–75.
2. Secretariat of Health. The National Addiction Survey [Spanish]. Mexico City, Mexico: Secre-tariat of Health, General Directorate of Epidemiology, 1993.
3. CDC. Smoking-attributable mortality—Mexico, 1992. MMWR 1995;44:372–3,379–81.
4. Tapia-Conyer R, Medina-Mora ME, Sepulveda J, et al. The National Addiction Survey of Mexico[Spanish]. Salud Pública Mex 1990;32:507–22.
5. Public Health Service. Healthy people 2000: national health promotion and disease preventionobjectives—midcourse review and 1995 revisions. Washington, DC: US Department of Healthand Human Services, Public Health Service, 1995.
6. US Department of Health and Human Services. Preventing tobacco use among young people:a report of the Surgeon General. Atlanta, Georgia: US Department of Health and Human Ser-vices, Public Health Service, CDC, National Center for Chronic Disease Prevention and HealthPromotion, Office on Smoking and Health, 1994.
Vol. 46 / No. 20 MMWR 443
Cigarette Sales to Minors — Continued
7. AC Nielsen. Measurement of retailer compliance with respect to tobacco sales to minors leg-islation: wave 2, 1996. Montreal, Quebec: AC Nielsen, 1996.
8. Wakefield M, Carrangis J, Wilson D, Reynolds C. Illegal cigarette sales to children in SouthAustralia. Tobacco Control 1992;1:114–7.
9. World Health Organization. Guidelines for controlling and monitoring the tobacco epidemic.Geneva, Switzerland: World Health Organization, 1997 (in press).
10. World Health Organization. Tobacco or health: first global status report. Geneva, Switzerland:World Health Organization, 1997 (in press).
Cigarette Sales to Minors — Continued
As part of its commemoration of CDC’s 50th anniversary, MMWR is reprinting se-
lected MMWR articles of historical interest to public health, accompanied by a current
editorial note. Reprinted below is the report published October 30, 1987, which ana-
lyzed smoking-attributable mortality and years of potential life lost for 1984, followed
by a contemporary editorial note.
Perspectives in Disease Prevention and Health Promotion
Smoking-Attributable Mortality and Years of Potential Life Lost —United States, 1984
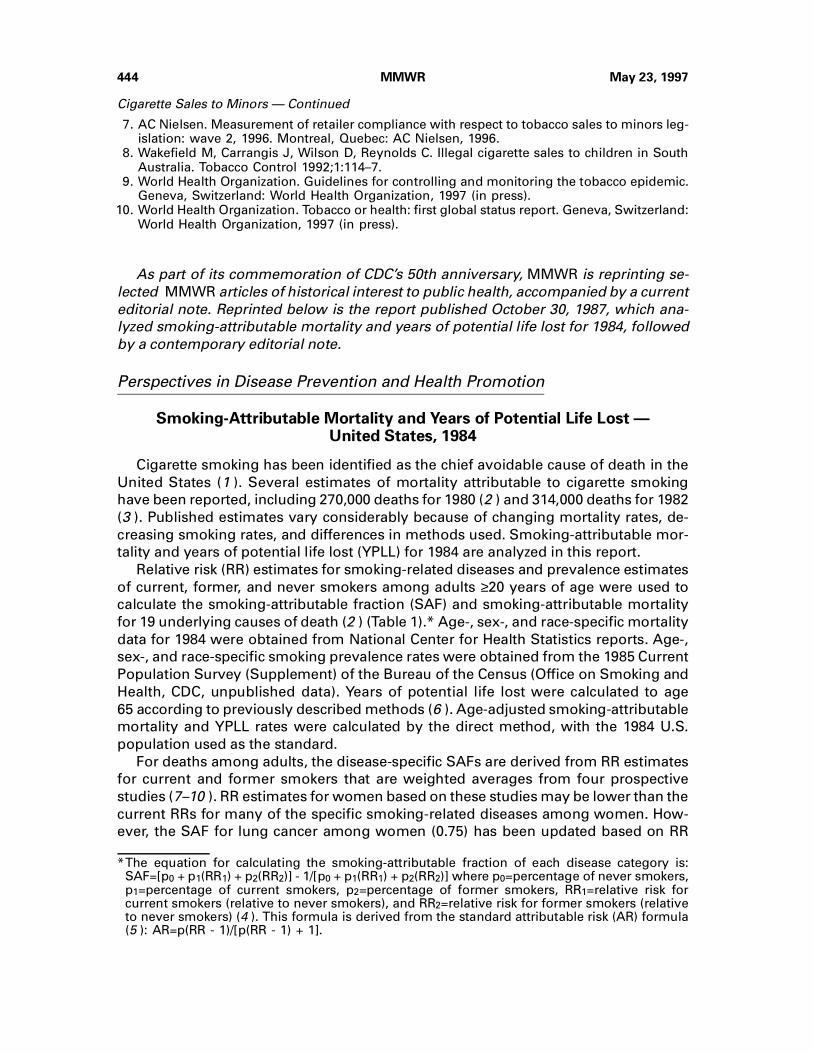
Smoking-Attributable Mortality — ContinuedCigarette smoking has been identified as the chief avoidable cause of death in the
United States (1 ). Several estimates of mortality attributable to cigarette smoking
have been reported, including 270,000 deaths for 1980 (2 ) and 314,000 deaths for 1982
(3 ). Published estimates vary considerably because of changing mortality rates, de-
creasing smoking rates, and differences in methods used. Smoking-attributable mor-
tality and years of potential life lost (YPLL) for 1984 are analyzed in this report.
Relative risk (RR) estimates for smoking-related diseases and prevalence estimates
of current, former, and never smokers among adults ≥20 years of age were used to
calculate the smoking-attributable fraction (SAF) and smoking-attributable mortality
for 19 underlying causes of death (2 ) (Table 1).* Age-, sex-, and race-specific mortality
data for 1984 were obtained from National Center for Health Statistics reports. Age-,
sex-, and race-specific smoking prevalence rates were obtained from the 1985 Current
Population Survey (Supplement) of the Bureau of the Census (Office on Smoking and
Health, CDC, unpublished data). Years of potential life lost were calculated to age
65 according to previously described methods (6 ). Age-adjusted smoking-attributable
mortality and YPLL rates were calculated by the direct method, with the 1984 U.S.
population used as the standard.
For deaths among adults, the disease-specific SAFs are derived from RR estimates
for current and former smokers that are weighted averages from four prospective
studies (7–10 ). RR estimates for women based on these studies may be lower than the
current RRs for many of the specific smoking-related diseases among women. How-
ever, the SAF for lung cancer among women (0.75) has been updated based on RR
*The equation for calculating the smoking-attributable fraction of each disease category is:SAF=[p0 + p1(RR1) + p2(RR2)] - 1/[p0 + p1(RR1) + p2(RR2)] where p0=percentage of never smokers,p1=percentage of current smokers, p2=percentage of former smokers, RR1=relative risk forcurrent smokers (relative to never smokers), and RR2=relative risk for former smokers (relativeto never smokers) (4 ). This formula is derived from the standard attributable risk (AR) formula(5 ): AR=p(RR - 1)/[p(RR - 1) + 1].
444 MMWR May 23, 1997
Cigarette Sales to Minors — Continued
estimates from more recent mortality data (11 ). Race-specific RR estimates for smok-
ing-attributable diseases were not available.
For four pediatric diagnoses, the mortality attributed to maternal smoking during
pregnancy for children <1 year of age was determined. These calculations used RR
estimates from McIntosh (12 ) and current smoking prevalence among women
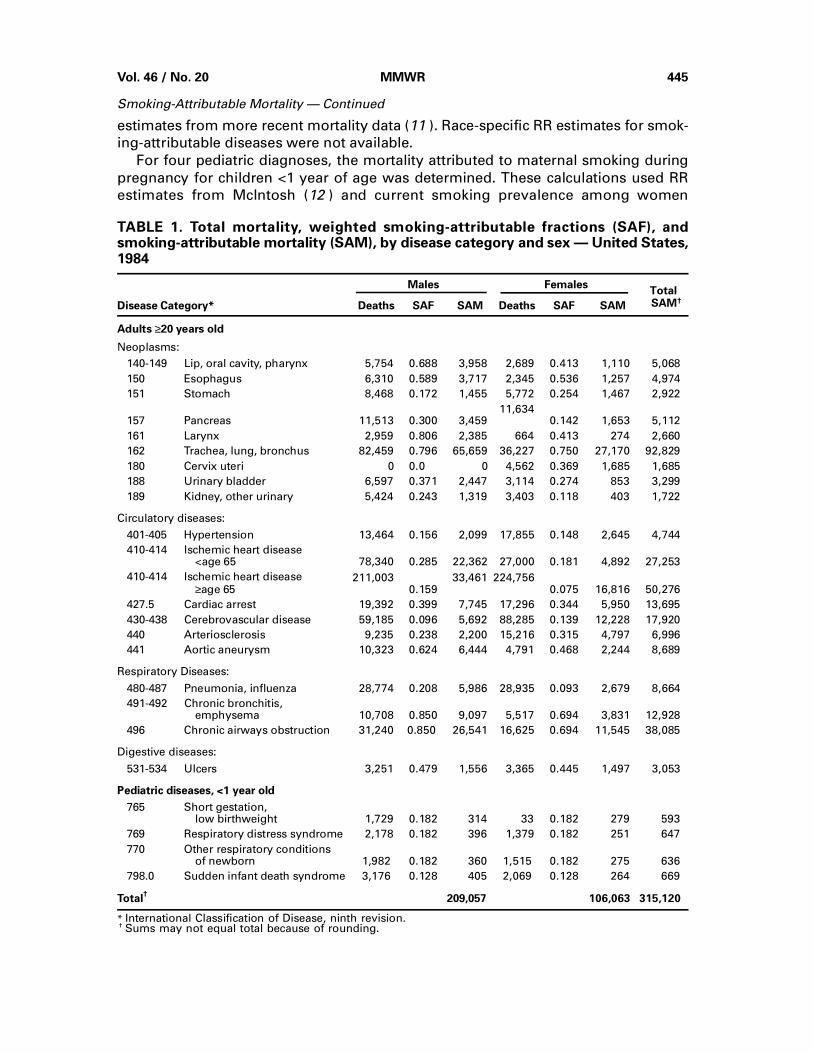
TABLE 1. Total mortality, weighted smoking-attributable fractions (SAF), andsmoking-attributable mortality (SAM), by disease category and sex — United States,1984
Males FemalesTotal
SAM†Disease Category* Deaths SAF SAM Deaths SAF SAM
Adults ≥20 years old
Neoplasms:
140-149 Lip, oral cavity, pharynx 5,754 0.688 3,958 2,689 0.413 1,110 5,068
150 Esophagus 6,310 0.589 3,717 2,345 0.536 1,257 4,974
151 Stomach 8,468 0.172 1,455 5,772 0.254 1,467 2,922
157 Pancreas 11,513 0.300 3,459 11,634
0.142 1,653 5,112
161 Larynx 2,959 0.806 2,385 664 0.413 274 2,660
162 Trachea, lung, bronchus 82,459 0.796 65,659 36,227 0.750 27,170 92,829
180 Cervix uteri 0 0.0 0 4,562 0.369 1,685 1,685
188 Urinary bladder 6,597 0.371 2,447 3,114 0.274 853 3,299
189 Kidney, other urinary 5,424 0.243 1,319 3,403 0.118 403 1,722
Circulatory diseases:
401-405 Hypertension 13,464 0.156 2,099 17,855 0.148 2,645 4,744
410-414 Ischemic heart disease <age 65 78,340 0.285 22,362 27,000 0.181 4,892 27,253
410-414 Ischemic heart disease
≥age 65211,003
0.159 33,461 224,756
0.075 16,816 50,276
427.5 Cardiac arrest 19,392 0.399 7,745 17,296 0.344 5,950 13,695
430-438 Cerebrovascular disease 59,185 0.096 5,692 88,285 0.139 12,228 17,920
440 Arteriosclerosis 9,235 0.238 2,200 15,216 0.315 4,797 6,996
441 Aortic aneurysm 10,323 0.624 6,444 4,791 0.468 2,244 8,689
Respiratory Diseases:
480-487 Pneumonia, influenza 28,774 0.208 5,986 28,935 0.093 2,679 8,664
491-492 Chronic bronchitis, emphysema 10,708 0.850 9,097 5,517 0.694 3,831 12,928
496 Chronic airways obstruction 31,240 0.850 26,541 16,625 0.694 11,545 38,085
Digestive diseases:
531-534 Ulcers 3,251 0.479 1,556 3,365 0.445 1,497 3,053
Pediatric diseases, <1 year old
765 Short gestation, low birthweight 1,729 0.182 314 33 0.182 279 593
769 Respiratory distress syndrome 2,178 0.182 396 1,379 0.182 251 647
770 Other respiratory conditions of newborn 1,982 0.182 360 1,515 0.182 275 636
798.0 Sudden infant death syndrome 3,176 0.128 405 2,069 0.128 264 669
Total†
209,057 106,063 315,120
* International Classification of Disease, ninth revision.† Sums may not equal total because of rounding.
Vol. 46 / No. 20 MMWR 445
Smoking-Attributable Mortality — Continued
20–64 years of age as a proxy for the percentage of pregnant women who smoke. The
RR (1.50) for sudden infant death syndrome from McIntosh (12 ) was used, but the RR
(1.76) for total infant mortality reported by McIntosh was used to calculate the SAF for
only three specific infant death categories (short gestation/low birthweight, respira-
tory distress syndrome, and other respiratory conditions).
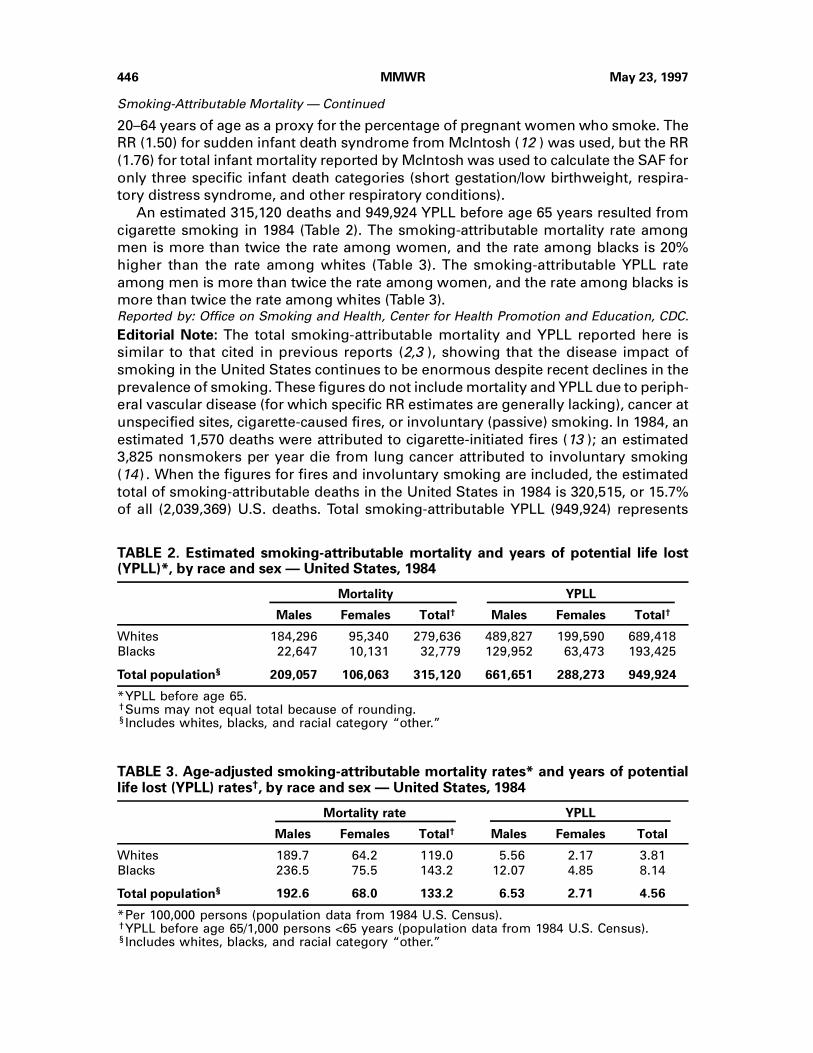
An estimated 315,120 deaths and 949,924 YPLL before age 65 years resulted from
cigarette smoking in 1984 (Table 2). The smoking-attributable mortality rate among
men is more than twice the rate among women, and the rate among blacks is 20%
higher than the rate among whites (Table 3). The smoking-attributable YPLL rate
among men is more than twice the rate among women, and the rate among blacks is
more than twice the rate among whites (Table 3).Reported by: Office on Smoking and Health, Center for Health Promotion and Education, CDC.
Editorial Note: The total smoking-attributable mortality and YPLL reported here is
similar to that cited in previous reports (2,3 ), showing that the disease impact of
smoking in the United States continues to be enormous despite recent declines in the
prevalence of smoking. These figures do not include mortality and YPLL due to periph-
eral vascular disease (for which specific RR estimates are generally lacking), cancer at
unspecified sites, cigarette-caused fires, or involuntary (passive) smoking. In 1984, an
estimated 1,570 deaths were attributed to cigarette-initiated fires (13 ); an estimated
3,825 nonsmokers per year die from lung cancer attributed to involuntary smoking
(14) . When the figures for fires and involuntary smoking are included, the estimated
total of smoking-attributable deaths in the United States in 1984 is 320,515, or 15.7%
of all (2,039,369) U.S. deaths. Total smoking-attributable YPLL (949,924) represents
TABLE 2. Estimated smoking-attributable mortality and years of potential life lost(YPLL)*, by race and sex — United States, 1984
Mortality YPLL
Males Females Total† Males Females Total†
Whites 184,296 95,340 279,636 489,827 199,590 689,418
Blacks 22,647 10,131 32,779 129,952 63,473 193,425
Total population§ 209,057 106,063 315,120 661,651 288,273 949,924
*YPLL before age 65.†Sums may not equal total because of rounding.§Includes whites, blacks, and racial category “other.”
TABLE 3. Age-adjusted smoking-attributable mortality rates* and years of potentiallife lost (YPLL) rates†, by race and sex — United States, 1984
Mortality rate YPLL
Males Females Total† Males Females Total
Whites 189.7 64.2 119.0 5.56 2.17 3.81
Blacks 236.5 75.5 143.2 12.07 4.85 8.14
Total population§ 192.6 68.0 133.2 6.53 2.71 4.56
*Per 100,000 persons (population data from 1984 U.S. Census).†YPLL before age 65/1,000 persons <65 years (population data from 1984 U.S. Census).§Includes whites, blacks, and racial category “other.”
446 MMWR May 23, 1997
Smoking-Attributable Mortality — Continued
8.1% of all (11,761,000) U.S. YPLL before age 65 (excluding YPLL due to cigarette-
caused fires or involuntary smoking).
Among blacks, the smoking-attributable mortality (32,779) represents 13.9% of to-
tal 1984 mortality (235,884), whereas the smoking-attributable mortality for whites
(279,636) was 15.7% of total 1984 mortality (1,781,897), excluding deaths due to fires
or involuntary smoking. However, the smoking-attributable mortality rate and YPLL
rate were higher among blacks than among whites. These differences in rates reflect
a higher prevalence of smoking and a higher mortality rate from smoking-related dis-
eases among blacks. Higher YPLL rates among blacks may also reflect more smoking-
attributable deaths at earlier ages. Because blacks tend to smoke fewer cigarettes per
day than whites (15,16 ), the difference in smoking-attributable mortality and YPLL
rates between blacks and whites may be slightly overestimated. On the other hand,
the RR of smoking-related diseases among blacks may be higher than the RR esti-
mates used here because of increased interactions between smoking and other risk
factors, different tar and nicotine exposures, or different smoking patterns. Still,
these findings support previously cited concerns regarding the increased burden of
smoking-related disease among blacks (17 ).
Smoking prevalence for 1985 was used to calculate the SAFs in this study. How-
ever, the 1984 smoking-related mortality is a result of a higher smoking prevalence
during the 1950s, ’60s, and ’70s, the decades during which these diseases were devel-
oping. Therefore, the SAFs used here are conservative.
CDC has examined YPLL before age 65 years since 1979 (6 ). In this study, most
smoking-related deaths (218,691, or 69.4%) occurred among persons ≥65 years of age.
Thus, the smoking-attributable YPLL among persons <65 reported here (949,924) is
substantially lower than the 3.6 million smoking-attributable YPLL calculated when
the average life expectancy in the United States is used for calculating YPLL for 1984.
Group-specific calculations such as these are possible for states and other defined
populations if mortality and smoking prevalence data for those populations are avail-
able. A computer program has recently been developed to aid in calculating mortality
and YPLL attributed to cigarette smoking (18 ). CDC is now collaborating with all
50 state health departments, Puerto Rico, and the District of Columbia to perform
similar studies. Results from this project will be reported in 1988.
References 1. Office on Smoking and Health. The health consequences of smoking: cancer—a report of
the Surgeon General. Rockville, Maryland: US Department of Health and Human Services,Public Health Service, 1982:xi; DHHS publication no. (PHS)82-50179.
2. Rice DP, Hodgson TA, Sinsheimer P, Browner W, Kopstein AN. The economic costs of thehealth effects of smoking, 1984. Milbank Mem Fund Q 1986;64:489-547.
3. Office of Technology Assessment. Smoking-related deaths and financial costs. OTA StaffMemorandum. Health Program, U.S. Congress, 1985.
4. Walter SD. The estimation and interpretation of attributable risk in health research. Biometrics1976;32:829-49.
5. Lilienfeld AM, Lilienfeld DE. Foundations of epidemiology. 2nd ed. New York: Oxford Uni-versity Press, 1980.
6. CDC. Premature mortality in the United States: public health issues in the use of years ofpotential life lost. MMWR 1986;35(suppl 2S).
7. Hammond EC. Smoking in relation to the death rates of one million men and women. In:Haenszel WM, ed. Epidemiological approaches to the study of cancer and other chronic dis-eases. Bethesda: National Cancer Institute, US Department of Health, Education, and Welfare,Public Health Service, 1966:127-204. (NCI Monograph no. 19).
Vol. 46 / No. 20 MMWR 447
Smoking-Attributable Mortality — Continued
8. Doll R, Peto R. Mortality in relation to smoking: 20 years’ observations on male British Doctors.Br Med J 1976;2:1525-36.
9. Doll R, Gray R, Hafner B, Peto R. Mortality in relation to smoking: 22 years’ observations onfemale British doctors. Br Med J 1980;280:967-71.
10. Cederlöf R, Friberg L, Lundman T. The interactions of smoking, environment, and heredityand their implications for disease etiology: a report of epidemiological studies on the Swedishtwin registries. Acta Med Scand 1977;612(suppl):7-128.
11. American Cancer Society. 1986 cancer facts and figures. New York: American Cancer Society,1986:17.
12. McIntosh ID. Smoking and pregnancy: attributable risks and public health implications. CanJ Public Health 1984;75:141-8.
13. Hall JR Jr. Expected changes in fire damages from reducing cigarette ignition propensity.Report No. 5, Technical Study Group, Cigarette Safety Act of 1984. Quincy, Massachusetts:National Fire Protection Association, Fire Analysis Division, 1987.
14. National Academy of Sciences. Environmental tobacco smoke: measuring exposures and as-sessing health effects. Washington, DC: National Academy Press, 1986: Appendix D.
15. CDC. Cigarette smoking in the United States, 1986. MMWR 1987;36:581-5.
16. National Center for Health Statistics. Health, United States, 1986. Washington, DC: US De-partment of Health and Human Services, Public Health Service, 1986:126; DHHS publicationno. (PHS)87-1232.
17. CDC. Cigarette smoking among blacks and other minority populations. MMWR 1987;36:404-7.
18. Shultz JM. SAMMEC: smoking-attributable mortality, morbidity, and economic costs (com-puter software and documentation). Minnesota: Center for Nonsmoking and Health,Minnesota Department of Health, 1986.
Editorial Note—1997: In 1987, CDC published the preceding report that provided a
detailed and comprehensive estimate of the number of deaths attributed to cigarette
smoking in the United States. Using the attributable fraction, which measures the
magnitude of a public health problem accounted for by an etiologic agent, CDC was
able to quantify the impact of smoking. This method established that smoking was the
leading cause of preventable deaths in the United States (1 ). As a result, increased
emphasis was placed on decreasing the health burden caused by tobacco use and on
reducing cigarette smoking. Since this SAM estimate was published in 1987, contin-
ued research has increased understanding of the health risks associated with tobacco
use, including nicotine addiction and the recognition that addiction begins in child-
hood. Public health programs have responded by focusing on preventing tobacco use
among adolescents, assisting in tobacco-use cessation, and protecting nonsmokers
from environmental tobacco smoke. This contemporary editorial note reviews pre-
vious SAM estimates, presents new SAM estimates for 1990–1994, and discusses fu-
ture implications.
SAM and YPLL estimates for the United States published since the first estimate for
1984 include 390,000 deaths for 1985, 434,000 deaths and 6 million YPLL before age 85
for 1988, and 418,000 deaths and 5 million YPLL to life expectancy for 1990 (2 ). SAM
and YPLL also have been estimated for all 50 states and the District of Columbia for
1985 and for 1990 (3 ). Although all estimates were calculated by the same equation
used for the SAF, the data sources, study populations, and causes of death have
changed. The Smoking-Attributable Mortality, Morbidity, and Economic Costs (SAM-
MEC) software program has also been used for calculating these estimates (2 ).
Since 1989, RR estimates for calculating SAM and YPLL have been obtained from
the American Cancer Society’s Cancer Prevention Study II (CPS-II) for 1982–1986 (4 ).
The CPS-II was selected, in part, because it is the largest prospective U.S. study that
has collected data on the relation between smoking and mortality (4 ). Recent SAM
448 MMWR May 23, 1997
Smoking-Attributable Mortality — Continued
estimates for adults have been limited to persons aged ≥35 years because the CPS-II
study population was restricted to this age range. Deaths from stomach cancer and
ulcers were dropped from the calculation of SAM because a causal relation has not
been established (4 ). Conversely, the cardiovascular and respiratory disease catego-
ries were expanded to include the International Classification of Diseases, Ninth Revi-
sion [ICD-9], codes 390–398, 415–417, 420–429, 442–448, 010–012, and 493. The CPS-II
data also enabled the calculation of the RR for smoking and cerebrovascular disease,
which declines with age (4 ), for two age groups (35–64 years and ≥65 years).
Cigarette smoking remains the leading preventable cause of death in the United
States. The same methods and data sources that were used to calculate the 1990 SAM
and YPLL (2 )† were used for the 1990–1994 calculations, which indicated that
2,153,700 deaths (1,393,200 men and 760,400 women; total annual average: 430,700
deaths) were attributed to smoking (19.5% of all deaths). A total of 906,600 of these
deaths resulted from cardiovascular diseases; 778,700, from neoplasms; 454,800,
from nonmalignant respiratory diseases; 7900, from diseases among infants; and
5500, from smoking-related fires. Lung cancer (616,800 deaths), ischemic heart dis-
ease (IHD) (490,000 deaths), and chronic airway obstruction (270,100 deaths) ac-
counted for most deaths. During 1990–1994, cigarette smoking resulted in 5,732,900
YPLL before age 65 years and in 28,606,000 YPLL to life expectancy.
During 1990–1994, estimates of SAM were higher among men than among women,
reflecting their longer duration and higher prevalence of smoking and greater num-
bers of cigarettes smoked per day (6 ). Annual SAM rates will probably remain stable
if current trends in smoking prevalence among adults continue. Although the preva-
lence of smoking among persons aged ≥35 years decreased from 1985 to 1990 (28.4%
to 24.1%), during 1990–1994, smoking prevalence remained relatively constant—at
23.6%–24.8% (CDC, unpublished data). However, the prevalence of smoking among
U.S. adolescents has been increasing since 1992 (7 ). If these smoking patterns con-
tinue into adulthood, SAM and YPLL are expected to increase. Assuming that one
third of adult smokers, 10% of former smokers, and 5.3 million persons aged <18 years
die from smoking and that current smoking patterns continue, an estimated 25 million
persons alive today will die prematurely from smoking-related illnesses (7,8 ).
Lung cancer has been and probably will continue to be the leading cause of SAM
because, although lung cancer death rates are decreasing among men, rates are con-
tinuing to increase among women (9 ). Among women, death rates for lung cancer
have surpassed those for breast cancer since 1987 (9 ). In addition, because recent
trends indicate a slowing of the decline in IHD mortality, IHD will probably remain a
major contributor to SAM (9 ).
SAM and YPLL may be underestimated for several reasons (2 ); recent studies have
addressed two of these reasons. First, SAM and YPLL estimates are based on the
prevalence of current and former smokers in the current year; however, the deaths
that occur during a given year are primarily among persons who began smoking 30–
50 years earlier (10 ), many of whom have quit smoking (10 ). Including these persons
in the prevalence estimates of former smokers may decrease the SAF because the
summary measure of risk for former smokers does not reflect their increased likeli-
†Except for the prevalence of smoking among pregnant women in the United States for 1992through 1994, which was estimated from the 1992–1993 National Pregnancy and Health Survey(5 ).
Vol. 46 / No. 20 MMWR 449
Smoking-Attributable Mortality — Continued
hood of dying from a smoking-related disease (4 ). Among whites, expanding the clas-
sification of smoking to include information on duration and number of cigarettes
smoked per day resulted in 10% larger SAM estimates for IHD than SAM estimates in
which smoking was categorized as current, former, and never (10 ). Second, the SAM
estimates do not include mortality caused by cigar smoking, pipe smoking, or smoke-
less tobacco use. Approximately 1000 deaths were attributable to pipe smoking in
1991 (11 ).
Although SAM and YPLL estimates are not adjusted for confounders (2–4 ), a recent
study has documented little change in SAM estimates after adjustment for confoun-
ders (12 ). Among whites, SAM estimates for the combined disease categories of lung
cancer, IHD, bronchitis/emphysema, chronic airway obstruction, and cerebrovascular
disease were 2% higher than age-adjusted estimates after adjustment for relevant
confounders including age, education, alcohol intake, diabetes, and hypertension (12).
Cigarette smoking has resulted in approximately 10 million deaths since the first
Surgeon General’s report on smoking and health in 1964 (2,4,13 ). In 1993, $50 billion
in medical costs were attributable to smoking (14 ). The human and economic costs of
smoking will continue to accumulate until the completely effective implementation of
public health efforts to prevent initiation, to promote cessation, and to protect non-
smokers from the adverse effects of environmental tobacco smoke. Examples of such
efforts include Food and Drug Administration regulations to restrict youth access to
tobacco and to reduce the appeal of cigarette advertising to youth (7 ); comprehensive
state-based efforts, including tax increases and earmarked funding for tobacco-use
prevention and mass media campaigns similar to those in Massachusetts and Califor-
nia (15 ); physician adherence to the Agency for Health Care Policy and Research’s
smoking cessation guidelines (8 ); institutional adoption of the Guidelines for School
Health Programs to Prevent Tobacco Use and Addiction (16 ); and clean indoor-air
policies that protect nonsmokers. 1997 Editorial Note by Ann M Malarcher, PhD, Jeffrey H Chrismon, Gary A Giovino, PhD,Michael P Eriksen, ScD, Office on Smoking and Health, National Center for Chronic DiseasePrevention and Health Promotion, CDC.
References1. McGinnis JM, Foege WH. Actual causes of death in the United States. JAMA 1993;270:2207–12.
2. CDC. Cigarette smoking-attributable mortality and years of potential life lost—United States,1990. MMWR 1993;42:645–9.
3. Nelson DE, Kirkendall RS, Lawton RL, et al. Surveillance for smoking-attributable mortalityand years of potential life lost, by state—United States, 1990. MMWR 1994;43(no. SS-1):1–8.
4. US Department of Health and Human Services. Reducing the health consequences of smoking:25 years of progress—a report of the Surgeon General. Washington, DC: US Department ofHealth and Human Services, Public Health Service, CDC, National Center for Chronic DiseasePrevention and Health Promotion, Office on Smoking and Health, 1989.
5. National Institute on Drug Abuse. Summary tables: annualized estimates from the NationalPregnancy and Health Survey. Rockville, Maryland: US Department of Health and HumanServices, Public Health Service, National Institutes of Health, National Institute on Drug Abuse,1994.
6. Giovino GA, Schooley MW, Zhu B-P, et al. Surveillance for selected tobacco-use behaviors—United States, 1900–1994. MMWR 1994;43(no. SS-3).
7. CDC. Projected smoking-related deaths among youth—United States. MMWR 1996;45:971–4.
8. CDC. State specific prevalence of cigarette smoking—United States, 1995. MMWR1996;45:962–6.
9. National Center for Health Statistics. Health, United States, 1995. Hyattsville, Maryland: USDepartment of Health and Human Services, Public Health Service, CDC, 1996.
450 MMWR May 23, 1997
Smoking-Attributable Mortality — Continued
10. Schulman J, Mowery PD, Pierce BK, et al. Methodologic issues in estimating smoking at-tributable mortality. Atlanta, Georgia: Battelle, Centers for Public Health Research andEvaluation, 1995.
11. Nelson DE, Davis RM, Chrismon JH, Giovino GA. Pipe smoking in the United States, 1965–1991:prevalence and attributable mortality. Prev Med 1996;25:91–9.
12. Schulman J, Epstein L, Mowery PD, Pierce B, Euskirchen E, Abed J. Smoking attributablemortality: control for confounding. Atlanta, Georgia: Battelle, Centers for Public Health Re-search and Evaluation, 1997.
13. US Department of Health, Education, and Welfare. Smoking and health report of the advisorycommittee to the Surgeon General of the Public Health Service. Washington, DC: US De-partment of Health, Education, and Welfare, Public Health Service, 1964.
14. CDC. Medical-care expenditures attributable to cigarette smoking—United States, 1993.MMWR 1994;43:469–72.
15. CDC. Cigarette smoking before and after an excise tax increase and an antismoking cam-paign—Massachusetts, 1990–1996. MMWR 1996;45:966–70.
16. CDC. Guidelines for school health programs to prevent tobacco use and addiction. MMWR1994;43(no. RR-2).
Smoking-Attributable Mortality — Continued
Outbreaks of Cyclosporiasis — United States, 1997
Cyclosporiasis — ContinuedIn April and May 1997, CDC received reports of seven event-associated clusters of
cases of cyclosporiasis from five states (California, Florida, Nevada, New York, and
Texas). Approximately 80 cases of infection with human-associated Cyclospora, a re-
cently characterized coccidian parasite (1 ), have been laboratory-confirmed. State
and local health departments, CDC, and the Food and Drug Administration are con-
ducting investigations to identify the vehicles of infection.
Both foodborne and waterborne outbreaks of cyclosporiasis have previously been
reported in the United States during spring and summer months (2–4 ). In 1996, a total
of 978 laboratory-confirmed cases of cyclosporiasis in the United States and Canada
were reported in association with a widespread foodborne outbreak (3 ). The average
incubation period of cyclosporiasis is 1 week. Illness can be protracted (from days to
weeks) with frequent, watery stools and other gastrointestinal symptoms; symptoms
may remit and relapse. Health-care providers should consider Cyclospora infection in
persons with prolonged diarrheal illness and specifically request laboratory testing for
this parasite (5,6 ), which is not routinely performed by most laboratories.
Cyclosporiasis can be treated with a 7-day course of oral trimethoprim (TMP)-
sulfamethoxazole (SMX) (for adults, 160 mg TMP plus 800 mg SMX twice daily; for
children, 5 mg/kg TMP plus 25 mg/kg SMX twice daily) (7 ). Treatment regimens for
patients who cannot tolerate sulfa drugs have not yet been identified.
Health departments that identify cases of cyclosporiasis should contact CDC’s Divi-
sion of Parasitic Diseases, National Center for Infectious Diseases, telephone (770)
488-7760.Reported by: State and local health departments. Office of Regulatory Affairs, and Center forFood Safety and Applied Nutrition, Food and Drug Administration. Div of Parasitic Diseases,National Center for Infectious Diseases, CDC.
References1. Ortega YR, Sterling CR, Gilman RH, Cama VA, Díaz F. Cyclospora species—a new protozoan
pathogen of humans. N Engl J Med 1993;328:1308–12.
2. CDC. Update: outbreaks of Cyclospora cayetanensis infection—United States and Canada,
1996. MMWR 1996;45:611–2.
Vol. 46 / No. 20 MMWR 451
Smoking-Attributable Mortality — Continued
3. Herwaldt BL, Ackers M-L, Cyclospora Working Group. An outbreak in 1996 of cyclosporiasis
associated with imported raspberries. N Engl J Med 1997;336:1548–56 (in press).
4. Huang P, Weber JT, Sosin DM, et al. The first reported outbreak of diarrheal illness associated
with Cyclospora in the United States. Ann Intern Med 1995;123:409–14.
5. Soave R. Cyclospora: an overview. Clin Infect Dis 1996;23:429–37.
6. Garcia LS, Bruckner DA. Diagnostic medical parasitology. 3rd ed. Washington, DC: American
Society for Microbiology, 1997:66–9.
7. Hoge CW, Shlim DR, Ghimire M, et al. Placebo-controlled trial of co-trimoxazole for Cyclospora
infections among travellers and foreign residents in Nepal. Lancet 1995;345:691–3.
Cyclosporiasis — Continued
Notice to Reader
Courses on Epidemiology, Public Health Informatics, and Advanced CaseStudies in Public Health Practice
CDC and the University of Washington School of Public Health and Community
Medicine will cosponsor courses in epidemiology, public health informatics, and ad-
vanced case studies in public health practice as part of the 1997 Summer Institute of
Public Health Practice at the University of Washington School of Public Health,
July 21–August 1, 1997, in Seattle, Washington. The epidemiology course will provide
an in-depth consideration of special epidemiologic topics. The informatics course will
cover the principles of applying information technology to public health practice. The
advanced case studies course will examine current issues in public health practice
using several management tools and analytic techniques. These courses are offered
in conjunction with various practice-oriented public health science and management
courses at the Summer Institute. Public health practitioners are encouraged to attend
the courses.
Participation in each course is limited, and early application is encouraged. There is
a tuition charge. Additional information and applications are available from the Center
for Health Education and Research, 1001 Broadway, Suite 217, Seattle, WA 98122; tele-
phone (206) 720-4250; fax (206) 720-4218; e-mail: [email protected]; World-
Wide Web site: http://healthlinks.washington.edu/nwcphp/edu/si/intro.html.
452 MMWR May 23, 1997
Cyclosporiasis — Continued
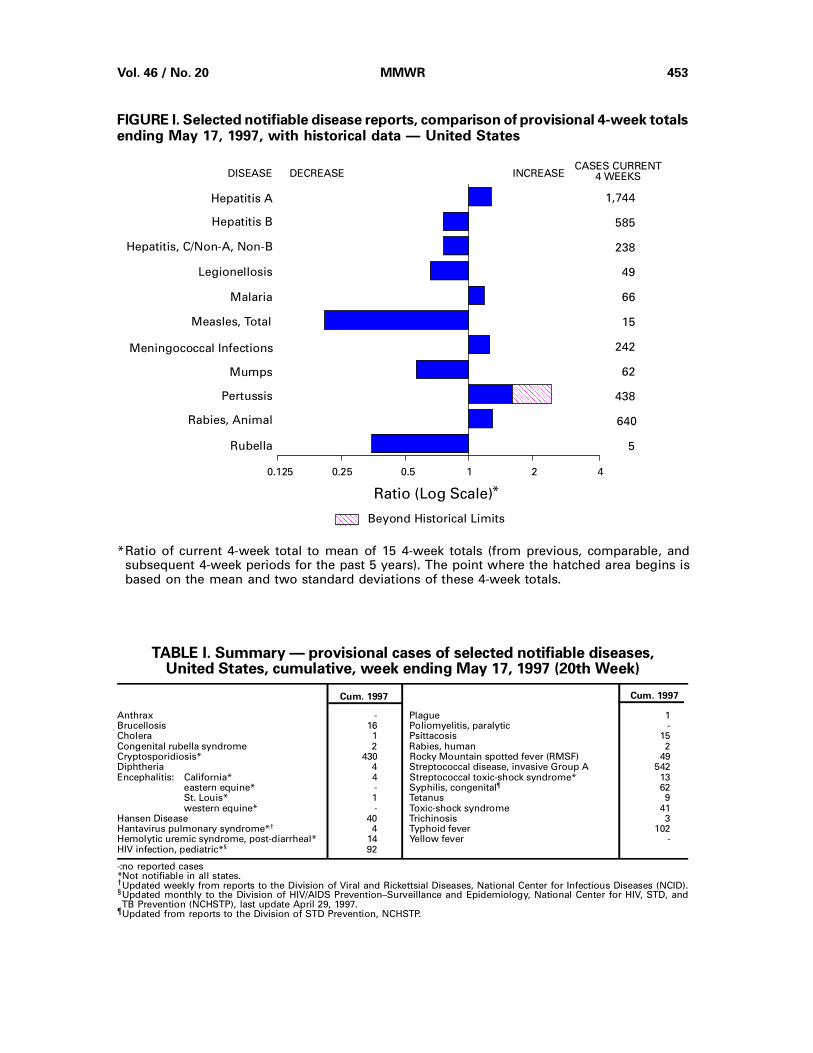
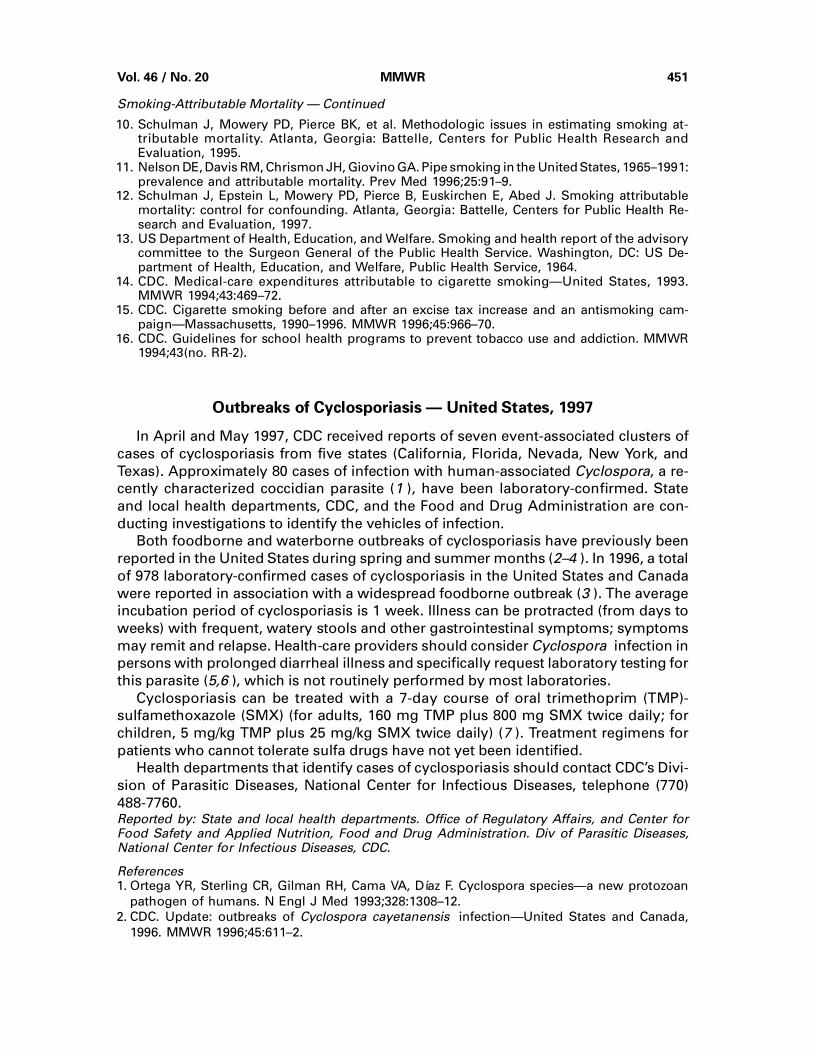
FIGURE I. Selected notifiable disease reports, comparison of provisional 4-week totalsending May 17, 1997, with historical data — United States
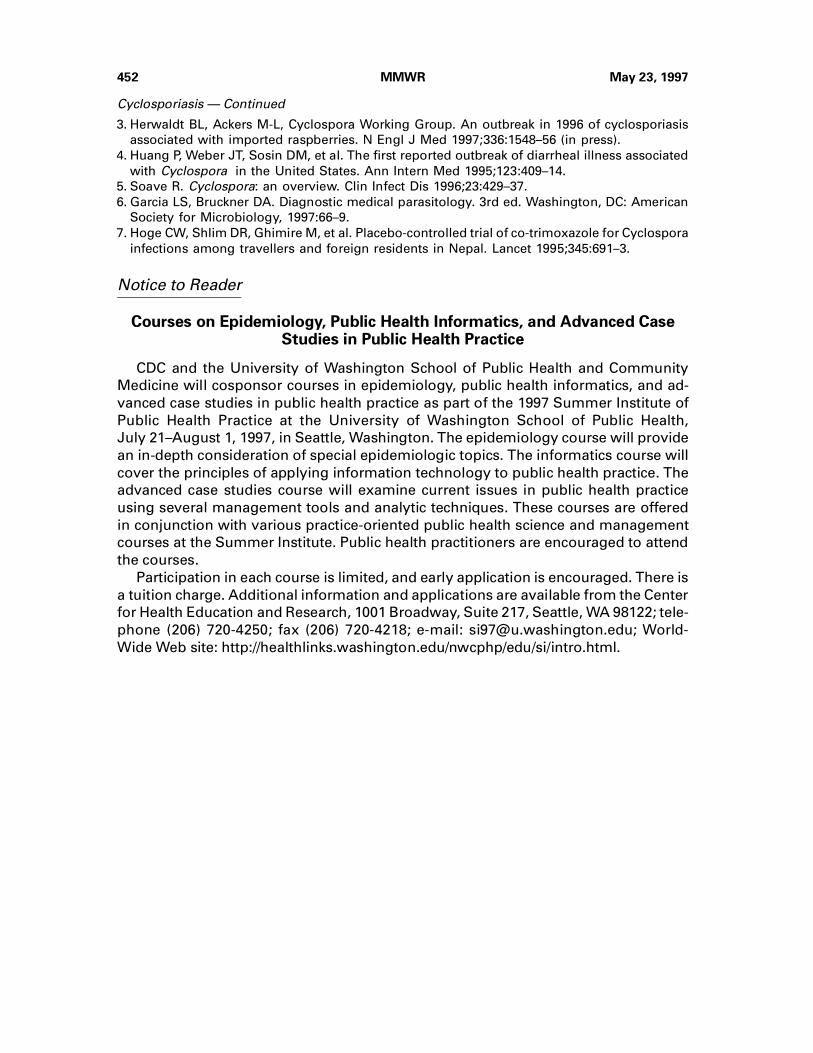
Anthrax - Plague 1Brucellosis 16 Poliomyelitis, paralytic -Cholera 1 Psittacosis 15Congenital rubella syndrome 2 Rabies, human 2Cryptosporidiosis* 430 Rocky Mountain spotted fever (RMSF) 49Diphtheria 4 Streptococcal disease, invasive Group A 542Encephalitis: California* 4 Streptococcal toxic-shock syndrome* 13
eastern equine* - Syphilis, congenital¶ 62St. Louis* 1 Tetanus 9western equine* - Toxic-shock syndrome 41
Hansen Disease 40 Trichinosis 3Hantavirus pulmonary syndrome*† 4 Typhoid fever 102Hemolytic uremic syndrome, post-diarrheal* 14 Yellow fever -HIV infection, pediatric*§ 92
Cum. 1997Cum. 1997
TABLE I. Summary — provisional cases of selected notifiable diseases,United States, cumulative, week ending May 17, 1997 (20th Week)
-: no reported cases*Not notifiable in all states.† Updated weekly from reports to the Division of Viral and Rickettsial Diseases, National Center for Infectious Diseases (NCID).§Updated monthly to the Division of HIV/AIDS Prevention–Surveillance and Epidemiology, National Center for HIV, STD, andTB Prevention (NCHSTP), last update April 29, 1997.
¶Updated from reports to the Division of STD Prevention, NCHSTP.
DISEASE DECREASE INCREASECASES CURRENT
4 WEEKS
Ratio (Log Scale)*
AAAAAAAAAAAA
AAAAAA
Beyond Historical Limits
4210.50.250.125
1,744
585
238
49
66
15
242
62
438
640
5
Hepatitis A
Hepatitis B
Hepatitis, C/Non-A, Non-B
Legionellosis
Malaria
Measles, Total
Mumps
Pertussis
Rabies, Animal
Rubella
Meningococcal Infections
AAAAAAAAAAAAAAAAAAAA
AAAAAAAAAAAAAAAAAAAA
AAAAA
*Ratio of current 4-week total to mean of 15 4-week totals (from previous, comparable, andsubsequent 4-week periods for the past 5 years). The point where the hatched area begins isbased on the mean and two standard deviations of these 4-week totals.
Vol. 46 / No. 20 MMWR 453
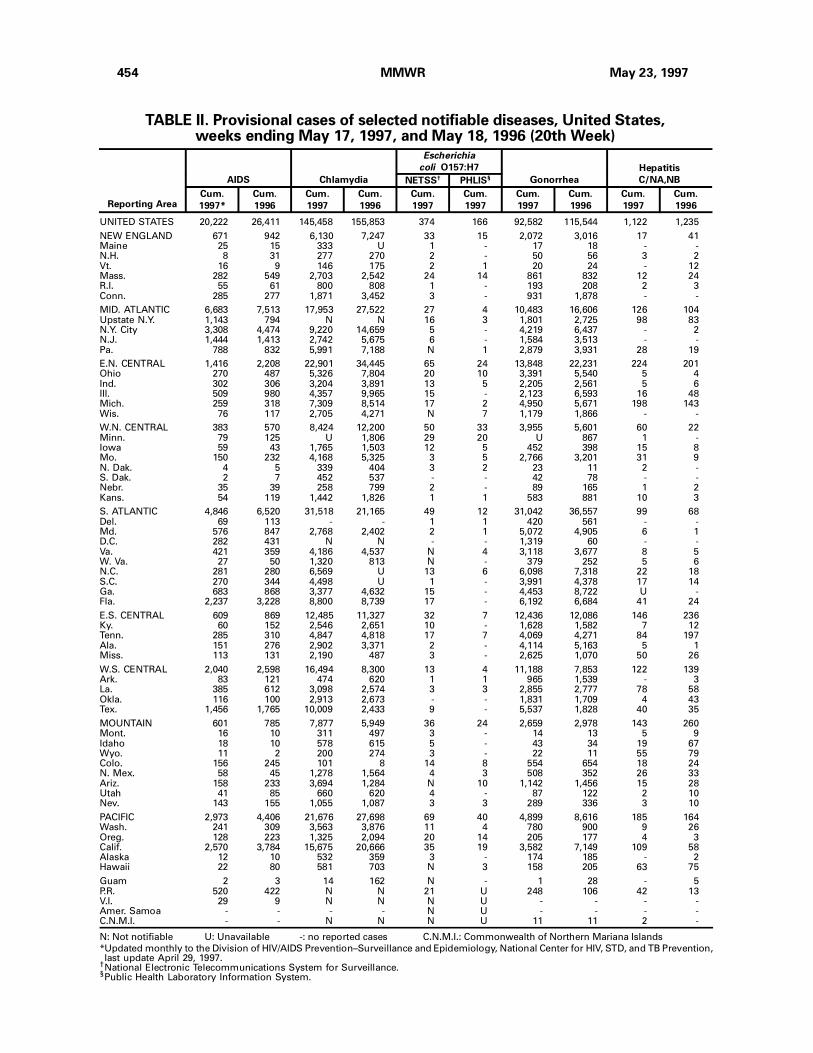
TABLE II. Provisional cases of selected notifiable diseases, United States,weeks ending May 17, 1997, and May 18, 1996 (20th Week)
UNITED STATES 20,222 26,411 145,458 155,853 374 166 92,582 115,544 1,122 1,235
NEW ENGLAND 671 942 6,130 7,247 33 15 2,072 3,016 17 41Maine 25 15 333 U 1 - 17 18 - -N.H. 8 31 277 270 2 - 50 56 3 2Vt. 16 9 146 175 2 1 20 24 - 12Mass. 282 549 2,703 2,542 24 14 861 832 12 24R.I. 55 61 800 808 1 - 193 208 2 3Conn. 285 277 1,871 3,452 3 - 931 1,878 - -
MID. ATLANTIC 6,683 7,513 17,953 27,522 27 4 10,483 16,606 126 104Upstate N.Y. 1,143 794 N N 16 3 1,801 2,725 98 83N.Y. City 3,308 4,474 9,220 14,659 5 - 4,219 6,437 - 2N.J. 1,444 1,413 2,742 5,675 6 - 1,584 3,513 - -Pa. 788 832 5,991 7,188 N 1 2,879 3,931 28 19
E.N. CENTRAL 1,416 2,208 22,901 34,445 65 24 13,848 22,231 224 201Ohio 270 487 5,326 7,804 20 10 3,391 5,540 5 4Ind. 302 306 3,204 3,891 13 5 2,205 2,561 5 6Ill. 509 980 4,357 9,965 15 - 2,123 6,593 16 48Mich. 259 318 7,309 8,514 17 2 4,950 5,671 198 143Wis. 76 117 2,705 4,271 N 7 1,179 1,866 - -
W.N. CENTRAL 383 570 8,424 12,200 50 33 3,955 5,601 60 22Minn. 79 125 U 1,806 29 20 U 867 1 -Iowa 59 43 1,765 1,503 12 5 452 398 15 8Mo. 150 232 4,168 5,325 3 5 2,766 3,201 31 9N. Dak. 4 5 339 404 3 2 23 11 2 -S. Dak. 2 7 452 537 - - 42 78 - -Nebr. 35 39 258 799 2 - 89 165 1 2Kans. 54 119 1,442 1,826 1 1 583 881 10 3
S. ATLANTIC 4,846 6,520 31,518 21,165 49 12 31,042 36,557 99 68Del. 69 113 - - 1 1 420 561 - -Md. 576 847 2,768 2,402 2 1 5,072 4,905 6 1D.C. 282 431 N N - - 1,319 60 - -Va. 421 359 4,186 4,537 N 4 3,118 3,677 8 5W. Va. 27 50 1,320 813 N - 379 252 5 6N.C. 281 280 6,569 U 13 6 6,098 7,318 22 18S.C. 270 344 4,498 U 1 - 3,991 4,378 17 14Ga. 683 868 3,377 4,632 15 - 4,453 8,722 U -Fla. 2,237 3,228 8,800 8,739 17 - 6,192 6,684 41 24
E.S. CENTRAL 609 869 12,485 11,327 32 7 12,436 12,086 146 236Ky. 60 152 2,546 2,651 10 - 1,628 1,582 7 12Tenn. 285 310 4,847 4,818 17 7 4,069 4,271 84 197Ala. 151 276 2,902 3,371 2 - 4,114 5,163 5 1Miss. 113 131 2,190 487 3 - 2,625 1,070 50 26
W.S. CENTRAL 2,040 2,598 16,494 8,300 13 4 11,188 7,853 122 139Ark. 83 121 474 620 1 1 965 1,539 - 3La. 385 612 3,098 2,574 3 3 2,855 2,777 78 58Okla. 116 100 2,913 2,673 - - 1,831 1,709 4 43Tex. 1,456 1,765 10,009 2,433 9 - 5,537 1,828 40 35
MOUNTAIN 601 785 7,877 5,949 36 24 2,659 2,978 143 260Mont. 16 10 311 497 3 - 14 13 5 9Idaho 18 10 578 615 5 - 43 34 19 67Wyo. 11 2 200 274 3 - 22 11 55 79Colo. 156 245 101 8 14 8 554 654 18 24N. Mex. 58 45 1,278 1,564 4 3 508 352 26 33Ariz. 158 233 3,694 1,284 N 10 1,142 1,456 15 28Utah 41 85 660 620 4 - 87 122 2 10Nev. 143 155 1,055 1,087 3 3 289 336 3 10
PACIFIC 2,973 4,406 21,676 27,698 69 40 4,899 8,616 185 164Wash. 241 309 3,563 3,876 11 4 780 900 9 26Oreg. 128 223 1,325 2,094 20 14 205 177 4 3Calif. 2,570 3,784 15,675 20,666 35 19 3,582 7,149 109 58Alaska 12 10 532 359 3 - 174 185 - 2Hawaii 22 80 581 703 N 3 158 205 63 75
Guam 2 3 14 162 N - 1 28 - 5P.R. 520 422 N N 21 U 248 106 42 13V.I. 29 9 N N N U - - - -Amer. Samoa - - - - N U - - - -C.N.M.I. - - N N N U 11 11 2 -
N: Not notifiable U: Unavailable -: no reported cases C.N.M.I.: Commonwealth of Northern Mariana Islands
*Updated monthly to the Division of HIV/AIDS Prevention–Surveillance and Epidemiology, National Center for HIV, STD, and TB Prevention,last update April 29, 1997.
†National Electronic Telecommunications System for Surveillance.§Public Health Laboratory Information System.
Reporting Area
AIDS Chlamydia
Escherichia
coli O157:H7
Gonorrhea
Hepatitis
C/NA,NBNETSS† PHLIS§
Cum.
1997*
Cum.
1996
Cum.
1997
Cum.
1996
Cum.
1997
Cum.
1997
Cum.
1997
Cum.
1996
Cum.
1997
Cum.
1996
454 MMWR May 23, 1997
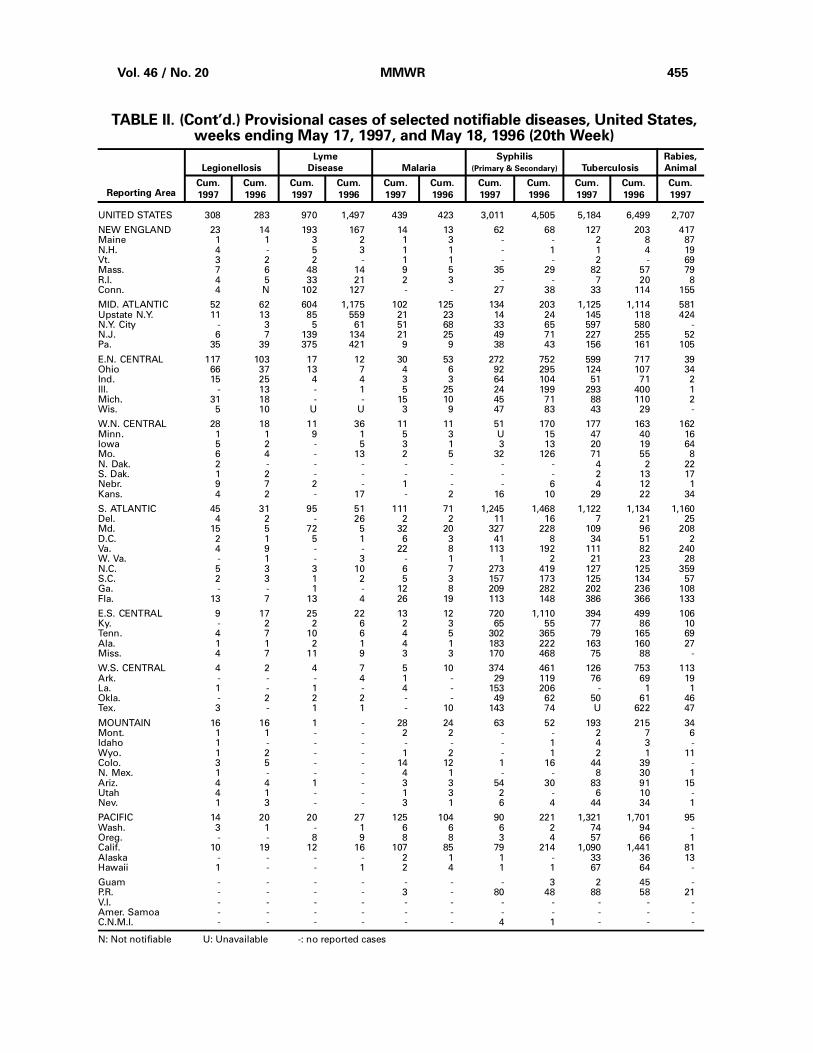
TABLE II. (Cont’d.) Provisional cases of selected notifiable diseases, United States,weeks ending May 17, 1997, and May 18, 1996 (20th Week)
UNITED STATES 308 283 970 1,497 439 423 3,011 4,505 5,184 6,499 2,707
NEW ENGLAND 23 14 193 167 14 13 62 68 127 203 417Maine 1 1 3 2 1 3 - - 2 8 87N.H. 4 - 5 3 1 1 - 1 1 4 19Vt. 3 2 2 - 1 1 - - 2 - 69Mass. 7 6 48 14 9 5 35 29 82 57 79R.I. 4 5 33 21 2 3 - - 7 20 8Conn. 4 N 102 127 - - 27 38 33 114 155
MID. ATLANTIC 52 62 604 1,175 102 125 134 203 1,125 1,114 581Upstate N.Y. 11 13 85 559 21 23 14 24 145 118 424N.Y. City - 3 5 61 51 68 33 65 597 580 -N.J. 6 7 139 134 21 25 49 71 227 255 52Pa. 35 39 375 421 9 9 38 43 156 161 105
E.N. CENTRAL 117 103 17 12 30 53 272 752 599 717 39Ohio 66 37 13 7 4 6 92 295 124 107 34Ind. 15 25 4 4 3 3 64 104 51 71 2Ill. - 13 - 1 5 25 24 199 293 400 1Mich. 31 18 - - 15 10 45 71 88 110 2Wis. 5 10 U U 3 9 47 83 43 29 -
W.N. CENTRAL 28 18 11 36 11 11 51 170 177 163 162Minn. 1 1 9 1 5 3 U 15 47 40 16Iowa 5 2 - 5 3 1 3 13 20 19 64Mo. 6 4 - 13 2 5 32 126 71 55 8N. Dak. 2 - - - - - - - 4 2 22S. Dak. 1 2 - - - - - - 2 13 17Nebr. 9 7 2 - 1 - - 6 4 12 1Kans. 4 2 - 17 - 2 16 10 29 22 34
S. ATLANTIC 45 31 95 51 111 71 1,245 1,468 1,122 1,134 1,160Del. 4 2 - 26 2 2 11 16 7 21 25Md. 15 5 72 5 32 20 327 228 109 96 208D.C. 2 1 5 1 6 3 41 8 34 51 2Va. 4 9 - - 22 8 113 192 111 82 240W. Va. - 1 - 3 - 1 1 2 21 23 28N.C. 5 3 3 10 6 7 273 419 127 125 359S.C. 2 3 1 2 5 3 157 173 125 134 57Ga. - - 1 - 12 8 209 282 202 236 108Fla. 13 7 13 4 26 19 113 148 386 366 133
E.S. CENTRAL 9 17 25 22 13 12 720 1,110 394 499 106Ky. - 2 2 6 2 3 65 55 77 86 10Tenn. 4 7 10 6 4 5 302 365 79 165 69Ala. 1 1 2 1 4 1 183 222 163 160 27Miss. 4 7 11 9 3 3 170 468 75 88 -
W.S. CENTRAL 4 2 4 7 5 10 374 461 126 753 113Ark. - - - 4 1 - 29 119 76 69 19La. 1 - 1 - 4 - 153 206 - 1 1Okla. - 2 2 2 - - 49 62 50 61 46Tex. 3 - 1 1 - 10 143 74 U 622 47
MOUNTAIN 16 16 1 - 28 24 63 52 193 215 34Mont. 1 1 - - 2 2 - - 2 7 6Idaho 1 - - - - - - 1 4 3 -Wyo. 1 2 - - 1 2 - 1 2 1 11Colo. 3 5 - - 14 12 1 16 44 39 -N. Mex. 1 - - - 4 1 - - 8 30 1Ariz. 4 4 1 - 3 3 54 30 83 91 15Utah 4 1 - - 1 3 2 - 6 10 -Nev. 1 3 - - 3 1 6 4 44 34 1
PACIFIC 14 20 20 27 125 104 90 221 1,321 1,701 95Wash. 3 1 - 1 6 6 6 2 74 94 -Oreg. - - 8 9 8 8 3 4 57 66 1Calif. 10 19 12 16 107 85 79 214 1,090 1,441 81Alaska - - - - 2 1 1 - 33 36 13Hawaii 1 - - 1 2 4 1 1 67 64 -
Guam - - - - - - - 3 2 45 -P.R. - - - - 3 - 80 48 88 58 21V.I. - - - - - - - - - - -Amer. Samoa - - - - - - - - - - -C.N.M.I. - - - - - - 4 1 - - -
N: Not notifiable U: Unavailable -: no reported cases
Reporting Area
Legionellosis
Lyme
Disease Malaria
Syphilis
(Primary & Secondary) Tuberculosis
Rabies,
Animal
Cum.
1997
Cum.
1996
Cum.
1997
Cum.
1996
Cum.
1997
Cum.
1996
Cum.
1997
Cum.
1996
Cum.
1997
Cum.
1996
Cum.
1997
Vol. 46 / No. 20 MMWR 455
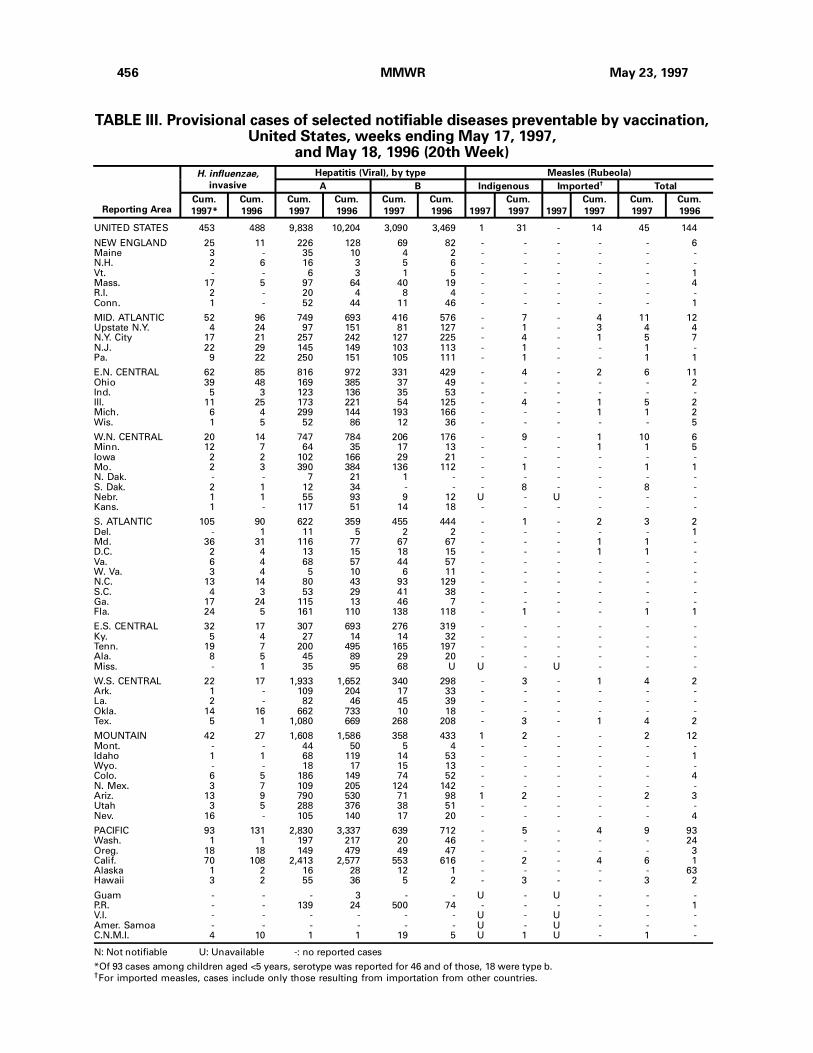
TABLE III. Provisional cases of selected notifiable diseases preventable by vaccination,United States, weeks ending May 17, 1997,
and May 18, 1996 (20th Week)
UNITED STATES 453 488 9,838 10,204 3,090 3,469 1 31 - 14 45 144
NEW ENGLAND 25 11 226 128 69 82 - - - - - 6Maine 3 - 35 10 4 2 - - - - - -N.H. 2 6 16 3 5 6 - - - - - -Vt. - - 6 3 1 5 - - - - - 1Mass. 17 5 97 64 40 19 - - - - - 4R.I. 2 - 20 4 8 4 - - - - - -Conn. 1 - 52 44 11 46 - - - - - 1
MID. ATLANTIC 52 96 749 693 416 576 - 7 - 4 11 12Upstate N.Y. 4 24 97 151 81 127 - 1 - 3 4 4N.Y. City 17 21 257 242 127 225 - 4 - 1 5 7N.J. 22 29 145 149 103 113 - 1 - - 1 -Pa. 9 22 250 151 105 111 - 1 - - 1 1
E.N. CENTRAL 62 85 816 972 331 429 - 4 - 2 6 11Ohio 39 48 169 385 37 49 - - - - - 2Ind. 5 3 123 136 35 53 - - - - - -Ill. 11 25 173 221 54 125 - 4 - 1 5 2Mich. 6 4 299 144 193 166 - - - 1 1 2Wis. 1 5 52 86 12 36 - - - - - 5
W.N. CENTRAL 20 14 747 784 206 176 - 9 - 1 10 6Minn. 12 7 64 35 17 13 - - - 1 1 5Iowa 2 2 102 166 29 21 - - - - - -Mo. 2 3 390 384 136 112 - 1 - - 1 1N. Dak. - - 7 21 1 - - - - - - -S. Dak. 2 1 12 34 - - - 8 - - 8 -Nebr. 1 1 55 93 9 12 U - U - - -Kans. 1 - 117 51 14 18 - - - - - -
S. ATLANTIC 105 90 622 359 455 444 - 1 - 2 3 2Del. - 1 11 5 2 2 - - - - - 1Md. 36 31 116 77 67 67 - - - 1 1 -D.C. 2 4 13 15 18 15 - - - 1 1 -Va. 6 4 68 57 44 57 - - - - - -W. Va. 3 4 5 10 6 11 - - - - - -N.C. 13 14 80 43 93 129 - - - - - -S.C. 4 3 53 29 41 38 - - - - - -Ga. 17 24 115 13 46 7 - - - - - -Fla. 24 5 161 110 138 118 - 1 - - 1 1
E.S. CENTRAL 32 17 307 693 276 319 - - - - - -Ky. 5 4 27 14 14 32 - - - - - -Tenn. 19 7 200 495 165 197 - - - - - -Ala. 8 5 45 89 29 20 - - - - - -Miss. - 1 35 95 68 U U - U - - -
W.S. CENTRAL 22 17 1,933 1,652 340 298 - 3 - 1 4 2Ark. 1 - 109 204 17 33 - - - - - -La. 2 - 82 46 45 39 - - - - - -Okla. 14 16 662 733 10 18 - - - - - -Tex. 5 1 1,080 669 268 208 - 3 - 1 4 2
MOUNTAIN 42 27 1,608 1,586 358 433 1 2 - - 2 12Mont. - - 44 50 5 4 - - - - - -Idaho 1 1 68 119 14 53 - - - - - 1Wyo. - - 18 17 15 13 - - - - - -Colo. 6 5 186 149 74 52 - - - - - 4N. Mex. 3 7 109 205 124 142 - - - - - -Ariz. 13 9 790 530 71 98 1 2 - - 2 3Utah 3 5 288 376 38 51 - - - - - -Nev. 16 - 105 140 17 20 - - - - - 4
PACIFIC 93 131 2,830 3,337 639 712 - 5 - 4 9 93Wash. 1 1 197 217 20 46 - - - - - 24Oreg. 18 18 149 479 49 47 - - - - - 3Calif. 70 108 2,413 2,577 553 616 - 2 - 4 6 1Alaska 1 2 16 28 12 1 - - - - - 63Hawaii 3 2 55 36 5 2 - 3 - - 3 2
Guam - - - 3 - - U - U - - -P.R. - - 139 24 500 74 - - - - - 1V.I. - - - - - - U - U - - -Amer. Samoa - - - - - - U - U - - -C.N.M.I. 4 10 1 1 19 5 U 1 U - 1 -
N: Not notifiable U: Unavailable -: no reported cases
*Of 93 cases among children aged <5 years, serotype was reported for 46 and of those, 18 were type b.†For imported measles, cases include only those resulting from importation from other countries.
Reporting Area
H. influenzae,
invasive
Hepatitis (Viral), by type Measles (Rubeola)
A B Indigenous Imported† Total
Cum.
1997*
Cum.
1996
Cum.
1997
Cum.
1996
Cum.
1997
Cum.
1996 1997
Cum.
1997 1997
Cum.
1997
Cum.
1997
Cum.
1996
456 MMWR May 23, 1997
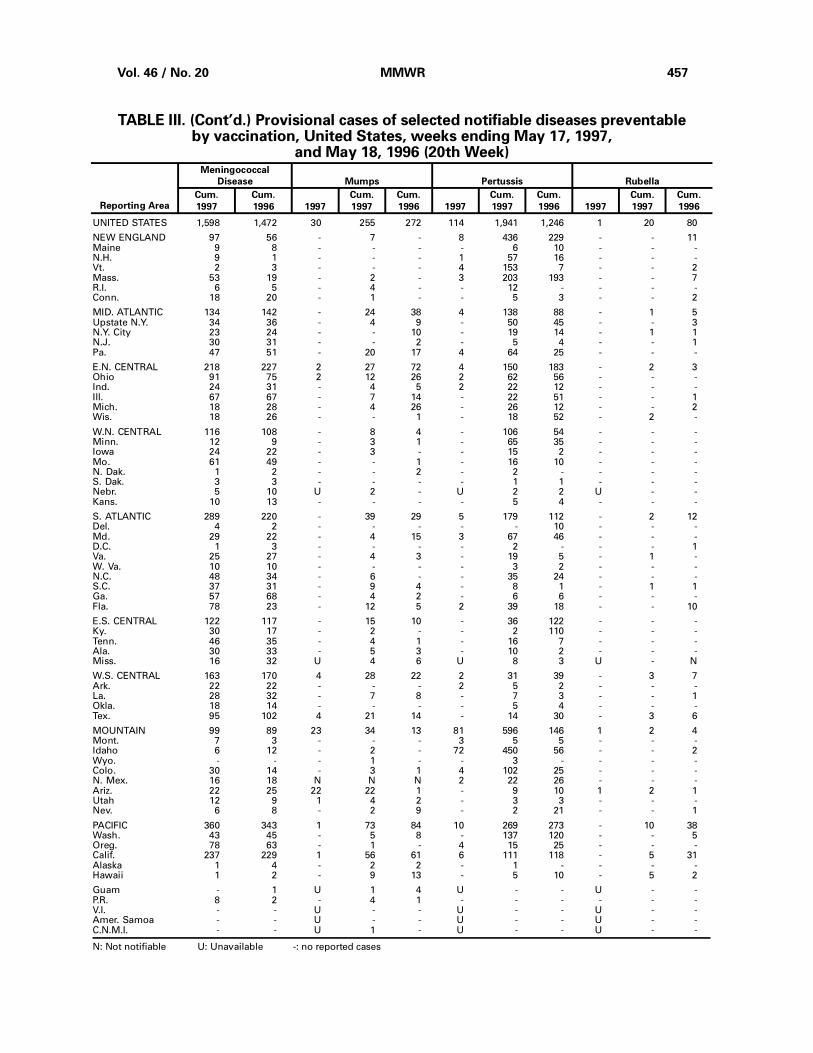
UNITED STATES 1,598 1,472 30 255 272 114 1,941 1,246 1 20 80
NEW ENGLAND 97 56 - 7 - 8 436 229 - - 11Maine 9 8 - - - - 6 10 - - -N.H. 9 1 - - - 1 57 16 - - -Vt. 2 3 - - - 4 153 7 - - 2Mass. 53 19 - 2 - 3 203 193 - - 7R.I. 6 5 - 4 - - 12 - - - -Conn. 18 20 - 1 - - 5 3 - - 2
MID. ATLANTIC 134 142 - 24 38 4 138 88 - 1 5Upstate N.Y. 34 36 - 4 9 - 50 45 - - 3N.Y. City 23 24 - - 10 - 19 14 - 1 1N.J. 30 31 - - 2 - 5 4 - - 1Pa. 47 51 - 20 17 4 64 25 - - -
E.N. CENTRAL 218 227 2 27 72 4 150 183 - 2 3Ohio 91 75 2 12 26 2 62 56 - - -Ind. 24 31 - 4 5 2 22 12 - - -Ill. 67 67 - 7 14 - 22 51 - - 1Mich. 18 28 - 4 26 - 26 12 - - 2Wis. 18 26 - - 1 - 18 52 - 2 -
W.N. CENTRAL 116 108 - 8 4 - 106 54 - - -Minn. 12 9 - 3 1 - 65 35 - - -Iowa 24 22 - 3 - - 15 2 - - -Mo. 61 49 - - 1 - 16 10 - - -N. Dak. 1 2 - - 2 - 2 - - - -S. Dak. 3 3 - - - - 1 1 - - -Nebr. 5 10 U 2 - U 2 2 U - -Kans. 10 13 - - - - 5 4 - - -
S. ATLANTIC 289 220 - 39 29 5 179 112 - 2 12Del. 4 2 - - - - - 10 - - -Md. 29 22 - 4 15 3 67 46 - - -D.C. 1 3 - - - - 2 - - - 1Va. 25 27 - 4 3 - 19 5 - 1 -W. Va. 10 10 - - - - 3 2 - - -N.C. 48 34 - 6 - - 35 24 - - -S.C. 37 31 - 9 4 - 8 1 - 1 1Ga. 57 68 - 4 2 - 6 6 - - -Fla. 78 23 - 12 5 2 39 18 - - 10
E.S. CENTRAL 122 117 - 15 10 - 36 122 - - -Ky. 30 17 - 2 - - 2 110 - - -Tenn. 46 35 - 4 1 - 16 7 - - -Ala. 30 33 - 5 3 - 10 2 - - -Miss. 16 32 U 4 6 U 8 3 U - N
W.S. CENTRAL 163 170 4 28 22 2 31 39 - 3 7Ark. 22 22 - - - 2 5 2 - - -La. 28 32 - 7 8 - 7 3 - - 1Okla. 18 14 - - - - 5 4 - - -Tex. 95 102 4 21 14 - 14 30 - 3 6
MOUNTAIN 99 89 23 34 13 81 596 146 1 2 4Mont. 7 3 - - - 3 5 5 - - -Idaho 6 12 - 2 - 72 450 56 - - 2Wyo. - - - 1 - - 3 - - - -Colo. 30 14 - 3 1 4 102 25 - - -N. Mex. 16 18 N N N 2 22 26 - - -Ariz. 22 25 22 22 1 - 9 10 1 2 1Utah 12 9 1 4 2 - 3 3 - - -Nev. 6 8 - 2 9 - 2 21 - - 1
PACIFIC 360 343 1 73 84 10 269 273 - 10 38Wash. 43 45 - 5 8 - 137 120 - - 5Oreg. 78 63 - 1 - 4 15 25 - - -Calif. 237 229 1 56 61 6 111 118 - 5 31Alaska 1 4 - 2 2 - 1 - - - -Hawaii 1 2 - 9 13 - 5 10 - 5 2
Guam - 1 U 1 4 U - - U - -P.R. 8 2 - 4 1 - - - - - -V.I. - - U - - U - - U - -Amer. Samoa - - U - - U - - U - -C.N.M.I. - - U 1 - U - - U - -
N: Not notifiable U: Unavailable -: no reported cases
TABLE III. (Cont’d.) Provisional cases of selected notifiable diseases preventableby vaccination, United States, weeks ending May 17, 1997,
and May 18, 1996 (20th Week)
Reporting Area
Meningococcal
Disease Mumps Pertussis Rubella
Cum.
1997
Cum.
1996 1997
Cum.
1997
Cum.
1996 1997
Cum.
1997
Cum.
1996 1997
Cum.
1997
Cum.
1996
Vol. 46 / No. 20 MMWR 457
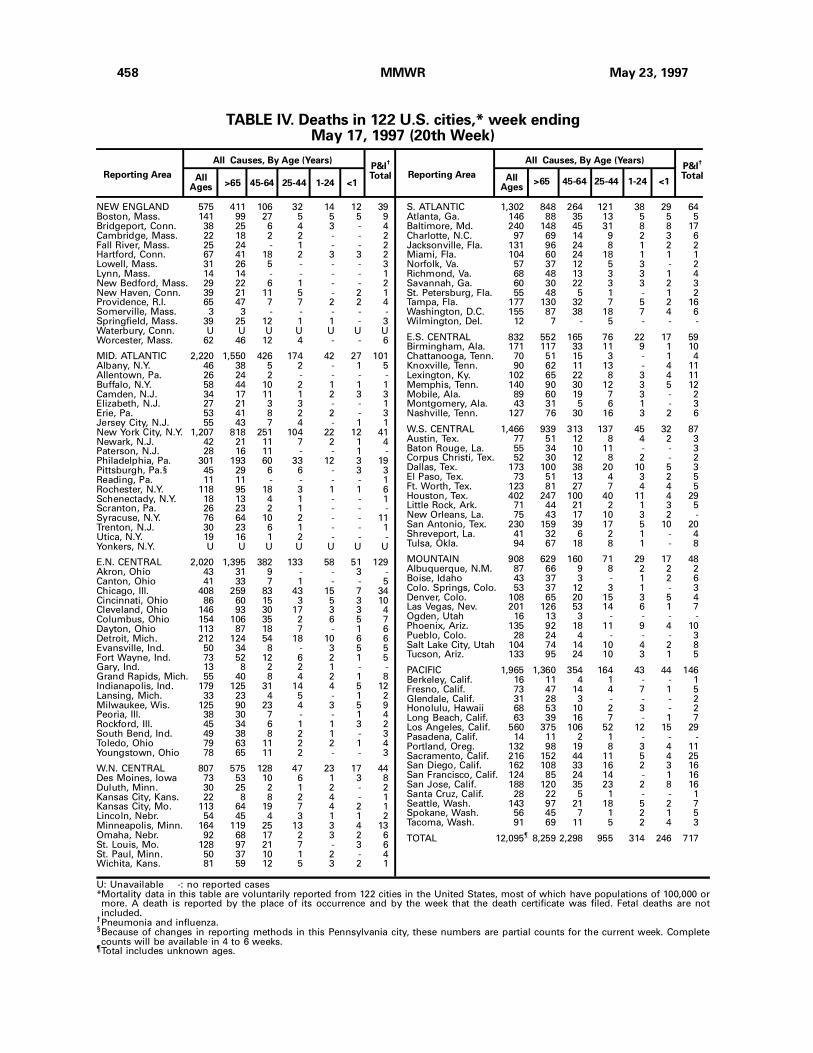
NEW ENGLAND 575 411 106 32 14 12 39Boston, Mass. 141 99 27 5 5 5 9Bridgeport, Conn. 38 25 6 4 3 - 4Cambridge, Mass. 22 18 2 2 - - 2Fall River, Mass. 25 24 - 1 - - 2Hartford, Conn. 67 41 18 2 3 3 2Lowell, Mass. 31 26 5 - - - 3Lynn, Mass. 14 14 - - - - 1New Bedford, Mass. 29 22 6 1 - - 2New Haven, Conn. 39 21 11 5 - 2 1Providence, R.I. 65 47 7 7 2 2 4Somerville, Mass. 3 3 - - - - -Springfield, Mass. 39 25 12 1 1 - 3Waterbury, Conn. U U U U U U UWorcester, Mass. 62 46 12 4 - - 6
MID. ATLANTIC 2,220 1,550 426 174 42 27 101Albany, N.Y. 46 38 5 2 - 1 5Allentown, Pa. 26 24 2 - - - -Buffalo, N.Y. 58 44 10 2 1 1 1Camden, N.J. 34 17 11 1 2 3 3Elizabeth, N.J. 27 21 3 3 - - 1Erie, Pa. 53 41 8 2 2 - 3Jersey City, N.J. 55 43 7 4 - 1 1New York City, N.Y. 1,207 818 251 104 22 12 41Newark, N.J. 42 21 11 7 2 1 4Paterson, N.J. 28 16 11 - - 1 -Philadelphia, Pa. 301 193 60 33 12 3 19Pittsburgh, Pa.§ 45 29 6 6 - 3 3Reading, Pa. 11 11 - - - - 1Rochester, N.Y. 118 95 18 3 1 1 6Schenectady, N.Y. 18 13 4 1 - - 1Scranton, Pa. 26 23 2 1 - - -Syracuse, N.Y. 76 64 10 2 - - 11Trenton, N.J. 30 23 6 1 - - 1Utica, N.Y. 19 16 1 2 - - -Yonkers, N.Y. U U U U U U U
E.N. CENTRAL 2,020 1,395 382 133 58 51 129Akron, Ohio 43 31 9 - - 3 -Canton, Ohio 41 33 7 1 - - 5Chicago, Ill. 408 259 83 43 15 7 34Cincinnati, Ohio 86 60 15 3 5 3 10Cleveland, Ohio 146 93 30 17 3 3 4Columbus, Ohio 154 106 35 2 6 5 7Dayton, Ohio 113 87 18 7 - 1 6Detroit, Mich. 212 124 54 18 10 6 6Evansville, Ind. 50 34 8 - 3 5 5Fort Wayne, Ind. 73 52 12 6 2 1 5Gary, Ind. 13 8 2 2 1 - -Grand Rapids, Mich. 55 40 8 4 2 1 8Indianapolis, Ind. 179 125 31 14 4 5 12Lansing, Mich. 33 23 4 5 - 1 2Milwaukee, Wis. 125 90 23 4 3 5 9Peoria, Ill. 38 30 7 - - 1 4Rockford, Ill. 45 34 6 1 1 3 2South Bend, Ind. 49 38 8 2 1 - 3Toledo, Ohio 79 63 11 2 2 1 4Youngstown, Ohio 78 65 11 2 - - 3
W.N. CENTRAL 807 575 128 47 23 17 44Des Moines, Iowa 73 53 10 6 1 3 8Duluth, Minn. 30 25 2 1 2 - 2Kansas City, Kans. 22 8 8 2 4 - 1Kansas City, Mo. 113 64 19 7 4 2 1Lincoln, Nebr. 54 45 4 3 1 1 2Minneapolis, Minn. 164 119 25 13 3 4 13Omaha, Nebr. 92 68 17 2 3 2 6St. Louis, Mo. 128 97 21 7 - 3 6St. Paul, Minn. 50 37 10 1 2 - 4Wichita, Kans. 81 59 12 5 3 2 1
S. ATLANTIC 1,302 848 264 121 38 29 64Atlanta, Ga. 146 88 35 13 5 5 5Baltimore, Md. 240 148 45 31 8 8 17Charlotte, N.C. 97 69 14 9 2 3 6Jacksonville, Fla. 131 96 24 8 1 2 2Miami, Fla. 104 60 24 18 1 1 1Norfolk, Va. 57 37 12 5 3 - 2Richmond, Va. 68 48 13 3 3 1 4Savannah, Ga. 60 30 22 3 3 2 3St. Petersburg, Fla. 55 48 5 1 - 1 2Tampa, Fla. 177 130 32 7 5 2 16Washington, D.C. 155 87 38 18 7 4 6Wilmington, Del. 12 7 - 5 - - -
E.S. CENTRAL 832 552 165 76 22 17 59Birmingham, Ala. 171 117 33 11 9 1 10Chattanooga, Tenn. 70 51 15 3 - 1 4Knoxville, Tenn. 90 62 11 13 - 4 11Lexington, Ky. 102 65 22 8 3 4 11Memphis, Tenn. 140 90 30 12 3 5 12Mobile, Ala. 89 60 19 7 3 - 2Montgomery, Ala. 43 31 5 6 1 - 3Nashville, Tenn. 127 76 30 16 3 2 6
W.S. CENTRAL 1,466 939 313 137 45 32 87Austin, Tex. 77 51 12 8 4 2 3Baton Rouge, La. 55 34 10 11 - - 3Corpus Christi, Tex. 52 30 12 8 2 - 2Dallas, Tex. 173 100 38 20 10 5 3El Paso, Tex. 73 51 13 4 3 2 5Ft. Worth, Tex. 123 81 27 7 4 4 5Houston, Tex. 402 247 100 40 11 4 29Little Rock, Ark. 71 44 21 2 1 3 5New Orleans, La. 75 43 17 10 3 2 -San Antonio, Tex. 230 159 39 17 5 10 20Shreveport, La. 41 32 6 2 1 - 4Tulsa, Okla. 94 67 18 8 1 - 8
MOUNTAIN 908 629 160 71 29 17 48Albuquerque, N.M. 87 66 9 8 2 2 2Boise, Idaho 43 37 3 - 1 2 6Colo. Springs, Colo. 53 37 12 3 1 - 3Denver, Colo. 108 65 20 15 3 5 4Las Vegas, Nev. 201 126 53 14 6 1 7Ogden, Utah 16 13 3 - - - -Phoenix, Ariz. 135 92 18 11 9 4 10Pueblo, Colo. 28 24 4 - - - 3Salt Lake City, Utah 104 74 14 10 4 2 8Tucson, Ariz. 133 95 24 10 3 1 5
PACIFIC 1,965 1,360 354 164 43 44 146Berkeley, Calif. 16 11 4 1 - - 1Fresno, Calif. 73 47 14 4 7 1 5Glendale, Calif. 31 28 3 - - - 2Honolulu, Hawaii 68 53 10 2 3 - 2Long Beach, Calif. 63 39 16 7 - 1 7Los Angeles, Calif. 560 375 106 52 12 15 29Pasadena, Calif. 14 11 2 1 - - -Portland, Oreg. 132 98 19 8 3 4 11Sacramento, Calif. 216 152 44 11 5 4 25San Diego, Calif. 162 108 33 16 2 3 16San Francisco, Calif. 124 85 24 14 - 1 16San Jose, Calif. 188 120 35 23 2 8 16Santa Cruz, Calif. 28 22 5 1 - - 1Seattle, Wash. 143 97 21 18 5 2 7Spokane, Wash. 56 45 7 1 2 1 5Tacoma, Wash. 91 69 11 5 2 4 3
TOTAL 12,095¶
8,259 2,298 955 314 246 717
Reporting Area>65 45-64 25-44 1-24 <1
P&I†
TotalAllAges
All Causes, By Age (Years)
Reporting AreaP&I
†
TotalAllAges
All Causes, By Age (Years)
>65 45-64 25-44 1-24 <1
U: Unavailable -: no reported cases*Mortality data in this table are voluntarily reported from 122 cities in the United States, most of which have populations of 100,000 ormore. A death is reported by the place of its occurrence and by the week that the death certificate was filed. Fetal deaths are notincluded.
†Pneumonia and influenza.§Because of changes in reporting methods in this Pennsylvania city, these numbers are partial counts for the current week. Completecounts will be available in 4 to 6 weeks.
¶Total includes unknown ages.
TABLE IV. Deaths in 122 U.S. cities,* week endingMay 17, 1997 (20th Week)
458 MMWR May 23, 1997
Contributors to the Production of the MMWR (Weekly)
Weekly Notifiable Disease Morbidity Data and 122 Cities Mortality Data
Denise Koo, M.D., M.P.H.
State Support Team
Robert Fagan
Jill Andrews
Karl A. Brendel
Siobhan Gilchrist, M.P.H.
Harry Holden
Gerald Jones
Felicia Perry
Svati Shah, M.P.H.
CDC Operations Team
Carol M. Knowles
Deborah A. Adams
Willie J. Anderson
Christine R. Burgess
Timothy M. Copeland
Patsy A. Hall
Myra A. Montalbano
Angela Trosclair, M.S.
Desktop Publishing and Graphics Support
Morie M. Higgins
Peter M. Jenkins
Vol. 46 / No. 20 MMWR 459
The Morbidity and Mortality Weekly Report (MMWR) Series is prepared by the Centers for Disease Controland Prevention (CDC) and is available free of charge in electronic format and on a paid subscription basisfor paper copy. To receive an electronic copy on Friday of each week, send an e-mail message [email protected]. The body content should read SUBscribe mmwr-toc. Electronic copy also isavailable from CDC’s World-Wide Web server at http://www.cdc.gov/ or from CDC’s file transfer protocolserver at ftp.cdc.gov. To subscribe for paper copy, contact Superintendent of Documents, U.S. GovernmentPrinting Office, Washington, DC 20402; telephone (202) 512-1800.
Data in the weekly MMWR are provisional, based on weekly reports to CDC by state health departments.The reporting week concludes at close of business on Friday; compiled data on a national basis are officiallyreleased to the public on the following Friday. Address inquiries about the MMWR Series, including materialto be considered for publication, to: Editor, MMWR Series, Mailstop C-08, CDC, 1600 Clifton Rd., N.E., Atlanta,GA 30333; telephone (404) 332-4555.
All material in the MMWR Series is in the public domain and may be used and reprinted withoutpermission; citation as to source, however, is appreciated.
Director, Centers for Disease Control and PreventionDavid Satcher, M.D., Ph.D.
Deputy Director, Centers for Disease Controland PreventionClaire V. Broome, M.D.
Director, Epidemiology Program OfficeStephen B. Thacker, M.D., M.Sc.
Editor, MMWR SeriesRichard A. Goodman, M.D., M.P.H.
Managing Editor, MMWR (weekly)Karen L. Foster, M.A.
Writers-Editors, MMWR (weekly)David C. JohnsonDarlene D. Rumph PersonTeresa F. RutledgeCaran R. Wilbanks
✩U.S. Government Printing Office: 1997-532-228/67003 Region IV
460 MMWR May 23, 1997