Embed Size (px)
Citation preview

TRA
ININ
G IN
MO
NITO
RIN
G A
ND
EPID
EMIO
LOG
ICA
L ASSESSM
ENT O
F MA
SS DR
UG
AD
MIN
ISTRATIO
N FO
R ELIM
INATIN
G LYM
PH
ATIC FILA
RIA
SIS
Preventive Chemotherapy and Transmission Control (PCT)Department of Control of Neglected Tropical Diseases (NTD)World Health Organization20, Avenue Appia1211 Geneva 27, Switzerland
http://www.who,int/neglected_diseases/en
Eff ective monitoring and evaluation are necessary to achieve the goals of LF elimination. Aft er mass administration of medicines according to the guidelines established by WHO, programmes must be able to assess whether the interventions have succeeded in lowering the prevalence of infection to a level at which transmission is no longer likely to be sustainable. Transmission assessment survey (TAS) is designed to provide a simple, robust survey design for documenting that the prevalence of lymphatic fi lariasis among 6–7 year old children is below a predetermined threshold; to provide the evidence base for programme managers that MDA can be stopped; and to assure national governments that national programmes have achieved their elimination goals.
Th is manual is designed to teach personnel of national programmes to eliminate lymphatic filariasis, including regional and district health personnel, the essential elements of monitoring and evaluating national programmes to eliminate LF. Th e focus is on planning and implementing TAS as an input to decide whether to move from MDA to post-MDA surveillance.
FILARIASISLYMPHATIC
TRAINING IN MONITORING AND EPIDEMIOLOGICAL ASSESSMENT OF MASS DRUG ADMINISTRATION FOR ELIMINATING LYMPHATIC FILARIASIS
GLOBAL PROGRAMME TO ELIMINATE LYMPHATIC FILARIASIS
WORLD HEALTH ORGANIZATION
LEARNERS’ GUIDE
LF_TAS_Learner_manual_Cover.indd 1 14/02/2014 14:04:23

FILARIASISLYMPHATIC
TRAINING IN MONITORING AND EPIDEMIOLOGICAL ASSESSMENT OF MASS DRUG ADMINISTRATION FOR ELIMINATING LYMPHATIC FILARIASIS
GLOBAL PROGRAMME TO ELIMINATE LYMPHATIC FILARIASIS
WORLD HEALTH ORGANIZATION
TASLEARNERS’ GUIDE
LF_TAS_Learner_manual.indd 1 26/03/2014 11:49:52

© World Health Organization 2013
All rights reserved. Publications of the World Health Organization are available on the WHO web site (www.who.int) or can be purchased from WHO Press, World Health Organization, 20 Avenue Appia, 1211 Geneva 27, Switzerland (tel.: +41 22 791 3264; fax: +41 22 791 4857; e-mail: [email protected]).
Requests for permission to reproduce or translate WHO publications –whether for sale or for non-commercial distribution– should be addressed to WHO Press through the WHO web site (www.who.int/about/licensing/copyright_form/en/index.html).
The designations employed and the presentation of the material in this publication do not imply the expression of any opinion whatsoever on the part of the World Health Organization concerning the legal status of any country, territory, city or area or of its authorities, or concerning the delimitation of its frontiers or boundaries. Dotted lines on maps represent approximate border lines for which there may not yet be full agreement.
The mention of specifi c companies or of certain manufacturers’ products does not imply that they are endorsed or recommended by the World Health Organization in preference to others of a similar nature that are not mentioned. Errors and omissions excepted, the names of proprietary products are distinguished by initial capital letters.
All reasonable precautions have been taken by the World Health Organization to verify the information contained in this publication. However, the published material is being distributed without warranty of any kind, either expressed or implied. The responsibility for the interpretation and use of the material lies with the reader. In no event shall the World Health Organization be liable for damages arising from its use.
Printed in Italy.
WHO/HTM/NTD/PCT/2013.9
Prepartion of this document was supported by the Department for International Development of the Governement of the United Kingdoms of Great Britain and Northern Ireland.
WHO Library Cataloguing-in-Publication Data
Training in monitoring and epidemiological assessment of mass drug administration for eliminating lymphatic fi lariasis: learners’ guide.
1.Elephantiasis, Filarial – drug therapy. 2.Filariasis – drug therapy. 3.Filariasis – epidemiology. 4.Drug therapy - methods. 5.National health programs. 6.Program evaluation 7.Teaching materials. I.World Health Organization.
ISBN 978 92 4 150545 1 (NLM classifi cation: WC 880)
LF_TAS_Learner_manual.indd 2 26/03/2014 11:50:52

Contents
Preface vAcknowledgements viAbbreviations ixIntroduction xi
THEORY OF TRANSMISSION ASSESSMENT SURVEYS (TAS) Module 1. Background 1Module 2. Eligibility for a TAS 7Module 3. Evaluation unit 11Module 4. Survey design 15Module 5. Diagnostic tests 19Module 6. Aft er the survey 23Module 7. Verifi cation of elimination 27
PRACTICAL ASPECTS OF TRANSMISSION ASSESSMENT SURVEYS Module 8. Survey sample builder 31Module 9. Timetable, budget and administration 37Module 10. Field work 41
ANNEXES 43Annex 1. Test to be taken by participants before and aft er training 66Annex 2. Changes in editions of Monitoring and epidemiological assessment of mass drug administration—A manual for national elimination programmes between 2005 and 2011 68Annex 3. WHO TAS Eligibility and Reporting Form 70
LF_TAS_Learner_manual.indd 3 26/03/2014 11:50:52

Annex 4. Algorithm for choosing design of TAS in areas where Anopheles or Culex is the principal vector and where Aedes is the principal vector 74Annex 5. Procedure for testing blood fi lms 75Annex 6. Procedures for confi rmatory testing 76Annex 7. Timeline template 78Annex 8. Checklist for planning and implementing a transmission assessment survey 79Annex 9. Budget template 82Annex 10.Sample data collection form for school surveys 83Annex 11.Bench aid for new diagnostic test to detect antigen to W. bancroft i 85
LF_TAS_Learner_manual.indd 4 26/03/2014 11:50:52

vTRAINING IN MONITORING AND EPIDEMIOLOGICAL ASSESSMENTof mass drug administration for eliminating lymphatic fi lariasis
Acknowledgements
Training in monitoring and epidemiological assessment of mass drug administration for eliminating lymphatic fi lariasis—learners’ guide was produced under the overall supervision of Dr Lorenzo Savioli, Director, and Dr Dirk Engels, Coordinator, Department of Control of Neglected Tropical Diseases.
WHO expresses its sincere thanks to all those who contributed to preparation of this document. Special thanks are due to the following individuals: Dr Steve Ault (WHO Regional Offi ce for the Americas), Dr Riadh Ben-Ismail (WHO Regional Offi ce for the Eastern Mediterranean), Ms Molly Brady (RTI International), Dr Eva-Maria Christophel (WHO Regional Offi ce for the Western Pacifi c), Mr Brian Chu (Task Force for Global Health, USA), Dr Aditya Prasad Dash (WHO Regional Offi ce for South-East Asia), Dr Amadou Garba (WHO Regional Offi ce for Africa), Prof John Gyapong (University of Ghana), Dr Kaliannagounder Krishnamoorthy (Vector Control Research Centre, India), Dr Louise Kelly Hope (Centre for Neglected Tropical Diseases, Liverpool School of tropical Medicine, United Kingdom), Dr Patrick Lammie (United States Centers for Disease Control and Prevention), Dr Adiele Onyeze (WHO Regional Offi ce for Africa), Dr Eric Ottesen (Task Force for Global Health, USA), Dr Reda Ramzy (National Nutrition Institute, Egypt), Dr Maria Rebollo (Centre for Neglected Tropical Diseases, Liverpool School of tropical Medicine, United Kingdom), Ms Angela Weaver (United States Agency for International Development), Ms Kimberly Won (United States Center for Disease Control and Prevention), Dr Hany Ziady (WHO Regional Offi ce for the Eastern Mediterranean) and Ms Katie Zoerhoff (RTI International).
Th e training modules developed by Ms Kimberly Won (United States Center for Disease Control and Prevention) formed the basis for this document. Dr Aya Yajima (WHO Department of Control of Neglected Tropical Diseases) and Dr Kazuyo Ichimori (Focal Point for Lymphatic Filariasis Elimination, WHO Department of Control of Neglected Tropical Diseases) prepared the fi nal draft .
LF_TAS_Learner_manual.indd Sec2:v 26/03/2014 11:50:52

LF_TAS_Learner_manual.indd Sec2:vi 26/03/2014 11:50:52

viiTRAINING IN MONITORING AND EPIDEMIOLOGICAL ASSESSMENTof mass drug administration for eliminating lymphatic fi lariasis
Abbreviations
Ag antigenaemia ELISA enzyme-linked immunosorbent assay EU evaluation unit GPELF Global Programme to Eliminate Lymphatic Filariasis MDA mass drug administration Mf microfi laraemia ICT immunochromatographic test IU implementation unit PCR polymerase chain reaction RPRG regional programme review group TAS transmission assessment survey WHO World Health Organization
LF_TAS_Learner_manual.indd Sec2:vii 26/03/2014 11:50:52

LF_TAS_Learner_manual.indd Sec2:viii 26/03/2014 11:50:53

ixTRAINING IN MONITORING AND EPIDEMIOLOGICAL ASSESSMENTof mass drug administration for eliminating lymphatic fi lariasis
Introduction
In 1997, the Fift ieth World Health Assembly resolved to eliminate lymphatic fi lariasis (LF) as a public health problem. In response, the World Health Organization (WHO) established the Global Programme to Eliminate Lymphatic Filariasis (GPELF) to assist Member States in achieving this goal by 2020. Th e two components of the GPELF are (i) to reduce the prevalence of infection to levels at which it is assumed that transmission can no longer be sustained and (ii) to manage morbidity and prevent disability (Figure 1).1
1 WHO Global Programme to Eliminate Lymphatic Filariasis (GPELF) progress report 2000–2009 and strategic plan 2010–2020. (WHO/HTM/NTD/PCT/2010.6). Geneva, World Health Organization, 2010.
Figure 1. Two components of the Global Programme to Eliminate Lymphatic Filariasis: interrupting transmission and preventing morbidity and managing disability among people with the disease
Situation analysis Plan Minimum package of
MMDP care2. MMDP
VC/IVM
Mapping MDA Post-MDAsurveillance1. MDA
TAS
M&E
Dos
sier d
evel
opm
ent
Verif
icat
ion
MMDP and rehabilitation integrated into health services
Arrows represent epidemiological assessment recommended as part of monitoring and evaluation of the national programme.
VC/IVM, vector control and integrated vector management; MDA, mass drug administration; TAS, transmission assessment survey; M&E, monitoring and evaluation; MMDP, morbidity management and disability prevention.
LF_TAS_Learner_manual.indd Sec2:ix 26/03/2014 11:50:53

x TRAINING IN MONITORING AND EPIDEMIOLOGICAL ASSESSMENTof mass drug administration for eliminating lymphatic fi lariasis
To eliminate LF, WHO recommends delivery of combinations of two medicines to entire populations at risk, by a strategy known as ‘mass drug administration (MDA)’. Th is involves four steps: mapping, MDA, post-MDA surveillance and verifi cation of elimination.2
Eff ective monitoring and evaluation are necessary to achieve the goals of LF elimination. Aft er mass administration of medicines according to the guidelines established by WHO, programmes must be able to assess whether the interventions have succeeded in lowering the prevalence of infection to a level at which transmission is no longer likely to be sustainable. Th e Progress report 2000–2009 and strategic plan 2010–2020 of the GPELF,1 which reviewed progress made in the fi rst decade of the programme, highlighted the remaining challenges for the coming decade and proposed ways to reach the global goal of elimination by 2020. Th e milestone for 2011 was revision of WHO guidelines on interrupting transmission and conducting post-MDA surveillance. Accordingly, in 2011, WHO published a manual for monitoring and epidemiological assessment of MDA.3 Th e manual described a new, standardized method for measuring prevalence, the ‘transmission assessment survey (TAS)’, in which blood diagnostic test results are used to determine whether areas have reached a critical threshold of infection. Th e results of a TAS provide evidence for deciding whether to stop or continue MDA.
Objectives of training
Th e manual is designed to teach the essential elements of monitoring and evaluating national programmes to eliminate LF.3 Th e focus is on planning and implementing TAS as an input to decide whether to move from MDA to post-MDA surveillance.
Aft er completing the course, learners will understand:
• the elements of a TAS, • how to plan and implement a TAS in an evaluation unit (EU), and • the actions required aft er implementation of a survey.
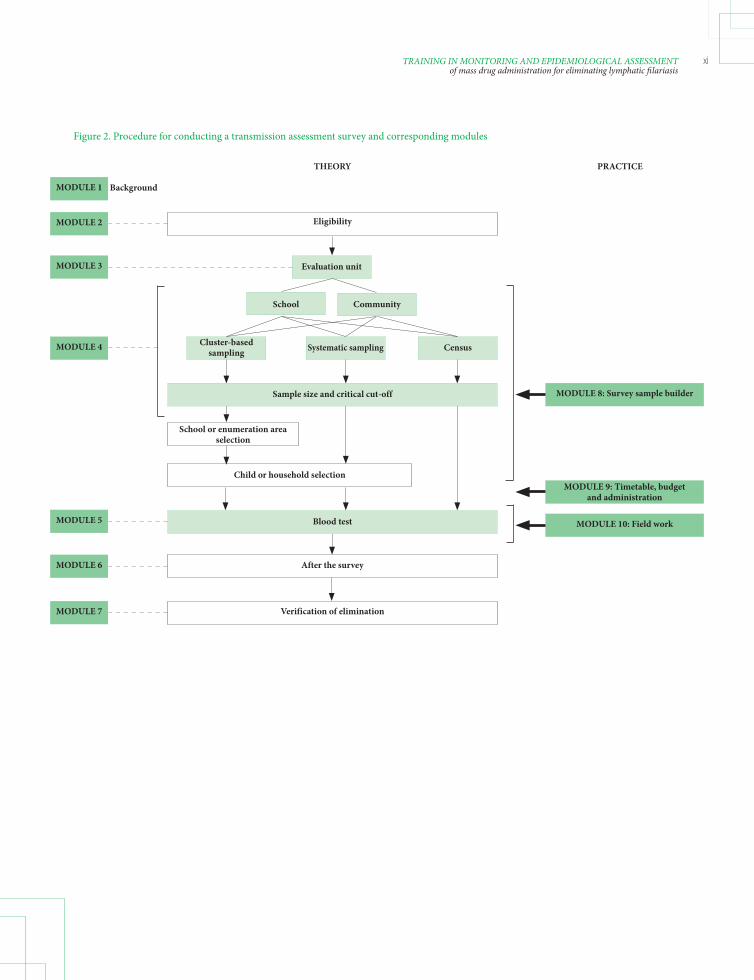
Th e procedure for conducting a TAS is illustrated in Figure 2. Th e training course is designed as a 3-day workshop to present the essential elements of monitoring and evaluation in the GPELF and to prepare a plan for conducting a TAS appropriately in accordance with WHO guidelines. Th e modules are structured into two parts (Table 1): the theory behind each chapter and a practical part, which introduces recommended practices for applying the theory in the fi eld.
2 Transmission assessment surveys in the Global Programme to Eliminate Lymphatic Filariasis. WHO position statement. Geneva, World Health Organization, 2012.3 Monitoring and epidemiological assessment of mass drug administration: a manual for national elimination programmes. Geneva, World Health Organization, 2011.
LF_TAS_Learner_manual.indd Sec2:x 26/03/2014 11:50:53
xiTRAINING IN MONITORING AND EPIDEMIOLOGICAL ASSESSMENTof mass drug administration for eliminating lymphatic fi lariasis
Figure 2. Procedure for conducting a transmission assessment survey and corresponding modules
THEORY
MODULE 1
MODULE 2
MODULE 3
MODULE 4
MODULE 5
MODULE 6
MODULE 7
After the survey
Verification of elimination
Evaluation unit
PRACTICE
MODULE 8: Survey sample builder
MODULE 9: Timetable, budget and administration
MODULE 10: Field work
Eligibility
School Community
Cluster-based sampling Systematic sampling Census
Sample size and critical cut-off
School or enumeration area selection
Child or household selection
Blood test
Background
LF_TAS_Learner_manual.indd Sec2:xi 26/03/2014 11:50:53

xii TRAINING IN MONITORING AND EPIDEMIOLOGICAL ASSESSMENTof mass drug administration for eliminating lymphatic fi lariasis
Table 1. Structure of training modules and relevant chapter of the 2011 WHO monitoring and evaluation manual
Training module Relevant chapter of manual Suggested l earners National Subnational programme programme personnel personnel
THEORY Module 1. Background • Chapter 1. Eliminating lymphatic filariasis • Chapter 2. Recommended strategy for interrupting transmission √ √ • Chapter 4. Mapping Module 2. Eligibility for a TAS • Chapter 5. Monitoring coverage of mass drug administration • Chapter 6. Assessing the impact of mass drug administration through sentinel and spot-check sites √ √ • Chapter 7.2. When should surveys occur? Module 3. Evaluation unit • Chapter 7.1. What geographical area should be used? √
Module 4. Survey design • Chapter 7.3 How should the surveys be implemented? √
Module 5. Diagnostic tests • Chapter 3. Diagnostic tools √ √
Module 6. After the survey • Chapter 8. Implementing activities and surveillance √ √ after mass drug administration has stopped Module 7. Verification of • Chapter 9. Verifying the absence of transmission √ elimination
PRACTICE Module 8. Survey sample • Annex 5. Detailed protocol for transmission assessment builder survey √
Module 9. Timetable, budget None √ √ and administration Module 10. Field-work • Annex 5. Detailed protocol for transmission assessment survey √ √
For whom are these training modules intended?
Th ese training modules are intended for personnel at two levels:
• personnel of national programmes to eliminate LF who are responsible for planning, implementing and reporting on TAS and for training subnational personnel. Th e learners should include a national programme manager, a monitoring and evaluation offi cer and a laboratory offi cer. Th ey might also include subnational health personnel. • regional or district health personnel who will prepare and implement fi eld- work and report to the national programme manager.
LF_TAS_Learner_manual.indd Sec2:xii 26/03/2014 11:50:53
xiiiTRAINING IN MONITORING AND EPIDEMIOLOGICAL ASSESSMENTof mass drug administration for eliminating lymphatic fi lariasis
How will this course be taught?
Presentations
Presentations in the form of lectures provide theoretical and practical information for staff of national programmes for planning and implementing TAS. Lectures are usually followed by group work or practical exercises. Th e slides for the modules are downloadable from http://www.who.int/lymphatic_fi lariasis/resources/TAS_training_materials/en. Th ese can be used by learners for preparatory reading, as hand-outs during training and as practical resources during a survey.
Practical exercises and group work
At the end of most modules, learners are given exercises to help them gain practical experience, e.g. preparing a budget and timetable for conducting a survey and designing a survey with the ‘survey sample builder’. Learners will work in small groups, ideally with colleagues from the same country, to apply the theory to their country situation. Th e outcomes of the practical exercises should form part of the country presentations at the end of the workshop and can also be included in the national TAS plan.
Demonstration
In module 5, ‘Diagnostic tests’, the preparation, use and reading of diagnostic tests will be demonstrated by the facilitators.
Role-play
In the role-play exercise, learners are asked to simulate fi eld situations, such as playing the part of a fi eld team in module 10. For example, they might determine the ideal work fl ow for a phlebotomist taking a blood sample from a child and preparing a diagnostic test or for a person reading a diagnostic test. Th e learners should then discuss their observations to identify the most eff ective organization of fi eld-work.
Use of the learners’ guide
Th e theoretical part of the guide, consisting of seven modules, describes the background of the GPELF, conceptual elements of monitoring and evaluation in a national programme to eliminate LF and the basic knowledge required to plan and conduct a TAS, both as a decision-making step to move from MDA to post-MDA surveillance and as a tool for post-MDA surveillance. Th e process of preparing a dossier for verifi cation of elimination is also introduced.
Th e practical part of the guide, consisting of three modules, is designed to provide guidance and examples of approaches to logistical planning of a TAS and organization of fi eld-work.
LF_TAS_Learner_manual.indd Sec2:xiii 26/03/2014 11:50:53

xiv TRAINING IN MONITORING AND EPIDEMIOLOGICAL ASSESSMENTof mass drug administration for eliminating lymphatic fi lariasis
Learners will achieve the objectives of each module by consistently following the facilitators’ instructions and by close interaction with them. Th e learners must have assimilated the knowledge of one unit before proceeding to the next. If they require clarifi cation on any point, they should ask the facilitators.
Preparation
In order to obtain maximum benefi t from the course, learners should arrive with information that will allow preparation of a workplan:
• Pertinent data on eligibility for conducting a TAS should be collected and entered on the ‘INTRO’ and ‘ELIGIBILITY’ worksheets of the TAS Eligibility and Reporting Form. Th ese data include information on implementation units (IU), MDA coverage and sentinel site and spot-check survey results. Th e workplan prepared during the workshop will be for at least one EU, so data entered onto the worksheet should be for an area in which a TAS is likely to be conducted soon. • Pertinent data for preparing a TAS should be collected and entered on the ‘Sampling frame’ in the ‘SURVEY DESIGN’ worksheet of the TAS Eligibility and Reporting Form for each EU. Th ese data include the number of 6–7-year-old children and net primary school enrolment rates. • While some of the actual costs may not be known, general estimates will help to prepare an overall budget. A budget template with general budget categories is provided. • Country maps indicating endemic IUs are helpful for defi ning EUs and can be used for country presentations at the end of the course. • A complete list of public and private primary schools or census enumeration areas for the area defi ned on the ‘SURVEY DESIGN’ worksheet of the TAS Eligibility and Reporting Form should be available.
Evaluation
Evaluation of learners
In order to allow each learner to evaluate his or her progress, a test to be taken before and aft er training is provided (Annex 1).
Evaluation of the training
Th e facilitator will distribute a questionnaire to learners at the end of each day to elicit their opinions of the training. Th e feedback will be used to improve future training. Learners can complete the evaluation questionnaire anonymously if they wish.
LF_TAS_Learner_manual.indd Sec2:xiv 26/03/2014 11:50:53

LF_TAS_Learner_manual.indd Sec2:xv 26/03/2014 11:50:53
xvi TRAINING IN MONITORING AND EPIDEMIOLOGICAL ASSESSMENTof mass drug administration for eliminating lymphatic fi lariasis
THEORY OF TRANSMISSION ASSESSMENT SURVEYS (TAS)
© L
isa R
oton
do
LF_TAS_Learner_manual.indd Sec2:xvi 26/03/2014 11:50:53

1BACKGROUNDModule 1
MO
DU
LE 1
Background
Learning objectives:
By the end of this module, learners should be able to answer the questions:
• What is lymphatic fi lariasis (LF)? • What is the Global Programme to Eliminate LF (GPELF)? • What is a transmission assessment survey (TAS)? • How does a national programme report to the GPELF?
Relevant sections of the 2011 WHO monitoring and evaluation manual3
• Chapter 1. Eliminating lymphatic fi lariasis • Chapter 2. Recommended strategy for interrupting transmission • Chapter 4. Mapping
Lisa
Rot
ondo
LF_TAS_Learner_manual.indd Sec1:1 26/03/2014 11:50:54
2 TRAINING IN MONITORING AND EPIDEMIOLOGICAL ASSESSMENTof mass drug administration for eliminating lymphatic fi lariasis
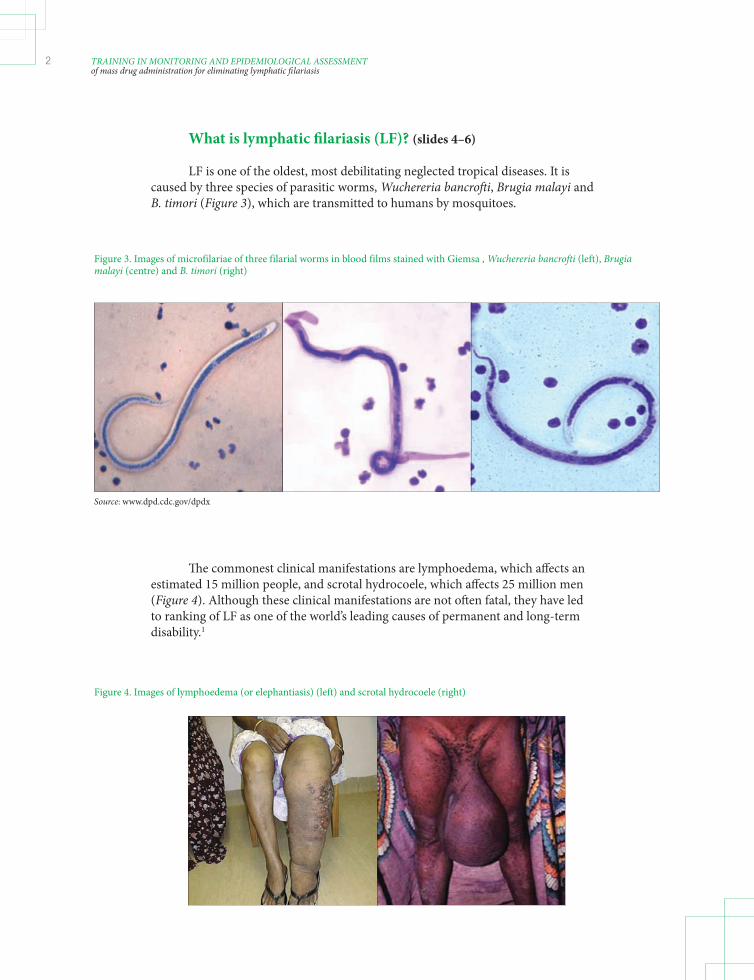
What is lymphatic fi lariasis (LF)? (slides 4–6)
LF is one of the oldest, most debilitating neglected tropical diseases. It is caused by three species of parasitic worms, Wuchereria bancroft i, Brugia malayi and B. timori (Figure 3), which are transmitted to humans by mosquitoes.
Figure 3. Images of microfilariae of three filarial worms in blood films stained with Giemsa , Wuchereria bancrofti (left), Brugia malayi (centre) and B. timori (right)
Source: www.dpd.cdc.gov/dpdx
Th e commonest clinical manifestations are lymphoedema, which aff ects an estimated 15 million people, and scrotal hydrocoele, which aff ects 25 million men (Figure 4). Although these clinical manifestations are not oft en fatal, they have led to ranking of LF as one of the world’s leading causes of permanent and long-term disability.1
Figure 4. Images of lymphoedema (or elephantiasis) (left) and scrotal hydrocoele (right)
LF_TAS_Learner_manual.indd Sec1:2 26/03/2014 11:50:54
3BACKGROUNDModule 1
MO
DU
LE 1
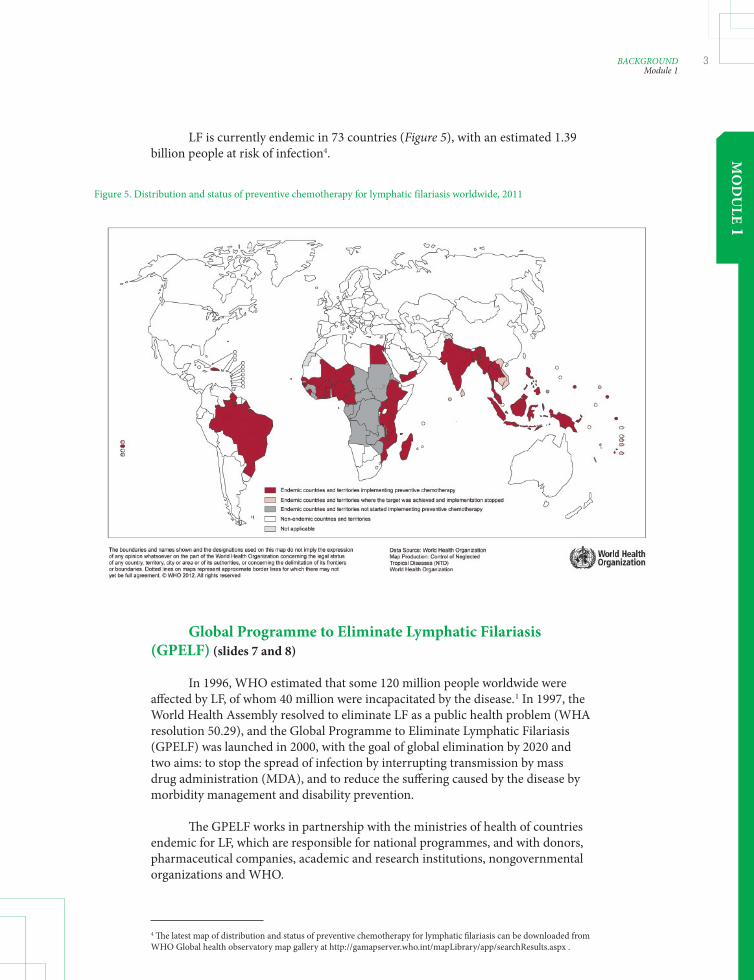
LF is currently endemic in 73 countries (Figure 5), with an estimated 1.39 billion people at risk of infection4.
Figure 5. Distribution and status of preventive chemotherapy for lymphatic filariasis worldwide, 2011
Global Programme to Eliminate Lymphatic Filariasis (GPELF) (slides 7 and 8)
In 1996, WHO estimated that some 120 million people worldwide were aff ected by LF, of whom 40 million were incapacitated by the disease.1 In 1997, the World Health Assembly resolved to eliminate LF as a public health problem (WHA resolution 50.29), and the Global Programme to Eliminate Lymphatic Filariasis (GPELF) was launched in 2000, with the goal of global elimination by 2020 and two aims: to stop the spread of infection by interrupting transmission by mass drug administration (MDA), and to reduce the suff ering caused by the disease by morbidity management and disability prevention.
Th e GPELF works in partnership with the ministries of health of countries endemic for LF, which are responsible for national programmes, and with donors, pharmaceutical companies, academic and research institutions, nongovernmental organizations and WHO.
4 Th e latest map of distribution and status of preventive chemotherapy for lymphatic fi lariasis can be downloaded from WHO Global health observatory map gallery at http://gamapserver.who.int/mapLibrary/app/searchResults.aspx .
LF_TAS_Learner_manual.indd Sec1:3 26/03/2014 11:50:55

4 TRAINING IN MONITORING AND EPIDEMIOLOGICAL ASSESSMENTof mass drug administration for eliminating lymphatic fi lariasis
Programmatic steps for interrupting transmission (slide 9)
Th e four programme steps recommended by the GPELF for interrupting transmission are shown in Figure 6:
1. Mapping the geographical distribution of the disease; 2. MDA for 5 years of more to reduce the number of parasites in the blood to levels that will prevent mosquito vectors from transmitting infection; 3. Post-MDA surveillance aft er MDA is discontinued; and 4. Verifi cation of elimination of transmission.
Figure 6. Programme steps for interrupting transmission of lymphatic filariasis by mass drug administration (MDA)
Verification
Mapping (slide 10)
Mapping is conducted to determine whether active transmission is occurring and whether MDA is required.
1. Defi ne the Implementation Unit (IU) for MDA in the country. 2. Implement mapping by: a) Reviewing existing information b) Conducting mapping surveys • Measure antigenaemia (Ag) by immunochromatographic tests (ICT) or microfi laraemia (Mf) by blood fi lm in older school-aged or adult populations. If the prevalence in this population is ≥1%, classify the IU as being endemic.
MDA (slide 11)
GPELF recommends mass administration of a combination of medicines:
• diethylcarbamazine (DEC) + albendazole (in countries not co-endemic for onchocerciasis) • ivermectin + albendazole (in countries co-endemic for onchocerciasis)
Mapping MDA Post-MDA Surveillance
LF_TAS_Learner_manual.indd Sec1:4 26/03/2014 11:50:55

5BACKGROUNDModule 1
MO
DU
LE 1
A single dose should be given annually for at least 5 years to all eligible individuals targeted in the entire endemic area.
Th e objective is to achieve reductions in the density of microfi lariae circulating in the blood of infected individuals and in the prevalence of infection in the entire community to levels at which it is assumed that microfi lariae can no longer be transmitted by mosquito vectors to new human hosts.
Monitoring and evaluation during MDA (slide 12)
Eff ective monitoring and evaluation are important throughout a LF elimination programme (Figure 7).
Th e prevalence of Mf or Ag can be used in mapping. During MDA, coverage is monitored at each round to determine whether the goal of at least 65% coverage of the total population was met. Aft er at least fi ve rounds of eff ective MDA, the impact is evaluated at sentinel and spot-check sites. If all the eligibility criteria are met, a transmission assessment survey (TAS) is conducted to help make a decision to stop MDA. TAS is repeated twice during post-MDA surveillance.
Figure 7. Steps for interrupting transmission of lymphatic filariasis by mass drug administration (MDA) as described by WHO in 20113
Mapping MDA Post-MDA Surveillance
Pass
Follow-upBaseline Mid term(optional)
YesMf or
Ag ≥ 1 %
Fail
(ELIGIBILITY)
M&E
TAS
Mf, microfilaraemia; Ag, antigenaemia; M&E, monitoring and evaluation; TAS, transmission assessment survey
Source: Illustrated from Global Programme to Eliminate Lymphatic Filariasis (GPELF). Monitoring and epidemiological assessment of mass drug administration—a manual for national elimination programmes. Geneva, World Health Organization, 2011.
Mapping MDA Surveillance
Verification
LF_TAS_Learner_manual.indd Sec1:5 26/03/2014 11:50:55

6 TRAINING IN MONITORING AND EPIDEMIOLOGICAL ASSESSMENTof mass drug administration for eliminating lymphatic fi lariasis
Transmission assessment survey (TAS) (slide 13)
A TAS is conducted with a standardized method, and the results help decision-makers in the national programme to move from MDA to post-MDA surveillance. Guidance is given in Table 2.
Table 2. Transmission assessment surveys
Technical aspect Guidance
Geographical area Evaluation unit When survey should be conducted When all the eligibility criteria are met At least 6 months after the last round of mass drug administration Target population Children aged 6–7 years Diagnostic tests W. bancrofti areas: ICT Brugia spp. areas: Brugia RapidTM test Survey design Cluster sampling or systematic sampling in schools, the community or a censusICT, immunochromatographic test
Children aged 6 and 7 years are targeted because they should have been protected from infection if MDA was successful in interrupting transmission. Positive test results in this age group therefore usually indicate recent transmission.
A TAS is a simplifi ed version of the former ‘stopping-MDA survey’ protocol, which had a number of limitations.
Limitations of previous guideline (2005) (slide 14)
Th e diff erences between the two editions of the manual on monitoring and epidemiological assessment of mass drug administration (2005 and 2011) are summarized in Annex 2.
• An additional 5–10 sentinel and spot-check tests were required per IU. • Antigen surveys of 2–4-year-old children were not informative in most countries. • Lot quality assurance sampling surveys were diffi cult to conduct (e.g. too many schools to visit per IU to test 3000 children). • Th e 1 in 3000 threshold was too conservative.
LF_TAS_Learner_manual.indd Sec1:6 26/03/2014 11:50:56
7BACKGROUNDModule 1
MO
DU
LE 1
Post-MDA surveillance (slide 15)
A TAS is not only important in deciding to stop MDA but is also a method recommended in post-MDA surveillance to detect recrudescence of transmission. Surveys should be repeated at least twice aft er MDA, at an interval of 2–3 years, to ensure that recrudescence has not occurred and that transmission can therefore be considered interrupted.
Post-MDA surveillance is discussed in module 6.
Reporting from a national programme to the GPELF (slide 16)
As a signifi cant decision will be made on the basis of the outcome of the TAS, it must be conducted at the appropriate time and be of high quality. Th e national programme should inform WHO and regional programme review groups (RPRG) of plans and reports of TAS and obtain advice if necessary.
Annex 3 gives the WHO TAS Eligibility and Reporting Form that can be used for this purpose.
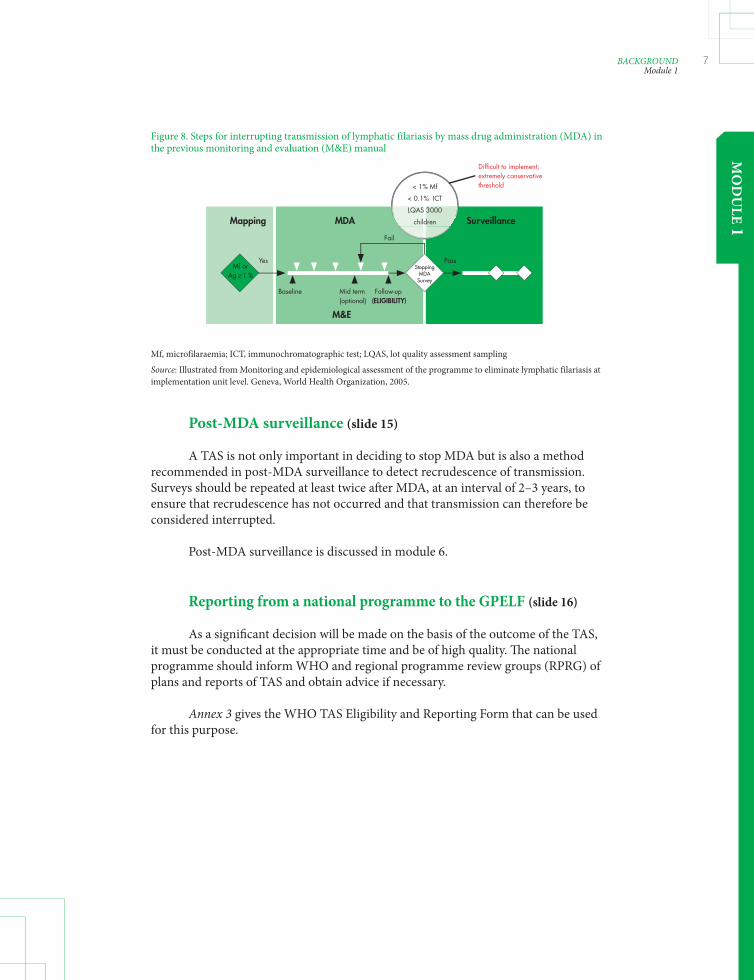
Figure 8. Steps for interrupting transmission of lymphatic filariasis by mass drug administration (MDA) in the previous monitoring and evaluation (M&E) manual
Mf, microfilaraemia; ICT, immunochromatographic test; LQAS, lot quality assessment sampling
Source: Illustrated from Monitoring and epidemiological assessment of the programme to eliminate lymphatic filariasis at implementation unit level. Geneva, World Health Organization, 2005.
Mapping MDA Surveillance
Pass
Follow-upBaseline Mid term(optional)
YesMf or
Ag ≥ 1 %
Fail
(ELIGIBILITY)
M&E
< 1% Mf
< 0.1% ICT
LQAS 3000
children
Difficult to implement; extremely conservative threshold
StoppingMDA
Survey
LF_TAS_Learner_manual.indd Sec1:7 26/03/2014 11:50:56

8 TRAINING IN MONITORING AND EPIDEMIOLOGICAL ASSESSMENTof mass drug administration for eliminating lymphatic fi lariasis
Figure 9. Proposed reporting and feedback mechanism between national programmes and the Global Programme for transmission assessment surveys (TAS) and post-MDA surveillance
Begin planning TAS TAS
VerificationPost-MDA surveillance
Communicate plan to WHO/RPRG
RPRG endorses plan Submit report to WHO/RPRG
RPRG endorses results
Submit dossier to WHO/RPRG
NTD-STAG endorses the claim
RPRG endorses dossier and
recommends it to NTD-STAG (via its M&E Working Group)
M&E, monitoring and evaluation; RPRG, Regional Programme Review Group; WHO, World Health Organization; STAG-NTD, the Strategic and Technical Advisory Group on Neglected Tropical Diseases.
LF_TAS_Learner_manual.indd Sec1:8 26/03/2014 11:50:56

9ELIGIBILITY FOR A TAS Module 2
MO
DU
LE 2
Eligibility for a TAS
Learning objectives:
By the end of this module, learners should understand how to assess the eligibility of an IU for a TAS on the basis of:
• epidemiological drug coverage (programme coverage) • prevalence of infection at sentinel sites • prevalence of infection at spot-check sites
Relevant sections of the 2011 WHO monitoring and evaluation manual3
• Chapter 5. Monitoring coverage of mass drug administration • Chapter 6. Assessing the impact of mass drug administration through sentinel and spot check sites • Chapter 7.2. When should surveys occur?
LF_TAS_Learner_manual.indd Sec1:9 26/03/2014 11:50:56

10 TRAINING IN MONITORING AND EPIDEMIOLOGICAL ASSESSMENTof mass drug administration for eliminating lymphatic fi lariasis
Eligibility criteria for a TAS (slide 4)
Surveys require signifi cant investments in time and money; therefore, national programmes must be as certain as possible that a survey is conducted at the appropriate time. Before a survey is planned, the following basic eligibility criteria must be met by each IU.
• At least fi ve rounds of MDA were completed. • Th e epidemiological drug coverage (programme coverage) at each round was ≥ 65%. • Sentinel sites: Th e prevalence of Mf was < 1% or that of Ag was < 2% at all sites aft er the last eff ective round. • Spot-check sites: Th e prevalence of Mf was < 1% or that of Ag was < 2% at all sites aft er the last eff ective round.
Epidemiological drug coverage (programme coverage) (slide 5)
Epidemiological drug coverage is defi ned as the proportion of individuals in an IU who actually ingested the medicines.
Number of people reported to have ingested the drugsEpidemiological drug coverage = –––––––––––––––––––––––––––––––––––––––––––––– X 100 Total population in IU
In order to reduce the prevalence of Mf in infected individuals to the threshold below which transmission is assumed to be no longer sustainable and recrudescence is unlikely to occur even in the absence of intervention, at least 65% of the total population in each IU must ingest the medicines for at least fi ve rounds of MDA. Monitoring epidemiological drug coverage at each round is therefore an essential component of programme management, which provides important information for deciding whether an IU is eligible for a TAS.
Coverage should refl ect the actual compliance with intake of the medicines by the target population. Reported coverage can be verifi ed by coverage surveys.
LF_TAS_Learner_manual.indd Sec1:10 26/03/2014 11:50:56
11ELIGIBILITY FOR A TAS Module 2
MO
DU
LE 2
Sentinel and spot-check surveys (slide 6)
Blood surveys at sentinel sites are used to establish baseline infection levels and to monitor the impact of MDA on infection prevalence periodically. Once a sentinel site is selected, the same site must serve as the sentinel site throughout the programme.
Blood surveys at spot-check sites are used to confi rm that the results of sentinel surveys represent the infection level in the entire IU. At least one spot-check site is selected for each sentinel site. Diff erent spot-check sites are selected each time.
How many sentinel and spot-check sites are needed for each IU? (slide 7)
• At least one sentinel site per 1 million people in the IU • At least one sentinel site for each IU; more sites may be selected when resources allow.
Smaller IUs may be combined and served by one sentinel site. Combined IUs should be contiguous, have similar epidemiological characteristics and should have implemented MDA at the same time. Th e advice of WHO and the RPRG may be required.
Characteristics of sentinel and spot-check sites (slide 8)
Sites with the following characteristics should be selected as sentinel and spot-check sites:
• A population of at least 500 people (so as to collect a convenience sample of at least 300 people aged > 5 years of age) • In an area of known high transmission (i.e. high disease or parasite prevalence or vector abundance) or an area where diffi culty in achieving high drug coverage is anticipated • No prior MDA for onchocerciasis • A stable population
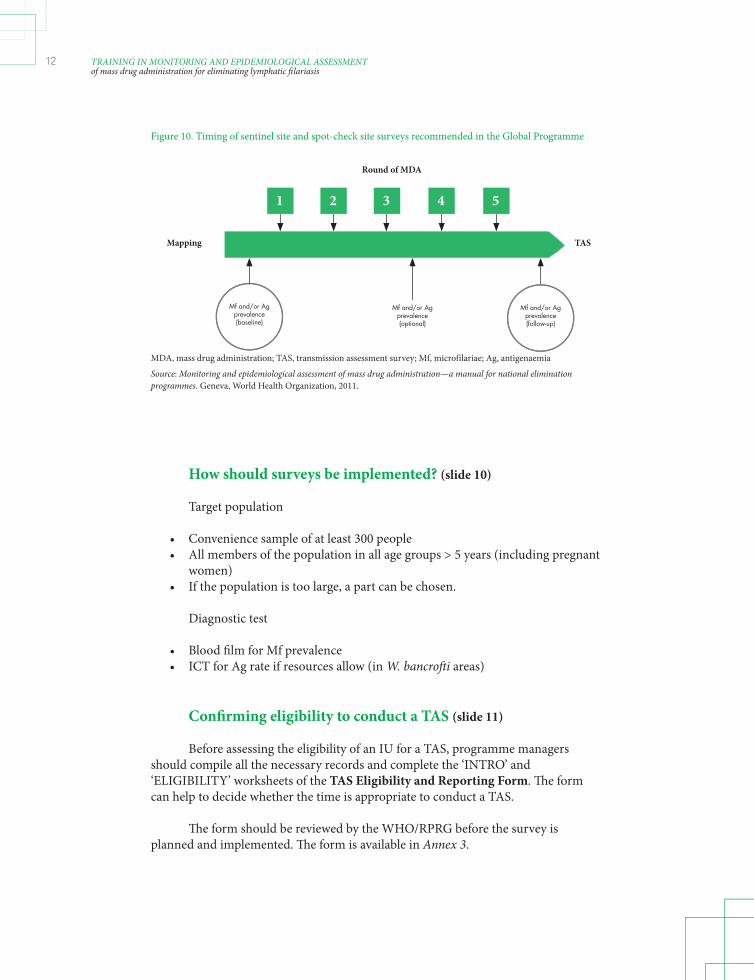
When should surveys be conducted? (slide 9)
• Baseline survey: before fi rst MDA • Mid-term survey: at least 6 months aft er third MDA (optional); could be replaced by eff ective annual monitoring of coverage • Follow-up survey: at least 6 months aft er fi ft h eff ective MDA to assess whether the IU is eligible for a TAS
LF_TAS_Learner_manual.indd Sec1:11 26/03/2014 11:50:56
12 TRAINING IN MONITORING AND EPIDEMIOLOGICAL ASSESSMENTof mass drug administration for eliminating lymphatic fi lariasis
1
Round of MDA
2 3 4 5
Mapping TAS
Mf and/or Ag prevalence (baseline)
Mf and/or Ag prevalence (follow-up)
Mf and/or Ag prevalence (optional)
Figure 10. Timing of sentinel site and spot-check site surveys recommended in the Global Programme
MDA, mass drug administration; TAS, transmission assessment survey; Mf, microfilariae; Ag, antigenaemia
Source: Monitoring and epidemiological assessment of mass drug administration—a manual for national elimination programmes. Geneva, World Health Organization, 2011.
How should surveys be implemented? (slide 10)
Target population
• Convenience sample of at least 300 people • All members of the population in all age groups > 5 years (including pregnant women) • If the population is too large, a part can be chosen.
Diagnostic test
• Blood fi lm for Mf prevalence • ICT for Ag rate if resources allow (in W. bancroft i areas)
Confi rming eligibility to conduct a TAS (slide 11)
Before assessing the eligibility of an IU for a TAS, programme managers should compile all the necessary records and complete the ‘INTRO’ and ‘ELIGIBILITY’ worksheets of the TAS Eligibility and Reporting Form. Th e form can help to decide whether the time is appropriate to conduct a TAS.
Th e form should be reviewed by the WHO/RPRG before the survey is planned and implemented. Th e form is available in Annex 3.
LF_TAS_Learner_manual.indd Sec1:12 26/03/2014 11:50:56
MO
DU
LE 3
13EVALUATION UNITModule 3
Evaluation unit
Learning objectives:
By the end of this module, learners should understand how to defi ne a survey area, known as an evaluation unit (EU).
Relevant sections of the 2011 WHO monitoring and evaluation manual3
• Section 7.1 What geographical area should be used?
LF_TAS_Learner_manual.indd Sec1:13 26/03/2014 11:50:56

14 TRAINING IN MONITORING AND EPIDEMIOLOGICAL ASSESSMENTof mass drug administration for eliminating lymphatic fi lariasis
Survey area for a TAS (slides 4 and 5)
If all the data from IUs confi rm that they are eligible for a TAS, planning can start. Th e design of a TAS is determined in several steps.
Th e fi rst step is to defi ne the survey area (Figure 11), which is designated as an EU. It is important to recognize the diff erence between IUs and EUs and to defi ne the appropriate EU:
• IU: Th e administrative unit in a country that is used for MDA • EU: A study area selected for a TAS
Defi ning an EU (slide 6)
IUs can be combined, divided or remain the same in defi ning an EU. Nevertheless, all IUs in a country in which MDA is implemented will be included in a TAS.
If IUs are combined, the resulting EU should have the following characteristics:
• IUs in an EU are usually contiguous. • All IUs in an EU should have had at least fi ve eff ective rounds of MDA (i.e. covering ≥ 65% of the total population) and meet all the eligibility criteria for a TAS. • All areas in an EU should have similar epidemiological features and LF transmission dynamics (i.e. epidemiological drug coverage, baseline prevalence, Mf or Ag prevalence in sentinel and spot-check site surveys, principal LF parasites, vector abundance). • Th e population should not exceed 2 million.
Figure 11. Determining the design of a transmission assessment survey in module 3
Survey area Evaluation unit
School Community
Cluster-based sampling Systematic sampling Census
Sample size and critical cut-offSample size
Survey site
Sampling strategy
1.
4.
2.
3.
LF_TAS_Learner_manual.indd Sec1:14 26/03/2014 11:50:56
MO
DU
LE 3
15EVALUATION UNITModule 3
Combining IUs (slide 7)
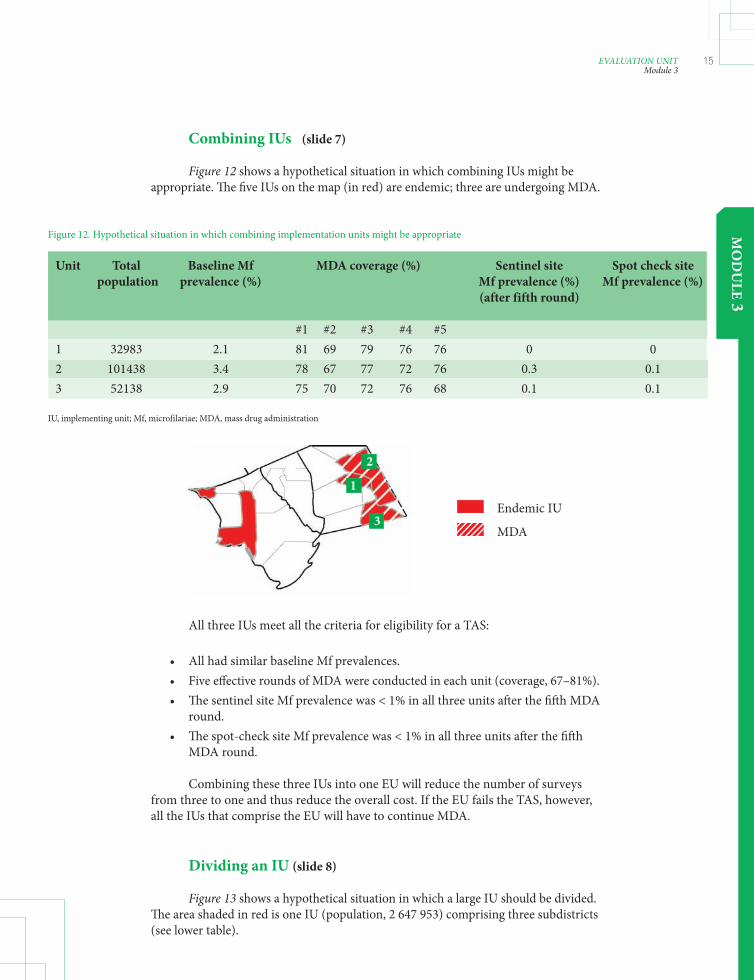
Figure 12 shows a hypothetical situation in which combining IUs might be appropriate. Th e fi ve IUs on the map (in red) are endemic; three are undergoing MDA.
Figure 12. Hypothetical situation in which combining implementation units might be appropriate
Unit Total Baseline Mf MDA coverage (%) Sentinel site Spot check site population prevalence (%) Mf prevalence (%) Mf prevalence (%) (after fifth round)
#1 #2 #3 #4 #5 1 32983 2.1 81 69 79 76 76 0 0 2 101438 3.4 78 67 77 72 76 0.3 0.1 3 52138 2.9 75 70 72 76 68 0.1 0.1
IU, implementing unit; Mf, microfilariae; MDA, mass drug administration
1
2
3Endemic IU
MDA
All three IUs meet all the criteria for eligibility for a TAS:
• All had similar baseline Mf prevalences. • Five eff ective rounds of MDA were conducted in each unit (coverage, 67–81%). • Th e sentinel site Mf prevalence was < 1% in all three units aft er the fi ft h MDA round. • Th e spot-check site Mf prevalence was < 1% in all three units aft er the fi ft h MDA round.
Combining these three IUs into one EU will reduce the number of surveys from three to one and thus reduce the overall cost. If the EU fails the TAS, however, all the IUs that comprise the EU will have to continue MDA.
Dividing an IU (slide 8)
Figure 13 shows a hypothetical situation in which a large IU should be divided. Th e area shaded in red is one IU (population, 2 647 953) comprising three subdistricts (see lower table).
LF_TAS_Learner_manual.indd Sec1:15 26/03/2014 11:50:56

16 TRAINING IN MONITORING AND EPIDEMIOLOGICAL ASSESSMENTof mass drug administration for eliminating lymphatic fi lariasis
All the eligibility criteria for a TAS have been met:
• fi ve rounds of MDA with eff ective coverage and• Mf prevalence at all sentinel and spot-check sites is < 1%.
Th e total population of the IU is, however, more than 2 million.
In this example, the baseline Mf prevalence in subdistrict 2 was actually higher than that in subdistricts 1 and 3. Th erefore, subdistricts 1 and 3 could be combined for one assessment, and 2 could be assessed separately. Alternatively three TAS could be conducted, with one in each subdistrict.
While dividing an IU into several EUs increases the number of surveys to be conducted, it allows a more focused assessment of the situation in the IU.
Geographical area of an EU (slide 9)
Although there is no upper limit to the geographical area of an EU, combining IUs may increase the probability of missing foci of infection and might increase the logistical diffi culties (e.g. transport costs).
Exercise (slide 10)
Using existing data (e.g. maps, listing of IUs, population sizes, number of MDA rounds, epidemiological drug coverage) to:
1. defi ne an appropriate EU(s) 2. present the defi ned EU(s) to the group
Figure 13. Hypothetical situation in which a large implementation unit should be divided
Total Baseline Mf MDA coverage (%) Sentinel site Spot check site population prevalence (%) Mf prevalence (%) Mf prevalence (%) (after fifth round)
#1 #2 #3 #4 #5 2 647 953 2.8 79 66 71 74 72 0.2 0.3
Mf, microfilariae; MDA, mass drug administration; IU, implementing unit
Endemic IU
MDA
Sub-distrcit Total Baseline Mf population prevalence (%)
1 798 234 1.8 2 989 436 5.4 3 860 283 1.2
1 2
3
LF_TAS_Learner_manual.indd Sec1:16 26/03/2014 11:50:56

MO
DU
LE 4
17SURVEY DESIGNModule 4
Survey design
Learning objectives:
By the end of this module, learners should understand how to determine: • survey site • sampling strategy • sample size • critical cut-off
Relevant sections of the 2011 WHO monitoring and evaluation manual3
• Section 7.3. How should the surveys be implemented?
LF_TAS_Learner_manual.indd Sec1:17 26/03/2014 11:50:56

18 TRAINING IN MONITORING AND EPIDEMIOLOGICAL ASSESSMENTof mass drug administration for eliminating lymphatic fi lariasis
Determining survey site, sampling strategy and sample size (slide 4, Figure 14)
Once the survey area has been defi ned, the next steps are to determine the survey site, sampling strategy and sample size.
Target population (slide 5)
Target group: Children aged 6–7 years
Why? Young children should have been protected from infection if MDA was successful in interrupting transmission. Positive test results in this age group therefore usually indicate recent transmission.
• For school-based surveys:
– All children enrolled in selected grades (usually grades 1 and 2) should be considered eligible for the survey sample. – Once the grade(s) have been selected for the survey, every child enrolled in that grade(s) is eligible for the survey, regardless of age. Th e sample may therefore include children aged 5, 8 or 9 years or more.
• For community-based household surveys:
– All children aged 6–7 years old in the EU are eligible for inclusion.
Figure 14. Steps in determining the design of a transmission assessment survey in module 4
Survey area Evaluation unit
School Community
Cluster-based sampling Systematic sampling Census
Sample size and critical cut-offSample size
Survey site
Sampling strategy
1.
4.
2.
3.
LF_TAS_Learner_manual.indd Sec1:18 26/03/2014 11:50:56

MO
DU
LE 4
19SURVEY DESIGNModule 4
Survey site (slide 6)
A TAS can be conducted in schools or in communities, depending on the proportion of 6- and 7-year-old children in schools.
Options:
• School/based survey • Community based household survey
• If the net primary-school enrolment ratio in the EU is ≥ 75%, the survey can be conducted in schools.
– Th e net school enrolment ratio should be confi rmed with the ministry of education. – Th e enrolment ratios for the EU should be used, if available. Good judgement should be used if the rates in the EU vary.
• If the net primary-school enrolment ratio is < 75%, a community-based household survey should be conducted.
Sampling strategy (slides 7 and 8)
Aft er the survey site (school or community) has been selected, the next step is to determine an appropriate sampling strategy. Th ree options are available (Figure 14):
• Cluster sampling
– A ‘cluster’ is a sampling unit, which in the case of a TAS is a school or enumeration area. – First select clusters, then systematically test only children in selected clusters. – Advantage: fewer sites to visit
• Systematic sampling
– Sample children at all sites. – Select children to test at fi xed intervals. – Advantage: smaller sample
• Census
– No sampling required; test all children in target age range in all sites.
LF_TAS_Learner_manual.indd Sec1:19 26/03/2014 11:50:56
20 TRAINING IN MONITORING AND EPIDEMIOLOGICAL ASSESSMENTof mass drug administration for eliminating lymphatic fi lariasis
Th e choice of cluster or systematic sampling depends on the total number of children in the target age range (6–7 years) and the total number of clusters (schools or enumeration areas) in the EU. Census sampling should be used in areas where the target population is small.
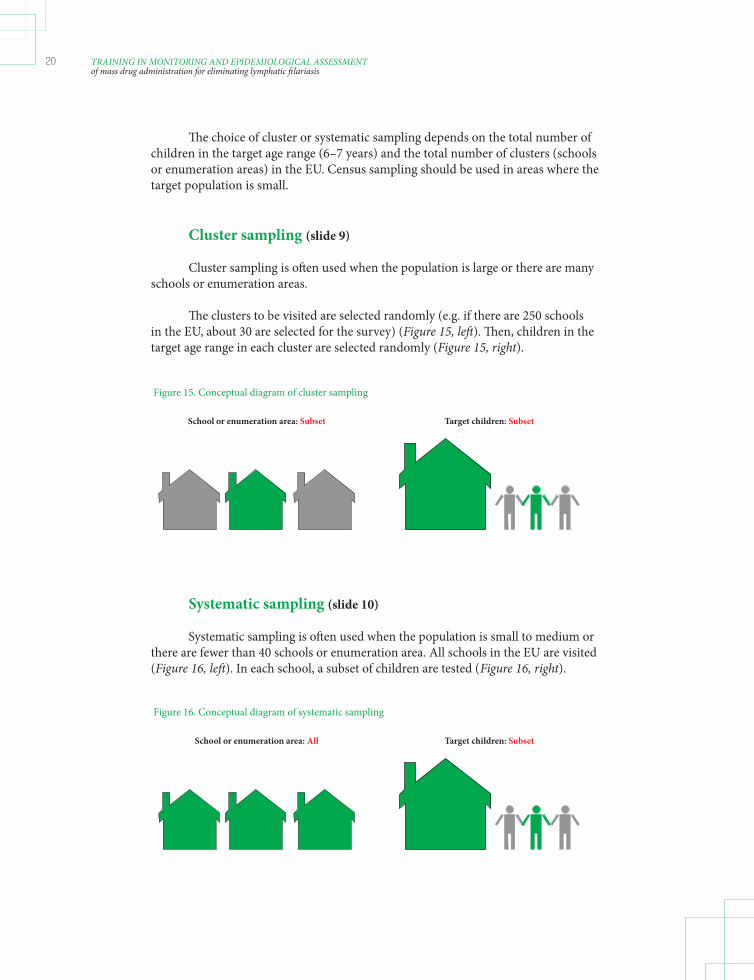
Cluster sampling (slide 9)
Cluster sampling is oft en used when the population is large or there are many schools or enumeration areas.
Th e clusters to be visited are selected randomly (e.g. if there are 250 schools in the EU, about 30 are selected for the survey) (Figure 15, left ). Th en, children in the target age range in each cluster are selected randomly (Figure 15, right).
Figure 15. Conceptual diagram of cluster sampling
School or enumeration area: Subset Target children: Subset
Systematic sampling (slide 10)
Systematic sampling is oft en used when the population is small to medium or there are fewer than 40 schools or enumeration area. All schools in the EU are visited (Figure 16, left ). In each school, a subset of children are tested (Figure 16, right).
Figure 16. Conceptual diagram of systematic sampling
School or enumeration area: All Target children: Subset
LF_TAS_Learner_manual.indd Sec1:20 26/03/2014 11:50:56

MO
DU
LE 4
21SURVEY DESIGNModule 4
Census (slide 11)
A census is usually conducted when the population is small (< 400 children in areas where Anopheles or Culex is the principal vector; < 1000 children in areas where Aedes is the principal vector). In census sampling, all children in the target age group in the EU are tested (Figure 17).
Figure 17. Conceptual diagram of census
School or enumeration area: All Target children: All
Algorithm for survey site and sampling strategy (slide 12)
Th e survey site and sampling strategy can be selected by using the algorithm on page 25 of the 2011 WHO monitoring and evaluation manual, which is reproduced in Annex 4.
Sample size (slides 13 and 14)
Once the location and sampling strategy have been determined, the target sample size for the survey should be calculated. Sample size can be calculated from either:
• Tables A.5.1 and A.5.2 of Annex 5 of the 2011 WHO monitoring and evaluation manual3 (pp. 73–74) or • the ‘survey sample builder’ (see module 8).
Sample size depends on the total population of target-age children in the EU. As Aedes spp. are more effi cient vectors, the target level of Ag is lower in these areas. As a result, the sample sizes will be larger than in areas where Anopheles, Culex or Mansonia is the principal vector.
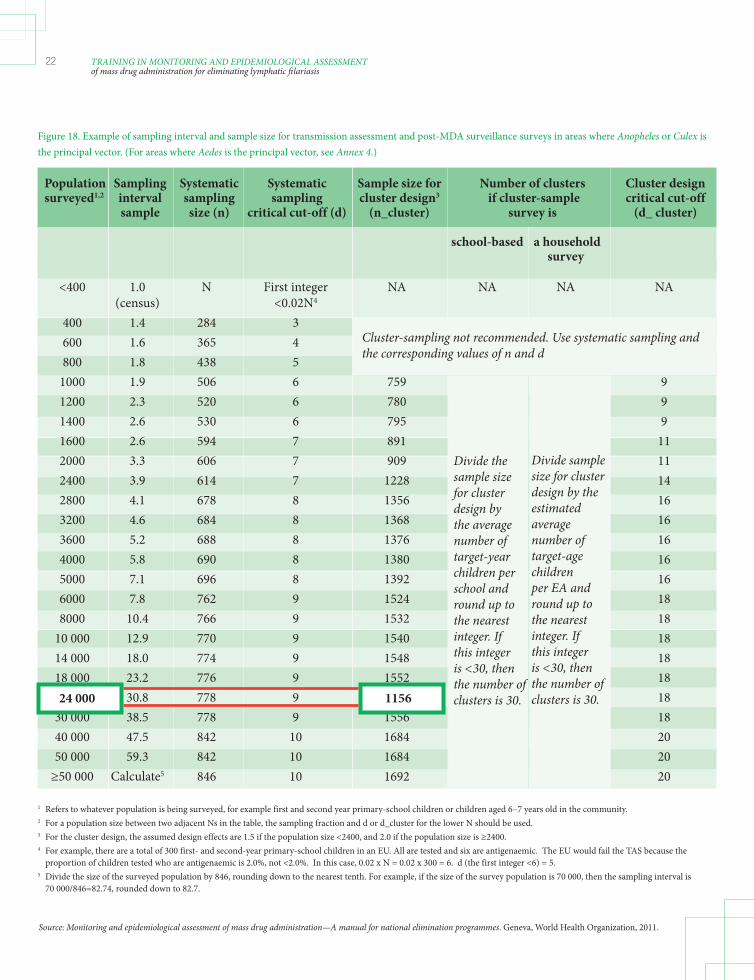
In the example shown in Figure 18, the total population of children in the target age group in the EU is approximately 24 000. If the programme manager has decided to conduct cluster sampling, the target sample size for the survey will be 1 156 children of the target age group in the EU.
LF_TAS_Learner_manual.indd Sec1:21 26/03/2014 11:50:57
22 TRAINING IN MONITORING AND EPIDEMIOLOGICAL ASSESSMENTof mass drug administration for eliminating lymphatic fi lariasis
Figure 18. Example of sampling interval and sample size for transmission assessment and post-MDA surveillance surveys in areas where Anopheles or Culex is the principal vector. (For areas where Aedes is the principal vector, see Annex 4.)
Population Sampling Systematic Systematic Sample size for Number of clusters Cluster design surveyed1,2 interval sampling sampling cluster design3 if cluster-sample critical cut-off sample size (n) critical cut-off (d) (n_cluster) survey is (d_ cluster)
school-based a household survey <400 1.0 N First integer NA NA NA NA (census) <0.02N4
400 1.4 284 3 600 1.6 365 4 800 1.8 438 5 1000 1.9 506 6 759 9 1200 2.3 520 6 780 9 1400 2.6 530 6 795 9 1600 2.6 594 7 891 11 2000 3.3 606 7 909 11 2400 3.9 614 7 1228 14 2800 4.1 678 8 1356 16 3200 4.6 684 8 1368 16 3600 5.2 688 8 1376 16 4000 5.8 690 8 1380 16 5000 7.1 696 8 1392 16 6000 7.8 762 9 1524 18 8000 10.4 766 9 1532 18 10 000 12.9 770 9 1540 18 14 000 18.0 774 9 1548 18 18 000 23.2 776 9 1552 18 24 000 30.8 778 9 1556 18 30 000 38.5 778 9 1556 18 40 000 47.5 842 10 1684 20 50 000 59.3 842 10 1684 20 ≥50 000 Calculate5 846 10 1692 20
1 Refers to whatever population is being surveyed, for example first and second year primary-school children or children aged 6–7 years old in the community.2 For a population size between two adjacent Ns in the table, the sampling fraction and d or d_cluster for the lower N should be used.3 For the cluster design, the assumed design effects are 1.5 if the population size <2400, and 2.0 if the population size is ≥2400.4 For example, there are a total of 300 first- and second-year primary-school children in an EU. All are tested and six are antigenaemic. The EU would fail the TAS because the proportion of children tested who are antigenaemic is 2.0%, not <2.0%. In this case, 0.02 x N = 0.02 x 300 = 6. d (the first integer <6) = 5.5 Divide the size of the surveyed population by 846, rounding down to the nearest tenth. For example, if the size of the survey population is 70 000, then the sampling interval is 70 000/846=82.74, rounded down to 82.7.
Cluster-sampling not recommended. Use systematic sampling and the corresponding values of n and d
Divide the sample size for cluster design by the average number of target-year children per school and round up to the nearest integer. If this integer is <30, then the number of clusters is 30.
Divide sample size for cluster design by the estimated average number of target-age children per EA and round up to the nearest integer. If this integer is <30, then the number of clusters is 30.24 000 1156
Source: Monitoring and epidemiological assessment of mass drug administration—A manual for national elimination programmes. Geneva, World Health Organization, 2011.
LF_TAS_Learner_manual.indd Sec1:22 26/03/2014 11:50:57

MO
DU
LE 4
23SURVEY DESIGNModule 4
Figure 18. Example of sampling interval and sample size for transmission assessment and post-MDA surveillance surveys in areas where Anopheles or Culex is the principal vector. (For areas where Aedes is the principal vector, see Annex 4.)
Population Sampling Systematic Systematic Sample size for Number of clusters Cluster design surveyed1,2 interval sampling sampling cluster design3 if cluster-sample critical sample size (n) critical cut-off (d) (n_cluster) survey is cut-off cluster)
school-based a household survey <400 1.0 N First integer NA NA NA NA (census) <0.02N4
400 1.4 284 3 600 1.6 365 4 800 1.8 438 5 1000 1.9 506 6 759 9 1200 2.3 520 6 780 9 1400 2.6 530 6 795 9 1600 2.6 594 7 891 11 2000 3.3 606 7 909 11 2400 3.9 614 7 1228 14 2800 4.1 678 8 1356 16 3200 4.6 684 8 1368 16 3600 5.2 688 8 1376 16 4000 5.8 690 8 1380 16 5000 7.1 696 8 1392 16 6000 7.8 762 9 1524 18 8000 10.4 766 9 1532 18 10 000 12.9 770 9 1540 18 14 000 18.0 774 9 1548 18 18 000 23.2 776 9 1552 18 24 000 30.8 778 9 1556 18 30 000 38.5 778 9 1556 18 40 000 47.5 842 10 1684 20 50 000 59.3 842 10 1684 20 ≥50 000 Calculate5 846 10 1692 20
1 Refers to whatever population is being surveyed, for example first and second year primary-school children or children aged 6–7 years old in the community.2 For a population size between two adjacent Ns in the table, the sampling fraction and d or d_cluster for the lower N should be used.3 For the cluster design, the assumed design effects are 1.5 if the population size <2400, and 2.0 if the population size is ≥2400.4 For example, there are a total of 300 first- and second-year primary-school children in an EU. All are tested and six are antigenaemic. The EU would fail the TAS because the proportion of children tested who are antigenaemic is 2.0%, not <2.0%. In this case, 0.02 x N = 0.02 x 300 = 6. d (the first integer <6) = 5.5 Divide the size of the surveyed population by 846, rounding down to the nearest tenth. For example, if the size of the survey population is 70 000, then the sampling interval is 70 000/846=82.74, rounded down to 82.7.
Cluster-sampling not recommended. Use systematic sampling and the corresponding values of n and d
Divide the sample size for cluster design by the average number of target-year children per school and round up to the nearest integer. If this integer is <30, then the number of clusters is 30.
Divide sample size for cluster design by the estimated average number of target-age children per EA and round up to the nearest integer. If this integer is <30, then the number of clusters is 30.24 000 1156
Source: Monitoring and epidemiological assessment of mass drug administration—A manual for national elimination programmes. Geneva, World Health Organization, 2011.
18
Critical cut-off (slides 15 and 16)
Critical cut-off : Th reshold of infection prevalence below which transmission is assumed to be no longer sustainable and recrudescence is unlikely to occur, even in the absence of MDA. • A TAS provides an estimate of this threshold in the EU as the number of antigen-positive or antibody-positive cases.
• If the number of positive cases is at or below the established cut-off , the EU ‘passes’, and governments can decide to stop MDA. • If the number of positive cases is above the established cut-off , at least two more rounds of MDA should be conducted.
In the example in Figure 19, the critical cut-off is 18. If the total number of positive cases is 18 or fewer, a decision can be made to stop MDA. If the total number of positive cases is greater than 18, MDA should continue for at least two more rounds.
Figure 19. Example of sampling interval and sample size for transmission assessment and post-MDA surveillance surveys in areas in which Anopheles or Culex is the principal vector
LF_TAS_Learner_manual.indd Sec1:23 26/03/2014 11:50:57

24 TRAINING IN MONITORING AND EPIDEMIOLOGICAL ASSESSMENTof mass drug administration for eliminating lymphatic fi lariasis
Critical cut-off in census (slide 17)
In areas where a census is used (i.e. every child in the target age group is tested), a point prevalence of infection is calculated and forms the basis for programmatic decisions. MDA can be stopped in:
• areas of Culex, Anopheles or Mansonia in which the prevalence is < 2% • in areas of Aedes areas in which the prevalence is < 1%.
Exercise (slide 18)
1. Using Figure 3 of the 2011 WHO monitoring and evaluation manual (p. 25), you will:
i. determine whether a school-based or a community-based survey is appropriate for the EU(s) defi ned in module 3. ii. determine whether a cluster, systematic or census sampling design is appropriate.
2. Using Table A.5.1 or A.5.2 of the 2011 WHO monitoring and evaluation manual (pp. 73–74), you will:
i. determine the sample size required for the EU(s) defi ned in module 3. ii. determine the critical cut-off for the survey(s).
LF_TAS_Learner_manual.indd Sec1:24 26/03/2014 11:50:57
MO
DU
LE 5
25DIAGNOSTIC TESTSModule 5
Diagnostic tests
Learning objectives:
By the end of this module, learners should understand how to: • procure diagnostic tests • collect blood • prepare, conduct and interpret ICTs • prepare, conduct and interpret Brugia RapidTM tests
Relevant sections of the 2011 WHO monitoring and evaluation manual3
• Section 3. Diagnostic tools
LF_TAS_Learner_manual.indd Sec1:25 26/03/2014 11:50:57

26 TRAINING IN MONITORING AND EPIDEMIOLOGICAL ASSESSMENTof mass drug administration for eliminating lymphatic fi lariasis
Diagnostic tests for TAS (slides 4–6)
Th e diagnostic test selected depends on the phase of the national LF elimination programme and on the type of parasites endemic in the area (Figures 20 and 21). Th e ICT is recommended by the GPELF for areas in which W. bancroft i is endemic, the Brugia RapidTM test for areas endemic for Brugia spp. and both tests for areas in which W. bancroft i and Brugia spp. are endemic, with testing evaluated separately against critical cut-off thresholds.5
Figure 20. Programme steps for interrupting transmission and recommended diagnostic tests
Mf, microfilariae; Ag, antigenaemia; MDA, mass drug administration; TAS, transmission assessment survey; M&E, monitoring and evaluation; ICT, immunochromatographic tests.
Blood film or ICT
Mapping MDA Surveillance
Pass
Follow-upBaseline Mid term(optional)
YesMf or
Ag ≥ 1 %
Fail
(ELIGIBILITY)
M&E
TASP
Assessment tools
Mapping MDA TAS Surveillance
Blood film or ICT ICT or Brugia RapidTM
ICT or Brugia RapidTM
Potential for future use:Antibody, xenomonitoring
5 A new diagnostic test to detect antigen to W. bancroft i is being developed and is expected to be available in the near future (see Annex 11).
Th e ICT detects antigens from live or dead adult worms circulating in the peripheral blood that are still disintegrating, regardless of the presence of microfi lariae. Positive results therefore indicate recent infection. ICTs are currently available only for W. bancroft i.
Th e Brugia RapidTM test detects antifi larial antibodies to B. malayi and B. timori. While antibodies might persist for years aft er infection, detection in children is considered to indicate recent infection.
Procurement of diagnostic tests (slide 7)
• ICT: BinaxNow® Filariasis is manufactured by Alere, Inc. (Scarborough, Maine, USA). A “no objection certifi cate” is required for importation of the test devices. Positive controls can be obtained from the Filariasis Research Reagent Repository Center (www.fi lariasiscenter.org). • Brugia RapidTM test: manufactured by Reszon Diagnostics International (Selangor, Malaysia)
LF_TAS_Learner_manual.indd Sec1:26 26/03/2014 11:50:57
MO
DU
LE 5
27DIAGNOSTIC TESTSModule 5
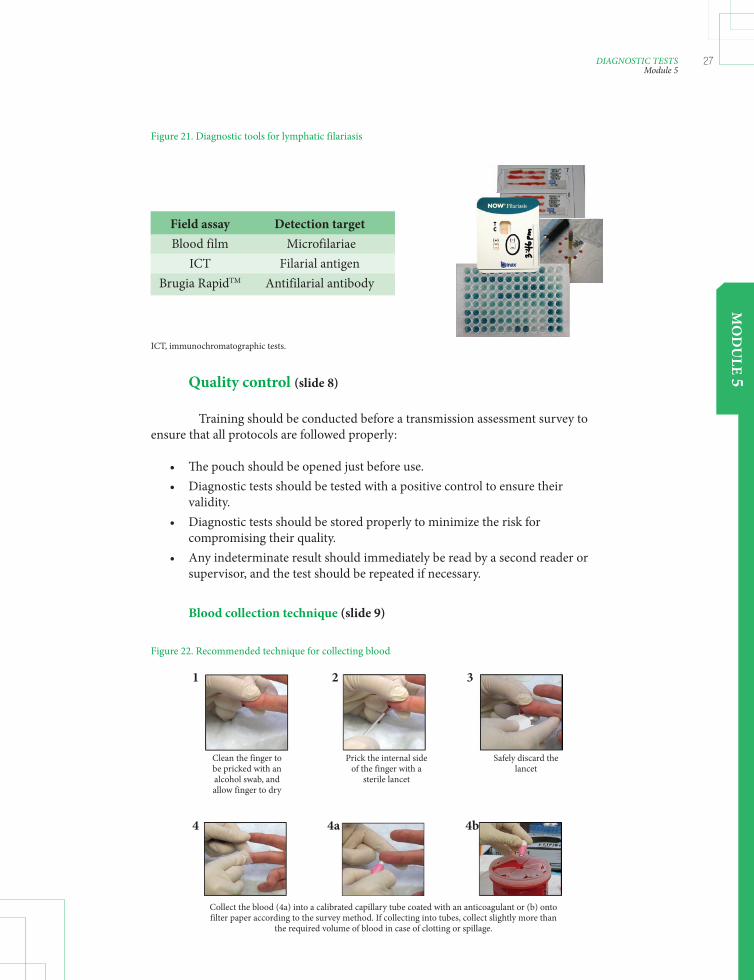
Quality control (slide 8)
Training should be conducted before a transmission assessment survey to ensure that all protocols are followed properly:
• Th e pouch should be opened just before use. • Diagnostic tests should be tested with a positive control to ensure their validity. • Diagnostic tests should be stored properly to minimize the risk for compromising their quality. • Any indeterminate result should immediately be read by a second reader or supervisor, and the test should be repeated if necessary.
Blood collection technique (slide 9)
Figure 21. Diagnostic tools for lymphatic filariasis
ICT, immunochromatographic tests.
Field assay Detection target Blood film Microfilariae ICT Filarial antigen Brugia RapidTM Antifilarial antibody
Figure 22. Recommended technique for collecting blood
Clean the finger to be pricked with an alcohol swab, and allow finger to dry
Prick the internal side of the finger with a
sterile lancet
Safely discard the lancet
Collect the blood (4a) into a calibrated capillary tube coated with an anticoagulant or (b) onto filter paper according to the survey method. If collecting into tubes, collect slightly more than
the required volume of blood in case of clotting or spillage.
321
4 4a 4b
LF_TAS_Learner_manual.indd Sec1:27 26/03/2014 11:50:57

28 TRAINING IN MONITORING AND EPIDEMIOLOGICAL ASSESSMENTof mass drug administration for eliminating lymphatic fi lariasis
ICT (slide 10)
• Sensitive for detecting W. bancroft i antigen. • Do not require laboratory equipment and can be processed quickly. • Positive result indicates the presence of adult worm antigen. • Adequate training is necessary to reduce interobserver variation and to reduce misreading of cards, which can lead to false-positive results.
Preparation (slide 11)
• Storage: Cards have a limited shelf-life at ambient temperature (3 months at 30 °C) but a longer shelf-life when stored at 4 °C (about 9 months). Cards should not be frozen. • Testing with a positive control: Before a fi eld survey is begun, two cards from each lot should be tested with a weak positive control, which can be obtained from the Filariasis Research Reagent Repository Center (www.fi lariasiscenter. org). With this control, the test line may be very faint. Do not use cards that give a negative result when tested with the control. • Transport: A cool box is not required for transporting cards for use in the fi eld; however, care should be taken not to expose cards to extreme heat for long periods. • Light: Cards must be read under adequate lighting, as faint lines can be diffi cult to see. Th is is especially important when reading cards at night.
LF_TAS_Learner_manual.indd Sec1:28 26/03/2014 11:50:57

MO
DU
LE 5
29DIAGNOSTIC TESTSModule 5
Figure 23 Recommended procedure for immunochromatographic tests (ICTs)
1
Remove card from pouch just before use.
3
Add blood sample slowly to the white portion of the sample pad.
DO NOT add blood directly to the pink portion of the sample pad.
DO NOT close the card before the sample migrates to the pink portion of the sample pad (takes about 30 seconds aft er addition of blood).
2 Collect 100 μl of blood by fi nger prick into a calibrated capillary tube OR remove 100 μl of blood from a microcentrifuge tube with a micropipette. DO NOT add blood directly from the fi nger to the card.
4
Remove adhesive liner and close card. Start timing.
It is helpful to record the starting time on the front of the card.
If plasma fails to migrate completely past the bottom of the window, a false-positive result may be read.
DO NOT read cards if the plasma has not fl owed ALL the way down the strip.
5
Procedure (slides 12–14)
Circle the appropriate result on the front of the card to create a permanent record.
DO NOT read cards at any time other than 10 minutes, as the reading may be false-positive.
Read test results 10 minutes aft er closing card.
LF_TAS_Learner_manual.indd Sec1:29 26/03/2014 11:50:57

30 TRAINING IN MONITORING AND EPIDEMIOLOGICAL ASSESSMENTof mass drug administration for eliminating lymphatic fi lariasis
Interpretation (slide 15)
Figure 24. Interpretations of test results obtained with immunochromatographic tests (ICTs)
Positive Positive (weak) Negative
The test line should be pink. Sometimes, a grey line or shadow appears in the test line position. This should not
be misinterpreted as a positive result.
InvalidNo lines appear
InvalidNo control line
Negative
T = TestC = Control
Brugia RapidTM test (slide 16)
• Sensitive for detecting antibodies to B. malayi and B. timori. • Does not require laboratory equipment and can be processed quickly. • Positive result indicates the presence of antifi larial antibodies.
Preparation (slide 17)
• Storage: Th e test has a shelf-life of 18 months when stored at ambient temperatures (20–25 °C); 4 °C (refrigeration) is recommended for long-term storage. Th e tests should NOT be frozen. • Transport: A cool box is not required, although it is desirable, when transporting tests for use in the fi eld. Care should be taken not to expose the tests to extreme heat for long periods. • Lighting: Tests must be read under adequate lighting, as faint lines can be diffi cult to see. Th is is especially important when reading tests at night. • Th e test requires 30 μl of serum or plasma or 35 μl of whole blood.
LF_TAS_Learner_manual.indd Sec1:30 26/03/2014 11:50:58

MO
DU
LE 5
31DIAGNOSTIC TESTSModule 5
Procedure (slides 18–21)
Figure 25. Recommended procedure for Brugia RapidTM tests
1 Bring test cassette and chase buff er to room temperature. Remove cassette from foil pouch just before use. Label the cassette with information on the sample.
3
Add blood sample slowly to the square well by touching the capillary tube or pipette tip to the sloping side. If using serum or plasma, only 30 μl are needed.
Add one drop of chase buff er to the same square well.If using serum or plasma, no chase buff er is required.
Th e sample will start to fl ow up the strip. Th e cassette can be tapped gently on the table to facilitate the fl ow. Wait until the sample has reached the blue line (A). If the sample does not reach the blue line (A) aft er 4 minutes but has reached area B, proceed to the next step.
2 Collect 35 μl of blood by fi nger prick into a calibrated capillary tube OR remove 35 μl of blood from a microcentrifuge tube with a micropipette. DO NOT add blood directly from the fi nger to the cassette.
4
When the sample has reached the blue line (A), add three drops of chase buff er to the circle well at the top of the cassette.Add the buff er drop by drop, and allow each drop to saturate the pad before delivering the next drop.
Firmly pull the clear tab at the bottom of the cassette until you feel resistance.
Aft er pulling the clear tab, add one drop of buff er to the square well.
5
Start timing. Read test results 25 minutes aft er adding the fi nal drop of buff er. Test results for serum and plasma samples should be read aft er 15 minutes.
Record the start or end time on the front of the cassette. Write the appropriate result on the front of the cassette to create a permanent record.
LF_TAS_Learner_manual.indd Sec1:31 26/03/2014 11:50:58

32 TRAINING IN MONITORING AND EPIDEMIOLOGICAL ASSESSMENTof mass drug administration for eliminating lymphatic fi lariasis
Interpretation (slide 22)
Figure 26. Interpretations of test results obtained with the Brugia RapidTM tests
PositiveB and C lines present
Positive (weak)B and C lines present
NegativeB line appears;
no C line present
The intensity of the blue line does not affect the reading.
InvalidNo B and C lines
present
InvalidNo B line present;
C line appears
InvalidBlood did not clear
A = blue lineB = ControlC = Test line
Exercise (slide 23)
During the practical session you will:
1. Practise fi nger-prick blood collection. 2. Observe the use of positive controls to ensure the validity of the diagnostic test(s). 3. Practise using the diagnostic test(s) approved for transmission assessment surveys in your country.
Th e procedures for making blood fi lms and interpreting them and for confi rmatory testing are described in annexes 6 and 7.
LF_TAS_Learner_manual.indd Sec1:32 26/03/2014 11:50:58

MO
DU
LE 6
33AFTER THE SURVEYModule 6
Aft er the survey
Learning objectives:
By the end of this module, learners should understand how to: • interpret the results of a TAS • report to decision-makers and the GPELF • follow up positive cases • conduct post-MDA surveillance aft er MDA
Relevant sections of the 2011 WHO monitoring and evaluation manual3
• Section 8. Implementing activities and surveillance aft er mass drug administration has stopped
LF_TAS_Learner_manual.indd Sec1:33 26/03/2014 11:50:58
34 TRAINING IN MONITORING AND EPIDEMIOLOGICAL ASSESSMENTof mass drug administration for eliminating lymphatic fi lariasis
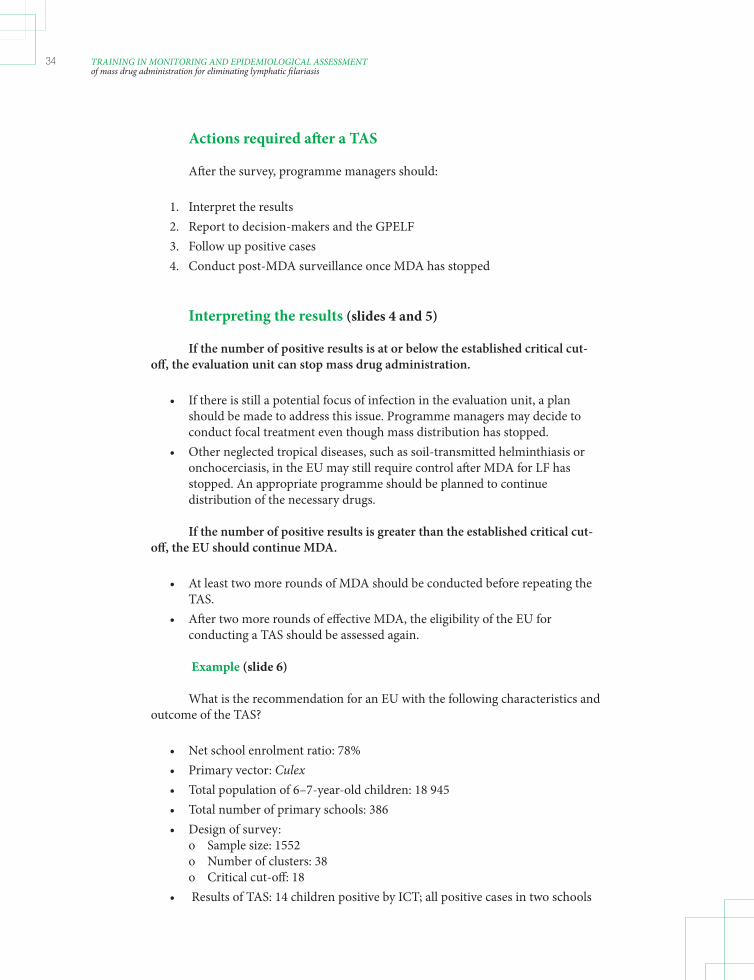
Actions required aft er a TAS
Aft er the survey, programme managers should:
1. Interpret the results 2. Report to decision-makers and the GPELF 3. Follow up positive cases 4. Conduct post-MDA surveillance once MDA has stopped
Interpreting the results (slides 4 and 5)
If the number of positive results is at or below the established critical cut-off , the evaluation unit can stop mass drug administration.
• If there is still a potential focus of infection in the evaluation unit, a plan should be made to address this issue. Programme managers may decide to conduct focal treatment even though mass distribution has stopped. • Other neglected tropical diseases, such as soil-transmitted helminthiasis or onchocerciasis, in the EU may still require control aft er MDA for LF has stopped. An appropriate programme should be planned to continue distribution of the necessary drugs.
If the number of positive results is greater than the established critical cut-off , the EU should continue MDA.
• At least two more rounds of MDA should be conducted before repeating the TAS. • Aft er two more rounds of eff ective MDA, the eligibility of the EU for conducting a TAS should be assessed again.
Example (slide 6)
What is the recommendation for an EU with the following characteristics and outcome of the TAS?
• Net school enrolment ratio: 78% • Primary vector: Culex • Total population of 6–7-year-old children: 18 945 • Total number of primary schools: 386 • Design of survey: o Sample size: 1552 o Number of clusters: 38 o Critical cut-off : 18 • Results of TAS: 14 children positive by ICT; all positive cases in two schools
LF_TAS_Learner_manual.indd Sec1:34 26/03/2014 11:50:58

MO
DU
LE 6
35AFTER THE SURVEYModule 6
Reporting to decision-makers and the GPELF (slide 10)
Decision-makers in the country (i.e. government) should be informed of the result of a TAS in order to make an appropriate decision to stop or continue MDA. As a signifi cant decision will be made on the basis of the outcome of the survey, national programme managers should also inform WHO and RPRG of the results and obtain advice if necessary (Figure 27).
Th e transmission assessment survey reporting form is available in Annex 3.
Box. Identifying reasons for ‘failing’ a TAS (slide 7-9) When an EU ‘fails’ a TAS, it is beneficial to identify the reasons, which could include one or more of the following:
• Irregular MDA • Inadequate epidemiological drug coverage due to distribution failures or failure to adhere to directly observed therapy • Poor quality of generic drugs • Population migration or previously undetected foci of infection • Systematic non-compliance
Systematic non-compliance (slides 8 and 9) is the failure of a certain individuals to take the distributed drugs regularly during any round of MDA. These individuals may continue to constitute a reservoir of microfilariae. Even if the recommended drug coverage is achieved, systematic non-compliance may contribute to perpetuation of transmission of LF.
Systematic non-compliance can be addressed by:
• targeted MDA designed to capture non-compliant individuals systematically, • social mobilization strategies targeting non-compliant individuals and • revised health education messages.
Figure 27. Proposed process of submission and review of the reporting form on the results of a transmission assessment survey (TAS) between the national programme and the Global Programme
TAS Post-MDA surveillance
Submit report to WHO/RPRG
RPRG endorses results
MDA, mass drug administration; RPRG, Regional Programme Review Meeting; WHO, World Health Organization
LF_TAS_Learner_manual.indd Sec1:35 26/03/2014 11:50:58

36 TRAINING IN MONITORING AND EPIDEMIOLOGICAL ASSESSMENTof mass drug administration for eliminating lymphatic fi lariasis
Follow-up of positive cases (slides 11 and 12)
Positive cases should be treated with:
• a single dose of a combination of albendazole (400 mg) and ivermectin (150–200 μg/kg) in areas in which onchocerciasis is co-endemic; or • a single dose of a combination of albendazole (400 mg) plus diethylcarbamazine (6 mg/kg) or diethylcarbamazine (6 mg/kg) alone for 12 days in areas where there is no onchocerciasis.
Programme managers may choose to test for Mf during the peak circulation time to follow-up positive cases.
• Residence can be ascertained to detect any signifi cant migration in the area that could aff ect the impact of MDA rounds. • Th is should be done before positive cases are treated.
If resources allow, programme managers should conduct follow-up surveys in communities with antigen- or antibody-positive children to obtain additional information on potential residual transmission.
Figure 28. Algorithm for following up positive test results in a transmission assessment survey
Positive test result
If exposure probably occured
elsewhere
Access secondary transmission
Investigate history of filarial exposure
If local exposure is probable
Begin assessment on focus
Perform ICT(BmR1) and mf testing of family and neighbours
If additional positives are found, expand to community surveys
If all are negative, probability of transmission is likely to be low
Source: Monitoring and epidemiological assessment of mass drug administration—A manual for national elimination programmes. Geneva, World Health Organization, 2011.
LF_TAS_Learner_manual.indd Sec1:36 26/03/2014 11:50:59
MO
DU
LE 6
37AFTER THE SURVEYModule 6
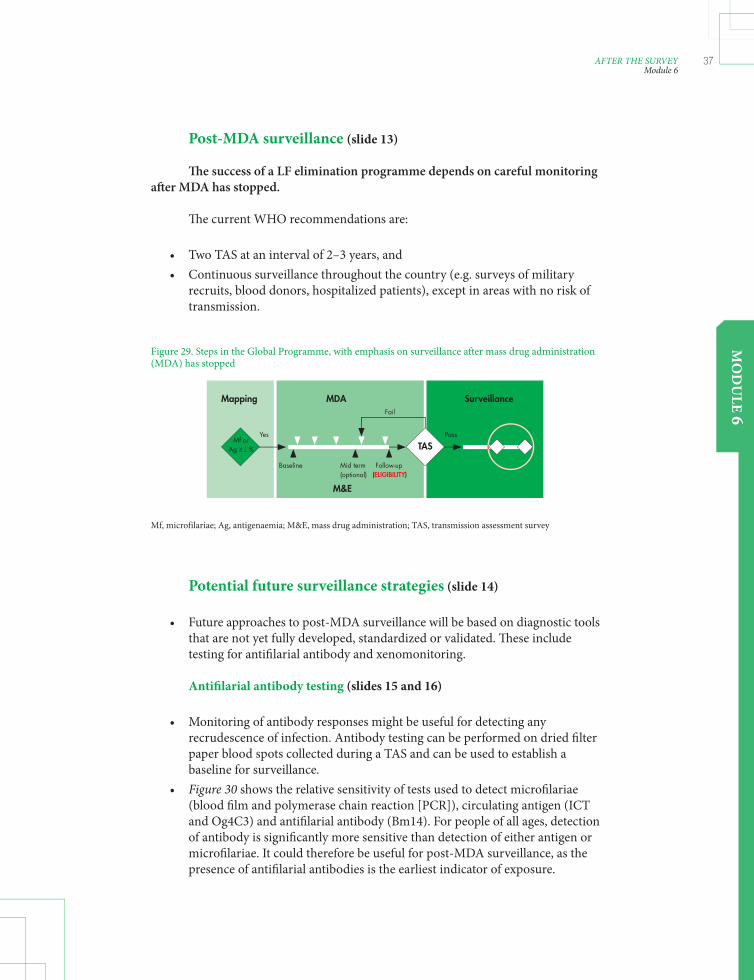
Post-MDA surveillance (slide 13)
Th e success of a LF elimination programme depends on careful monitoring aft er MDA has stopped.
Th e current WHO recommendations are:
• Two TAS at an interval of 2–3 years, and • Continuous surveillance throughout the country (e.g. surveys of military recruits, blood donors, hospitalized patients), except in areas with no risk of transmission.
Potential future surveillance strategies (slide 14)
• Future approaches to post-MDA surveillance will be based on diagnostic tools that are not yet fully developed, standardized or validated. Th ese include testing for antifi larial antibody and xenomonitoring.
Antifi larial antibody testing (slides 15 and 16)
• Monitoring of antibody responses might be useful for detecting any recrudescence of infection. Antibody testing can be performed on dried fi lter paper blood spots collected during a TAS and can be used to establish a baseline for surveillance. • Figure 30 shows the relative sensitivity of tests used to detect microfi lariae (blood fi lm and polymerase chain reaction [PCR]), circulating antigen (ICT and Og4C3) and antifi larial antibody (Bm14). For people of all ages, detection of antibody is signifi cantly more sensitive than detection of either antigen or microfi lariae. It could therefore be useful for post-MDA surveillance, as the presence of antifi larial antibodies is the earliest indicator of exposure.
Figure 29. Steps in the Global Programme, with emphasis on surveillance after mass drug administration (MDA) has stopped
Mf, microfilariae; Ag, antigenaemia; M&E, mass drug administration; TAS, transmission assessment survey
Mapping MDA Surveillance
Pass
Follow-upBaseline Mid term(optional)
YesMf or
Ag ≥ 1 %
Fail
(ELIGIBILITY)
M&E
TAS
LF_TAS_Learner_manual.indd Sec1:37 26/03/2014 11:50:59

38 TRAINING IN MONITORING AND EPIDEMIOLOGICAL ASSESSMENTof mass drug administration for eliminating lymphatic fi lariasis
Xenomonitoring (slide 17)
• Direct assessment of parasites in vector mosquitoes by PCR techniques may be useful for measuring parasite prevalence in humans in the same community. While xenomonitoring may be useful, however, more research is needed to develop feasible methods for sampling and testing mosquitoes.
60
50
40
30
20
10
00-–5 6-–10 11-–15 16-–20 21-–30 31-–40 41-–50 >50
Figure 30. Prevalence of lymphatic filariasis detected with different diagnostic tests, by age group
ICT, immunochromatographic test; PCR, polymerase chain reaction
Source: Gass K et al. A multicenter evaluation of diagnostic tools to define endpoints for programs to eliminate Bancroftian filariasis. PLoS Neglected Tropical Diseases 2012; 6(1):e1479.
Bm14 antibody detection assayICTOg4C3 antigen detection assayBlood filmPCR
LF_TAS_Learner_manual.indd Sec1:38 26/03/2014 11:50:59

MO
DU
LE 7
39VERIFICATION OF ELIMINATIONModule 7
Verifi cation of elimination
Learning objectives:
By the end of this module, learners should understand how to: • compiling and analysing all data on LF in the country • preparing a national dossier • submitting the dossier to the RPRG
Relevant sections of the 2011 WHO monitoring and evaluation manual3
• Section 9: Verifying the absence of transmission
LF_TAS_Learner_manual.indd Sec1:39 26/03/2014 11:50:59
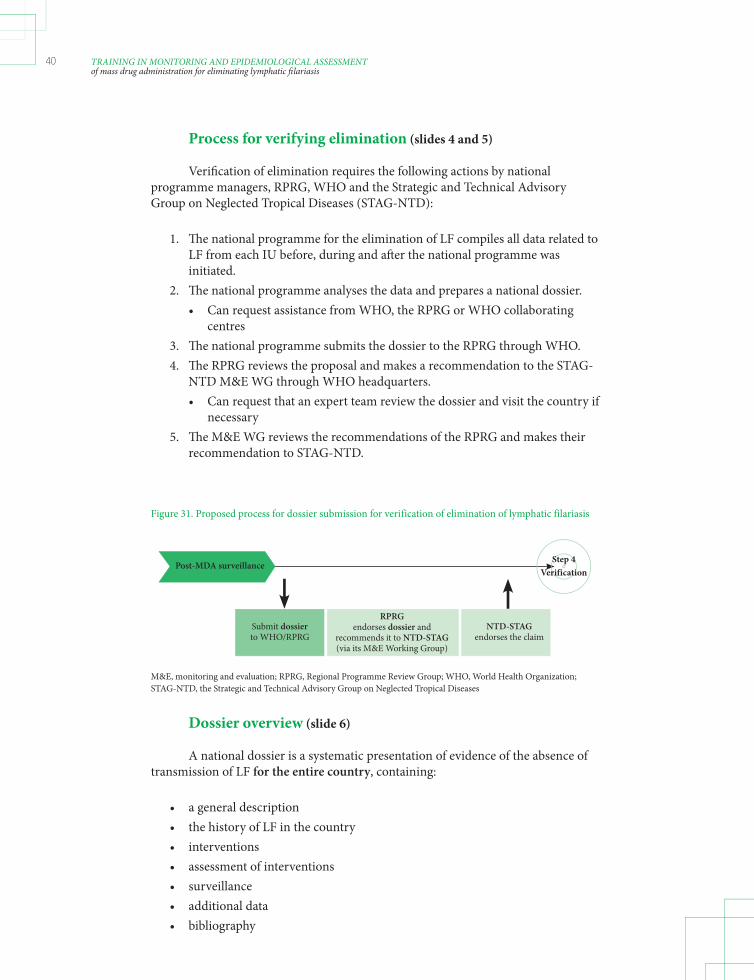
40 TRAINING IN MONITORING AND EPIDEMIOLOGICAL ASSESSMENTof mass drug administration for eliminating lymphatic fi lariasis
Process for verifying elimination (slides 4 and 5)
Verifi cation of elimination requires the following actions by national programme managers, RPRG, WHO and the Strategic and Technical Advisory Group on Neglected Tropical Diseases (STAG-NTD):
1. Th e national programme for the elimination of LF compiles all data related to LF from each IU before, during and aft er the national programme was initiated. 2. Th e national programme analyses the data and prepares a national dossier. • Can request assistance from WHO, the RPRG or WHO collaborating centres 3. Th e national programme submits the dossier to the RPRG through WHO. 4. Th e RPRG reviews the proposal and makes a recommendation to the STAG- NTD M&E WG through WHO headquarters. • Can request that an expert team review the dossier and visit the country if necessary 5. Th e M&E WG reviews the recommendations of the RPRG and makes their recommendation to STAG-NTD.
Dossier overview (slide 6)
A national dossier is a systematic presentation of evidence of the absence of transmission of LF for the entire country, containing:
• a general description • the history of LF in the country • interventions • assessment of interventions • surveillance • additional data • bibliography
Figure 31. Proposed process for dossier submission for verification of elimination of lymphatic filariasis
M&E, monitoring and evaluation; RPRG, Regional Programme Review Group; WHO, World Health Organization; STAG-NTD, the Strategic and Technical Advisory Group on Neglected Tropical Diseases
Step 4 Verification
Post-MDA surveillance
Submit dossier to WHO/RPRG
NTD-STAG endorses the claim
RPRG endorses dossier and
recommends it to NTD-STAG (via its M&E Working Group)
LF_TAS_Learner_manual.indd Sec1:40 26/03/2014 11:50:59

MO
DU
LE 7
41VERIFICATION OF ELIMINATIONModule 7
Spatial presentation of data is encouraged, including maps of endemic and
non-endemic areas and maps showing IUs and EUs.
General description (slides 7 and 8)
• Overall geographical and economic features of the country • Health system – capacity to detect cases of infection – capacity to provide treatment for clinical cases • Vectors – geographical distribution – feeding behaviour – density and competence • Immigration patterns to and from areas endemic for LF, including other countries • Occurrence of LF in neighbouring countries and the status of LF control or elimination in those countries
History of LF (slides 9 and 10)
• Detailed description – maps of past and present foci of transmission – review of data on prevalence and intensity of infection in humans – review of data on prevalence of infection in vector mosquitoes • Clinical fi larial disease – geographical distribution and prevalence – access to treatment for lymphoedema and hydrocoele • Non-endemic areas – how non-endemic areas were defi ned – what surveillance there was in those areas to ensure that they remained non-endemic
Interventions (slide 11)
Details of all measures to control or interrupt transmission: • screening, testing and treating positive cases • MDA • environmental and economic improvement • vector control
LF_TAS_Learner_manual.indd Sec1:41 26/03/2014 11:50:59

42 TRAINING IN MONITORING AND EPIDEMIOLOGICAL ASSESSMENTof mass drug administration for eliminating lymphatic fi lariasis
Assessment of interventions (slide 12)
• Detailed description of surveys and studies conducted to evaluate the impact of interventions – mapping surveys – sentinel and spot-check sites – surveys for stopping MDA: “C surveys”, child transmission surveys, TAS • Descriptions should include: – dates – sampling methods and procedures – diagnostic tests used – follow-up of positive test results
Surveillance (slides 13 and 14)
• A full review of any surveillance activities undertaken since stopping MDA and other interventions – post-MDA surveys, such as a TAS – other active surveillance activities – case reports of fi lariasis obtained through routine disease surveillance and other systems – complete follow-up for each positive case detected • Evidence that adequate sampling or surveillance was conducted in all previously endemic areas and in areas that were defi ned as non-endemic • Details of surveys done in cross-border areas and among immigrants from fi lariasis-endemic areas • Demonstration that any positive cases detected aft er MDA represented isolated events not traceable to an area of active transmission
Additional data (slide 15)
Any other data to support absence of transmission, including other sources of information. Th is need not be in a separate section.
Bibliography (slide 16)
Articles and reports on lymphatic fi lariasis, its geographical distribution and interventions: • ministry of health records • published studies • academic theses and dissertations
LF_TAS_Learner_manual.indd Sec1:42 26/03/2014 11:50:59

Timing (slide 17)
Th e dossier should be submitted only aft er all EUs have completed post-MDA surveillance. However, data collection and archiving should start early. Do not wait until interventions in all EUs are complete to start collecting and archiving data.
LF_TAS_Learner_manual.indd Sec1:43 26/03/2014 11:50:59

44 TRAINING IN MONITORING AND EPIDEMIOLOGICAL ASSESSMENTof mass drug administration for eliminating lymphatic fi lariasis
PRACTICAL ASPECTS OF TRANSMISSION ASSESSMENT SURVEYS
© B
rian
Chu
LF_TAS_Learner_manual.indd Sec1:44 26/03/2014 11:50:59

MO
DU
LE 8
45SURVEY SAMPLE BUILDERModule 8
Survey sample builder
Learning objectives:
By the end of this module, learners should understand how to: • how to use the survey sample builder to: – determine the design of the survey – select random clusters and children or households • the protocol for TAS
Relevant sections of the 2011 WHO monitoring and evaluation manual3
• Annex 5: Detailed protocol for a transmission assessment survey
Bria
n Ch
u
LF_TAS_Learner_manual.indd Sec1:45 26/03/2014 11:51:00

46 TRAINING IN MONITORING AND EPIDEMIOLOGICAL ASSESSMENTof mass drug administration for eliminating lymphatic fi lariasis
Survey sample builder (slide 4)
Th e ‘survey sample builder’6 is a Microsoft Excel-based tool that can be used to automate calculations for determining the appropriate survey design and to facilitate random selection of clusters and children or households from a list of randomized numbers (Figure 32). Use of the survey sample builder also reduces the risk for selection bias, as it ensures equal probability for selecting individuals eligible for sampling.
Preparation before sample selection (slides 5 and 6)
School survey
Communicate with the ministry of education to obtain a comprehensive list of all primary schools in the defi ned evaluation unit.
• Ideally, the list of schools will be ordered according to geographical proximity rather than alphabetically. Th is will allow better geographical representation of the selected schools in the EU.
Obtain an average non-response rate for the schools in the EU, if available.
• Th e non-response rate gives an estimate of the non-participant rate and should include school absenteeism, refusals and inability to collect suffi cient blood for diagnostic testing. • If the non-response rate is unknown, it is recommended to estimate 10-15% non-response.
Figure 32. Steps in determining a survey design and random sample selection with the survey sample builder
School
Cluster-based sampling Systematic sampling Census
Evaluation unit
Community
Cluster-based sampling Systematic sampling Census
Sample size and critical cut-off
School
Child Child Household Household
Enumeration area
Survey design
Random selection
6 Th e latest version can be downloaded at http://www.ntdsupport.org/resources/
LF_TAS_Learner_manual.indd Sec1:46 26/03/2014 11:51:00
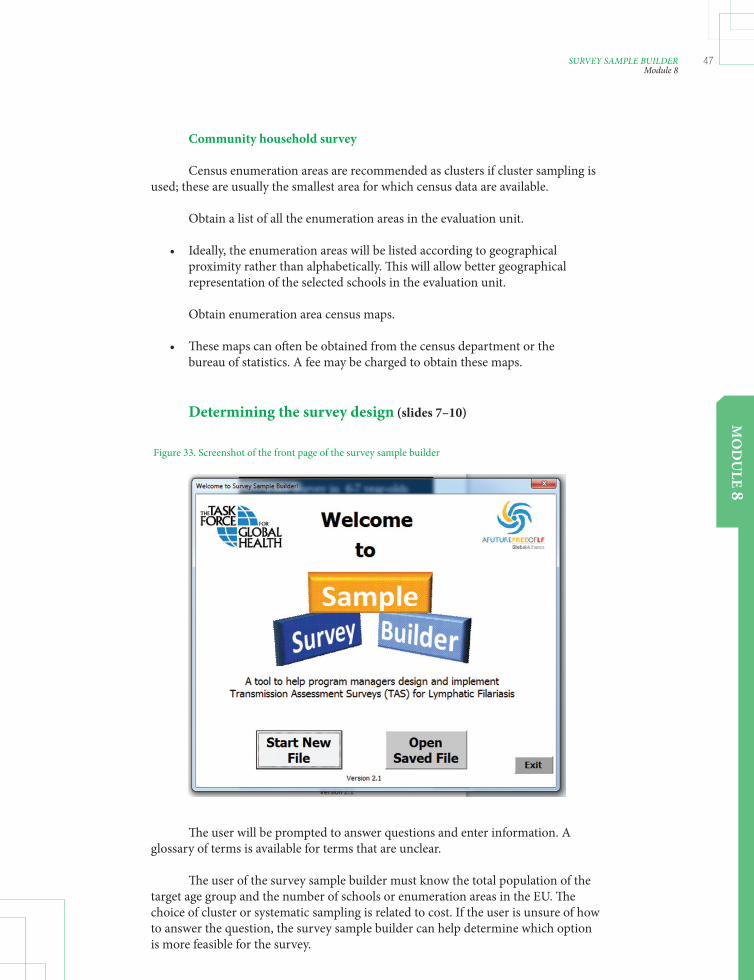
MO
DU
LE 8
47SURVEY SAMPLE BUILDERModule 8
Community household survey
Census enumeration areas are recommended as clusters if cluster sampling is used; these are usually the smallest area for which census data are available.
Obtain a list of all the enumeration areas in the evaluation unit.
• Ideally, the enumeration areas will be listed according to geographical proximity rather than alphabetically. Th is will allow better geographical representation of the selected schools in the evaluation unit.
Obtain enumeration area census maps.
• Th ese maps can oft en be obtained from the census department or the bureau of statistics. A fee may be charged to obtain these maps.
Determining the survey design (slides 7–10)
Th e user will be prompted to answer questions and enter information. A glossary of terms is available for terms that are unclear.
Th e user of the survey sample builder must know the total population of the target age group and the number of schools or enumeration areas in the EU. Th e choice of cluster or systematic sampling is related to cost. If the user is unsure of how to answer the question, the survey sample builder can help determine which option is more feasible for the survey.
Figure 33. Screenshot of the front page of the survey sample builder
LF_TAS_Learner_manual.indd Sec1:47 26/03/2014 11:51:00

48 TRAINING IN MONITORING AND EPIDEMIOLOGICAL ASSESSMENTof mass drug administration for eliminating lymphatic fi lariasis
Once this information has been entered, the survey sample builder recommends a survey design, including the target sample size, the number of clusters needed, the sampling interval and the critical cut-off .
Figure 34. Screenshot of the school survey data entry page
Figure 35. Screenshot of the survey design result page
Survey sampling method determined by data entered into
programme
LF_TAS_Learner_manual.indd Sec1:48 26/03/2014 11:51:01

MO
DU
LE 8
49SURVEY SAMPLE BUILDERModule 8
Selecting randomized clusters and children or households (slide 11)
Depending on the survey design, clusters (schools or enumeration areas) and children or households should be selected randomly, except when census sampling is used. Th e survey sample builder facilitates selection by generating a list of randomized numbers.
In community sampling, once the households are selected, all the children in the target age group will be tested. In census sampling, all the children in the enumeration area will be tested (see module 5).
Selecting randomized clusters (slides 12–14)
Cluster sampling requires selection of a minimum of 30 schools or enumeration areas from which children are selected.
1. Obtain a comprehensive list of all primary sampling units (i.e. schools, enumeration areas) in the EU. 2. Number them, preferably in order of geographical proximity as opposed to alphabetical order in order to achieve better geographical distribution. 3. Once all sampling units have been assigned a number, click the “Randomize” button. 4. Once the survey design has been determined, a list of random numbers (10, 23, 36, 49 … in the example in Figure 36) is generated by the survey sample builder. Select schools or enumeration areas in the list according to these random numbers (i.e. schools numbered 10, 23, 36, 49 …).
Figure 36. Screenshot of the cluster selection page
LF_TAS_Learner_manual.indd Sec1:49 26/03/2014 11:51:01

50 TRAINING IN MONITORING AND EPIDEMIOLOGICAL ASSESSMENTof mass drug administration for eliminating lymphatic fi lariasis
It is recommended that 5–10 additional clusters be selected for use if the sample size falls considerably short of the target aft er all the clusters have been surveyed. Th e additional clusters should be selected from a list of all remaining clusters by the same random selection process. Th e survey sample builder allows selection of additional clusters.
Selecting randomized children or households (slides 15 and 16)
Aft er choosing randomized cluster or systematic sampling, the next step is random selection of children (in school-based surveys) or households (in community-based surveys), as, in many cases, not every child in a cluster will be tested.
Th e survey sample builder calculates the appropriate sampling interval to use and also calculates a random starting number and sampling interval (inverse of the sampling fraction) to generate two numbered lists to guide selection of schoolchildren or households. Th e lists are used to select the children to be tested in a school survey and the houses to be sampled in a household survey.
Th e survey team randomly selects one of the two lists. In the example in Figure 37, the team chose list A; therefore, the fi rst, third, fourth, fi ft h ... house on the list will be selected.
Figure 37. Random household selection from two lists
List B
1 1 3 2 4 4 5 5 7 6 8 8 9 9 11 10 12 12 13 13 15 14 16 16 ... ...
Lists corresponding to the houses selected for sampling out of all houses in the enumeration area
The random number used to generate these lists is0.775367533
List A
1 2 3 4 5 6
12 11 10 9 8 7
Every 6–7-year-old child in the house should be tested. Th e same list should be used throughout the survey.
Sampling intervals are also listed in tables A.5.1 and A.5.2 in the 2011 monitoring and evaluation manual (pp. 73–74).
LF_TAS_Learner_manual.indd Sec1:50 26/03/2014 11:51:01

MO
DU
LE 8
51SURVEY SAMPLE BUILDERModule 8
Example 1 (slides 17–20)
Th e following characteristics of the EU were entered into the survey sample builder to determine the appropriate design:
• Net school enrolment ratio: 78% • Primary vector: Culex • Population of students in target grades: 18 945 • Total number of primary schools: 386 • Estimated non-response rate: 15%
Th e survey design selected by the survey sample builder is shown in Figure 38
In this example, you will select 38 primary schools and test all children in the target grades in each selected school. If the total number of positive cases is 18 or fewer, the EU ‘passes’ the TAS. If the total number of positive cases is greater than 18, the EU ‘fails’ the TAS.
Figure 38. Screenshot of the survey design result page for example 1
LF_TAS_Learner_manual.indd Sec1:51 26/03/2014 11:51:01
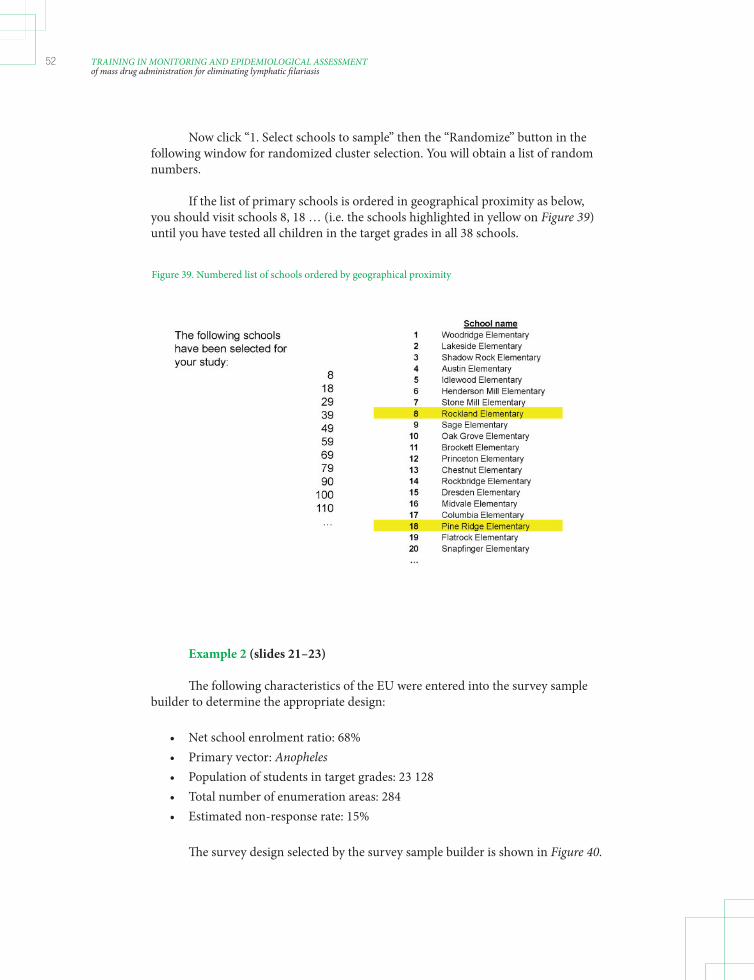
52 TRAINING IN MONITORING AND EPIDEMIOLOGICAL ASSESSMENTof mass drug administration for eliminating lymphatic fi lariasis
Now click “1. Select schools to sample” then the “Randomize” button in the following window for randomized cluster selection. You will obtain a list of random numbers.
If the list of primary schools is ordered in geographical proximity as below, you should visit schools 8, 18 … (i.e. the schools highlighted in yellow on Figure 39) until you have tested all children in the target grades in all 38 schools.
Example 2 (slides 21–23)
Th e following characteristics of the EU were entered into the survey sample builder to determine the appropriate design:
• Net school enrolment ratio: 68% • Primary vector: Anopheles • Population of students in target grades: 23 128 • Total number of enumeration areas: 284 • Estimated non-response rate: 15%
Th e survey design selected by the survey sample builder is shown in Figure 40.
Figure 39. Numbered list of schools ordered by geographical proximity
LF_TAS_Learner_manual.indd Sec1:52 26/03/2014 11:51:01

MO
DU
LE 8
53SURVEY SAMPLE BUILDERModule 8
Figure 40. Screenshot of the survey design result page for example 2
In this example, you will select 30 enumeration areas as the cluster in the same way you have selected schools in Example 1.
If 30 enumeration areas are randomly selected with the survey sample builder, the next step is to randomly select households in each selected enumeration area. Clicking the button “2. Generate Lists A & B” will generate two lists of random numbers (Figure 41). Th e survey team will randomly select list A or B (e.g. by fl ipping a coin). In this example, the team chose list A; therefore, the fi rst, third, fourth, fi ft h… households along the chosen route will be tested in each selected enumeration area. You will test all children in the target grades in each selected household. If the total number of positive cases is 18 or less, the EU ‘passes’ the TAS. If the total number of positive cases is above 18, the EU ‘fails’ the TAS.
LF_TAS_Learner_manual.indd Sec1:53 26/03/2014 11:51:02
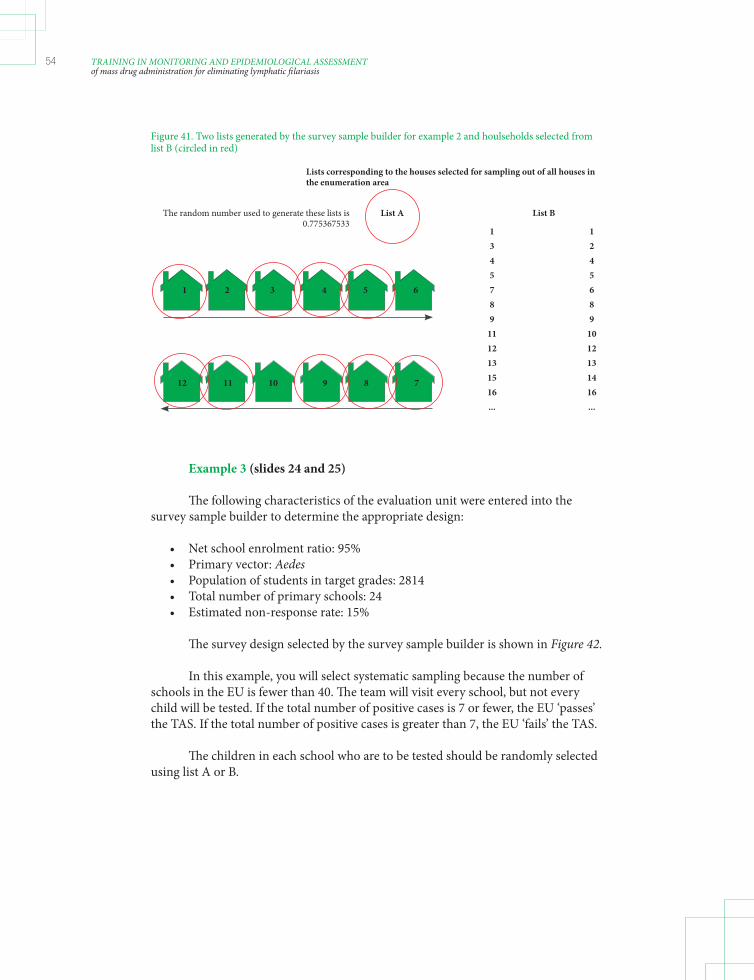
54 TRAINING IN MONITORING AND EPIDEMIOLOGICAL ASSESSMENTof mass drug administration for eliminating lymphatic fi lariasis
Figure 41. Two lists generated by the survey sample builder for example 2 and houlseholds selected from list B (circled in red)
List B
1 1 3 2 4 4 5 5 7 6 8 8 9 9 11 10 12 12 13 13 15 14 16 16 ... ...
Lists corresponding to the houses selected for sampling out of all houses in the enumeration area
The random number used to generate these lists is0.775367533
List A
1 2 3 4 5 6
12 11 10 9 8 7
Example 3 (slides 24 and 25)
Th e following characteristics of the evaluation unit were entered into the survey sample builder to determine the appropriate design:
• Net school enrolment ratio: 95% • Primary vector: Aedes • Population of students in target grades: 2814 • Total number of primary schools: 24 • Estimated non-response rate: 15%
Th e survey design selected by the survey sample builder is shown in Figure 42.
In this example, you will select systematic sampling because the number of schools in the EU is fewer than 40. Th e team will visit every school, but not every child will be tested. If the total number of positive cases is 7 or fewer, the EU ‘passes’ the TAS. If the total number of positive cases is greater than 7, the EU ‘fails’ the TAS.
Th e children in each school who are to be tested should be randomly selected
using list A or B.
LF_TAS_Learner_manual.indd Sec1:54 26/03/2014 11:51:02

MO
DU
LE 8
55SURVEY SAMPLE BUILDERModule 8
Figure 42 Screenshots of the survey design result page for example 3
Protocol for TAS (slide 26)
Th e protocol for the TAS is as follows:
• Defi ne EU. • Determine survey site and sampling strategy. • Calculate sample size. • Prepare lists of – schools for a school-based survey – enumeration areas for a community-based survey • Test selected children with – ICTs in areas endemic for W. bancroft i – Brugia RapidTM tests in areas endemic for Brugia spp. • Interpret the results on the basis of the critical cut-off .
LF_TAS_Learner_manual.indd Sec1:55 26/03/2014 11:51:02

56 TRAINING IN MONITORING AND EPIDEMIOLOGICAL ASSESSMENTof mass drug administration for eliminating lymphatic fi lariasis
Exercise (Slide 27)
Using population data on the EU(s) in module 3, you will use the survey sample builder to:
• defi ne the appropriate survey design • defi ne the sample size needed • defi ne the number of sites for the survey • defi ne the sampling fraction • defi ne the sampling interval • select the sites to include (if necessary) • generate two lists (if necessary)
LF_TAS_Learner_manual.indd Sec1:56 26/03/2014 11:51:02

MO
DU
LE 9
57TIMETABLE, BUDGET AND ADMINISTRATIONModule 9
Timetable, budget and administration
Learning objectives:
By the end of this module, learners should understand how to: • preparing a timetable • preparing a budget • procuring supplies • obtaining ethical clearance • obtaining informed consent • preparing public notifi cation • preparing data collection and management
Relevant sections of the 2011 WHO monitoring and evaluation manual3
None
LF_TAS_Learner_manual.indd Sec1:57 26/03/2014 11:51:02

58 TRAINING IN MONITORING AND EPIDEMIOLOGICAL ASSESSMENTof mass drug administration for eliminating lymphatic fi lariasis
Administrative planning and preparation (slide 3)
Once the eligibility of an EU for a TAS is confi rmed, national programme managers should initiate administrative planning and preparation for the survey, including all the learning objectives of this module.
Preparing a timetable (slides 4 and 5)
Th e time required for planning and conducting a TAS depends largely on how long it takes to complete individual components, such as determining eligibility for the survey, obtaining ethical clearance and communicating with the ministry of education. Ample time should be allotted for collecting necessary approvals and information.
On average, the time required to conduct a TAS is 2–4 weeks for school-based surveys and 3–6 weeks for community-based surveys.
Th e table in Annex 7 can be used to construct a timetable for conducting a TAS. Th e checklist of activities to consider in planning in Annex 8 can also be used.
Preparing a budget (slides 6–8)
A detailed budget must be prepared before a TAS to ensure that it will be conducted as planned. Poor budget planning may result in an incomplete survey, with implications for the resources available for future activities.
Th e main cost categories to be taken into account are:
• Personnel • Travel and transport • Supplies – Diagnostic tests – Consumables – Shipping and customs fees • Stationery and other offi ce supplies • Communication – Telephone – Internet – Photocopies • Other – Ethical approval – Maps – Allowances for village leaders and teachers
Th e budget template shown in Annex 9 can be used to estimate the required budget.
LF_TAS_Learner_manual.indd Sec1:58 26/03/2014 11:51:02
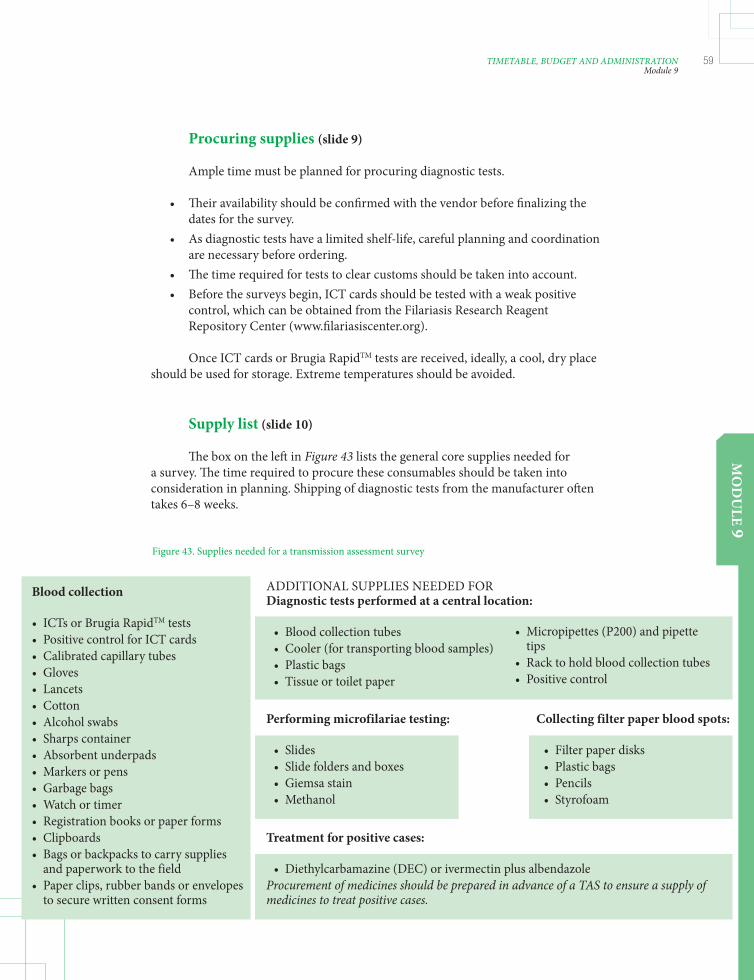
MO
DU
LE 9
59TIMETABLE, BUDGET AND ADMINISTRATIONModule 9
Procuring supplies (slide 9)
Ample time must be planned for procuring diagnostic tests.
• Th eir availability should be confi rmed with the vendor before fi nalizing the dates for the survey. • As diagnostic tests have a limited shelf-life, careful planning and coordination are necessary before ordering. • Th e time required for tests to clear customs should be taken into account. • Before the surveys begin, ICT cards should be tested with a weak positive control, which can be obtained from the Filariasis Research Reagent Repository Center (www.fi lariasiscenter.org).
Once ICT cards or Brugia RapidTM tests are received, ideally, a cool, dry place should be used for storage. Extreme temperatures should be avoided.
Supply list (slide 10)
Th e box on the left in Figure 43 lists the general core supplies needed for a survey. Th e time required to procure these consumables should be taken into consideration in planning. Shipping of diagnostic tests from the manufacturer oft en takes 6–8 weeks.
Figure 43. Supplies needed for a transmission assessment survey
Blood collection • ICTs or Brugia RapidTM tests • Positive control for ICT cards • Calibrated capillary tubes • Gloves • Lancets • Cotton • Alcohol swabs • Sharps container • Absorbent underpads • Markers or pens • Garbage bags • Watch or timer • Registration books or paper forms • Clipboards • Bags or backpacks to carry supplies and paperwork to the field • Paper clips, rubber bands or envelopes to secure written consent forms
ADDITIONAL SUPPLIES NEEDED FOR Diagnostic tests performed at a central location: • Blood collection tubes • Cooler (for transporting blood samples) • Plastic bags • Tissue or toilet paper
• Micropipettes (P200) and pipette tips • Rack to hold blood collection tubes • Positive control
Performing microfilariae testing: • Slides • Slide folders and boxes • Giemsa stain • Methanol
Collecting filter paper blood spots: • Filter paper disks • Plastic bags • Pencils • Styrofoam
Treatment for positive cases: • Diethylcarbamazine (DEC) or ivermectin plus albendazoleProcurement of medicines should be prepared in advance of a TAS to ensure a supply of medicines to treat positive cases.
LF_TAS_Learner_manual.indd Sec1:59 26/03/2014 11:51:02

60 TRAINING IN MONITORING AND EPIDEMIOLOGICAL ASSESSMENTof mass drug administration for eliminating lymphatic fi lariasis
Ethical clearance (slide 11)
Requirements for ethical clearance vary from country to country. Preparations for obtaining the necessary clearance should be made well before the start of a survey. In most countries, a TAS is considered to be an evaluation of a public health programme and is not classifi ed as research; consequently, it does not require a full review by an ethics committee.
Informed consent (slide 12)
Requirements vary by country. Preparations for obtaining the necessary consent should be made well before the start of the survey.
Th e test procedures used in a transmission assessment survey are considered to carry minimal risk. If written consent or assent is required for school surveys, forms should be sent in advance to allow ample time for the return of signed forms. If only a fraction of children are to be sampled in a school survey, the children should be selected and consent for the testing obtained in advance
Public notifi cation (slide 13)
Once the schools or enumeration areas have been selected for the TAS, the appropriate offi cials should be notifi ed about visits well before the start of the survey.
Preparation of data collection and management (slides 14 and 15)
Appropriate data management should be determined in advance of the survey. A WHO Eligibility and Reporting Form is available to standardize collection of the data needed to plan and implement a TAS. An electronic data system for reporting from the fi eld to the national level is also available.
Th e necessary precautions should be taken to manage data properly to ensure that all ethical requirements are maintained. Patient identities and test results should be made available only to authorized personnel.
An example of a data collection form for a school survey is provided in Annex 10.
Exercise (slide 16)
In this exercise, you will estimate a timetable and budget for a TAS in the EU(s) defi ned in module 3, taking into consideration the survey design generated with the survey sample builder.
LF_TAS_Learner_manual.indd Sec1:60 26/03/2014 11:51:02

MO
DU
LE 10
61FIELD WORKModule 10
Field work
Learning objectives:
By the end of this module, learners should understand how to: • fi eld team organization • specimen collection and testing in school-based surveys • specimen collection and testing in community-based surveys
Relevant sections of the 2011 WHO monitoring and evaluation manual3
• Annex 5. Detailed protocol for transmission assessment surveys
LF_TAS_Learner_manual.indd Sec1:61 26/03/2014 11:51:02

62 TRAINING IN MONITORING AND EPIDEMIOLOGICAL ASSESSMENTof mass drug administration for eliminating lymphatic fi lariasis
Field team organization (slides 4 and 5)
Each fi eld survey team should consist of at least three members (Figure 44):
• one responsible for registering children and managing supplies • one phlebotomist and test preparer • one test reader
Programme managers should organize fi eld teams and designate roles before the actual fi eld-work. Holding a training session on the survey design, blood sampling and diagnostic test procedures is highly recommended.
School-based surveys (slides 6–10)
Th is section outlines a suggested approach for specimen collection and testing in schools. Situations are diff erent in each country, and the appropriate procedure should be determined.
1. Ensure that proper consent has been obtained. If written consent is required, forms should be sent out well in advance of the fi eld activities to ensure maximum participation. In order to ensure a high rate of return of signed consent forms, clear, concise messages about the survey and the consent forms should be disseminated well beforehand. 2. Th e fi eld team will arrive at a designated school and work with teachers, the headmaster or headmistress or school offi cials to gather all targeted (usually fi rst- and second-year) children. 3. If not all children in the targeted grades are to be sampled, fl ip a coin to decide whether list A or list B will be used. Th is is necessary only if the sampling interval ≠ 1(i.e. not every child will be tested). Children should be lined up in sequence to be counted (Figure 45).
Figure 44. Field team organization for a transmission assessment survey
LF_TAS_Learner_manual.indd Sec1:62 26/03/2014 11:51:02

MO
DU
LE 10
63FIELD WORKModule 10
4. Select children according to the numbers on the list, and continue until the next number on the list is higher than the total number of pupils in the targeted grades at the school. If the sampling interval = 1, every child in attendance should be tested.
5. Th e team should collect demographic data and blood specimens from the selected children. In most instances, diagnostic tests will be conducted and read in the fi eld from capillary tubes. Alternatively, blood can be collected into blood collection tubes, and tests can be conducted at a central location aft er all the children have been sampled. If readings are done in the evening or at night, an adequate light source is essential to obtain an accurate result. 6. Arrangements should be made to treat all children found to be positive by the ICT or Brugia RapidTM tests. 7. Teams should keep a record of the total numbers of children in the targeted grades who are in attendance and who are absent from each school on the day of the survey. Th ese numbers should be compared with the numbers enrolled and the predetermined non-response rate to determine whether additional clusters will be needed as the survey progresses. If the non-response rate is lower than expected, suffi cient supplies should be planned to complete the survey. 8. Repeat the steps for each chosen school and additional schools (if necessary) to satisfy the target sample size. 9. Even if the number of positive cases exceeds the critical cut-off point, the survey team should continue to collect information on every child in the sample to provide baseline data for interpretation of future results.
Community household surveys (slides 11–15)
If the net primary school enrolment ratio in the EU is < 75%, community-based household surveys should be conducted. Generally, community-based surveys are more expensive and time-consuming than school surveys; a community-based survey can take 3–6 weeks to conduct.
Figure 45. Disposition of children for testing in a school-based survey
List B
1 1 3 2 4 4 5 5 7 6 ... ...
List A
1 2 3 4 5 6 7
LF_TAS_Learner_manual.indd Sec1:63 26/03/2014 11:51:02

64 TRAINING IN MONITORING AND EPIDEMIOLOGICAL ASSESSMENTof mass drug administration for eliminating lymphatic fi lariasis
Th is section outlines a suggested approach of specimen collection and testing in the community setting (Figure 46). Situations will be diff erent in each country, and it will be necessary to determine what best fi ts the situation.
1. At each selected enumeration area or community, teams should work with village offi cials and community health workers to estimate the number of households and plan a walking route to take them to each household. If available, sketch maps of the enumeration area can be used. Th e timing of the survey should be carefully planned so that children are likely to be at home (e.g. school breaks, evenings). Th e community should be sensitized well in advance of the start of the survey.
2. Th e team should collect demographic data and blood specimens from all 6–7-year-old children in each selected household. It is recommended to collect blood samples in tubes for diagnostic testing in a laboratory or another controlled environment. Th is reduces the time between sample collection while moving from house to house and lowers the risk for reading error. 3. Arrangements should be made to treat people found to be positive by diagnostic tests. 4. Repeat all steps for each selected enumeration area and additional areas (if necessary) to satisfy the target sample size. 5. Even if the number of positive cases exceeds the critical cut-off point, the survey team should continue to collect information on everyone in the sample.
Figure 46. Suggested steps in a community-based household survey
List A 1 83 104 126 15
Step 1: Enumerate houses. Houses can be enumerated and selected before sample collection.Step 2: Visit houses on list A or list B. Selection continues until the next number on the list is higher than the total number of households in the enumeration areaStep 3: Test all 6–7-year-old children in the selected houses. If there are no 6–7-year-old children in the selected house, the team proceeds to the next house numbered on the list.
1 2 3
LF_TAS_Learner_manual.indd Sec1:64 26/03/2014 11:51:02

MO
DU
LE 10
65FIELD WORKModule 10
Data management and analysis (slide 16)
All demographic, sample, test and result data should be collected and recorded in an appropriate database management system.
Critical cut-off values are used to determine whether the level of infection has been reduced to a level at which transmission is probably not sustainable. Th e results of the TAS contribute to a decision to stop or continue MDA.
If a census has been used, the overall prevalence of infection will be calculated to guide the transmission assessment.
Non-respondents (slide 17)
Th e maximum acceptable non-response rate is 15%. At least one attempt should be made to revisit schools or houses to fi nd non-respondents. In cluster sampling, if follow-up still results in less than the required sample size, additional clusters can be added, which can be selected before a survey with the survey sample builder. Th ese clusters should be used only aft er it becomes clear that the required sample size will not be reached.
Reminder: Sample size includes only children for whom valid test results are available; it does not include absentees, refusals or children with invalid test results.
Role-playing exercise (slide 18)
During this role-playing exercise, you will set up a mock fi eld setting, taking into account:
• the number of personnel needed for the activities • the steps to take on arrival at the school or household • the steps to take to set up a blood collection station at the school or household • how to manage the selection of children (if necessary)
LF_TAS_Learner_manual.indd Sec1:65 26/03/2014 11:51:03

66 TRAINING IN MONITORING AND EPIDEMIOLOGICAL ASSESSMENTof mass drug administration for eliminating lymphatic fi lariasis
LF_TAS_Learner_manual.indd Sec1:66 26/03/2014 11:51:03

67ANNEXES
Annexes
1. Requirements for conducting a transmission assessment survey (TAS) include:
a. At least ______ rounds of eff ective mass drug administration (MDA) b. Epidemiological drug coverage of at least ______% during each round of MDA c. Sentinel site: Microfi lariaemia prevalence of ______% or antigenaemia prevalence of _____% d. Spot-check site: Microfi lariaemia prevalence of ______% or antigenaemia prevalence of _____%
2. A TAS should be conducted at least ___ months aft er the most recent round of eff ective MDA.
3. True or false:
a. An evaluation unit (EU) must be the same as a MDA implementation unit (IU). ________ b. Th e total population of an EU should not exceed 2 million. __________
Annex 1. Test to be taken by participants before and aft er training
LF_TAS_Learner_manual.indd Sec1:67 26/03/2014 11:51:03
68 TRAINING IN MONITORING AND EPIDEMIOLOGICAL ASSESSMENTof mass drug administration for eliminating lymphatic fi lariasis
4. Th e diagnostic test used for TAS in areas endemic for:
a. W. bancroft i is _______________ b. Brugia spp. is ________________
5. What is the target age group for a TAS, and what is the rationale for selecting this age group? _________________________________________________________________ _________________________________________________________________ ________________________
6. Th e net primary school enrolment ratio must be at least ______% for a TAS to be conducted in schools.
7. Identify the type of sampling strategy for:
a. selecting children to test in all schools per enumeration area in an EU at a fi xed interval: _____________ sampling b. fi rst randomly selecting clusters (schools per enumeration area) then systematically selecting children to test only in selected clusters: ___________ sampling c. no sampling required; test all children in target age range: _____________
8. True or false: Th e choice of sampling strategy depends on the total population in the target age range and the total number of clusters in the EU. __________
9. In a TAS, the threshold of infection prevalence below which transmission is probably no longer sustainable even in the absence of MDA is called the _____________.
10. Th e survey sample builder generated the following list of randomized numbers for clusters 2, 6, 8, 9 and 10. Circle the schools to visit on the list, which is ordered according to geographical proximity.
1. Austin Elementary 2. Dunwoody Elementary 3. Henderson Mill Elementary 4. Oakcliff Elementary 5. Jolly Elementary 6. Columbia Elementary 7. Ashford Park Elementary 8. Dresden Elementary 9. Stone Mill Elementary 10. Snapfi nger Elementary
LF_TAS_Learner_manual.indd Sec1:68 26/03/2014 11:51:03
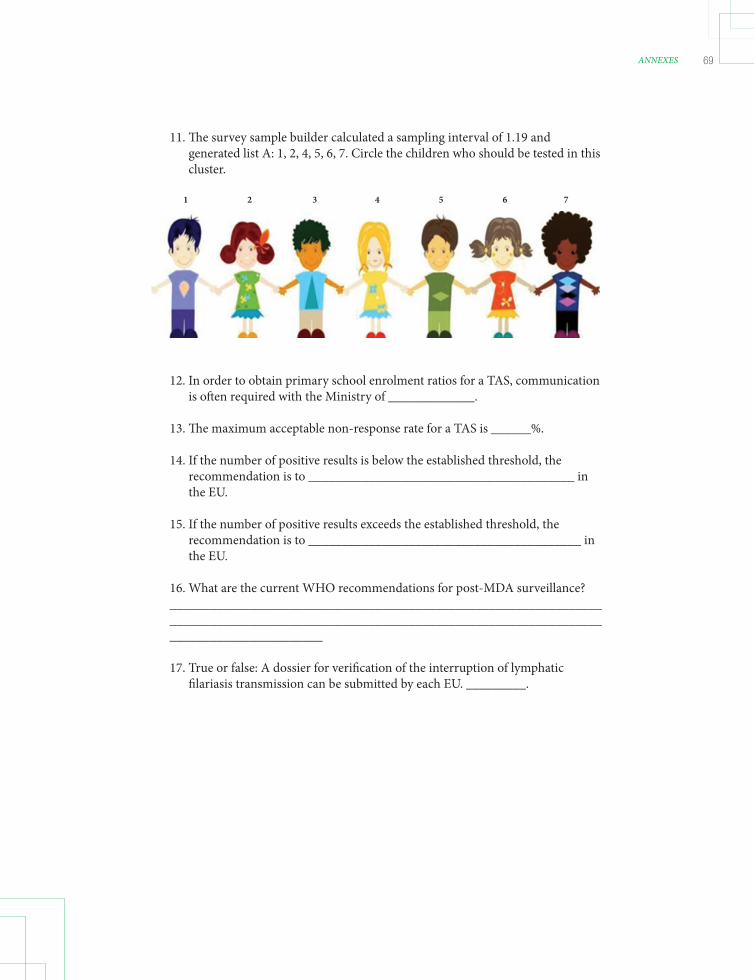
69ANNEXES
11. Th e survey sample builder calculated a sampling interval of 1.19 and generated list A: 1, 2, 4, 5, 6, 7. Circle the children who should be tested in this cluster.
1 2 3 4 5 6 7
12. In order to obtain primary school enrolment ratios for a TAS, communication is oft en required with the Ministry of _____________.
13. Th e maximum acceptable non-response rate for a TAS is ______%.
14. If the number of positive results is below the established threshold, the recommendation is to ________________________________________ in the EU.
15. If the number of positive results exceeds the established threshold, the recommendation is to _________________________________________ in the EU.
16. What are the current WHO recommendations for post-MDA surveillance? _________________________________________________________________ _________________________________________________________________ _______________________
17. True or false: A dossier for verifi cation of the interruption of lymphatic fi lariasis transmission can be submitted by each EU. _________.
LF_TAS_Learner_manual.indd Sec1:69 26/03/2014 11:51:03

70 TRAINING IN MONITORING AND EPIDEMIOLOGICAL ASSESSMENTof mass drug administration for eliminating lymphatic fi lariasis
Annex 2. Changes in editions of Moni-toring and epidemiological assessment of mass drug administration—A manual for national elimination programmes between 2005 and 2011
Table A.4.2 Table of random numbers
Item 2005 2011
Numbers of sentinel and Two sites each per IU containing At least one site each per IU containing spot-check sites populations of < 500 people each populations of < 500 people each (in order to collect at least 300 samples each)
Data collection times at sentinel Baseline Baseline and spot-check sites Before third MDA Before fourth MDA (optional) Before fifth MDA Before sixth MDA (a sixth MDA will likely be conducted in any case)
Measurement of clinical Included in section on sentinel sites Deleted manifestations
Geographical area for a transmission Implementation unit (IU) Evaluation unit (EU) assessment survey (TAS)
Other criteria for implementing Prevalence of Mf is < 1% at sentinel Prevalence of Mf is < 1% at sentinel and a TAS and spot-check sites before fifth MDA spot-check sites after fifth MDA, with In areas where Wuchereria bancrofti < 65% coverage of total population in is endemic, no children aged 2–4 years each MDA test Ag-positive at sentinel and spot- check sites Prevalence of Mf is < 1% and no children aged 2–4 years test Ag-positive at 5–10 additional spot-check sites No Ag-positives in community-based LQAS cluster survey of 300 children aged 2–4 years in high-risk areas
Design of survey Lot quality assurance sampling survey If the net primary school enrolment ratio of 3000 school entrants in IU is ≥ 75%, cluster survey or systematic sampling with LQAS analysis in schools If the net primary school enrolment ratio is < 75%, cluster survey or systematic sampling with LQAS in community
LF_TAS_Learner_manual.indd Sec1:70 26/03/2014 11:51:03
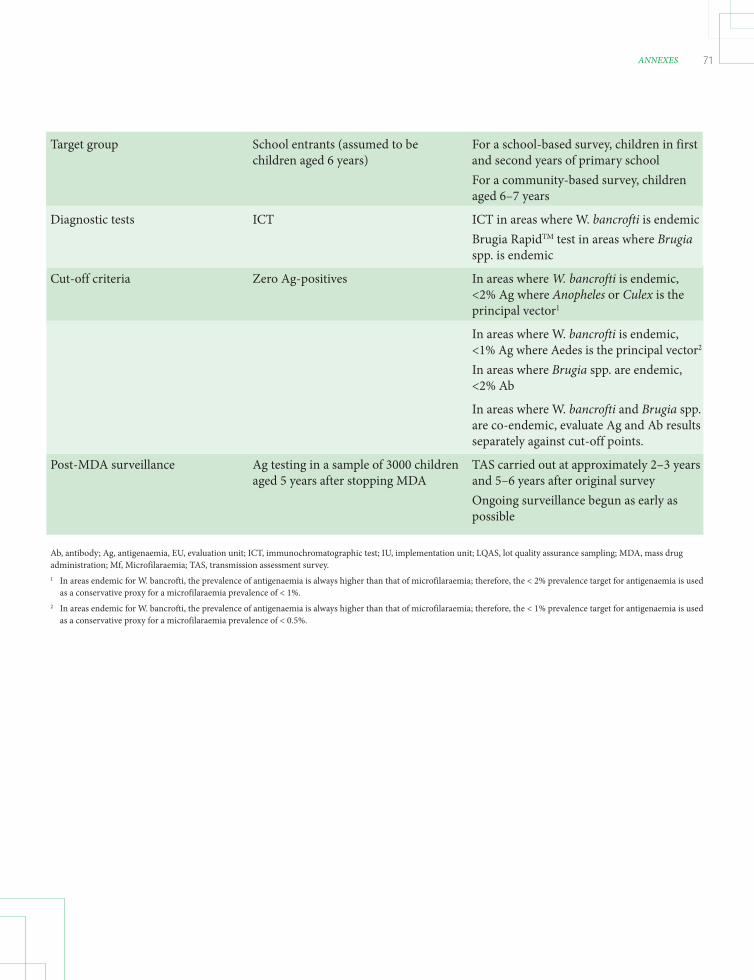
71ANNEXES
Target group School entrants (assumed to be For a school-based survey, children in first children aged 6 years) and second years of primary school For a community-based survey, children aged 6–7 years
Diagnostic tests ICT ICT in areas where W. bancrofti is endemic Brugia RapidTM test in areas where Brugia spp. is endemic
Cut-off criteria Zero Ag-positives In areas where W. bancrofti is endemic, <2% Ag where Anopheles or Culex is the principal vector1
In areas where W. bancrofti is endemic, <1% Ag where Aedes is the principal vector2
In areas where Brugia spp. are endemic, <2% Ab
In areas where W. bancrofti and Brugia spp. are co-endemic, evaluate Ag and Ab results separately against cut-off points.
Post-MDA surveillance Ag testing in a sample of 3000 children TAS carried out at approximately 2–3 years aged 5 years after stopping MDA and 5–6 years after original survey Ongoing surveillance begun as early as possible
Ab, antibody; Ag, antigenaemia, EU, evaluation unit; ICT, immunochromatographic test; IU, implementation unit; LQAS, lot quality assurance sampling; MDA, mass drug administration; Mf, Microfilaraemia; TAS, transmission assessment survey.1 In areas endemic for W. bancrofti, the prevalence of antigenaemia is always higher than that of microfilaraemia; therefore, the < 2% prevalence target for antigenaemia is used as a conservative proxy for a microfilaraemia prevalence of < 1%.2 In areas endemic for W. bancrofti, the prevalence of antigenaemia is always higher than that of microfilaraemia; therefore, the < 1% prevalence target for antigenaemia is used as a conservative proxy for a microfilaraemia prevalence of < 0.5%.
LF_TAS_Learner_manual.indd Sec1:71 26/03/2014 11:51:03

72 TRAINING IN MONITORING AND EPIDEMIOLOGICAL ASSESSMENTof mass drug administration for eliminating lymphatic fi lariasis
Annex 3. WHO TAS Eligibility and Reporting Form
Structure of the form (worksheets):INTRO
ELIGIBILITY
SURVEY DESIGN
RESULTS
Country and EU data
Burkina Faso2013
Defra-Lena-KV3
430,647 6,000
W. bancroftiAnophelesStop MDA
WHO country officeWHO regional officeWHO headquarters
TAS Eligibility and Reporting FormThe purpose of this template is to give national lymphatic filariasis elimination programme and data managers astandardized tool for systematically summarizing the eligibility of an evaluation unit (EU) for a transmission assessmentsurvey (TAS), the survey design and the results.
National programmes are requested to complete the eligibility and survey design worksheet and submit it to the WorldHealth Organization (WHO) before implementing the survey, so that it can be reviewed technically and the necessarysupport coordinated. Similarly, programmes are requested to complete and submit the results worksheet to WHOimmediately after implementation. The forms can be submitted throughout the year.
Instruction for data entry
This worksheet contains guides on completing the form for EUs in which a survey has been planned or implemented and for providing information on the EU and the country.
This worksheet summarizes the results of the survey conducted by the EU, including the number of children surveyed, the number of positive cases identified, the non-response rate, the actual timetable and the resources used.
This worksheet contains information on the criteria for eligibility of an EU, such as the history of mass drug administration (MDA) coverage and the results of sentinel and spot-check surveys.These worksheets contain information on the design of the planned survey, such as the sampling frame, survey sites, diagnostic tools to be used, sample size, critical cut-off, estimated timetable and resources required.
Year of reporting data
Most of the cells on the worksheets include formulae, which are calculated automatically.
White - cell is not protected. Please enter the value of the requested indicator.Yellow - cell is protected and includes name of the indicator. No data entry required.
Please enter your data into the cells according to the colour code:
Blue - cell is protected and includes formula. No data entry required.
Orange - cell is not protected and includes a drop-down menu. Please select the value from the list.
COUNTRY
Objective of TAS
Predominant vector in the EU
Name of the EUNumber of Implementation Units (IUs) in the EUTotal population of the EUTotal area of the EU (km2)Parasite species in the EU
Please send this form to the following:
Th e latest WHO TAS Eligibility and Reporting Form can be downloaded in .xls (Excel format) from:http://www.who.int/lymphatic_fi lariasis/resources/TAS_training_materials/en/index.html
LF_TAS_Learner_manual.indd Sec1:72 26/03/2014 11:51:03
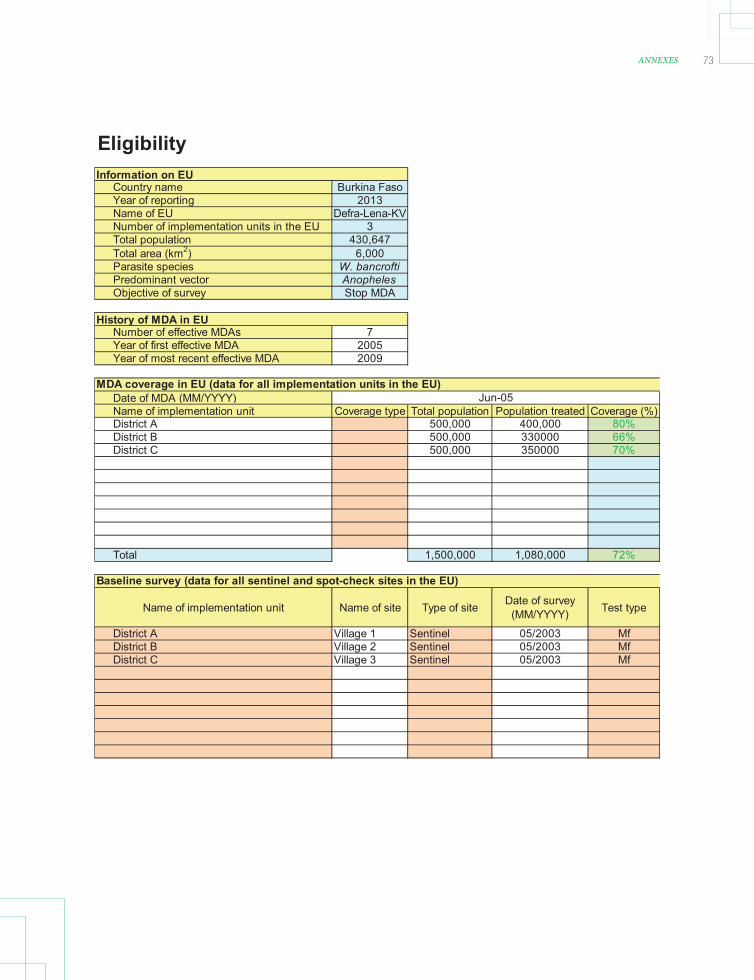
73ANNEXES
Eligibility
Country name Burkina FasoYear of reporting 2013Name of EU Defra-Lena-KVNumber of implementation units in the EU 3Total population 430,647Total area (km2) 6,000Parasite species W. bancroftiPredominant vector AnophelesObjective of survey Stop MDA
Number of effective MDAs 7Year of first effective MDA 2005Year of most recent effective MDA 2009
Date of MDA (MM/YYYY)Name of implementation unit Coverage type Total population Population treated Coverage (%)District A 500,000 400,000 80%District B 500,000 330000 66%District C 500,000 350000 70%
Total 1,500,000 1,080,000 72%
Name of implementation unit Name of site Type of site Date of survey (MM/YYYY) Test type
District A Village 1 Sentinel 05/2003 MfDistrict B Village 2 Sentinel 05/2003 MfDistrict C Village 3 Sentinel 05/2003 Mf
Information on EU
History of MDA in EU
MDA coverage in EU (data for all implementation units in the EU)
Baseline survey (data for all sentinel and spot-check sites in the EU)
Jun-05
LF_TAS_Learner_manual.indd Sec1:73 26/03/2014 11:51:04

74 TRAINING IN MONITORING AND EPIDEMIOLOGICAL ASSESSMENTof mass drug administration for eliminating lymphatic fi lariasis
Survey Design
Country name Burkina FasoYear of reporting 2013Name of EU Defra-Lena-KVNumber of implementation units in the EU 3Total population 430647Total area (km2) 6000Parasite species W. bancroftiPredominant vector AnophelesObjective of transmission assessment survey Stop MDA
Net primary school enrolment rate (%) 95%Survey site location SchoolGrade(s) with majority of 6-7 year olds 1-3Total number of children in selected grade(s) in EU 2,547Total number of primary schools in EU 26
Survey type CensusDiagnostic test ICTTarget number of schools or enumeration areasTarget sample sizeCritical cut-off valueEstimated non-response rateSampling interval
Planned starting month and yearEstimated number of survey days requiredBudgeted costSource(s) of fundingNumber of ICT or Brugia Rapid tests required
Information on EU
Sampling frame
Estimated timeline and resources
Design (from 'Survey Sample Builder')
LF_TAS_Learner_manual.indd Sec1:74 26/03/2014 11:51:04
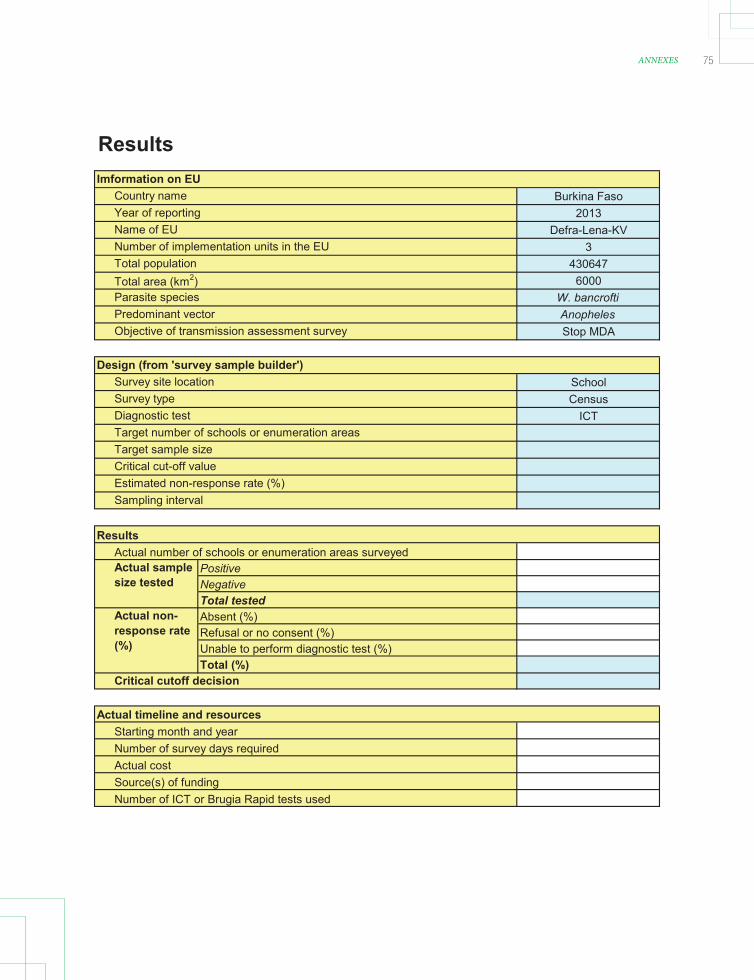
75ANNEXES
Results
Burkina Faso2013
Defra-Lena-KV3
4306476000
W. bancroftiAnophelesStop MDA
SchoolCensus
ICT
PositiveNegativeTotal testedAbsent (%)Refusal or no consent (%)Unable to perform diagnostic test (%)Total (%)
Source(s) of fundingNumber of ICT or Brugia Rapid tests used
Estimated non-response rate (%)Sampling interval
Actual timeline and resourcesStarting month and yearNumber of survey days required
Actual non-response rate (%)
Critical cutoff decision
Diagnostic testTarget number of schools or enumeration areasTarget sample sizeCritical cut-off value
Actual cost
Imformation on EUCountry name
Actual sample size tested
Actual number of schools or enumeration areas surveyedResults
Predominant vectorObjective of transmission assessment survey
Design (from 'survey sample builder')Survey site location
Year of reportingName of EUNumber of implementation units in the EU
Total area (km2)Parasite species
Total population
Survey type
LF_TAS_Learner_manual.indd Sec1:75 26/03/2014 11:51:04

76 TRAINING IN MONITORING AND EPIDEMIOLOGICAL ASSESSMENTof mass drug administration for eliminating lymphatic fi lariasis
Annex 4. Algorithm for choosing design of TAS in areas where Anopheles or Culex is the principal vector (above) and where Aedes is the principal vector (below)
NO< 1000
Net primary-school enrolment
ratio ≥ 75%
How many 1st and
2nd year primary-
school children in
EU?
How many 6 and 7 year-old children
in EU?
Test all 1st and 2nd
year primary school
children
Systematic sample of
1st and 2nd year primary
school children
Test all 6 and 7 year-old children
Systematic sample of 6 and 7 year-old children
Are there at least 40 schools with 1st and 2nd year primary-school
children?
Are there at least 40 EAs?
Is a cluster design more feasible than systematic sample in terms of costs?
Is a cluster design more feasible than systematic sample in terms of costs?
Cluster survey of 1st and 2nd year primary-school
children
Systematic sample of 1st and 2nd year
primary-school children
Cluster survey of 6 and 7 year-old
children
Systematic sample of 6 and 7 year-old
children
SCHOOL
COMMUNITY
YES
NO
YES
NO
NO
NO
YES
≥ 1800
1000–1799
≥ 1800
< 1000
1000–1799
YES
YES
Net primary-school enrolment
ratio ≥ 75%
How many 1st and
2nd year primary-
school children in
EU?
How many 6 and 7 year-old children
in EU?
Test all 1st and 2nd
year primary school
children
Systematic sample of
1st and 2nd year primary
school children
Test all 6 and 7 year-old children
Systematic sample of 6 and 7 year-old children
Are there at least 40 schools with 1st and 2nd year primary-school
children?
Are there at least 40 EAs?
Is a cluster design more feasible than systematic sample in terms of costs?
Is a cluster design more feasible than systematic sample in terms of costs?
Cluster survey of 1st and 2nd year primary-school
children
Systematic sample of 1st and 2nd year
primary-school children
Cluster survey of 6 and 7 year-old
children
Systematic sample of 6 and 7 year-old
children
SCHOOL
COMMUNITY
YES
NO
YES
NO
NO
NO
YES
NO
≥ 1000
< 400
400–999
≥ 1000
< 400
400–999
YES
YES
EU, evaluation unit; EA, enumeration area
LF_TAS_Learner_manual.indd Sec1:76 26/03/2014 11:51:04

77ANNEXES
Used to detect microfi lariae in blood in order to determine the prevalence and density of microfi lariae.
Test procedure
1. Clean slide with alcohol to remove lint and oil residue, and label slide appropriately. 2. Perform a fi nger-prick as described in the blood collection standard operating procedure. 3. Collect 60 μl of blood into a blood collection tube or a calibrated capillary tube. 4. Using a micropipette or capillary tube, place three parallel lines of blood (20 μl each) along the length of the slide.
Annex 5. Procedure for testing blood fi lms
5. Air-dry the blood fi lm thoroughly for 24–72 hours. 6. Carefully load the slides onto the staining racks. Dehaemoglobinize the blood fi lm for approximately 5 minutes in tap water, distilled water or normal saline. • Dehaemoglobinization is necessary to clear the red blood cells so that the microfi lariae can be visualized more easily. Th is is complete when the smear turns an opaque greyish-white. Caution must be exercised at this time, because the smear is fragile, and rough washing or agitation can fl oat it off the slide. Although fi xation in methanol is not absolutely necessary, it results in better staining of the microfi lariae. 7. Air-dry on the staining racks. 8. Fix in methanol for 3–5 minutes. 9. Stain with Giemsa. Th e general rule is to stain for a time equivalent to dilution of the stain. Routinely, use a 1:50 dilution of stock Giemsa and stain for 50 minutes. If the white blood cell nuclei are properly stained, microfi lariae should also be adequately stained. For Giemsa staining of fi lms to be examined for microfi lariae, the pH of the staining solution is not critical (unlike those to be examined for malaria parasites). Th e overall colour of the smear may range from pink to purple to blue, depending on the pH, but the microfi lariae will be stained adequately regardless of colour.
LF_TAS_Learner_manual.indd Sec1:77 26/03/2014 11:51:04

78 TRAINING IN MONITORING AND EPIDEMIOLOGICAL ASSESSMENTof mass drug administration for eliminating lymphatic fi lariasis
10. Air-dry. 11. Examine the preparation under a microscope. Use the x 10 objective fi rst to locate the microfi lariae; then identify the fi larial species under the x 40 and x 100 objectives.
Test interpretation
Microfi lariae, if present, can be seen on the slide under a light microscope (with appropriate staining) (Figure 3). Care should be taken to identify fi larial species correctly on the basis of morphological characteristics. Bench aids are available from WHO for correct identifi cation of microfi lariae.
LF_TAS_Learner_manual.indd Sec1:78 26/03/2014 11:51:04
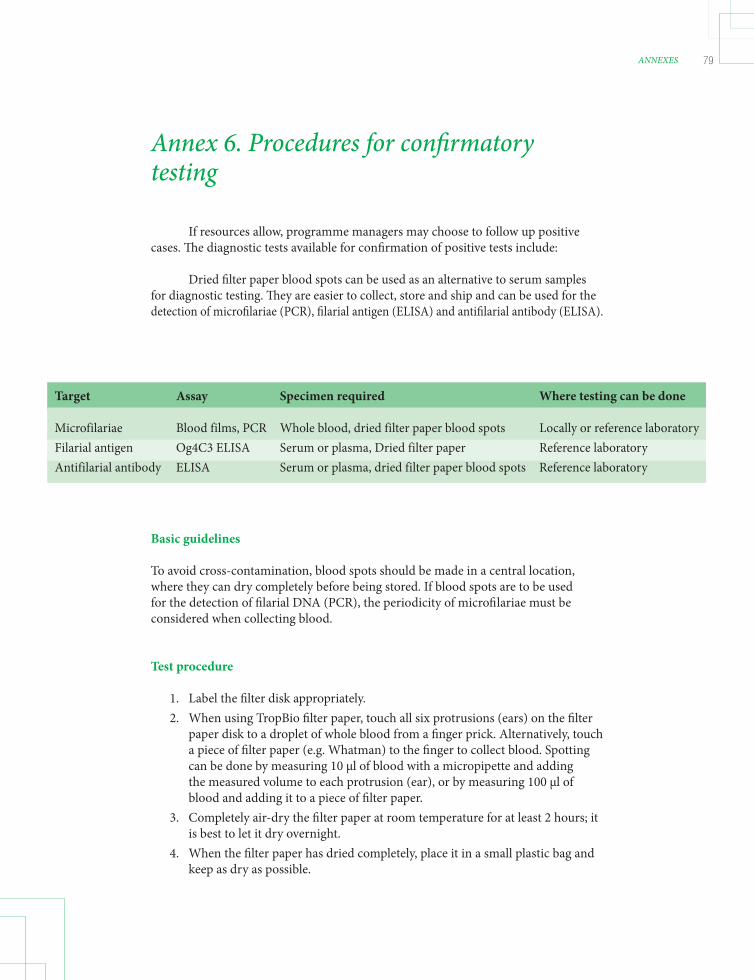
79ANNEXES
If resources allow, programme managers may choose to follow up positive cases. Th e diagnostic tests available for confi rmation of positive tests include:
Dried fi lter paper blood spots can be used as an alternative to serum samples for diagnostic testing. Th ey are easier to collect, store and ship and can be used for the detection of microfi lariae (PCR), fi larial antigen (ELISA) and antifi larial antibody (ELISA).
Annex 6. Procedures for confi rmatory testing
Basic guidelines
To avoid cross-contamination, blood spots should be made in a central location, where they can dry completely before being stored. If blood spots are to be used for the detection of fi larial DNA (PCR), the periodicity of microfi lariae must be considered when collecting blood.
Test procedure
1. Label the fi lter disk appropriately. 2. When using TropBio fi lter paper, touch all six protrusions (ears) on the fi lter paper disk to a droplet of whole blood from a fi nger prick. Alternatively, touch a piece of fi lter paper (e.g. Whatman) to the fi nger to collect blood. Spotting can be done by measuring 10 μl of blood with a micropipette and adding the measured volume to each protrusion (ear), or by measuring 100 μl of blood and adding it to a piece of fi lter paper. 3. Completely air-dry the fi lter paper at room temperature for at least 2 hours; it is best to let it dry overnight. 4. When the fi lter paper has dried completely, place it in a small plastic bag and keep as dry as possible.
Target Assay Specimen required Where testing can be done
Microfilariae Blood films, PCR Whole blood, dried filter paper blood spots Locally or reference laboratory Filarial antigen Og4C3 ELISA Serum or plasma, Dried filter paper Reference laboratory Antifilarial antibody ELISA Serum or plasma, dried filter paper blood spots Reference laboratory
LF_TAS_Learner_manual.indd Sec1:79 26/03/2014 11:51:04

80 TRAINING IN MONITORING AND EPIDEMIOLOGICAL ASSESSMENTof mass drug administration for eliminating lymphatic fi lariasis
Storage
For short-term storage (up to 1 week): Store at 4 °C. For longer term storage: • Place groups of 50 disks (each in its own individual small plastic bag) into larger plastic bags. • A silica gel desiccant can be placed into the larger bag. Make sure the small bags containing the fi lters are completely sealed so they do not contact the desiccant. • Store at –20 °C. • Dried disks packed and stored in this way can then be safely transported to the testing laboratory for up to 1 week at normal ambient temperature.
TropBio filter disk Whatman filter paper
LF_TAS_Learner_manual.indd Sec1:80 26/03/2014 11:51:04

81ANNEXES
Annex 7. Timeline template
TAS Timetable TemplateName of country: _____________________Name of evaluation unit: _____________________
Activity or taskTime
(months) Jan Feb Mar Apr May Jun Jul Aug Sep Oct Nov DecDetermine eligibilityCollect data at sentinel and spot-check sites
PlanningConfirm school enrolment rateObtain lists of schools or enumeration areasObtain mapsEthical clearance
Study designDetermine designDetermine sampling strategyDetermine sample sizeDetermine type of survey
LogisticsPrepare a budgetProcure diagnostic testsProcure consumablesOrganize field teamsPrepare public notificationIdentify data collection tools
TrainingOrganize field training
SurveyConduct the surveyAnalyse dataFollow up cases
LF_TAS_Learner_manual.indd Sec1:81 26/03/2014 11:51:04

82 TRAINING IN MONITORING AND EPIDEMIOLOGICAL ASSESSMENTof mass drug administration for eliminating lymphatic fi lariasis
Annex 8. Checklist for planning and implementing a transmission assessment survey
Task Possible personnel responsible Relevant module National Subnational programme programmes
Planning
1. Evaluation unit Defi ne EU √ 2 and 3 Complete the ‘INTRO’ and ‘ELIGIBILITY’ worksheets of the TAS Eligibility √
and Reporting Form √ Submit the TAS Eligibility and Reporting Form via WHO to RPRG
2. Survey design
Determine net primary school enrolment rate in the EU √ 4 and 8
School survey (net primary school enrolment rate ≥ 75%) Determine grade(s) with majority of 6–7-year-old children √ Obtain estimated enrolment rate(s) in selected grades from ministry of education √ Estimate non-response rate in the EU √ Obtain list of all primary schools in the EU, and order them by geographical proximity √ Use the survey sample builder to randomize survey sites and to determine survey design,
target sample size and critical cut-off √ Determine actual enrolment in selected grades in the schools, and adjust survey design
if necessary √ Community survey (net primary school enrolment rate < 75%)
Defi ne administrative unit (census enumeration areas are recommended) √ Obtain estimated no. of 6–7-year-old children in the enumeration area from census √ Estimate non-response rate in the EU √ Obtain list of all enumeration areas in the EU, and order them by geographical proximity √ Use the survey sample builder to determine survey sites, survey design, target sample
size and critical cut-off √ With offi cials in selected enumeration areas, review estimate of 6–7-year-old children,
and adjust survey design if necessary √ 3. Administration 9
Prepare a budget √ Prepare a timetable √ Obtain ethical approval for the survey, if necessary √
4. Materials 9
Procure diagnostic tests √ Clear diagnostic tests through customs √
LF_TAS_Learner_manual.indd Sec1:82 26/03/2014 11:51:04

83ANNEXES
Task Possible personnel responsible Relevant module National Subnational programme programmes
Obtain and organize consumable supplies √ √ Devise and print informed consent forms, if necessary √ √ Coordinate with schools for distribution of informed consent forms, if necessary √ √ Devise and print data collection forms with clear system of identifi ers, or set up
electronic data forms √ √ Obtain enumeration area maps (for community-based surveys) √ √
5. Field preparation √ 9
Organize and designate roles of staff and fi eld teams √ √ Train staff in survey design, fi eld procedures and diagnostic testing √ √ Organize transport and vehicle requirements √ √ Notify offi cials in schools or enumeration areas about upcoming survey √ √
Field work (for each school or enumeration area)
1. Before sampling 9 Orient and brief survey teams, supporting staff and offi cers about the survey design √ √ Ensure that consent has been obtained properly √ √ Identify the place in the school in which sampling can be done (for school-based surveys) √ √
2. Selection of participants 10 School survey
Gather all eligible children, with assistance from teachers and school offi cials √ √ Record numbers of eligible children present and absent on survey day √ √ Randomly choose one of two lists, if necessary √ √ Line up all eligible children, and select those to survey from the list, if necessary √ √
Community survey Review estimated population and boundaries of the enumeration area with local offi cials √ √ Plan a walking route that passes each house using maps or other guides √ √ Randomly choose one of two lists √ √ Begin walking route, stopping at each house on list √ √ Select all 6–7-year-old children in the houses √ √ Record the actual number of children in each house who are present and absent on the
survey day √ √ 3. Sampling 5 and 10
Set up a designated area for collecting data and blood √ √ Collect demographic data on each selected child √ √ Collect a blood specimen from each child (in EDTA-coated tube if to be tested later at a
central location) √ √ Conduct an ICT or Brugia RapidTM test directly in the fi eld or send to a central location √ √ Record results on a data collection form or in an electronic system √ √
4. Aft er sampling 6 and 10
Clean up the sampling area √ √ Treat or arrange for treatment of positive cases √ √
EU, evaluation unit; ICT, immunochromatographic test ; TAS, transmission assessment survey.
LF_TAS_Learner_manual.indd Sec1:83 26/03/2014 11:51:04

84 TRAINING IN MONITORING AND EPIDEMIOLOGICAL ASSESSMENTof mass drug administration for eliminating lymphatic fi lariasis
Annex 9. Budget template
TAS Budget TemplateName of country: _____________________Name of evaluation unit: _____________________
Category Unit cost Number of unit Number of days AmountPersonnel costsDaily allowances for supervisors 0Daily allowances for field staff 0
subtotal 0Transport and fuelFuel Repair and maintenance Other transport
subtotal 0Supplies and consumablesDiagnostic testField supplies
subtotal 0Office suppliesStationary Photocopies
subtotal 0CommunicationTelephone and faxInternet
subtotal 0TrainingHall hireFoodMiscellaneous expenses
subtotal 0Other (specify)e.g. customs fees, maps, ethical approval
subtotal 0TOTAL BUDGET 0
LF_TAS_Learner_manual.indd Sec1:84 26/03/2014 11:51:05

85ANNEXES
Annex 10. Sample data collection form for school surveys
Directions
1 School ID: use tw
o digit school ID (starting from
01 onwards) , fi ll in this ID
before going to the school, from the m
aster list of all the schools with unique ID
assigned to each school.
2 Sheet number-sequential sheet num
ber starting from 01 should be used if m
ultiple sheets are used for each school. Each sheet will include 20 children. If the sheet num
ber is 3, the fi rst line number w
ill be 061.
3 Write the total num
ber of students in the targeted grades who w
ere absent or refused testing.
4 Line Num
ber: Use a three digit num
ber starting from 001 for each school, and if m
ultiple sheets are used, then continue from the previous sheet. For diff erent school, start from
001 again.
Colum
n 1: Create a unique student ID by com
bining the two digit school ID
and 3 digit line number
C
olumn 2: W
rite the child’s last (family) nam
e, followed by a com
ma and the child’s fi rst (given) nam
e.C
olumn 3: If the child is fem
ale, circle 1. If the child is male, circle 2.
C
olumn 4: W
rite the grade in which the child is enrolled, e.g. G
rade 1=1, Grade 2=2, etc.
Colum
n 5: If parental consent was obtained, circle 1. If parental consent w
as not obtained, circle 2.
C
olumn 6: Enter date of birth of child, in the form
at dd/mm
/yy
C
olumn 7: Fill in this colum
n only if date of birth is unknown. W
rite the age in years.
C
olumn 8: W
rite the address where the child lives, e.g. street, village, etc.
Colum
n 9: Circle 1 if the ICT or Brugia Rapid result was positive, 2 if negative, 3 if invalid, 4 if no result (eg not enough blood collected), 9 if the child is absent, and 99 if the child refused or the parental consent w
as not given. C
olumn 10: Circle na(98) if the fi rst ICT or Brugia Rapid is negative. O
nly those with positive, invalid or no results on the fi rst test receive a second test.
Colum
n 11: Circle na(98) if the second test is negative. Only those w
ith a positive test result receive treatment.
LF_TAS_Learner_manual.indd Sec1:85 26/03/2014 11:51:05

86 TRAINING IN MONITORING AND EPIDEMIOLOGICAL ASSESSMENTof mass drug administration for eliminating lymphatic fi lariasis
Annex 11. Bench aid for new diagnostic test to detect antigen to W. bancroft i
LF_TAS_Learner_manual.indd Sec1:86 26/03/2014 11:51:05

87ANNEXES
Th e latest version can be downloaded at http://www.ntdsupport.org/resources
LF_TAS_Learner_manual.indd Sec1:87 02/04/2014 11:06:07