Embed Size (px)
Citation preview
1
World Energy Trilemma Index | 2017
MONITORING THE SUSTAINABILITY OF NATIONAL ENERGY SYSTEMS In Partnership with OLIVER WYMAN

2
ABOUT THE WORLD ENERGY COUNCIL The World Energy Council is the principal impartial network of energy leaders and practitioners promoting an affordable, stable and environmentally sensitive energy system for the greatest benefit of all.
Formed in 1923, the Council is the UN-accredited global energy body, representing the entire energy spectrum, with over 3,000 member organisations in over 90 countries, drawn from governments, private and state corporations, academia, NGOs and energy stakeholders. We inform global, regional and national energy strategies by hosting high-level events including the World Energy Congress and publishing authoritative studies, and work through our extensive member network to facilitate the world’s energy policy dialogue.
Further details at www.worldenergy.org and @WECouncil
Copyright © 2017 World Energy Council. All rights reserved. All or part of this publication may be used or reproduced as long as the following citation is included on each copy or transmission: ‘Used by permission of the World Energy Council’.
World Energy Council
Registered in England and Wales
No. 4184478
VAT Reg. No. GB 123 3802 48
Registered Office
62–64 Cornhill
London EC3V 3NH
United Kingdom
ABOUT THE ENERGY TRILEMMA INDEX
The World Energy Council’s definition of energy sustainability is based on three core dimensions: energy security, energy equity, and environmental sustainability. Balancing these three goals constitutes a ‘trilemma’ and is the basis for prosperity and competitiveness of individual countries.
The World Energy Trilemma Index, prepared annually by the World Energy Council in partnership with global consultancy Oliver Wyman, along with the Global Risk Centre of its parent Marsh & McLennan Companies since 2010, is a comparative ranking of 125 countries’ energy systems. It provides an assessment of a country’s ability to balance the trade-offs between the three trilemma dimensions.
Access the complete Index results and use the interactive Trilemma Index tool and its pathway calculator to find out more about countries’ trilemma performance and what it takes to build a sustainable energy system:
www.worldenergy.com/data.
Produced in partnership with OLIVER WYMAN
MONITORING NATIONAL ENERGY SYSTEMS
3
TABLE OF CONTENTS
EXECUTIVE SUMMARY 5
INTRODUCTION 9 About the annual Energy Trilemma Index 9 Overview of the 2017 Energy Trilemma Index ranking and balance score 12 Placing countries on the Index watch list 16 An Energy Sector in Transition:: the 2017 Energy Trilemma Index in context 19
REGIONAL ENERGY PROFILES 23 Asia 23 Europe 25 Latin America and the Caribbean 27 Middle East and North Africa 30 North America 32 Sub-Saharan Africa 35
COUNTRY PROFILES 38
FREQUENTLY ASKED QUESTIONS 134
ACKNOWLEDGEMENTS 142

4
MONITORING NATIONAL ENERGY SYSTEMS
5
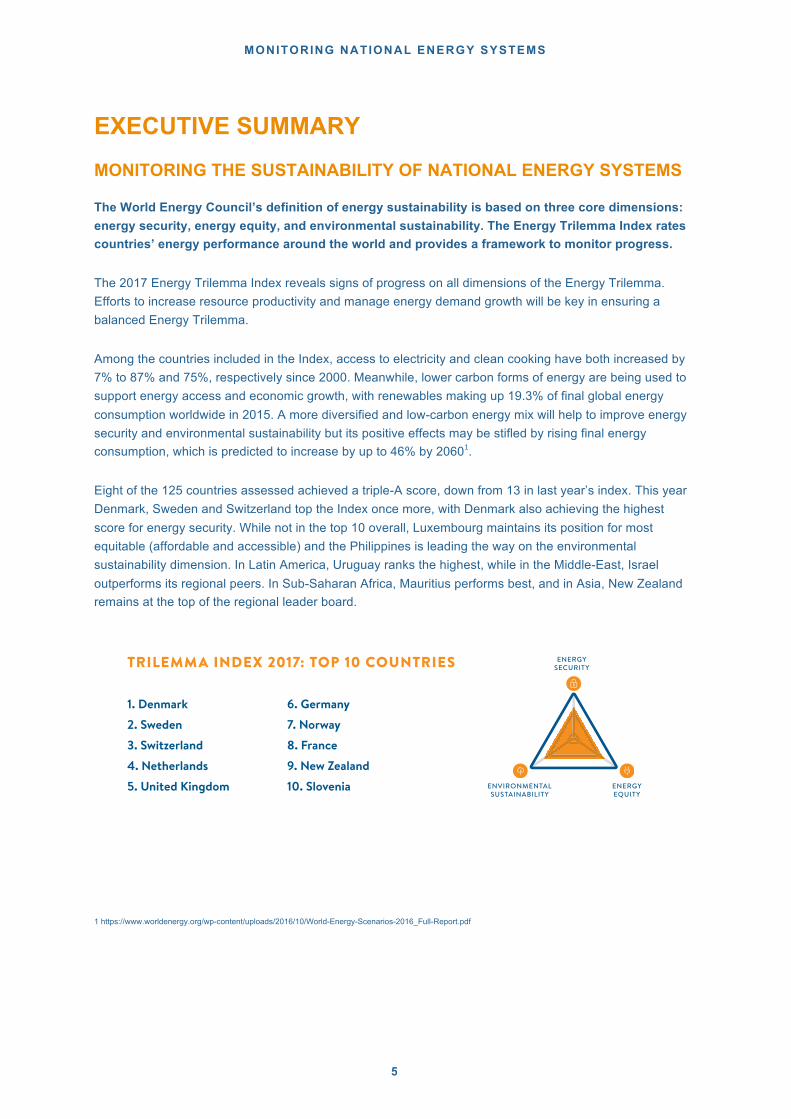
EXECUTIVE SUMMARY MONITORING THE SUSTAINABILITY OF NATIONAL ENERGY SYSTEMS The World Energy Council’s definition of energy sustainability is based on three core dimensions: energy security, energy equity, and environmental sustainability. The Energy Trilemma Index rates countries’ energy performance around the world and provides a framework to monitor progress.
The 2017 Energy Trilemma Index reveals signs of progress on all dimensions of the Energy Trilemma. Efforts to increase resource productivity and manage energy demand growth will be key in ensuring a balanced Energy Trilemma.
Among the countries included in the Index, access to electricity and clean cooking have both increased by 7% to 87% and 75%, respectively since 2000. Meanwhile, lower carbon forms of energy are being used to support energy access and economic growth, with renewables making up 19.3% of final global energy consumption worldwide in 2015. A more diversified and low-carbon energy mix will help to improve energy security and environmental sustainability but its positive effects may be stifled by rising final energy consumption, which is predicted to increase by up to 46% by 20601.
Eight of the 125 countries assessed achieved a triple-A score, down from 13 in last year’s index. This year Denmark, Sweden and Switzerland top the Index once more, with Denmark also achieving the highest score for energy security. While not in the top 10 overall, Luxembourg maintains its position for most equitable (affordable and accessible) and the Philippines is leading the way on the environmental sustainability dimension. In Latin America, Uruguay ranks the highest, while in the Middle-East, Israel outperforms its regional peers. In Sub-Saharan Africa, Mauritius performs best, and in Asia, New Zealand remains at the top of the regional leader board.
1 https://www.worldenergy.org/wp-content/uploads/2016/10/World-Energy-Scenarios-2016_Full-Report.pdf
World Energy Trilemma Index 2017
EXECUTIVE SUMMARYIN PARTNERSHIP WITH OLIVER WYMAN
MONITORING THE SUSTAINABILITYOF NATIONAL ENERGY SYSTEMS
The World Energy Council’s definition of energy sustainability is based on three core dimensions: energy security, energy equity, and environmental sustainability. The Energy Trilemma Index rates countries’ energy performance around the world and provides a framework to monitor progress.
The 2017 Energy Trilemma Index reveals signs of progress on all dimensions of the Energy Trilemma. Efforts to increase resource productivity and manage energy demand growth will be key in ensuring a balanced Energy Trilemma.
Among the countries included in the Index, access to electricity and clean cooking have both increased by 7% to 87% and 75%, respectively since 2000. Meanwhile, lower carbon forms of energy are being used to support energy access and economic growth, with renewables making up 19.3% of final global energy consumption worldwide in 2015. A more diversified and low-carbon energy mix will help to improve energy security and environmental sustainability but its positive effects may be stifled by rising final energy consumption, which is predicted to increase by up to 46% by 20601.
Eight of the 125 countries assessed achieved a triple-A score, down from 13 in last year’s index. This year Denmark, Sweden and Switzerland top the Index once more, with Denmark also achieving the highest score for energy security. While not in the top 10 overall, Luxembourg maintains its position for most equitable (affordable and accessible) and the Philippines is leading the way on the environmental sustainability dimension. In Latin America, Uruguay ranks the highest, while in the Middle-East, Israel outperforms its regional peers. In Sub-Saharan Africa, Mauritius performs best, and in Asia, New Zealand remains at the top of the regional leader board.
ENERGYSECURITY
ENVIRONMENTALSUSTAINABILITY
ENERGYEQUITY
1. Denmark2. Sweden3. Switzerland4. Netherlands5. United Kingdom
6. Germany7. Norway8. France9. New Zealand10. Slovenia
1. https://www.worldenergy.org/wp-content/uploads/2016/10/World-Energy-Scenarios-2016_Full-Report.pdf
TRILEMMA INDEX 2017: TOP 10 COUNTRIES

6
MONITORING NATIONAL ENERGY SYSTEMS
7

Introduction

MONITORING NATIONAL ENERGY SYSTEMS
9
INTRODUCTION: ABOUT THE ANNUAL ENERGY TRILEMMA INDEX The World Energy Council’s definition of energy sustainability is based on three core dimensions – energy security, energy equity, and environmental sustainability. Together, they constitute a ‘trilemma’, and achieving high performance on all three dimensions entails complex interwoven links between public and private actors, governments and regulators, economic and social factors, national resources, environmental concerns, and individual behaviors.
As the global energy sector is being transformed by three reinforcing trends - decarbonisation, digitalisation and decentralisation – policymakers around the globe will come across new opportunities to make progress on the Energy Trilemma. At the same time, they will be required to sustain the advancements made on the trilemma over the past years by managing and actively integrating a greater diversity of market actors and technologies without fragmenting the energy system.
BOX 1: THE THREE DIMENSIONS OF THE ENERGY TRILEMMA
Energy security: Effective management of primary energy supply from domestic and external sources, reliability of energy infrastructure, and ability of energy providers to meet current and future demand.
Energy equity: Accessibility and affordability of energy supply across the population.
Environmental sustainability: Encompasses achievement of supply- and demand-side energy efficiencies and development of energy supply from renewable and other low-carbon sources.
WORLD ENERGY COUNCIL | ENERGY TRILEMMA INDEX | 2017
10
The Energy Trilemma Index quantifies the Energy Trilemma and comparatively ranks 125 countries2 in terms of their ability to provide a secure, affordable, and environmentally sustainable energy system. In addition, countries are awarded a balance score that highlights how well the country manages the trade-offs between the three Energy Trilemma dimensions and identifies top performing countries with a ‘AAA’ score.
The Index rankings are based on a range of data sets that capture both energy performance and the context of that energy performance. Energy performance indicators consider supply and demand, the affordability of and access to energy, and the environmental impact of a country’s energy production and use. The contextual indicators consider the broader circumstances of energy performance, including a country’s ability to provide coherent, predictable and stable policy and regulatory frameworks, initiate R&D and innovation, and attract investment.
Prepared annually by the World Energy Council in partnership with global consultancy Oliver Wyman, along with the Global Risk Centre of its parent Marsh & McLennan Companies since 2010, the Index methodology was updated and revised in 2016 to capture the changing energy landscape. The methodology maintains the focus on the three Energy Trilemma dimensions but is enhanced by three main changes. Firstly, the revised methodology broadens the scope of indicators covered to provide a more inclusive ranking of the energy sector with a greater focus on the diversity of energy supply. Secondly, the assessment of energy equity is enhanced by including measures for the quality of supply and affordability of a wider number of energy resources, including household electricity, natural gas and diesel costs. Finally, the revised Index includes a consideration of the resilience of a country’s energy system, with indicators for energy storage and the ability of a country to prepare for and repair energy infrastructure following shocks (human factor).
Included in this Index report are:
• 2017 Energy Trilemma Index rankings and balance scores
• 2017 Watch list
• Regional profiles by key geographies • Index rankings from three consecutive years (2015, 2016 and 2017)
• Energy Trilemma profiles for each of the 94 World Energy Council member countries included
in the Index3
• Appendices including the revised Index rationale and 2016 methodology.
As countries have unique resources, policy goals and challenges, the absolute rank of a country may be less meaningful than its relative performance versus its peers. To support such analysis, the Index report provides data to generate regional, economic, or structure of the energy sector peer group comparisons. For the deeper Index analysis, countries were organised into four economic groups:
2 The World Energy Trilemma Index includes 130 countries but rankings have only been produced for 125 countries due to data limitations. Countries that are tracked but
not ranked are: Chinese Taipei, Libya, Barbados, Syria (Arab Republic), and Yemen.
3 The World Energy Trilemma Index report only features country profiles for the World Energy Council’s Member Committees. Results for all 125 countries can be viewed
on https://trilemma.worldenergy.org). The World Energy Council’s Member Committees in Libya and Syria (Arab Republic) have not been ranked due to data limitations.
Therefore, no country profile exists for these countries in the report.
MONITORING NATIONAL ENERGY SYSTEMS
11
• Group I: GDP per capita greater than US$33,500
• Group II: GDP per capita between US$14,300 and US$33,500
• Group III: GDP per capita between US$6,000 and US$14,300
• Group IV: GDP per capita lower than US$6,000.
Trends and the balance within the three dimensions also provide valuable information in helping countries address their energy trilemma. Decision makers in both the public and private sectors are encouraged to look at trends in performance over the years, particularly in each dimension, and to compare their countries against peer groups – including regional or GDP group peers.
To support decision makers, the World Energy Council and Oliver Wyman have developed an interactive online tool that allows users to view Index results, compare countries’ performance against other countries and identify what it takes to improve the energy trilemma performance. The tool can be accessed at: https://trilemma.worldenergy.org
Taken as a whole, the World Energy Trilemma Index is a unique and unparalleled resource and guide for policymakers seeking to develop solutions for sustainable energy systems in a time of transition, and for business leaders to support investment decisions.

WORLD ENERGY COUNCIL | ENERGY TRILEMMA INDEX | 2017
12
OVERVIEW OF THE 2017 ENERGY TRILEMMA RANKINGS
Figure 1 Top 10 Energy Trilemma Index performers overall and per dimension Source: World Energy Council/Oliver Wyman, 2017
This year’s top ten ranked countries are all European, except New Zealand, which continue to be led by Denmark at rank 1. Five of the top ten achieve a triple- A score. This reinforces that (a) countries must perform well across all trilemma dimensions to reach the top of the leader board and (b) it is possible to develop an energy system, in which policies work well together to balance the trade-offs between energy security, energy equity and environmental sustainability. But it also highlights, that it is important for policymakers to plan and manage the energy transition very carefully as there are many potential unintended consequences.

MONITORING NATIONAL ENERGY SYSTEMS
13
However, the complex trade-offs that are inherent in energy policy-making, as well as certain geographic limitations to achieving a trilemma balance, become evident when analysing countries that excel in one dimension but struggle to achieve a balance.
Luxembourg, for example, which receives the top score in energy equity, ranks 120th in energy security and 99th in environmental sustainability due to its small geographic area and resulting limitations in the availability and diversity of energy resources and generation capacity. Taking advantage of the transition trends, such as decentralisation, may provide countries such as Luxembourg with opportunities to improve both energy security and environmental sustainability. At the same time, the trend of empowered consumers may have unintended consequences, such as higher energy prices for some consumers and may lead to an overall drop of the country’s energy equity performance.
Conversely, the top-ten in environmental sustainability is dominated by states that are able to take advantage of their renewable energy potential such as Iceland, the Philippines and Costa Rica, which all have high geothermal or hydropower capacities. A main challenge for these countries, however, is to avoid over-reliance on one single or weather dependent energy resources, which could potentially hamper the resilience of the energy system and with that energy security. The Philippines, for example, which receives the top score in environmental sustainability, ranks 63rd in energy security and 95th in energy equity. Taking advantage of the transition trends, such as decentralisation, may provide countries like the Philippines with opportunities to improve energy access rates while at the same time improving the country’s energy equity performance. A well-managed integration of distributed energy resources (DER) and risks associated with the uptake of DER would at the same time reduce the risk of a drop in environmental sustainability.

WORLD ENERGY COUNCIL | ENERGY TRILEMMA INDEX | 2017
14
Figure 2 shows the overall Index performance and balance score of the 125 countries assessed in 2017.

MONITORING NATIONAL ENERGY SYSTEMS
15
An analysis of selected key metrics used in this index shows that globally, there are signs that countries are building more sustainable energy systems by concurrently addressing energy security, energy equity and environmental sustainability challenges. Progress is most evident for indicators in the energy equity dimension.
Globally, the share of people with access to clean cooking, for example, has increased from 57% in 2000 to 64% in 2014, while the share of people with access to electricity has increased from 75% in 2000 to 82% in 2014.4 At the same time, global CO2 intensity has been decreasing from 0.42 tkCO2/USD in 2000 to 0.34 kCO2/USD in 2015 and global energy intensity has been decreasing from 0.12 koe/USD in 2000 to 0.10 4 UN SE4All (2017), Global Tracking Framework
WORLD ENERGY COUNCIL | ENERGY TRILEMMA INDEX | 2017
16
koe/USD in 2015.5 Together these two trends point towards a global upward trend with regards to energy equity and environmental performance where access to energy is improving at the same time as cleaner forms of energy are being used per US dollars created. Well-planned and managed adoption of distributed energy resources can support further progress on the energy trilemma dimensions.
For example, the share of renewables in total primary energy consumption has increased from 6.8% in 2005 to 9.7% in 2015. In this regard, the index’ regional profiles signal a positive trend towards greater diversification of energy sources, often through the exploitation of renewable energy generation potential. Oil-producing states, for example, are increasingly exploring or actively enhancing solar power generation to reduce their reliance on fossil fuels. Congruently, large developing states in Asia are working on decreasing their import dependence through an increase in renewable energy sources.
However, while a more diversified energy mix will help to improve energy security, its positive effects may be stifled by the global increase in energy consumption. Globally, efforts to increase resource productivity and manage energy demand growth will be key in ensuring a balanced energy trilemma going forward. Moreover, the increased use of distributed energy resources, especially distributed generation from renewables, may impact system reliability.
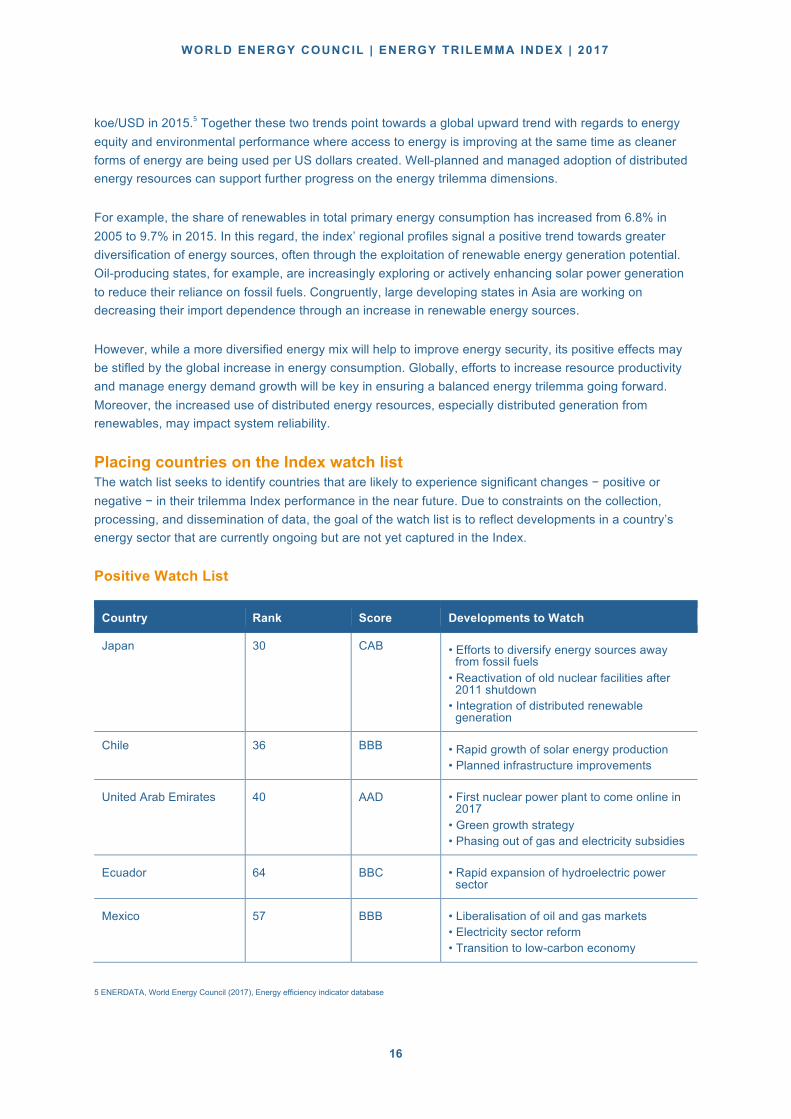
Placing countries on the Index watch list The watch list seeks to identify countries that are likely to experience significant changes − positive or negative − in their trilemma Index performance in the near future. Due to constraints on the collection, processing, and dissemination of data, the goal of the watch list is to reflect developments in a country’s energy sector that are currently ongoing but are not yet captured in the Index.
Positive Watch List
Country Rank Score Developments to Watch
Japan 30 CAB • Efforts to diversify energy sources away from fossil fuels
• Reactivation of old nuclear facilities after 2011 shutdown
• Integration of distributed renewable generation
Chile 36 BBB • Rapid growth of solar energy production • Planned infrastructure improvements
United Arab Emirates 40 AAD • First nuclear power plant to come online in 2017
• Green growth strategy • Phasing out of gas and electricity subsidies
Ecuador 64 BBC • Rapid expansion of hydroelectric power sector
Mexico 57 BBB • Liberalisation of oil and gas markets • Electricity sector reform • Transition to low-carbon economy
5 ENERDATA, World Energy Council (2017), Energy efficiency indicator database
MONITORING NATIONAL ENERGY SYSTEMS
17
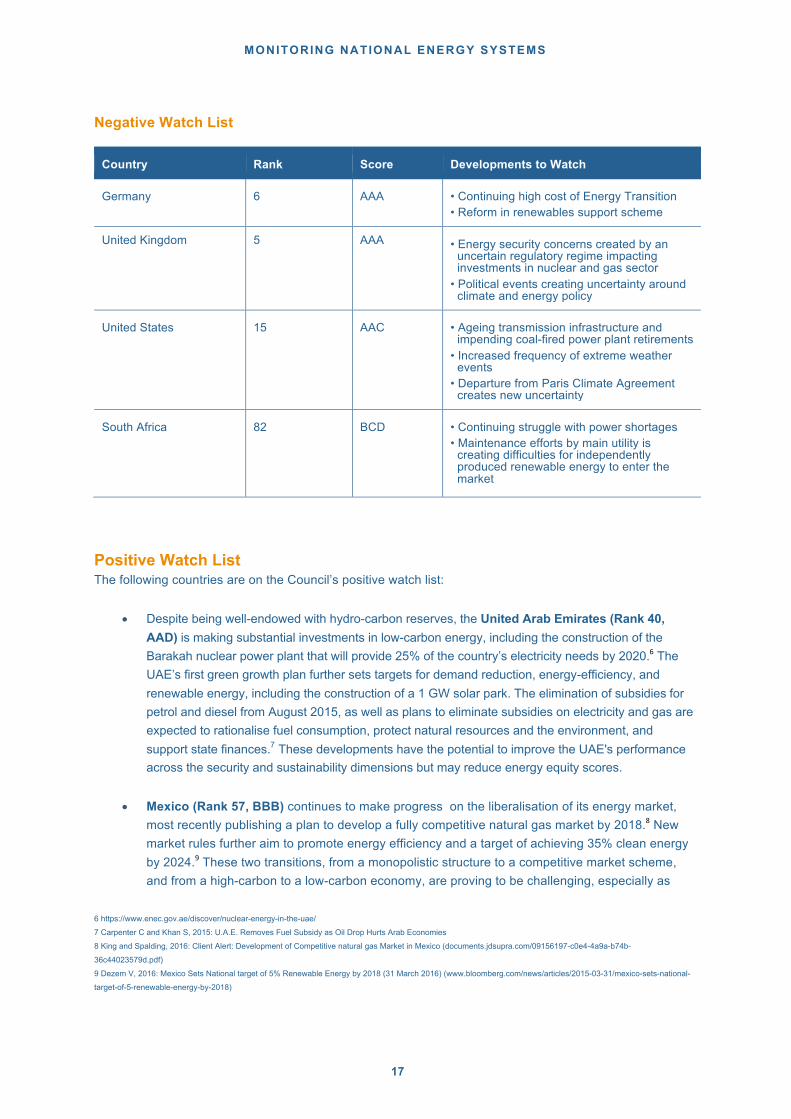
Negative Watch List
Country Rank Score Developments to Watch
Germany 6 AAA • Continuing high cost of Energy Transition • Reform in renewables support scheme
United Kingdom 5 AAA • Energy security concerns created by an uncertain regulatory regime impacting investments in nuclear and gas sector
• Political events creating uncertainty around climate and energy policy
United States 15 AAC • Ageing transmission infrastructure and impending coal-fired power plant retirements
• Increased frequency of extreme weather events
• Departure from Paris Climate Agreement creates new uncertainty
South Africa 82 BCD • Continuing struggle with power shortages • Maintenance efforts by main utility is
creating difficulties for independently produced renewable energy to enter the market
Positive Watch List The following countries are on the Council’s positive watch list:
• Despite being well-endowed with hydro-carbon reserves, the United Arab Emirates (Rank 40, AAD) is making substantial investments in low-carbon energy, including the construction of the Barakah nuclear power plant that will provide 25% of the country’s electricity needs by 2020.6 The UAE’s first green growth plan further sets targets for demand reduction, energy-efficiency, and renewable energy, including the construction of a 1 GW solar park. The elimination of subsidies for petrol and diesel from August 2015, as well as plans to eliminate subsidies on electricity and gas are expected to rationalise fuel consumption, protect natural resources and the environment, and support state finances.7 These developments have the potential to improve the UAE's performance across the security and sustainability dimensions but may reduce energy equity scores.
• Mexico (Rank 57, BBB) continues to make progress on the liberalisation of its energy market, most recently publishing a plan to develop a fully competitive natural gas market by 2018.8 New market rules further aim to promote energy efficiency and a target of achieving 35% clean energy by 2024.9 These two transitions, from a monopolistic structure to a competitive market scheme, and from a high-carbon to a low-carbon economy, are proving to be challenging, especially as
6 https://www.enec.gov.ae/discover/nuclear-energy-in-the-uae/
7 Carpenter C and Khan S, 2015: U.A.E. Removes Fuel Subsidy as Oil Drop Hurts Arab Economies
8 King and Spalding, 2016: Client Alert: Development of Competitive natural gas Market in Mexico (documents.jdsupra.com/09156197-c0e4-4a9a-b74b-
36c44023579d.pdf)
9 Dezem V, 2016: Mexico Sets National target of 5% Renewable Energy by 2018 (31 March 2016) (www.bloomberg.com/news/articles/2015-03-31/mexico-sets-national-
target-of-5-renewable-energy-by-2018)
WORLD ENERGY COUNCIL | ENERGY TRILEMMA INDEX | 2017
18
improvement and expansion of the country’s infrastructure is still required.10 However, the country’s overall energy trilemma performance is expected to improve gradually as the reforms are implemented.
• Having been on the Council’s negative watch list in recent years and remaining at the same overall rank since 2014, the government of Japan (Rank 30, CAB) has been actively pursuing a strategy to diversify its energy supplies as part of its wider revised energy policy following the Fukushima accident and the Great East Japan Earthquake of 2011. The strategy aims to increase the share of renewables to 13-14% and the share of nuclear energy to 10-11% of the national primary energy supply by 2030.11 The resumption of energy production at Japan’s reactors has slowed due to time-consuming examinations by the Nuclear Regulation Authority. The country also amended its feed-in-tariff following criticism that the prices were set too high. Despite the difficulties in pursuing its policies, these developments may herald a positive trend in the country’s energy policy.
• Chile (Rank 36, BBB) established its long-term plan to balance the energy trilemma with its Energy Policy 2050. While Chile is the largest producer of renewable energy in South America, it faces some systematic difficulties, with the main challenge being to expand its infrastructure capacity to adapt with the intermittency of solar and wind power. In particular, the northern and southern electricity grids of the country need to be better interconnected for a more effective distribution and work has already been underway to address this.
• Ecuador (Rank 64, BBC) is undergoing a major shift towards renewable energy, with eight new hydroelectric power plants coming online in the period 2015-2017. A total of 93% of the country’s energy supply is currently coming from hydropower. This development, if accompanied by a supportive fossil fuel infrastructure and improvements to the supply network, has the potential to significantly strengthen Ecuador’s performance across all dimensions of the Trilemma.
Negative Watch List The following countries are on the negative watch list:
• While Germany’s (Rank 6, AAA ) overall ranking declined slightly, it remains on the Council’s negative watch list given the challenges of the plan to transition Germany's energy system. The plan introduced in 2010 includes goals of increasing power generation from renewable sources, as well as a reduction of primary energy usage and CO2 emissions. The 2011 decision to phase-out nuclear power by 2022 further challenges Germany’s energy mix. Due to low wholesale prices and regulatory uncertainty, investment in necessary new conventional power plants has been challenged. A reform of the legislation for renewables support has shifted from feed-in tariffs (FITs) to a bidding process for green power, ensuring a more economical and affordable transition. Further changes in energy security and environmental sustainability are expected in future evaluations.
10 Clemente J, 2016: Mexico’s Ever growing Natural Gas Market (Forbes, 02 July 2016) (www.forbes.com/sites/judeclemente/2016/07/02/mexicos-growing-natural-gas-
market/#3f47d1dc5ddc)
11 Japanese Ministry of Economy, Trade and Industry, 2015: Long-term Energy Supply and Demand Outlook (www.meti.go.jp/english/press/2015/pdf/0716_01a.pdf)

MONITORING NATIONAL ENERGY SYSTEMS
19
• Despite, its improvement on this year’s overall ranking, the United Kingdom (Rank 5, AAA) faces significant challenges with its energy policy following the country’s decision to leave the EU. The potential exit from the single market could significantly increase its energy import costs with uncertainty affecting investment plans.
• Political uncertainty also affects the United States (Rank 15, AAC) following the decision to withdraw from the Paris Climate Change Agreement although its key challenges remain in addressing the country’s ageing energy transmission, storage, and distribution systems, as highlighted by the Department of Energy's Quadrennial Energy Review.12 While the Department of Energy has been stepping up efforts to diversify the country’s energy supply and improve its emergency response measures in light of the increasing frequency of extreme weather events, more investment is needed to tackle this challenge. Moreover, the majority of coal-fired and nuclear power plants are at least 30 years old, and, with an average lifespan of just 40 years, will need to be replaced over the coming years. This poses challenges to the country's energy security in the immediate future despite the expected increase in the country’s energy exports.
• South Africa (Rank 82, BCD) improved two places due to better energy security with lower demand growth and additional power coming from the Renewable Energy program launched in 2011, together with better operation of the existing generation fleet. More generally, the country’s energy system has improved due to increasing investment in infrastructure maintenance and fossil fuels, meaning that the frequency of blackouts has decreased. However, the country still struggles to diversify its energy sources, with most of its electricity still being supplied by Eskom through fossil fuels.13 Plans to build new nuclear reactors are on hold, and independent producers of renewable energy, while having made some advances over the past two years, still need to develop strong inroads into the country’s supply. Until these issues are addressed, South Africa’s sustainability score is unlikely to improve.
An Energy Sector in Transition: the 2017 Energy Trilemma Index in Context All countries can improve their energy performance. The 2017 World Energy Trilemma report companion to this index tapped into the insights of global energy leaders to explore the implications of the expansion and integration of distributed energy resources; in particular distributed generation, into existing power and electricity systems. Distributed energy resources are becoming increasingly important to the global energy system, particularly in the context of the energy transition. Improved efficiency and falling technology costs are expected to further accelerate this trend, with distributed generation, particularly renewables, playing a key role.
As the decentralisation trend continues in many countries, four power system archetypes emerge. Each archetype represents a different combination of centralised and decentralised generation, including a centralised, two hybrids and a decentralised system. Recognising these emerging systems will be important in managing the complex transition from the infrastructure backbone of past to the grid of the future.
12 Conca J, 2015: It Really Is Our Aging infrastructure (Forbes, 21 May 2015) www.forbes.com/sites/jamesconca/2015/05/21/its-our-aging-energy-infrastructure-
stupid/#74c870af7cd3)
13 Cohen M and Burkhardt P, 2015; What is South Africa Doing to tackle Its Electricity Crisis? (Bloomberg, 08 September 2015) (www.bloomberg.com/news/articles/2015-
09-08/what-is-south-africa-doing-to-tackle-its-electricity-crisis-)

WORLD ENERGY COUNCIL | ENERGY TRILEMMA INDEX | 2017
20
The interviews with energy leaders highlighted some key themes.
1. Countries that do not take the necessary steps to integrate distributed energy resources will face heightened energy security risks, potential infrastructure redundancies and investment challenges that will adversely affect their energy trilemma performance.
2. Decentralisation not only adds new resources to the system, but can also create new actors on energy markets, provided governments and regulators are prepared to allow access to them. Market entrants such as large energy ‘prosumers’, energy service aggregators, and rural energy entrepreneurs offer new sources of generation, supply and demand management. As countries transition to hybrid systems, the policies and regulatory frameworks governing who can participate in the energy markets and how, need to evolve.
3. Maintaining system reliability will become increasingly complex and new approaches to system management, supported by enhanced information technology systems, will be required to ensure energy security. However, this also creates the opportunity to improve system resilience through greater diversity of supply and generation, together with improved grid management.
4. Distributed generation technologies and standalone micro-grid and off-grid systems can provide electricity access at a faster rate and lower cost than conventional grid connections. This could allow developing economies to consider ‘leap-frogging’ some degree of centralised generation infrastructure to increase electricity access and meet global sustainable development goals.
5. Energy access and use is being opened up as consumers (especially companies) take control of how their energy needs are met and managed, enabled by growing options for distributed energy resources. If regulations and regulators empower them, consumers have the option to generate power for their own consumption and sell their excess electricity back into the grid, to leave the grid completely, or only use grid supply to supplement their own generation. They can choose electricity providers and utilise new energy management technologies to determine how to use energy. New technologies, such as blockchain or predictive analytics, will support this trend. Policymakers must evolve regulatory frameworks to integrate new opportunities arising from distributed energy resources and, potentially more proactive consumers, to respond to rising and rapidly evolving demands and options for energy use.
Implications for the energy sectorTo achieve long-term energy goals and enable policy innovation, as well as reform, to play a part in navigating the Energy Trilemma, policymakers and regulators need urgently to focus on these emerging technologies. New opportunities can be created, but may be associated with the disruption of existing market frameworks, roles and responsibilities, leading to a reconsideration of the energy services provided and how the costs for energy services are recovered.
As countries transition from one archetype to another, the role of energy incumbents will change. This transition will need active management given the financial exposure of other economic sectors. Without coherent and predictable policy and regulatory frameworks in place, incumbents may refrain from making the necessary and new investments that may, in turn, affect system reliability and affordability. Energy incumbents need to work with regulators to develop effective and responsive tariff and pricing models to cover the cost for operating, upgrading and maintaining grids, as well as providing back-up capacity.
If consumers – residential, commercial and industrial – are enabled by regulators to exploit these new opportunities, regulators will also need to ensure equity for all consumers across the energy system. As distributed energy resources give consumers with financial capacity and empowered by suitable aggregation services the opportunity to manage energy cost and price volatility, it exposes those consumers without financial capacity to price increases.

MONITORING NATIONAL ENERGY SYSTEMS
21
Distributed energy resources could also offer scope to reduced carbon emissions and address localised pollution and some empowered consumers are already using them to meet their own environmental sustainability goals. Regulators will need to consider how their market frameworks can adapt to support suitably distributed energy resources while improving the environmental sustainability of their power systems.
Recommendations Evolving technology and customer demands are two key drivers of a transition of the electricity system at an unprecedented pace. Policymakers should develop their own in-depth analysis of the potential opportunities and challenges that may arise in their own countries or regions from adopting distributed energy resources. Regulatory frameworks must evolve to integrate new opportunities to balance the Energy Trilemma effectively. The 2017 World Energy Trilemma research has identified three key focus areas for policymakers and industry leaders to consider in order to build a resilient energy system of tomorrow:
• Enable a dynamic and resilient market framework with the agility to adapt with the transitioning system. The market framework must be responsive and resilient to the future changes that will arise from new consumers and evolving customer needs and technological advances, as well as changing roles and responsibilities of market participants. Within this dynamic environment, regulators will need to enable adaptable funding mechanisms for rates and charges to support the necessary continued investment in the energy system.
• Establishing robust technology-neutral regulations supported by agreed standards with all stakeholders will be key to building a more dynamic and resilient market framework that supports transitioning energy systems. This includes standards for project development and financing to reduce cost and inefficiencies. Technical interoperability and service harmonisation, as well as standards to promote uptake and integration of distributed generation and distributed energy resources, are critical.
• Allow and plan for aggregator services to empower consumers to be more proactive by ensuring that the market framework can adapt to their evolving and shifting needs. Technology will provide new options to access and consume energy so the framework design will need to enable consumers to make those choices. This will require a different approach of considering what consumers may want and ’reverse engineering’ a market framework to facilitate new market entrants while keeping the trilemma goals in balance.
The energy transition is an unstoppable phenomenon. There will be leaders, learners and laggards, and adapting to this new reality with innovative policy responses and new business models will require an enormous effort. The ability of companies and policymakers to respond rapidly, creatively and collaboratively will determine the pace and shape of the global transition and, in turn, affect the ability of societies across the world to navigate the energy trilemma of security, sustainability and equity successfully. Governments and regulators need to plan for the transitions and anticipate its likely impacts on energy systems and market actors.

WORLD ENERGY COUNCIL | ENERGY TRILEMMA INDEX | 2017
22
2 Regional Energy Profiles

MONITORING NATIONAL ENERGY SYSTEMS
23
2. REGIONAL ENERGY PROFILES The variability in performance seen across the three dimensions of the Trilemma Index shows the degree to which the energy challenges faced by each country are unique. However, the transnational nature of both energy markets and environmental sustainability issues necessitates a view that extends beyond individual countries to the regional level. This section presents regional Energy Trilemma balances and performances, and outlines the trilemma challenges and opportunities that countries in each region will face as they manoeuver through the ‘grand transition’.
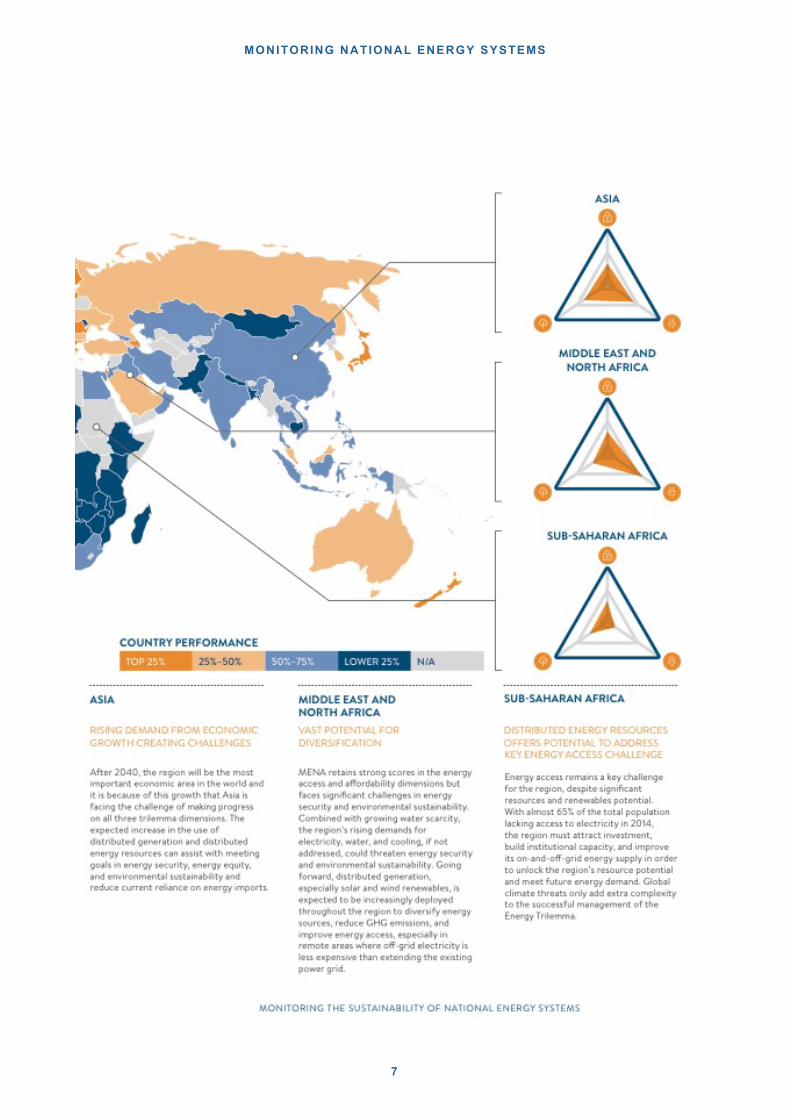
ASIA Between 2040 and 2050, Asia will surpass North America and Europe combined in terms of GDP, population size, military spending, health, education, governance and technological investment. It is in this context that Asia is facing the challenge of facilitating sustainable growth and making progress on all three trilemma dimensions. The anticipated increasing use of distributed generation and distributed energy resources can assist with meeting energy goals in energy security, energy equity and environmental sustainability.
The region includes a diverse array of economies, with less developed countries (Nepal and Pakistan), rapidly developing economies (China, India, Indonesia), and highly developed nations (Japan, the Republic of Korea, New Zealand). Asian countries vary enormously in their energy resources, as well as in their physical, social, cultural and economic backgrounds. Diverse challenges require each country to plot their own path forward.
Overall, the region is weak in all three energy trilemma dimensions and many countries in the region are currently in the lower half of the 2017 Energy Trilemma Index. There are increasing concerns for energy security across the region due to rapidly growing energy demand and import dependence. In 2011, China replaced the United States as the world largest energy consumer14. Meanwhile, India’s energy demand will double by 2035 on the back of economic and population growth. As a result, most Asian countries’ energy import dependence is increasing and among ASEAN, only Malaysia and Brunei Darussalam remain as net oil exporters15. The high energy import dependence, coupled with other factors such as weather-related disruptions pose increasing energy supply risks to this region. The strong energy demand also challenges environmental sustainability performance with Asia being the world’s biggest greenhouse gas (GHG) emitter, accounting for around a third of global GHG emissions in 2014, more than the European Union and 14 World energy scenario
15 http://canaryusa.com/energy-games-asia-increasing-energy-demands-increasing-imports/

WORLD ENERGY COUNCIL | ENERGY TRILEMMA INDEX | 2017
24
the United States combined16. In terms of energy equity, there are approximately 512 million people in the region lacking access to electricity, with the majority residing in rural areas17. Furthermore, Asia has the largest number of people that lack access to clean cooking, with nearly 50% of people in developing Asia still replying on biomass for cooking18.
In response to rising energy demands, the region is moving fast and playing an increasingly important role in renewable energy development. For example, China leads the world in terms of wind and solar capacity, contributing to more than half of global energy savings since the 1990s19. As part of commitments made in the global Paris Climate agreement, China aims for its carbon emissions to peak by 203020. On the other hand, given the region’s rapid economic growth and urbanization, Asia is still home to the world’s second largest population without electricity access. In order to solve the Energy Trilemma issue in Asia, the region needs to ensure that the ever-increasing energy demand is met while at the same time improving energy access and resilience.
Distributed generation holds significant potential for increasing energy security and access. Improving energy access is challenging in many countries, such as India and Nepal as well as island states such as Indonesia and the Philippines that have an uneven distribution of energy infrastructure. For these countries, the majority of the population without access to electricity resides in isolated communities and consists of low-income households. For example in Nepal, 97% of the urban population had access to electricity in 2012, compared with 71% in rural areas21. This is partly due to the scattered nature of the population in remote mountainous areas in Nepal, where grid expansion is extremely expensive and infeasible. Micro hydropower plants (MHPs) have become the major source of off-grid electricity in rural Nepal -by 2014, more than 1000 MHPs with a total generation capacity of 22 MW were providing off-grid electricity access to 20% of the population in Nepal22. In island countries like Indonesia, renewable energy microgrids are gradually replacing high cost diesel to produce power. In order to attract higher levels of private investment, the country recently issued the Accelerating Electrification in Rural Areas policy to grant ’Business Area’ concession to investors to guarantee that the national grid will not impede on the company’s service area.
However, scaling up electricity access through rapid DG expansion can create other challenges. For example, in remote areas in China such as Qinghai and Tibet, local governments built microgrids for electricity access. However, the lithium-ion batteries used for storage led to high costs being incurred as the batteries required replacing every four to five years. To solve this problem, longer-life alternative-flow batteries are being introduced and gradually adopted in China and other Asian markets. By 2024, it is expected that the US energy storage market, the largest in the world, will be overtaken in size by China, Japan and India23.
Highly developed countries such as Japan and Korea are turning towards the use of distributed generation and distributed energy resources to improve energy security and environmental sustainability. Japan is driving a transition from a centralized energy archetype system to a hybrid archetype system in partial response to the shock to the energy system resulting from the aftermath of the April 2011 earthquake and tsunami. In response to the plan of phasing out nuclear power as a result of the disaster, the government 16 World Economic Forum, 2016, As the World’s biggest emitter, can Asia lead the charge against climate change?
17 IEA, 2016, World Energy Outlook 2016 – Electricity Access Database
18 http://www.worldenergyoutlook.org/resources/energydevelopment/energyaccessdatabase/
19 World Economic Forum, 2016, As the World’s biggest emitter, can Asia lead the charge against climate change?
20 http://www.abc.net.au/news/2017-03-02/china-coal-cuts-and-renewables-transform-climate-change-leader/8316660
21 World Bank data
22 The World Bank, 2015, Ensuring the sustainability of rural electrification in Nepal
23 Inframation News, 2017: Success Dragon outlines China solar Plus storage ambitious

MONITORING NATIONAL ENERGY SYSTEMS
25
has set a new energy policy to balance energy security, with coal-fired power contributing to 56% of the baseload. To achieve this goal, 43 coal-fired power projects are planned or under construction, resulting in 127 million tonnes of CO2 being emitted every year24. While fossil-fueled generation continues to ensure more than half of the baseload, renewable generation is building up. By developing greater distributed generation, the goal is to develop a more reliable and disaster-resilient energy supply. Japan’s progress into a hybrid system was further accelerated by the deregulation of its household electricity market in April 2016. The regulatory reform is expected to promote competition, enable prosumers, and drive customer adoption of distributed energy resources. Nonetheless, management of the transition could also be very challenging due to the cost implications that will arise from updating the ageing infrastructure in order to cope with the updated distributed energy system.
EUROPE Europe continues to dominate the Trilemma Index in 2017, with nine European countries occupying the top ten places globally and all countries placed inside the top 100. But European countries need to guard against complacency and maintain focus on balancing the competing challenges of the Energy Trilemma. Key challenges remain with navigating the energy transition and ensuring that governance and regulations remain fit for purpose in a fast-evolving energy system.
Europe performs well in terms of the environmental sustainability dimension once again this year, with European countries claiming seven of the top ten spots. 20-20-20 targets set by the European Union in 2010, as well as the implications of the economic crisis, have helped to ensure that carbon and energy intensity have decreased, with the EU as a whole on track to meet the 20% target by 202025.
Nevertheless, long-term energy security remains a challenge. An over emphasis on climate change goals in the past has left EU member countries increasingly reliant on energy imports, with almost 73% of fossil fuels consumed in 2015 being imported compared with only 53% 25 years ago. Ongoing gas disputes between Russia and the EU have caused strain on countries particularly reliant on Russian gas in recent years26, as in central and eastern Europe, however promises by the US to step up LNG supply provide a 24 http://www.world-nuclear.org/information-library/country-profiles/countries-g-n/japan-nuclear-power.aspx
25 http://europa.eu/rapid/press-release_MEMO-17-163_en.htm 26 http://www.dw.com/en/europe-more-energy-efficient-but-still-import-dependent/a-37641114

WORLD ENERGY COUNCIL | ENERGY TRILEMMA INDEX | 2017
26
credible alternative to Russia’s influence in this regard. Tax and national regulation based competition amongst member states in order to protect national energy industries has only served to exacerbate security worries27, with a fragmentation of energy policies across Europe remaining a key issue for the proposed Energy Union strategy to tackle in the future.
An average household retail electricity price annual increase of 3.2% between 2008 and 2015 has meant energy affordability has become an increasingly key issue for consumers in most European countries28. Taxes and levies used to support EU renewable energy and combined heat and power projects have steadily increased their share of the final electricity bill for households, with the average taxes and levies share increasing from 28% to 38% from 2008 to 2015. In Denmark, this figure was the highest amongst EU member states during the second half of 2016, with taxes and levies accounting for 67.8% of the final electricity price for household consumers.29 However, as these revenues are used to finance energy efficiency and RES investments in Denmark, overall it reduces the net impact to the households’ energy bills.
Although there are certainly Trilemma challenges present in Europe, there are also many examples where the effective integration of Distributed Energy Resources (DER) as well as Distributed Generation (DG) has turned these into opportunities.
There are examples of how micro-CHP installations, when integrated with the grid, can serve as back-up power to utilities and can help increase energy security, amongst other benefits. Projects run in both Germany and the Netherlands, including ‘Powermatching City’ in Groningen, found that the potential for micro-CHP to work as a Virtual Power Plant (VPP) had benefits for consumers as well as the electricity network and operators.30 The result is a sustainable, resilient system that is sufficiently prepared for the future.31
Small-scale, distributed generation projects in Europe can also yield significant price savings to consumers in the community if conducted using appropriate stakeholder negotiation, financial and community support. For example, in Feldheim, Germany a combination of EU and Government subsidies, together with contributions from local residents and a local energy company, supported a construction of a parallel grid network for electricity and heating. Using wind turbines, solar PV, biogas and biomass plant, the grid works in parallel to the national grid to set energy prices independently.
Furthermore, digitalization projects involving demand response and sectoral coupling have delivered new efficiencies in European countries where they are well implemented. However, often such opportunities are hindered by missing or incomplete regulations.
Increasing interconnection capacity in Europe can also be effective in helping countries to manage their security of supply effectively. The proposed Midcat gas connection between France and Spain would help to reduce Europe’s dependence on Russian gas, as well as help Spain to manage an overcapacity in renewable energy32, providing benefits for security for all countries. Understandings between cross-national and government bodies – such as a Memorandum of Understanding signed between the European Commission and the Baltic Sea Region countries in 2015 supported by financing from the EU Connecting 27 https://www2.deloitte.com/content/dam/Deloitte/global/Documents/Energy-and-Resources/gx-er-energy-market-reform-in-europe.pdf
28 http://ec.europa.eu/energy/sites/ener/files/documents/com_2016_769.en_.pdf
29 http://ec.europa.eu/eurostat/statistics-explained/index.php/Electricity_price_statistics
30 http://www.cogeneurope.eu/medialibrary/2015/05/19/d6648069/miro-CHP%20study_merged.pdf
31 https://www.dnvgl.com/technology-innovation/broader-view/electrifying-the-future/smart-energy-systems.html
32 https://ec.europa.eu/energy/sites/ener/files/documents/2014_countryreports_spain.pdf
MONITORING NATIONAL ENERGY SYSTEMS
27
Europe Facility (CEF) – has also helped to set political commitments that are able to better coordinate national energy policies more effectively, realizing improvements insecurity of supply and integration of renewable energies in the long-term.33
As a result of EU overall Greenhouse Gas (GHG) reduction targets of 40% by the year 2030, as well as specific emission reduction targets of 40% for all new cars sold by 202134, many European countries are increasingly looking at the use of Electric Vehicles (EVs) as one method of using distributed energy resources in order to reduce GHG emissions, and thereby improving their environmental sustainability Trilemma dimension35. Norway is a clear EV pacesetter with the highest per capita number of all-electric cars in the world, with EVs accounting for around 40% of newly registered passenger cars in the country in 2016. Norway’s use of friendly transit policies and strong financial incentives has enabled EVs to compete with internal combustion (ICE) vehicles36 but is likely to be difficult to replicate elsewhere.37
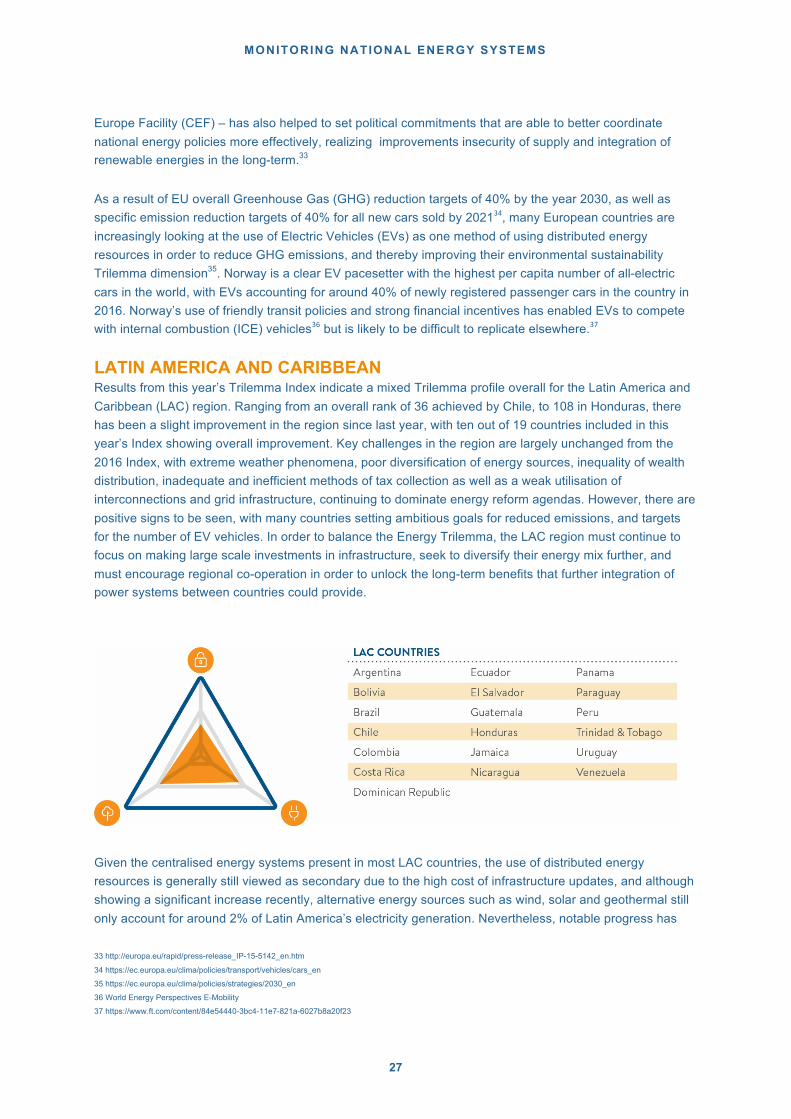
LATIN AMERICA AND CARIBBEAN Results from this year’s Trilemma Index indicate a mixed Trilemma profile overall for the Latin America and Caribbean (LAC) region. Ranging from an overall rank of 36 achieved by Chile, to 108 in Honduras, there has been a slight improvement in the region since last year, with ten out of 19 countries included in this year’s Index showing overall improvement. Key challenges in the region are largely unchanged from the 2016 Index, with extreme weather phenomena, poor diversification of energy sources, inequality of wealth distribution, inadequate and inefficient methods of tax collection as well as a weak utilisation of interconnections and grid infrastructure, continuing to dominate energy reform agendas. However, there are positive signs to be seen, with many countries setting ambitious goals for reduced emissions, and targets for the number of EV vehicles. In order to balance the Energy Trilemma, the LAC region must continue to focus on making large scale investments in infrastructure, seek to diversify their energy mix further, and must encourage regional co-operation in order to unlock the long-term benefits that further integration of power systems between countries could provide.
Given the centralised energy systems present in most LAC countries, the use of distributed energy resources is generally still viewed as secondary due to the high cost of infrastructure updates, and although showing a significant increase recently, alternative energy sources such as wind, solar and geothermal still only account for around 2% of Latin America’s electricity generation. Nevertheless, notable progress has 33 http://europa.eu/rapid/press-release_IP-15-5142_en.htm
34 https://ec.europa.eu/clima/policies/transport/vehicles/cars_en
35 https://ec.europa.eu/clima/policies/strategies/2030_en
36 World Energy Perspectives E-Mobility
37 https://www.ft.com/content/84e54440-3bc4-11e7-821a-6027b8a20f23

WORLD ENERGY COUNCIL | ENERGY TRILEMMA INDEX | 2017
28
been made to promote general DG adoption in the region, and examples of distributed generation projects are present in many countries. For example, in 2010 Costa Rica launched a net metering pilot program to promote small-scale, distributed renewable energy. It also aimed to gather data on the impacts of small-scale renewable projects on the national grid in order to improve future energy planning38. Barbados also demonstrated how well-structured incentives can boost demand for renewable distributed generation and reduce utility-scale generation. In 2013 the country published an extensive tax incentive policy to encourage activities related to renewable energy, especially distributed generation. By 2015, the policy led to a 7% cut in generation from thermal plants and a subsequent increase in solar DG systems adoption, resulting in solar meeting almost 8% of the country’s electricity needs39.
Looking at the energy security dimension, with only four of the 19 countries included in this year’s Index making it into the top 50 countries for energy security globally, and several countries lying outside of the top 100, energy security remains a key challenge for the region. A high reliance on hydropower means that the effects of changing weather patterns such as El Niño and La Niña, as well as extreme weather events in the region, remain a significant issue. Projected rises in electricity usage between 2.3 -2.7 times by 206040 mean that there is still a pressing need for large-scale infrastructure development, as well as regional integration. Nevertheless, there are signs of improvement to be seen. Twelve LAC countries improved their energy security ranking this year, with Brazil, Panama and Jamaica all rising by over 20 places. Examples such as the Central American Integrated System Project (SIEPAC), which aims to improve energy security through integrating regional power systems, show how the region is adapting to the challenge of energy resilience. By minimizing the risk of energy supply shortage through facilitating a multilateral agreement for a joint use of natural gas and hydropower reservoirs, Panama managed to recover from an energy crisis resulting from a prolonged drought in 2013 that reduced the levels of reservoirs at hydroelectric dams by importing electricity generated elsewhere in Central America and transmitted across the SIEPAC network41.
As noted in the World Energy Council’s 2017 Latin America & the Caribbean Energy Scenarios publication, LAC countries must seek to improve energy resilience to extreme weather events and look to diversify the energy mix with the use of decentralised and/or low-carbon generation sources42. Costa Rica’s focus on diversifying energy generation through increasing investment in non-hydro renewables is one example. Although hydropower is Costa Rica’s dominant energy source, accounting for 74% of electricity generation in 2016, the country has been investing heavily in wind farms, expanding its wind generating capacity from only 2.1% in 2009 to 10.5% of electricity generation in 201743. In addition, Costa Rica generated 12.8% of the country’s electricity with geothermal energy in 201644, and in 2013 ranked sixth in the world in terms of the percentage of electricity generated from geothermally generated sources45. The results are evident - in 2016 the country ran on 100% renewable electricity for more than 250 days, with renewable power suppling 98.1% of the national electricity demand, slightly down from the 98.8% in 2015. This is especially significant given the effects El Niño had on countries in the region in 2015, and considering that the country experienced low rainfall levels throughout 201646. With such a diverse mix of renewable energy sources, 38 WorldWatch Institute, The way forward for renewable energy in central America, 2013
39 http://global-climatescope.org/en/region/lac/
40 https://www.worldenergy.org/wp-content/uploads/2017/03/LAC-Scenarios_summary-report_English_WEB_2017.05.25.pdf
41 http://www.iadb.org/en/news/webstories/2013-06-25/energy-integration-in-central-america,10494.html
42 https://www.worldenergy.org/wp-content/uploads/2017/03/LAC-Scenarios_full-report_English.pdf
43 http://www.ticotimes.net/2015/11/17/costa-rica-increases-wind-power-generation
44 https://www.weforum.org/agenda/2017/04/costa-rica-ran-entirely-on-renewable-energy-for-more-than-250-days-last-year/
45 http://www.worldwatch.org/system/files/CA_report_highres_english_2013.pdf - p.25
46 http://www.independent.co.uk/environment/costa-rica-renewable-energy-electricity-production-2016-climate-change-fossil-fuels-global-warming-a7505341.html
MONITORING NATIONAL ENERGY SYSTEMS
29
Costa Rica can take advantage of a greater availability of wind and biomass to guarantee sustainable renewable generation of energy - even during the dry season47.
In 2014 the richest 10% of the population in Latin America owned 71% of the region’s wealth, and this severe inequality continues to be reflected in Trilemma energy equity scores, with only one country in the LAC region placed in the top 50 countries globally in 2017. In addition, while the LAC region was the developing region that came closest to achieving 100% electricity access in 201448, there are nearly 30 million people in the region that are still without electricity access, most of whom are located in isolated rural areas with low population densities. Increasingly, rural electrification strategies and policies have recognized the important role that distributed generation in the form of off-grid renewables can play in addressing electricity access. For example, acknowledging that grid extension was not a viable solution in providing access to households located in the Amazon region, the Brazilian Electricity Regulatory Agency (ANEEL)issued a special project manual that included 85% of a capital subsidy allocated for renewable energy in order to support mini-grid installation. As a result, at least 15 small hydropower plants and one solar PV plant were operational in remote Amazon areas in 2010. In addition, for remote areas where the grid is not able to reach, such as regions in the Amazon basin, utilities are mandated to develop mini-grid systems in their service territories. Private players have been contracted to implement mini-grids under a Build-Own-Operate (BOO) arrangement, and many LAC countries use auctions to encourage uptake. The long-term nature of the contract helps developers to reduce project risk, attracting more investors and eventually leading to a price decline for renewables. Peru, for example, introduced the National PV household Electrification Programme in 2013, aiming to provide electricity to 500,000 households with solar PV. To achieve the goal, it held its first off-grid renewable energy auction in 2014 for a 15-year power supply concession using solar PV. The result was an increase in electricity access in the country from 72.5% in 200049 to 93% in 2014. As highlighted in this year’s complementary Trilemma Report, Colombia is also looking to integrate distributed energy resources into the energy mix in order to help increase its electricity access rate from 96% to 100%, using a combination of off-grid, micro-grid and PV solar with storage. Achieving universal access will require a combination of decentralised and centralised approaches.
Although showing the most variability out of all Trilemma dimensions, with countries ranging from rank 7 to rank 122, environmental sustainability remains LAC’s strongest Trilemma dimension, with Costa Rica and Uruguay exhibiting a particularly good performance at ranks 7 and 10 respectively. Although showing signs of decrease in recent years, the LAC region still derives a significant amount of electricity from hydropower, accounting for 54% of the overall electricity mix in 2014.50As a result, many countries in the LAC region with a high environmental sustainability dimension – such as Costa Rica and Uruguay - owe their success in part to leveraging these strong hydropower capabilities. In Brazil and Colombia in particular, the extensive use of hydropower has led to lower GHG emissions, as well as higher electrification rates.
It is important to note the potential role that EVs could play in lessening the region’s pollution problem that is particularly evident in many cities. The transport sector in Latin America accounts for the largest and fastest-growing source of energy-related emissions51, being responsible for more than one-third of CO2 emissions in 2014, and some countries are starting to view EVs as a potential solution to this. In Colombia electrification of the transport fleet – including buses and taxes – has been identified as a top priority, with the city of Bogota hoping to substitute its entire bus fleet with hybrid and electric vehicles by 2024. In Chile, 47 http://www.ticotimes.net/2016/12/16/renewable-electricity-costa-rica
48 http://gtf.esmap.org/data/files/download-documents/eegp17-01_gtf_full_report_for_web_0516.pdf
49 http://www.irena.org/DocumentDownloads/Publications/IRENA_Market_Analysis_Latin_America_2016.pdf
50 https://www.worldenergy.org/wp-content/uploads/2017/03/LAC-Scenarios_summary-report_English_WEB_2017.05.25.pdf
51 http://www.thedialogue.org/wp-content/uploads/2015/10/Green-Transportation-The-Outlook-for-Electric-Vehicles-in-Latin-America.pdf

WORLD ENERGY COUNCIL | ENERGY TRILEMMA INDEX | 2017
30
where the transport sector is expected to grow by 40% by 2020 under a business-as-usual scenario, electric vehicles have been recognised as one way of combatting the current air quality problem in cities, and officials aim to increase the amount of EVs to 70,000 by 2020. Given the region’s access to large stores of hydro generation, if current barriers are reduced - including high upfront costs, a lack of charging infrastructure and grid reliability – increased uptake of EVs could be an excellent way of improving the region’s environmental sustainability dimension. Other environmental sustainability results for the region also show promising signs – the LAC energy sector is the least carbon intensive in the developing world, and cumulative carbon emissions from 2014 to 2060 are projected to account for only 4.7-5.1% of the world’s total emissions52.
MIDDLE EAST AND NORTH AFRICA The Middle East and North Africa (MENA) performs strongly in energy access and affordability dimensions but faces significant challenges with respect to energy security and environmental sustainability. Countries are challenged by high energy intensity and GHG emissions and a high penetration of conventional energy resources. Combined with growing water scarcity, if the region’s growing demands for electricity, water, and cooling, are not addressed, the energy security and environmental sustainability dimensions could be threatened even further. Going forward, distributed generation powered by solar and wind renewables is expected to be deployed increasingly throughout the region in order to diversify energy sources, reduce GHG emissions, and improve energy access, particularly in remote areas where off-grid electricity is less expensive than extending the existing power grid.
MENA countries have comparatively weaker energy security performance than other regions despite tremendous fossil fuel resources, with MENA accounting for 54.9% of global oil and 50.3% of global gas reserves. However, the region is challenged by energy demand management and low energy diversity. The region is expected to see energy consumption grow by 70% from 2009 to 2035, twice the global primary energy demand increase53. Meanwhile, fossil fuels continue to supply the majority of the region’s primary energy needs, with renewable energy only contributing approximately 1% of the total energy mix. Along with high fossil fuel use the Middle East has high energy-related greenhouse gas emissions and these are expected to increase by 47% from 2010 to 2035 – which is significantly higher than the global growth rate of 20%. As a result, most countries in the region score poorly in environmental sustainability dimension, with the exception of Egypt and Tunisia. Tunisia has focused on renewable development over the past five years, with wind power capacity increasing eightfold from 2008 to 2012. Compared with the marginal use of
52 https://www.worldenergy.org/wp-content/uploads/2017/03/LAC-Scenarios_full-report_English.pdf
53 http://library.fes.de/pdf-files/iez/08959.pdf
MONITORING NATIONAL ENERGY SYSTEMS
31
renewable energy in the region, Tunisia has been leading the way with a 14% renewable energy share in 201354.
Overall, the region currently has relatively modest use of renewables and is substantially lagging behind the world average renewable use of 13.2% of all energy supply55. This is despite the region’s vast potential for renewable energy - estimated at 45% of the total global potential for renewable energy. The region receives approximately 22% to 26% of all solar energy striking the earth, which is believed to be sufficient to meet the current global electricity needs56. With long sunshine hours and extensive land available for the construction of solar panels, the region has ideal conditions for the adoption of solar energy and distributed generation. As a result, many MENA countries are focused on improving energy efficiency, diversifying their energy mix through an increased use of solar and nuclear power, and examining how distributed generation (on-grid and off-grid) and distributed energy resources can help address Energy Trilemma challenges and meet energy goals. The region currently lags behind in the adoption of PV distributed generation and so the growth of distributed generation and distributed energy resources will require an evolution in regulatory frameworks – for example, allowing wheeling of power and net metering.
Many countries are launching efforts to improve energy performance by leveraging distributed generation and renewables. Dubai, for example, has initiated several interrelated programmes to control electricity consumption substantially and promote renewable energy. As a part of the Distributed Resources Generation programme, the Shams Dubai initiative encourages households and building owners to install PV panels for local electricity supply and to connect them to DEWA’s (Dubai Electricity and Water Authority) grid to export any surplus to the national network. In addition, to encourage more efficient energy consumption habits, smarter urban electrical grids are being adopted to monitor usage over time. Taken together, these measures have saved more than 1,100 gigawatt-hours of electricity and reduced carbon dioxide emissions by over 536,000 tons in Dubai from 2009 to 201457.
Distributed generation is also being used to improve rural electrification. An estimated 20 million people in the MENA region lived without access to even a basic level of electricity in 201058, particulaly in rural areas without grid access. In this situation, off-grid renewables are an attractive option and Morocco’s Global Rural Electrification Programme (PERG) is one example of a rural electrification programme that included solar and wind technologies. Under this programme, expensive, inefficient and polluting diesel generators are replaced by decentralized electrification systems based on mini-networks driven by wind and hydroelectric power or individual PV systems. Rural electrification rates hit 100% by 201259 with solar PV representing 10% of village electrification in the country.
Renewable energy is also being deployed to improve performance on the environmental sustainability dimension. Egypt has seen its environmental sustainability rank increase by 15 places in 2017 to top the region. This is in line with the country’s ambitious plan of generating 20% of the national electricity from renewable sources by 202060. To achieve this goal, the government has been gradually removing energy subsidies, and has launched a Feed-in Tariff schedule to allow for private investments in renewable energy 54 IRENA, MENA Renewables status report
55 https://www.iea.org/about/faqs/renewableenergy/
56 The Potential of Renewable Energy in MENA, IFC KNOWLEDGE SERIES IN MENA, Series 5 - see
http://www.ifc.org/wps/wcm/connect/c6a15e8042cbdd4daa2bee384c61d9f7/Knowledg+issue+05+v6.pdf?MOD=AJPERES&The%20Potential%20of%20Renewable%20En
ergy%20in%20MENA
57 DEWA saves Dh752m through energy efficiency measures,” Emirates 24/7, April 8, 2015 (http://www.emirates247.com/business/energy/dewa-saves-dh752m-through-
energy-efficiency-measures-2015-04-08-1.586734)
58 http://www.ren21.net/Portals/0/documents/activities/Regional%20Reports/MENA_2013_lowres.pdf
59 Index data from world bank
60 https://www.iea.org/policiesandmeasures/pams/egypt/name-24583-en.php
WORLD ENERGY COUNCIL | ENERGY TRILEMMA INDEX | 2017
32
projects, and has a Feed-in Tariff in place for distributed generation PV rooftop systems. Due to Egypt’s green initiatives in the past decade, the country has reduced its CO2 per capita from 2.27 tonnes in 2012 to 1.95 tonnes in 201561.
There are other initiatives across the region to increase distributed generation. For example, net metering and power wheeling schemes have supported the expansion of small distributed generation PV in Jordan, and Kuwait has plans to roll out a program for multi-home rooftop PV across the country.
However, there are barriers that create significant challenges for the MENA economies when considering adopting renewable energy and distributed generation more generally. Firstly, most MENA countries subsidize domestic consumption of hydrocarbons. Subsidies are intended to promote social stability, nevertheless, it comes at the expense of government spending capability on other sectors and hinders energy efficient practices and consumer-led distributed generation adoption in the region. In addition, despite growing recognition of renewable energy, factors such as insufficient transmission grid capacity and inadequate regulatory frameworks as well as low investor confidence and low levels of foreign direct investments due to the complex political and security landscape in many MENA countries are also challenging renewable energy and distributed generation development in the region.
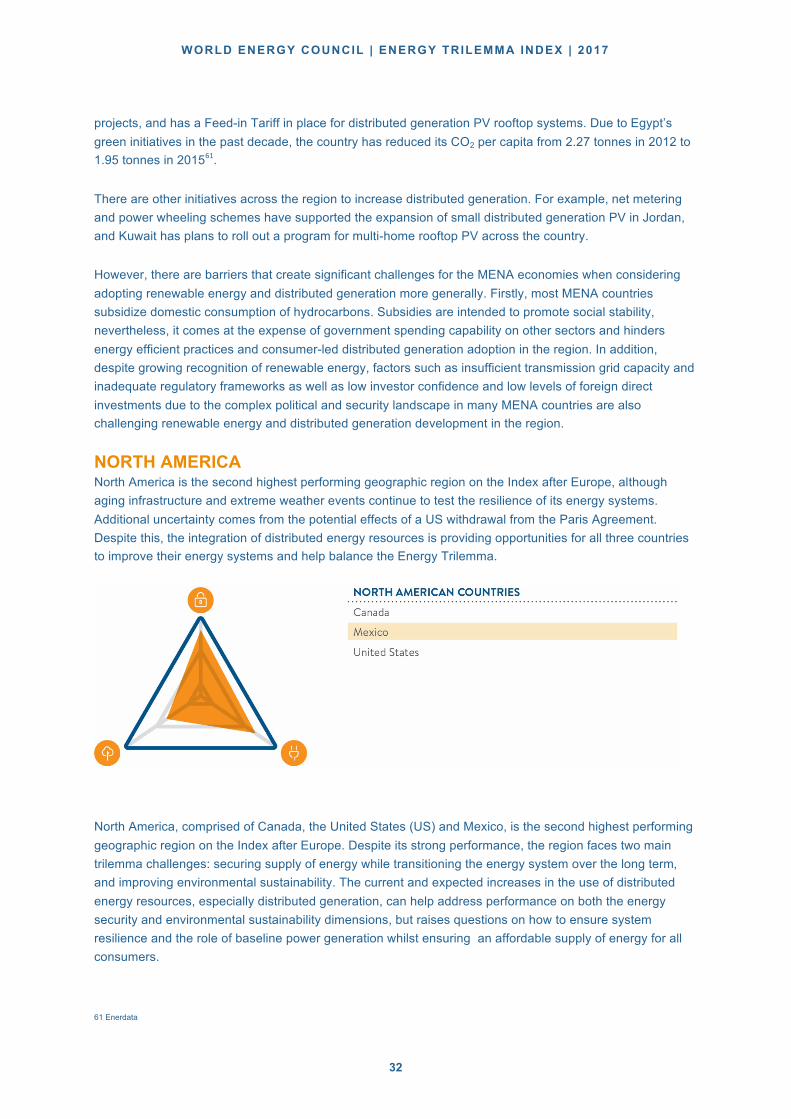
NORTH AMERICA North America is the second highest performing geographic region on the Index after Europe, although aging infrastructure and extreme weather events continue to test the resilience of its energy systems. Additional uncertainty comes from the potential effects of a US withdrawal from the Paris Agreement. Despite this, the integration of distributed energy resources is providing opportunities for all three countries to improve their energy systems and help balance the Energy Trilemma.
North America, comprised of Canada, the United States (US) and Mexico, is the second highest performing geographic region on the Index after Europe. Despite its strong performance, the region faces two main trilemma challenges: securing supply of energy while transitioning the energy system over the long term, and improving environmental sustainability. The current and expected increases in the use of distributed energy resources, especially distributed generation, can help address performance on both the energy security and environmental sustainability dimensions, but raises questions on how to ensure system resilience and the role of baseline power generation whilst ensuring an affordable supply of energy for all consumers.
61 Enerdata

MONITORING NATIONAL ENERGY SYSTEMS
33
North America is well endowed with fossil fuel resources, including oil, natural gas, and coal, and also has significant hydropower potential. Due to the region’s natural resource endowment, energy security concerns are related to diversifying energy sources, updating aging energy infrastructure and increasing resilience to extreme weather events. Increased severity of extreme weather events are testing the reliability of North American energy infrastructure and posing challenges to future operations. For example, the period from 2013-2016 saw four of the top five hottest years on record62, and as temperatures continue to rise, air conditioning driven electricity demand will grow, while at the same time high temperatures reduce the efficiency of aging transmission lines.
The region also needs to improve performance on the environmental sustainability dimension. Reducing the carbon footprint and mitigating the impacts of GHG emissions is especially important for North America due to the region’s status as a top emitter of GHG. In 2013, North America accounted for approximately16% of total global GHG emissions63, making it the second-highest emitting region behind Asia. Distributed energy resources, especially distributed generation, provide opportunities for all three countries to address energy security and environmental sustainability challenges. Aging generational infrastructure across the region further emphasizes the importance of investments in new generation capacity and energy demand management. Canada, Mexico, and the US all face the challenge of updating aging energy infrastructure to accommodate new technologies and resources, services and service providers. The infrastructure deficit in the U.S. is pegged at $USD3.6 trillion64; in Canada, it is C$570 billion65. Smart grids and DER will be important components in modernizing the aging system, easing the integration of distributed resources, while potentially reducing demand from traditional generating sources and offering opportunities to increase energy efficiency. Canada, for example, is investing half a billion dollars (Canadian) of public funds in smart grid projects.
North America’s transition from the current energy generation paradigm to one with a higher proportion of distributed energy resources, especially renewable distributed generation, raises questions on how to manage and structure the energy system to ensure supply and demand. For example, reliability of the electric system can be impacted by the addition of DER when the resources are not controllable or viewable by the system operator. The intermittency and seasonality of some forms of distributed generation, especially solar and wind, add to the challenge.
There has been significant increase in distributed generation units in the US; these are mainly single solutions (in particular solar panels) both connected and not connected to the distribution grid. In the US, New York and California are currently leaders in developing a comprehensive strategy for the deployment of DER and stimulating a change to the regulated investor-owned utility model. New York has initiated a number of distributed generation programs and pilot distributed generation projects with a focus on improving resilience in case of extreme weather by increasing consumers’ self-sufficiency. By contrast, California, has been pursuing distributed generation with a focus on improving environmental sustainability. The state currently has 5600MW of installed capacity from distributed generation66, and the main utility operator has proposed allowing any distributed generation system with at least 0.5KW of capacity to connect to the grid, with operator control only required for systems with over 10KW of capacity67.
62 NOAA National Centers for Environmental Information, State of the Climate: Global Climate Report for Annual 2016, published online January 2017, retrieved on
August 22, 2017 from https://www.ncdc.noaa.gov/sotc/global/201613
63 http://data.worldbank.org/indicator/EN.ATM.CO2E.KT
64 https://www.infrastructurereportcard.org/solutions/investment/
65 https://www.theglobeandmail.com/report-on-business/rob-commentary/a-national-infrastructure-bank-will-ensure-canadas-long-term-prosperity/article35237546/
66 http://www.californiadgstats.ca.gov/

WORLD ENERGY COUNCIL | ENERGY TRILEMMA INDEX | 2017
34
Looking forward, regulatory uncertainty remains a key challenge for the US energy sector with the government’s recent decision to withdraw from the Paris Climate Agreement68. However, despite the uncertain regulatory climate around sustainable energy, commitment among Americans remains high to support the development of additional solar and wind, and the positive trend seen in recent years may continue.
Canada is one of the top five energy producers in the world and is a net exporter of electricity to the US. Sixty-one percent of Canada’s power needs are met by hydroelectricity. The country had an installed DG capacity of about 5GW as of 201469. With a large country and relatively small population, using a locally-placed, sustainable method of generation can increase the reliability and availability of power, diversify the electricity portfolio while increasing overall environmental sustainability. Distributed generation systems can be especially helpful in rural areas, where long transmission lines from central power generation sources are highly susceptible to failure and reduce efficiency of production. In addition, local renewable powered distributed generation can help rural communities that may currently rely on diesel powered plants.
Mexico is a signee of the Paris climate accord and pledged to reduce energy consumption by 22% over 2010 levels, leading to efforts to improve performance in the environmental sustainability dimension. For example, in 2016, Mexico City introduced new building regulations designed to increase the energy efficiency of their buildings, and it is estimated that efficiency measures will reduce building energy usage by up to 20 percent70.
Mexico is expected to experience an explosion of renewable energy, with laws in place requiring 35% of energy generation to come from clean sources, up from 25% today71. Most of the advances are expected with solar power, as wind power is developing slowly in Mexico, with only 3 GW of installed power in 201572. Looking at solar energy, the Secretariat of Energy estimates solar electricity generation capacity to increase by 3.5 GW between 2016 and 2018. Solar resources are the main components of distributed systems in Mexico, making up 97% of new installations in 2015. Distributed generation is especially important for providing reliable energy for remote communities in Mexico, and contributing to the country’s achievement of the country’s Paris agreement goals.
Mexico’s energy secretary (SENER) has taken a number of steps to support the increase of solar DG. For example, new guidelines for the interconnection of small solar system to the national electricity grid were introduced in 2017 to make it easier and more attractive for residential and commercial consumers to invest in solar energy. The government also increased the electricity price by 25% for high consumption users toincentivise the adoption of distribution generation further. By 2016, Mexico reached 220 MW of distributed rooftop solar generation capacity, and this number is forecasted to double in 2017 and eventually reach the government’s goal of 500,000 domestic rooftop solar systems interconnected to the grid73.
67 https://www.greentechmedia.com/articles/read/californias-plan-to-turn-distributed-energy-resources-into-grid-market-play
68 https://www.nytimes.com/2017/06/01/climate/trump-paris-climate-agreement.html?mcubz=0
69 Hiscock, Jennifer, Smart Grid in Canada 2014, report # 2015-018 RP-ANU 411-SGPLAN, Natural Resources Canada, March 2015 .
70 http://www.wrirosscities.org/news/mexico-city-prioritizes-building-efficiency-new-regulations
71 Secretariat of Energy, Mexico: Renewable Energies Outlook 2016-2030
72 Mexico Energy Outlook, International Energy Agency
73 http://www.theyucatantimes.com/2017/04/mexico-cuts-red-tape-relating-to-small-solar-energy-system-installations/
https://www.nrel.gov/docs/fy17osti/66026.pdf

MONITORING NATIONAL ENERGY SYSTEMS
35
SUB-SAHARAN AFRICA Eighteen out of the 25 countries included in this year’s Index for the Sub-Saharan region are placed outside the top 100 overall, with only Mauritius being placed in the top 50 due to a strong performance in environmental sustainability. Energy access remains a key challenge for the region, despite significant resources and renewables potential. To unlock the region’s resource potential and meet future energy demand, the region must attract investment, build institutional capacity and improve its on-grid and off-grid energy supply.
The region is well endowed with natural resources including fossil fuels, hydropower and renewables, and Sub-Saharan Africa has 16% of the global population. However, it uses the lowest amount of commercial energy in the world, using less than 700 kilograms of oil equivalent per capita - compared with a North American average of 7,844 kg. In addition, Africa is particularly vulnerable to climate change impacts, and such global threats add another level of complexity when trying to balance the Trilemma across the region. Due to its high poverty level and limited adaptation capabilities, areas of scarce water and rain-fed agricultural production are particularly at risk74. For example, in 2016 the effects of an especially strong El Niño and higher than average temperatures left over 20 million people in East Africa food insecure, with 10 million people requiring food aid in Ethiopia alone75. By contrast, in 2012 Nigeria suffered unprecedented levels of flooding, displacing 1.3 million people from their homes.76
With 21 out of 25 countries in the region lying outside the top 100, energy equity remains the region’s worst performing dimension. The region has the world’s largest number of people living without access to electricity, accounting for almost 65% of the total population in 2014, or around 632 million people.77 Furthermore, electricity demand in the region grew by around 45% from 2000 to 2012, with Nigeria and South Africa the largest consumers and being responsible for more than 40% of total demand78. It is predicted that the electricity demand will continue to increase at an average rate of 2% a year until 204079 due to a strong rate of economic expansion, population growth, urbanization and industrialization in the region. However, with limited generation capacities and installed power grids, the supply of electricity is lagging behind demand growth, resulting in a complex and persistent electricity gap in most Sub-Saharan Africa countries. In addition, in some cases even the presence of a grid connection does not guarantee electricity access, or that people will even use it. For example, Nigeria has a grid connection rate of 96%, but only 18% of connections work properly around 50% of the time80, and 41% of Nigerian businesses opt to generate their own electricity in addition to 74 https://africacheck.org/factsheets/factsheet-why-africa-is-vulnerable-to-climate-change/
75 https://docs.unocha.org/sites/dms/Documents/El%20Nino%20Monthly%20Overview%209%20March%2016.pdf
76 https://www.irinnews.org/feature/2017/05/03/flood-ridden-nigeria-farmers-need-more-help-adapting-climate-change
77 IEA, 2014
78 IEA, 2014
79 IEA, 2014
80 http://theconversation.com/what-lies-behind-africas-lack-of-access-and-unreliable-power-supplies-56521
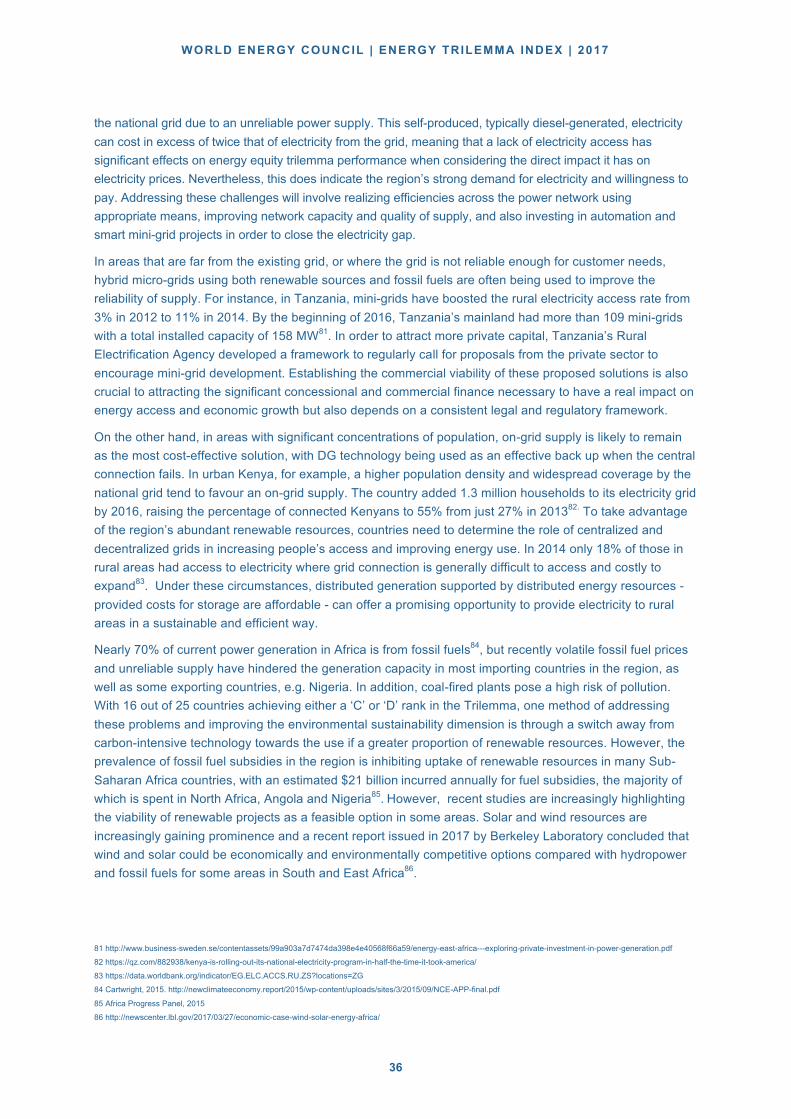
WORLD ENERGY COUNCIL | ENERGY TRILEMMA INDEX | 2017
36
the national grid due to an unreliable power supply. This self-produced, typically diesel-generated, electricity can cost in excess of twice that of electricity from the grid, meaning that a lack of electricity access has significant effects on energy equity trilemma performance when considering the direct impact it has on electricity prices. Nevertheless, this does indicate the region’s strong demand for electricity and willingness to pay. Addressing these challenges will involve realizing efficiencies across the power network using appropriate means, improving network capacity and quality of supply, and also investing in automation and smart mini-grid projects in order to close the electricity gap.
In areas that are far from the existing grid, or where the grid is not reliable enough for customer needs, hybrid micro-grids using both renewable sources and fossil fuels are often being used to improve the reliability of supply. For instance, in Tanzania, mini-grids have boosted the rural electricity access rate from 3% in 2012 to 11% in 2014. By the beginning of 2016, Tanzania’s mainland had more than 109 mini-grids with a total installed capacity of 158 MW81. In order to attract more private capital, Tanzania’s Rural Electrification Agency developed a framework to regularly call for proposals from the private sector to encourage mini-grid development. Establishing the commercial viability of these proposed solutions is also crucial to attracting the significant concessional and commercial finance necessary to have a real impact on energy access and economic growth but also depends on a consistent legal and regulatory framework.
On the other hand, in areas with significant concentrations of population, on-grid supply is likely to remain as the most cost-effective solution, with DG technology being used as an effective back up when the central connection fails. In urban Kenya, for example, a higher population density and widespread coverage by the national grid tend to favour an on-grid supply. The country added 1.3 million households to its electricity grid by 2016, raising the percentage of connected Kenyans to 55% from just 27% in 201382. To take advantage of the region’s abundant renewable resources, countries need to determine the role of centralized and decentralized grids in increasing people’s access and improving energy use. In 2014 only 18% of those in rural areas had access to electricity where grid connection is generally difficult to access and costly to expand83. Under these circumstances, distributed generation supported by distributed energy resources - provided costs for storage are affordable - can offer a promising opportunity to provide electricity to rural areas in a sustainable and efficient way.
Nearly 70% of current power generation in Africa is from fossil fuels84, but recently volatile fossil fuel prices and unreliable supply have hindered the generation capacity in most importing countries in the region, as well as some exporting countries, e.g. Nigeria. In addition, coal-fired plants pose a high risk of pollution. With 16 out of 25 countries achieving either a ‘C’ or ‘D’ rank in the Trilemma, one method of addressing these problems and improving the environmental sustainability dimension is through a switch away from carbon-intensive technology towards the use if a greater proportion of renewable resources. However, the prevalence of fossil fuel subsidies in the region is inhibiting uptake of renewable resources in many Sub-Saharan Africa countries, with an estimated $21 billionincurred annually for fuel subsidies, the majority of which is spent in North Africa, Angola and Nigeria85.However, recent studies are increasingly highlighting the viability of renewable projects as a feasible option in some areas. Solar and wind resources are increasingly gaining prominence and a recent report issued in 2017 by Berkeley Laboratory concluded that wind and solar could be economically and environmentally competitive options compared with hydropower and fossil fuels for some areas in South and East Africa86.
81 http://www.business-sweden.se/contentassets/99a903a7d7474da398e4e40568f66a59/energy-east-africa---exploring-private-investment-in-power-generation.pdf
82 https://qz.com/882938/kenya-is-rolling-out-its-national-electricity-program-in-half-the-time-it-took-america/
83 https://data.worldbank.org/indicator/EG.ELC.ACCS.RU.ZS?locations=ZG
84 Cartwright, 2015. http://newclimateeconomy.report/2015/wp-content/uploads/sites/3/2015/09/NCE-APP-final.pdf 85 Africa Progress Panel, 2015
86 http://newscenter.lbl.gov/2017/03/27/economic-case-wind-solar-energy-africa/

MONITORING NATIONAL ENERGY SYSTEMS
37
Country Profiles

WORLD ENERGY COUNCIL | ENERGY TRILEMMA INDEX | 2017
38
COUNTRY PROFILES Country profiles provides the Index rankings overall and per dimension for each of the World Energy Council's member country represented in the 2017 Trilemma Index as well as their balance score. The Trilemma graph on each country profile illustrates the balance score, which highlights the trade-offs between the three competing dimensions: energy security, energy equity, and environmental sustainability. The table on the right hand side shows the Index rankings from three consecutive years broken down by dimension and trends in performance over the years. Furthermore, the country profile provides an indication of trends and future developments, an overview of the country’s energy endowment, contributions of energy sources to total primary energy supply and electricity generation as well as relevant key metrics to provide more context.
Interactive country profiles and associated data can also be viewed on the Index web tool, which has been developed by the World Energy Council, in partnership with global management consultancy Oliver Wyman and the Global Risk Centre of its parent Marsh & McLennan Companies. The tool can be accessed via: https://trilemma.worldenergy.org
HOWTOINTERPRETCOUNTRYPROFILES:DEFINITIONS
Industrialsector(%GDP) %oftotalGDPthatisintheindustrialsector(CIAWorldFactBook,2014)
GDPpercapita,PPPUS$(GDPGroup
Grossdomesticproduct(WorldBank2015)andIndexGDPgroup
Energyintensity(koeperUS$)
MeasureshowmuchenergyisusedtocreateoneunitofGDP(Enerdata&WorldEnergyCouncil,2014)
Diversityofinternationalenergysuppliers
Indicatestowhatextentthecountryisdependentonenergytradingpartners.DiversityofinternationalenergysupplierscalculatedthroughtheHerfindahl-HirschmanIndex(HHI),(UNCTAD,2014).
Populationwithaccesstoelectricity(%)
Shareofpopulationwithaccesstoelectricity(SE4All,2012)
Accesstocleancookinginurban|ruralareas(%)
%ofhouseholdsthathaveaccesstonon-solidfuelsinurbanandruralareas(SE4All,2012)
Householdelectricityprices(US$/kWh)
Averagecostofelectricity(IEA,Eurostat,WorldEnergyCouncil,WorldBank,2015)
Rateoftransmissionanddistributionlosses(%)
Theratiobetweenthequantityofenergylostduringtransportanddistributionandtheelectricityconsumption.Indicatesefficiencyofinfrastructure(EnerdataandWorldEnergyCouncil,2014)
CO2intensity(kCO2perUS$)
MeasuresCO2fromfuelcombustiontogenerateoneunitofGDPinPPP(EnerdataandWorldEnergyCouncil,2014)
GHGemissiongrowthrate2010–2014(%)
Greenhousegasemissiongrowthratefromtheenergysectorbetween2000and2012,(WRI/CAIT,2012)
Fossilfuelreserves Resourceendowment(WorldEnergyCouncil,2016:WorldEnergyResources).Foradditionalenergyresources,forexample,unconventionalorrenewableenergysources,visitwww.worldenergy.org/data/resources
Diversityoftotalprimaryenergysupply
Diversityofenergysupply&diversityofelectricitygeneration:Contributorsofenergysourcestototalprimaryenergysupplyandelectricitygeneration,indicatingcurrentresilienceonfossilfuelsorotherenergysourcesintheenergyandelectricitysectorrespectively(IEA,2013)Diversityofelectricity
generation
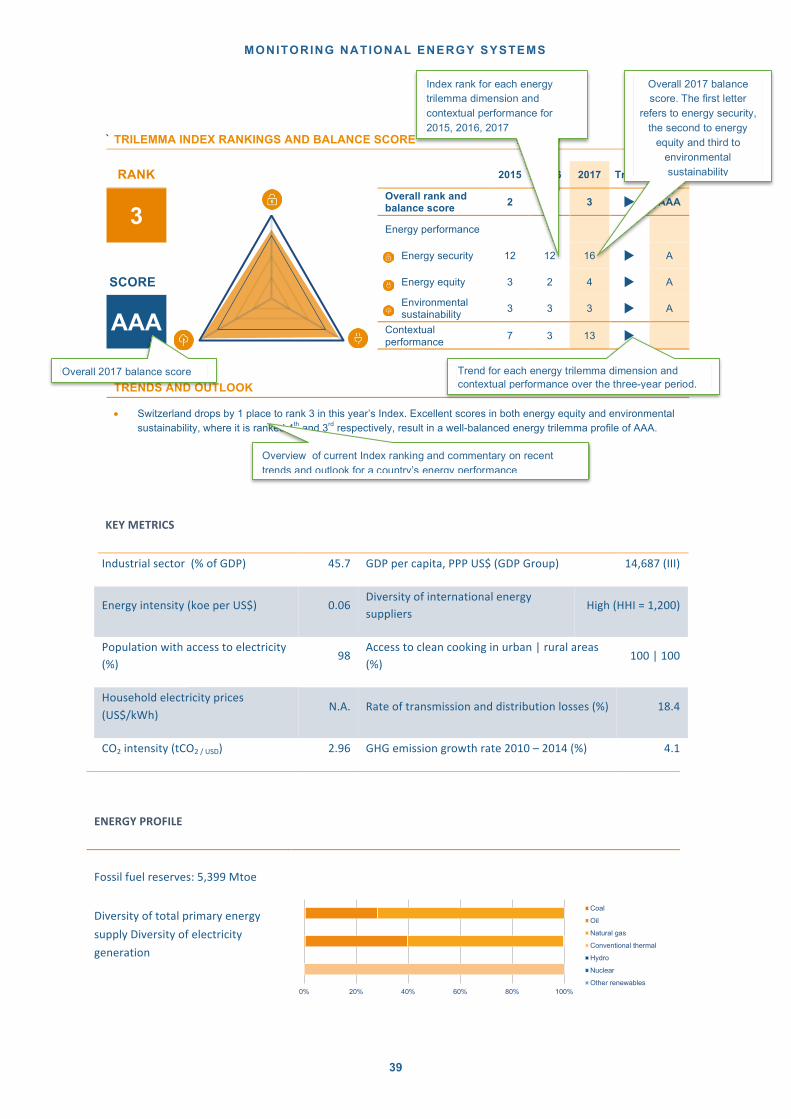
MONITORING NATIONAL ENERGY SYSTEMS
39
SWITZERLAND
TRILEMMA INDEX RANKINGS AND BALANCE SCORE
RANK 2015 2016 2017 Trend Score
3 Overall rank and
balance score 2 2 3 u AAA
Energy performance
Energy security 12 12 16 u A
SCORE Energy equity 3 2 4 u A
AAA Environmental
sustainability 3 3 3 u A
Contextual performance
7 3 13 u
TRENDS AND OUTLOOK
• Switzerland drops by 1 place to rank 3 in this year’s Index. Excellent scores in both energy equity and environmental sustainability, where it is ranked 4th and 3rd respectively, result in a well-balanced energy trilemma profile of AAA.
• Switzerland’s leading position in the Index reflects the country’s past energy and energy-related policy decisions. Recent policy decisions, however, are likely to have a strong impact on the country’s energy sustainability balance.
• Recent energy policy developments include the decision to refrain from building new nuclear power plants, to reduce energy consumption, increase energy efficiency and to promote renewable energies. In a popular vote in May 2017, the Swiss people approved these initial measures. The entire energy strategy is expected to be implemented fully by 2050. The measures and next steps to phase out nuclear are not yet known, and will be a matter of political discussions in the next few months (a public referendum is probable). To achieve the transition to a low-carbon energy system in the long term, in the mid-term Switzerland is likely to become more dependent on electricity imports.
• Policymakers need to focus on: 1) construction of new electricity grids; 2) completing the liberalisation of the electricity market; 3) securing energy supply after the phase-out of nuclear power plants; and 4) coming to a bilateral agreement with the EU in order to participate in the European internal energy market and the EU-ETS. Furthermore, there is the need to be ambitious and increase the renovation rate of buildings as part of the transition to a low-carbon energy system.
KEY METRICS
Industrial sector (% of GDP) 25.5 GDP per capita, PPP US$ (GDP Group) 62,881 (I)
Energy intensity (koe per US$) 0.05 Diversity of international energy suppliers Medium (HHI = 2,270)
Population with access to electricity (%) 100 Access to clean cooking in rural | urban areas (%) 100 | 100
Household electricity prices (US$/kWh) 0.16 Rate of transmission and distribution losses (%) 7.6
CO2 intensity (kCO2 per US$) 0.10 GHG emission growth rate 2000 – 2013 (%) -0.2
ENERGY PROFILE
Fossil fuel reserves: 0 Mtoe
Total primary energy supply composition
Diversity of electricity generation
0% 20% 40% 60% 80% 100%
Coal
Oil
Naturalgas
Conventionalthermal
Nuclear
Hydro
Otherrenewables
`
KEYMETRICS
Industrialsector(%ofGDP) 45.7 GDPpercapita,PPPUS$(GDPGroup) 14,687(III)
Energyintensity(koeperUS$) 0.06Diversityofinternationalenergysuppliers
High(HHI=1,200)
Populationwithaccesstoelectricity(%)
98Accesstocleancookinginurban|ruralareas(%)
100|100
Householdelectricityprices(US$/kWh)
N.A. Rateoftransmissionanddistributionlosses(%) 18.4
CO2intensity(tCO2/USD) 2.96 GHGemissiongrowthrate2010–2014(%) 4.1
ENERGYPROFILE
Fossilfuelreserves:5,399Mtoe
DiversityoftotalprimaryenergysupplyDiversityofelectricitygeneration
Overall 2017 balance score. The first letter
refers to energy security, the second to energy
equity and third to environmental sustainability
Overall 2017 balance score
0% 20% 40% 60% 80% 100%
Coal
Oil
Natural gas
Conventional thermal
Hydro
Nuclear
Other renewables
Index rank for each energy trilemma dimension and contextual performance for 2015, 2016, 2017
Trend for each energy trilemma dimension and contextual performance over the three-year period.
Overview of current Index ranking and commentary on recent trends and outlook for a country’s energy performance

WORLD ENERGY COUNCIL | ENERGY TRILEMMA INDEX | 2017
40
ALGERIA
TRILEMMA INDEX RANKINGS AND BALANCE SCORE
RANK 2015 2016 2017 Trend Score
65 Overall rank and
balance score 58 66� 65 X� CBC
Energy performance � �
Energy security 88 88� 81 X� C
SCORE Energy equity 36 37� 37 X� B
CBC Environmental
sustainability 70 80� 79 X� C
Contextual performance 103 108� 101 X�
TRENDS AND OUTLOOK
• Algeria improves by 1 place in this year’s Index, to rank 65. Algeria performs well in energy equity, but lags behind in energy security and environmental sustainability, resulting in a balance score of CBC.
• Algeria has continuously developed its economy and improved its energy system. Energy policies have been implemented to intensify oil and gas exploration efforts to increase reserves, to promote renewable energy and energy efficiency and increase the share of renewables in electricity generation to 40% by 2030.
• Policymakers should continue to focus on: 1) increasing the proportion of renewable energy in electricity generation; 2) the development of energy efficiency because there is great potential for improvement; 3) the development of a renewable energy industry that is economically sustainable; and 4) the development and support of research and development (R&D) and training to increase the transfer of knowledge and technology.
KEY METRICS
Industrial sector (% of GDP) 38.9 GDP per capita, PPP US$ (GDP Group) 15,075 (II)
Energy intensity (koe per US$) 0.07 Diversity of international energy suppliers High (HHI = 1,175)
Population with access to electricity (%) 100 Access to clean cooking in rural | urban areas (%) 100 | 100
Household electricity prices (US$/kWh) N.A. Rate of transmission and distribution losses (%) 16.3
CO2 intensity (kCO2 per US$) 0.27 GHG emission growth rate 2000 – 2013 (%) 3.8
ENERGY PROFILE
Fossil fuel reserves: 5,397 Mtoe
Total primary energy supply composition
Diversity of electricity generation 0% 20% 40% 60% 80% 100%
Coal
Oil
Natural gas
Conventional thermal
Nuclear
Hydro
Other renewables

MONITORING NATIONAL ENERGY SYSTEMS
41
ARGENTINA
TRILEMMA INDEX RANKINGS AND BALANCE SCORE
RANK 2015 2016 2017 Trend Score
58 Overall rank and
balance score 61 58 58 u BBC
Energy performance
Energy security 51 48 52 u B
SCORE Energy equity 69 69 61 u B
BBC
Environmental
sustainability 69 69 72 u C
Contextual
performance 92 92 92 u
TRENDS AND OUTLOOK
• Argentina maintains its rank this year at 58. The country performs well in all trilemma dimensions, with environmental
sustainability being the country’s weakest dimension, resulting in a balance score of BBC.
• The Government, in power since December 2015, is trying to reverse the deep energy crisis that the former had
created. Among the measures taken are: 1) Gradual reduction of subsidies for gas and electricity demand; 2)
Renegotiation of the distribution and transmission tariffs that have been frozen since 2002; 3) Price increases for non-
conventional gas (USD 7,5 MMBTU), to be gradually reduced over 3 years; 4) International bids for renewable energy
projects that have resulted in more than 2000 MW offered; 5) Bids for new thermal capacity.
• The state-controlled oil company YPF has an aggressive programme in shale gas areas, entering into contracts with
private international companies including Chevron, Shell, Exxon, Statoil and Petronas. However, the country’s oil
production continues to fall (6% per year) and gas production remains stable. Local costs of production are still too
high and therefore there is a need to subsidise prices to producers. With subsidies to shale gas representing 30% of
all energy subsidies, the Government is making big efforts to reduce these costs. The country continues to be a net
importer of energy (approx. 15%), but importation costs have been reduced drastically, especially for LNG imports.
KEY METRICS
Industrial sector (% of GDP) 28.1 GDP per capita, PPP US$ (GDP Group) 19,934 (II)
Energy intensity (koe per US$) 0.07 Diversity of international energy suppliers High (HHI = 1,338)
Population with access to electricity (%) 100 Access to clean cooking in rural | urban areas (%) 100 | 99
Household electricity prices (US$/kWh) 0.01 Rate of transmission and distribution losses (%) 17.7
CO2 intensity (kCO2 per US$) 0.24 GHG emission growth rate 2000 – 2013 (%) 2.0
ENERGY PROFILE
Fossil fuel reserves: 610 Mtoe
Total primary energy supply composition
Diversity of electricity generation
0% 20% 40% 60% 80% 100%
Coal
Oil
Naturalgas
Conventionalthermal
Nuclear
Hydro
Otherrenewables
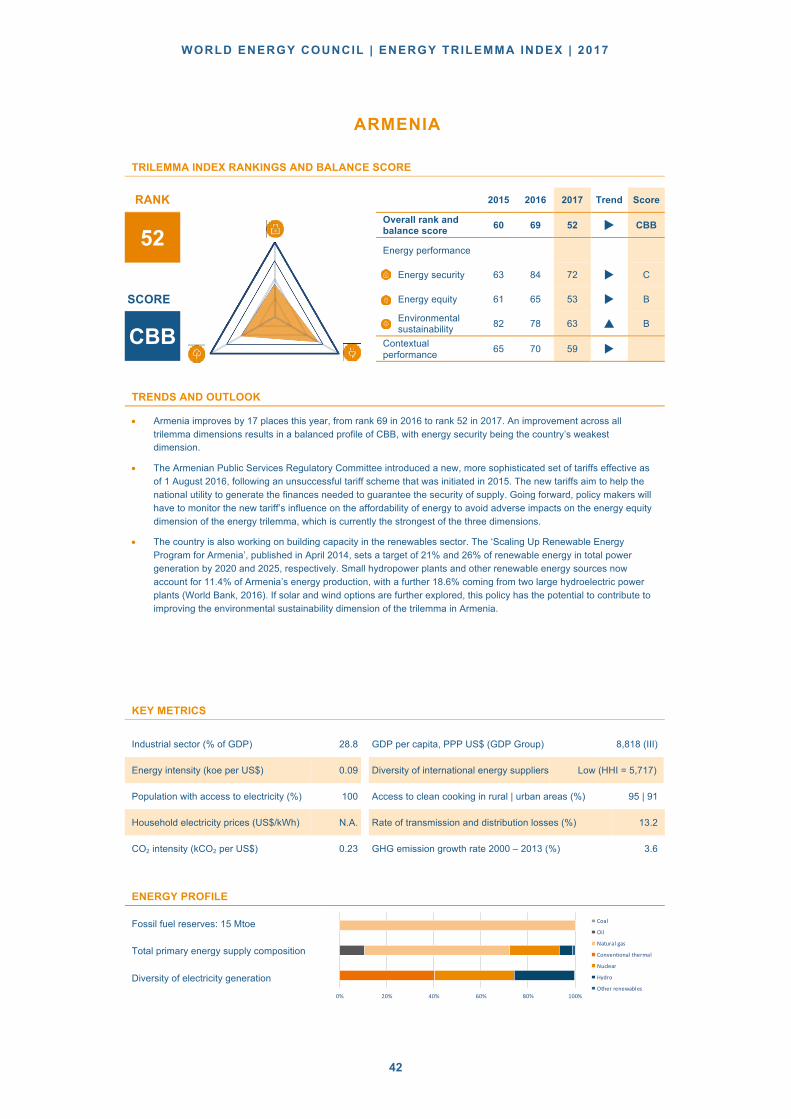
WORLD ENERGY COUNCIL | ENERGY TRILEMMA INDEX | 2017
42
ARMENIA
TRILEMMA INDEX RANKINGS AND BALANCE SCORE
RANK 2015 2016 2017 Trend Score
52 Overall rank and
balance score 60 69 52 u CBB
Energy performance
Energy security 63 84 72 u C
SCORE Energy equity 61 65 53 u B
CBB Environmental
sustainability 82 78 63 p B
Contextual performance 65 70 59 u
TRENDS AND OUTLOOK
• Armenia improves by 17 places this year, from rank 69 in 2016 to rank 52 in 2017. An improvement across all trilemma dimensions results in a balanced profile of CBB, with energy security being the country’s weakest dimension.
• The Armenian Public Services Regulatory Committee introduced a new, more sophisticated set of tariffs effective as of 1 August 2016, following an unsuccessful tariff scheme that was initiated in 2015. The new tariffs aim to help the national utility to generate the finances needed to guarantee the security of supply. Going forward, policy makers will have to monitor the new tariff’s influence on the affordability of energy to avoid adverse impacts on the energy equity dimension of the energy trilemma, which is currently the strongest of the three dimensions.
• The country is also working on building capacity in the renewables sector. The ‘Scaling Up Renewable Energy Program for Armenia’, published in April 2014, sets a target of 21% and 26% of renewable energy in total power generation by 2020 and 2025, respectively. Small hydropower plants and other renewable energy sources now account for 11.4% of Armenia’s energy production, with a further 18.6% coming from two large hydroelectric power plants (World Bank, 2016). If solar and wind options are further explored, this policy has the potential to contribute to improving the environmental sustainability dimension of the trilemma in Armenia.
KEY METRICS
Industrial sector (% of GDP) 28.8 GDP per capita, PPP US$ (GDP Group) 8,818 (III)
Energy intensity (koe per US$) 0.09 Diversity of international energy suppliers Low (HHI = 5,717)
Population with access to electricity (%) 100 Access to clean cooking in rural | urban areas (%) 95 | 91
Household electricity prices (US$/kWh) N.A. Rate of transmission and distribution losses (%) 13.2
CO2 intensity (kCO2 per US$) 0.23 GHG emission growth rate 2000 – 2013 (%) 3.6
ENERGY PROFILE
Fossil fuel reserves: 15 Mtoe
Total primary energy supply composition
Diversity of electricity generation 0% 20% 40% 60% 80% 100%
Coal
Oil
Naturalgas
Conventionalthermal
Nuclear
Hydro
Otherrenewables

MONITORING NATIONAL ENERGY SYSTEMS
43
AUSTRIA
TRILEMMA INDEX RANKINGS AND BALANCE SCORE
RANK 2015 2016 2017 Trend Score
12 Overall rank and
balance score 11 10 12 u AAB
Energy performance
Energy security 26 20 18 u A
SCORE Energy equity 5 6 8 u A
AAB
Environmental sustainability
24 23 30 u B
Contextual performance
15 16 22 u
TRENDS AND OUTLOOK
• Austria drops by 2 places this year to rank 12. A strong performance across the board, especially for energy equity,
where it ranks 8th globally, results in a well-rounded trilemma profile of AAB.
• Austria’s energy security ranking reflects its increasing energy self-sufficiency, which is also one of the country’s main
long-term goals, as well as the progress made since 1980 in the renewable energy sector, where Austria has nearly
tripled the production of renewable energy.
• Austria’s energy policy rests on three pillars – security of supply, energy efficiency and renewable energy sources.
The country’s decarbonisation drive has strengthened as the economy and renewable energy use have continued to
grow, while fossil fuel use has decreased. Notably, Austria has quadrupled public funding for energy research,
development and demonstration over the past 10 years (2005 to 2015). Research into energy efficiency, smart grids,
storage and renewables define the priorities for publicly financed energy research.
• Policy developments in Austria and targets for 2020 are compatible and in line with EU policy, including 1) increasing
the share of energy consumption produced from renewable resources to 34% by 2020; 2) reducing greenhouse gas
emissions by 16% from 2005 levels for sectors not included in the EU Emissions Trading Scheme (EU-ETS), and
21% from 2005 levels for sectors included in the EU-ETS and 3) 20% improvement in energy efficiency by 2020. In
addition, Austria’s Sustainability Strategy lists 20 goals to increase quality of life overall, strengthen economic growth,
support sustainable goods and services, and optimise the transport system.
KEY METRICS
Industrial sector (% of GDP) 28.3 GDP per capita, PPP US$ (GDP Group) 50,078 (I)
Energy intensity (koe per US$) 0.08 Diversity of international energy suppliers High (HHI = 1,420)
Population with access to electricity (%) 100 Access to clean cooking in rural | urban areas (%) 100 | 100
Household electricity prices (US$/kWh) 0.22 Rate of transmission and distribution losses (%) 5.0
CO2 intensity (kCO2 per US$) 0.20 GHG emission growth rate 2000 – 2013 (%) 0.3
ENERGY PROFILE
Fossil fuel reserves: 15 Mtoe
Total primary energy supply composition
Diversity of electricity generation
0% 20% 40% 60% 80% 100%
Coal
Oil
Naturalgas
Conventionalthermal
Nuclear
Hydro
Otherrenewables

WORLD ENERGY COUNCIL | ENERGY TRILEMMA INDEX | 2017
44
BAHRAIN
TRILEMMA INDEX RANKINGS AND BALANCE SCORE
RANK 2015 2016 2017 Trend Score
62 Overall rank and
balance score 53 59 62 u CAD
Energy performance
Energy security 86 80 84 u C
SCORE Energy equity 9 7 5 u A
CAD Environmental
sustainability 101 104 107 u D
Contextual performance 47 58 54 u
TRENDS AND OUTLOOK
• Bahrain has a rank of 62 in this year’s Index. Whilst performing particularly strongly on energy equity, where it ranks 5th globally, energy security and environmental sustainability remain relatively low. This results in a balance score of CAD.
• Bahrain has some of the lowest electricity and diesel prices in the world, with Bahrain families owning one residence paying approximately ¢0.79/kWh and $37.1/million BTU for electricity and diesel in 2017, respectively. This helps contribute to Bahrain’s excellent score for energy equity
• In 2017 the government endorsed Bahrain’s National Plan for Energy Efficiency (NEEAP) and the National Plan for Renewable Energy (NREAP) via the cabinet Resolution Number 2384/8. The National Plan for Energy Efficiency includes 22 initiatives that affect building design, electricity supply, industrial programmes designed to encourage companies to improve energy efficiency, and initiatives relating to the government and economic sectors. The National Plan for Renewable Energy includes six initiatives relating to solar rooftop projects, renewable energy requirements for some new infrastructure projects, as well as the development of larger, central solar power plant projects. Targets include increasing the share of renewables in the energy mix to 5% by 2025, and to 10% by 2035. Efficiency of energy consumption will also be increased to 6% by 2035.
• The Kingdom of Bahrain Energy Efficiency Plan, an energy strategy plan relating to the establishment of smart metering, new energy building codes and solar applications etc. that was previously the responsibility of the World Bank, is now under the jurisdiction of the Sustainable Energy Unit (SEU).
.
KEY METRICS
Industrial sector (% of GDP) 40.3 GDP per capita, PPP US$ (GDP Group) 46,586 (I)
Energy intensity (koe per US$) 0.08 Diversity of international energy suppliers Low (HHI = 8,742)
Population with access to electricity (%) 100 Access to clean cooking in rural | urban areas (%) 100 | 100
Household electricity prices (US$/kWh) N.A. Rate of transmission and distribution losses (%) 4.0
CO2 intensity (kCO2 per US$) 0.59 GHG emission growth rate 2000 – 2013 (%) 3.9
ENERGY PROFILE
Fossil fuel reserves: 170 Mtoe
Total primary energy supply composition
Diversity of electricity generation 0% 20% 40% 60% 80% 100%
Coal
Oil
Naturalgas
Conventionalthermal
Nuclear
Hydro
Otherrenewables
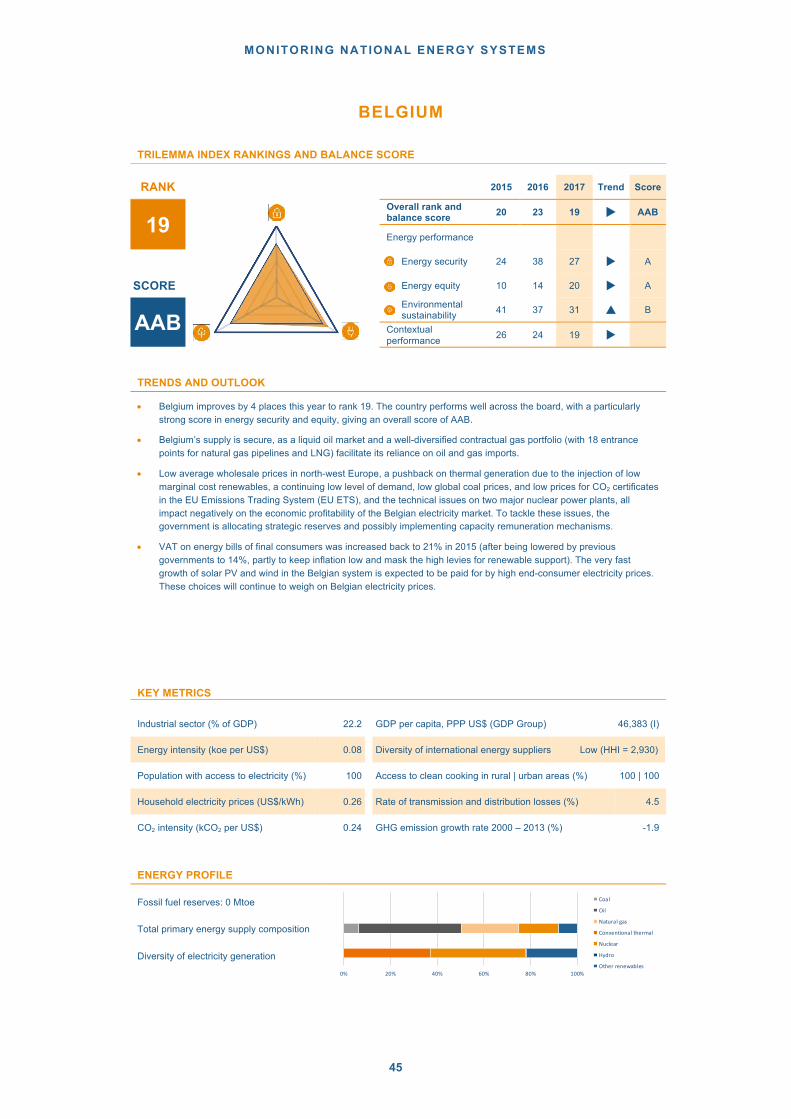
MONITORING NATIONAL ENERGY SYSTEMS
45
BELGIUM
TRILEMMA INDEX RANKINGS AND BALANCE SCORE
RANK 2015 2016 2017 Trend Score
19 Overall rank and
balance score 20 23 19 u AAB
Energy performance
Energy security 24 38 27 u A
SCORE Energy equity 10 14 20 u A
AAB Environmental
sustainability 41 37 31 p B
Contextual performance 26 24 19 u
TRENDS AND OUTLOOK
• Belgium improves by 4 places this year to rank 19. The country performs well across the board, with a particularly strong score in energy security and equity, giving an overall score of AAB.
• Belgium’s supply is secure, as a liquid oil market and a well-diversified contractual gas portfolio (with 18 entrance points for natural gas pipelines and LNG) facilitate its reliance on oil and gas imports.
• Low average wholesale prices in north-west Europe, a pushback on thermal generation due to the injection of low marginal cost renewables, a continuing low level of demand, low global coal prices, and low prices for CO2 certificates in the EU Emissions Trading System (EU ETS), and the technical issues on two major nuclear power plants, all impact negatively on the economic profitability of the Belgian electricity market. To tackle these issues, the government is allocating strategic reserves and possibly implementing capacity remuneration mechanisms.
• VAT on energy bills of final consumers was increased back to 21% in 2015 (after being lowered by previous governments to 14%, partly to keep inflation low and mask the high levies for renewable support). The very fast growth of solar PV and wind in the Belgian system is expected to be paid for by high end-consumer electricity prices. These choices will continue to weigh on Belgian electricity prices.
KEY METRICS
Industrial sector (% of GDP) 22.2 GDP per capita, PPP US$ (GDP Group) 46,383 (I)
Energy intensity (koe per US$) 0.08 Diversity of international energy suppliers Low (HHI = 2,930)
Population with access to electricity (%) 100 Access to clean cooking in rural | urban areas (%) 100 | 100
Household electricity prices (US$/kWh) 0.26 Rate of transmission and distribution losses (%) 4.5
CO2 intensity (kCO2 per US$) 0.24 GHG emission growth rate 2000 – 2013 (%) -1.9
ENERGY PROFILE
Fossil fuel reserves: 0 Mtoe
Total primary energy supply composition
Diversity of electricity generation 0% 20% 40% 60% 80% 100%
Coal
Oil
Naturalgas
Conventionalthermal
Nuclear
Hydro
Otherrenewables

WORLD ENERGY COUNCIL | ENERGY TRILEMMA INDEX | 2017
46
BOLIVIA
TRILEMMA INDEX RANKINGS AND BALANCE SCORE
RANK 2015 2016 2017 Trend Score
101 Overall rank and
balance score 98 100 101 u CCD
Energy performance
Energy security 65 73 71 u C
SCORE Energy equity 97 97 90 u C
CCD
Environmental
sustainability 106 107 110 u D
Contextual
performance 102 110 106 u
TRENDS AND OUTLOOK
• Bolivia drops 1 place in this year’s Index to rank 101. It receives relatively low scores across all trilemma dimensions,
with environmental sustainability remaining its weakest dimension, resulting in a score of CCD.
• Bolivia exports natural gas to Brazil and Argentina, and it has the fifth largest proven natural gas reserves in South
America. Proven oil reserves are relatively small, and the country has become a net oil importer as production fails to
keep pace with consumption. There is good potential for renewable energy, especially from by-products of sugar cane
and wood industries, and hydroelectric, which has not yet been fully exploited.
• Recent developments focus on the oil and gas sector, aiming to replenish oil reserves and maintain natural gas
exports to Brazil and Argentina, through an Investment Act, complemented by a Law of Incentives for the oil sector, a
new hydrocarbons law and a law on prior consultation.
• Key issues for policymakers to focus on: 1) creation of an attractive, enabling environment for investment to flow into
transport of hydrocarbons in both the internal network and future export markets; 2) continuous assessment of
exploration and production potential of domestic natural gas resources; 3) engagement with the general public in
order to increase public acceptance, shorten the time of pre-consultation with indigenous peoples and allow for a
speedier approval of contracts; and 4) further development of renewables, including hydropower.
KEY METRICS
Industrial sector (% of GDP) 32.6 GDP per capita, PPP US$ (GDP Group) 7,236 (III)
Energy intensity (koe per US$) 0.11 Diversity of international energy suppliers Medium (HHI = 1,969)
Population with access to electricity (%) 90 Access to clean cooking in rural | urban areas (%) 39 | 95
Household electricity prices (US$/kWh) 0.10 Rate of transmission and distribution losses (%) 9.4
CO2 intensity (kCO2 per US$) 0.30 GHG emission growth rate 2000 – 2013 (%) 7.3
ENERGY PROFILE
Fossil fuel reserves: 22 Mtoe
Total primary energy supply composition
Diversity of electricity generation
0% 20% 40% 60% 80% 100%
Coal
Oil
Naturalgas
Conventionalthermal
Nuclear
Hydro
Otherrenewables

MONITORING NATIONAL ENERGY SYSTEMS
47
BOTSWANA
TRILEMMA INDEX RANKINGS AND BALANCE SCORE
RANK 2015 2016 2017 Trend Score
98 Overall rank and
balance score 96 94 98 u DCC
Energy performance
Energy security 106 105 103 u D
SCORE Energy equity 92 90 93 u C
DCC Environmental
sustainability 93 92 94 u C
Contextual performance 46 45 49 u
TRENDS AND OUTLOOK
• Botswana drops 4 places this year to rank 98 overall. The country performs poorly on energy security, resulting in a balance score of DCC.
• Botswana’s power sector relies on coal for 60% of electricity generation. The power system – comprising only the Morupule A 132 MW coal-fired power plant − is run by the vertically integrated government-owned utility, Botswana Power Corporation. However, back-up power plants are necessary to meet the country’s peak demand. Botswana relies on an independent power producer running power plants consuming approximately 17,000 litres of diesel/hour, and the country is highly dependent on electricity and diesel imports to meet its peak demand.
• The government has only recently recognised the need to further its strategy for increasing the role of renewables in the energy mix. In particular, Botswana is endowed with ample solar energy potential.
• In 2015, the government asked for assistance from the World Bank for a renewable energy strategy to harness the significant solar potential of the country. In June 2015, the government announced it would release a tender for two 50 MW solar PV plants. Renewable energy currently accounts for less than 2% of the country’s generation mix.
KEY METRICS
Industrial sector (% of GDP) 33.2 GDP per capita, PPP US$ (GDP Group) 16,735 (II)
Energy intensity (koe per US$) 0.06 Diversity of international energy suppliers Low (HHI = 7,977)
Population with access to electricity (%) 56 Access to clean cooking in rural | urban areas (%) 39 | 77
Household electricity prices (US$/kWh) 0.07 Rate of transmission and distribution losses (%) 6.8
CO2 intensity (kCO2 per US$) 0.23 GHG emission growth rate 2000 – 2013 (%) 2.2
ENERGY PROFILE
Fossil fuel reserves: 0 Mtoe
Total primary energy supply composition
Diversity of electricity generation 0% 20% 40% 60% 80% 100%
Coal
Oil
Naturalgas
Conventionalthermal
Nuclear
Hydro
Otherrenewables
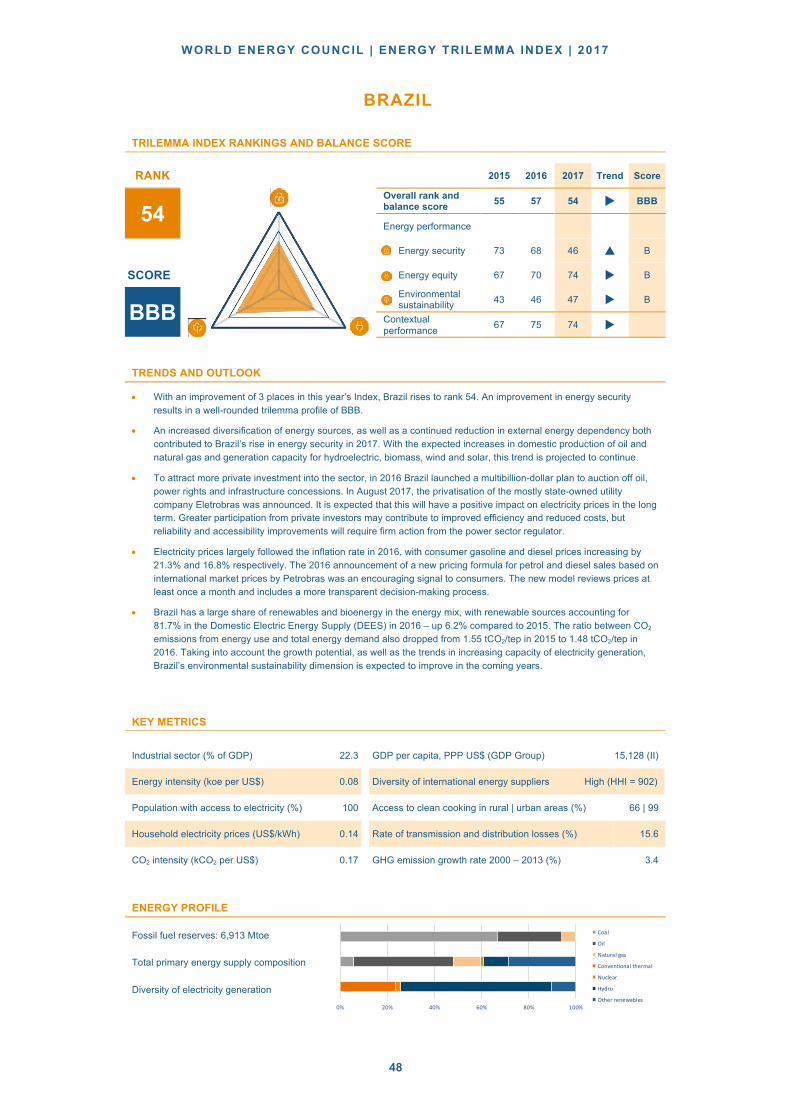
WORLD ENERGY COUNCIL | ENERGY TRILEMMA INDEX | 2017
48
BRAZIL
TRILEMMA INDEX RANKINGS AND BALANCE SCORE
RANK 2015 2016 2017 Trend Score
54 Overall rank and
balance score 55 57 54 u BBB
Energy performance
Energy security 73 68 46 p B
SCORE Energy equity 67 70 74 u B
BBB
Environmental
sustainability 43 46 47 u B
Contextual
performance 67 75 74 u
TRENDS AND OUTLOOK
• With an improvement of 3 places in this year’s Index, Brazil rises to rank 54. An improvement in energy security
results in a well-rounded trilemma profile of BBB.
• An increased diversification of energy sources, as well as a continued reduction in external energy dependency both
contributed to Brazil’s rise in energy security in 2017. With the expected increases in domestic production of oil and
natural gas and generation capacity for hydroelectric, biomass, wind and solar, this trend is projected to continue.
• To attract more private investment into the sector, in 2016 Brazil launched a multibillion-dollar plan to auction off oil,
power rights and infrastructure concessions. In August 2017, the privatisation of the mostly state-owned utility
company Eletrobras was announced. It is expected that this will have a positive impact on electricity prices in the long
term. Greater participation from private investors may contribute to improved efficiency and reduced costs, but
reliability and accessibility improvements will require firm action from the power sector regulator.
• Electricity prices largely followed the inflation rate in 2016, with consumer gasoline and diesel prices increasing by
21.3% and 16.8% respectively. The 2016 announcement of a new pricing formula for petrol and diesel sales based on
international market prices by Petrobras was an encouraging signal to consumers. The new model reviews prices at
least once a month and includes a more transparent decision-making process.
• Brazil has a large share of renewables and bioenergy in the energy mix, with renewable sources accounting for
81.7% in the Domestic Electric Energy Supply (DEES) in 2016 – up 6.2% compared to 2015. The ratio between CO2
emissions from energy use and total energy demand also dropped from 1.55 tCO2/tep in 2015 to 1.48 tCO2/tep in
2016. Taking into account the growth potential, as well as the trends in increasing capacity of electricity generation,
Brazil’s environmental sustainability dimension is expected to improve in the coming years.
KEY METRICS
Industrial sector (% of GDP) 22.3 GDP per capita, PPP US$ (GDP Group) 15,128 (II)
Energy intensity (koe per US$) 0.08 Diversity of international energy suppliers High (HHI = 902)
Population with access to electricity (%) 100 Access to clean cooking in rural | urban areas (%) 66 | 99
Household electricity prices (US$/kWh) 0.14 Rate of transmission and distribution losses (%) 15.6
CO2 intensity (kCO2 per US$) 0.17 GHG emission growth rate 2000 – 2013 (%) 3.4
ENERGY PROFILE
Fossil fuel reserves: 6,913 Mtoe
Total primary energy supply composition
Diversity of electricity generation
0% 20% 40% 60% 80% 100%
Coal
Oil
Naturalgas
Conventionalthermal
Nuclear
Hydro
Otherrenewables

MONITORING NATIONAL ENERGY SYSTEMS
49
BULGARIA
TRILEMMA INDEX RANKINGS AND BALANCE SCORE
RANK 2015 2016 2017 Trend Score
43 Overall rank and
balance score 49 48 43 u BBB
Energy performance
Energy security 52 67 45 u B
SCORE Energy equity 59 55 62 u B
BBB Environmental
sustainability 71 67 62 p B
Contextual performance 50 49 48 u
TRENDS AND OUTLOOK
• Bulgaria improves by 5 places to rank 43. An improvement in energy security results in a well-balanced score of BBB.
• In the spring of 2015, the Bulgarian Parliament amended the existing Energy Act to: increase the political independence of the national regulatory commission; financially stabilise the electricity sector; improve market transparency; promote trans-border trade; and enhance end-user rights. The new legal framework was expected to improve the sustainable use of renewable energy sources, market liberalisation and social equity during the period prior to full liberalisation of the market. The amendments have not yet resulted in the expected improvements.
• Key issues policymakers need to focus on are: 1) improved energy security through stimulation of investments in reliable energy infrastructure, further diversifying sources and routes of energy supply, and optimising the use of indigenous energy resources; 2) increased energy efficiency; 3) prompt actions focused on financial stabilisation of the energy sector; 4) increased social protection; 5) pursuing the ambitious targets of giving 30% of households access to natural gas by 2020 as set out in the national energy strategy; and 6) respect for the rule of law.
KEY METRICS
Industrial sector (% of GDP) 27.9 GDP per capita, PPP US$ (GDP Group) 19,199 (II)
Energy intensity (koe per US$) 0.09 Diversity of international energy suppliers Low (HHI = 4,930)
Population with access to electricity (%) 100 Access to clean cooking in rural | urban areas (%) 100 | 84
Household electricity prices (US$/kWh) 0.11 Rate of transmission and distribution losses (%) 12.2
CO2 intensity (kCO2 per US$) 0.47 GHG emission growth rate 2000 – 2013 (%) -0.5
ENERGY PROFILE
Fossil fuel reserves: 1,657 Mtoe
Total primary energy supply composition
Diversity of electricity generation 0% 20% 40% 60% 80% 100%
Coal
Oil
Naturalgas
Conventionalthermal
Nuclear
Hydro
Otherrenewables
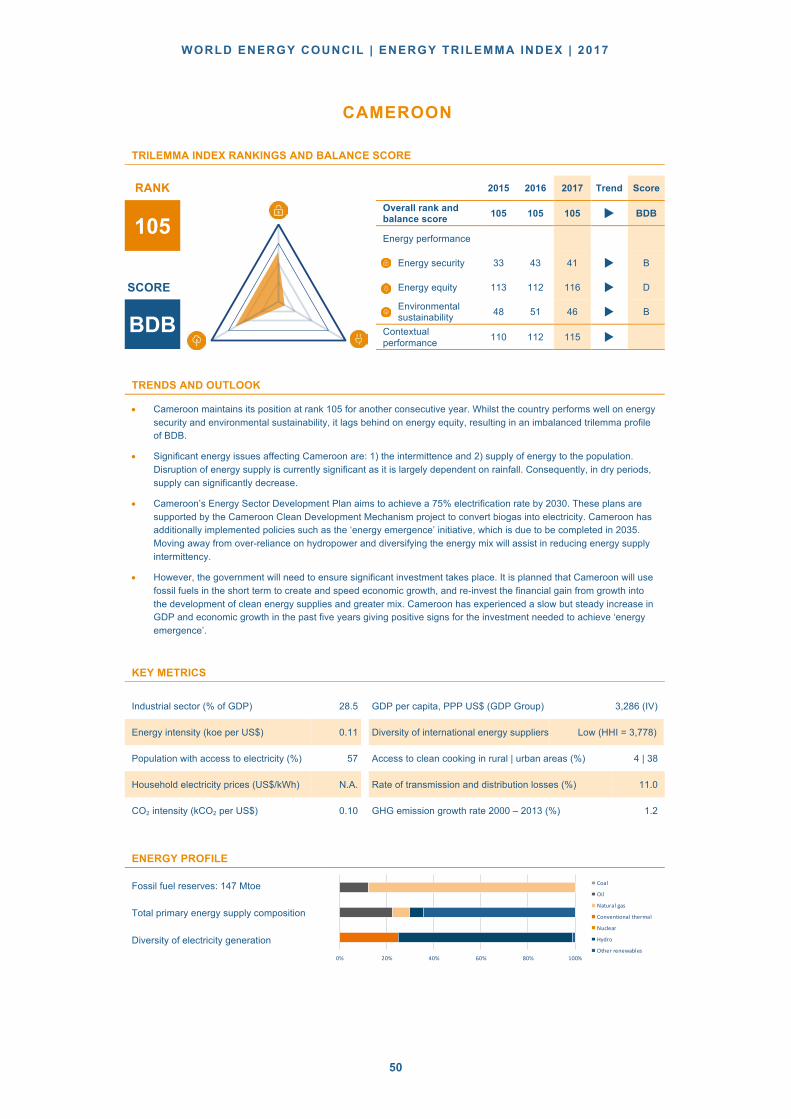
WORLD ENERGY COUNCIL | ENERGY TRILEMMA INDEX | 2017
50
CAMEROON
TRILEMMA INDEX RANKINGS AND BALANCE SCORE
RANK 2015 2016 2017 Trend Score
105 Overall rank and
balance score 105 105 105 u BDB
Energy performance
Energy security 33 43 41 u B
SCORE Energy equity 113 112 116 u D
BDB
Environmental sustainability
48 51 46 u B
Contextual performance
110 112 115 u
TRENDS AND OUTLOOK
• Cameroon maintains its position at rank 105 for another consecutive year. Whilst the country performs well on energy
security and environmental sustainability, it lags behind on energy equity, resulting in an imbalanced trilemma profile
of BDB.
• Significant energy issues affecting Cameroon are: 1) the intermittence and 2) supply of energy to the population.
Disruption of energy supply is currently significant as it is largely dependent on rainfall. Consequently, in dry periods,
supply can significantly decrease.
• Cameroon’s Energy Sector Development Plan aims to achieve a 75% electrification rate by 2030. These plans are
supported by the Cameroon Clean Development Mechanism project to convert biogas into electricity. Cameroon has
additionally implemented policies such as the ‘energy emergence’ initiative, which is due to be completed in 2035.
Moving away from over-reliance on hydropower and diversifying the energy mix will assist in reducing energy supply
intermittency.
• However, the government will need to ensure significant investment takes place. It is planned that Cameroon will use
fossil fuels in the short term to create and speed economic growth, and re-invest the financial gain from growth into
the development of clean energy supplies and greater mix. Cameroon has experienced a slow but steady increase in
GDP and economic growth in the past five years giving positive signs for the investment needed to achieve ‘energy
emergence’.
KEY METRICS
Industrial sector (% of GDP) 28.5 GDP per capita, PPP US$ (GDP Group) 3,286 (IV)
Energy intensity (koe per US$) 0.11 Diversity of international energy suppliers Low (HHI = 3,778)
Population with access to electricity (%) 57 Access to clean cooking in rural | urban areas (%) 4 | 38
Household electricity prices (US$/kWh) N.A. Rate of transmission and distribution losses (%) 11.0
CO2 intensity (kCO2 per US$) 0.10 GHG emission growth rate 2000 – 2013 (%) 1.2
ENERGY PROFILE
Fossil fuel reserves: 147 Mtoe
Total primary energy supply composition
Diversity of electricity generation
0% 20% 40% 60% 80% 100%
Coal
Oil
Naturalgas
Conventionalthermal
Nuclear
Hydro
Otherrenewables

MONITORING NATIONAL ENERGY SYSTEMS
51
CANADA
TRILEMMA INDEX RANKINGS AND BALANCE SCORE
RANK 2015 2016 2017 Trend Score
21 Overall rank and
balance score 18 22 21 u AAC
Energy performance
Energy security 4 5 4 u A
SCORE Energy equity 14 11 22 u A
AAC Environmental
sustainability 97 96 100 u C
Contextual performance 14 14 11 u
TRENDS AND OUTLOOK
• Canada improves by 1 place this year to rank 21. The country performs strongly on energy security and energy equity dimensions, but lags behind when it comes to environmental sustainability. This results in an imbalanced trilemma grade of AAC.
• Many world-leading efforts in carbon policy have been implemented by Canada’s provincial governments, which have the primary authority over energy and environmental matters. Examples include the elimination of coal-fired power from the generation mix of Canada’s largest province, regulations to eliminate coal-fired power by both the federal and provincial governments, and investments in advanced technology such as the world’s first fully integrated project to capture, use and permanently store CO2 from a coal-fired power plant. In addition, transformations towards green electricity generation are now underway in several provinces. These developments should support the continuing improvement in Canada’s future rankings.
• Three key issues of current focus are: 1) managing the environmental/climate impacts of energy end-use applications (58% of total emissions come from transport, buildings, industry, and electricity) and also from oil and gas development (25% of total emissions); 2) a more inclusive and comprehensive review process for energy infrastructure projects to access new export markets, taking account of the many diverse interests involved; and, 3) ensuring wider engagement and the sharing of benefits from resource development projects, most notably with Canada’s aboriginal population on whose traditional lands most major energy projects will be located.
KEY METRICS
Industrial sector (% of GDP) 27.7 GDP per capita, PPP US$ (GDP Group) 44,025 (I)
Energy intensity (koe per US$) 0.13 Diversity of international energy suppliers Low (HHI = 4,974)
Population with access to electricity (%) 100 Access to clean cooking in rural | urban areas (%) 100 | 100
Household electricity prices (US$/kWh) 0.16 Rate of transmission and distribution losses (%) 9.8
CO2 intensity (kCO2 per US$) 0.40 GHG emission growth rate 2000 – 2013 (%) 0.4
ENERGY PROFILE
Fossil fuel reserves: 34,086 Mtoe
Total primary energy supply composition
Diversity of electricity generation 0% 20% 40% 60% 80% 100%
Coal
Oil
Naturalgas
Conventionalthermal
Nuclear
Hydro
Otherrenewables

WORLD ENERGY COUNCIL | ENERGY TRILEMMA INDEX | 2017
52
CHAD
TRILEMMA INDEX RANKINGS AND BALANCE SCORE
RANK 2015 2016 2017 Trend Score
122 Overall rank and
balance score 119 119 122 u DDB
Energy performance
Energy security 91 93 113 u D
SCORE Energy equity 123 123 124 u D
DDB Environmental
sustainability 54 52 56 u B
Contextual performance 124 124 124 u
TRENDS AND OUTLOOK
• Chad drops 3 places this year to rank 122. Although performing relatively well in environmental sustainability, the country still lags behind on energy security and energy equity, resulting in a balance grade of DDB.
• Consumption of electricity and petroleum products accounts for only 10% of national consumption. Wood and charcoal provide 90% of the energy consumed in Chad, while natural gas consumption is very limited as fewer than 11,000 households are equipped with gas heaters. The majority of energy production and consumption occurs in the capital. Output of electricity was 103 GWh in 2008, from thermal sources only. High costs and scarcity of electricity hamper Chad’s economic development.
• The country is highly dependent on oil imports from Nigeria, Cameroon and other neighbouring countries. STEE, the utility responsible for electricity production and distribution, does not have the capacity to meet the country’s ever-growing electric energy demand. Therefore, the country is in the process of implementing a national energy policy, with considerations given to renewable energy due to the country’s significant solar potential.
• In 2015, the Sustainable Energy Fund for Africa (SEFA) approved a US$780,000 preparation grant for the development of a first phase 40 MW of Starsol solar PV plant near N’Djamena in Chad as the first Independent Power Producer (IPP) scheme to be connected to the national grid.
KEY METRICS
Industrial sector (% of GDP) 14.2 GDP per capita, PPP US$ (GDP Group) 1,991 (IV)
Energy intensity (koe per US$) 0.04 Diversity of international energy suppliers Low (HHI = 8,704)
Population with access to electricity (%) 8 Access to clean cooking in rural | urban areas (%) 2 | 13
Household electricity prices (US$/kWh) N.A. Rate of transmission and distribution losses (%) 12.2
CO2 intensity (kCO2 per US$) 0.01 GHG emission growth rate 2000 – 2013 (%) N.A.
ENERGY PROFILE
Fossil fuel reserves: 216 Mtoe
Total primary energy supply composition
Diversity of electricity generation 0% 20% 40% 60% 80% 100%
Coal
Oil
Naturalgas
Conventionalthermal
Nuclear
Hydro
Otherrenewables

MONITORING NATIONAL ENERGY SYSTEMS
53
CHILE
TRILEMMA INDEX RANKINGS AND BALANCE SCORE
RANK 2015 2016 2017 Trend Score
36 Overall rank and
balance score 35 38 36 u BBB
Energy performance
Energy security 42 44 62 u B
SCORE Energy equity 66 66 49 u B
BBB Environmental
sustainability 51 48 44 u B
Contextual performance
20 23 32 u
TRENDS AND OUTLOOK
• Chile improves by 2 places this year to rank 36. The country performs well across all trilemma dimensions, resulting in a balanced grade of BBB.
• Chile currently imports 60% of its total primary energy, exposing it to the international volatility of commodity prices, as well as political and market risks. The greatest challenges are perceived as: the development of local resources, in particular medium and small-scale renewable energies; developing a regulatory framework for the electricity distribution sector; developing the regulatory framework for energy efficiency; promoting regional integration through gas and electricity interconnectors; promoting electric mobility and smart cities; and accommodating for the additional capacity provided by the next tenders for the production of electricity.
• Chile’s Energy Policy 2050 establishes the following objectives by 2050: 1) Electricity outages to not exceed 1 hour/year in any locality of Chile, except in cases of force majeure; 2) GHG emissions relating to Chile’s energy sector are consistent with the thresholds defined by international guidelines and with the corresponding national emissions reduction goal; 3) Universal and equitable access to modern, reliable and affordable energy services for the entire population; 4) Regional and territorial planning and land-use instruments are in line with the guidelines of the Energy Policy; 5) Aim to be one of the top three OECD countries with the lowest average residential and industrial electricity prices; 6) 70% of electricity generated in Chile comes from renewable sources; 7) Growth of energy consumption is decoupled from GDP growth; 8) 100% of new buildings meet OECD standards for construction, and are fitted with intelligent management systems; 9) 100% of the major categories of appliances and equipment sold in Chile are energy efficient; 10) Ensure knowledge surrounding energy efficiency is diffused to all levels of society.
KEY METRICS
Industrial sector (% of GDP) 32.4 GDP per capita, PPP US$ (GDP Group) 23,960 (II)
Energy intensity (koe per US$) 0.08 Diversity of international energy suppliers Low (HHI = 2,512)
Population with access to electricity (%) 100 Access to clean cooking in rural | urban areas (%) 55 | 98
Household electricity prices (US$/kWh) 0.07 Rate of transmission and distribution losses (%) 6.7
CO2 intensity (kCO2 per US$) 0.26 GHG emission growth rate 2000 – 2013 (%) 3.7
ENERGY PROFILE
Fossil fuel reserves: 54 Mtoe
Total primary energy supply composition
Diversity of electricity generation
0% 20% 40% 60% 80% 100%
Coal
Oil
Naturalgas
Conventionalthermal
Nuclear
Hydro
Otherrenewables

WORLD ENERGY COUNCIL | ENERGY TRILEMMA INDEX | 2017
54
CHINA
TRILEMMA INDEX RANKINGS AND BALANCE SCORE
RANK 2015 2016 2017 Trend Score
86 Overall rank and
balance score 87 87 86 u BBD
Energy performance
Energy security 70 62 58 p B
SCORE Energy equity 77 77 76 u B
BBD
Environmental sustainability
116 117 117 u D
Contextual performance
63 62 47 u
TRENDS AND OUTLOOK
• China improves 1 rank this year to 86. China performs relatively well in energy security and energy equity, but still
lags behind on environmental sustainability, resulting in a balance score of BBD.
• China is still in the process of rapid industrialisation and urbanisation, and balancing the economic/social
development and the related energy/environment issues is a challenge for China, to which the Chinese government is
paying much attention. China’s 12th five-year plan set mandatory targets on energy efficiency, non-fossil share,
environment protection and low carbon during 2010−2015. In this period China’s GDP grew by 7.8% on average, with
an annual primary energy consumption and carbon emission growth of 3.6% and 2.7%, respectively. Energy intensity
and carbon intensity reduced to 18% and 21%, respectively, and the share of non-fossil energy increased to 15%.
• 2016 was the first year of China’s 13th five-year plan. China has proposed the strategy of green development and set
ambitious mandatory targets for 2015−2020, including reducing energy intensity by 15%, reducing carbon intensity by
18%, increasing the share of non-fossil to 15%, and an air quality target which aims for I and II degree level air in 335
cities on 80% of days. In the meantime, China pledges to enhance legislation and introduce market-based reforms,
including launching the nationwide carbon trading market in 2017. Related plans and policies, which will promote
more sustainable development in the coming five years, will be announced soon.
KEY METRICS
Industrial sector (% of GDP) 40.9 GDP per capita, PPP US$ (GDP Group) 15,535 (II)
Energy intensity (koe per US$) 0.12 Diversity of international energy suppliers High (HHI = 531)
Population with access to electricity (%) 100 Access to clean cooking in rural | urban areas (%) 17 | 91
Household electricity prices (US$/kWh) 0.09 Rate of transmission and distribution losses (%) 5.8
CO2 intensity (kCO2 per US$) 0.54 GHG emission growth rate 2000 – 2013 (%) 8.5
ENERGY PROFILE
Fossil fuel reserves: 85,363 Mtoe
Total primary energy supply composition
Diversity of electricity generation
0% 20% 40% 60% 80% 100%
Coal
Oil
Naturalgas
Conventionalthermal
Nuclear
Hydro
Otherrenewables

MONITORING NATIONAL ENERGY SYSTEMS
55
COLOMBIA
TRILEMMA INDEX RANKINGS AND BALANCE SCORE
RANK 2015 2016 2017 Trend Score
45 Overall rank and
balance score 43 41 45 u BCA
Energy performance
Energy security 35 36 43 u B
SCORE Energy equity 81 80 84 u C
BCA
Environmental sustainability
8 10 16 u A
Contextual performance
66 68 66 u
TRENDS AND OUTLOOK
• Colombia drops 4 places in this year’s Index to rank 45. Good performance in both energy security and environmental
sustainability dimensions, combined with a relatively low score in energy equity, results in an overall trilemma grade
of BCA.
• Colombia, although in a relatively high position in the Index, still faces major challenges such as: expanding coverage
of energy services, and finding solutions based on non-conventional energies; improving quality and reliability of
energy services; diversification of the energy mix; and sustaining positive economic development without increasing
CO2 emissions.
• Main areas policymakers are focusing on are: 1) ensuring the continued development of the mining and energy sector
as one of the main drivers of economic growth and social development; 2) promoting energy efficiency on energy
demand and supply side, and consolidating a culture for sustainable use of natural resources; 3) strengthening the
participation of different stakeholders in the development phases of the industry; 4) increasing exploration of natural
gas; 5) developing and implementing efficient mass transport systems; 6) ensuring the expansion of electricity
generation capacity; and 7) strengthening guarantees and investment opportunities in the country, and boosting
investment in science and technology in the energy sector.
KEY METRICS
Industrial sector (% of GDP) 33.4 GDP per capita, PPP US$ (GDP Group) 14,158 (III)
Energy intensity (koe per US$) 0.04 Diversity of international energy suppliers Low (HHI = 7,236)
Population with access to electricity (%) 98 Access to clean cooking in rural | urban areas (%) 50 | 98
Household electricity prices (US$/kWh) 0.18 Rate of transmission and distribution losses (%) 11.3
CO2 intensity (kCO2 per US$) 0.13 GHG emission growth rate 2000 – 2013 (%) 2.0
ENERGY PROFILE
Fossil fuel reserves: 5,178 Mtoe
Total primary energy supply composition
Diversity of electricity generation
0% 20% 40% 60% 80% 100%
Coal
Oil
Naturalgas
Conventionalthermal
Nuclear
Hydro
Otherrenewables

WORLD ENERGY COUNCIL | ENERGY TRILEMMA INDEX | 2017
56
CONGO (DEMOCRATIC REPUBLIC)
TRILEMMA INDEX RANKINGS AND BALANCE SCORE
RANK 2015 2016 2017 Trend Score
121 Overall rank and
balance score 116 117 121 u CDC
Energy performance
Energy security 94 98 91 u C
SCORE Energy equity 112 113 120 u D
CDC
Environmental sustainability
86 85 82 u C
Contextual performance
122 122 125 u
TRENDS AND OUTLOOK
• The Democratic Republic of the Congo (DRC) drops 4 places this year to rank 121. An improvement in energy
security results in a grade change from D to C from 2016-2017; however, energy equity still remains low, resulting in
an overall balance score of CDC.
• The DRC meets its energy needs mostly through biomass and hydropower. The country currently exploits only 2%
of its hydroelectric resources from the Congo River, which is estimated to have the potential to supply 100 GW of
power, the highest in Africa. Current hydro installed capacity is 2,420 MW, of which only 1,281 MW is operational.
The World Bank and the African Development Bank are supporting the country to develop an additional 4,800 MW at
the Inga 3 site.
• Despite such rich hydroelectric potential and 2009 reforms, the DRC has one of the lowest rates of electrification in
the world, amounting in 2013 to 1% in rural areas and 19% in urban areas. This is due to a limited length of high-
voltage transmission lines (only 4,600 km).
• All these conditions have favoured the development of small and independent power producers and distributors,
through which the country has been liberalising the sector, promoting private investment in generation and
distribution.
KEY METRICS
Industrial sector (% of GDP) 35.2 GDP per capita, PPP US$ (GDP Group) 801 (IV)
Energy intensity (koe per US$) 0.44 Diversity of international energy suppliers Medium (HHI = 1,835)
Population with access to electricity (%) 14 Access to clean cooking in rural | urban areas (%) 2 | 11
Household electricity prices (US$/kWh) N.A. Rate of transmission and distribution losses (%) N.A.
CO2 intensity (kCO2 per US$) 0.05 GHG emission growth rate 2000 – 2013 (%) 3.8
ENERGY PROFILE
Fossil fuel reserves: 24 Mtoe
Total primary energy supply composition
Diversity of electricity generation
0% 20% 40% 60% 80% 100%
Coal
Oil
Naturalgas
Conventionalthermal
Nuclear
Hydro
Otherrenewables

MONITORING NATIONAL ENERGY SYSTEMS
57
CÔTE D’IVOIRE
TRILEMMA INDEX RANKINGS AND BALANCE SCORE
RANK 2015 2016 2017 Trend Score
103 Overall rank and
balance score 104 101 103 u BDC
Energy performance
Energy security 19 30 48 u B
SCORE Energy equity 106 105 107 u D
BDC Environmental
sustainability 95 94 86 u C
Contextual performance 113 102 98 p
TRENDS AND OUTLOOK
• Côte d’Ivoire ranks 103 in this year’s Index, dropping 2 places from 2016. Whilst achieving good results in energy security, the country lags behind in both energy equity and environmental sustainability, resulting in a balance score of BDC.
• Côte d’Ivoire has a large renewable energy potential. However, the country’s ability to develop and implement energy policies to develop these energy sources has been hampered by internal conflict. Combined with a lack of investment in energy and infrastructure, this has resulted in low energy access and a poorly diversified energy mix.
• Although there is extensive grid supply, the prohibitive cost of accessing the grid presents a barrier to access the electricity. As a result, there is a large disparity between the number of people who live in a grid-connected locality and the households that are actually connected.
• In 2012, the government agreed on an energy sector plan that prioritises investment in fossil-fuelled power generation and transport infrastructure, and commits the country to achieving a 15% share of renewables in final energy consumption by 2020. While there are some efforts to increase the use of renewables (such as reduced taxes for the use of solar), policies to reduce the cost and further promote the deployment of renewables are required to achieve this target, and with that an improvement in its trilemma ranking and balance.
KEY METRICS
Industrial sector (% of GDP) 31.8 GDP per capita, PPP US$ (GDP Group) 3,720 (IV)
Energy intensity (koe per US$) 0.12 Diversity of international energy suppliers Low (HHI = 7,363)
Population with access to electricity (%) 62 Access to clean cooking in rural | urban areas (%) 2 | 35
Household electricity prices (US$/kWh) N.A. Rate of transmission and distribution losses (%) 17.0
CO2 intensity (kCO2 per US$) 0.15 GHG emission growth rate 2000 – 2013 (%) 3.7
ENERGY PROFILE
Fossil fuel reserves: 14 Mtoe
Total primary energy supply composition
Diversity of electricity generation 0% 20% 40% 60% 80% 100%
Coal
Oil
Naturalgas
Conventionalthermal
Nuclear
Hydro
Otherrenewables
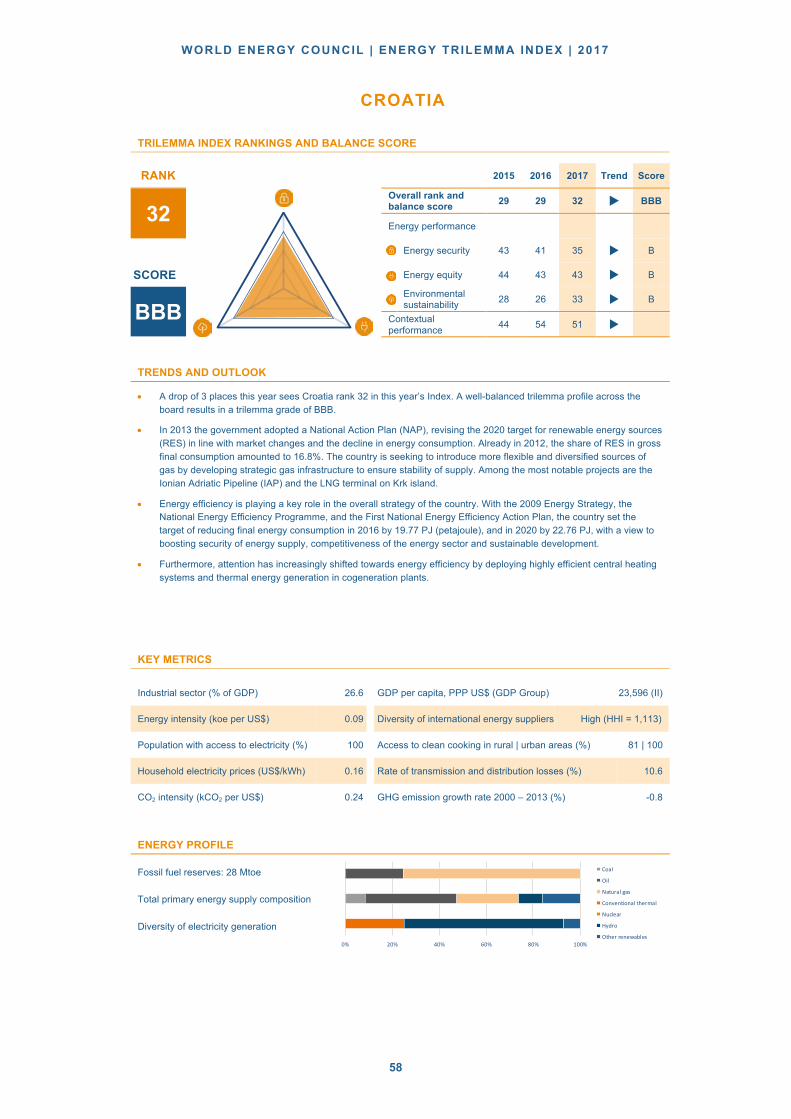
WORLD ENERGY COUNCIL | ENERGY TRILEMMA INDEX | 2017
58
CROATIA
TRILEMMA INDEX RANKINGS AND BALANCE SCORE
RANK 2015 2016 2017 Trend Score
32 Overall rank and
balance score 29 29 32 u BBB
Energy performance
Energy security 43 41 35 u B
SCORE Energy equity 44 43 43 u B
BBB
Environmental
sustainability 28 26 33 u B
Contextual
performance 44 54 51 u
TRENDS AND OUTLOOK
• A drop of 3 places this year sees Croatia rank 32 in this year’s Index. A well-balanced trilemma profile across the
board results in a trilemma grade of BBB.
• In 2013 the government adopted a National Action Plan (NAP), revising the 2020 target for renewable energy sources
(RES) in line with market changes and the decline in energy consumption. Already in 2012, the share of RES in gross
final consumption amounted to 16.8%. The country is seeking to introduce more flexible and diversified sources of
gas by developing strategic gas infrastructure to ensure stability of supply. Among the most notable projects are the
Ionian Adriatic Pipeline (IAP) and the LNG terminal on Krk island.
• Energy efficiency is playing a key role in the overall strategy of the country. With the 2009 Energy Strategy, the
National Energy Efficiency Programme, and the First National Energy Efficiency Action Plan, the country set the
target of reducing final energy consumption in 2016 by 19.77 PJ (petajoule), and in 2020 by 22.76 PJ, with a view to
boosting security of energy supply, competitiveness of the energy sector and sustainable development.
• Furthermore, attention has increasingly shifted towards energy efficiency by deploying highly efficient central heating
systems and thermal energy generation in cogeneration plants.
KEY METRICS
Industrial sector (% of GDP) 26.6 GDP per capita, PPP US$ (GDP Group) 23,596 (II)
Energy intensity (koe per US$) 0.09 Diversity of international energy suppliers High (HHI = 1,113)
Population with access to electricity (%) 100 Access to clean cooking in rural | urban areas (%) 81 | 100
Household electricity prices (US$/kWh) 0.16 Rate of transmission and distribution losses (%) 10.6
CO2 intensity (kCO2 per US$) 0.24 GHG emission growth rate 2000 – 2013 (%) -0.8
ENERGY PROFILE
Fossil fuel reserves: 28 Mtoe
Total primary energy supply composition
Diversity of electricity generation
0% 20% 40% 60% 80% 100%
Coal
Oil
Naturalgas
Conventionalthermal
Nuclear
Hydro
Otherrenewables
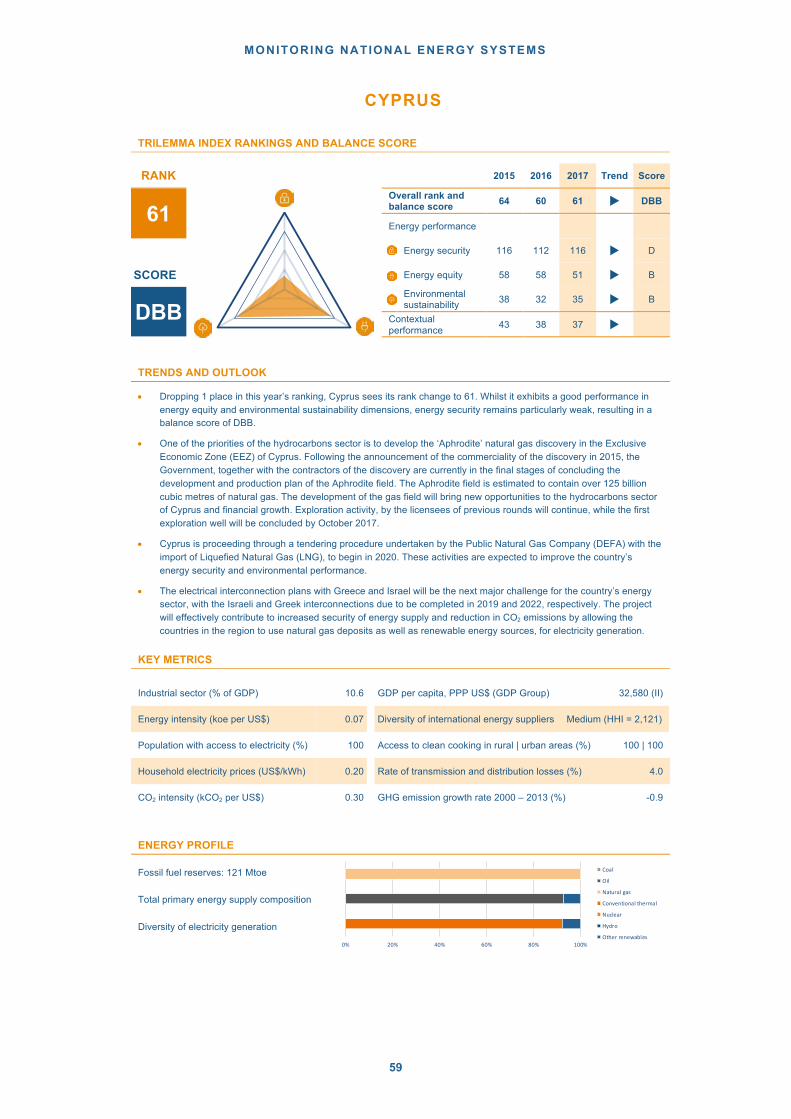
MONITORING NATIONAL ENERGY SYSTEMS
59
CYPRUS
TRILEMMA INDEX RANKINGS AND BALANCE SCORE
RANK 2015 2016 2017 Trend Score
61 Overall rank and
balance score 64 60 61 u DBB
Energy performance
Energy security 116 112 116 u D
SCORE Energy equity 58 58 51 u B
DBB Environmental
sustainability 38 32 35 u B
Contextual performance 43 38 37 u
TRENDS AND OUTLOOK
• Dropping 1 place in this year’s ranking, Cyprus sees its rank change to 61. Whilst it exhibits a good performance in energy equity and environmental sustainability dimensions, energy security remains particularly weak, resulting in a balance score of DBB.
• One of the priorities of the hydrocarbons sector is to develop the ‘Aphrodite’ natural gas discovery in the Exclusive Economic Zone (EEZ) of Cyprus. Following the announcement of the commerciality of the discovery in 2015, the Government, together with the contractors of the discovery are currently in the final stages of concluding the development and production plan of the Aphrodite field. The Aphrodite field is estimated to contain over 125 billion cubic metres of natural gas. The development of the gas field will bring new opportunities to the hydrocarbons sector of Cyprus and financial growth. Exploration activity, by the licensees of previous rounds will continue, while the first exploration well will be concluded by October 2017.
• Cyprus is proceeding through a tendering procedure undertaken by the Public Natural Gas Company (DEFA) with the import of Liquefied Natural Gas (LNG), to begin in 2020. These activities are expected to improve the country’s energy security and environmental performance.
• The electrical interconnection plans with Greece and Israel will be the next major challenge for the country’s energy sector, with the Israeli and Greek interconnections due to be completed in 2019 and 2022, respectively. The project will effectively contribute to increased security of energy supply and reduction in CO2 emissions by allowing the countries in the region to use natural gas deposits as well as renewable energy sources, for electricity generation.
KEY METRICS
Industrial sector (% of GDP) 10.6 GDP per capita, PPP US$ (GDP Group) 32,580 (II)
Energy intensity (koe per US$) 0.07 Diversity of international energy suppliers Medium (HHI = 2,121)
Population with access to electricity (%) 100 Access to clean cooking in rural | urban areas (%) 100 | 100
Household electricity prices (US$/kWh) 0.20 Rate of transmission and distribution losses (%) 4.0
CO2 intensity (kCO2 per US$) 0.30 GHG emission growth rate 2000 – 2013 (%) -0.9
ENERGY PROFILE
Fossil fuel reserves: 121 Mtoe
Total primary energy supply composition
Diversity of electricity generation 0% 20% 40% 60% 80% 100%
Coal
Oil
Naturalgas
Conventionalthermal
Nuclear
Hydro
Otherrenewables

WORLD ENERGY COUNCIL | ENERGY TRILEMMA INDEX | 2017
60
CZECH REPUBLIC
TRILEMMA INDEX RANKINGS AND BALANCE SCORE
RANK 2015 2016 2017 Trend Score
17 Overall rank and
balance score 21 19 17 u AAB
Energy performance
Energy security 14 14 14 u A
SCORE Energy equity 8 5 7 u A
AAB
Environmental
sustainability 62 54 49 p B
Contextual
performance 30 29 26 u
TRENDS AND OUTLOOK
• A consecutive yearly improvement of 2 places from 2014, where it sat at rank 23, means the Czech Republic ranks
17 in this year’s Index. Energy equity is a particular highlight, where the country ranks 7th
globally. This results in a
well-balanced profile of AAB.
• In 2015 the Czech government issued several energy policies: 1) the update of the State Energy Concept of the
Czech Republic (SEK); 2) the National Action Plan for Smart Grids; 3) the National Action Plan for Energy Efficiency;
and 4) the National Plan on Nuclear Energy Development.
• The national energy policy is based on: construction of new nuclear power generation units on the existing sites of
nuclear power plants; a gradual transition from mostly extracted lignite deposits towards natural gas and renewable
energy sources for electricity and heat production, with domestic coal remaining a stable segment of the country’s
energy mix (decreasing from 45% today to less than 20% in the coming decades); medium-term stabilising of
combined heat and power (CHP), provision of coal/fuels for central heating; increasing efficiency in energy production
and making considerable efficiencies in the use of all kinds of energy; and reconstruction and development of network
infrastructure (electricity, gas) to ensure system integration of decentralised production, operational reliability, as well
as ancillary and transit services.
KEY METRICS
Industrial sector (% of GDP) 37.8 GDP per capita, PPP US$ (GDP Group) 34,711 (I)
Energy intensity (koe per US$) 0.08 Diversity of international energy suppliers Medium (HHI = 2,096)
Population with access to electricity (%) 100 Access to clean cooking in rural | urban areas (%) 100 | 100
Household electricity prices (US$/kWh) 0.15 Rate of transmission and distribution losses (%) 6.4
CO2 intensity (kCO2 per US$) 0.35 GHG emission growth rate 2000 – 2013 (%) -1.5
ENERGY PROFILE
Fossil fuel reserves: 739 Mtoe
Total primary energy supply composition
Diversity of electricity generation
0% 20% 40% 60% 80% 100%
Coal
Oil
Naturalgas
Conventionalthermal
Nuclear
Hydro
Otherrenewables
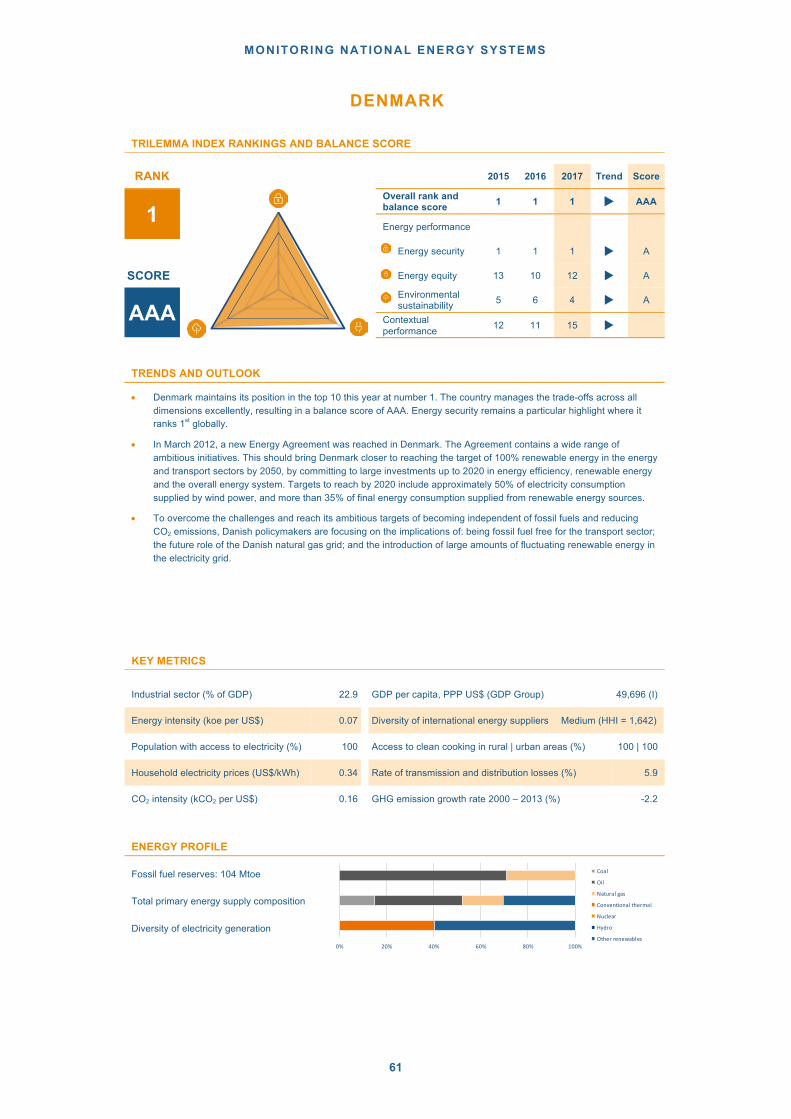
MONITORING NATIONAL ENERGY SYSTEMS
61
DENMARK
TRILEMMA INDEX RANKINGS AND BALANCE SCORE
RANK 2015 2016 2017 Trend Score
1 Overall rank and
balance score 1 1 1 u AAA
Energy performance
Energy security 1 1 1 u A
SCORE Energy equity 13 10 12 u A
AAA Environmental
sustainability 5 6 4 u A
Contextual performance 12 11 15 u
TRENDS AND OUTLOOK
• Denmark maintains its position in the top 10 this year at number 1. The country manages the trade-offs across all dimensions excellently, resulting in a balance score of AAA. Energy security remains a particular highlight where it ranks 1st globally.
• In March 2012, a new Energy Agreement was reached in Denmark. The Agreement contains a wide range of ambitious initiatives. This should bring Denmark closer to reaching the target of 100% renewable energy in the energy and transport sectors by 2050, by committing to large investments up to 2020 in energy efficiency, renewable energy and the overall energy system. Targets to reach by 2020 include approximately 50% of electricity consumption supplied by wind power, and more than 35% of final energy consumption supplied from renewable energy sources.
• To overcome the challenges and reach its ambitious targets of becoming independent of fossil fuels and reducing CO2 emissions, Danish policymakers are focusing on the implications of: being fossil fuel free for the transport sector; the future role of the Danish natural gas grid; and the introduction of large amounts of fluctuating renewable energy in the electricity grid.
KEY METRICS
Industrial sector (% of GDP) 22.9 GDP per capita, PPP US$ (GDP Group) 49,696 (I)
Energy intensity (koe per US$) 0.07 Diversity of international energy suppliers Medium (HHI = 1,642)
Population with access to electricity (%) 100 Access to clean cooking in rural | urban areas (%) 100 | 100
Household electricity prices (US$/kWh) 0.34 Rate of transmission and distribution losses (%) 5.9
CO2 intensity (kCO2 per US$) 0.16 GHG emission growth rate 2000 – 2013 (%) -2.2
ENERGY PROFILE
Fossil fuel reserves: 104 Mtoe
Total primary energy supply composition
Diversity of electricity generation 0% 20% 40% 60% 80% 100%
Coal
Oil
Naturalgas
Conventionalthermal
Nuclear
Hydro
Otherrenewables
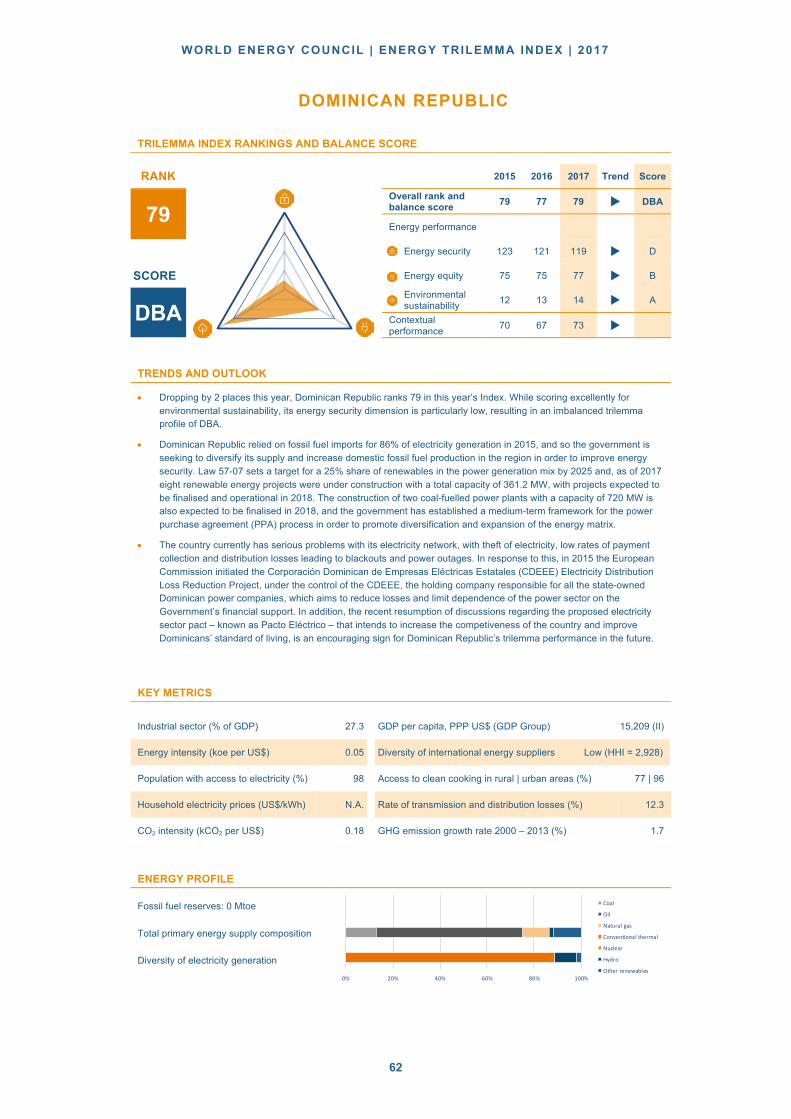
WORLD ENERGY COUNCIL | ENERGY TRILEMMA INDEX | 2017
62
DOMINICAN REPUBLIC
TRILEMMA INDEX RANKINGS AND BALANCE SCORE
RANK 2015 2016 2017 Trend Score
79 Overall rank and
balance score 79 77 79 u DBA
Energy performance
Energy security 123 121 119 u D
SCORE Energy equity 75 75 77 u B
DBA
Environmental sustainability
12 13 14 u A
Contextual performance
70 67 73 u
TRENDS AND OUTLOOK
• Dropping by 2 places this year, Dominican Republic ranks 79 in this year’s Index. While scoring excellently for
environmental sustainability, its energy security dimension is particularly low, resulting in an imbalanced trilemma
profile of DBA.
• Dominican Republic relied on fossil fuel imports for 86% of electricity generation in 2015, and so the government is
seeking to diversify its supply and increase domestic fossil fuel production in the region in order to improve energy
security. Law 57-07 sets a target for a 25% share of renewables in the power generation mix by 2025 and, as of 2017
eight renewable energy projects were under construction with a total capacity of 361.2 MW, with projects expected to
be finalised and operational in 2018. The construction of two coal-fuelled power plants with a capacity of 720 MW is
also expected to be finalised in 2018, and the government has established a medium-term framework for the power
purchase agreement (PPA) process in order to promote diversification and expansion of the energy matrix.
• The country currently has serious problems with its electricity network, with theft of electricity, low rates of payment
collection and distribution losses leading to blackouts and power outages. In response to this, in 2015 the European
Commission initiated the Corporación Dominican de Empresas Eléctricas Estatales (CDEEE) Electricity Distribution
Loss Reduction Project, under the control of the CDEEE, the holding company responsible for all the state-owned
Dominican power companies, which aims to reduce losses and limit dependence of the power sector on the
Government’s financial support. In addition, the recent resumption of discussions regarding the proposed electricity
sector pact – known as Pacto Eléctrico – that intends to increase the competiveness of the country and improve
Dominicans’ standard of living, is an encouraging sign for Dominican Republic’s trilemma performance in the future.
KEY METRICS
Industrial sector (% of GDP) 27.3 GDP per capita, PPP US$ (GDP Group) 15,209 (II)
Energy intensity (koe per US$) 0.05 Diversity of international energy suppliers Low (HHI = 2,928)
Population with access to electricity (%) 98 Access to clean cooking in rural | urban areas (%) 77 | 96
Household electricity prices (US$/kWh) N.A. Rate of transmission and distribution losses (%) 12.3
CO2 intensity (kCO2 per US$) 0.18 GHG emission growth rate 2000 – 2013 (%) 1.7
ENERGY PROFILE
Fossil fuel reserves: 0 Mtoe
Total primary energy supply composition
Diversity of electricity generation
0% 20% 40% 60% 80% 100%
Coal
Oil
Naturalgas
Conventionalthermal
Nuclear
Hydro
Otherrenewables
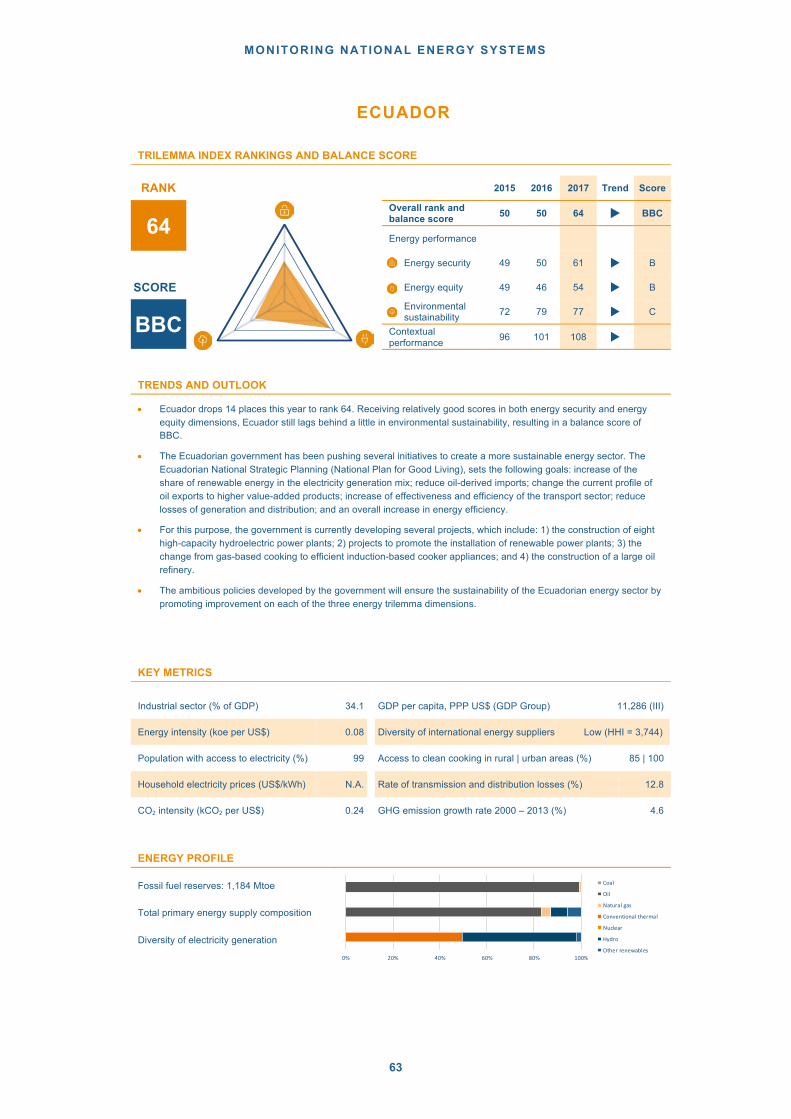
MONITORING NATIONAL ENERGY SYSTEMS
63
ECUADOR
TRILEMMA INDEX RANKINGS AND BALANCE SCORE
RANK 2015 2016 2017 Trend Score
64 Overall rank and
balance score 50 50 64 u BBC
Energy performance
Energy security 49 50 61 u B
SCORE Energy equity 49 46 54 u B
BBC Environmental
sustainability 72 79 77 u C
Contextual performance 96 101 108 u
TRENDS AND OUTLOOK
• Ecuador drops 14 places this year to rank 64. Receiving relatively good scores in both energy security and energy equity dimensions, Ecuador still lags behind a little in environmental sustainability, resulting in a balance score of BBC.
• The Ecuadorian government has been pushing several initiatives to create a more sustainable energy sector. The Ecuadorian National Strategic Planning (National Plan for Good Living), sets the following goals: increase of the share of renewable energy in the electricity generation mix; reduce oil-derived imports; change the current profile of oil exports to higher value-added products; increase of effectiveness and efficiency of the transport sector; reduce losses of generation and distribution; and an overall increase in energy efficiency.
• For this purpose, the government is currently developing several projects, which include: 1) the construction of eight high-capacity hydroelectric power plants; 2) projects to promote the installation of renewable power plants; 3) the change from gas-based cooking to efficient induction-based cooker appliances; and 4) the construction of a large oil refinery.
• The ambitious policies developed by the government will ensure the sustainability of the Ecuadorian energy sector by promoting improvement on each of the three energy trilemma dimensions.
KEY METRICS
Industrial sector (% of GDP) 34.1 GDP per capita, PPP US$ (GDP Group) 11,286 (III)
Energy intensity (koe per US$) 0.08 Diversity of international energy suppliers Low (HHI = 3,744)
Population with access to electricity (%) 99 Access to clean cooking in rural | urban areas (%) 85 | 100
Household electricity prices (US$/kWh) N.A. Rate of transmission and distribution losses (%) 12.8
CO2 intensity (kCO2 per US$) 0.24 GHG emission growth rate 2000 – 2013 (%) 4.6
ENERGY PROFILE
Fossil fuel reserves: 1,184 Mtoe
Total primary energy supply composition
Diversity of electricity generation 0% 20% 40% 60% 80% 100%
Coal
Oil
Naturalgas
Conventionalthermal
Nuclear
Hydro
Otherrenewables
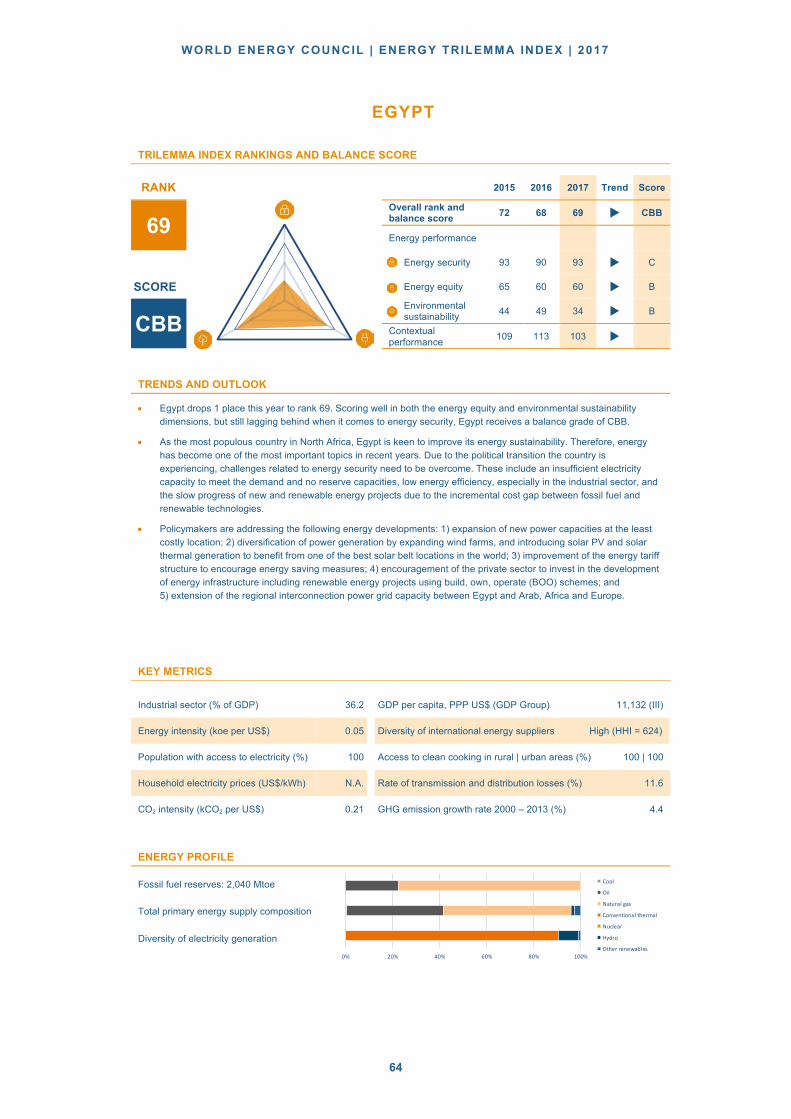
WORLD ENERGY COUNCIL | ENERGY TRILEMMA INDEX | 2017
64
EGYPT
TRILEMMA INDEX RANKINGS AND BALANCE SCORE
RANK 2015 2016 2017 Trend Score
69 Overall rank and
balance score 72 68 69 u CBB
Energy performance
Energy security 93 90 93 u C
SCORE Energy equity 65 60 60 u B
CBB Environmental
sustainability 44 49 34 u B
Contextual performance 109 113 103 u
TRENDS AND OUTLOOK
• Egypt drops 1 place this year to rank 69. Scoring well in both the energy equity and environmental sustainability dimensions, but still lagging behind when it comes to energy security, Egypt receives a balance grade of CBB.
• As the most populous country in North Africa, Egypt is keen to improve its energy sustainability. Therefore, energy has become one of the most important topics in recent years. Due to the political transition the country is experiencing, challenges related to energy security need to be overcome. These include an insufficient electricity capacity to meet the demand and no reserve capacities, low energy efficiency, especially in the industrial sector, and the slow progress of new and renewable energy projects due to the incremental cost gap between fossil fuel and renewable technologies.
• Policymakers are addressing the following energy developments: 1) expansion of new power capacities at the least costly location; 2) diversification of power generation by expanding wind farms, and introducing solar PV and solar thermal generation to benefit from one of the best solar belt locations in the world; 3) improvement of the energy tariff structure to encourage energy saving measures; 4) encouragement of the private sector to invest in the development of energy infrastructure including renewable energy projects using build, own, operate (BOO) schemes; and 5) extension of the regional interconnection power grid capacity between Egypt and Arab, Africa and Europe.
KEY METRICS
Industrial sector (% of GDP) 36.2 GDP per capita, PPP US$ (GDP Group) 11,132 (III)
Energy intensity (koe per US$) 0.05 Diversity of international energy suppliers High (HHI = 624)
Population with access to electricity (%) 100 Access to clean cooking in rural | urban areas (%) 100 | 100
Household electricity prices (US$/kWh) N.A. Rate of transmission and distribution losses (%) 11.6
CO2 intensity (kCO2 per US$) 0.21 GHG emission growth rate 2000 – 2013 (%) 4.4
ENERGY PROFILE
Fossil fuel reserves: 2,040 Mtoe
Total primary energy supply composition
Diversity of electricity generation 0% 20% 40% 60% 80% 100%
Coal
Oil
Naturalgas
Conventionalthermal
Nuclear
Hydro
Otherrenewables
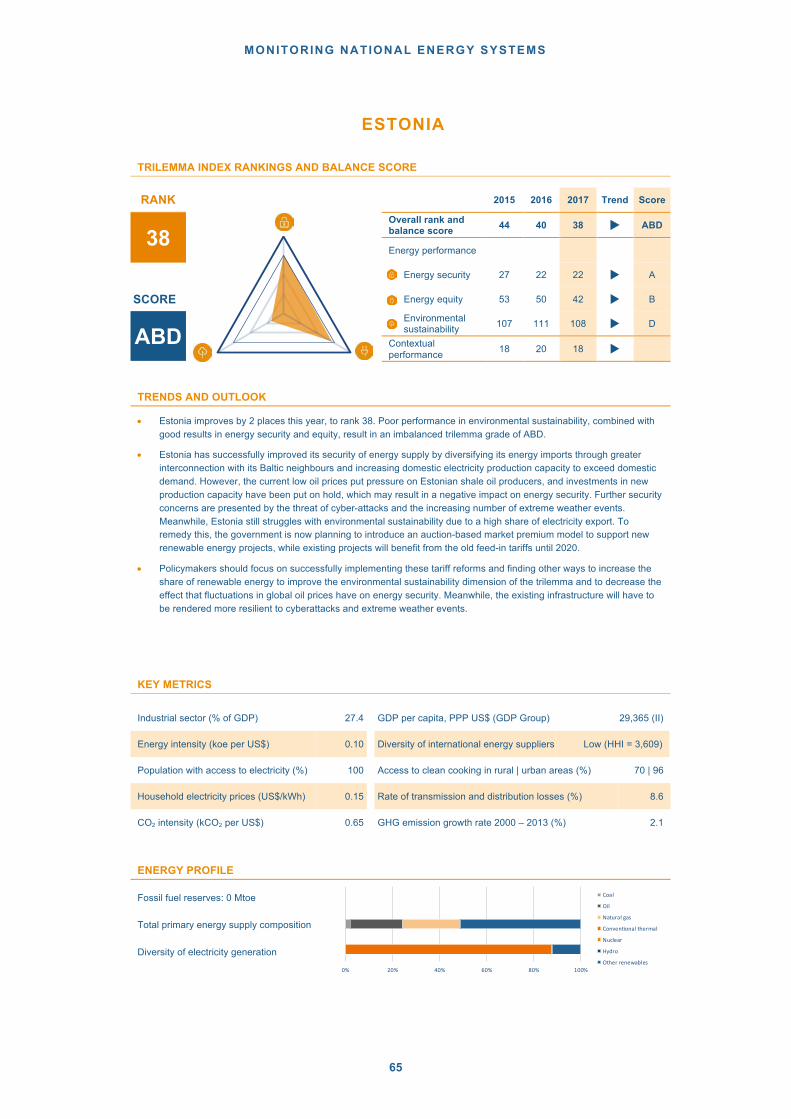
MONITORING NATIONAL ENERGY SYSTEMS
65
ESTONIA
TRILEMMA INDEX RANKINGS AND BALANCE SCORE
RANK 2015 2016 2017 Trend Score
38 Overall rank and
balance score 44 40 38 u ABD
Energy performance
Energy security 27 22 22 u A
SCORE Energy equity 53 50 42 u B
ABD Environmental
sustainability 107 111 108 u D
Contextual performance 18 20 18 u
TRENDS AND OUTLOOK
• Estonia improves by 2 places this year, to rank 38. Poor performance in environmental sustainability, combined with good results in energy security and equity, result in an imbalanced trilemma grade of ABD.
• Estonia has successfully improved its security of energy supply by diversifying its energy imports through greater interconnection with its Baltic neighbours and increasing domestic electricity production capacity to exceed domestic demand. However, the current low oil prices put pressure on Estonian shale oil producers, and investments in new production capacity have been put on hold, which may result in a negative impact on energy security. Further security concerns are presented by the threat of cyber-attacks and the increasing number of extreme weather events. Meanwhile, Estonia still struggles with environmental sustainability due to a high share of electricity export. To remedy this, the government is now planning to introduce an auction-based market premium model to support new renewable energy projects, while existing projects will benefit from the old feed-in tariffs until 2020.
• Policymakers should focus on successfully implementing these tariff reforms and finding other ways to increase the share of renewable energy to improve the environmental sustainability dimension of the trilemma and to decrease the effect that fluctuations in global oil prices have on energy security. Meanwhile, the existing infrastructure will have to be rendered more resilient to cyberattacks and extreme weather events.
KEY METRICS
Industrial sector (% of GDP) 27.4 GDP per capita, PPP US$ (GDP Group) 29,365 (II)
Energy intensity (koe per US$) 0.10 Diversity of international energy suppliers Low (HHI = 3,609)
Population with access to electricity (%) 100 Access to clean cooking in rural | urban areas (%) 70 | 96
Household electricity prices (US$/kWh) 0.15 Rate of transmission and distribution losses (%) 8.6
CO2 intensity (kCO2 per US$) 0.65 GHG emission growth rate 2000 – 2013 (%) 2.1
ENERGY PROFILE
Fossil fuel reserves: 0 Mtoe
Total primary energy supply composition
Diversity of electricity generation 0% 20% 40% 60% 80% 100%
Coal
Oil
Naturalgas
Conventionalthermal
Nuclear
Hydro
Otherrenewables
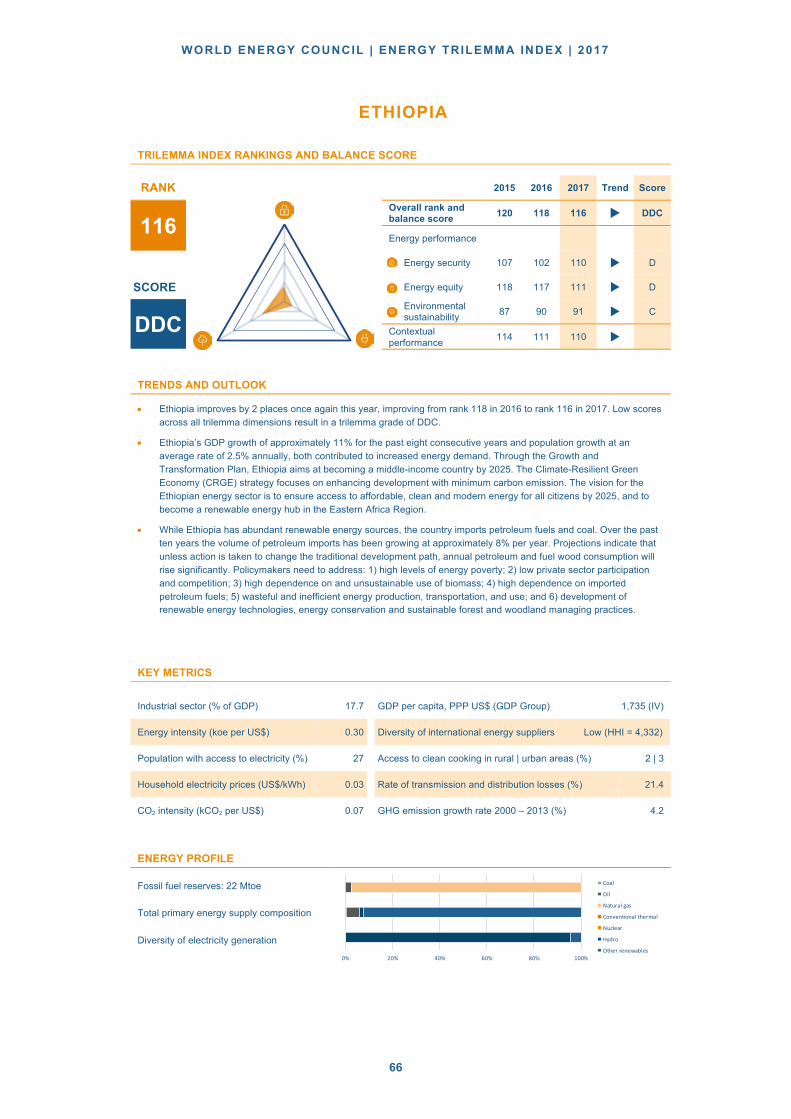
WORLD ENERGY COUNCIL | ENERGY TRILEMMA INDEX | 2017
66
ETHIOPIA
TRILEMMA INDEX RANKINGS AND BALANCE SCORE
RANK 2015 2016 2017 Trend Score
116 Overall rank and
balance score 120 118 116 u DDC
Energy performance
Energy security 107 102 110 u D
SCORE Energy equity 118 117 111 u D
DDC
Environmental sustainability
87 90 91 u C
Contextual performance
114 111 110 u
TRENDS AND OUTLOOK
• Ethiopia improves by 2 places once again this year, improving from rank 118 in 2016 to rank 116 in 2017. Low scores
across all trilemma dimensions result in a trilemma grade of DDC.
• Ethiopia’s GDP growth of approximately 11% for the past eight consecutive years and population growth at an
average rate of 2.5% annually, both contributed to increased energy demand. Through the Growth and
Transformation Plan, Ethiopia aims at becoming a middle-income country by 2025. The Climate-Resilient Green
Economy (CRGE) strategy focuses on enhancing development with minimum carbon emission. The vision for the
Ethiopian energy sector is to ensure access to affordable, clean and modern energy for all citizens by 2025, and to
become a renewable energy hub in the Eastern Africa Region.
• While Ethiopia has abundant renewable energy sources, the country imports petroleum fuels and coal. Over the past
ten years the volume of petroleum imports has been growing at approximately 8% per year. Projections indicate that
unless action is taken to change the traditional development path, annual petroleum and fuel wood consumption will
rise significantly. Policymakers need to address: 1) high levels of energy poverty; 2) low private sector participation
and competition; 3) high dependence on and unsustainable use of biomass; 4) high dependence on imported
petroleum fuels; 5) wasteful and inefficient energy production, transportation, and use; and 6) development of
renewable energy technologies, energy conservation and sustainable forest and woodland managing practices.
KEY METRICS
Industrial sector (% of GDP) 17.7 GDP per capita, PPP US$ (GDP Group) 1,735 (IV)
Energy intensity (koe per US$) 0.30 Diversity of international energy suppliers Low (HHI = 4,332)
Population with access to electricity (%) 27 Access to clean cooking in rural | urban areas (%) 2 | 3
Household electricity prices (US$/kWh) 0.03 Rate of transmission and distribution losses (%) 21.4
CO2 intensity (kCO2 per US$) 0.07 GHG emission growth rate 2000 – 2013 (%) 4.2
ENERGY PROFILE
Fossil fuel reserves: 22 Mtoe
Total primary energy supply composition
Diversity of electricity generation
0% 20% 40% 60% 80% 100%
Coal
Oil
Naturalgas
Conventionalthermal
Nuclear
Hydro
Otherrenewables
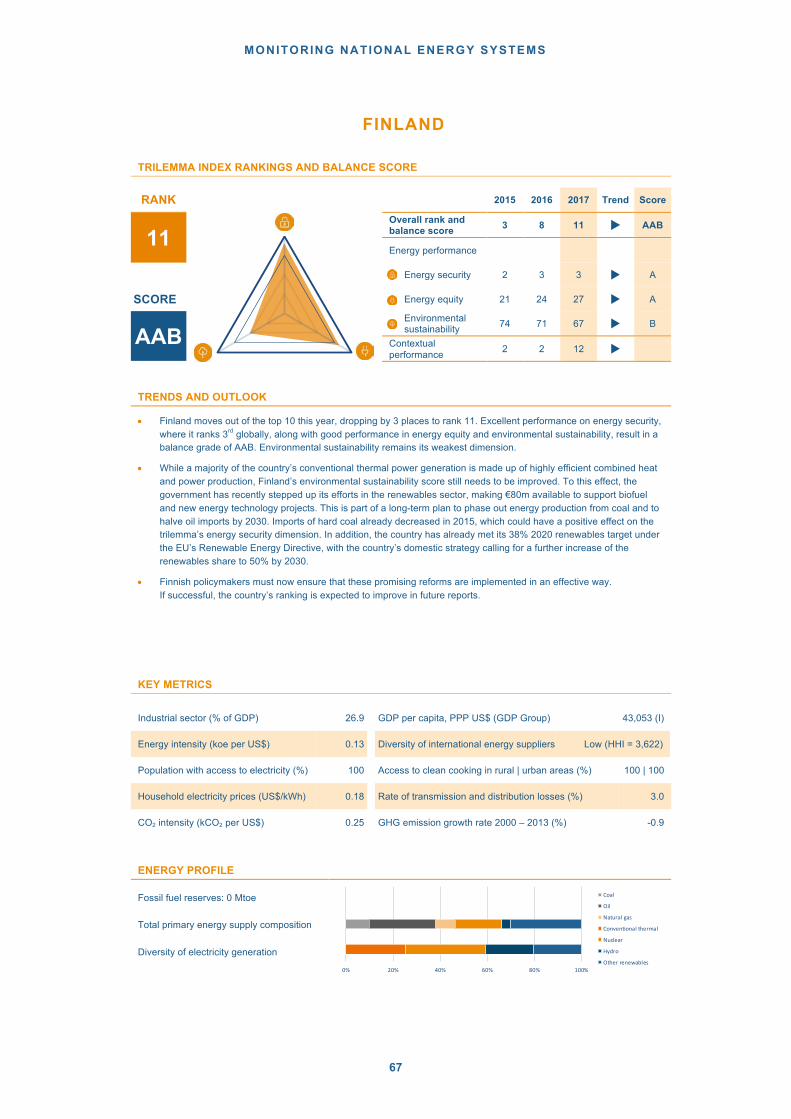
MONITORING NATIONAL ENERGY SYSTEMS
67
FINLAND
TRILEMMA INDEX RANKINGS AND BALANCE SCORE
RANK 2015 2016 2017 Trend Score
11 Overall rank and
balance score 3 8 11 u AAB
Energy performance
Energy security 2 3 3 u A
SCORE Energy equity 21 24 27 u A
AAB Environmental
sustainability 74 71 67 u B
Contextual performance 2 2 12 u
TRENDS AND OUTLOOK
• Finland moves out of the top 10 this year, dropping by 3 places to rank 11. Excellent performance on energy security, where it ranks 3rd globally, along with good performance in energy equity and environmental sustainability, result in a balance grade of AAB. Environmental sustainability remains its weakest dimension.
• While a majority of the country’s conventional thermal power generation is made up of highly efficient combined heat and power production, Finland’s environmental sustainability score still needs to be improved. To this effect, the government has recently stepped up its efforts in the renewables sector, making €80m available to support biofuel and new energy technology projects. This is part of a long-term plan to phase out energy production from coal and to halve oil imports by 2030. Imports of hard coal already decreased in 2015, which could have a positive effect on the trilemma’s energy security dimension. In addition, the country has already met its 38% 2020 renewables target under the EU’s Renewable Energy Directive, with the country’s domestic strategy calling for a further increase of the renewables share to 50% by 2030.
• Finnish policymakers must now ensure that these promising reforms are implemented in an effective way. If successful, the country’s ranking is expected to improve in future reports.
KEY METRICS
Industrial sector (% of GDP) 26.9 GDP per capita, PPP US$ (GDP Group) 43,053 (I)
Energy intensity (koe per US$) 0.13 Diversity of international energy suppliers Low (HHI = 3,622)
Population with access to electricity (%) 100 Access to clean cooking in rural | urban areas (%) 100 | 100
Household electricity prices (US$/kWh) 0.18 Rate of transmission and distribution losses (%) 3.0
CO2 intensity (kCO2 per US$) 0.25 GHG emission growth rate 2000 – 2013 (%) -0.9
ENERGY PROFILE
Fossil fuel reserves: 0 Mtoe
Total primary energy supply composition
Diversity of electricity generation 0% 20% 40% 60% 80% 100%
Coal
Oil
Naturalgas
Conventionalthermal
Nuclear
Hydro
Otherrenewables
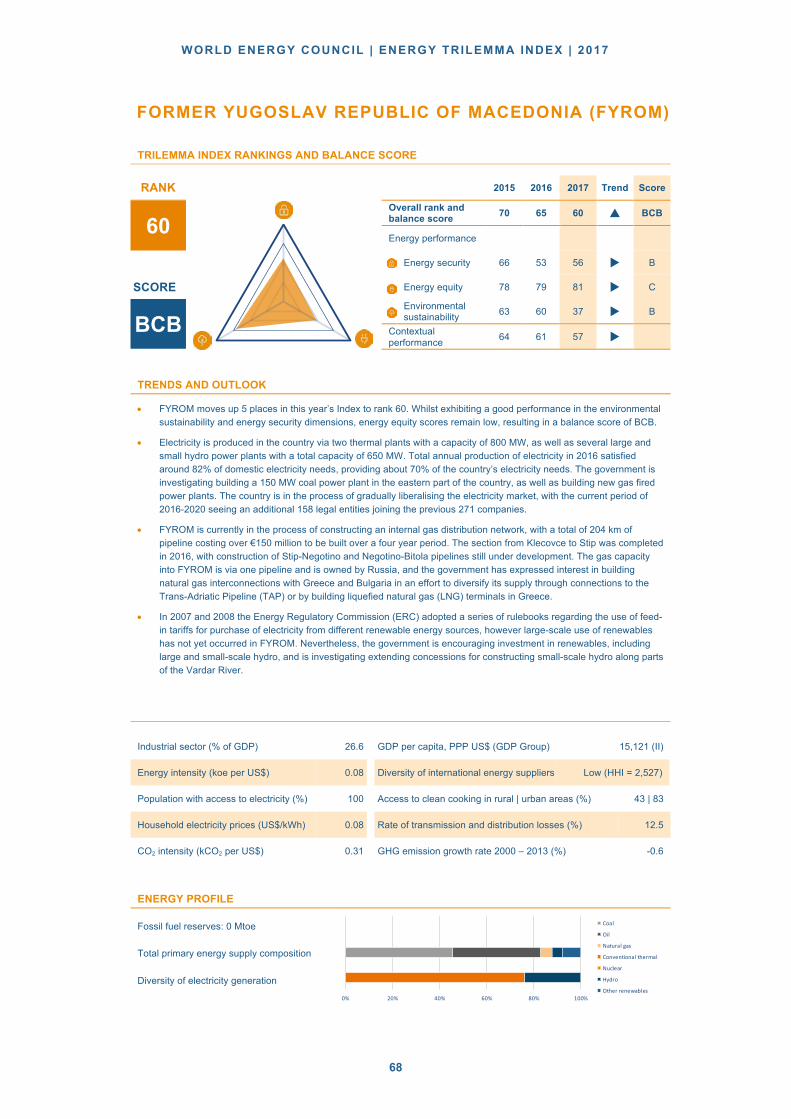
WORLD ENERGY COUNCIL | ENERGY TRILEMMA INDEX | 2017
68
FORMER YUGOSLAV REPUBLIC OF MACEDONIA (FYROM)
TRILEMMA INDEX RANKINGS AND BALANCE SCORE
RANK 2015 2016 2017 Trend Score
60 Overall rank and
balance score 70 65 60 p BCB
Energy performance
Energy security 66 53 56 u B
SCORE Energy equity 78 79 81 u C
BCB
Environmental
sustainability 63 60 37 u B
Contextual
performance 64 61 57 u
TRENDS AND OUTLOOK
• FYROM moves up 5 places in this year’s Index to rank 60. Whilst exhibiting a good performance in the environmental
sustainability and energy security dimensions, energy equity scores remain low, resulting in a balance score of BCB.
• Electricity is produced in the country via two thermal plants with a capacity of 800 MW, as well as several large and
small hydro power plants with a total capacity of 650 MW. Total annual production of electricity in 2016 satisfied
around 82% of domestic electricity needs, providing about 70% of the country’s electricity needs. The government is
investigating building a 150 MW coal power plant in the eastern part of the country, as well as building new gas fired
power plants. The country is in the process of gradually liberalising the electricity market, with the current period of
2016-2020 seeing an additional 158 legal entities joining the previous 271 companies.
• FYROM is currently in the process of constructing an internal gas distribution network, with a total of 204 km of
pipeline costing over €150 million to be built over a four year period. The section from Klecovce to Stip was completed
in 2016, with construction of Stip-Negotino and Negotino-Bitola pipelines still under development. The gas capacity
into FYROM is via one pipeline and is owned by Russia, and the government has expressed interest in building
natural gas interconnections with Greece and Bulgaria in an effort to diversify its supply through connections to the
Trans-Adriatic Pipeline (TAP) or by building liquefied natural gas (LNG) terminals in Greece.
• In 2007 and 2008 the Energy Regulatory Commission (ERC) adopted a series of rulebooks regarding the use of feed-
in tariffs for purchase of electricity from different renewable energy sources, however large-scale use of renewables
has not yet occurred in FYROM. Nevertheless, the government is encouraging investment in renewables, including
large and small-scale hydro, and is investigating extending concessions for constructing small-scale hydro along parts
of the Vardar River.
Industrial sector (% of GDP) 26.6 GDP per capita, PPP US$ (GDP Group) 15,121 (II)
Energy intensity (koe per US$) 0.08 Diversity of international energy suppliers Low (HHI = 2,527)
Population with access to electricity (%) 100 Access to clean cooking in rural | urban areas (%) 43 | 83
Household electricity prices (US$/kWh) 0.08 Rate of transmission and distribution losses (%) 12.5
CO2 intensity (kCO2 per US$) 0.31 GHG emission growth rate 2000 – 2013 (%) -0.6
ENERGY PROFILE
Fossil fuel reserves: 0 Mtoe
Total primary energy supply composition
Diversity of electricity generation
0% 20% 40% 60% 80% 100%
Coal
Oil
Naturalgas
Conventionalthermal
Nuclear
Hydro
Otherrenewables

MONITORING NATIONAL ENERGY SYSTEMS
69
FRANCE
TRILEMMA INDEX RANKINGS AND BALANCE SCORE
RANK 2015 2016 2017 Trend Score
8 Overall rank and
balance score 9 6 8 u AAA
Energy performance
Energy security 21 16 25 u A
SCORE Energy equity 12 9 13 u A
AAA Environmental
sustainability 13 11 6 u A
Contextual performance 22 19 21 u
TRENDS AND OUTLOOK
• France remains in the top 10 this year, ranking 8 overall. An excellent prioritisation of trilemma dimensions – where it performs particularly well in environmental sustainability - results in a very well-balanced score of AAA.
• France has very little domestic oil and natural gas production and relies heavily on imports. To reduce import dependency, France has pursued a vigorous policy of nuclear power development since the mid-1970s, and now has by far the largest nuclear generating capacity of any country in Europe, and is second only to the United States worldwide. Nuclear power constitutes approximately 79% of total electricity generation.
• Recent energy policies include measures and targets to improve energy efficiency, boost renewable power and tackle climate change. The government recently passed a new energy transition law with the aim of cutting France’s reliance on nuclear energy in favour of renewables. The legislation includes the commitment to increase the target price of carbon to €56 per ton in 2020 and €100 per ton in 2030.The government has also revised social tariffs for electricity and gas to counteract the increase in energy prices.
• Key challenges for France come with the implementation phase of its policies and efforts must go towards meeting the targets set. The coexistence of regulated tariffs and market prices for electricity could also cause friction for producers.
KEY METRICS
Industrial sector (% of GDP) 19.5 GDP per capita, PPP US$ (GDP Group) 41,466 (I)
Energy intensity (koe per US$) 0.07 Diversity of international energy suppliers High (HHI = 747)
Population with access to electricity (%) 100 Access to clean cooking in rural | urban areas (%) 100 | 100
Household electricity prices (US$/kWh) 0.20 Rate of transmission and distribution losses (%) 7.7
CO2 intensity (kCO2 per US$) 0.15 GHG emission growth rate 2000 – 2013 (%) -1.5
ENERGY PROFILE
Fossil fuel reserves: 19 Mtoe
Total primary energy supply composition
Diversity of electricity generation
0% 20% 40% 60% 80% 100%
Coal
Oil
Naturalgas
Conventionalthermal
Nuclear
Hydro
Otherrenewables

WORLD ENERGY COUNCIL | ENERGY TRILEMMA INDEX | 2017
70
GERMANY
TRILEMMA INDEX RANKINGS AND BALANCE SCORE
RANK 2015 2016 2017 Trend Score
6 Overall rank and
balance score 5 5 6 u AAB
Energy performance
Energy security 6 7 12 u A
SCORE Energy equity 22 15 17 u A
AAB Environmental
sustainability 29 31 32 u B
Contextual performance 16 15 16 u
TRENDS AND OUTLOOK
• Dropping by 1 place, Germany maintains a place in the top 10 at number 6. The country balances the trilemma dimensions very well, giving an overall balance score of AAB.
• The German Energy Transition, initiated before 2010, targets sustainability and focuses on a strong increase in power generation from renewable sources, a reduction of primary energy usage and CO2 emissions. The 2011 decision to phase out nuclear by 2022 constitutes a challenge to Germany’s energy mix. Nine out of 17 facilities have been shut down to date and the remaining eight nuclear power plants will be phased out gradually over the next five years. Due to low wholesale prices and regulatory uncertainty, investors are reluctant to invest in new conventional power plants, which will still be needed to secure energy demand.
• For an increased share of renewables, the Renewable Energy Law (EEG) guarantees a fixed price, independent of demand and supply for renewable power plants. In 2016 the decision to transform the electricity market in Germany from a feed-in-tariff based system towards a bidding process for green power producers represented an important change, aiming at a more economical and affordable transition. The government also enacted a new law on market design to further develop the energy-only market instead of implementing a capacity market. Nevertheless, tools such as a grid and capacity reserve were installed to ensure security of supply. Renewable energies and their integration into the existing system will represent the major challenge in energy politics for the new government elected in September 2017. Policymakers must set the right framework towards a free and efficient European electricity market to limit the burden.
KEY METRICS
Industrial sector (% of GDP) 30.5 GDP per capita, PPP US$ (GDP Group) 48,730 (I)
Energy intensity (koe per US$) 0.07 Diversity of international energy suppliers High (HHI = 1,364)
Population with access to electricity (%) 100 Access to clean cooking in rural | urban areas (%) 100 | 100
Household electricity prices (US$/kWh) 0.33 Rate of transmission and distribution losses (%) 4.6
CO2 intensity (kCO2 per US$) 0.24 GHG emission growth rate 2000 – 2013 (%) -0.7
ENERGY PROFILE
Fossil fuel reserves: 28,355 Mtoe
Total primary energy supply composition
Diversity of electricity generation 0% 20% 40% 60% 80% 100%
Coal
Oil
Naturalgas
Conventionalthermal
Nuclear
Hydro
Otherrenewables

MONITORING NATIONAL ENERGY SYSTEMS
71
GHANA
TRILEMMA INDEX RANKINGS AND BALANCE SCORE
RANK 2015 2016 2017 Trend Score
96 Overall rank and
balance score 97 99 96 u ADC
Energy performance
Energy security 36 35 28 u A
SCORE Energy equity 105 106 106 u D
ADC Environmental
sustainability 78 81 76 u C
Contextual performance 83 91 82 u
TRENDS AND OUTLOOK
• Ghana improves by 3 spots this year, rising from rank 99 in 2016 to rank 96 in 2017. Whilst performing excellently in energy security, environmental sustainability and energy equity in particular remain weak. This results in an overall balance score of ADC.
• In order to improve energy security, energy equity and environmental sustainability Ghana needs to address a number of related challenges, including: 1) the lack of a credible, sustained and focused energy policy; 2) the inability to execute policies; 3) governmental interference; and 4) ineffective regulatory authorities.
• Recent policy developments include: the enactment of Electricity Regulations, 2008 (L.I 1937), which is intended to provide for the planning, expansion, safety criteria, reliability and cost-effectiveness of the Interconnected Transmission System, and to regulate the wholesale electricity market; the enactment of the Renewable Energy Act, 2011 (Act 832) to improve the development, management and utilisation of renewable energy sources for production of heat and power in an efficient and environmentally-sustainable manner; and the incorporation of Ghana Gas Company in July 2011 with the responsibility to build, own, and operate infrastructure required for gathering, processing, transporting and marketing natural gas in Ghana.
KEY METRICS
Industrial sector (% of GDP) 27.6 GDP per capita, PPP US$ (GDP Group) 4,294 (IV)
Energy intensity (koe per US$) 0.07 Diversity of international energy suppliers Low (HHI = 2,715)
Population with access to electricity (%) 78 Access to clean cooking in rural | urban areas (%) 4 | 29
Household electricity prices (US$/kWh) N.A. Rate of transmission and distribution losses (%) 23.6
CO2 intensity (kCO2 per US$) 0.15 GHG emission growth rate 2000 – 2013 (%) 7.3
ENERGY PROFILE
Fossil fuel reserves: 109 Mtoe
Total primary energy supply composition
Diversity of electricity generation 0% 20% 40% 60% 80% 100%
Coal
Oil
Naturalgas
Conventionalthermal
Nuclear
Hydro
Otherrenewables

WORLD ENERGY COUNCIL | ENERGY TRILEMMA INDEX | 2017
72
GREECE
TRILEMMA INDEX RANKINGS AND BALANCE SCORE
RANK 2015 2016 2017 Trend Score
29 Overall rank and
balance score 37 33 29 p BBA
Energy performance
Energy security 77 56 42 p B
SCORE Energy equity 46 44 48 u B
BBA
Environmental sustainability
23 19 18 u A
Contextual performance
48 46 53 u
TRENDS AND OUTLOOK
• Greece continues its trend of rising 4 places each year, where it ranked 37 in 2015, to rank 29 overall in 2017. The
country continues to balance the energy trilemma well, with noticeable improvement seen in the energy security
dimension, resulting in a grade of BBA.
• Greece has put in place a number of policy instruments to meet the ever-increasing electricity demand, favouring the
market uptake of renewable energy sources. The aim is also to attempt to reduce the share of coal in electricity
generation, which currently accounts for 40% of power generation. If successful, such plans can help to improve the
country’s energy security and environmental sustainability trilemma performance.
• A new remuneration policy framework for renewables allows feed-in tariffs (FITs) only for small PV systems, while
large installations participate via competitive schemes. This requires healthy competition among electricity
generators, and encourages renewable energy investors to step in without generous FITs. Only 7 MW of new PV was
installed in the first half of 2015. To revive the stalled domestic PV market, the country has implemented a net-
metering scheme, applicable only to solar PV installations for self-consumption (both rooftop and ground-mounted
systems).
• The Government is obstructing the liberalisation of the energy market, maintaining control of the national electricity
company − the Public Power Corporation (PPC), owner of the national transmission system operator.
KEY METRICS
Industrial sector (% of GDP) 15.7 GDP per capita, PPP US$ (GDP Group) 26,783 (II)
Energy intensity (koe per US$) 0.07 Diversity of international energy suppliers Medium (HHI = 1,633)
Population with access to electricity (%) 100 Access to clean cooking in rural | urban areas (%) 100 | 100
Household electricity prices (US$/kWh) 0.21 Rate of transmission and distribution losses (%) 7.5
CO2 intensity (kCO2 per US$) 0.28 GHG emission growth rate 2000 – 2013 (%) -1.9
ENERGY PROFILE
Fossil fuel reserves: 2,109 Mtoe
Total primary energy supply composition
Diversity of electricity generation
0% 20% 40% 60% 80% 100%
Coal
Oil
Naturalgas
Conventionalthermal
Nuclear
Hydro
Otherrenewables

MONITORING NATIONAL ENERGY SYSTEMS
73
HONG KONG
TRILEMMA INDEX RANKINGS AND BALANCE SCORE
RANK 2015 2016 2017 Trend Score
34 Overall rank and
balance score 40 37 34 u DAA
Energy performance
Energy security 121 117 111 p D
SCORE Energy equity 29 31 32 u A
DAA Environmental
sustainability 20 20 22 u A
Contextual performance 8 7 10 u
TRENDS AND OUTLOOK
• Hong Kong improves by 3 places in this year’s Index, where it ranked 37 in 2016, to rank 34 in 2017. Whilst receiving excellent scores in both energy equity and environmental sustainability dimensions, it performs poorly in energy security, resulting in an imbalanced trilemma score of DAA.
• The economy has scarce indigenous energy sources and approximately 25% of electricity is imported. To secure a clean and reliable electricity supply, Hong Kong signed a Memorandum of Understanding (MOU) on energy cooperation with mainland China in August 2008, guaranteeing supply of nuclear energy and an enhanced supply of natural gas. The successful completion and commissioning of the Hong Kong Branch Line of the Second West−East Natural Gas Pipeline has helped ensure a stable and secure supply of natural gas from the mainland for power generation. The government has put in place a contingency plan for oil in the event of disruption. A code of practice has also been put in place that requires major oil companies to maintain a minimum of 30 days’ supply of gas oil and naphtha.
• In the 1990s, natural gas for electricity generation was introduced for diversity of supply. Moreover, with the introduction of LPG vehicles in 2000, LPG has been used as a fuel for more than 20,000 taxis and light buses.
• With the 2013 Clean Air Plan for Hong Kong, the Government has implemented a series of measures to improve air quality.
KEY METRICS
Industrial sector (% of GDP) 7.3 GDP per capita, PPP US$ (GDP Group) 58,553 (I)
Energy intensity (koe per US$) 0.03 Diversity of international energy suppliers Low (HHI = 2,530)
Population with access to electricity (%) 100 Access to clean cooking in rural | urban areas (%) N.A. | N.A.
Household electricity prices (US$/kWh) N.A. Rate of transmission and distribution losses (%) 9.4
CO2 intensity (kCO2 per US$) 0.13 GHG emission growth rate 2000 – 2013 (%) N.A.
ENERGY PROFILE
Fossil fuel reserves: 0 Mtoe
Total primary energy supply composition
Diversity of electricity generation
0% 20% 40% 60% 80% 100%
Coal
Oil
Naturalgas
Conventionalthermal
Nuclear
Hydro
Otherrenewables

WORLD ENERGY COUNCIL | ENERGY TRILEMMA INDEX | 2017
74
HUNGARY
TRILEMMA INDEX RANKINGS AND BALANCE SCORE
RANK 2015 2016 2017 Trend Score
27 Overall rank and
balance score 15 21 27 u ABA
Energy performance
Energy security 10 17 19 u A
SCORE Energy equity 27 26 50 u B
ABA
Environmental
sustainability 25 25 27 u A
Contextual
performance 37 43 50 u
TRENDS AND OUTLOOK
• Hungary drops 6 places this year to rank 27. Hungary balances the trade-offs of the energy trilemma well, although
lags behind slightly in energy equity, resulting in a balance score of ABA.
• Published in 2012, the Hungarian government has developed a National Energy Strategy to 2030 focusing on
reducing the country’s energy dependency by: 1) improving energy-efficiency measures throughout the supply and
consumption chain; 2) increasing the share of low-carbon electricity generation; 3) maintaining existing nuclear
capacity; 4) construction of international connections and closer integration with the Central European electricity and
gas networks; and 5) renewing the government’s energy institutions.
• Hungary regularly outperforms its targets for shares of renewable energy as set out under EU guidelines, with
biomass for the use of heat and power being a main driver. Solar power increased from 1 GWh in 2010 to 186 GWh
in 2015; however, an amendment to the energy law in 2016 stunts penetration of wind by banning the construction of
turbines within a 12 km radius of populated areas. Nuclear power provides the majority of Hungary’s electricity, and in
March 2017 the European Commission cleared investment for an agreement that was reached with the Russian
Federation to build two nuclear reactors of 1,200 MW. The reactors are expected to be operational in 2025 and 2026.
• Key areas policymakers continue to focus on are: 1) energy efficiency, through renovation of existing building stock to
reduce energy consumption for heating and cooling; 2) electricity market regulation, through inclusion of capacity
payment mechanisms, to cover long-term marginal costs of power plants as [wholesale] electricity prices fall.
KEY METRICS
Industrial sector (% of GDP) 31.9 GDP per capita, PPP US$ (GDP Group) 26,681 (II)
Energy intensity (koe per US$) 0.09 Diversity of international energy suppliers Medium (HHI = 2,195)
Population with access to electricity (%) 100 Access to clean cooking in rural | urban areas (%) 100 | 84
Household electricity prices (US$/kWh) 0.14 Rate of transmission and distribution losses (%) 9.0
CO2 intensity (kCO2 per US$) 0.23 GHG emission growth rate 2000 – 2013 (%) -2.3
ENERGY PROFILE
Fossil fuel reserves: 21,169 Mtoe
Total primary energy supply composition
Diversity of electricity generation
0% 20% 40% 60% 80% 100%
Coal
Oil
Naturalgas
Conventionalthermal
Nuclear
Hydro
Otherrenewables

MONITORING NATIONAL ENERGY SYSTEMS
75
ICELAND
TRILEMMA INDEX RANKINGS AND BALANCE SCORE
RANK 2015 2016 2017 Trend Score
14 Overall rank and
balance score 12 15 14 u BAA
Energy performance
Energy security 54 57 33 u B
SCORE Energy equity 17 19 16 u A
BAA Environmental
sustainability 2 2 21 u A
Contextual performance 17 17 17 u
TRENDS AND OUTLOOK
• Iceland improves by 1 place this year to rank 14 overall. Iceland exhibits a good performance across all trilemma dimensions, resulting in a balance score of BAA.
• With a big share of renewables, Iceland currently does not have a spot market for electricity. Prices are negotiated via a power purchase agreement (PPA). State-owned Landsvirkjun is by far the largest energy company in Iceland, providing approximately 75% of all the electricity produced in Iceland (12.6 GWh annually). Landsvirkjun is responsible for more than 96% of all hydro generation, and 11% of the total geothermal output. 80% of electricity Landsvirkjun generates is sold to energy intensive industries via long-term contracts. The remaining 20% is bought by public utilities and the Icelandic Transmission System Operator (TSO).
• According to the National Renewable Energy Action Plan for 2020 (NREAP), electricity generation from geothermal power plants is expected to increase by 12% from 5.24 TWh in 2014 to 5.8 TWh in 2020, which corresponds to about 80 MW installed electrical capacity. Recently, the possibility emerged of exporting electricity − via HVDC submarine cables − to mainland Europe.
KEY METRICS
Industrial sector (% of GDP) 22.7 GDP per capita, PPP US$ (GDP Group) 51,399 (I)
Energy intensity (koe per US$) 0.22 Diversity of international energy suppliers Medium (HHI = 2,437)
Population with access to electricity (%) 100 Access to clean cooking in rural | urban areas (%) 100 | 100
Household electricity prices (US$/kWh) N.A. Rate of transmission and distribution losses (%) 2.8
CO2 intensity (kCO2 per US$) 0.16 GHG emission growth rate 2000 – 2013 (%) -0.5
ENERGY PROFILE
Fossil fuel reserves: 0 Mtoe
Total primary energy supply composition
Diversity of electricity generation 0% 20% 40% 60% 80% 100%
Coal
Oil
Naturalgas
Conventionalthermal
Nuclear
Hydro
Otherrenewables

WORLD ENERGY COUNCIL | ENERGY TRILEMMA INDEX | 2017
76
INDIA
TRILEMMA INDEX RANKINGS AND BALANCE SCORE
RANK 2015 2016 2017 Trend Score
92 Overall rank and
balance score 92 91 92 u CCC
Energy performance
Energy security 60 51 66 u C
SCORE Energy equity 93 93 96 u C
CCC Environmental
sustainability 96 97 92 u C
Contextual performance 105 100 86 p
TRENDS AND OUTLOOK
• With a drop of 1 place this year, India ranks 92 overall. The country performs equally on all dimensions resulting in a balance score of CCC.
• India's Intended Nationally Determined Contributions (INDCs) include; reduction of emission intensity of GDP by 33−35 % by 2030 from 2005 levels; approximately 40% cumulative electric power installed capacity from non-fossil fuel based energy resources by 2030, with the help of technology transfer and low-cost international finance from the Green Climate Fund (GCF); creation of additional carbon sink of 2.5-3 billion tonnes of CO2 through additional forest cover by 2030.
• Recent policy directions and impacts include: 1) goal to reduce crude oil import dependence by 10% by 2022 via increasing domestic production through unified E&P policy under HELP, new fuel efficiency standards effective from April 2017, promotion of EVs (all new cars to be electric by 2030), and new biofuel policy; 2) raise the share of gas in the energy mix to 15% by 2022; 3) increase RE power capacity to 175 GW by 2022 and 275 GW by 2027; 4) new hydro policy; 5) interventions under UDAY improving DISCOMS; 6) on track for 100% village electrification by 2018; 7) EPAR compliance being implemented; 8) gradual phasing out of subsidies for kerosene with targeted subsidy via DBT; 9) second cycle of PAT for industrial energy efficiency and SEEP for super-efficient appliances; 10) DSM through large-scale replacement by LEDs; 11) smart cities.
• Key challenges include: 1) integrating large RE capacity 2) Regulations and policies keeping pace with technology; 3) improving operational performance of DISCOMS; 4) growth in manufacturing through Make-in India; 5) clean energy for all.
KEY METRICS
Industrial sector (% of GDP) 29.6 GDP per capita, PPP US$ (GDP Group) 6,572 (III)
Energy intensity (koe per US$) 0.08 Diversity of international energy suppliers High (HHI = 782)
Population with access to electricity (%) 79 Access to clean cooking in rural | urban areas (%) 12 | 87
Household electricity prices (US$/kWh) 0.08 Rate of transmission and distribution losses (%) 19.9
CO2 intensity (kCO2 per US$) 0.30 GHG emission growth rate 2000 – 2013 (%) 5.2
ENERGY PROFILE
Fossil fuel reserves: 44,262 Mtoe
Total primary energy supply composition
Diversity of electricity generation 0% 20% 40% 60% 80% 100%
Coal
Oil
Naturalgas
Conventionalthermal
Nuclear
Hydro
Otherrenewables

MONITORING NATIONAL ENERGY SYSTEMS
77
INDONESIA
Fossil fuel reserves: 22,536 Mtoe
Total primary energy supply composition
Diversity of electricity generation 0% 20% 40% 60% 80% 100%
Coal
Oil
Naturalgas
Conventionalthermal
Nuclear
Hydro
Otherrenewables
INDONESIA
TRILEMMA INDEX RANKINGS AND BALANCE SCORE
RANK 2015 2016 2017 Trend Score
75 Overall rank and
balance score 82 85 75 u BCB
Energy performance
Energy security 57 63 59 u B
SCORE Energy equity 87 88 82 u C
BCB
Environmental sustainability
81 77 68 p B
Contextual performance
77 77 83 u
TRENDS AND OUTLOOK
• Indonesia improves by 10 places this year to rank 75. It performs well for both energy security and environmental sustainability, but lags behind slightly when it comes to energy equity, resulting in a balance score of BCB.
• Fossil fuels remain the dominant energy source for Indonesia. Levels of development and deployment of efficient, low-carbon and carbon-free energy technologies are slower than expected to fulfil sustained energy demand growth, which remains positive under significant energy subsidies to support social and economic development. The total subsidies in Indonesia were estimated at US$ 27.7 billion in 2014, or around 3% GDP, which is almost 6% of the total global subsidies in the same year.
• The National Energy Presidential Decree No. 5, 2006 on National Energy Policy that guides Indonesia’s long-term energy goals was revised in October 2014 setting new targets, including a mix of oil (25%), gas (22%), coal (30%) and new and renewable energy (23%) by 2025. Indonesia is also currently in the third stage of its 20-year National Long-Term Development Plan that lasts from 2005-2025. Targets for this include a renewable energy share of 23% in total primary energy supply by 2025, and at least a 31% share by 2050. A draft National Electricity General Plan (RUKN) for 2015-2034 also includes a renewable electricity capacity target of 45 GW by 2025, with hydropower expecting to have the largest share at 21 GW, followed by geothermal, solar PV, bioenergy, ocean and wind.
• Key issues policymakers need to continue to focus on include: 1) removing energy subsidies; 2) intensifying the efforts to increase the use of new and renewable energy through research and development, pilot projects, providing incentives, capacity building; 3) embed low-carbon and carbon-free technologies in the long-term energy plan; 4) increase energy efficiency on supply and demand sides; and 5) attract more investments to the energy sector.
KEY METRICS
Industrial sector (% of GDP) 40. GDP per capita, PPP US$ (GDP Group) 11,612 (III)
Energy intensity (koe per US$) 0.06 Diversity of international energy suppliers Medium (HHI = 1,814)
Population with access to electricity (%) 97 Access to clean cooking in rural | urban areas (%) 29 | 88
Household electricity prices (US$/kWh) 0.11 Rate of transmission and distribution losses (%) 9.8
CO2 intensity (kCO2 per US$) 0.19 GHG emission growth rate 2000 – 2013 (%) 2.8
ENERGY PROFILE
Fossil fuel reserves: 22,536 Mtoe
Total primary energy supply composition
Diversity of electricity generation
0% 20% 40% 60% 80% 100%
Coal
Oil
Naturalgas
Conventionalthermal
Nuclear
Hydro
Otherrenewables
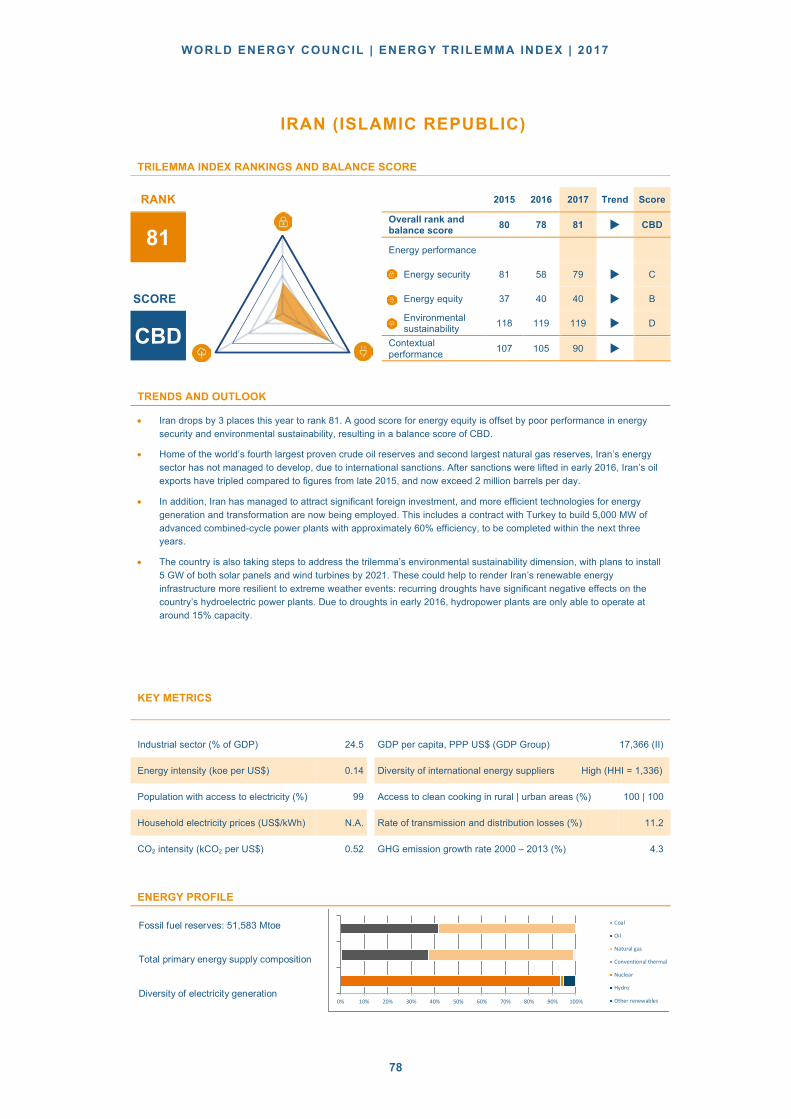
WORLD ENERGY COUNCIL | ENERGY TRILEMMA INDEX | 2017
78
INDONESIA
Fossil fuel reserves: 22,536 Mtoe
Total primary energy supply composition
Diversity of electricity generation 0% 20% 40% 60% 80% 100%
Coal
Oil
Naturalgas
Conventionalthermal
Nuclear
Hydro
Otherrenewables
IRAN (ISLAMIC REPUBLIC)
TRILEMMA INDEX RANKINGS AND BALANCE SCORE
RANK 2015 2016 2017 Trend Score
81 Overall rank and
balance score 80 78 81 u CBD
Energy performance
Energy security 81 58 79 u C
SCORE Energy equity 37 40 40 u B
CBD
Environmental sustainability
118 119 119 u D
Contextual performance
107 105 90 u
TRENDS AND OUTLOOK
• Iran drops by 3 places this year to rank 81. A good score for energy equity is offset by poor performance in energy
security and environmental sustainability, resulting in a balance score of CBD.
• Home of the world’s fourth largest proven crude oil reserves and second largest natural gas reserves, Iran’s energy
sector has not managed to develop, due to international sanctions. After sanctions were lifted in early 2016, Iran’s oil
exports have tripled compared to figures from late 2015, and now exceed 2 million barrels per day.
• In addition, Iran has managed to attract significant foreign investment, and more efficient technologies for energy
generation and transformation are now being employed. This includes a contract with Turkey to build 5,000 MW of
advanced combined-cycle power plants with approximately 60% efficiency, to be completed within the next three
years.
• The country is also taking steps to address the trilemma’s environmental sustainability dimension, with plans to install
5 GW of both solar panels and wind turbines by 2021. These could help to render Iran’s renewable energy
infrastructure more resilient to extreme weather events: recurring droughts have significant negative effects on the
country’s hydroelectric power plants. Due to droughts in early 2016, hydropower plants are only able to operate at
around 15% capacity.
KEY METRICS
Industrial sector (% of GDP) 24.5 GDP per capita, PPP US$ (GDP Group) 17,366 (II)
Energy intensity (koe per US$) 0.14 Diversity of international energy suppliers High (HHI = 1,336)
Population with access to electricity (%) 99 Access to clean cooking in rural | urban areas (%) 100 | 100
Household electricity prices (US$/kWh) N.A. Rate of transmission and distribution losses (%) 11.2
CO2 intensity (kCO2 per US$) 0.52 GHG emission growth rate 2000 – 2013 (%) 4.3
ENERGY PROFILE
Fossil fuel reserves: 21,433 Mtoe
Total primary energy supply composition
Diversity of electricity generation
0% 20% 40% 60% 80% 100%
Coal
Oil
Naturalgas
Conventionalthermal
Nuclear
Hydro
Otherrenewables
0% 10% 20% 30% 40% 50% 60% 70% 80% 90% 100%
Coal
Oil
Natural gas
Conventional thermal
Nuclear
Hydro
Other renewables
ENERGY PROFILE
Fossil fuel reserves: 51,583 Mtoe
Total primary energy supply composition
Diversity of electricity generation

MONITORING NATIONAL ENERGY SYSTEMS
79
IRAQ
TRILEMMA INDEX RANKINGS AND BALANCE SCORE
RANK 2015 2016 2017 Trend Score
80 Overall rank and
balance score 69 74 80 u CBD
Energy performance
Energy security 59 64 83 u C
SCORE Energy equity 54 53 58 u B
CBD Environmental
sustainability 92 100 103 u D
Contextual performance 118 118 111 u
TRENDS AND OUTLOOK
• Iraq drops 6 places this year to rank 80. A drop in energy security results in a letter grade of C, whilst environmental sustainability remains the weakest scoring dimension, resulting in a balance score of CBD.
• The lraqi energy sector is still completely owned by the public sector, and is nearly totally dependent on oil and gas revenues for electricity generation, transportation and distribution. The sector is still facing the challenge of the highly expensive and destructive war against lSlS terrorists, and also the very low oil prices, and hence very limited government revenues. Moreover, the continued disputes with the Kurdistan Regional Government (KRG) reduce oil/gas production and export and hence annual federal revenues are not clearly defined.
• Other minor challenges include rising energy demand internally and also improvement of environment protection legislations. Iraq is tackling these challenges through diversification of economic resources, and through better exploitation of gas and gas-linked industry. In addition, it is intended that a good portion of the revenues will be invested in the non-energy economy, including industry, agriculture, trade, transport and education.
• Improvement of energy efficiency has priority in the recently updated renewable and energy strategy. The national target is for renewable energy to exceed 5% of total electricity production by 2030.
KEY METRICS
Industrial sector (% of GDP) 63.8 GDP per capita, PPP US$ (GDP Group) 17,353 (II)
Energy intensity (koe per US$) 0.05 Diversity of international energy suppliers Low (HHI = 4,052)
Population with access to electricity (%) 99 Access to clean cooking in rural | urban areas (%) 95 | 100
Household electricity prices (US$/kWh) N.A. Rate of transmission and distribution losses (%) 43.8
CO2 intensity (kCO2 per US$) 0.31 GHG emission growth rate 2000 – 2013 (%) 3.7
ENERGY PROFILE
Fossil fuel reserves: 22,014 Mtoe
Total primary energy supply composition
Diversity of electricity generation 0% 20% 40% 60% 80% 100%
Coal
Oil
Naturalgas
Conventionalthermal
Nuclear
Hydro
Otherrenewables

WORLD ENERGY COUNCIL | ENERGY TRILEMMA INDEX | 2017
80
IRELAND
TRILEMMA INDEX RANKINGS AND BALANCE SCORE
RANK 2015 2016 2017 Trend Score
20 Overall rank and
balance score 19 20 20 u CAA
Energy performance
Energy security 75 77 85 u C
SCORE Energy equity 16 16 10 u A
CAA Environmental
sustainability 10 7 2 u A
Contextual performance 11 10 6 u
TRENDS AND OUTLOOK
• Ireland maintains its position at rank 20 this year, where it performs particularly well in environmental sustainability, being placed 2nd globally. An excellent score for energy equity, combined with a somewhat weak score in energy security results in a balance score of CAA.
• In 2014, Ireland imported 85% of its energy needs. At the same time, total primary energy use in Ireland fell by 0.5%. Fossil fuels accounted for 90% of all energy used in Ireland, with oil remaining as the dominant fuel source (47%), followed by gas (28%), coal (9%), renewable energy (8%) and peat (6%), with the balance (2%) comprising electricity imports and energy from waste. Ireland has set one of the world’s most ambitious renewable energy targets: to produce 40% of its electricity from renewable energy by 2020, with the majority of this expected to come from wind-powered generation.
• A full review of Irish national energy policy was undertaken and the outcome is set out in the December 2015 White Paper; ‘Ireland’s Transition to a Low Carbon Energy Future.’ It envisages a reduction of 80−95% in energy-related emissions by 2050. The White Paper identifies the non-traded sector as the primary focus of government policy, which would involve decarbonising the heat and transport sectors.
KEY METRICS
Industrial sector (% of GDP) 41.7 GDP per capita, PPP US$ (GDP Group) 68,883 (I)
Energy intensity (koe per US$) 0.04 Diversity of international energy suppliers Low (HHI = 4,314)
Population with access to electricity (%) 100 Access to clean cooking in rural | urban areas (%) 100 | 100
Household electricity prices (US$/kWh) 0.27 Rate of transmission and distribution losses (%) 7.4
CO2 intensity (kCO2 per US$) 0.15 GHG emission growth rate 2000 – 2013 (%) -1.5
ENERGY PROFILE
Fossil fuel reserves: 8 Mtoe
Total primary energy supply composition
Diversity of electricity generation 0% 20% 40% 60% 80% 100%
Coal
Oil
Naturalgas
Conventionalthermal
Nuclear
Hydro
Otherrenewables

MONITORING NATIONAL ENERGY SYSTEMS
81
ISRAEL
TRILEMMA INDEX RANKINGS AND BALANCE SCORE
RANK 2015 2016 2017 Trend Score
26 Overall rank and
balance score 34 34 26 u BBA
Energy performance
Energy security 85 85 49 u B
SCORE Energy equity 35 36 36 u B
BBA Environmental
sustainability 37 29 28 u A
Contextual performance 24 22 23 u
TRENDS AND OUTLOOK
• Israel improves its position by 8 places this year, rising to 26. An improvement in energy security results in a well-rounded trilemma profile of BBA, with Israel performing particularly well regarding environmental sustainability.
• The discovery of offshore natural gas reserves and underground oil shale, and the subsequent beginning of exploration will change the country’s energy landscape, as Israel relies heavily on fossil fuel imports to meet its growing energy needs. As a country that has been largely dependent on imports to meet its needs, these reserves are critical to the country’s energy security.
• Recent policy developments include: 1) the National Energy Efficiency Programme; and 2) a target for renewable electricity generation − set at 10% by 2020 − to help counteract increasing energy demand and reduce GHG emissions.
• The greatest challenges for policymakers are to: 1) ensure that production of new resources is carried out efficiently; 2) set a binding target for reducing GHG emissions; and 3) closely monitor the implementation of the energy efficiency programme.
KEY METRICS
Industrial sector (% of GDP) 31.4 GDP per capita, PPP US$ (GDP Group) 37,901 (I)
Energy intensity (koe per US$) 0.05 Diversity of international energy suppliers High (HHI = 1,110)
Population with access to electricity (%) 100 Access to clean cooking in rural | urban areas (%) 100 | 100
Household electricity prices (US$/kWh) N.A. Rate of transmission and distribution losses (%) 3.2
CO2 intensity (kCO2 per US$) 0.28 GHG emission growth rate 2000 – 2013 (%) 1.8
ENERGY PROFILE
Fossil fuel reserves: 165 Mtoe
Total primary energy supply composition
Diversity of electricity generation 0% 20% 40% 60% 80% 100%
Coal
Oil
Naturalgas
Conventionalthermal
Nuclear
Hydro
Otherrenewables
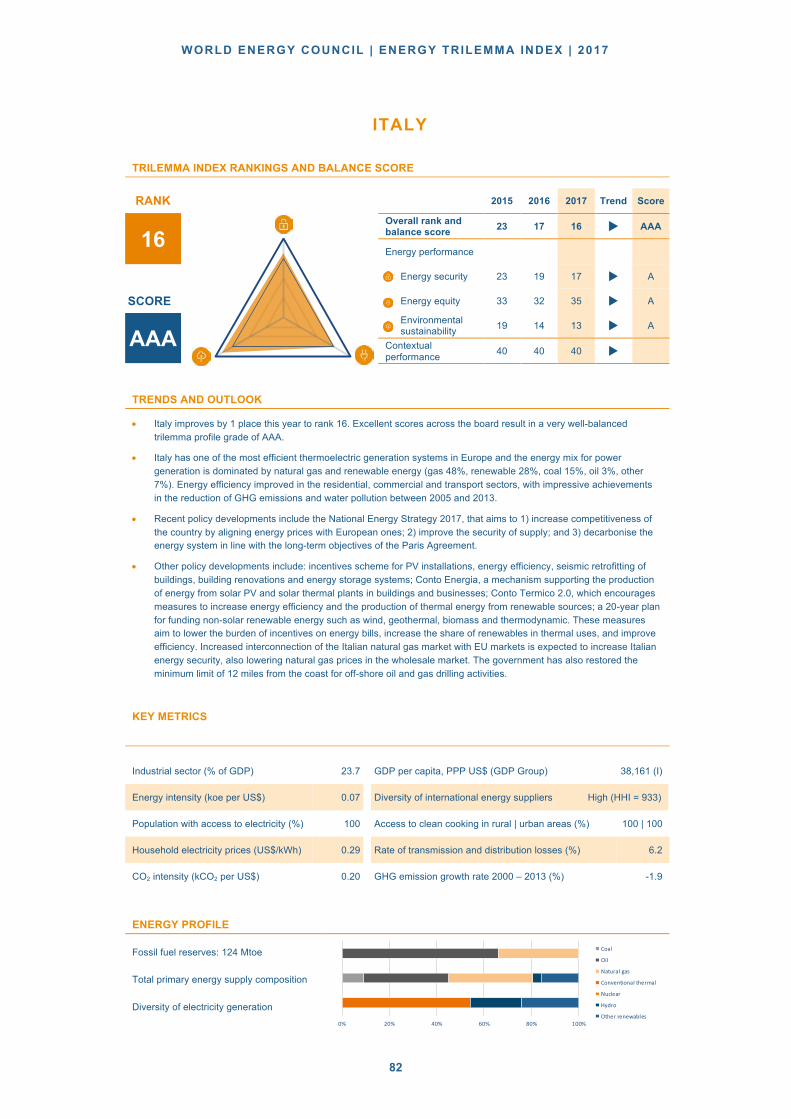
WORLD ENERGY COUNCIL | ENERGY TRILEMMA INDEX | 2017
82
ITALY
TRILEMMA INDEX RANKINGS AND BALANCE SCORE
RANK 2015 2016 2017 Trend Score
16
Overall rank and balance score 23 17 16 u AAA
Energy performance
Energy security 23 19 17 u A
SCORE Energy equity 33 32 35 u A
AAA
Environmental
sustainability 19 14 13 u A
Contextual
performance 40 40 40 u
TRENDS AND OUTLOOK
• Italy improves by 1 place this year to rank 16. Excellent scores across the board result in a very well-balanced
trilemma profile grade of AAA.
• Italy has one of the most efficient thermoelectric generation systems in Europe and the energy mix for power
generation is dominated by natural gas and renewable energy (gas 48%, renewable 28%, coal 15%, oil 3%, other
7%). Energy efficiency improved in the residential, commercial and transport sectors, with impressive achievements
in the reduction of GHG emissions and water pollution between 2005 and 2013.
• Recent policy developments include the National Energy Strategy 2017, that aims to 1) increase competitiveness of
the country by aligning energy prices with European ones; 2) improve the security of supply; and 3) decarbonise the
energy system in line with the long-term objectives of the Paris Agreement.
• Other policy developments include: incentives scheme for PV installations, energy efficiency, seismic retrofitting of
buildings, building renovations and energy storage systems; Conto Energia, a mechanism supporting the production
of energy from solar PV and solar thermal plants in buildings and businesses; Conto Termico 2.0, which encourages
measures to increase energy efficiency and the production of thermal energy from renewable sources; a 20-year plan
for funding non-solar renewable energy such as wind, geothermal, biomass and thermodynamic. These measures
aim to lower the burden of incentives on energy bills, increase the share of renewables in thermal uses, and improve
efficiency. Increased interconnection of the Italian natural gas market with EU markets is expected to increase Italian
energy security, also lowering natural gas prices in the wholesale market. The government has also restored the
minimum limit of 12 miles from the coast for off-shore oil and gas drilling activities.
KEY METRICS
Industrial sector (% of GDP) 23.7 GDP per capita, PPP US$ (GDP Group) 38,161 (I)
Energy intensity (koe per US$) 0.07 Diversity of international energy suppliers High (HHI = 933)
Population with access to electricity (%) 100 Access to clean cooking in rural | urban areas (%) 100 | 100
Household electricity prices (US$/kWh) 0.29 Rate of transmission and distribution losses (%) 6.2
CO2 intensity (kCO2 per US$) 0.20 GHG emission growth rate 2000 – 2013 (%) -1.9
ENERGY PROFILE
Fossil fuel reserves: 124 Mtoe
Total primary energy supply composition
Diversity of electricity generation
0% 20% 40% 60% 80% 100%
Coal
Oil
Naturalgas
Conventionalthermal
Nuclear
Hydro
Otherrenewables
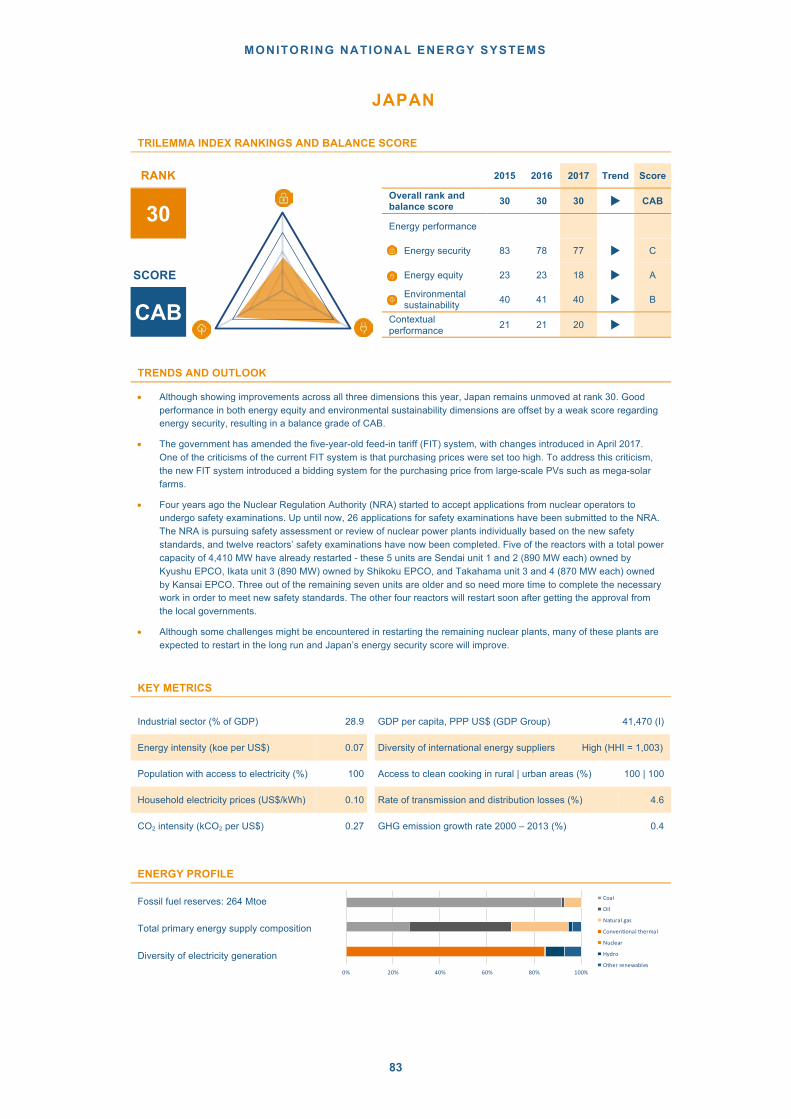
MONITORING NATIONAL ENERGY SYSTEMS
83
JAPAN
TRILEMMA INDEX RANKINGS AND BALANCE SCORE
RANK 2015 2016 2017 Trend Score
30 Overall rank and
balance score 30 30 30 u CAB
Energy performance
Energy security 83 78 77 u C
SCORE Energy equity 23 23 18 u A
CAB Environmental
sustainability 40 41 40 u B
Contextual performance 21 21 20 u
TRENDS AND OUTLOOK
• Although showing improvements across all three dimensions this year, Japan remains unmoved at rank 30. Good performance in both energy equity and environmental sustainability dimensions are offset by a weak score regarding energy security, resulting in a balance grade of CAB.
• The government has amended the five-year-old feed-in tariff (FIT) system, with changes introduced in April 2017. One of the criticisms of the current FIT system is that purchasing prices were set too high. To address this criticism, the new FIT system introduced a bidding system for the purchasing price from large-scale PVs such as mega-solar farms.
• Four years ago the Nuclear Regulation Authority (NRA) started to accept applications from nuclear operators to undergo safety examinations. Up until now, 26 applications for safety examinations have been submitted to the NRA. The NRA is pursuing safety assessment or review of nuclear power plants individually based on the new safety standards, and twelve reactors’ safety examinations have now been completed. Five of the reactors with a total power capacity of 4,410 MW have already restarted - these 5 units are Sendai unit 1 and 2 (890 MW each) owned by Kyushu EPCO, Ikata unit 3 (890 MW) owned by Shikoku EPCO, and Takahama unit 3 and 4 (870 MW each) owned by Kansai EPCO. Three out of the remaining seven units are older and so need more time to complete the necessary work in order to meet new safety standards. The other four reactors will restart soon after getting the approval from the local governments.
• Although some challenges might be encountered in restarting the remaining nuclear plants, many of these plants are expected to restart in the long run and Japan’s energy security score will improve.
KEY METRICS
Industrial sector (% of GDP) 28.9 GDP per capita, PPP US$ (GDP Group) 41,470 (I)
Energy intensity (koe per US$) 0.07 Diversity of international energy suppliers High (HHI = 1,003)
Population with access to electricity (%) 100 Access to clean cooking in rural | urban areas (%) 100 | 100
Household electricity prices (US$/kWh) 0.10 Rate of transmission and distribution losses (%) 4.6
CO2 intensity (kCO2 per US$) 0.27 GHG emission growth rate 2000 – 2013 (%) 0.4
ENERGY PROFILE
Fossil fuel reserves: 264 Mtoe
Total primary energy supply composition
Diversity of electricity generation 0% 20% 40% 60% 80% 100%
Coal
Oil
Naturalgas
Conventionalthermal
Nuclear
Hydro
Otherrenewables

WORLD ENERGY COUNCIL | ENERGY TRILEMMA INDEX | 2017
84
JORDAN
TRILEMMA INDEX RANKINGS AND BALANCE SCORE
RANK 2015 2016 2017 Trend Score
87 Overall rank and
balance score 67 75 87 u DBC
Energy performance
Energy security 100 106 121 u D
SCORE Energy equity 50 52 56 u B
DBC
Environmental
sustainability 83 82 78 u C
Contextual
performance 68 72 69 u
TRENDS AND OUTLOOK
• Jordan drops by 12 places this year, from rank 75 in 2016 to rank 87 in 2017. Energy equity remains the top
performing dimension, while energy security is particularly weak, resulting in a balance score of DBC.
• The major current challenges for the country are an extremely high dependence on imports, with over 95% of its
energy demand annually being imported. These imports impose a heavy cost burden, representing about 20% of the
GDP in 2014. The Arab Spring leaves the country in constant instability of supply of oil and natural gas. Energy
demand is projected to continue to grow between 5−7% annually with the flow of refugees, national population
growth, and expansion of development projects. The country’s current and future top priorities are to achieve a
diversification of energy sources by introducing alternative energy, exploiting domestic reserves, and switching from
import of Piped Natural Gas (PNG) to Liquefied Natural Gas (LNG).
• The country has been attempting to increase the share of nuclear, solar and wind power to 16% of the total energy
mix by 2020 compared to 2% in 2013, signing a $10bn deal for construction of 2,000 MW nuclear power reactors with
Russian state-owned company Rosatom in March 2015. The oil shale reserve has been developed by the Jordan Oil
Shale Company and Shell, with the expectation that shales will contribute 14% to the nation’s energy mix in 2020. A
new LNG terminal opened in July 2015 to replace the import of oil and unstable PNG. This will also contribute to
reducing CO2 emissions as well as increasing energy security.
KEY METRICS
Industrial sector (% of GDP) 29.6 GDP per capita, PPP US$ (GDP Group) 9,050 (III)
Energy intensity (koe per US$) 0.08 Diversity of international energy suppliers Low (HHI = 2,962)
Population with access to electricity (%) 100 Access to clean cooking in rural | urban areas (%) 100 | 100
Household electricity prices (US$/kWh) N.A. Rate of transmission and distribution losses (%) 10.9
CO2 intensity (kCO2 per US$) 0.34 GHG emission growth rate 2000 – 2013 (%) 3.8
ENERGY PROFILE
Fossil fuel reserves: 6 Mtoe
Total primary energy supply composition
Diversity of electricity generation
0% 20% 40% 60% 80% 100%
Coal
Oil
Naturalgas
Conventionalthermal
Nuclear
Hydro
Otherrenewables

MONITORING NATIONAL ENERGY SYSTEMS
85
KAZAKHSTAN
TRILEMMA INDEX RANKINGS AND BALANCE SCORE
RANK 2015 2016 2017 Trend Score
78 Overall rank and
balance score 84 82 78 u CBD
Energy performance
Energy security 72 65 65 u C
SCORE Energy equity 52 54 59 u B
CBD
Environmental sustainability
122 122 120 u D
Contextual performance
60 50 45 p
TRENDS AND OUTLOOK
• A jump of 4 places sees Kazakhstan climb to rank 78 in this year’s Index. Good scores in energy security and equity
dimensions are combined with a poor score in environmental sustainability, resulting in a balance grade of CBD.
• Recent policy developments in Kazakhstan include: strengthening state institutions responsible for energy efficiency
in production, extraction and consumption of energy; clear and comprehensive energy saving programmes to reduce
the energy intensity of industry (a 25% reduction by 2020 compared to 2008); the adoption of policies to support the
development and inclusion of available renewable energy sources (RES) into the energy mix (renewable and
alternative sources by 2050 should provide 50% of the country’s electricity); and plans and programmes to facilitate
the modernisation of existing power generation, power grids and oil refining installations. The diversification of the
generation portfolio will be enhanced by Kazakhstan’s Transition to a Green Economy, approved by the Order of the
President of Kazakhstan in 2013.
• Policymakers will continue existing successful practices to maintain a favourable investment climate, which allows
improvements to the country’s trilemma balance, and attracts investment into the exploration and production of
energy resources for export to world markets. There is a need to further develop power generating facilities by
introducing cutting-edge technologies that will not only ensure domestic supply, but also enable the country to offer
significant amounts of electricity to markets in neighbouring countries.
KEY METRICS
Industrial sector (% of GDP) 32.5 GDP per capita, PPP US$ (GDP Group) 25,264 (II)
Energy intensity (koe per US$) 0.10 Diversity of international energy suppliers Low (HHI = 5,081)
Population with access to electricity (%) 100 Access to clean cooking in rural | urban areas (%) 80 | 99
Household electricity prices (US$/kWh) N.A. Rate of transmission and distribution losses (%) 7.5
CO2 intensity (kCO2 per US$) 0.60 GHG emission growth rate 2000 – 2013 (%) 6.3
ENERGY PROFILE
Fossil fuel reserves: 28,663 Mtoe
Total primary energy supply composition
Diversity of electricity generation
0% 20% 40% 60% 80% 100%
Coal
Oil
Naturalgas
Conventionalthermal
Nuclear
Hydro
Otherrenewables

WORLD ENERGY COUNCIL | ENERGY TRILEMMA INDEX | 2017
86
KENYA
TRILEMMA INDEX RANKINGS AND BALANCE SCORE
RANK 2015 2016 2017 Trend Score
100 Overall rank and
balance score 107 107 100 u ADC
Energy performance
Energy security 37 47 24 u A
SCORE Energy equity 117 118 109 u D
ADC Environmental
sustainability 55 58 80 u C
Contextual performance 93 89 85 p
TRENDS AND OUTLOOK
• Kenya improves its ranking to 100 in this year’s Index. Whilst the country performs particularly well when it comes to energy security, poor scores in both energy equity and environmental sustainability result in grades of D and C respectively, resulting in a balance score of ADC.
• Kenya’s power supply situation has transformed significantly recently in terms of generation capacity, having addressed perennial supply shortages that have affected the country for over a decade. In the past Kenya had to rely heavily on diesel fired plants including emergency thermal power plants (EPPs), especially during periods of drought when hydro reservoirs were low. This has since improved with the increase in generation from geothermal and other renewable sources, allowing the retirement of a total of 120 MW of Emergency Power Producers (EPPs), with the last 30 MW phased out in mid-2016. Currently, the installed capacity stands at 2,333 MW, while peak demand is 1,665 MW.
• Power supply reliability is another area of great importance to Kenya. Recent initiatives include system overhauls and the construction of dedicated or alternative supply routes for industrial and commercial consumers, as well as for urban areas. Recently, the country has achieved a major milestone through the energisation of the 400kV Suswa-Isinya-Rabai line. This will evacuate excess power from the geothermal plants at Olkaira to the coast, reducing dependence on thermal generation in the region.
• In its long-term development strategy ‘Vision 2030’, energy was identified as one of the critical foundations and enablers of the socio-economic transformation envisioned for the country. To this effect, a number of policies and regulations have been developed: the 2015 Energy Bill to consolidate all laws relating to energy, the National Energy and Petroleum Policy 2015 to support the administration of all the proposed laws and the Petroleum Exploration, Development and Production Local Content Regulations 2014 Act for local content provisions, to name a few.
KEY METRICS
Industrial sector (% of GDP) 19.1 GDP per capita, PPP US$ (GDP Group) 3,156 (IV)
Energy intensity (koe per US$) 0.16 Diversity of international energy suppliers Medium (HHI = 1,857)
Population with access to electricity (%) 36 Access to clean cooking in rural | urban areas (%) 3 | 58
Household electricity prices (US$/kWh) 0.12 Rate of transmission and distribution losses (%) 16.3
CO2 intensity (kCO2 per US$) 0.12 GHG emission growth rate 2000 – 2013 (%) 2.7
ENERGY PROFILE
Fossil fuel reserves: 0 Mtoe
Total primary energy supply composition
Diversity of electricity generation 0% 20% 40% 60% 80% 100%
Coal
Oil
Naturalgas
Conventionalthermal
Nuclear
Hydro
Otherrenewables
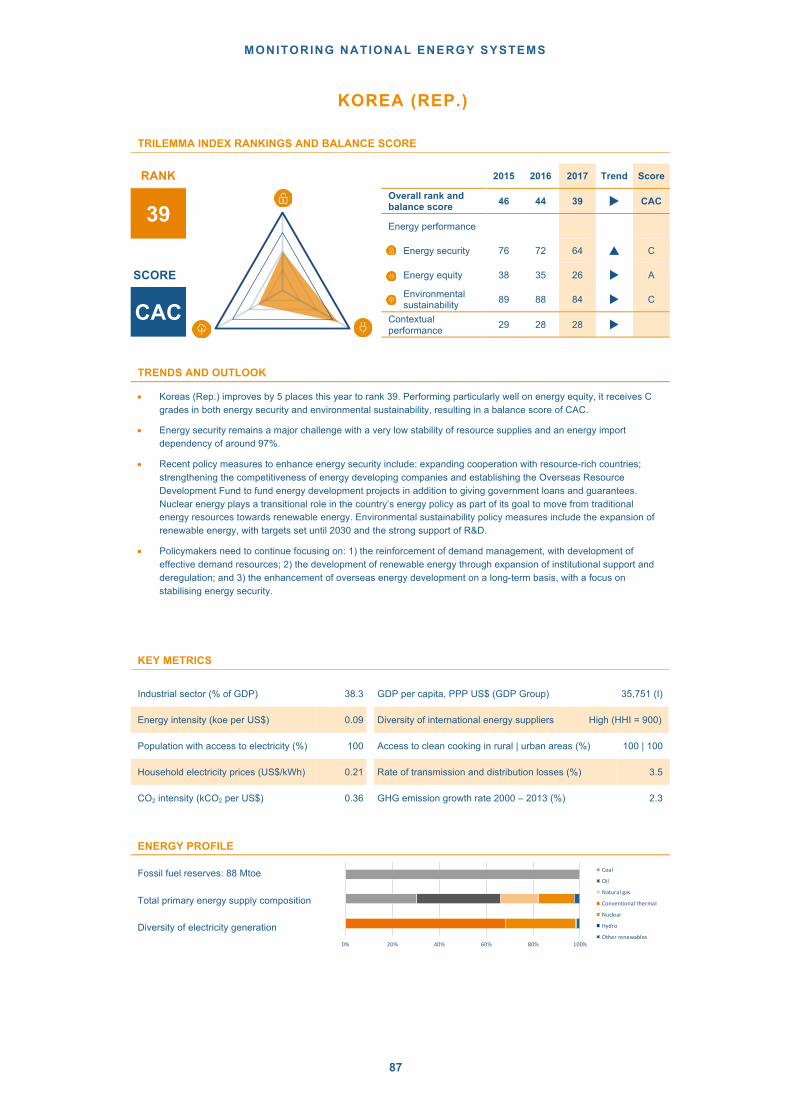
MONITORING NATIONAL ENERGY SYSTEMS
87
KOREA (REP.)
TRILEMMA INDEX RANKINGS AND BALANCE SCORE
RANK 2015 2016 2017 Trend Score
39 Overall rank and
balance score 46 44 39 u CAC
Energy performance
Energy security 76 72 64 p C
SCORE Energy equity 38 35 26 u A
CAC
Environmental
sustainability 89 88 84 u C
Contextual
performance 29 28 28 u
TRENDS AND OUTLOOK
• Koreas (Rep.) improves by 5 places this year to rank 39. Performing particularly well on energy equity, it receives C
grades in both energy security and environmental sustainability, resulting in a balance score of CAC.
• Energy security remains a major challenge with a very low stability of resource supplies and an energy import
dependency of around 97%.
• Recent policy measures to enhance energy security include: expanding cooperation with resource-rich countries;
strengthening the competitiveness of energy developing companies and establishing the Overseas Resource
Development Fund to fund energy development projects in addition to giving government loans and guarantees.
Nuclear energy plays a transitional role in the country’s energy policy as part of its goal to move from traditional
energy resources towards renewable energy. Environmental sustainability policy measures include the expansion of
renewable energy, with targets set until 2030 and the strong support of R&D.
• Policymakers need to continue focusing on: 1) the reinforcement of demand management, with development of
effective demand resources; 2) the development of renewable energy through expansion of institutional support and
deregulation; and 3) the enhancement of overseas energy development on a long-term basis, with a focus on
stabilising energy security.
KEY METRICS
Industrial sector (% of GDP) 38.3 GDP per capita, PPP US$ (GDP Group) 35,751 (I)
Energy intensity (koe per US$) 0.09 Diversity of international energy suppliers High (HHI = 900)
Population with access to electricity (%) 100 Access to clean cooking in rural | urban areas (%) 100 | 100
Household electricity prices (US$/kWh) 0.21 Rate of transmission and distribution losses (%) 3.5
CO2 intensity (kCO2 per US$) 0.36 GHG emission growth rate 2000 – 2013 (%) 2.3
ENERGY PROFILE
Fossil fuel reserves: 88 Mtoe
Total primary energy supply composition
Diversity of electricity generation
0% 20% 40% 60% 80% 100%
Coal
Oil
Naturalgas
Conventionalthermal
Nuclear
Hydro
Otherrenewables

WORLD ENERGY COUNCIL | ENERGY TRILEMMA INDEX | 2017
88
LATVIA
TRILEMMA INDEX RANKINGS AND BALANCE SCORE
RANK 2015 2016 2017 Trend Score
23 Overall rank and
balance score 24 25 23 u ABB
Energy performance
Energy security 15 18 5 u A
SCORE Energy equity 41 38 46 u B
ABB
Environmental sustainability
49 56 45 u B
Contextual performance
23 26 33 u
TRENDS AND OUTLOOK
• Latvia improves by 2 spots this year to rank 23. The country exhibits a well-balanced trilemma profile, especially for
energy security where it is placed 5th globally, resulting in a balance score of ABB.
• The Latvian Energy Long Term Strategy 2030 sets a target of 50% energy from renewable energy sources and a
50% reduction in energy imports from third country suppliers by 2030. An ongoing renovation of Latvia’s hydroelectric
power plants (eleven aged hydro units in total), as well as a reconstruction of natural gas CCGT plants has meant that
Latvia has so far managed to sustain its low level of GHG emissions in the power sector. CHP projects using biomass
are also in progress and wind projects are awaiting RES support schemes.
• A declaration by Baltic Prime Ministers in 2016 regarding the regional gas market development by 2020, as well as
increased diversification of gas imports via a new LNG terminal in Lithuania and ongoing BEMIP-G projects, mean
that Latvia’s energy security and equity dimensions of the trilemma are all expected to improve in the future. In
addition, the opening of the Latvian natural gas market to free trade in 2017, and progress on the implementation of a
planned connection from Latvia to Estonia, to be completed by 2020 as a part of the Baltic Energy Market
Interconnection Plan (BEMIP), are also expected to have benefits for energy security and equity. The main political
challenges for Latvia lie in preventing market failures, achieving energy policy neutrality and avoiding improperly
promoted economic incentives, in the light of ensuring a balanced development of renewable energy.
KEY METRICS
Industrial sector (% of GDP) 22.9 GDP per capita, PPP US$ (GDP Group) 26,031 (II)
Energy intensity (koe per US$) 0.10 Diversity of international energy suppliers Low (HHI = 2,773)
Population with access to electricity (%) 100 Access to clean cooking in rural | urban areas (%) 78 | 100
Household electricity prices (US$/kWh) 0.18 Rate of transmission and distribution losses (%) 6.5
CO2 intensity (kCO2 per US$) 0.19 GHG emission growth rate 2000 – 2013 (%) 0.2
ENERGY PROFILE
Fossil fuel reserves: 0 Mtoe
Total primary energy supply composition
Diversity of electricity generation
0% 20% 40% 60% 80% 100%
Coal
Oil
Naturalgas
Conventionalthermal
Nuclear
Hydro
Otherrenewables

MONITORING NATIONAL ENERGY SYSTEMS
89
LEBANON
TRILEMMA INDEX RANKINGS AND BALANCE SCORE
RANK 2015 2016 2017 Trend Score
95 Overall rank and
balance score 86 86 95 u DBC
Energy performance
Energy security 112 113 122 u D
SCORE Energy equity 76 74 75 u B
DBC Environmental
sustainability 58 61 71 u C
Contextual performance 99 95 95 u
TRENDS AND OUTLOOK
• Lebanon drops 9 places in this year’s Index to rank 95. Although performing well in energy equity, energy security is particularly weak, giving an overall balance score of DBC.
• In 2010, the government approved a strategy for the rehabilitation of the power sector, including the development of energy efficiency and renewable energy to address the country’s energy security concerns.
• The national target is for 12% of total electricity production to come from renewable energy by 2020. A recent move towards developing larger solar power plants, such as the Beirut River Solar Snake project, is a promising sign of the country’s progress on its renewables targets.
• With regards to energy efficiency targets, progress is slowing down. The National Energy Efficiency Action Plan, adopted in 2011, expired in 2015, and no successor plan has been formulated to ensure continuing energy efficiency gains.
• A key challenge to successful implementation will be to update the legislative framework that governs the power sector. Policymakers should focus on creating an enabling legislative framework for the development of renewable energy and energy efficiency, which has the potential to improve both the trilemma’s environmental sustainability and security dimensions.
KEY METRICS
Industrial sector (% of GDP) 20.9 GDP per capita, PPP US$ (GDP Group) 13,996 (III)
Energy intensity (koe per US$) 0.07 Diversity of international energy suppliers High (HHI = 1,220)
Population with access to electricity (%) 100 Access to clean cooking in rural | urban areas (%) 100 | 100
Household electricity prices (US$/kWh) N.A. Rate of transmission and distribution losses (%) 10.4
CO2 intensity (kCO2 per US$) 0.33 GHG emission growth rate 2000 – 2013 (%) 3.2
ENERGY PROFILE
Fossil fuel reserves: 0 Mtoe
Total primary energy supply composition
Diversity of electricity generation 0% 20% 40% 60% 80% 100%
Coal
Oil
Naturalgas
Conventionalthermal
Nuclear
Hydro
Otherrenewables
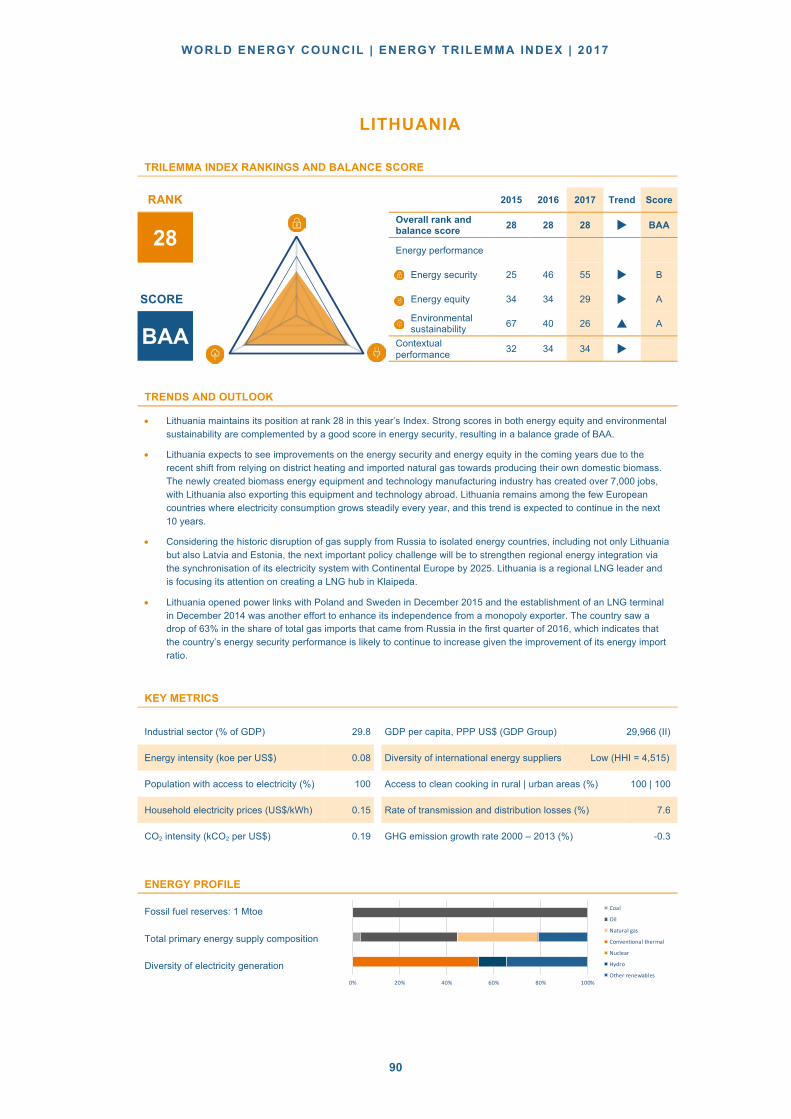
WORLD ENERGY COUNCIL | ENERGY TRILEMMA INDEX | 2017
90
LITHUANIA
TRILEMMA INDEX RANKINGS AND BALANCE SCORE
RANK 2015 2016 2017 Trend Score
28 Overall rank and balance score 28 28 28 u BAA
Energy performance
Energy security 25 46 55 u B
SCORE Energy equity 34 34 29 u A
BAA Environmental
sustainability 67 40 26 p A
Contextual performance 32 34 34 u
TRENDS AND OUTLOOK
• Lithuania maintains its position at rank 28 in this year’s Index. Strong scores in both energy equity and environmental sustainability are complemented by a good score in energy security, resulting in a balance grade of BAA.
• Lithuania expects to see improvements on the energy security and energy equity in the coming years due to the recent shift from relying on district heating and imported natural gas towards producing their own domestic biomass. The newly created biomass energy equipment and technology manufacturing industry has created over 7,000 jobs, with Lithuania also exporting this equipment and technology abroad. Lithuania remains among the few European countries where electricity consumption grows steadily every year, and this trend is expected to continue in the next 10 years.
• Considering the historic disruption of gas supply from Russia to isolated energy countries, including not only Lithuania but also Latvia and Estonia, the next important policy challenge will be to strengthen regional energy integration via the synchronisation of its electricity system with Continental Europe by 2025. Lithuania is a regional LNG leader and is focusing its attention on creating a LNG hub in Klaipeda.
• Lithuania opened power links with Poland and Sweden in December 2015 and the establishment of an LNG terminal in December 2014 was another effort to enhance its independence from a monopoly exporter. The country saw a drop of 63% in the share of total gas imports that came from Russia in the first quarter of 2016, which indicates that the country’s energy security performance is likely to continue to increase given the improvement of its energy import ratio.
KEY METRICS
Industrial sector (% of GDP) 29.8 GDP per capita, PPP US$ (GDP Group) 29,966 (II)
Energy intensity (koe per US$) 0.08 Diversity of international energy suppliers Low (HHI = 4,515)
Population with access to electricity (%) 100 Access to clean cooking in rural | urban areas (%) 100 | 100
Household electricity prices (US$/kWh) 0.15 Rate of transmission and distribution losses (%) 7.6
CO2 intensity (kCO2 per US$) 0.19 GHG emission growth rate 2000 – 2013 (%) -0.3
ENERGY PROFILE
Fossil fuel reserves: 1 Mtoe
Total primary energy supply composition
Diversity of electricity generation 0% 20% 40% 60% 80% 100%
Coal
Oil
Naturalgas
Conventionalthermal
Nuclear
Hydro
Otherrenewables

MONITORING NATIONAL ENERGY SYSTEMS
91
LUXEMBOURG
TRILEMMA INDEX RANKINGS AND BALANCE SCORE
RANK 2015 2016 2017 Trend Score
63 Overall rank and
balance score 57 55 63 u DAC
Energy performance
Energy security 120 122 120 u D
SCORE Energy equity 1 1 1 u A
DAC Environmental
sustainability 108 103 99 p C
Contextual performance 3 5 4 u
TRENDS AND OUTLOOK
• Luxembourg drops by 8 places to rank 63 in this year’s Index. Whilst exhibiting an excellent performance for energy equity, assuming 1st position globally, it lags behind in terms of energy security and environmental sustainability, resulting in an imbalanced trilemma score of DAC.
• A major challenge that Luxembourg faces is its dependence on energy imports (96.8% in 2010). Due to the country’s limited resource endowment, there is little potential for Luxembourg to develop domestic energy sources. Instead, the country needs to focus on promoting regional interconnection, diversifying its energy sources and suppliers, and improving its energy efficiency and intensity to promote its energy security. To this end, Luxembourg is planning to transition towards a new industrial model in which it hopes to merge ICT, renewable energy and new transport models.
• The wider deployment of renewables continues to be a major challenge for Luxembourg, with renewables accounting for 4.5% of final energy consumption in 2014, above the trajectory planned for 2013-2014. However, the 2020 target of 11% will be harder to reach. Despite its support mechanisms, including feed-in tariffs, investment incentives and tax deductions, the country is unlikely to meet the target given current progress.
• Luxembourg has implemented an Energy Efficiency Obligation Scheme for natural gas and electricity suppliers that encourages and provides incentives for customers that invest in more efficient appliances, insulation and when renovating buildings. Energy and carbon intensity in Luxembourg’s economy is the lowest among EU-15 countries. However, for the industry and transportation sectors, energy intensity is the highest among all EU-15 countries, with a low diesel price one of the contributing factors.
KEY METRICS
Industrial sector (% of GDP) 12.4 GDP per capita, PPP US$ (GDP Group) 105,882 (I)
Energy intensity (koe per US$) 0.09 Diversity of international energy suppliers Low (HHI = 4,588)
Population with access to electricity (%) 100 Access to clean cooking in rural | urban areas (%) 100 | 100
Household electricity prices (US$/kWh) 0.21 Rate of transmission and distribution losses (%) 1.9
CO2 intensity (kCO2 per US$) 0.21 GHG emission growth rate 2000 – 2013 (%) 1.7
ENERGY PROFILE
Fossil fuel reserves: 0 Mtoe
Total primary energy supply composition
Diversity of electricity generation 0% 20% 40% 60% 80% 100%
Coal
Oil
Naturalgas
Conventionalthermal
Nuclear
Hydro
Otherrenewables

WORLD ENERGY COUNCIL | ENERGY TRILEMMA INDEX | 2017
92
MALAYSIA
TRILEMMA INDEX RANKINGS AND BALANCE SCORE
RANK 2015 2016 2017 Trend Score
41 Overall rank and
balance score 38 35 41 u BBC
Energy performance
Energy security 55 37 53 u B
SCORE Energy equity 40 41 39 u B
BBC Environmental
sustainability 75 83 85 u C
Contextual performance 33 33 30 u
TRENDS AND OUTLOOK
• Malaysia drops by 6 places this year to rank 41. It scores well across all trilemma dimensions, with a slightly lower score received for environmental sustainability, giving an overall balance score of BBC.
• According to the eleventh Malaysia Plan (2016−2020), rural electrification and renewable energy development will be key aims for the Malaysian energy sector. The share of households with access to electricity increased to approximately 98% in 2015. In order to complete the electrification of the entire country by 2020, construction of new generation plants with 7.6 GW of total capacity, and a number of grid interconnection projects will be implemented. New power plants will contribute to not only the improvement of energy equity, but also enhance energy security and sustainability through replacing older, inefficient plants.
• The country is also seeking to improve its generation mix, which will reduce its high dependency on oil and gas. The potential of several alternative sources is being examined by the government; in particular biomass, biogas, geothermal and wind are expected to be at the heart of government policy. The target share of renewable sources in total generation capacity is 7.8% in Peninsular Malaysia and Sabah by 2020. Under this aim, the first geothermal plant is currently under construction and will start operation in 2018.
KEY METRICS
Industrial sector (% of GDP) 36.4 GDP per capita, PPP US$ (GDP Group) 27,681 (II)
Energy intensity (koe per US$) 0.07 Diversity of international energy suppliers High (HHI = 1,305)
Population with access to electricity (%) 100 Access to clean cooking in rural | urban areas (%) 100 | 100
Household electricity prices (US$/kWh) N.A. Rate of transmission and distribution losses (%) 6.1
CO2 intensity (kCO2 per US$) 0.32 GHG emission growth rate 2000 – 2013 (%) 4.6
ENERGY PROFILE
Fossil fuel reserves: 1,395 Mtoe
Total primary energy supply composition
Diversity of electricity generation 0% 20% 40% 60% 80% 100%
Coal
Oil
Naturalgas
Conventionalthermal
Nuclear
Hydro
Otherrenewables
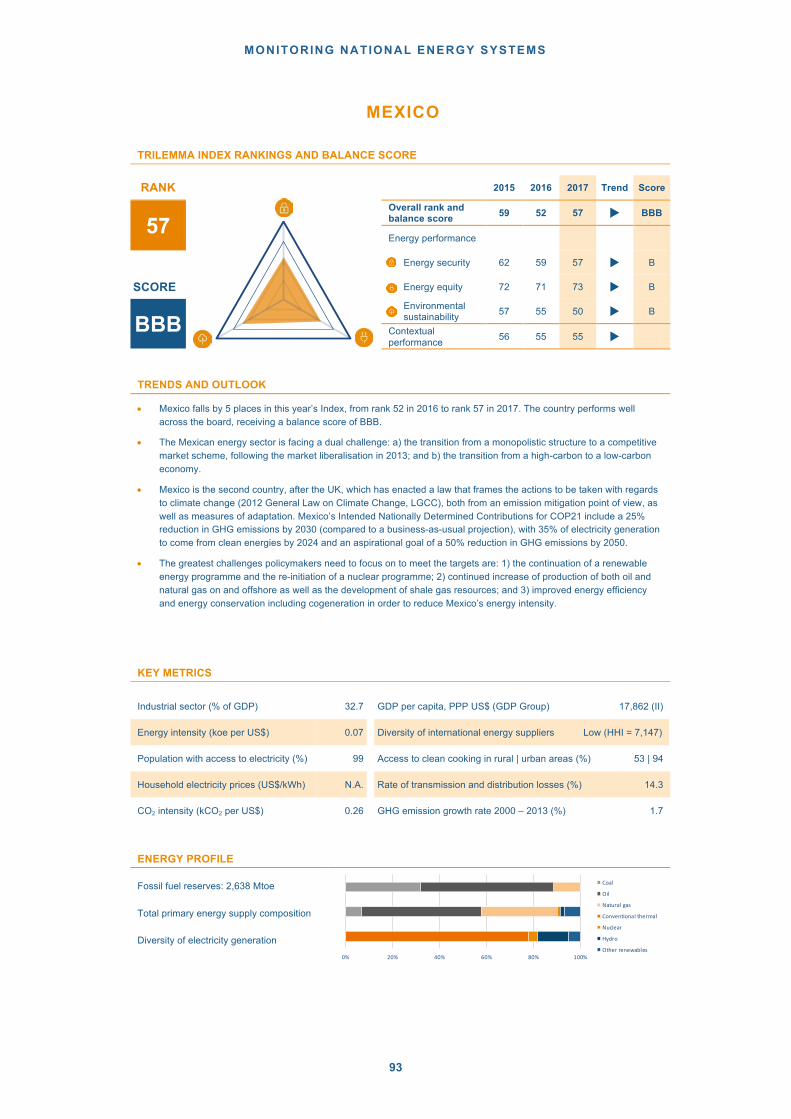
MONITORING NATIONAL ENERGY SYSTEMS
93
MEXICO
TRILEMMA INDEX RANKINGS AND BALANCE SCORE
RANK 2015 2016 2017 Trend Score
57 Overall rank and
balance score 59 52 57 u BBB
Energy performance
Energy security 62 59 57 u B
SCORE Energy equity 72 71 73 u B
BBB
Environmental
sustainability 57 55 50 u B
Contextual
performance 56 55 55 u
TRENDS AND OUTLOOK
• Mexico falls by 5 places in this year’s Index, from rank 52 in 2016 to rank 57 in 2017. The country performs well
across the board, receiving a balance score of BBB.
• The Mexican energy sector is facing a dual challenge: a) the transition from a monopolistic structure to a competitive
market scheme, following the market liberalisation in 2013; and b) the transition from a high-carbon to a low-carbon
economy.
• Mexico is the second country, after the UK, which has enacted a law that frames the actions to be taken with regards
to climate change (2012 General Law on Climate Change, LGCC), both from an emission mitigation point of view, as
well as measures of adaptation. Mexico’s Intended Nationally Determined Contributions for COP21 include a 25%
reduction in GHG emissions by 2030 (compared to a business-as-usual projection), with 35% of electricity generation
to come from clean energies by 2024 and an aspirational goal of a 50% reduction in GHG emissions by 2050.
• The greatest challenges policymakers need to focus on to meet the targets are: 1) the continuation of a renewable
energy programme and the re-initiation of a nuclear programme; 2) continued increase of production of both oil and
natural gas on and offshore as well as the development of shale gas resources; and 3) improved energy efficiency
and energy conservation including cogeneration in order to reduce Mexico’s energy intensity.
KEY METRICS
Industrial sector (% of GDP) 32.7 GDP per capita, PPP US$ (GDP Group) 17,862 (II)
Energy intensity (koe per US$) 0.07 Diversity of international energy suppliers Low (HHI = 7,147)
Population with access to electricity (%) 99 Access to clean cooking in rural | urban areas (%) 53 | 94
Household electricity prices (US$/kWh) N.A. Rate of transmission and distribution losses (%) 14.3
CO2 intensity (kCO2 per US$) 0.26 GHG emission growth rate 2000 – 2013 (%) 1.7
ENERGY PROFILE
Fossil fuel reserves: 2,638 Mtoe
Total primary energy supply composition
Diversity of electricity generation
0% 20% 40% 60% 80% 100%
Coal
Oil
Naturalgas
Conventionalthermal
Nuclear
Hydro
Otherrenewables
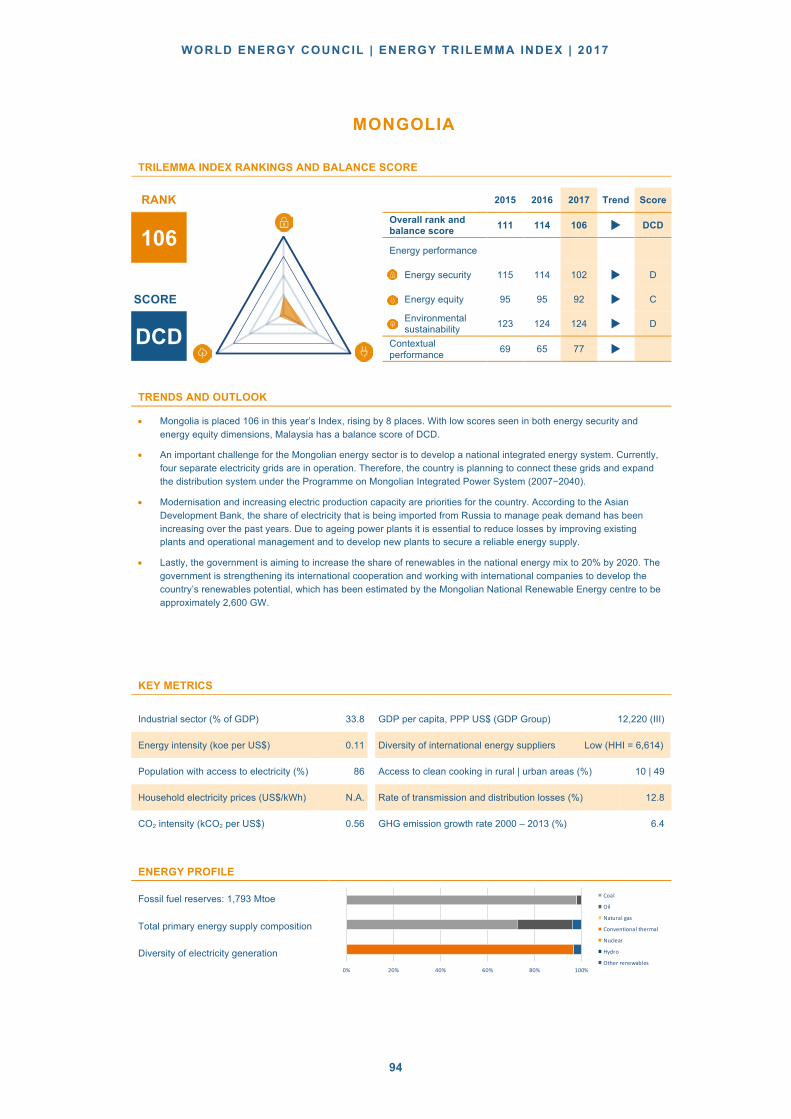
WORLD ENERGY COUNCIL | ENERGY TRILEMMA INDEX | 2017
94
MONGOLIA
TRILEMMA INDEX RANKINGS AND BALANCE SCORE
RANK 2015 2016 2017 Trend Score
106 Overall rank and
balance score 111 114 106 u DCD
Energy performance
Energy security 115 114 102 u D
SCORE Energy equity 95 95 92 u C
DCD Environmental
sustainability 123 124 124 u D
Contextual performance 69 65 77 u
TRENDS AND OUTLOOK
• Mongolia is placed 106 in this year’s Index, rising by 8 places. With low scores seen in both energy security and energy equity dimensions, Malaysia has a balance score of DCD.
• An important challenge for the Mongolian energy sector is to develop a national integrated energy system. Currently, four separate electricity grids are in operation. Therefore, the country is planning to connect these grids and expand the distribution system under the Programme on Mongolian Integrated Power System (2007−2040).
• Modernisation and increasing electric production capacity are priorities for the country. According to the Asian Development Bank, the share of electricity that is being imported from Russia to manage peak demand has been increasing over the past years. Due to ageing power plants it is essential to reduce losses by improving existing plants and operational management and to develop new plants to secure a reliable energy supply.
• Lastly, the government is aiming to increase the share of renewables in the national energy mix to 20% by 2020. The government is strengthening its international cooperation and working with international companies to develop the country’s renewables potential, which has been estimated by the Mongolian National Renewable Energy centre to be approximately 2,600 GW.
KEY METRICS
Industrial sector (% of GDP) 33.8 GDP per capita, PPP US$ (GDP Group) 12,220 (III)
Energy intensity (koe per US$) 0.11 Diversity of international energy suppliers Low (HHI = 6,614)
Population with access to electricity (%) 86 Access to clean cooking in rural | urban areas (%) 10 | 49
Household electricity prices (US$/kWh) N.A. Rate of transmission and distribution losses (%) 12.8
CO2 intensity (kCO2 per US$) 0.56 GHG emission growth rate 2000 – 2013 (%) 6.4
ENERGY PROFILE
Fossil fuel reserves: 1,793 Mtoe
Total primary energy supply composition
Diversity of electricity generation 0% 20% 40% 60% 80% 100%
Coal
Oil
Naturalgas
Conventionalthermal
Nuclear
Hydro
Otherrenewables
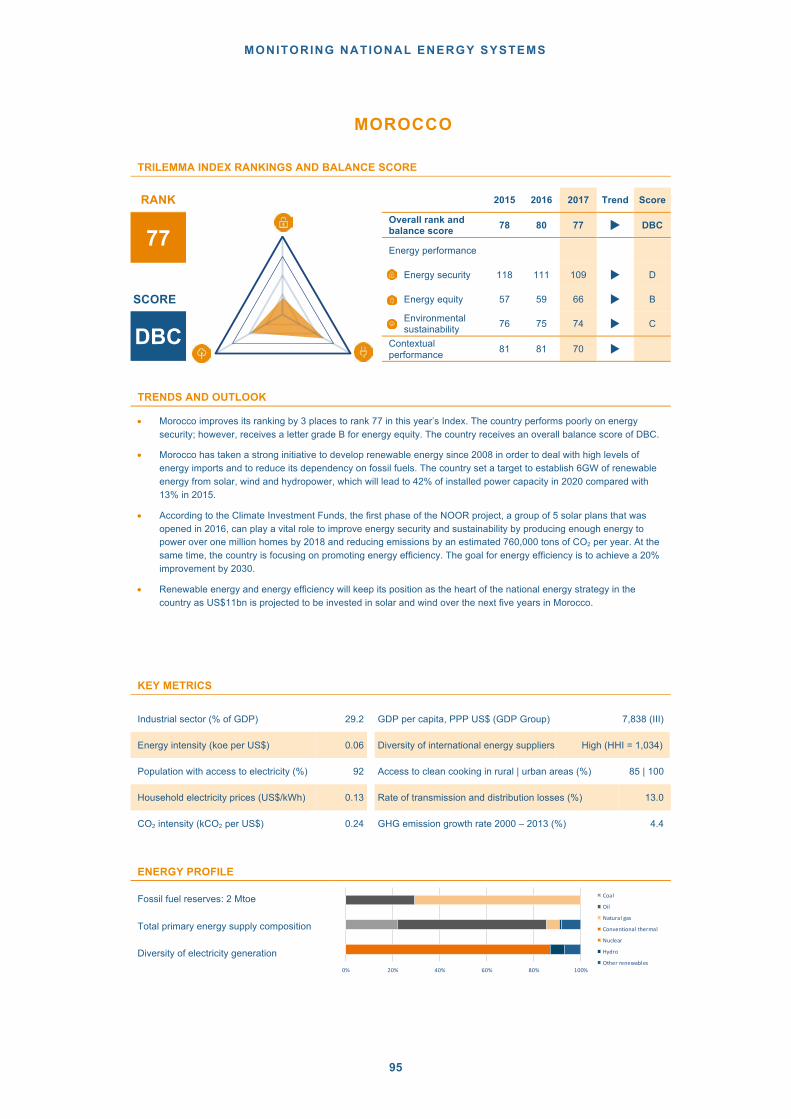
MONITORING NATIONAL ENERGY SYSTEMS
95
MOROCCO
TRILEMMA INDEX RANKINGS AND BALANCE SCORE
RANK 2015 2016 2017 Trend Score
77 Overall rank and
balance score 78 80 77 u DBC
Energy performance
Energy security 118 111 109 u D
SCORE Energy equity 57 59 66 u B
DBC Environmental
sustainability 76 75 74 u C
Contextual performance 81 81 70 u
TRENDS AND OUTLOOK
• Morocco improves its ranking by 3 places to rank 77 in this year’s Index. The country performs poorly on energy security; however, receives a letter grade B for energy equity. The country receives an overall balance score of DBC.
• Morocco has taken a strong initiative to develop renewable energy since 2008 in order to deal with high levels of energy imports and to reduce its dependency on fossil fuels. The country set a target to establish 6GW of renewable energy from solar, wind and hydropower, which will lead to 42% of installed power capacity in 2020 compared with 13% in 2015.
• According to the Climate Investment Funds, the first phase of the NOOR project, a group of 5 solar plans that was opened in 2016, can play a vital role to improve energy security and sustainability by producing enough energy to power over one million homes by 2018 and reducing emissions by an estimated 760,000 tons of CO2 per year. At the same time, the country is focusing on promoting energy efficiency. The goal for energy efficiency is to achieve a 20% improvement by 2030.
• Renewable energy and energy efficiency will keep its position as the heart of the national energy strategy in the country as US$11bn is projected to be invested in solar and wind over the next five years in Morocco.
KEY METRICS
Industrial sector (% of GDP) 29.2 GDP per capita, PPP US$ (GDP Group) 7,838 (III)
Energy intensity (koe per US$) 0.06 Diversity of international energy suppliers High (HHI = 1,034)
Population with access to electricity (%) 92 Access to clean cooking in rural | urban areas (%) 85 | 100
Household electricity prices (US$/kWh) 0.13 Rate of transmission and distribution losses (%) 13.0
CO2 intensity (kCO2 per US$) 0.24 GHG emission growth rate 2000 – 2013 (%) 4.4
ENERGY PROFILE
Fossil fuel reserves: 2 Mtoe
Total primary energy supply composition
Diversity of electricity generation 0% 20% 40% 60% 80% 100%
Coal
Oil
Naturalgas
Conventionalthermal
Nuclear
Hydro
Otherrenewables
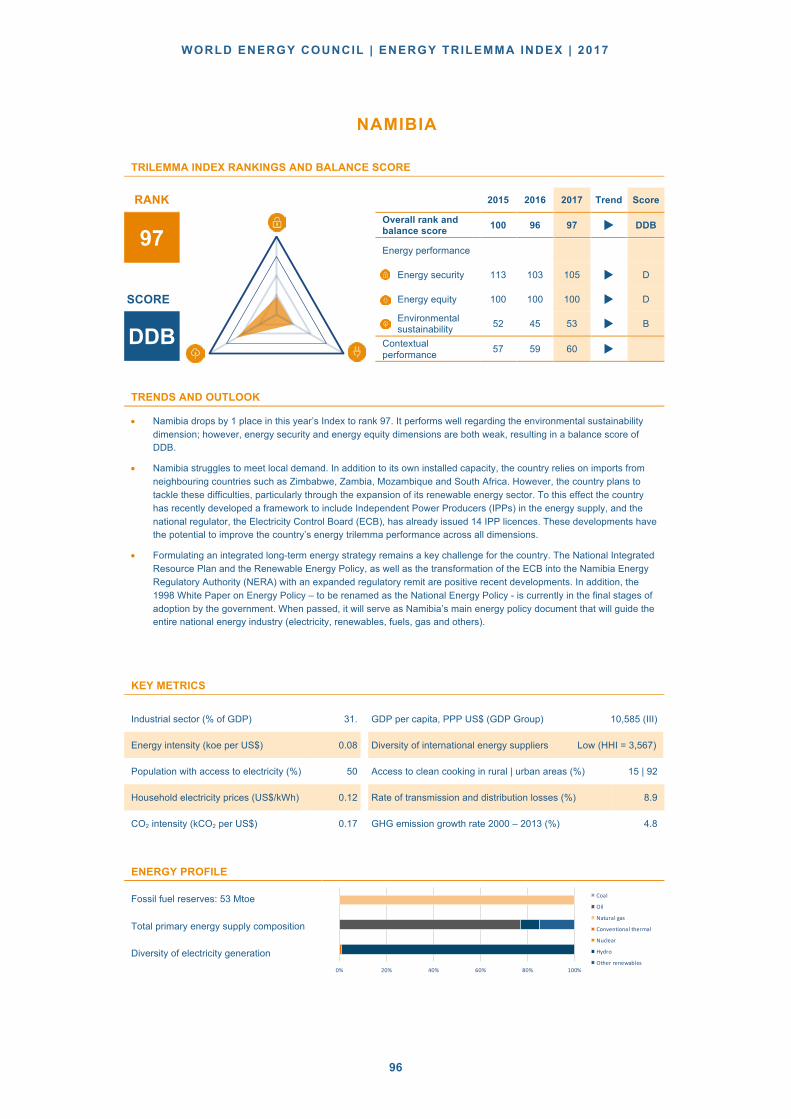
WORLD ENERGY COUNCIL | ENERGY TRILEMMA INDEX | 2017
96
NAMIBIA
TRILEMMA INDEX RANKINGS AND BALANCE SCORE
RANK 2015 2016 2017 Trend Score
97 Overall rank and
balance score 100 96 97 u DDB
Energy performance
Energy security 113 103 105 u D
SCORE Energy equity 100 100 100 u D
DDB Environmental
sustainability 52 45 53 u B
Contextual performance 57 59 60 u
TRENDS AND OUTLOOK
• Namibia drops by 1 place in this year’s Index to rank 97. It performs well regarding the environmental sustainability dimension; however, energy security and energy equity dimensions are both weak, resulting in a balance score of DDB.
• Namibia struggles to meet local demand. In addition to its own installed capacity, the country relies on imports from neighbouring countries such as Zimbabwe, Zambia, Mozambique and South Africa. However, the country plans to tackle these difficulties, particularly through the expansion of its renewable energy sector. To this effect the country has recently developed a framework to include Independent Power Producers (IPPs) in the energy supply, and the national regulator, the Electricity Control Board (ECB), has already issued 14 IPP licences. These developments have the potential to improve the country’s energy trilemma performance across all dimensions.
• Formulating an integrated long-term energy strategy remains a key challenge for the country. The National Integrated Resource Plan and the Renewable Energy Policy, as well as the transformation of the ECB into the Namibia Energy Regulatory Authority (NERA) with an expanded regulatory remit are positive recent developments. In addition, the 1998 White Paper on Energy Policy – to be renamed as the National Energy Policy - is currently in the final stages of adoption by the government. When passed, it will serve as Namibia’s main energy policy document that will guide the entire national energy industry (electricity, renewables, fuels, gas and others).
KEY METRICS
Industrial sector (% of GDP) 31. GDP per capita, PPP US$ (GDP Group) 10,585 (III)
Energy intensity (koe per US$) 0.08 Diversity of international energy suppliers Low (HHI = 3,567)
Population with access to electricity (%) 50 Access to clean cooking in rural | urban areas (%) 15 | 92
Household electricity prices (US$/kWh) 0.12 Rate of transmission and distribution losses (%) 8.9
CO2 intensity (kCO2 per US$) 0.17 GHG emission growth rate 2000 – 2013 (%) 4.8
ENERGY PROFILE
Fossil fuel reserves: 53 Mtoe
Total primary energy supply composition
Diversity of electricity generation
0% 20% 40% 60% 80% 100%
Coal
Oil
Naturalgas
Conventionalthermal
Nuclear
Hydro
Otherrenewables

MONITORING NATIONAL ENERGY SYSTEMS
97
NEPAL
TRILEMMA INDEX RANKINGS AND BALANCE SCORE
RANK 2015 2016 2017 Trend Score
117 Overall rank and
balance score 123 123 117 u DDC
Energy performance
Energy security 125 125 125 u D
SCORE Energy equity 111 111 103 u D
DDC
Environmental sustainability
85 86 81 u C
Contextual performance
116 115 116 u
TRENDS AND OUTLOOK
• Nepal improves by 6 places in this year’s Index, ranking 117. Energy security and equity scores are particularly poor,
with environmental sustainability being the highest performing dimension, resulting in an overall score of DDC.
• The key energy challenges for Nepal are to improve access to modern energy in rural communities, and to increase
electricity supply to provide reliable energy services to the population.
• Nepal has one of the lowest levels of electrification among South Asian countries and the rural population is highly
dependent on traditional biofuel for heating and cooking. At the same time, energy demand is expected to increase at
over 8% per year until 2027, according to the Nepal Electricity Authority (NEA).
• To provide reliable and sustainable energy, a ‘Rural Energy Development Programme’ was launched in 1996,
supported by the United Nations Development Programme (UNDP). The National Rural and Renewable Energy
Programme (2012−2017) is building on the Rural Energy Development Programme by building small hydropower and
solar heating systems. The programme is expected to bring benefits of economic, environmental and social
development to the country.
KEY METRICS
Industrial sector (% of GDP) 15.4 GDP per capita, PPP US$ (GDP Group) 2,468 (IV)
Energy intensity (koe per US$) 0.20 Diversity of international energy suppliers Low (HHI = 8,407)
Population with access to electricity (%) 85 Access to clean cooking in rural | urban areas (%) 14 | 49
Household electricity prices (US$/kWh) N.A. Rate of transmission and distribution losses (%) 22.8
CO2 intensity (kCO2 per US$) 0.09 GHG emission growth rate 2000 – 2013 (%) 2.6
ENERGY PROFILE
Fossil fuel reserves: 0 Mtoe
Total primary energy supply composition
Diversity of electricity generation
0% 20% 40% 60% 80% 100%
Coal
Oil
Naturalgas
Conventionalthermal
Nuclear
Hydro
Otherrenewables

WORLD ENERGY COUNCIL | ENERGY TRILEMMA INDEX | 2017
98
NETHERLANDS
TRILEMMA INDEX RANKINGS AND BALANCE SCORE
RANK 2015 2016 2017 Trend Score
4 Overall rank and balance score 8 4 4 u AAB
Energy performance
Energy security 20 9 10 u A
SCORE Energy equity 4 3 3 u A
AAB Environmental
sustainability 42 42 38 u B
Contextual performance 5 6 5 u
TRENDS AND OUTLOOK
• Netherlands maintains its rank at number 4 in this year’s Index, performing strongly across the board with a balance score of AAB. Its energy equity score is particularly good, achieving 3rd place globally.
• The Netherlands is well-positioned in the Index, but still faces a number of challenges. These include: the public debate around installation of additional onshore wind capacity; high expectations of biomass and green gas in the face of challenging markets; ensuring solar surges and geothermal meet expectations given the low starting base; and a feed-in tariff scheme that is not sufficient to reach targets. Furthermore, energy efficiency progress is fairly slow.
• Key energy policy developments are: the green deals; energy innovation top sector approach designed to strengthen market steering, market involvement and market resources for energy; and the SDE+ (stimulation of sustainable/renewable energy) feed-in scheme that is fully operational and funded (over €1.5bn per annum).
• A key trend is the strong decentralisation of power generation. Policymakers have to create the framework to stimulate or facilitate this development, including the upgrade of the existing network such as smart grids. Finally, the Netherlands is expected to strengthen its position as a gas country, with an increased focus on the role of gas as a balancing fuel in a system that is moving towards sustainability.
KEY METRICS
Industrial sector (% of GDP) 20. GDP per capita, PPP US$ (GDP Group) 50,898 (I)
Energy intensity (koe per US$) 0.07 Diversity of international energy suppliers High (HHI = 1,107)
Population with access to electricity (%) 100 Access to clean cooking in rural | urban areas (%) 100 | 100
Household electricity prices (US$/kWh) 0.20 Rate of transmission and distribution losses (%) 4.3
CO2 intensity (kCO2 per US$) 0.26 GHG emission growth rate 2000 – 2013 (%) -0.8
ENERGY PROFILE
Fossil fuel reserves: 715 Mtoe
Total primary energy supply composition
Diversity of electricity generation 0% 20% 40% 60% 80% 100%
Coal
Oil
Naturalgas
Conventionalthermal
Nuclear
Hydro
Otherrenewables

MONITORING NATIONAL ENERGY SYSTEMS
99
NEW ZEALAND
TRILEMMA INDEX RANKINGS AND BALANCE SCORE
RANK 2015 2016 2017 Trend Score
9 Overall rank and
balance score 7 9 9 u AAB
Energy performance
Energy security 16 13 15 u A
SCORE Energy equity 18 20 19 u A
AAB Environmental
sustainability 36 36 42 u B
Contextual performance 4 8 3 u
TRENDS AND OUTLOOK
• New Zealand maintains its rank at 9 in this year’s Index, being the only representative from Asia, as well as the only non-European country to be placed in the global top ten. It continues to manage the energy trilemma well across all dimensions, resulting in a balance score of AAB.
• The New Zealand Energy Strategy (NZES) and the New Zealand Energy Efficiency and Conservation Strategy (NZEECS) set out the government’s energy policy framework. The NZEECS’s priority areas of renewable and efficient use of process heat, efficient and low-emissions transport, and innovative and efficient use of electricity nest within the broader NZES’s four priorities (diverse resource development, environmental responsibility, efficient use of energy, and secure and affordable energy), and together shape New Zealand’s trilemma performance.
• Discussions in the energy sector are currently focused around how to successfully leverage off New Zealand’s already high proportion of renewable electricity (81% in 2015), and how to respond to the Paris Agreement imperative, all whilst ensuring a long-term economic transition to a low emissions economy.
• Trends to watch are: 1) the possible effects that a new government election in September may have on energy developments with a potential stronger focus on climate change targets and policies; 2) the implications of growing natural resource constraints, especially regarding water and its effects on electricity generation and agriculture and; 3) the shift of investment from hardware (e.g. pipes and wires) to software (e.g. blockchain and peer-to-peer trading) and its implications on energy demand, future competition, network regulation and prices.
KEY METRICS
Industrial sector (% of GDP) 21.8 GDP per capita, PPP US$ (GDP Group) 39,059 (I)
Energy intensity (koe per US$) 0.10 Diversity of international energy suppliers High (HHI = 1,073)
Population with access to electricity (%) 100 Access to clean cooking in rural | urban areas (%) 100 | 100
Household electricity prices (US$/kWh) 0.09 Rate of transmission and distribution losses (%) 6.6
CO2 intensity (kCO2 per US$) 0.26 GHG emission growth rate 2000 – 2013 (%) 0.1
ENERGY PROFILE
Fossil fuel reserves: 440 Mtoe
Total primary energy supply composition
Diversity of electricity generation 0% 20% 40% 60% 80% 100%
Coal
Oil
Naturalgas
Conventionalthermal
Nuclear
Hydro
Otherrenewables

WORLD ENERGY COUNCIL | ENERGY TRILEMMA INDEX | 2017
100
NIGER
TRILEMMA INDEX RANKINGS AND BALANCE SCORE
RANK 2015 2016 2017 Trend Score
125 Overall rank and
balance score 124 124 125 u DDD
Energy performance
Energy security 117 119 124 u D
SCORE Energy equity 125 125 125 u D
DDD Environmental
sustainability 120 120 121 u D
Contextual performance 112 114 112 u
TRENDS AND OUTLOOK
• Niger drops a place in this year’s Index, ranking last at 125. It performs poorly across all trilemma dimensions, resulting in an overall balance score of DDD.
• Despite the richness of Niger’s resources, energy is still a challenge for the authorities. This is mainly a result of low economic productivity and investment, and also the limited access that the majority of the country has to energy.
• Niger has significant natural energy resources such as biomass, uranium, mineral coal, natural gas, hydro and solar. It is estimated that 90% of Niger’s population accesses energy through the use of biomass, and 70% of energy supply comes from biomass. The second largest contributor is oil at 17%.
• National law and the liberalisation of the energy market result in Niger being an attractive investment opportunity, but infrastructure for delivering energy remains a key barrier.
• With regards to the renewable energy sector, there is still lack of sufficient legislation to attract incoming investment, specifically competitiveness, transparency and security of the market.
KEY METRICS
Industrial sector (% of GDP) 21.9 GDP per capita, PPP US$ (GDP Group) 978 (IV)
Energy intensity (koe per US$) 0.17 Diversity of international energy suppliers Low (HHI = 3,449)
Population with access to electricity (%) 14 Access to clean cooking in rural | urban areas (%) 2 | 9
Household electricity prices (US$/kWh) N.A. Rate of transmission and distribution losses (%) 16.5
CO2 intensity (kCO2 per US$) 0.13 GHG emission growth rate 2000 – 2013 (%) N.A.
ENERGY PROFILE
Fossil fuel reserves: 20 Mtoe
Total primary energy supply composition
Diversity of electricity generation 0% 20% 40% 60% 80% 100%
Coal
Oil
Naturalgas
Conventionalthermal
Nuclear
Hydro
Otherrenewables

MONITORING NATIONAL ENERGY SYSTEMS
101
NIGERIA
TRILEMMA INDEX RANKINGS AND BALANCE SCORE
RANK 2015 2016 2017 Trend Score
110 Overall rank and
balance score 101 104 110 u CDC
Energy performance
Energy security 5 8 67 u C
SCORE Energy equity 107 108 113 u D
CDC Environmental
sustainability 102 101 98 u C
Contextual performance 117 117 114 u
TRENDS AND OUTLOOK
• Nigeria drops 6 places in this year’s Index to rank 110. Energy equity remains its weakest dimension, whilst energy security sees a noticeable drop, resulting in an overall balance score of CDC.
• The key priority challenge for Nigeria is to diversify energy sources. According to the Ministry of Power, Works and Housing of Nigeria, the country depends on gas-fired power plants for over 80% of its electricity while hydropower generates about 14%.
• However, the gas supply is frequently disrupted by militants. This situation drives the country to find other energy sources, i.e. renewable energy. In July 2016, the federal government signed the power purchase agreement with 12 firms for the construction of solar power plants. These are expected to give the country 975 MW of electricity capacity and bring the benefits of enhancement of energy security.
• The second challenge refers to the energy equity aspect of the Trilemma. Nigeria has one of the lowest shares of electrification, however is showing signs of progress, climbing from 48% of people having access in 2010 to 58% in 2014. Therefore, developing a new transmission and distribution network and improving existing lines will continue to feature as priorities for the country’s energy agenda.
KEY METRICS
Industrial sector (% of GDP) 20.4 GDP per capita, PPP US$ (GDP Group) 5,867 (IV)
Energy intensity (koe per US$) 0.08 Diversity of international energy suppliers Medium (HHI = 1,885)
Population with access to electricity (%) 58 Access to clean cooking in rural | urban areas (%) 11 | 39
Household electricity prices (US$/kWh) N.A. Rate of transmission and distribution losses (%) 16.6
CO2 intensity (kCO2 per US$) 0.04 GHG emission growth rate 2000 – 2013 (%) 1.4
ENERGY PROFILE
Fossil fuel reserves: 9,384 Mtoe
Total primary energy supply composition
Diversity of electricity generation 0% 20% 40% 60% 80% 100%
Coal
Oil
Naturalgas
Conventionalthermal
Nuclear
Hydro
Otherrenewables
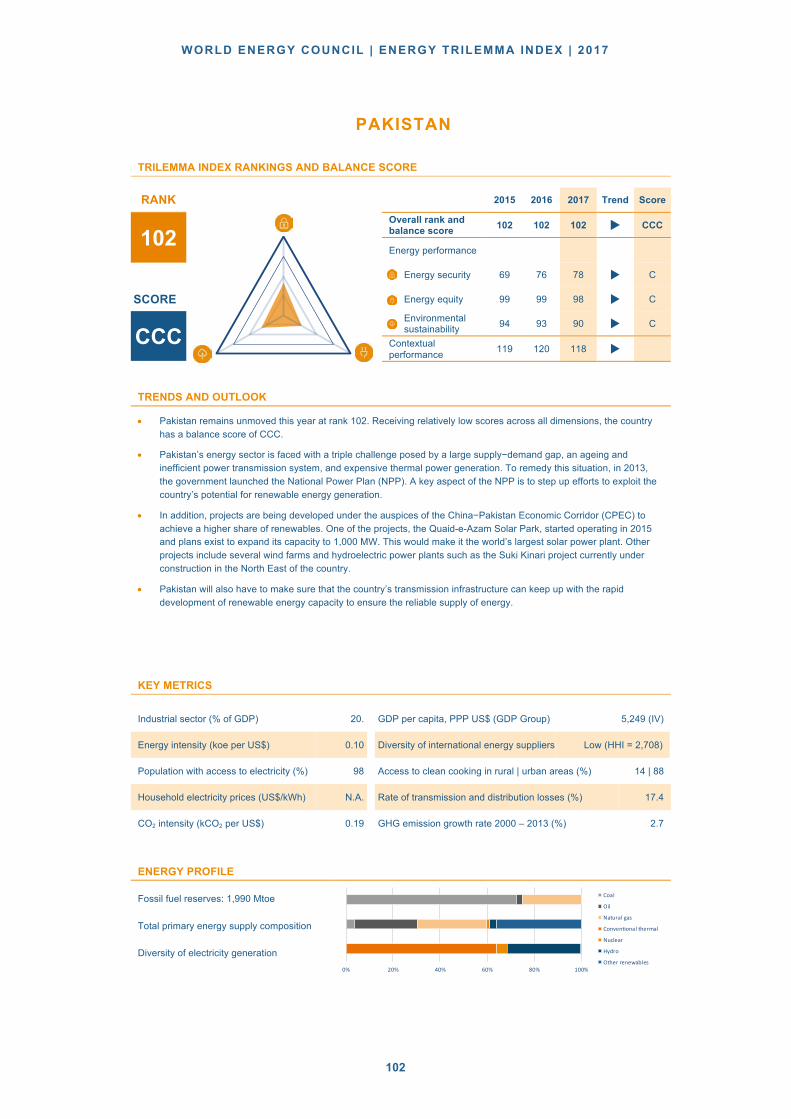
WORLD ENERGY COUNCIL | ENERGY TRILEMMA INDEX | 2017
102
PAKISTAN
TRILEMMA INDEX RANKINGS AND BALANCE SCORE
RANK 2015 2016 2017 Trend Score
102 Overall rank and
balance score 102 102 102 u CCC
Energy performance
Energy security 69 76 78 u C
SCORE Energy equity 99 99 98 u C
CCC
Environmental sustainability
94 93 90 u C
Contextual performance
119 120 118 u
TRENDS AND OUTLOOK
• Pakistan remains unmoved this year at rank 102. Receiving relatively low scores across all dimensions, the country
has a balance score of CCC.
• Pakistan’s energy sector is faced with a triple challenge posed by a large supply−demand gap, an ageing and
inefficient power transmission system, and expensive thermal power generation. To remedy this situation, in 2013,
the government launched the National Power Plan (NPP). A key aspect of the NPP is to step up efforts to exploit the
country’s potential for renewable energy generation.
• In addition, projects are being developed under the auspices of the China−Pakistan Economic Corridor (CPEC) to
achieve a higher share of renewables. One of the projects, the Quaid-e-Azam Solar Park, started operating in 2015
and plans exist to expand its capacity to 1,000 MW. This would make it the world’s largest solar power plant. Other
projects include several wind farms and hydroelectric power plants such as the Suki Kinari project currently under
construction in the North East of the country.
• Pakistan will also have to make sure that the country’s transmission infrastructure can keep up with the rapid
development of renewable energy capacity to ensure the reliable supply of energy.
KEY METRICS
Industrial sector (% of GDP) 20. GDP per capita, PPP US$ (GDP Group) 5,249 (IV)
Energy intensity (koe per US$) 0.10 Diversity of international energy suppliers Low (HHI = 2,708)
Population with access to electricity (%) 98 Access to clean cooking in rural | urban areas (%) 14 | 88
Household electricity prices (US$/kWh) N.A. Rate of transmission and distribution losses (%) 17.4
CO2 intensity (kCO2 per US$) 0.19 GHG emission growth rate 2000 – 2013 (%) 2.7
ENERGY PROFILE
Fossil fuel reserves: 1,990 Mtoe
Total primary energy supply composition
Diversity of electricity generation
0% 20% 40% 60% 80% 100%
Coal
Oil
Naturalgas
Conventionalthermal
Nuclear
Hydro
Otherrenewables
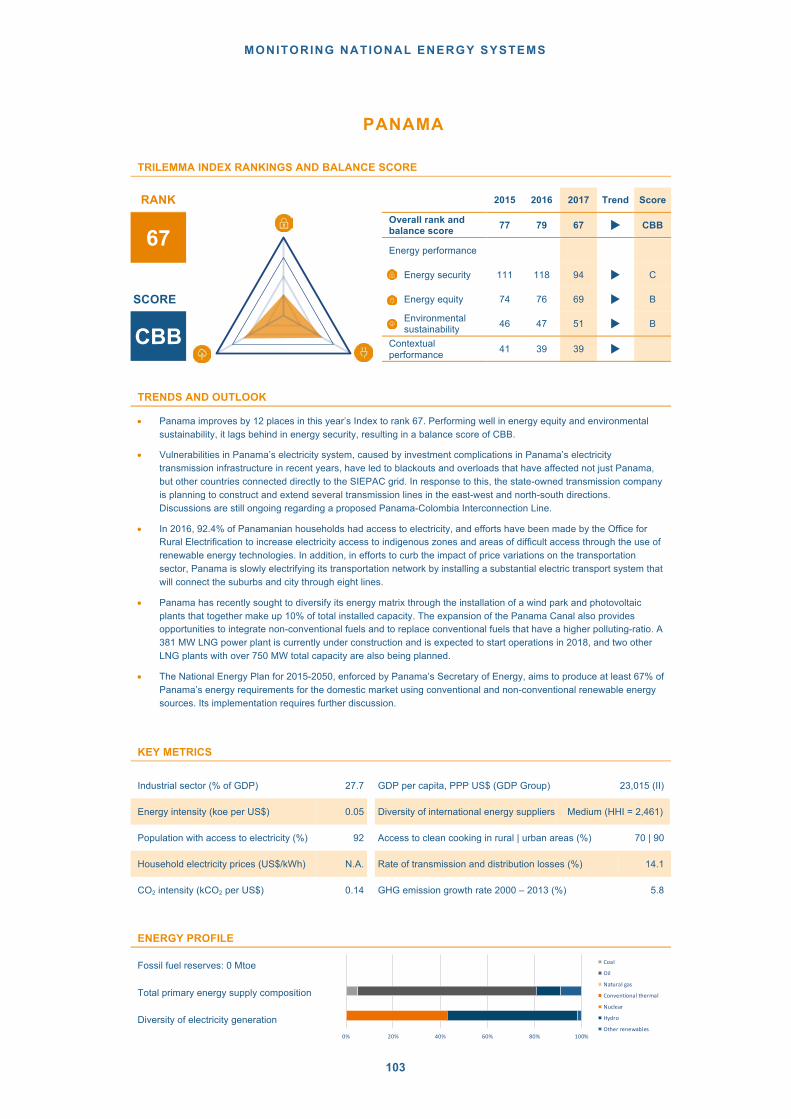
MONITORING NATIONAL ENERGY SYSTEMS
103
PANAMA
TRILEMMA INDEX RANKINGS AND BALANCE SCORE
RANK 2015 2016 2017 Trend Score
67
Overall rank and balance score 77 79 67 u CBB
Energy performance
Energy security 111 118 94 u C
SCORE Energy equity 74 76 69 u B
CBB
Environmental
sustainability
46 47 51 u B
Contextual
performance
41 39 39 u
TRENDS AND OUTLOOK
• Panama improves by 12 places in this year’s Index to rank 67. Performing well in energy equity and environmental
sustainability, it lags behind in energy security, resulting in a balance score of CBB.
• Vulnerabilities in Panama’s electricity system, caused by investment complications in Panama’s electricity
transmission infrastructure in recent years, have led to blackouts and overloads that have affected not just Panama,
but other countries connected directly to the SIEPAC grid. In response to this, the state-owned transmission company
is planning to construct and extend several transmission lines in the east-west and north-south directions.
Discussions are still ongoing regarding a proposed Panama-Colombia Interconnection Line.
• In 2016, 92.4% of Panamanian households had access to electricity, and efforts have been made by the Office for
Rural Electrification to increase electricity access to indigenous zones and areas of difficult access through the use of
renewable energy technologies. In addition, in efforts to curb the impact of price variations on the transportation
sector, Panama is slowly electrifying its transportation network by installing a substantial electric transport system that
will connect the suburbs and city through eight lines.
• Panama has recently sought to diversify its energy matrix through the installation of a wind park and photovoltaic
plants that together make up 10% of total installed capacity. The expansion of the Panama Canal also provides
opportunities to integrate non-conventional fuels and to replace conventional fuels that have a higher polluting-ratio. A
381 MW LNG power plant is currently under construction and is expected to start operations in 2018, and two other
LNG plants with over 750 MW total capacity are also being planned.
• The National Energy Plan for 2015-2050, enforced by Panama’s Secretary of Energy, aims to produce at least 67% of
Panama’s energy requirements for the domestic market using conventional and non-conventional renewable energy
sources. Its implementation requires further discussion.
KEY METRICS
Industrial sector (% of GDP) 27.7 GDP per capita, PPP US$ (GDP Group) 23,015 (II)
Energy intensity (koe per US$) 0.05 Diversity of international energy suppliers Medium (HHI = 2,461)
Population with access to electricity (%) 92 Access to clean cooking in rural | urban areas (%) 70 | 90
Household electricity prices (US$/kWh) N.A. Rate of transmission and distribution losses (%) 14.1
CO2 intensity (kCO
2 per US$) 0.14 GHG emission growth rate 2000 – 2013 (%) 5.8
ENERGY PROFILE
Fossil fuel reserves: 0 Mtoe
Total primary energy supply composition
Diversity of electricity generation
0% 20% 40% 60% 80% 100%
Coal
Oil
Naturalgas
Conventionalthermal
Nuclear
Hydro
Otherrenewables
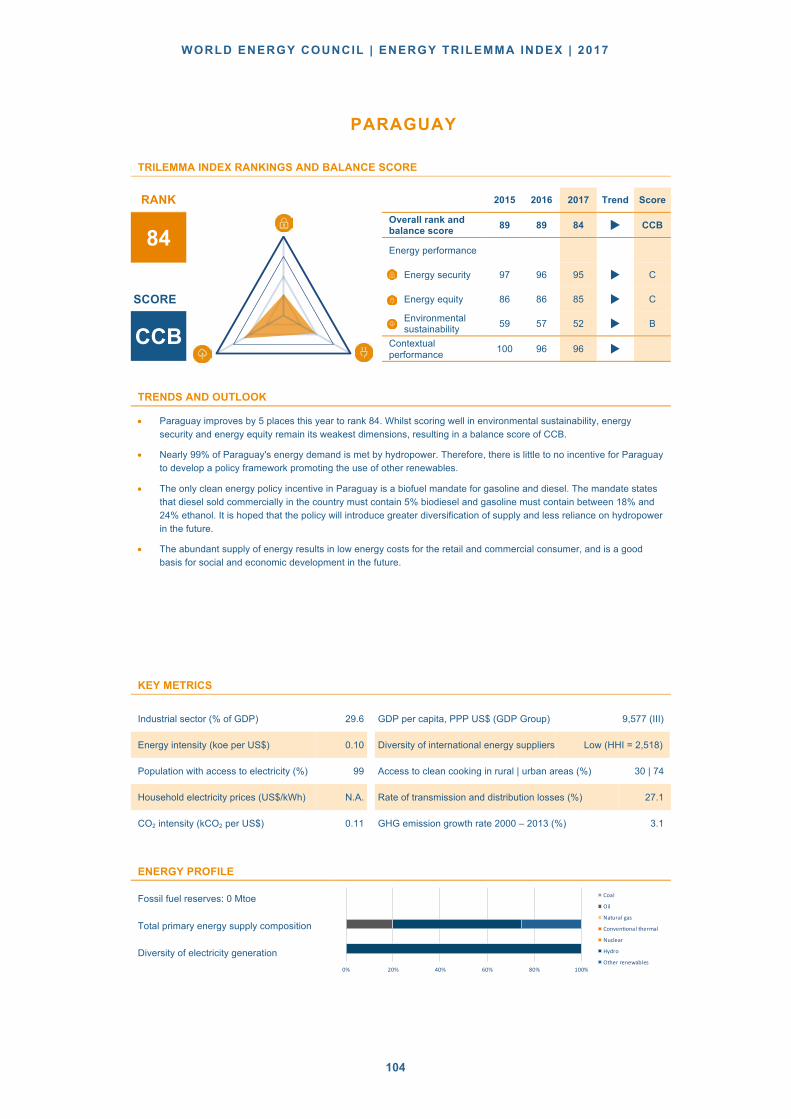
WORLD ENERGY COUNCIL | ENERGY TRILEMMA INDEX | 2017
104
PARAGUAY
TRILEMMA INDEX RANKINGS AND BALANCE SCORE
RANK 2015 2016 2017 Trend Score
84 Overall rank and
balance score 89 89 84 u CCB
Energy performance
Energy security 97 96 95 u C
SCORE Energy equity 86 86 85 u C
CCB Environmental
sustainability 59 57 52 u B
Contextual performance
100 96 96 u
TRENDS AND OUTLOOK
• Paraguay improves by 5 places this year to rank 84. Whilst scoring well in environmental sustainability, energy security and energy equity remain its weakest dimensions, resulting in a balance score of CCB.
• Nearly 99% of Paraguay's energy demand is met by hydropower. Therefore, there is little to no incentive for Paraguay to develop a policy framework promoting the use of other renewables.
• The only clean energy policy incentive in Paraguay is a biofuel mandate for gasoline and diesel. The mandate states that diesel sold commercially in the country must contain 5% biodiesel and gasoline must contain between 18% and 24% ethanol. It is hoped that the policy will introduce greater diversification of supply and less reliance on hydropower in the future.
• The abundant supply of energy results in low energy costs for the retail and commercial consumer, and is a good basis for social and economic development in the future.
KEY METRICS
Industrial sector (% of GDP) 29.6 GDP per capita, PPP US$ (GDP Group) 9,577 (III)
Energy intensity (koe per US$) 0.10 Diversity of international energy suppliers Low (HHI = 2,518)
Population with access to electricity (%) 99 Access to clean cooking in rural | urban areas (%) 30 | 74
Household electricity prices (US$/kWh) N.A. Rate of transmission and distribution losses (%) 27.1
CO2 intensity (kCO2 per US$) 0.11 GHG emission growth rate 2000 – 2013 (%) 3.1
ENERGY PROFILE
Fossil fuel reserves: 0 Mtoe
Total primary energy supply composition
Diversity of electricity generation
0% 20% 40% 60% 80% 100%
Coal
Oil
Naturalgas
Conventionalthermal
Nuclear
Hydro
Otherrenewables

MONITORING NATIONAL ENERGY SYSTEMS
105
PERU
TRILEMMA INDEX RANKINGS AND BALANCE SCORE
RANK 2015 2016 2017 Trend Score
55 Overall rank and
balance score 63 64 55 u BCB
Energy performance
Energy security 61 54 38 p B
SCORE Energy equity 85 84 80 u C
BCB Environmental
sustainability 32 38 39 u B
Contextual performance 62 60 67 u
TRENDS AND OUTLOOK
• Peru improves by 9 places this year to rank 55. Achieving good results in energy security and environmental sustainability dimensions, energy equity remains relatively low, resulting in a balance score of BCB.
• Peru’s National Energy Policy 2010−2040 was approved at the end of 2010, with the goal to encourage and protect private investment in the sector; and to minimise the social and environmental impacts by promoting the development of energy markets, encouraging efficiency and the development of renewable energies at the local, regional, and national level.
• Schemes to support these goals are already in place and include: a law, passed in April 2012, to promote energy security in hydrocarbons; a scheme to promote the modernisation of oil refineries; a universal energy access plan for the 2013−2022 period, implemented in May 2013, with clearly defined targets for different sub-components; and auctions and calls for tenders to secure the implementation of hydro projects. Additional fiscal incentives are in place for small-scale hydro, solar, wind, biomass, and geothermal.
KEY METRICS
Industrial sector (% of GDP) 32.8 GDP per capita, PPP US$ (GDP Group) 13,022 (III)
Energy intensity (koe per US$) 0.05 Diversity of international energy suppliers Low (HHI = 3,317)
Population with access to electricity (%) 93 Access to clean cooking in rural | urban areas (%) 14 | 80
Household electricity prices (US$/kWh) 0.17 Rate of transmission and distribution losses (%) 11.2
CO2 intensity (kCO2 per US$) 0.15 GHG emission growth rate 2000 – 2013 (%) 4.3
ENERGY PROFILE
Fossil fuel reserves: 536 Mtoe
Total primary energy supply composition
Diversity of electricity generation 0% 20% 40% 60% 80% 100%
Coal
Oil
Naturalgas
Conventionalthermal
Nuclear
Hydro
Otherrenewables

WORLD ENERGY COUNCIL | ENERGY TRILEMMA INDEX | 2017
106
POLAND
TRILEMMA INDEX RANKINGS AND BALANCE SCORE
RANK 2015 2016 2017 Trend Score
37
Overall rank and balance score 32 36 37 u CAB
Energy performance
Energy security 47 60 73 u C
SCORE Energy equity 30 28 30 u A
CAB
Environmental
sustainability
68 64 60 p B
Contextual
performance
34 36 35 u
TRENDS AND OUTLOOK
• Poland drops 1 place this year, to rank 37. Performing very well in energy equity, a drop in energy security results in a
balance score of CAB.
• Recent energy policy developments include the diversification of the energy mix through additional nuclear plants;
incentives to diversify gas supply and development of renewables; reducing energy intensity and increasing energy
efficiency; increasing the competitiveness of fuels and energy by liberalisation of the markets; improving the legal
framework for exploration works for domestic primary energy fuels; and limiting the energy sector impact on the
environment by the development of clean coal technologies.
• Expected future trends affecting Poland’s energy sustainability and issues for policymakers to focus on are:
1) development of the country’s energy network infrastructure; 2) further diversification of energy sources; 3)
modernisation of the electricity generation sector; 4) increase security of primary fuel supply through investments in
more efficient coal mining exploitation and exploration for conventional and unconventional gas; 5) increase transport
biofuels production and use; 6) continued efforts to improve energy efficiency and energy savings; 7) transition to a
low-carbon economy, while enabling an improvement of lifestyles over the next 20 years, by deploying low-emission
technologies to achieve lower emissions growth.
KEY METRICS
Industrial sector (% of GDP) 34.1 GDP per capita, PPP US$ (GDP Group) 27,811 (II)
Energy intensity (koe per US$) 0.08 Diversity of international energy suppliers Low (HHI = 4,365)
Population with access to electricity (%) 100 Access to clean cooking in rural | urban areas (%) 100 | 100
Household electricity prices (US$/kWh) 0.17 Rate of transmission and distribution losses (%) 7.1
CO2 intensity (kCO
2 per US$) 0.37 GHG emission growth rate 2000 – 2013 (%) 0.0
ENERGY PROFILE
Fossil fuel reserves: 3,912 Mtoe
Total primary energy supply composition
Diversity of electricity generation
0% 20% 40% 60% 80% 100%
Coal
Oil
Naturalgas
Conventionalthermal
Nuclear
Hydro
Otherrenewables

MONITORING NATIONAL ENERGY SYSTEMS
107
PORTUGAL
TRILEMMA INDEX RANKINGS AND BALANCE SCORE
RANK 2015 2016 2017 Trend Score
18 Overall rank and
balance score 17 18 18 u BAA
Energy performance
Energy security 39 31 30 u B
SCORE Energy equity 31 33 34 u A
BAA
Environmental
sustainability 11 12 17 u A
Contextual
performance 27 32 24 u
TRENDS AND OUTLOOK
• Portugal maintains its position at rank 18 in this year’s Index. A well-balanced energy trilemma profile results in a
score of BAA, with environmental sustainability being a particular strength.
• The implementation of the reinforcement of the electricity and gas interconnections between the Iberian Peninsula
and central Europe, a product of the Madrid Declaration held in 2015, continues to be a central policy aim for
Portugal. The initiative seeks to promote market integration, and increase the energy security of Europe, by taking
advantage of the high capacity of LNG terminals and excess renewable electricity capacity in the Iberian Peninsula In
efforts to diversify electricity import and exports, a viability study for a cable interconnection between Portugal and
Morocco was commissioned in January 2017, with a decision expected by the end of 2017..
• Due to the increasing cost competitiveness of renewables compared to fossil fuel sources, new renewable energy
projects no longer gain such a large benefit from the feed-in tariff regime, except from household and development
projects. Several licensing requests, amounting to 500 MW for PV projects under the new market regime, have been
submitted to the government administration responsible for renewable development projects, highlighting the
remarkable jump in competitiveness seen in renewables in recent years.
KEY METRICS
Industrial sector (% of GDP) 22.3 GDP per capita, PPP US$ (GDP Group) 30,624 (II)
Energy intensity (koe per US$) 0.07 Diversity of international energy suppliers High (HHI = 1,049)
Population with access to electricity (%) 100 Access to clean cooking in rural | urban areas (%) 100 | 100
Household electricity prices (US$/kWh) 0.25 Rate of transmission and distribution losses (%) 9.7
CO2 intensity (kCO2 per US$) 0.21 GHG emission growth rate 2000 – 2013 (%) -2.4
ENERGY PROFILE
Fossil fuel reserves: 0 Mtoe
Total primary energy supply composition
Diversity of electricity generation
0% 20% 40% 60% 80% 100%
Coal
Oil
Naturalgas
Conventionalthermal
Nuclear
Hydro
Otherrenewables
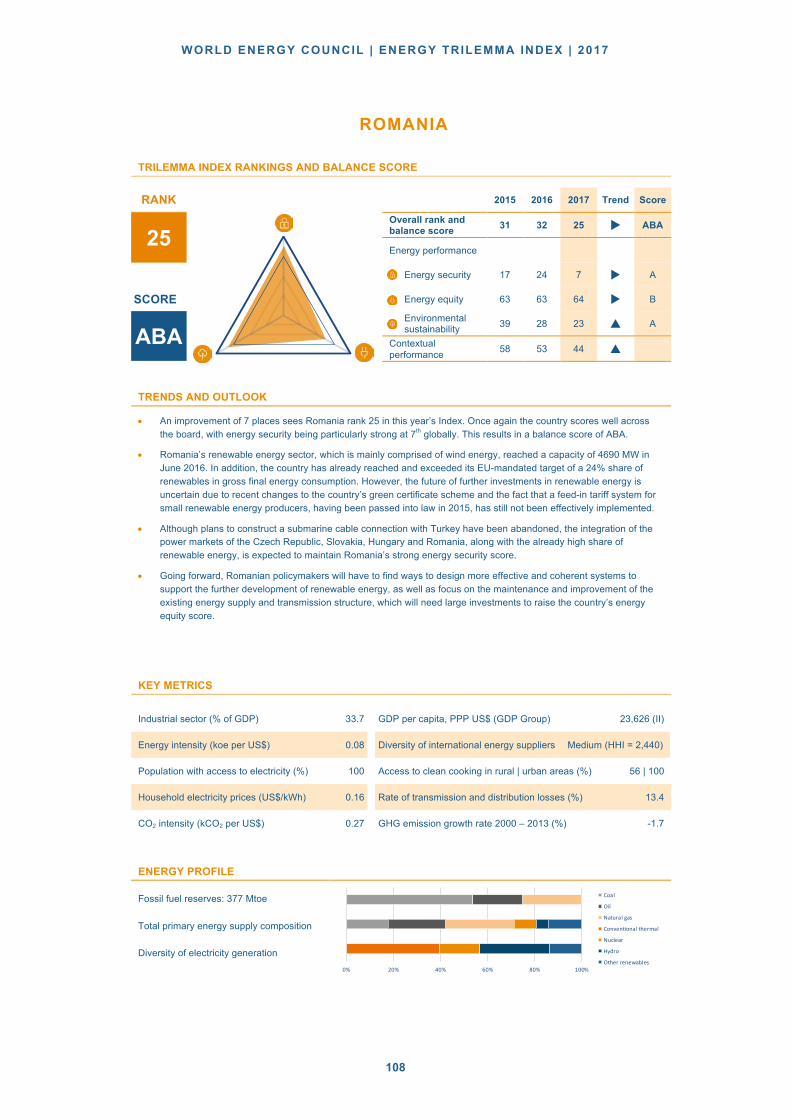
WORLD ENERGY COUNCIL | ENERGY TRILEMMA INDEX | 2017
108
ROMANIA
TRILEMMA INDEX RANKINGS AND BALANCE SCORE
RANK 2015 2016 2017 Trend Score
25 Overall rank and
balance score 31 32 25 u ABA
Energy performance
Energy security 17 24 7 u A
SCORE Energy equity 63 63 64 u B
ABA Environmental
sustainability 39 28 23 p A
Contextual performance 58 53 44 p
TRENDS AND OUTLOOK
• An improvement of 7 places sees Romania rank 25 in this year’s Index. Once again the country scores well across the board, with energy security being particularly strong at 7th globally. This results in a balance score of ABA.
• Romania’s renewable energy sector, which is mainly comprised of wind energy, reached a capacity of 4690 MW in June 2016. In addition, the country has already reached and exceeded its EU-mandated target of a 24% share of renewables in gross final energy consumption. However, the future of further investments in renewable energy is uncertain due to recent changes to the country’s green certificate scheme and the fact that a feed-in tariff system for small renewable energy producers, having been passed into law in 2015, has still not been effectively implemented.
• Although plans to construct a submarine cable connection with Turkey have been abandoned, the integration of the power markets of the Czech Republic, Slovakia, Hungary and Romania, along with the already high share of renewable energy, is expected to maintain Romania’s strong energy security score.
• Going forward, Romanian policymakers will have to find ways to design more effective and coherent systems to support the further development of renewable energy, as well as focus on the maintenance and improvement of the existing energy supply and transmission structure, which will need large investments to raise the country’s energy equity score.
KEY METRICS
Industrial sector (% of GDP) 33.7 GDP per capita, PPP US$ (GDP Group) 23,626 (II)
Energy intensity (koe per US$) 0.08 Diversity of international energy suppliers Medium (HHI = 2,440)
Population with access to electricity (%) 100 Access to clean cooking in rural | urban areas (%) 56 | 100
Household electricity prices (US$/kWh) 0.16 Rate of transmission and distribution losses (%) 13.4
CO2 intensity (kCO2 per US$) 0.27 GHG emission growth rate 2000 – 2013 (%) -1.7
ENERGY PROFILE
Fossil fuel reserves: 377 Mtoe
Total primary energy supply composition
Diversity of electricity generation 0% 20% 40% 60% 80% 100%
Coal
Oil
Naturalgas
Conventionalthermal
Nuclear
Hydro
Otherrenewables

MONITORING NATIONAL ENERGY SYSTEMS
109
RUSSIA
TRILEMMA INDEX RANKINGS AND BALANCE SCORE
RANK 2015 2016 2017 Trend Score
44 Overall rank and
balance score 48 45 44 u ABD
Energy performance
Energy security 8 6 13 u A
SCORE Energy equity 42 42 38 u B
ABD Environmental
sustainability 117 116 113 u D
Contextual performance 51 48 56 u
TRENDS AND OUTLOOK
• Russia improves by 1 place this year to rank 44. The country shows excellent performance regarding energy security, where it is placed 13th globally; its weakest dimension is environmental sustainability, resulting in a balance score of ABD.
• Russia is endowed with natural resources, and exports natural gas and oil to countries in Eastern and Western Europe, Turkey, Japan, as well as other Asian countries. The high dependence of the economy on energy exports and the vulnerability to the fluctuations in energy prices, the development of shale gas in other regions of the world, and Europe’s efforts to decrease dependence on Russian gas imports following disputes with key transit countries such as Ukraine, led to the development of new transportation routes and plans to tap new gas markets in the east (‘Pivot to the East’). However, competition with other gas suppliers, as well as economic turmoil in China, is raising concerns over the profitability of these plans. With four nuclear reactors under construction as of 2017, and an average of one large reactor per year due to come on line by 2028, Russia is working to further improve its security of supply while reducing its dependence on fossil fuels.
• Energy efficiency is a key issue for Russia. To this end, in 2014 the government published an updated version of the State Program on Energy Efficiency and Energy Development, which envisages a 40% decrease in energy intensity of the economy by 2020. Another key part of this strategy is the further development of renewables, which, by 2020, are to account for 2.5% of electricity generation, excluding large hydroelectric power plants.
KEY METRICS
Industrial sector (% of GDP) 32.8 GDP per capita, PPP US$ (GDP Group) 23,163 (II)
Energy intensity (koe per US$) 0.17 Diversity of international energy suppliers Medium (HHI = 1,915)
Population with access to electricity (%) 100 Access to clean cooking in rural | urban areas (%) 91 | 100
Household electricity prices (US$/kWh) N.A. Rate of transmission and distribution losses (%) 10.9
CO2 intensity (kCO2 per US$) 0.72 GHG emission growth rate 2000 – 2013 (%) 0.5
ENERGY PROFILE
Fossil fuel reserves: 156,299 Mtoe
Total primary energy supply composition
Diversity of electricity generation

WORLD ENERGY COUNCIL | ENERGY TRILEMMA INDEX | 2017
110
SAUDI ARABIA
TRILEMMA INDEX RANKINGS AND BALANCE SCORE
RANK 2015 2016 2017 Trend Score
53 Overall rank and
balance score 47 47 53 u BAD
Energy performance
Energy security 41 39 31 u B
SCORE Energy equity 11 12 11 u A
BAD
Environmental
sustainability
110 112 114 u D
Contextual
performance
54 51 71 u
TRENDS AND OUTLOOK
• Saudi Arabia drops 6 places this year to rank 53. Performing strongly in energy security, where it ranks 11
th
globally,
its weakest dimension is environmental sustainability. A good score in energy security completes the profile to give a
balance score of BAD.
• The Saudi energy sector is fully dependent on oil and gas for electricity generation and transportation. In order to
diversify its energy supply, in April 2016, the government launched its long-term development roadmap, ‘Saudi
Arabia’s Vision 2030’, which sets a goal of building 9.5 GW of renewable energy generation capacity by 2030.
• In June 2016, the country published the National Transformation Program 2020, which specifies more detailed short-
term targets for the country. This includes a goal of generating 4% of energy supply through renewable energy by
2020, which is to be met chiefly through solar energy. This has been rendered more attractive by the recent drop in
prices for solar PV technology. The National Transformation Program also calls for full compliance with security
standards for the introduction of nuclear power generation.
• Saudi Arabian policymakers must now focus on realising these ambitious goals and attracting the necessary
investment, while also continuing to improve energy efficiency in the country. Although fossil fuels will continue to
make up the vast majority of Saudi Arabia’s energy supply, successful implementation could improve the country’s
environmental sustainability as well as energy security scores in future rankings.
KEY METRICS
Industrial sector (% of GDP) 45.3 GDP per capita, PPP US$ (GDP Group) 54,431 (I)
Energy intensity (koe per US$) 0.08 Diversity of international energy suppliers High (HHI = 767)
Population with access to electricity (%) 100 Access to clean cooking in rural | urban areas (%) 100 | 100
Household electricity prices (US$/kWh) N.A. Rate of transmission and distribution losses (%) 7.1
CO2 intensity (kCO
2 per US$) 0.39 GHG emission growth rate 2000 – 2013 (%) 5.8
ENERGY PROFILE
Fossil fuel reserves: 43,894 Mtoe
Total primary energy supply composition
Diversity of electricity generation
0% 20% 40% 60% 80% 100%
Coal
Oil
Naturalgas
Conventionalthermal
Nuclear
Hydro
Otherrenewables

MONITORING NATIONAL ENERGY SYSTEMS
111
SENEGAL
TRILEMMA INDEX RANKINGS AND BALANCE SCORE
RANK 2015 2016 2017 Trend Score
111 Overall rank and
balance score 109 109 111 u CDC
Energy performance
Energy security 82 92 88 u C
SCORE Energy equity 108 107 114 u D
CDC
Environmental sustainability
88 91 96 u C
Contextual performance
101 99 91 u
TRENDS AND OUTLOOK
• Senegal drops 2 places to rank 111 in this year’s Index. With relatively low scores across the board, especially
regarding energy equity where it receives a D grade, Senegal receives an overall balance score of CDC.
• Senegal’s energy sector is currently faced with a number of challenges, including ageing infrastructure that is not
being properly maintained, nor planned to be replaced. Water issues are also at the top of the agenda, as droughts
have a strong impact on households, especially those located in rural areas.
• The 2012 Energy Strategy for Senegal sets out a sustainable development plan for the country’s energy sector.
Targets include achieving a 50% rural electrification rate by 2017, and a 20% renewables share of the electricity
generation mix by 2017. To support the deployment of renewables, Senegal has joined the ‘Scaling Solar’ initiative in
early 2016 to develop up to 200 MW of solar power.
• The Senegalese government has also signed up to the World Bank’s Electricity Sector Support Project, running from
2012 to 2020. The aim of the Senegal Electricity Sector Support Project is to reduce the national utility company’s
technical and commercial losses and to improve the reliability of electricity supply in certain areas of the country,
mainly in Greater Dakar. While improving the reliability of electricity supply will help to improve the country’s energy
equity, improving access to electricity in rural areas will be required to achieve significant energy equity gains.
KEY METRICS
Industrial sector (% of GDP) 23.4 GDP per capita, PPP US$ (GDP Group) 2,568 (IV)
Energy intensity (koe per US$) 0.10 Diversity of international energy suppliers Medium (HHI = 1,894)
Population with access to electricity (%) 61 Access to clean cooking in rural | urban areas (%) 8 | 80
Household electricity prices (US$/kWh) N.A. Rate of transmission and distribution losses (%) 13.0
CO2 intensity (kCO2 per US$) 0.28 GHG emission growth rate 2000 – 2013 (%) 4.0
ENERGY PROFILE
Fossil fuel reserves: 0 Mtoe
Total primary energy supply composition
Diversity of electricity generation
0% 20% 40% 60% 80% 100%
Coal
Oil
Naturalgas
Conventionalthermal
Nuclear
Hydro
Otherrenewables

WORLD ENERGY COUNCIL | ENERGY TRILEMMA INDEX | 2017
112
SERBIA
TRILEMMA INDEX RANKINGS AND BALANCE SCORE
RANK 2015 2016 2017 Trend Score
68 Overall rank and
balance score 68 73 68 u BBC
Energy performance
Energy security 46 61 51 u B
SCORE Energy equity 73 73 70 u B
BBC Environmental
sustainability 90 89 88 u C
Contextual performance 89 84 72 p
TRENDS AND OUTLOOK
• An improvement of 5 places sees Serbia rank 68 in this year’s Index. With good scores received for both energy security and energy equity dimensions, it lags behind slightly in environmental sustainability, resulting in a letter grade BBC.
• Considerable investments have been made in the energy sector to meet environmental goals. Several wind farms are ready for construction to meet the target of 500 MW, set by the National Action Plan, which calls for 27% of gross final energy consumption in 2020 to be from renewables. This is expected to improve the country’s energy security.
• The new Energy Sector Development Strategy to 2030 (ESDS) has been adopted in line with the EU policy, enforced by the Energy Community Treaty and action plans to implement energy efficiency and renewables. The existing feed-in tariff (FIT) scheme has been modified for solar power plants. These developments will have a positive impact on the energy security and environmental sustainability dimension. At the same time, construction of a new coal-fired power generation unit has started. Existing units are also being refurbished, with the intention that they will remain in operation beyond 2023, while those that do not meet environmental regulations will be shut down.
• Policymakers need to focus on: 1) adopting the program for the implementation of the ESDS until 2023; 2) meeting the obligation from the Energy Community Treaty to implement flue gas desulphurisation in all existing power plants that will remain in operation after 2023; 3) meeting the 27% target of renewables, including a 10% target for biofuels in the transport sector; and 4) enforcing the incentives for energy efficiency through the new budget fund.
KEY METRICS
Industrial sector (% of GDP) 31.4 GDP per capita, PPP US$ (GDP Group) 14,512 (II)
Energy intensity (koe per US$) 0.11 Diversity of international energy suppliers Low (HHI = 3,931)
Population with access to electricity (%) 100 Access to clean cooking in rural | urban areas (%) 46 | 86
Household electricity prices (US$/kWh) 0.10 Rate of transmission and distribution losses (%) 15.4
CO2 intensity (kCO2 per US$) 0.58 GHG emission growth rate 2000 – 2013 (%) 0.8
ENERGY PROFILE
Fossil fuel reserves: 9,404 Mtoe
Total primary energy supply composition
Diversity of electricity generation 0% 20% 40% 60% 80% 100%
Coal
Oil
Naturalgas
Conventionalthermal
Nuclear
Hydro
Otherrenewables

MONITORING NATIONAL ENERGY SYSTEMS
113
SINGAPORE
TRILEMMA INDEX RANKINGS AND BALANCE SCORE
RANK 2015 2016 2017 Trend Score
22 Overall rank and
balance score 25 24 22 u CAA
Energy performance
Energy security 80 70 74 u C
SCORE Energy equity 56 56 28 u A
CAA
Environmental
sustainability 7 9 11 u A
Contextual
performance 1 1 1 u
TRENDS AND OUTLOOK
• An improvement of 2 places sees Singapore rise to rank 22 in this year’s Index. Performing strongly in environmental
sustainability, where it ranks 11th globally, as well as 1
st for contextual performance, energy security remains weak.
This results in a grade of CAA.
• The country has been investing heavily in R&D projects, particularly in the electricity grid infrastructure. The country
has recently launched a Grid 2.0 initiative, that would consolidate the country’s gas, solar and thermal energy into a
single intelligent network. The government is committing about S$1 billion from the National Research Foundation
into this initiative to address Singapore’s future energy challenges.
• Smart grids are the other key part of the new energy industry in Singapore. The smart grid and data analytics projects
were launched in August 2016, and these are expected to be completed by 2021. The projects can allow the country
to enhance energy supply stability and sustainability by monitoring electricity disruptions and facilitating the use of
renewable energy.
KEY METRICS
Industrial sector (% of GDP) 26.2 GDP per capita, PPP US$ (GDP Group) 87,856 (I)
Energy intensity (koe per US$) 0.03 Diversity of international energy suppliers High (HHI = 591)
Population with access to electricity (%) 100 Access to clean cooking in rural | urban areas (%) 100 | 100
Household electricity prices (US$/kWh) N.A. Rate of transmission and distribution losses (%) 1.7
CO2 intensity (kCO2 per US$) 0.13 GHG emission growth rate 2000 – 2013 (%) 0.4
ENERGY PROFILE
Fossil fuel reserves: 0 Mtoe
Total primary energy supply composition
Diversity of electricity generation
0% 20% 40% 60% 80% 100%
Coal
Oil
Naturalgas
Conventionalthermal
Nuclear
Hydro
Otherrenewables

WORLD ENERGY COUNCIL | ENERGY TRILEMMA INDEX | 2017
114
SLOVAKIA
TRILEMMA INDEX RANKINGS AND BALANCE SCORE
RANK 2015 2016 2017 Trend Score
24 Overall rank and
balance score 14 16 24 u AAA
Energy performance
Energy security 9 15 23 u A
SCORE Energy equity 20 18 25 u A
AAA Environmental
sustainability 33 30 29 u A
Contextual performance 38 37 36 u
TRENDS AND OUTLOOK
• Slovakia drops by 8 places this year to rank 24. Showing excellent performance across all trilemma dimensions, Slovakia balances the trilemma very well, resulting in an overall balance score of AAA.
• Recent policy developments are mainly driven by EU energy and climate targets and implementation of EU policy and regulation continues, including market liberalisation and promotion of environmentally-friendly energy technologies. The removal of cross subsidies is challenging, as it conflicts with the support of the availability of cheap energy for low-income households and for the manufacturing sector.
• Policymakers need to focus on dealing with the challenge for the distribution system as a result of decentralised production and e-mobility. Increasing energy efficiency in all sectors of the economy remains a challenge and requires structural changes in the economy to move from heavy industry to sophisticated production, but also measures to reduce energy consumption of buildings. The role of nuclear energy needs to be discussed because the technology allows an increase of electricity generation without increasing carbon emissions. Furthermore, policymakers need to focus on decreasing the dependence on natural gas and oil imports.
KEY METRICS
Industrial sector (% of GDP) 34.8 GDP per capita, PPP US$ (GDP Group) 30,632 (II)
Energy intensity (koe per US$) 0.08 Diversity of international energy suppliers Low (HHI = 4,068)
Population with access to electricity (%) 100 Access to clean cooking in rural | urban areas (%) 100 | 100
Household electricity prices (US$/kWh) 0.18 Rate of transmission and distribution losses (%) 2.5
CO2 intensity (kCO2 per US$) 0.25 GHG emission growth rate 2000 – 2013 (%) -1.3
ENERGY PROFILE
Fossil fuel reserves: 13 Mtoe
Total primary energy supply composition
Diversity of electricity generation
0% 20% 40% 60% 80% 100%
Coal
Oil
Naturalgas
Conventionalthermal
Nuclear
Hydro
Otherrenewables

MONITORING NATIONAL ENERGY SYSTEMS
115
SLOVENIA
TRILEMMA INDEX RANKINGS AND BALANCE SCORE
RANK 2015 2016 2017 Trend Score
10 Overall rank and
balance score 13 12 10 u AAB
Energy performance
Energy security 3 2 2 u A
SCORE Energy equity 26 25 31 u A
AAB Environmental
sustainability 47 44 43 u B
Contextual performance 35 35 31 u
TRENDS AND OUTLOOK
• Slovenia makes it into the top 10 this year, improving by 2 places to rank 10. A strong performance in energy security, where it ranks 2nd globally, is matched by an excellent performance in energy equity. Overall Slovenia balances the energy trilemma very well, receiving a balance score of AAB.
• The Energy Act increases competition in the electricity market, especially in the gas market, and significantly stimulates investment in renewables and energy efficiency. The National Energy Concept, which sets energy-related environmental goals, is still in constructive public discussion and should be adopted by 2018. The main discussion is focusing on the future energy mix.
• Construction of a series of hydroelectric power plants on the Sava River is in progress, which will increase the share of renewables in the energy mix. The construction of electricity and gas interconnections with Hungary are in progress, which will benefit the regional energy market. Multiple technologically advanced smart grid projects on distribution levels are also being realised, including the SINCRO.GRID project, initiated by a Slovenian transmission operator along with a Croatian operator.
• To improve Slovenia’s environmental performance additional financial investments are needed for energy efficiency measures, particularly in the energy consumption of buildings (thermal insulation, window replacement and replacement of obsolete heating systems), and in supporting schemes for the use of renewable energy sources for energy supply of buildings. National environmental legislation and permit granting are still crucial obstacles for investments in the energy sector and in renewable energy sources.
KEY METRICS
Industrial sector (% of GDP) 32.7 GDP per capita, PPP US$ (GDP Group) 32,885 (II)
Energy intensity (koe per US$) 0.09 Diversity of international energy suppliers High (HHI = 1,396)
Population with access to electricity (%) 100 Access to clean cooking in rural | urban areas (%) 100 | 92
Household electricity prices (US$/kWh) 0.18 Rate of transmission and distribution losses (%) 6.1
CO2 intensity (kCO2 per US$) 0.25 GHG emission growth rate 2000 – 2013 (%) 0.1
ENERGY PROFILE
Fossil fuel reserves: 0 Mtoe
Total primary energy supply composition
Diversity of electricity generation 0% 20% 40% 60% 80% 100%
Coal
Oil
Naturalgas
Conventionalthermal
Nuclear
Hydro
Otherrenewables

WORLD ENERGY COUNCIL | ENERGY TRILEMMA INDEX | 2017
116
SOUTH AFRICA
TRILEMMA INDEX RANKINGS AND BALANCE SCORE
RANK 2015 2016 2017 Trend Score
82 Overall rank and
balance score 81 84 82 u BCD
Energy performance
Energy security 68 66 47 u B
SCORE Energy equity 8 82 87 u C
BCD Environmental
sustainability 105 105 109 u D
Contextual performance 49 47 46 u
TRENDS AND OUTLOOK
• South Africa improves by 2 places to rank 82 in this year’s Index, mainly due to a noticeable improvement in energy security. However, environmental sustainability remains its weakest dimension, resulting in an overall balance score of BCD.
• Energy security has improved due to a number of factors – additional power has become available from the Renewable Energy programme that was launched in 2011; the National Utility has improved the operation of its coal-fired fleet and the demand growth has not been as strong as anticipated due to the slow-down in the economy. In fact, the National Utility now has excess power relative to the demand it is serving.
• Environmental sustainability continues to be South Africa’s weakest trilemma dimension as a result of coal-based electricity generation. Although the contribution from renewable energy sources is increasing, it is still small (<14%). Coal-based generation of electricity will continue to dominate even as renewable energy programmes are completed.
• South Africa continues to explore ways to establish a natural gas infrastructure based on LNG as one way of addressing the environmental sustainability dimension, which has become an imperative following the Paris agreement, and also since the country has no indigenous natural gas supplies of its own.
KEY METRICS
Industrial sector (% of GDP) 29.2 GDP per capita, PPP US$ (GDP Group) 13,225 (III)
Energy intensity (koe per US$) 0.12 Diversity of international energy suppliers Medium (HHI = 1,532)
Population with access to electricity (%) 86 Access to clean cooking in rural | urban areas (%) 67 | 99
Household electricity prices (US$/kWh) 0.09 Rate of transmission and distribution losses (%) 9.0
CO2 intensity (kCO2 per US$) 0.71 GHG emission growth rate 2000 – 2013 (%) 2.9
ENERGY PROFILE
Fossil fuel reserves: 21,039 Mtoe
Total primary energy supply composition
Diversity of electricity generation 0% 20% 40% 60% 80% 100%
Coal
Oil
Naturalgas
Conventionalthermal
Nuclear
Hydro
Otherrenewables

MONITORING NATIONAL ENERGY SYSTEMS
117
SPAIN
TRILEMMA INDEX RANKINGS AND BALANCE SCORE
RANK 2015 2016 2017 Trend Score
13 Overall rank and
balance score 16 13 13 u AAA
Energy performance
Energy security 22 26 20 u A
SCORE Energy equity 28 30 33 u A
AAA Environmental
sustainability 15 17 15 u A
Contextual performance 31 31 27 u
TRENDS AND OUTLOOK
• Spain maintains its position at rank 13 in this year’s Index. Being able to manage the trade-offs of the energy trilemma excellently, Spain once again exhibits a balance score of AAA.
• Spain, in the context of the EU, has set a target of a 20% share of renewable energy in gross final energy consumption by 2020. In 2015, the share of renewables in final energy consumption reached 17.3%. In January 2016, the government launched 700 MW of renewable auctions, with two more taking place during 2017. This amounts to a total of 8,000 MW of renewable energy that will be available by 2020. However, regional integration may pose an obstacle towards the further growth of renewables. While the current level of electricity interconnections with Europe progressed significantly in 2015, it is still well below the EU target of 10%.
• The deployment of the Iberian Natural Gas Hub in December 2015 was a milestone for the development and maturity of the gas wholesale market in Spain, allowing the generation of price signals, increased transparency and flexibility as well as other advantages.
• Further progress to reduce energy poverty was made at the end of last year, with a new Royal Decree Law (RDL 7-2016) proposing the establishment of a new social bond financing mechanism. Most recently, energy utility suppliers have also signed numerous agreements with local and regional public authorities to protect vulnerable customers.
• The government has started the approval process for a comprehensive Climate Change and Energy Transition Act, with the objective of facilitating compliance with international and European commitments. This new act should pave the way for a sustainable development model that provides resilience to the effects of climate change.
KEY METRICS
Industrial sector (% of GDP) 23.6 GDP per capita, PPP US$ (GDP Group) 36,310 (I)
Energy intensity (koe per US$) 0.06 Diversity of international energy suppliers High (HHI = 672)
Population with access to electricity (%) 100 Access to clean cooking in rural | urban areas (%) 100 | 100
Household electricity prices (US$/kWh) 0.26 Rate of transmission and distribution losses (%) 10.1
CO2 intensity (kCO2 per US$) 0.20 GHG emission growth rate 2000 – 2013 (%) -1.5
ENERGY PROFILE
Fossil fuel reserves: 391 Mtoe
Total primary energy supply composition
Diversity of electricity generation 0% 20% 40% 60% 80% 100%
Coal
Oil
Naturalgas
Conventionalthermal
Nuclear
Hydro
Otherrenewables

WORLD ENERGY COUNCIL | ENERGY TRILEMMA INDEX | 2017
118
SRI LANKA
TRILEMMA INDEX RANKINGS AND BALANCE SCORE
RANK 2015 2016 2017 Trend Score
83 Overall rank and
balance score 83 81 83 u CCA
Energy performance
Energy security 84 74 69 p C
SCORE Energy equity 96 96 99 u C
CCA Environmental
sustainability 21 24 24 u A
Contextual performance 88 85 93 u
TRENDS AND OUTLOOK
• Dropping by 2 places, Sri Lanka moves down to rank 83 in this year’s Index. A strong performance in environmental sustainability results in a letter grade A; however, energy security and equity remain relatively low. This results in an imbalanced energy trilemma profile of CCA.
• Avoiding the expected energy shortage will be an urgent and important challenge for the country. According to the Public Utilities Commission’s analysis, Sri Lanka could face energy and capacity shortages in 2018−2019 and beyond under drought conditions, even with planned plant additions.
• In July 2016, the Asian Development Bank (ADB) approved a loan of US$115m and US$3.8m in grants to improve the reliability and quality of electricity supply. This includes electrification of remote islands with renewable hybrid energy systems. The country currently has an electrification rate of around 99.3%, the only South Asian nation to have near 100% grid connectivity.
KEY METRICS
Industrial sector (% of GDP) 29.5 GDP per capita, PPP US$ (GDP Group) 12,316 (III)
Energy intensity (koe per US$) 0.05 Diversity of international energy suppliers Medium (HHI = 2,182)
Population with access to electricity (%) 99.3 Access to clean cooking in rural | urban areas (%) 15 | 86
Household electricity prices (US$/kWh) N.A. Rate of transmission and distribution losses (%) 9.63
CO2 intensity (kCO2 per US$) 0.09 GHG emission growth rate 2000 – 2013 (%) 2.2
ENERGY PROFILE
Fossil fuel reserves: 0 Mtoe
Total primary energy supply composition
Diversity of electricity generation
0% 20% 40% 60% 80% 100%
Coal
Oil
Naturalgas
Conventionalthermal
Nuclear
Hydro
Otherrenewables

MONITORING NATIONAL ENERGY SYSTEMS
119
SWAZILAND
TRILEMMA INDEX RANKINGS AND BALANCE SCORE
RANK 2015 2016 2017 Trend Score
90 Overall rank and
balance score 95 95 90 u BDB
Energy performance
Energy security 48 45 54 u B
SCORE Energy equity 103 103 102 u D
BDB Environmental
sustainability 66 70 58 u B
Contextual performance 90 98 97 u
TRENDS AND OUTLOOK
• A rise of 5 places sees Swaziland placed at 90 in this year’s Index. Whilst performing well in the energy security and environmental sustainability dimensions, energy equity remains its weakest dimension, resulting in a balance score of BDB.
• Coal will continue to play an important role in the energy mix of Swaziland. The country has vast reserves and is considering building a 300 MW coal-fired thermal power station using clean coal technologies, which is expected to supply the country and allow export to the Southern African Power Pool. However, companies are investing in cogeneration to replace coal. These efforts are expected to improve the country’s energy independence by reducing the heavy reliance on imported energy. In addition, the development of a renewable energy strategy for both power (off- and on-grid) and fuel (biofuels), an independent power producer policy, and feed-in tariffs are underway.
• In addition, the country is looking to increase its strategic fuel reserves, enhance bulk purchasing (better prices), explore the possibility of setting up a petroleum products refinery, and tap into the natural gas market in Mozambique.
• Policymakers need to: 1) support the deployment of renewables; and 2) increase the budget for the energy sector to enable economic development and poverty reduction, through increased rural electrification, energy access, research and development, development of skills, and capacity building.
KEY METRICS
Industrial sector (% of GDP) 37.9 GDP per capita, PPP US$ (GDP Group) 8,343 (III)
Energy intensity (koe per US$) 0.10 Diversity of international energy suppliers Low (HHI = 9,596)
Population with access to electricity (%) 65 Access to clean cooking in rural | urban areas (%) 20 | 100
Household electricity prices (US$/kWh) N.A. Rate of transmission and distribution losses (%) 13.0
CO2 intensity (kCO2 per US$) 0.11 GHG emission growth rate 2000 – 2013 (%) N.A.
ENERGY PROFILE
Fossil fuel reserves: 0 Mtoe
Total primary energy supply composition
Diversity of electricity generation 0% 20% 40% 60% 80% 100%
Coal
Oil
Naturalgas
Conventionalthermal
Nuclear
Hydro
Otherrenewables

WORLD ENERGY COUNCIL | ENERGY TRILEMMA INDEX | 2017
120
SWEDEN
TRILEMMA INDEX RANKINGS AND BALANCE SCORE
RANK 2015 2016 2017 Trend Score
2 Overall rank and
balance score 4 3 2 u AAA
Energy performance
Energy security 13 10 9 u A
SCORE Energy equity 32 27 21 u A
AAA Environmental
sustainability 9 8 5 u A
Contextual performance 10 4 2 u
TRENDS AND OUTLOOK
• An impressive performance means Sweden rises by 1 place to rank 2 in this year’s Index. The country continues to manage the energy trilemma excellently, with improvement seen in all trilemma dimensions, resulting in a balance score of AAA.
• Currently, the transport sector (except trains, metro and trams) relies on fossil fuels. Special policies and financial support to incentivise the purchase of electric cars are in place, but results are not yet meeting expectations. The EU target to increase the share of biofuels used in transport to 10% by 2020 will be exceeded, with the share having already reached 31% in 2016. This is primarily due to a rapid increase in the blending of HVO-biodiesel and other biofuels in gasoline and diesel, and an increased number of cars running on biogas.
• Policymakers need to focus on finding a solution to replace the existing ten nuclear reactors that will be taken out of operation to meet future electricity demand. The first reactors are expected to close between 2017 and 2020. Vattenfall has taken a policy decision to close the two smallest reactors in Ringhals, and Uniper (formerly E.ON) has already closed the two smallest reactors in Oskarshamn in 2017. While the application to build new reactors has not been formally withdrawn, Vattenfall has currently stopped any further work on the application. In addition to finding measures to meet the EU CO2 reduction and RES targets, energy efficiency needs to be a top priority.
KEY METRICS
Industrial sector (% of GDP) 26.3 GDP per capita, PPP US$ (GDP Group) 49,175 (I)
Energy intensity (koe per US$) 0.08 Diversity of international energy suppliers High (HHI = 1,499)
Population with access to electricity (%) 100 Access to clean cooking in rural | urban areas (%) 100 | 100
Household electricity prices (US$/kWh) 0.22 Rate of transmission and distribution losses (%) 5.5
CO2 intensity (kCO2 per US$) 0.10 GHG emission growth rate 2000 – 2013 (%) -2.6
ENERGY PROFILE
Fossil fuel reserves: 0 Mtoe
Total primary energy supply composition
Diversity of electricity generation 0% 20% 40% 60% 80% 100%
Coal
Oil
Naturalgas
Conventionalthermal
Nuclear
Hydro
Otherrenewables

MONITORING NATIONAL ENERGY SYSTEMS
121
SWITZERLAND
TRILEMMA INDEX RANKINGS AND BALANCE SCORE
RANK 2015 2016 2017 Trend Score
3 Overall rank and
balance score 2 2 3 u AAA
Energy performance
Energy security 12 12 16 u A
SCORE Energy equity 3 2 4 u A
AAA Environmental
sustainability 3 3 3 u A
Contextual performance
7 3 13 u
TRENDS AND OUTLOOK
• Switzerland drops by 1 place to rank 3 in this year’s Index. Excellent scores in both energy equity and environmental sustainability, where it is ranked 4th and 3rd respectively, result in a well-balanced energy trilemma profile of AAA.
• Switzerland’s leading position in the Index reflects the country’s past energy and energy-related policy decisions. Recent policy decisions, however, are likely to have a strong impact on the country’s energy sustainability balance.
• Recent energy policy developments include the decision to refrain from building new nuclear power plants, to reduce energy consumption, increase energy efficiency and to promote renewable energies. In a popular vote in May 2017, the Swiss people approved these initial measures. The entire energy strategy is expected to be implemented fully by 2050. The measures and next steps to phase out nuclear are not yet known, and will be a matter of political discussions in the next few months (a public referendum is probable). To achieve the transition to a low-carbon energy system in the long term, in the mid-term Switzerland is likely to become more dependent on electricity imports.
• Policymakers need to focus on: 1) construction of new electricity grids; 2) completing the liberalisation of the electricity market; 3) securing energy supply after the phase-out of nuclear power plants; and 4) coming to a bilateral agreement with the EU in order to participate in the European internal energy market and the EU-ETS. Furthermore, there is the need to be ambitious and increase the renovation rate of buildings as part of the transition to a low-carbon energy system.
KEY METRICS
Industrial sector (% of GDP) 25.5 GDP per capita, PPP US$ (GDP Group) 62,881 (I)
Energy intensity (koe per US$) 0.05 Diversity of international energy suppliers Medium (HHI = 2,270)
Population with access to electricity (%) 100 Access to clean cooking in rural | urban areas (%) 100 | 100
Household electricity prices (US$/kWh) 0.16 Rate of transmission and distribution losses (%) 7.6
CO2 intensity (kCO2 per US$) 0.10 GHG emission growth rate 2000 – 2013 (%) -0.2
ENERGY PROFILE
Fossil fuel reserves: 0 Mtoe
Total primary energy supply composition
Diversity of electricity generation
0% 20% 40% 60% 80% 100%
Coal
Oil
Naturalgas
Conventionalthermal
Nuclear
Hydro
Otherrenewables
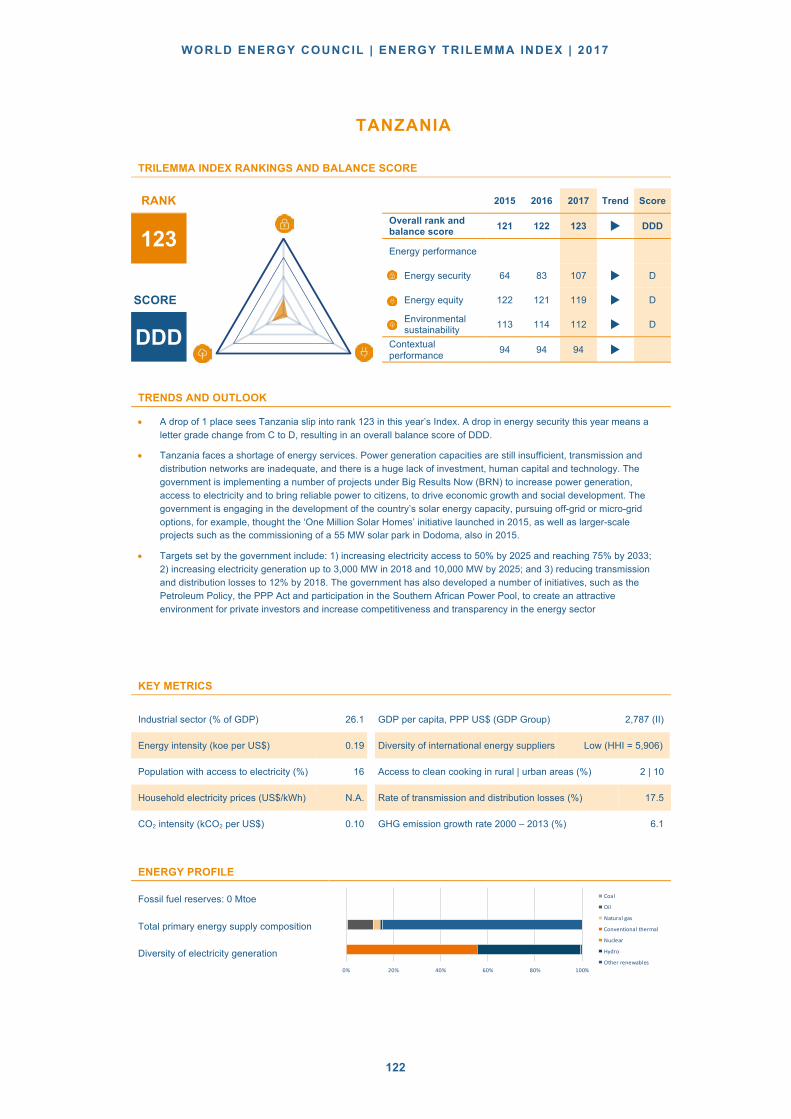
WORLD ENERGY COUNCIL | ENERGY TRILEMMA INDEX | 2017
122
TANZANIA
TRILEMMA INDEX RANKINGS AND BALANCE SCORE
RANK 2015 2016 2017 Trend Score
123 Overall rank and
balance score 121 122 123 u DDD
Energy performance
Energy security 64 83 107 u D
SCORE Energy equity 122 121 119 u D
DDD
Environmental sustainability
113 114 112 u D
Contextual performance
94 94 94 u
TRENDS AND OUTLOOK
• A drop of 1 place sees Tanzania slip into rank 123 in this year’s Index. A drop in energy security this year means a
letter grade change from C to D, resulting in an overall balance score of DDD.
• Tanzania faces a shortage of energy services. Power generation capacities are still insufficient, transmission and
distribution networks are inadequate, and there is a huge lack of investment, human capital and technology. The
government is implementing a number of projects under Big Results Now (BRN) to increase power generation,
access to electricity and to bring reliable power to citizens, to drive economic growth and social development. The
government is engaging in the development of the country’s solar energy capacity, pursuing off-grid or micro-grid
options, for example, thought the ‘One Million Solar Homes’ initiative launched in 2015, as well as larger-scale
projects such as the commissioning of a 55 MW solar park in Dodoma, also in 2015.
• Targets set by the government include: 1) increasing electricity access to 50% by 2025 and reaching 75% by 2033;
2) increasing electricity generation up to 3,000 MW in 2018 and 10,000 MW by 2025; and 3) reducing transmission
and distribution losses to 12% by 2018. The government has also developed a number of initiatives, such as the
Petroleum Policy, the PPP Act and participation in the Southern African Power Pool, to create an attractive
environment for private investors and increase competitiveness and transparency in the energy sector
KEY METRICS
Industrial sector (% of GDP) 26.1 GDP per capita, PPP US$ (GDP Group) 2,787 (II)
Energy intensity (koe per US$) 0.19 Diversity of international energy suppliers Low (HHI = 5,906)
Population with access to electricity (%) 16 Access to clean cooking in rural | urban areas (%) 2 | 10
Household electricity prices (US$/kWh) N.A. Rate of transmission and distribution losses (%) 17.5
CO2 intensity (kCO2 per US$) 0.10 GHG emission growth rate 2000 – 2013 (%) 6.1
ENERGY PROFILE
Fossil fuel reserves: 0 Mtoe
Total primary energy supply composition
Diversity of electricity generation
0% 20% 40% 60% 80% 100%
Coal
Oil
Naturalgas
Conventionalthermal
Nuclear
Hydro
Otherrenewables

MONITORING NATIONAL ENERGY SYSTEMS
123
THAILAND
TRILEMMA INDEX RANKINGS AND BALANCE SCORE
RANK 2015 2016 2017 Trend Score
74 Overall rank and
balance score 76 76 74 u CBC
Energy performance
Energy security 96 94 89 u C
SCORE Energy equity 68 67 71 u B
CBC Environmental
sustainability 77 76 73 u C
Contextual performance 72 71 62 u
TRENDS AND OUTLOOK
• Thailand improves by 2 places to rank 74 in this year’s Index. A good performance in the energy equity dimension is offset by relatively low scores in energy security and environmental sustainability dimensions, resulting in a balance score of CBC.
• Increasing energy production to enhance energy security and reduce reliance on energy imports is a key challenge for Thailand. To address this challenge, the government aims to advance the exploration and production of energy resources at domestic and international levels; explore the joint development of energy resources with neighbouring economies; develop a more diversified energy mix; and encourage electricity production from renewable and other alternative energy sources. In addition, the government aims to increase competition and investment in the energy industry by creating a business-friendly, transparent environment through the Investor Relation Office, which will be responsible for investment procedures and processes in the energy industry.
• The government has developed policies to encourage the production and use of alternative energy, in particular biofuels, biomass, solid waste and animal manure. These measures are expected to enhance energy security, reduce pollution, and support farmers by encouraging the production and use of renewable energy at the community level.
KEY METRICS
Industrial sector (% of GDP) 36.4 GDP per capita, PPP US$ (GDP Group) 16,916 (II)
Energy intensity (koe per US$) 0.08 Diversity of international energy suppliers High (HHI = 1,195)
Population with access to electricity (%) 100 Access to clean cooking in rural | urban areas (%) 62 | 100
Household electricity prices (US$/kWh) N.A. Rate of transmission and distribution losses (%) 5.9
CO2 intensity (kCO2 per US$) 0.28 GHG emission growth rate 2000 – 2013 (%) 4.0
ENERGY PROFILE
Fossil fuel reserves: 1,118 Mtoe
Total primary energy supply composition
Diversity of electricity generation 0% 20% 40% 60% 80% 100%
Coal
Oil
Naturalgas
Conventionalthermal
Nuclear
Hydro
Otherrenewables

WORLD ENERGY COUNCIL | ENERGY TRILEMMA INDEX | 2017
124
TRINIDAD & TOBAGO
TRILEMMA INDEX RANKINGS AND BALANCE SCORE
RANK 2015 2016 2017 Trend Score
88 Overall rank and
balance score 90 90 88 u CBD
Energy performance
Energy security 102 99 92 u C
SCORE Energy equity 48 48 55 u B
CBD Environmental
sustainability 124 123 122 u D
Contextual performance 61 64 75 u
TRENDS AND OUTLOOK
• An improvement of 2 places sees Trinidad and Tobago rise to rank 88 in this year’s Index. Whilst scoring low on environmental sustainability, it performs well in terms of energy equity, receiving a balance score of CBD overall.
• Trinidad and Tobago’s electricity rates are among the lowest in the Caribbean region at approximately US$0.04 to US$0.06 per kWh, well below the regional average of US$0.33 per kWh, contributing towards the country’s energy equity performance. Trinidad and Tobago has significant oil and natural gas reserves and is a net exporter of these fuels. The country is the world’s 6th largest exporter of LNG. Liquid fuels subsidies are removed on a step-by-step basis. There have been two price increases since 2015 in order to bring prices in-line with the international market, in an effort to decrease the fiscal burden on the government.
• The government has set a renewable energy goal of 135 MW (10% of 2016 peak capacity) by 2021. There is a strong recognition for the need to increase energy security through promotion of energy efficiency and energy conservation in the production and utilisation of energy sources. Key issues the government will continue to address include: 1) increasing current production levels while reducing the rate of depletion of energy sources; 2) diversifying energy sources to include renewable energy and contributing to global efforts to address climate change and global warming; and 3) maximising the benefits that accrue to the citizens from the exploitation of energy resources.
KEY METRICS
Industrial sector (% of GDP) 40.4 GDP per capita, PPP US$ (GDP Group) 31,908 (III)
Energy intensity (koe per US$) 0.11 Diversity of international energy suppliers Low (HHI = 3,622)
Population with access to electricity (%) 100 Access to clean cooking in rural | urban areas (%) 100 | 100
Household electricity prices (US$/kWh) N.A. Rate of transmission and distribution losses (%) 2.4
CO2 intensity (kCO2 per US$) 0.99 GHG emission growth rate 2000 – 2013 (%) 0.5
ENERGY PROFILE
Fossil fuel reserves: 410 Mtoe
Total primary energy supply composition
Diversity of electricity generation 0% 20% 40% 60% 80% 100%
Coal
Oil
Naturalgas
Conventionalthermal
Nuclear
Hydro
Otherrenewables

MONITORING NATIONAL ENERGY SYSTEMS
125
TUNISIA
TRILEMMA INDEX RANKINGS AND BALANCE SCORE
RANK 2015 2016 2017 Trend Score
59 Overall rank and
balance score 54 54 59 u DBB
Energy performance
Energy security 101 101 100 u D
SCORE Energy equity 45 49 47 u B
DBB
Environmental
sustainability 35 43 41 u B
Contextual
performance 80 80 78 u
TRENDS AND OUTLOOK
• Tunisia drops by 5 places to rank 59 in this year’s Index. Energy security remains its weakest dimension; however,
this is offset by good scores in energy equity and environmental sustainability, resulting in a balance score of DBB.
• Over the past few years, Tunisia has made continued efforts to sustain its economic development and improve the
energy sustainability balance. To achieve the latter, policies have been implemented to manage the exploration and
production of hydrocarbons that will allow Tunisia to accelerate its economic development and to establish its position
on the world market. Furthermore, programmes for the promotion of energy efficiency, renewable energy and energy
substitution have been initiated.
• Key issues policymakers need to focus on are: 1) increasing the share of renewable energy in electricity generation
(including wind, solar and a new concentrated solar power (CSP) scheme) and households (solar water heat, micro
generation); and 2) extending the natural gas network in the south and central parts of the country.
KEY METRICS
Industrial sector (% of GDP) 28.2 GDP per capita, PPP US$ (GDP Group) 11,599 (II)
Energy intensity (koe per US$) 0.07 Diversity of international energy suppliers Medium (HHI = 1,518)
Population with access to electricity (%) 100 Access to clean cooking in rural | urban areas (%) 100 | 100
Household electricity prices (US$/kWh) N.A. Rate of transmission and distribution losses (%) 15.7
CO2 intensity (kCO2 per US$) 0.24 GHG emission growth rate 2000 – 2013 (%) 2.0
ENERGY PROFILE
Fossil fuel reserves: 111 Mtoe
Total primary energy supply composition
Diversity of electricity generation
0% 20% 40% 60% 80% 100%
Coal
Oil
Naturalgas
Conventionalthermal
Nuclear
Hydro
Otherrenewables

WORLD ENERGY COUNCIL | ENERGY TRILEMMA INDEX | 2017
126
TURKEY
TRILEMMA INDEX RANKINGS AND BALANCE SCORE
RANK 2015 2016 2017 Trend Score
50 Overall rank and
balance score 45 46 50 u CBB
Energy performance
Energy security 67 69 82 u C
SCORE Energy equity 43 45 52 u B
CBB
Environmental sustainability
56 53 55 u B
Contextual performance
53 57 52 u
TRENDS AND OUTLOOK
• Turkey drops 4 places this year to rank 50. Good scores are achieved in the energy equity and environmental
sustainability dimensions, but a drop in energy security, results in a balance score of CBB.
• Turkey must accommodate a fast-growing demand for energy. The country broke its all-time energy consumption
record on July 3rd
2017 with approximately 928 million kWh, and enormous investment volumes are required to meet
the country’s continuing growth. At the moment, 25% of primary energy consumption and 49% of power generation –
a record high – is met by domestic resources.
• Several initiatives are underway to improve energy security in the country: 1) A competitive tender of 1000 MW solar
was completed in March, with the Kalyon-Hanwha Group consortium submitting the lowest offer of $6.99 cents/kWh.
It is one of the largest single solar projects in the world; 2) 1387 MW wind power generation was added to installed
capacity in 2016, followed by a massive US$1 billion tender in August 2017 for 1000 MW, setting a new world record
feed-in tariff price of $3.48 cents/kWh. An average of 1.5 million tons of CO2 emissions will be reduced; 3)
Geothermal power has achieved a 70% growth in the past eight months. This puts Turkey at 4th place globally in
terms of geothermal electricity generation; 4) The Trans-Anatolian Natural Gas Pipeline (TANAP), which began
construction in 2015, is expected to make its first contribution to the Turkish grid by June 2018. Export to Europe is
expected in 2020 once the construction of the Trans Adriatic Pipeline (TAP) is completed; 5) TurkStream Natural Gas
Pipeline (TANAP) is expected to become operational by the end of 2019. The Intergovernmental Agreement of the
project was signed during WEC2016; 6) Construction of Turkey’s first nuclear power plant, Akkuyu, is underway with
an additional one planned in Sinop. When completed, both reactors are expected to make up a 10% share of total
electricity supply.
KEY METRICS
Industrial sector (% of GDP) 31.7 GDP per capita, PPP US$ (GDP Group) 24,244 (III)
Energy intensity (koe per US$) 0.08 Diversity of international energy suppliers High (HHI = 1,176)
Population with access to electricity (%) 100 Access to clean cooking in rural | urban areas (%) 100 | 94
Household electricity prices (US$/kWh) 0.10 Rate of transmission and distribution losses (%) 13.8
CO2 intensity (kCO2 per US$) 0.29 GHG emission growth rate 2000 – 2013 (%) 2.8
ENERGY PROFILE
Fossil fuel reserves: 6,123 Mtoe
Total primary energy supply composition
Diversity of electricity generation
0% 20% 40% 60% 80% 100%
Coal
Oil
Naturalgas
Conventionalthermal
Nuclear
Hydro
Otherrenewables

MONITORING NATIONAL ENERGY SYSTEMS
127
UKRAINE
TRILEMMA INDEX RANKINGS AND BALANCE SCORE
RANK 2015 2016 2017 Trend Score
48 Overall rank and
balance score 65 63 48 u ABD
Energy performance
Energy security 28 28 11 u A
SCORE Energy equity 60 61 63 u B
ABD Environmental
sustainability 111 108 102 u D
Contextual performance 95 97 87 u
TRENDS AND OUTLOOK
• Ukraine jumps 15 places this year to rank 48. An excellent improvement in energy security this year, where it is ranked 11th globally, combined with a good score in energy equity result in letter grades of A and B, respectively. A low score in the environmental sustainability dimension results in an imbalanced trilemma profile of ABD.
• Ukraine’s energy sector faces great challenges, from a high dependence on expensive fossil fuel imports such as oil and gas, to inefficient infrastructure and markets. Recent energy policy developments to address those challenges include the decision to replace Russian gas with Ukrainian coal, increase oil and gas production (for example, from the Black Sea shelf), and develop nuclear power capacity.
• Furthermore, there is a need to strengthen energy efficiency policies, make full use of the country’s renewable energy potential such as biogas and municipal waste for heat and power generation, and lower gas consumption in the district heating sector to ensure heat supply and lower energy bills.
KEY METRICS
Industrial sector (% of GDP) 25.6 GDP per capita, PPP US$ (GDP Group) 8,272 (I)
Energy intensity (koe per US$) 0.18 Diversity of international energy suppliers Medium (HHI = 1,690)
Population with access to electricity (%) 100 Access to clean cooking in rural | urban areas (%) 89 | 99
Household electricity prices (US$/kWh) N.A. Rate of transmission and distribution losses (%) 12.3
CO2 intensity (kCO2 per US$) 0.65 GHG emission growth rate 2000 – 2013 (%) -0.6
ENERGY PROFILE
Fossil fuel reserves: 24,231 Mtoe
Total primary energy supply composition
Diversity of electricity generation 0% 20% 40% 60% 80% 100%
Coal
Oil
Naturalgas
Conventionalthermal
Nuclear
Hydro
Otherrenewables
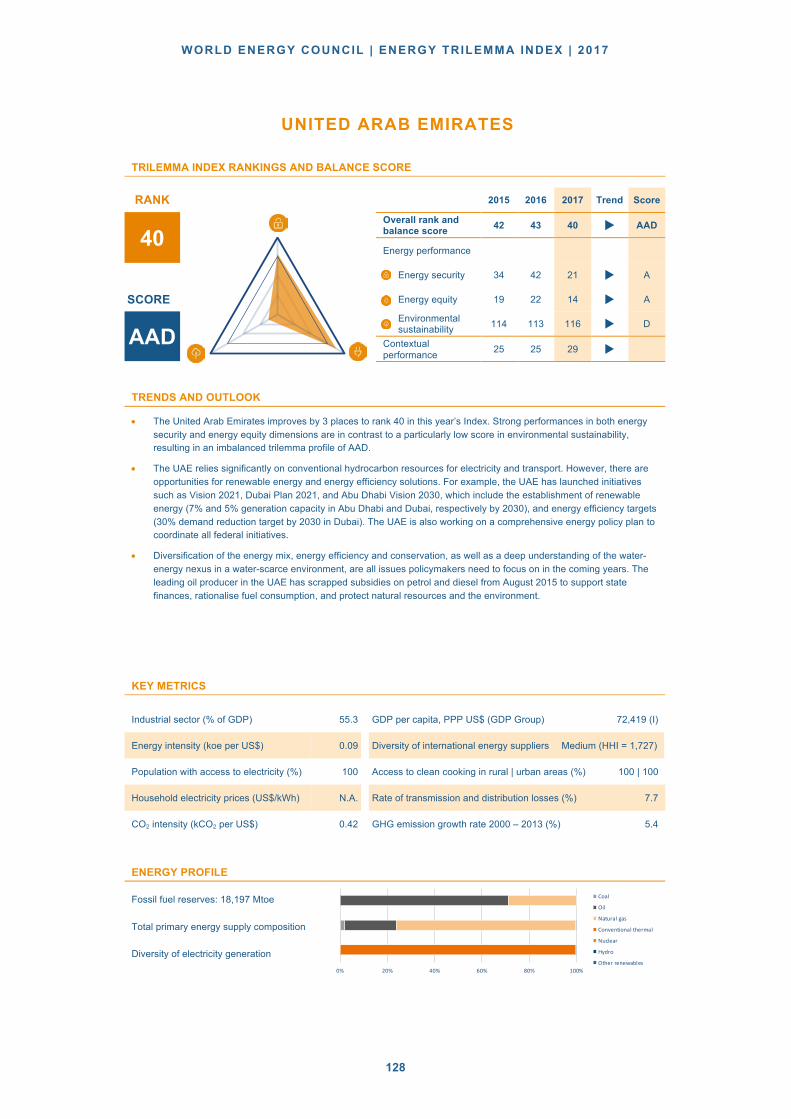
WORLD ENERGY COUNCIL | ENERGY TRILEMMA INDEX | 2017
128
UNITED ARAB EMIRATES
TRILEMMA INDEX RANKINGS AND BALANCE SCORE
RANK 2015 2016 2017 Trend Score
40 Overall rank and
balance score 42 43 40 u AAD
Energy performance
Energy security 34 42 21 u A
SCORE Energy equity 19 22 14 u A
AAD Environmental
sustainability 114 113 116 u D
Contextual performance 25 25 29 u
TRENDS AND OUTLOOK
• The United Arab Emirates improves by 3 places to rank 40 in this year’s Index. Strong performances in both energy security and energy equity dimensions are in contrast to a particularly low score in environmental sustainability, resulting in an imbalanced trilemma profile of AAD.
• The UAE relies significantly on conventional hydrocarbon resources for electricity and transport. However, there are opportunities for renewable energy and energy efficiency solutions. For example, the UAE has launched initiatives such as Vision 2021, Dubai Plan 2021, and Abu Dhabi Vision 2030, which include the establishment of renewable energy (7% and 5% generation capacity in Abu Dhabi and Dubai, respectively by 2030), and energy efficiency targets (30% demand reduction target by 2030 in Dubai). The UAE is also working on a comprehensive energy policy plan to coordinate all federal initiatives.
• Diversification of the energy mix, energy efficiency and conservation, as well as a deep understanding of the water-energy nexus in a water-scarce environment, are all issues policymakers need to focus on in the coming years. The leading oil producer in the UAE has scrapped subsidies on petrol and diesel from August 2015 to support state finances, rationalise fuel consumption, and protect natural resources and the environment.
KEY METRICS
Industrial sector (% of GDP) 55.3 GDP per capita, PPP US$ (GDP Group) 72,419 (I)
Energy intensity (koe per US$) 0.09 Diversity of international energy suppliers Medium (HHI = 1,727)
Population with access to electricity (%) 100 Access to clean cooking in rural | urban areas (%) 100 | 100
Household electricity prices (US$/kWh) N.A. Rate of transmission and distribution losses (%) 7.7
CO2 intensity (kCO2 per US$) 0.42 GHG emission growth rate 2000 – 2013 (%) 5.4
ENERGY PROFILE
Fossil fuel reserves: 18,197 Mtoe
Total primary energy supply composition
Diversity of electricity generation 0% 20% 40% 60% 80% 100%
Coal
Oil
Naturalgas
Conventionalthermal
Nuclear
Hydro
Otherrenewables

MONITORING NATIONAL ENERGY SYSTEMS
129
UNITED KINGDOM
TRILEMMA INDEX RANKINGS AND BALANCE SCORE
RANK 2015 2016 2017 Trend Score
5 Overall rank and
balance score 10 11 5 u AAA
Energy performance
Energy security 38 32 26 p A
SCORE Energy equity 7 8 15 u A
AAA
Environmental sustainability
16 15 9 u A
Contextual performance
13 13 7 u
TRENDS AND OUTLOOK
• The United Kingdom improves by 6 places this year to rank in the top 10 list once again. Excellent performance in all
trilemma dimensions results in a very well-balanced profile of AAA.
• Challenges in securing energy supply, however, remain. Overall domestic production of fossil fuels continues to
decline, and the plans to expand production of unconventional oil and gas still have to overcome technical challenges
and gain public support. In the power sector, an ageing nuclear plant is being decommissioned, while planned new
nuclear was approved by the new government in mid-2016. In addition, the planned closure of all coal plants under
UK legislation by 2025 (as well as existing EU regulation driving closure at present) is resulting in a decline in
electricity generation from coal, and was at a record low in the first quarter of 2016. Electricity generation from
renewables is showing steady increase year-on-year, but does not match the decline in generation from conventional
sources.
• Regarding energy affordability, policy changes continue to impact. In June 2016, the UK Competition and Markets
Authority published its final review into the supply and acquisition of energy in the UK and, while acknowledging that
the sector has made significant progress in reducing emissions and ensuring security of supply, concerns were raised
in relation to energy affordability. Proposed regulatory changes in light of the report are yet to come into effect. In
addition, the consequences of the UK’s decision to leave the EU and subsequent changes in government leadership
and restructuring of government departments are yet to be realised.
KEY METRICS
Industrial sector (% of GDP) 19.4 GDP per capita, PPP US$ (GDP Group) 42,609 (I)
Energy intensity (koe per US$) 0.05 Diversity of international energy suppliers High (HHI = 1,308)
Population with access to electricity (%) 100 Access to clean cooking in rural | urban areas (%) 100 | 100
Household electricity prices (US$/kWh) 0.24 Rate of transmission and distribution losses (%) 8.0
CO2 intensity (kCO2 per US$) 0.17 GHG emission growth rate 2000 – 2013 (%) -1.4
ENERGY PROFILE
Fossil fuel reserves: 740 Mtoe
Total primary energy supply composition
Diversity of electricity generation
0% 20% 40% 60% 80% 100%
Coal
Oil
Naturalgas
Conventionalthermal
Nuclear
Hydro
Otherrenewables

WORLD ENERGY COUNCIL | ENERGY TRILEMMA INDEX | 2017
130
UNITED STATES
TRILEMMA INDEX RANKINGS AND BALANCE SCORE
RANK 2015 2016 2017 Trend Score
15 Overall rank and
balance score 22 14 15 u AAC
Energy performance
Energy security 11 4 8 u A
SCORE Energy equity 15 13 24 u A
AAC
Environmental sustainability
80 73 75 u C
Contextual performance
19 18 14 u
TRENDS AND OUTLOOK
• The United States drops by 1 place this year to rank 15. Whilst exhibiting strong performances in both energy
security, where it ranks 8th globally, and energy equity, this is offset by a relatively weak score in terms of
environmental sustainability. This results in a balance score of AAC.
• Due to advances in horizontal drilling and hydraulic fracturing, shale gas production has become economically viable
in recent years. The Energy Information Administration (EIA) estimates that the country has more than 1,744 trn cubic
feet (tcf) of technically recoverable natural gas, including 211 tcf of proved reserves (the discovered, economically
recoverable fraction of the original gas-in-place). Production of shale gas is expected to increase from a 2007 US total
of 1.4 tcf to 4.8 tcf in 2020. The significant increases in domestic oil and gas production will greatly reduce oil imports
over the next 10 years, and lead to increased exports of refined products and possibly natural gas.
• The recent decision by the Trump administration to withdraw from the Paris Agreement has added uncertainty to the
US energy sector. Nevertheless, commitment among Americans remains high in supporting renewables
development, with some cities pledging to stick by earlier commitments to target emissions decreases and increase
shares of renewables.
KEY METRICS
Industrial sector (% of GDP) 20.0 GDP per capita, PPP US$ (GDP Group) 57,467 (II)
Energy intensity (koe per US$) 0.09 Diversity of international energy suppliers Medium (HHI = 1,675)
Population with access to electricity (%) 100 Access to clean cooking in rural | urban areas (%) 100 | 100
Household electricity prices (US$/kWh) 0.21 Rate of transmission and distribution losses (%) 6.2
CO2 intensity (kCO2 per US$) 0.34 GHG emission growth rate 2000 – 2013 (%) -0.8
ENERGY PROFILE
Fossil fuel reserves: 180,609 Mtoe
Total primary energy supply composition
Diversity of electricity generation
0% 20% 40% 60% 80% 100%
Coal
Oil
Naturalgas
Conventionalthermal
Nuclear
Hydro
Otherrenewables

MONITORING NATIONAL ENERGY SYSTEMS
131
URUGUAY
TRILEMMA INDEX RANKINGS AND BALANCE SCORE
RANK 2015 2016 2017 Trend Score
35 Overall rank and
balance score 27 27 35 u CBA
Energy performance
Energy security 29 40 70 u C
SCORE Energy equity 51 51 57 u B
CBA
Environmental sustainability
14 16 10 u A
Contextual performance
45 44 43 u
TRENDS AND OUTLOOK
• A drop of 8 places sees Uruguay rank 35 in this year’s Index. Whilst a drop in energy security results in a change
from B to C, the country excels in environmental sustainability, ranking 10th globally. This results in a balance score of
CBA.
• The country has no proven oil, natural gas or coal reserves, but a high availability of renewable energy sources. By
carefully choosing renewable energy sources and technologies such as hydropower, wind energy, biomass
cogeneration, and biofuels, it was possible, without subsidies, to reach a 57% share of renewable energy in the 2015
energy mix (up from 37% in 2005). At the end of 2015, Uruguay had 26 wind farms (857 MW installed capacity), of
which 19 were installed in the past two years. This represents a 15% share of wind energy in the electricity generation
mix. In addition, during 2015, the country increased the use of biomass waste as an energy source by 30%. This,
among other measures, contributes towards the country’s strong energy trilemma performance.
• The country is evaluating the construction of a regasification LNG plant and 70% of the Uruguayan offshore area is
being explored for natural gas and oil. Between 2010 and 2015 US$7bn has been invested in the energy sector
(15% of annual GDP). As a result of this process, during the past two years, Uruguay has moved from being an
energy importer to being an energy exporter. Moreover, since 2015 Uruguay did not have to import electricity.
KEY METRICS
Industrial sector (% of GDP) 28.9 GDP per capita, PPP US$ (GDP Group) 21,625 (I)
Energy intensity (koe per US$) 0.07 Diversity of international energy suppliers Medium (HHI = 2,191)
Population with access to electricity (%) 100 Access to clean cooking in rural | urban areas (%) 81 | 100
Household electricity prices (US$/kWh) N.A. Rate of transmission and distribution losses (%) 12.4
CO2 intensity (kCO2 per US$) 0.10 GHG emission growth rate 2000 – 2013 (%) 2.5
ENERGY PROFILE
Fossil fuel reserves: 0 Mtoe
Total primary energy supply composition
Diversity of electricity generation
0% 20% 40% 60% 80% 100%
Coal
Oil
Naturalgas
Conventionalthermal
Nuclear
Hydro
Otherrenewables
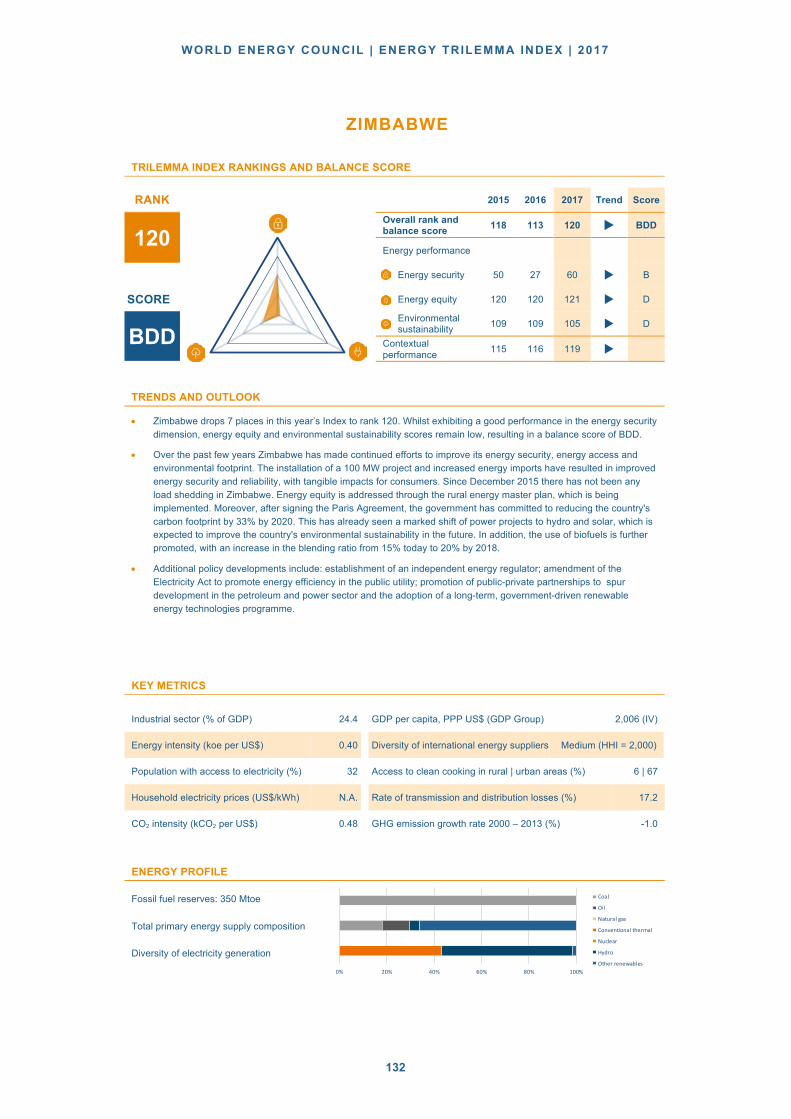
WORLD ENERGY COUNCIL | ENERGY TRILEMMA INDEX | 2017
132
ZIMBABWE
TRILEMMA INDEX RANKINGS AND BALANCE SCORE
RANK 2015 2016 2017 Trend Score
120 Overall rank and
balance score 118 113 120 u BDD
Energy performance
Energy security 50 27 60 u B
SCORE Energy equity 120 120 121 u D
BDD
Environmental
sustainability 109 109 105 u D
Contextual
performance 115 116 119 u
TRENDS AND OUTLOOK
• Zimbabwe drops 7 places in this year’s Index to rank 120. Whilst exhibiting a good performance in the energy security
dimension, energy equity and environmental sustainability scores remain low, resulting in a balance score of BDD.
• Over the past few years Zimbabwe has made continued efforts to improve its energy security, energy access and
environmental footprint. The installation of a 100 MW project and increased energy imports have resulted in improved
energy security and reliability, with tangible impacts for consumers. Since December 2015 there has not been any
load shedding in Zimbabwe. Energy equity is addressed through the rural energy master plan, which is being
implemented. Moreover, after signing the Paris Agreement, the government has committed to reducing the country's
carbon footprint by 33% by 2020. This has already seen a marked shift of power projects to hydro and solar, which is
expected to improve the country's environmental sustainability in the future. In addition, the use of biofuels is further
promoted, with an increase in the blending ratio from 15% today to 20% by 2018.
• Additional policy developments include: establishment of an independent energy regulator; amendment of the
Electricity Act to promote energy efficiency in the public utility; promotion of public-private partnerships to spur
development in the petroleum and power sector and the adoption of a long-term, government-driven renewable
energy technologies programme.
KEY METRICS
Industrial sector (% of GDP) 24.4 GDP per capita, PPP US$ (GDP Group) 2,006 (IV)
Energy intensity (koe per US$) 0.40 Diversity of international energy suppliers Medium (HHI = 2,000)
Population with access to electricity (%) 32 Access to clean cooking in rural | urban areas (%) 6 | 67
Household electricity prices (US$/kWh) N.A. Rate of transmission and distribution losses (%) 17.2
CO2 intensity (kCO2 per US$) 0.48 GHG emission growth rate 2000 – 2013 (%) -1.0
ENERGY PROFILE
Fossil fuel reserves: 350 Mtoe
Total primary energy supply composition
Diversity of electricity generation
0% 20% 40% 60% 80% 100%
Coal
Oil
Naturalgas
Conventionalthermal
Nuclear
Hydro
Otherrenewables

MONITORING NATIONAL ENERGY SYSTEMS
133
Frequently asked questions
WORLD ENERGY COUNCIL | ENERGY TRILEMMA INDEX | 2017
134
A. GENERAL INTRODUCTION WHAT IS THE WORLD ENERGY TRILEMMA INDEX? The World Energy Trilemma Index is a quantification of the Energy Trilemma, which is defined by the World Energy Council as the triple challenge of providing secure, affordable, and environmentally sustainable energy. Balancing these trade-offs is challenging but is also the foundation for the prosperity and competitiveness of countries.
The World Energy Trilemma Index looks at indicators of energy performance across the three dimensions as well as the country’s context.
1. Energy security measures the ability to meet current and future energy demand.
2. Energy equity measures the ability to provide access to reliable and affordable energy for domestic
and commercial use. 3. Environmental sustainability measures the ability to mitigate natural resource depletion and
environmental degradation.
Country context focuses on elements that enable countries to effectively develop and implement energy policy and achieve energy goals. This component examines factors such as the capacity to support a coherent and predictable policy framework, a stable regulatory environment, and overall attractiveness of the country to investors.
The Energy Trilemma Index is prepared annually by the World Energy Council in partnership with global consultancy Oliver Wyman, along with the Global Risk Centre of its parent Marsh & McLennan Companies since 2010.
WHAT IS THE GOAL OF THE INDEX? The goal of the Index is to provide insights into a country’s relative energy performance with regards to energy security, energy equity and environmental sustainability. In doing so, the Index highlights a country’s challenges in balancing the energy ’Trilemma’ and opportunities for improvements in meeting energy goals now and in the future. The Index thus informs policy makers, energy leaders, and the investment and financial sector.
WHAT IS THE SCOPE OF THE INDEX? The Index includes 130 countries, 94 of which are member countries of the World Energy Council. However, in 2017, rankings have only been produced for 125 countries due to data limitations. Countries that are tracked but not ranked are: Chinese Taipei, Libya, Barbados, Syria (Arab Republic) and Yemen.
The Index aggregates 72 datasets into 35 indicators to create a snapshot energy profile for each country.
WHAT TIME PERIOD DOES THE 2017 INDEX CAPTURE? The 2017 Index generally reflects data from 2014-2016, although selected datasets may date from earlier if more recent data is not available. Recent world events that could affect the Index’s outcomes may therefore not be fully captured (e.g., the sharp drop in oil prices through 2015 or the geopolitical unrest in the Middle East).

MONITORING NATIONAL ENERGY SYSTEMS
135
To address this limitation, the World Energy Trilemma Index Report identifies a ’watch list’ that seeks to identify countries that are likely to experience significant changes – positive or negative – in their trilemma Index performance in the near future. The goal of the watch list is to reflect developments in a country’s energy sector that are currently ongoing but not yet captured in the data that is available.
HOW ARE THE INDEX RESULTS PRESENTED? Countries are provided with an overall Index rank (1-125), as well as rankings for each dimension of energy security, energy equity and energy sustainability. The top performing country is awarded a #1 ranking, while the lowest ranking country is assigned rank # 125.
In addition, each country is also given a ‘balance score’ that allocates a ‘letter grade’ to a country’s ranking in each dimension and countries are provided with a three-letter score. The scores are calculated by splitting the normalised results in each dimension into four groups (A, B, C, D). High performance across all three dimensions is s awarded ’AAA’. Letter scores such as BBC, CCD, highlight the balance or imbalance across a country’s energy performance. An imbalance in energy performance suggests current or future challenge in the country’s energy policy. Each letter reflects one dimension of the Energy Trilemma: the first letter refers to energy security; the second letter to energy equity and the third letter to environmental sustainability.
Index results and analysis are also complemented by regional overviews as well as individual country profiles of World Energy Council member countries only. The country profiles provide trends in energy trilemma performance as well as performance on specific indicators assessed in the overall Index.
WHERE CAN I FIND THE FULL RESULTS? The results are published once a year. Results can be downloaded for free from the Council’s webpage.
Index data is available at: https://www.worldenergy.org/data/.
The full report with country rankings and profiles is available at: https://www.worldenergy.org/publications/
As part of the world energy Trilemma work programme of the World Energy Council, an analysis report is published once a year, which draws on the findings of the Index and puts these into regional, economic and energy trilemma profile context. The 2017 World Energy Trilemma report, TITLE, can be found at: https://www.worldenergy.org/work-programme/.
WORLD ENERGY COUNCIL | ENERGY TRILEMMA INDEX | 2017
136
B. INDEX RANKINGS & POLICIES
WHAT DOES THE INDEX TELL US ABOUT THE COUNTRY’S ENERGY PERFORMANCE AND POLICY? The Index shows how well each country is performing on the Energy Trilemma and in effect, captures the aggregate effect of energy policies applied over time. Because the Index shows aggregate policy effects, it does not identify the effectiveness of a particular policy; each policy interacts with a unique set of policies specific to that country over different periods. Nonetheless, the Index broadly measures the aggregate outcome of country policies, such as the level of country CO2 emissions or the overall use of electricity per capita relative to other countries.
It is important to note that the Index is a comparative ranking and shows the performance of a country in the context of the relative to the performance of all the countries. To move up in the Index ranking requires a country to improve its performance relative to peer countries. Thus, if a country’s energy performance remains stable but those of other countries improve, a country will decrease in rankings.
WHAT WILL AFFECT A COUNTRY’S RANKING IN THE INDEX? The Index is weighted in favour of energy performance versus contextual performance. Therefore, changes in energy performance will have a greater effect on a country’s ranking than contextual dimensions.
A country’s overall position in the Index is affected by the degree of balance between the three energy performance dimensions. Given the equal weighting of these dimensions, countries that exhibit broadly similar and relatively higher scores in these will typically rank higher on the Index and have a higher letter grade.
Few countries manage to perform well across all three energy dimensions. Currently, many countries achieve stronger performance in two dimensions, suggesting trade-offs between energy dimensions. For example, some energy exporting countries may lead in social equity (highly affordable and accessible energy) and also in energy security (high energy exports) but obtain lower scores in environmental impact mitigation (due to intense energy use). A trade-off between strong affordability and low energy intensity becomes evident as low prices limit incentives to reduce energy consumption and to engage in energy efficiency programs.
HOW CAN A COUNTRY MOVE UP OR DOWN THE INDEX? Country position can change due to changes in a county’s performance or due to the relative changes in other countries’ performances. For example, a country with broadly unchanged data could move lower in Index rankings if other countries make improvements.
For example, a country’s ranking on the indicator ’Diversity of electricity production’ will depend on how its diversity (e.g., hydroelectric, nuclear, wind, conventional thermal) ranks against other countries. Put differently, a country’s underlying indicator data can remain the same year-on-year but its Index position can move due to changes within other countries. Thus, performance stagnation could impact the Index position in the same way as retrograde motion of the energy performance data.

MONITORING NATIONAL ENERGY SYSTEMS
137
WHAT POLICIES WILL AFFECT A COUNTRY’S POSITION ON THE INDEX? The Index aggregates many different data points and it is thus often very difficult to pinpoint how any single policy affects a country’s performance against a particular indicator or in an overall dimension. For example, ’GHG emissions’ could change due to multiple policies implemented over time aimed at reducing GHG and CO2 emissions. Technological factors within specific industries (e.g., changes in automotive technology) can also have an impact, and are not directly measured by the Index.
Those factors noted, countries which implement a range of clear and predictable energy policies resulting in an overall framework that addresses the three aspects of energy trilemma typically rank higher in the Index.
C. INDEX METHODOLOGY WHY WAS THE INDEX METHODOLOGY REVISED IN 2016? The Index was launched in 2010 and the methodology was revised in 2016. There were three broad goals in revising the Index methodology:
1. To broaden the focus of indicators to provide a more comprehensive view of energy performance:
• The earlier version of the Index had a heavy focus on the electricity sector. Model updates
allowed the focus to expand to the wider energy sector (including renewables and nuclear), primarily by including additional indicators for diversity of primary energy supply as well as
diversity of electricity generation.
• The understanding of energy equity was also enhanced, primarily by broadening the scope of energy access measures (clean cooking) and, including measures for the quality of supply and
affordability of a wider number of energy resources (natural gas and diesel).
2. To enable a forward-looking view of energy performance by capturing resilience of the energy system:
• Countries must increasingly consider the resilience of their energy system to emerging risks
(including extreme weather, economic shocks, or geopolitical factors) as a critical aspect of energy security. The Index updates include measures specifically aimed at assessing the resilience of a
country’s energy system; this is assessed by both utilizing a broader understanding of energy
storage and also measuring the preparedness (human factor) of a country – that is the ability of a country to prepare for and repair energy infrastructure following shocks.
3. To try to reduce a potential bias to wealthier countries:
• In the earlier version of the Index, country context accounted for 25% of overall Index performance; this has been reduced to 10% in the current Index. While recognising the
importance of country context to energy performance, in many instances, there are few
energy-specific indicators available (e.g., foreign direct investment and technology transfer indicators relate to all sectors and not just energy) and the indicators thus may not effectively
WORLD ENERGY COUNCIL | ENERGY TRILEMMA INDEX | 2017
138
reveal energy policymaking performance. To address this data challenge and not unduly
favour wealthier countries, the context weighting has been reduced.
HOW ARE INDICATORS SELECTED FOR THE INDEX? Each indicator category is composed of a set of carefully selected indicators that meet the selection criteria and are highly relevant to the World Energy Council’s understanding of the Energy Trilemma.
It was also critical that the indicators could be consistently and readily derived from reputable sources and cover a high proportion of member countries; some potential indicators were excluded from the Index due to low Council’s country coverage. Indicator data sources include the International Energy Agency, the U.S. Energy Information Administration, the World Bank, the International Monetary Fund, the World Economic Forum, and others.
Data selection criteria included:
• Country coverage / data availability and timeliness;
• Comparability of data: Data to calculate an indicator is derived from as single and common a
unique source as possible; • Relevance: Indicators are chosen or developed to provide insight into country situations;
• Distinctiveness and balance: Each indicator focuses on a different aspect of the issue being
explored; • Contextual sensitivity: Indicators capture different country situations (e.g., wealth, size);
• Robustness: Indicators are captured from reputable sources with the most current information
available; • Balance: Indicators within each dimension (and dimensions across the Index) exhibit coverage
of different issues.
WHAT IS THE 2017 INDEX BASED ON? Eachcountry’soverallIndexrankingisbasedonunderlyingindicatorsacross13categoriesin4dimensions–someofwhicharesupportedbymultipledatasets.Forexample,“Affordabilityandcompetitiveness”ismeasuredusingthreeindicators,eachofwhichissupportedbymultipledatasets.Figure1providesanoverviewofunderlyingindicatorsandweightingregimes.

MONITORING NATIONAL ENERGY SYSTEMS
139
FIGURE 1: 2017 ENERGY TRILEMMA INDEX STRUCTURE AND WEIGHTING
ARE MORE DETAILS ON THE METHODOLOGY AVAILABLE? Full details on the Index methodology, including the sources of all datasets and how each indicator is calculated and treated, are provided in the comprehensive ’Methodology’ document available at: www.worldenergy.org.
WHY ARE GRADES ASSIGNED USING ACTUAL DISTRIBUTION? Assigning grades using the actual distribution is more representative of the data. It presents the absolute difference between the countries’ performance in the different dimensions and avoids artificially dividing countries into different categories with a fixed number of countries within each category (e.g. AAA ranking), as would occur with an even distribution approach.

WORLD ENERGY COUNCIL | ENERGY TRILEMMA INDEX | 2017
140
WHY ARE GATE CRITERIA USED? Gatecriteriawereintroducedtoaddressheavilyskeweddata,suchasaccesstoenergy–therearealargenumberofcountriesthathavea100%accessrate.Agatecriterionhelpsgroupsimilarcountries(e.g.,thosewitha100%accessrate)andtherebypreventstheskeweddatafromexcessivelyinfluencingoutcomes.
WHICH (SUB)-INDICATORS ARE SUBJECT TO A GATE CRITERION? The following indicators and sub-indicators are subject to a gate criterion:
Diversity of primary energy supply:
1. Import dependence;
2. Energy storage (oil stocks and infrastructure); 3. Access to electricity;
4. Access to clean cooking;
5. Number of patents issued by residents.
Please refer to full Index Methodology document for a detailed explanation of the gate criteria and the rationale behind the gate criteria for each of the sub-indicators.
WHY IS MISSING DATA REPLACED BY THE GROUP MEAN? The group mean is more representative of the specific countries in terms of economic development, social situation, etc. This representativeness renders missing values less likely to distort country outcomes.
The groups are established based (jointly) on economic groups and geographic region
• GDP Group I: GDP per capita greater than USD 33,500;
• GDP Group II: GDP per capita between USD14,300 and USD 33,500;
• GDP Group III: GDP per capita between USD 6,000 and USD 14,300; • GDP Group IV: GDP per capita lower than USD 6,000.
The indicator mean is the average of a specific indicator across all countries. For example, the indicator mean would average CO2 emissions data between the United States and South Sudan, which have very different figures.
Using group means ensures that, for example, CO2 emissions data would be averaged between South Sudan and countries with a similar GDP and geographic location, which could be more reflective of the economy and energy profile of South Sudan.
WHAT ARE THE LIMITATIONS OF THE INDEX? • The Index cannot capture real-time energy trilemma performance due to the challenges of
capturing large volumes of reliable data for a wide range of countries.
• The Index cannot isolate the impact of a particular single policy. • The Index uses nearly 100 data sets. In a number of instances data for specific countries is not
available (i.e. the data set has missing data), in which case missing data is replaced by the group
mean.

MONITORING NATIONAL ENERGY SYSTEMS
141
WHAT QUESTIONS/ DISCUSSION ARE REVEALED BY THE INDEX? The Index prompts an analysis of statistical groupings of countries to better understand why some are performing better than others. The grouping of countries is sometimes obvious, but other times requires additional analysis to understand. This leads to further dialogue:
• What is the country’s perspective/priority on the ‘right balance’ on the energy trilemma? • How does the country want to achieve its energy trilemma goals?
• What is the role of government policies (national, regional, local) in supporting these energy
goals? • What policies are appropriate to drive energy goals (e.g., raising fuel taxes to encourage energy
efficiency or encouraging greater use of electric cars?). How do these policies need to evolve
over time? • What are the situational and/or contextual barriers the country faces in terms of energy
performance, and how might these barriers be overcome?
• How do situational and contextual barriers differ across countries in different stages of their development? How can emerging countries combine social and economic development with
balancing the energy trilemma?

WORLD ENERGY COUNCIL | ENERGY TRILEMMA INDEX | 2017
142
ACKNOWLEDGEMENTS The project team would like to thank the individuals who informed the project’s approach, supplied information, provided ideas and reviewed drafts. Their support and insight has provided an invaluable contribution to the development and quality of the report.
WORLD ENERGY COUNCIL STUDY GROUP – PRINCIPAL CONTRIBUTORS Philip Lowe (Executive Chair); Hajime Murata (Honorary Chair)
(Note: organised by countries’ alphabetical order)
Maria Eugenia Posleman, Argentina; Ernesto Badaraco, Argentina; Horacio Fernandez, Argentina; Philipp Irschik, Austria; Simonetta Naletto, Belgium; Boris Gorenstin, Brazil; Maria Claudia Grillo, Brazil; Lauro Valdir de Souza, Brazil; Pietro Erber, Brazil; David Collie, Canada; Andrew Pietrewicz, Canada; Dan Boucher, Canada; Jim Crone, Canada; Steve Dorey, Canada; Peter Edwards, China; Gabriel Vizcaino, Colombia; Daniel Diaz Toro, Colombia; Daniel Romero, Colombia; Linda Chimborazo, Ecuador; Ahmed Sami, Egypt; Tawfik F. Azer, Egypt; Mihkel Härm, Estonia; Jourma Routti, Finland; Pirjo Jantunen, Finland; Alain Bucaille, France; Francois Dassa, France; Jean-Michel Trochet, France; Jean-Eudes Moncomble, France; Christian Hoffmann, Germany; Jochen Lorz, Germany; Katharina Klein, Germany; Ulrike Doering, Germany; Stefan Saatmann, Germany; Kwaku Jnr. Kunadu, Ghana; John W. M. Cheng, Hong Kong, China; Joseph Law, Hong Kong, China; Karuna Kalra, India; Pradeep Chaturvedi, India; Sunil Parwani, India; Rupa Devi Singh, India; Mohsen Mazloum Farsibaf, Iran; Mehdi Sadeghi, Iran; Jan Okko Ziegler, Italy; Luca Bragoli, Italy; Mariano Morazzo, Italy; Daniela Di Rosa, Italy; Giuseppe Montesano, Italy; Marco Piredda, Italy; Carlo Stagnaro, Italy; Valeria Palmisano, Italy; Hajime Murata, Japan; Samal Bex, Kazakhstan; Michel-Ange Medlej, Lebanon; Gintaras Adzgauskas, Lithuania; José María Valenzuela, Mexico; Sanae Boujrada, Morocco; Maxwell Muyambo, Namibia; Jenny Lackey, New Zealand; Andrew Millar, New Zealand; John Carnegie, New Zealand; Mahaman Laouan Gaya, Niger; Roseline Kela, Nigeria; Abbas Musa, Nigeria; Michal Smyk, Poland; Dariusz Gulczynski, Poland; Nuno Ribeiro da Silva, Portugal; Anton Vladescu, Romania; Luminita Durau, Romania; Mothana Alodhaib, Saudi Arabia; Yousef Alshammari, Saudi Arabia; Noura Mansouri, Saudi Arabia; Miodrag Mesarovic, Serbia; Charles Mahony, South Africa; Nombeko Mbava, South Africa; Raúl Alejandro Livas Elizondo, Spain; Paul Westin, Sweden; Wolfgang Kweitel, Switzerland; Chawalit Pantaros, Thailand; Cansu Karaca, Turkey; Aylin Çiğdem Köne, Turkey; Ghasaq Yousif Shaheen, United Arab Emirates; Simone Bares, United Kingdom; Susan Lower, United Kingdom; Ashutosh Shastri, United Kingdom; Michael Putra, United Kingdom; Serhat Akmeşe, United States; Cecilia San Roman, Uruguay, Wisdom T Farirai, Zimbabwe
WORLD ENERGY COUNCIL STUDIES COMMITTEE Jean-Marie Dauger, France (Chair); William D'haeseleer, Belgium; Lauro Valdir de Souza, Brazil; Kang Yanbing, China; Jean-Paul Bouttes, France; John W. M. Cheng, Hong Kong; Atul Sobti, India; Gautam Vivek, India; Mehdi Sadeghi, Iran; Nastaran Rahimi, Iran; Alessandro Costa, Italy; Carlo Papa, Italy; Atsushi Noda, Japan; Arturo Vaca, Mexico; Jan Antonczyk, Poland; Dan Ioan Gheorghiu, Romania; Klaus Hammes, Sweden; Jim Doull, United States of America
OLIVER WYMAN / MARSH & MCLENNAN COMPANIES PRINCIPAL CONTRIBUTORS Francois Austin (Global Leader, Energy Practice, Oliver Wyman); James Basden (Partner, Oliver Wyman); Paul Beswick (Partner, Oliver Wyman); Sarojini Davis (Project Manager, Oliver Wyman Labs); Andrew George (Energy and Power Chairman, Marsh); Bernhard Hartmann (Partner, Oliver Wyman); Wolfram Hedrich (Partner, Oliver Wyman); Dustin Hughes (Consultant, Oliver Wyman Labs); Sandro Melis (Partner, Oliver Wyman); Bob Orr
MONITORING NATIONAL ENERGY SYSTEMS
143
(Partner, Oliver Wyman); Saji Sam (Partner, Oliver Wyman); Richard Smith-Bingham (Director, Global Risk Center, Marsh & McLennan Companies); Joerg Staeglich, (Partner, Oliver Wyman); Alex Wittenberg (Executive Director, Global Risk Center, Marsh & McLennan Companies)
PROJECT TEAM Christoph Frei (Secretary General, World Energy Council); Phillip Lowe (Executive Chair, World Energy Council); Jean-Marie Dauger (Chair, Studies Committee, World Energy Council); Sandra Winkler (Director Policies, World Energy Council
AUTHORS / PROJECT MANAGEMENT Lucy Nottingham (Director, Global Risk Center, Marsh & McLennan Companies); Andrea Buser (Manager Trilemma & Issues Monitor, World Energy Council); David Neher; (Consultant, Oliver Wyman); Lingjun Jian (Consultant, Oliver Wyman); Giulia Pasquale (Consultant, Oliver Wyman); Blair Chalmers (Director, Asia Pacific Risk Center, Marsh & McLennan Companies); Jamie Beaven (Intern, World Energy Council); Martin Young (Senior Consultant, World Energy Council)
For our colleague, Wing Yi Kan.

WORLD ENERGY COUNCIL | ENERGY TRILEMMA INDEX | 2017
144
OFFICERS OF THE WORLD ENERGY COUNCIL YOUNGHOON DAVID KIM Chair
JEAN-MARIE DAUGER Co-chair Chair – Studies Committee
IBRAHIM AL-MUHANNA Vice Chair – Special Responsibility Gulf States/Middle East
MATAR AL NEYADI Vice Chair – 2019 Congress, Abu Dhabi
NUER BAIKELI Vice Chair – Asia
KLAUS-DIETER BARBKNECHT Vice Chair – Finance
LEONHARD BIRNBAUM Vice Chair – Europe
OLEG BUDARGIN Vice Chair – Responsibility for Regional Development
JOSÉ DA COSTA CARVALHO NETO Chair – Programme Committee
CLAUDIA CRONENBOLD Vice Chair – Latin America/Caribbean
ROBERT HANF Vice Chair – North America
ELHAM IBRAHIM Vice Chair – Africa
SHIGERU MURAKI Vice Chair – Asia Pacific/South Asia
JOSÉ ANTONIO VARGAS LLERAS Chair – Communications & Strategy Committee
---------------------------------------
CHRISTOPH FREI Secretary General
PATRONS OF THE WORLD ENERGY COUNCIL Accenture Strategy
Electricité de France
ENGIE
GE Power
Hydro-Québec
Korea Electric Power Corp.
Marsh & McLennan Companies
Masdar
Oliver Wyman
PricewaterhouseCoopers
PJSC Rosseti
Rosatom
Siemens AG
Swiss Re Corporate Solutions
Tokyo Electric Power Co.

WORLD ENERGY COUNCIL Algeria
Argentina
Armenia
Austria
Bahrain
Belgium
Bolivia
Botswana
Brazil
Bulgaria
Cameroon
Canada
Chad
Chile
China
Colombia
Congo (Dem. Rep.)
Côte d’Ivoire
Croatia
Cyprus
Czech Republic
Denmark
Dominican Republic
Ecuador
Egypt (Arab Rep.)
Estonia
Ethiopia
Finland
France
Germany
Ghana
Greece
Hong Kong, China
Hungary
Iceland
India
Indonesia
Iran (Islamic Rep.)
Iraq
Ireland
Israel
Italy
Japan
Jordan
Kazakhstan
Kenya
Korea (Rep.)
Latvia
Lebanon
Libya
Lithuania
Luxembourg
Macedonia (FYR)
Malaysia
Mexico
Monaco
Mongolia
Morocco
Namibia
Nepal
Netherlands
New Zealand
Niger
Nigeria
Pakistan
Panama
Paraguay
Peru
Poland
Portugal
Romania
Russian Federation
Saudi Arabia
Senegal
Serbia
Singapore
Slovakia
Slovenia
South Africa
Spain
Sri Lanka
Swaziland
Sweden
Switzerland
Syria (Arab Rep.)
Tanzania
Thailand
Trinidad & Tobago
Tunisia
Turkey
Ukraine
United Arab Emirates
United Kingdom
United States
Uruguay
Yemen
Zimbabwe
62–64 Cornhill
London EC3V 3NH
United Kingdom
T (+44) 20 7734 5996
F (+44) 20 7734 5926
www.worldenergy.org | @WECouncil