Embed Size (px)
Citation preview

Document of
The World Bank
FOR OFFICIAL USE ONLY
FLE COPY
Report No. 4909-IN
STAFF APPRAISAL REPORT
INDIA
BODHGHAT HYDROELECTRIC PROJECT
April 16, 1984
RIuSouth Asia Projects DepartmentPower and Transportation Division
This document has a restricted distribution and may be used by recipients only in the performance oftheir official duties. Its contents may. not otherwise be disclosed without World Bank authorization.
Pub
lic D
iscl
osur
e A
utho
rized
Pub
lic D
iscl
osur
e A
utho
rized
Pub
lic D
iscl
osur
e A
utho
rized
Pub
lic D
iscl
osur
e A
utho
rized
Pub
lic D
iscl
osur
e A
utho
rized
Pub
lic D
iscl
osur
e A
utho
rized
Pub
lic D
iscl
osur
e A
utho
rized
Pub
lic D
iscl
osur
e A
utho
rized

CURRENCY EQUIVALENTS
Currency Unit = Rupee (Rs)Rs 1 = Paise 100Us$ 1 Rs 10.0
Rs 1 US$ 0.10Rs 1 million = US$ 100,000
MEASURES AND EQUIVALENTS
1 Kilometer (km) = 1,000 meters (n) = 0.6214 miles (mi)1 Meter (m) = 39.37 inches (in)L Cubic meter (m3 ) = 1.31 cubic yard (cu yd) = 35.35 cubic feet (cu ft)I Hectare (ha) = 10,000 m2 = 2.471 acres (ac)
1 Kilogram (kg) = 2.2046 pounds (lb)1 Ton (t) = I metric ton = 2,200 lbs1 Kilocalories (kcal) = 3.968 British thermal unit (Btu)1. Kilovolt (kV) = 1,000 volts (V)1. Kilovolt-ampere (kVA) = 1,000 volt-amperes (VA)1. Megawatt (MW) = 1,000 kilowatts (kW) =1 million watts1 Gigawatt hour (GWh) = 1,000,000 kilowatt hours (kWh)
ABBREVIATIONS AND ACRONYMS
CIF - Cost Insurance Freight
CEA - Central ELectricity AuthorityCWC - Central Water CommissionDOE - Department of EnvironmentDRP - Dam Review PanelGOI - Governmnent of IndiaGOMP - Government of Madhya PradeshGSI - Geological Service of IndiaHT - High TensionIBRD - International Bank for Reconstruction and DevelopmentIDA - International Development AssociationLRMC - Long Run Marginal CostMPEB - Madhya Pradesh Electricity BoardN:HPC - National Hydro-Electric Power CorporationNPP - National Power PlanNTPC - National Thermal Power CorporationREC - Rural Electrification CorporationREB - Regional Electricity BoardSEB - State Electricity Board
SOE - Statement of Expenditures
FISCAL YEAR ENDS MARCH 31

FOR OFFICIAL USE ONLY
INDIA
BODHGHAT HYDROELECTRIC PROJECT
STAFF APPRAISAL REPORT
Table of Contents
Page No.
LOAN, CREDIT AND PROJECT SUMMARY ................................. i-iii
I. THE ENERGY SECTOR ......................... 1.................
Energy Resources . ...................................., 1Energy Prospects ....... 2Energy Pricing Policies . 2The Power Subsector. 3Power Supply and Demand . 3Bank Group Operations in the Power Sector. 4Sector Institutions . 5Bank Group Strategy in the Power Sector. 6Power Supply and Demand in the Western Region. 9Supply and Demand of Electricity in Madhya Pradesh .10
II. THE BORROWER, THE IMPLEMENTING AGENCY AND THE BENEFICIARY .. 11
The Borrower ... 11Lending Arrangements . ..... . .11
The Implementing Agency and the Beneficiary . .11Madhya Pradesh State Electricity Board (MPEB) . .11Organization and Management . . .11Staffing ... 12Training ... 12MPEB Accounts ... 12Data Processing Facilities . . .13Audit ... 13Transmission and Distribution Losses . . .13Insurance ... 14Taxes .............................................. . 14
This project was appraised by Messrs. A. Sanchez, Senior Engineer,M. El-Menshawy, Financial Analyst. Mr. Gazoni assisted in the economicappraisal of the project.
This document has a restricted distribution and may be used by recipients only in the performance oftheir official duties. Its contents may not otherwise be disclosed without World Bank authorization.

-ii-
Page No.
III. THE PROJECT ................................................ 15
Background ............................ 15Project Objectives .. 16
Project Description .. 16
Transmission .. 17Project Cost ............................................... 17
Project Financing .. 19Construction Schedule .. 19Project Engineering .. 20
Project Implementation .. 21Procurement .. 22Disbursements .. 24
Water Rights .. 25Land Acquisition and Resettlement . .25
Environmental Aspects .. 26Project Operation .. 26
Project Monitoring .. 27Project Risks .. 27
IV. FINANCIAL ANALYSIS .29
Background to SEBs Finances .. 29
MPEB Financial Performance .. 29Billing and Collection .. 31
MPEB-s Financial Projections . .31
Future Financial Situation .. 32Debt/Equity Situation .. 32
Financial Plan ......................... 33
V. PROJECT JUSTIFICATION AND ECONOMIC ANALYSIS .... ............ 34
Least Cost System Expansion and Project Sizing .... ......... 34
Capacity Optimization ...................................... 35Cost Benefit Analysis ...................................... 36
Justification for Bank Participation ....................... 37
VI. AGREEMENTS AND RECOMMENDATIONS .. 38
Recommendation . .39
- iii-
Page No.
ANNEXES
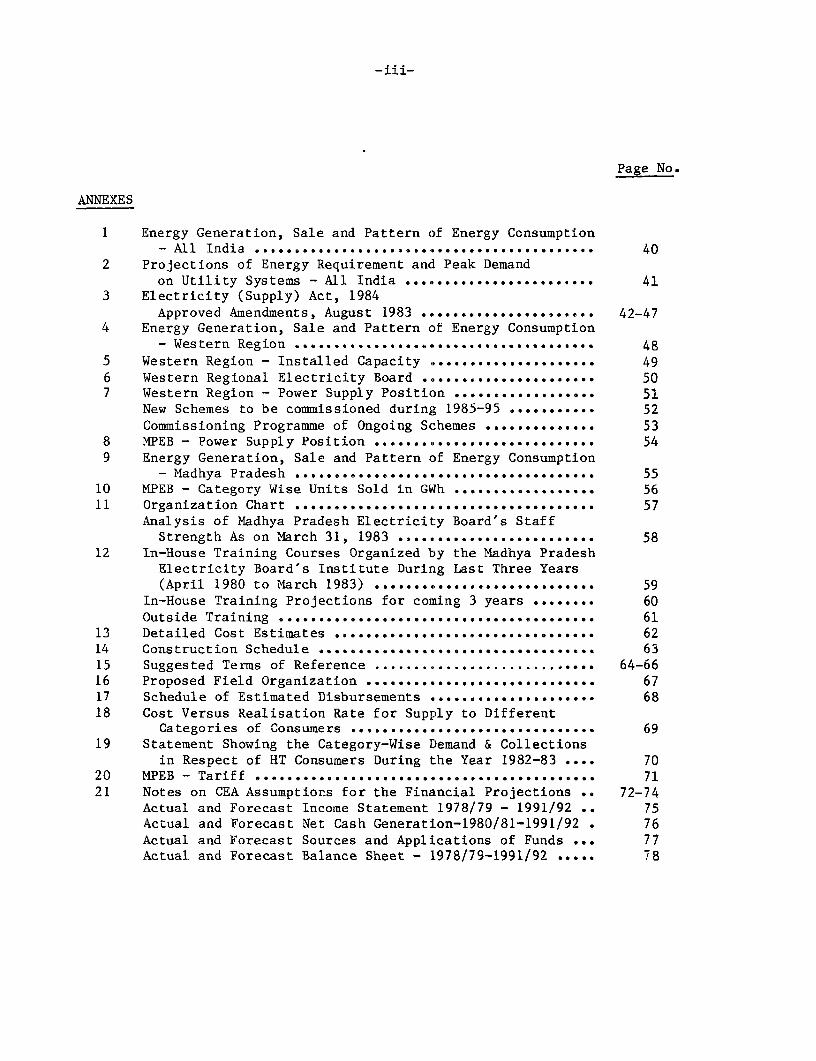
1 Energy Generation, Sale and Pattern of Energy Consumption- All India .so...................es...*o ... oo-o-e. 40
2 Projections of Energy Requirement and Peak Demandon Utility Systems - All India ....................... 41
3 Electricity (Supply) Act, 1984Approved Amendments, August 1983 ...................... 000-6 42-47
4 Energy Generation, Sale and Pattern of Energy Consumption- Western Region ......... .... ... ....... . ... ..- .... * * * 48
5 Western Region - Installed Capacity .................... 496 Western Regional Electricity Board ... se.............. 507 Western Region - Power Supply Position ................. 51
New Schemes to be commissioned during 1985-95 e.......... 52Commissioning Programme of Ongoing Schemes ...-...... . 53
8 MPEB - Power Supply Position ............... ,.......... o.... 549 Energy Generation, Sale and Pattern of Energy Consumption
- Madhya Pradesh .............................. 5510 MPEB - Category Wise Units Sold in GWh .................. 5611 Organization Chart 57
Analysis of Madhya Pradesh Electricity Board's StaffStrength As on March 31, 1983 ......... o.....58
12 In-House Training Courses Organized by the Madhya PradeshElectricity Board's Institute During Last Three Years(April 1980 to March 1983) ............................ 59
In-House Training Projections for coming 3 years ....... 60Outside Training 6...... 0.*... .....- *.0*000*****. 61
13 Detailed Cost Estimates ............ ................. 6214 Construction Schedule 6315 Suggested Terms of Reference ..... ....................... 64-6616 Proposed Field Organization 6717 Schedule of Estimated Disbursements .. *........6818 Cost Versus Realisation Rate for Supply to Different
Categories of Consumers .. o ... . .. .... . ..... 6919 Statement Showing the Category-Wise Demand & Collections
in Respect of HT Consumers During the Year 1982-83 .... 7020 MPEB - Tariff ............ . .... 7121 Notes on CEA Assumptions for the Financial Projections so 72-74
Actual and Forecast Income Statement 1978/79 - 1991/92 75Actual and Forecast Net Cash Generation-1980/81-1991/92 . 76Actual and Forecast Sources and Applications of Funds .. o 77Actual and Forecast Balance Sheet - 1978/79-1991/92 ..... 78
-iv-
Page No.
Annex
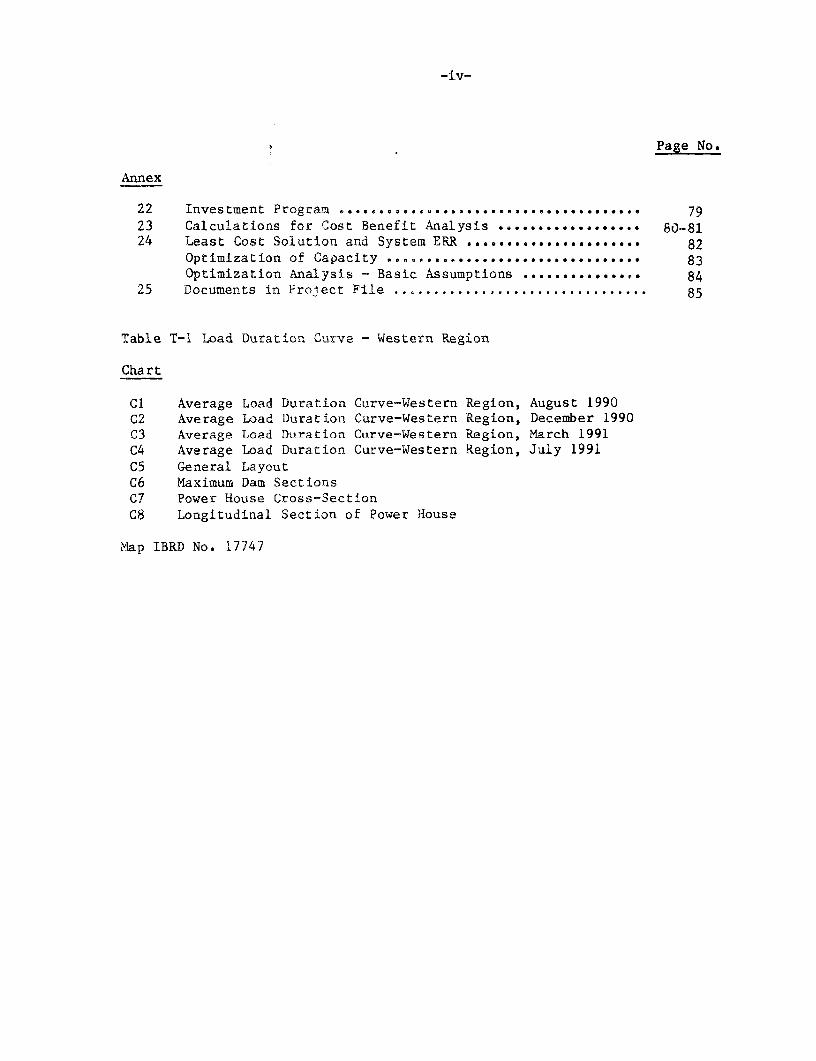
22 Investment Program ...*.... o..* ..*.***............. 7923 Calculations for Cost Benefit Analysis *......... 80--8124 Least Cost Solution and System ERR ................... 82
Optimization of Capacity .............. ............ * .* ...**** 83Optimization Analysis - Basic Assumptions 84
25 Documents in Prolect File ............................. 85
Table T-1 Load Duration Curve - Western Region
Chart
C1 Average Load Duration Curve-Western Region, August 1990C2 Average Load Duration Curve-Western Region, December 1990C3 Average Load Duration Curve-Western Region, March 1991C4 Average Load Duration Curve-Western Region, July 1991C5 General LayoutC6 Maximum Dam SectionsC7 Power House Cross-SectionC8 Longitudinal Section of Power House
Map IBRD No. 17747

INDIA
BODHGHAT HYDROELECTRIC PROJECT
LOAN, CREDIT AND PROJECT SUMMARY
Borrower: India, acting by its President.
Beneficiary: Madhya Pradesh Electricity Board (MPEB).
Amount: Bank Loan: US$157.4 million, including capitalizedfront-end fee.
Special Fund Credit: SDR 134.4 million (US$143million equivalent).
Terms: Bank Loan: Repayment over 20 years, including fiveyears' grace, at the applicable variable rate ofinterest; front-end fee of 0.25% of the base loan amount.
Special Fund Credit: Standard IDA terms,
Relending Terms: Government of India (GOI) to Government of MadhyaPradesh (GOMP): As part of Central assistance to Statesfor development projects on terms and conditionsapplicable at the time.
Government of Madhva Pradesh to MPEB: Repayment over25 years, including five years' grace, at GOMP's currentapplicable rate of interest, not less than 7.5% perannum.
GOI will bear the exchange and interest rate risks.
Proiect Description: The project's main objective is to assist inmeeting the electricity demand in the State ofMadhya Pradesh and in. the Western Region of Indiathrough the addition of 500 MW of hydro-powercapacity and better use of the existing thermalplants. The project comprises the construction ofa 500 MW (4 x 125 MW) hydro-power station includ-ing all equipment, civil works and a transmissionline to the Western Regional grid. Main worksinclude a 90 m high, 1650 m long combined gravityand rock-fill dam, about 4500 m of tunnels andshafts, a powerhouse, and 5 km of dischargechannel. The project also includes a pilot ther-mal plant rehabilitation program designed toprovide for more efficient use of MPEB s thermalstations, which would serve as a basis for even-tual development of an India-wide rehabilitationprogram, and improvement and expansion of MPEB's

- ii-
data processing unit and services. There are norisks other than those normally associated withthis kind of project. All physical components tobe constructed are well within the boundaries ofknown technology. The Central ElectricityAuthority and the Central Water Commission willprovide assistance as necessary to MPEB in design,supervision and management of the works.
Estimated Cost: 1/
(Us$ millions)Item Local Foreign Total
Land and Relocation 22.0 - 22.0
Dam 136.4 51.2 187.5Water Conductor System 58.4 14.6 73.0Power Station 107.0 72.9 179.8Switchyard and Transmission 5.9 0.8 6.8Thermal Plant Rehabilitation 17.5 17.5 35.0Training and Consulting Services 1.5 1.5 3.0Miscellaneous 16.5 - _16.5
Base Cost 365.1 158.5 523.6
Physical Contingencies 43.8 14.1 57.9Price Contingencies 101.1 40.2 141.4
Total Project Cost 510.0 212.8 722.8
Front-end Fee on Bank Loan - 0.4 0.4Intere6t during Construction
Bank - 41.4 41.4Other 172.9 - 172.9
Total Financing required 682.9 254.6 937.5
Total project cost net of taxes and duties amounts to US$637.6 million.
1/ Includes taxes and duties of US$85.2 million.

-iii-
Financing Plan: (US$ millions)Local Foreign Total
IBRD Loan 28.3 129.1 157.4Special Fund Credit 72.6 70.4 143.0GOI/Cofinanciers 395.0 55.1 450.1MPEB 187.0 - 187.0
Total 682.9 254.6 937.5
Estimated Disbursements:
(US$ millions)IBRD/IDA FY FY85 FY86 FY87 FY88 FY89 FY90 FY91 FY92
Annual 24.4 | 39.0 57.0 63.0 69.0 24.0 15.0 9.0Cumulative 24.4 63.4 120.4 183.4 252.4 276.4 291.4 300.4
Rate of Return: About 11%.
Appraisal Report: No. 4909-IN, dated April 16, 1984.
1/ Including payment of front-end fee of about US$0.4 million.


INDIA
BODHGHAT HYDROELECTRIC PROJECT
I. THE ENERGY SECTOR
Energy Resources
1.01 India's commercially exploitable energy resources consist of coal,oil, gas, hydro potential and uranium, which account for about 46% of thetotal primary energy supply. Noncommercial energy, firewood and agriculturaland animal waste account for the rest. Coal is the main domestic source ofprimary energy, with potential reserves estimated at about 85 billion tons,of which 25 billion tons are proven reserves. Most of the coal is of low tomedium quality (3,500 to 5,500 kcal/kg). India's remaining proven andpotential reserves of petroleum are currently estimated at 800 million tonsof oil equivalent, of which 470 million tons is oil and the remainder naturalgas. Domestic production of oil has increased from 0.5 million tons in 1961to 16.2 million tons in 1982 and currently meets about 44% of the country'soil requirements. Annual gas production is estimated at about 3.1 milliontons of oil equivalent, of which about 60% is used as fuel or feedstock, andthe balance is flared, mainly because there is no market within reasonabledistance. The economically exploitable hydroelectric potential of India isabout 100,000 MW, of which only about 12,000 MW has been developed. Another4,700 MW is under construction, and 23,000 MW is under investigation. Indiaalso has sufficient uranium (about 15,000 ton equivalent of uranium oxideeconomically exploitable) and thorium reserves to meet the country's demandfor nuclear power in the foreseeable future.
1.02 India's energy policy has been geared to limiting the use ofpetroleum only in sectors where it cannot be economically substituted byother energy resources, particularly coal. Despite the recent development ofthe offshore petroleum reserves, the country remains dependent, to a largeextent, on imported oil to meet growing demand for transportation,fertilizers and petrochemicals, as well as in agriculture where substitutionby electricity continues to be limited by insufficient power generation anddistribution facilities. The cost of oil imports in 1981/82 was US$6billion, representing about 70% of India's estimated merchandise exportearnings. Well identified domestic energy resserves of coal andhydroelectricity are large enough to supply most of India's future commercialenergy requirements for industry and power generation. However, proven oiland gas reserves are not sufficient to meet the demand for oil in sectorswhere substitution by other fuels is not economically viable.
1.03 Renewable energy resources accounted for about 59% of the totalsupply of primary energy in 1975/76, but since then its share has been

-2-
declining. Wood, charcoal, dung and vegetable waste accounted for anestimated 92% of this supply. The rest was in the form of hydroelectricpDwer. It is expected that renewable energy (especially traditional fuels)will continue to play an important, though decreasing, role in the supply ofenergy in rural areas in the coming decades.
Energy Prospects
1.04 Studies prepared in 1979 by a Working Group on Energy Policyappointed by GOI indicate that the availability of commercial energy maybecome a serious constraint to India's economic development and recommended asystematic program for energy conservation and demand management. The mainpolicy measures recommended are: (i) improvement in the efficiency of energyutiiization; (ii) introduction of fuel-efficient technologies; (iii)reduction of the demand for transportation through improved planning ofproduction and consumption locations; (iv) reduction of the energy intensityof industries; and (v) inter-fuel substitution from commercial energyresources to noncommercial and renewable energy resources. According to thestudies, such measures, supplemented by appropriate pricing policies areexpected to restrain commercial energy consumption without impeding economicgrowth.
Energy Pricing Policies
1.05 India has consistently followed a policy of maintaining compositeretail prices of oil products at international levels. All products exceptkerosene and naptha are priced at or above border prices. Although there isa cross-subsidy from gasoline to kerosene, based on social and environmentalconsiderations, the weighted average prices for all products are higher thanimport prices. Coal prices are generally below the economic cost of supplyto the country. Although most of the Indian coal is non-tradeable due to itslow quality, there are substantial amounts of steam and coking coal.Adjusting for quality, quantity and duration of contracts, the estimatedeconomic cost for tradeable Indian steam coal would be, at the pithead,between US$29 to US$37 per ton, compared to current price which rangesbetween US$17 to US$21 per ton. The situation is similar for coking coalwhose pithead estimated trading f.o.b. price is between US$30 and US$54,while the domestic price is between US$18 and US$23. For the non-tradeablecoal there are indications that it is priced below the long-run marginal cost(IRMC) given the financial losses incurred by the producers and therelatively low levels of resources mobilized by the industry. There is nouniform pricing system for gas in India. Currently, its price is fixed onthe basis of form of production (associated or free) and on the type ofsupply contract. There are no studies on its economic cost. Although thereare variations among SEBs in the price of electricity, the average tariff isbelow the estimated LRMC. In 10 out of 15 SEBs, average industrial tariffsapproach LRMC whilst for domestic consumers LRMC is about three times theaverage tariff, and for agricultural consumers it is about four times the

-3-
average tariff. The weighted average LRMC for all consumers is nearly twicethe average revenue. GOI is aware of this disrepancy and has made explicitits policy for rationalizing energy prices. Coal prices were increased by30% in February 1982, 16.5% in May 1982, and 20% in November 1983. Therealso has been a considerable improvement in the power sector prices. In the21 month period between March 1981 and December 1982, electricity pricesincreased by about 28% compared to a 6.3% increase in the general wholesaleprice index in the same period.
The Power Subsector
1.06 In recognition of the need to develop indigenous energy resources,coal based generation and hydroelectricity have been receiving top priorityin Central and State Government policy planning. The power sector nowreceives the largest share of India's public investment resources (20% of theSixth Five-Year Plan outlay). In spite of this emphasis, demand for powercontinues to exceed supply. In keeping with the global energy policy, GOIhas also indicated the need to increase the hydropower capacity to achieve amore efficient operation of power system, which presently is predominantlythermal (coal based), and to make better use of the existing thermal capacitythrough upgrading and improved operation and maintenance.
Power Supply and Demand
1.07 In the 1950s and 1960s, installed capacity and power generationmanaged to keep pace with the nation's demand for power, both growing at anaverage annual rate of about 11%. Since 1970, however, the situation hasdeteriorated. Delays in the commissioning of new power plants, operating andmaintenance problems, mostly due to lower than expected coal quality, andinsufficient investment under severe budget constraints have led to acritical shortage of power. Between 1970-1975, power generation increased atan average annual rate of about 5%. The situation improved considerablybetween 1975-1980, with growth in both generation and capacity averaging7%-9% annually. This was largely due successively to good monsoons in1975/76 and 1976/77, improved coal supply, and a concerted effort to improveproject implementation, thermal capacity utilization and overall power systemmanagement. Since 1979/80 power generation has been increasing at a higherrate than installed capacity. Data for 1980/81 and 1982/82 indicate anaverage annual increase for these two years of about 8.0% for powergeneration and 6.5% for installed capacity, indicating better utilization ofexisting resources. Nevertheless, power shortages have persisted in manyparts of the country.
1.08 As of March 1983, India's total installed generating capacity,including non-utility plant, was about 38,100 MW. Of this, about 63% wasconventional thermal, 35% hydro, and 2% nuclear. Annex 1 shows the relevantfigures for the power sector in India between 1951 and 1983. Industrialconsumptions accounts for about 60% of all electricity sold in the country,

-4-
agriculture (mainly irrigation) for about 18%, domestic use for about 12%,and other consumers for aboit 10%. As a result of accelerated agriculturaldevelopment, there has been a marked growth of power consumption in the ruralareas where more than 80% of India's population lives. The number ofelectrified villages, for example, grew from approximately 3,000 in 1950/51to an estimated 300,000, or about 52% of all villages in India by the end of1982. Projections made by India's Central Electricity Authority (CEA) forits National Power Plan (NPP) indicate that over the thirteen-year period1981/82-1994/95, utility generating capacity should grow at an average annualrate of about 9.5%, to a total of about 106,000 MW. Of this, about 59,000 MW(56%) would be thermal, 44,000 MW (41%) hydro and 3,500 MW (3%) nuclear.Annex 2 shows the forecasted capacity and energy requirements for India up toyear 2000 as estimated by CEA, for the NPP.
Bank Group Operations in the Power Sector
1.09 Since 1954, the Bank Group has made 15 loans to India for powerprojects amounting to US$1,389.6 million, and 16 IDA credits totallingUS$2,266 million. Of these, US$2,465.4 million was for generating plant;US$23 million for construction equipment for the Beas hydro-electric project;US$630.7 million for the provision of high-voltage transmission; and US$536.5million for the support of rural electrification schemes. Sixteen projectshave been completed: ten for generating plant, the Beas Project, four forpower transmission, and the First Rural Electrification Project. The FirstSingrauli (Credit 685-IN of April 1977), Third Trombay (Loan 1549-IN of June1978), and Second Rural Electrification (Credit 911-IN of June 1979) Projectsare scheduled to be completed this year. The First Korba (Credit 793-IN ofMay 1978) and First Ramagundam (Credit 874-IN and Loan 1648-IN of February1979) Thermal Power Projects are in an advanced stage of implementation. Theloan for the Third Rural Electrification Project (Loan 2165-IN) was approvedin June 1982. The loan for the Central Power Transmission Project (Loan2283-IN), and the loan and credit for the Upper Indravati Hydro Project (Loan2278-IN and Credit 1356-IN), were approved in May 1983. The Singrauli,Korba, and Second and Third Rural Electrification projects are on schedule.The first four units of the Singrauli project and the first two units of theKorba project were commissioned on schedule. The Farakka and Ramagundamprojects are proceeding satisfactorily, the first unit at Ramagundam havingbeen commissioned four months ahead of schedule. The Third Trombay Project(Unit 5) is expected to be commissioned early in 1984, about a year behindschedule.
1.10 A project performance audit was conducted in 1980 for the SecondPower Transmission Project (Credit 242-IN). The project was considered tohave been successful in assisting the nine beneficiary State ElectricityBoards (SEBs) in extending their transmission systems to meet their growingpower requirements. Utilization of generating capacity in these SEBsexceeded the appraisal forecast. Rehabilitation of the finances of SEBs,which commenced under this project, is continuing under subsequent projects.

-5-
The audit highlighted the difficulties of adequately supervising thisproject, which consisted of many widely scattered subprojects, and ofeffecting institutional improvements in the absence of a close workingrelationship between the Bank Group and the beneficiary SEBs. With theassumption of increased responsibility by CEA in the power sector, a moreeffective relationship with SEBs is envisaged.
Sector Institutions
1.11 Under the Indian Constitution, the responsibility for supplying poweris shared by the Central and State Governments, and full agreement betweenthe two is required for the implementation of most actions. The principalagencies in the sector are: the State Electricity Boards (SEBs), the RegionalElectricity Boards (REBs), the Central Electricity Authority (CEA), theNational Thermal Power Corporation (NTPC), the National Hydro-Electric PowerCorporation (NHPC), and the Rural Electrification Corporation (REC).
1.12 SEBs were constituted by the State Governments under the provisionsof the Electricity (Supply) Act of 1948 to promote the efficient andcoordinated development of generation, transmission and distributiorn ofelectricity, and to control and regulate private licensees and utilitieswithin the states. The States effectively own or control over 90% ofelectricity supply facilities. Although SEBs are corporate entities andenjoy some autonomy in the management of their day-to-day operations, theyare under the control of State Governments in matters covering capitalinvestment, tariffs, borrowings, pay scales and personnel policies.
1.13 With the physical interconnection of the States' systems formingregional systems, there has been an increased need for interstatecoordination. In response to improved operation and planning, REBs have beenset up for each of the Northern, Southern, Eastern, Western and North-EasternRegions. The general function of an REB is to coordinate the operation ofthe power system to the maximum benefit of the Region as a whole, tocoordinate overhaul and maintenance programs, to determine generationschedules and power available for transfer between States, and to determinetariffs for the transfer of power within the Region.
1.14 CEA was constituted in 1950 with responsibility for formulatingnational power policies and coordinating the activities of the variousagencies involved in electricity supply. Its powers were extended byamendments to the Electricity (Supply) Act of 1948 in 1976. It is now alsoresponsible for the formulation and coordination of plans for powerdevelopment, optimization of investments in the power sector for the wholecountry, development of intercDnnected system, operation, training ofpersonnel, and research and development. CEA accumulates data on economic,financial and accounting aspects of the power industry, both at the Centerand State levels, with particular reference to the operations of SEBs, andadvises them on financial matters. In addition, CEA plays the role of

-6-
consultant to SEBs for the engineering of electromechanical elements of thesystems. Working in coordination with CEA, the Central Water Commission(CWC), under the Ministry of Irrigation, is responsible for the preparationand approval of all civil engineering aspects of the hydroelectric projectsand serveE as the consultant to SEB's in this regard.
1.15 Economic and technical considerations indicated the need to constructand operate major generationt and transmission facilities, whose size exceedsSEB's needs and capabilities. With this purpose, in 1975 GOI incorporatedNTPC and NHPC, whose main purpose is to construct, own and operate largepower stations, as well as high-voltage power transmission lines andassociated substations. NTPC has under construction and partly in operationsix large thermal power stations, while NHPC is building three hydrostations. Although the Central Government is becoming increasingly importantin the sector, the SEBs will continue to play a major role, particularly inhydro-electric projects. The States own most hydro sites and are unlikely toturn over these sources of comparatively inexpensive energy to the Center.NHPC can develop hydro sites only when the water rights are clear and theState has surrendered its claim on them.
1.16 The REC was constituted in 1969 and registered under the CompaniesAct of 1956 as a limited company wholly owned by GOI. Its primary objectiveis to finance rural electrification schemes prepared by SEBs throughoutIndia, functioning as a financial intermediary with technical expertise, andensuring the efficient onlending of funds drawn primarily from GOI. RECcoordinates its lending operations with the activities of other agencieswhich provide financing for rural development. Although the amount of RECfinancial support is small in relation to total SEB operations, REC todayfinances more than half of total rural electrification expenditures.
Bank Group Strategy in the Power Sector
1.17 The Bank Group's strategy in the Indian power sector has been tocooperate with GOI in finding solutions to the many difficult and politicallysensitive problems confronting the Indian electricity supply industry. TheBank's main objectives in the sector are:
(a) to eliminate power shortages by the installation of generationand transmission capacity, and the promotion of measures toimprove the operation and maintenance of existing plant;
(b) to introduce long-range system planning on a nationwidebasis so as to assure implementation of a least-cost powerdeveelopment program;
(c) to promote improvements in sector organization and training;and

-7-
(d) to strengthen the finances of the institutions in the sector,particularly the State Electricity Boards.
1.18 Despite many difficulties, improvements achieved so far have beenencouraging. With the establishment of Regional Electricity Boards (REBsWthe National Thermal Power Corporation (NTPC) and the National Hydro PowerCorporation (NHPC), important steps towards an improved organizationalstructure of the power sector have been made. CEA was reorganised and itspowers enlarged; amendments in the financial provisions of the Electricity(Supply) Act 1948 clarified the requirements to be followed in tariffsetting, the financial performance of SEBs has improved; the majority of SEBshave completed tariff studies based on marginal cost pricing principles; CEAhas prepared a long-term National Power Plan; and the increased investment inthe sector will help eliminate the power deficits.
1.19 Because of the rapid expansion of the power industry, all aspects ofthe sector needed to be reviewed and solutions found for its variousproblems. GOI established in 1978 the Committee on Power, which submittedits conclusions to GOI in September 1980. They refer to all major aspects ofthe power sector including planning, project formulation and implementation;operation and maintenance; organization and management; finance, and tariffs;rural electrification; and research and development. The recommendations ofthe Committee on Power, most of which are satisfactory in light of the BankGroup's strategy, form a basis for improvement of all those aspects of thepower sector.
1.20 In accordance with undertakings agreed during negotiations for theSecond Korba Thermal Power Project, GOI furnished, in May 1982, a program forthe implementation of five categories of power sector improvements which theBank Group considered areas of high priority. Satisfactory progress has beenmade in these five areas for which some of the more recent activities andachievements are as follows:
(a) Performance of Thermal Power Plants
The Department of Power in GOI has established teams ofspecialists, including representatives from CEA, SEBs andmanufacturers, to visit all thermal power plants with 100/120MW and 200/210 MW generating units in the country to diagnosetechnical and operational problems, propose solutions andassign responsibilities for their implementation. Repeatvisits are planned to assess progress.
(b) Coordination of Power Development and Growth in Other Sectors
The Bank Group received the draft National Power Plan forpower development in September 1982. This plan provides fore-casts of power demand, and projects the generating capacity and
-8-
equipment that will be required to meet this demand. It willprovide the basis both for five-year plans and annual investmentprograms.
(c) Intensification of Hydro-Electric Power Development
GOI is progressing with plans for a number of hydro projects,some of which will be proposed for Bank Group financing andothers for bilateral assistance. Several projects - among themVishnu Prayag (UP), Lohari Nag (UP), Naphtha Zhakri (HP),Puyan Kutti (Kerala), and Lower Periyar (Kerala) - have reachedadvanced stages of project preparation. The Upper Indravatiproject, the first hydro power project in India to be proposedfor Bank Group financing, was approved on May 10, 1983. Inaddition, GOI is planning to begin investigations on whatwould be one of the largest bydro power projects in the world -the 15,000 MW Dihand project-in north eastern India where anumber of other projects are also under consideration.
(d) Strengthening the role of the Central Sector in Power Generationand interstate High Voltage Transmission
(i) GOI, through NTPC, has under construction and partlyin operation about 10,000 MW of power generatingcapacity. In addition to the four Bank Group-financedthermal stations at Singrauli, Korba, Ramagudam andFarakka (which, except for Farakka, are now in theirsecond phases of construction), a 1000 MW plant atRihand (UP) and a 1260 MW plant at Vindhyachal (MP) arealso being undertaken by NTPC. Agreements have beensigned with the UK and USSR, respectively, for thefinancing of these plants. A 840 MW plant near Delhiis also under consideration by NTPC.
(ii) The Central Power Transmission project will reinforcethe Centrally owned power transmission grid, and providethe first stage of integration of the Northern, Westernand Southern regional grids, taking into accountcompatability for eventual energy pooling.
(e) Establishment of Financial Objectives and Policies for theirImplementation; Principles for Evolving Rational Tariff Policies;and Improvements in Management Information and Accounting Systemsfor State Electricity Boards.
(i) Legislation for amendment of the financial provisions ofthe Electricity (Supply) Act, 1948 was enacted by GOIin August 1983. These amendments will remove some of the
-9-
anomalies in the Act which have resulted in the SEBs allfollowing different and inconsistent accounting practices,thereby rendering their financial performance impossibleto measure or compare.
(ii) Management consultants have completed a review of presentaccounting practices in two of the SEBs (Punjab andGujarat); they are now engaged in developing a uniformsystem of commercial accounting for adoption by all SEBs.Their review was followed by preparation of a draft reportand accounting manual completed in January 1984 which willform the basis of the new accounting system scheduled forintroduction in 1985. CEA is charged with monitoring thedevelopment of the new accounting system and the financialperformance of the SEBs.
(iii) With the Third Rural Electrification Project, approvedin June 1982, new financial performance criteria forthe SEBs were introduced. These were designed toprovide for reasonable contributions by the SEBs topower investment, and to reduce gradually StateGovernment subsidies for rural electrification losses.
Power Supply and Demand in the Western Region
1.21 The Western Region, in which the project would be located, comprisesthe states of Gujarat, Madhya Pradesh, and Maharashtra and the UnionTerritories of Goa, Daman and Diu, and Dadra and Nagar Haveli. The Regioncovers about 29% of the country's area and has an estimated population of 149million. Industrial electricity consumption represents about 62% of theregion's total, compared with 57% nationwide, agricultural uses account for13% (against 18% for India), and the rest (25%) is consumed by residentialand commercial users. Overall electricity sales have been increased between1975 and 1983 at an average annual rate of about 8% p.a. Industrialconsumption increased at an annual rate of 6.2%, agricultural at 14% anddomestic at 12%. Maharashtra consumes about 54% of the total production,followed by Gujarat (28%) and Madhya Pradesh (18%) (Annex 4).
1.22 As of March 1983, the total installed utility capacity in the Regionwas about 10,045 MW, consisting of 78% thermal, 18% hydro and 4% nuclear(Annex 5). This capacity, with the exception of 210 MW owned and operated byNTPC and 420 MW owned and operated by Department of Atomic Energy, is ownedby SEBs. There are in addition,some 660 MW of captive industrial generatingplants (above 600 kW per set). About 51% of total regional capacity islocated in Maharashtra, 28% in Gujarat and 21% in Madhya Pradesh. Althoughinstalled capacity increased at about 10.4% p.a. during 1975-83, availablecapacity grew at about 8.3% p.a., indicating a significant deterioration inplant availability (only about 62% of installed capacity in 1982/83). Causesof low availability range from lower than expected quality of coal and

-10-
equipment to overloading of plants due to capacity shortages. Althoughinterconnection of the Region's states is established, operations are not yetfully integrated due to operational constraints in Madhya Pradesh (Annex 6).The pooling and dispatching arrangements are coordinated through REB and areexpected to substantially improve with a new load dispatch facility based ona real time computer currently under installation.
1.23 Annex 7 shows the past and projected power supply situation for theRegion and the expected capacity additions during 1984-92. The peak andenergy requirements shown are based on the forecast prepared for the NationalPower Plan, adjusted on the basis of the actual demand observed in 1982/83 inthe Western Regiorn. Currently the power shortage in the region is criticalresulting in severe supply restriction in all three States, especially inMaharashtra and Madhya Pradesh. Regulatory measures for power cuts andrestrictions and load shedding were imposed throughout the year whichaffected the industrial and agricultural consumers as well as domestic usersabove a minimum level. Due to the existing shortage of peaking capacity, theconstrained peak demand has grown at an average rate of only 7.4% p.a.during the last five years. Demand for peak capacity is expected to growat about 8.5% p.a. until 1992. The present estimated capacity shortage ofabout 1300 MW or 17% of the potential demand would be eliminated, accordingto current plans, around 1990. New addition to capacity during 1980s will bepriedominantly thermal, but in 1988/89-1992/93 additional hydel capacity of2,386 MW is expected to be commissioned, including 500 MW from the propoisedBodhghat Project.
Supply and Demand of Electricity in Madhya Pradesh
1.24 As of March 1983, the total installed capacity of MPEB, thebeneficiary of the project, was about 1,841 MW, consisting of 90% thermal(mostly coal fired) and 10% hydro. During the last 10 years, both the peakload and the installed capacity grew under restricted supply conditions atan annual rate of 9.5% (Annex 8). Electricity sales have grown at 8.1% p.a.during 1978/79-1982/83 reaching 5,878 GWh in 1982/83 (Annex 9). Due tocapacity shortages, imports were always needed to partially cover thedeficits. It is estimated that the unconstrained estimated peak load wouldreach about 4,800 MW in 1991/92 at a rate of growth of about 12.5% p.a. andthat the current capacity deficit of about 17% (320 MW) in 1983 will increaseto some 19% (900 MW) in 1991/92. Energy requirements are also expected toincrease at a rate of 12.5% p.a. between now and 1991/92, but the existingdeficit in energy availability will, however, decrease from about 23% toabout 13% in the same period. Of the total electricity consumption in Ml' in1982/83, 94% was for productive uses (commerce, industry, agriculture,traction) leaving the balance to domestic users, whose consumption is one ofthe lowest in India. In the same year, industry consumed 71.4% of theelectricity, followed by irrigation (9.4%), domestic uses (7.5%) and railwaysand waterworks (5.7%). While the share of industrial consumption, the singlelargest consumer, remained relatively unchanged during 1975-83, agriculturalconsumption grew at 16.6%, from 5.5% of the total in 1975 to 9.4% in 1983.Annex 10 shows the consumption by consumer categories for 1974-83.

-:1.1-
II. THE BORROWER, THE IMPLEMENTING AGENCY AND THE BENEFICIARY
A. The Borrower
Lending Arrangements
2.01 GOI would be the borrower and recipient of the Loan and Credit, andwould channel the proceeds to the Government of Madhya Pradesh (GOMP) inaccordance with its standard arrangements for development assistance to theStates. GOMP, in turn, will make available these funds to MPEB as part ofits lending contribution to the latter's investment program. MPEB wouldimplement the Project and, upon completion, it would carry out its operationand maintenance. It was agreed that Madhya Pradesh will onlend to the Boardthe proceeds of the Bank Group funds for a term of 25 years, including a
period of grace of 5 years, at an interest rate of not less than 7.5% perannum. GOI and GOMP also confirmed that the remainder of the funds providedfor the Project would also be made available to MPEB on a loan basis underthe same terms. These terms are acceptable considering that GOMP'scontribution to the project, including IDA and IBRD funds, are made availableto SEB in its entirety as a loan. The onlending rate is positive in realterms and will be adjusted annually by GOMP to keep it so.
B. The Implementing Agency and The Beneficiary
Madhya Pradesh State Electricity Board (MPEB)
Organization and Management
2.02 MPEB was constituted in 1950 under the Electricity (Supply) Act of1948, and is responsible for generation, transmission and distribution ofelectricity throughout the State. It constructs and operates thermal and
hydroelectric generating stations, and transmission and distribution networksto supply ultimate consumers and licencees with electric power. However,MPEB is not fully autonomous in executing these responsibilities, since it iscontrolled, according to statutory power, by the State Government, especiallyin matters of staffing, borrowing and tariff-setting. MPEB-s capitalinvestment program is determined within the overall State and nationalplanning framework.
2.03 MPEB is a corporate body consisting of six members including a
full-time Chairman and three full-timae members for Generation, Transmissionand Distribution, and for Finance. The other two members of the Board arepart time and comprise GOMP-s Finance Secretary and Energy Secretary (Annex11). MPEB-s organizational charts suggest well defined responsibilities forits operating units in the headquarters, regional divisions and prdjectsites. Transmission and distribution responsibilities, including commercial

-12-
activities, are carried out by four regional Chief Engineers who superviseabout nineteen circles each headed by a superintending engineer. MPEBexecutes considerable part of its development program with its departmentalorganization. It also owns and runs two workshops for fabrication of towersfor high-tension lines, up to 400 kV, and structures for substations.
Staffing
2.04 At the enid of 1982/83, MPEB had about 63,000 regular employees andabout 30,000 workers employed on a daily wage basis (Annex 11). About 18,000employees of its regular labor force and at least 90% of the daily wageworkers are engaged in construction activities. On this basis, operat:ion andmaintenance staff total 44,000 employees, giving a ratio of about 48consumers per employee which, although high, is acceptable when compared toother SEBs in India. All the sanctioned positions in MPEB at the topmanagement and middle management levels are filled. Vacancies at lowerlevels do not represent more than 8% of the sanctioned posts.
Training
2.05 MPEBs Central Training Institute at Jabalpur conducts intensiveinduction courses for engineers and chemists prior to their regularappointment. The normal training period is one year for engineers and. 15months for chemists, and covers technical, administrative and accountinLgsubjects. For diploma holders, induction courses are provided for 3 monthsin four training centres. There are also two training centres which providetraining for linemen. Similarly, thermal power plant operators are trainedfor 3 to 6 months under supervision of training staff at the Korba andAmarkantak power plants. In addition to these in-house trainingarrangements, the Board has been sending its personnel to attend variouscourses organized by institutions in the country or abroad on managerial andengineering aspects related to its activities (Annex 12).
MPEB Accounts
2.06 MPEB's accounting system is not fully in line with acceptedcommercial accounting practices. Moreover, it has not implemented the StateGovernment directive issued in July 1979 to adopt the revised forms of annualaccounts prescribed by CEA in consultation with the Comptroller and AuditorGeneral of India. However, M1PEB, under the Third Rural ElectrificationProject, agreed to introduce, from April 1, 1984, a system of commercialaccounting to be prescribed by GOI (similar undertakings have been submittedby fourteen SEBs). GOI has initiated the preparation of a suitable unifiedSEB accounting system. The consultant retained by GOI to develop the nlewsystem completed, in January 1984, a preparatory report which was due in June1983. In view of this slippage and other considerations, GOI now proposes toinitroduce the new accounting system from April 1985 and that localconsultants be hired by each SEB to verify and adjust the existing accounts

-13-
and to provide the necessary guidance and training during the initial stageof the system implementation. GOI provided in February 1, 1984 (letterDO:10(4)83-FIN) the schedule for the implementation of the uniform commercialaccounting system in all SEBs starting from April 1985. This schedule wasconfirmed during negotiations. It was also agreed that MPEB will introduce,from April 1985, a uniform commercial accounting system satisfactory to GOI,with the assistance of a local consultant whose terms of reference will beprovided to the Bank by June 30, 1984. In addition, it was agreed that,given the delay in the introduction of the uniform commercial accountingsystem for the SEB, the proposed system of Project accounting includingmanuals, regulations, and formats would be provided to the Bank by October31, 1984.
Data Processing Facilities
2.07 MPEB-s existing computer is used for billing (25% of MPEB's urbanconsumers), inventory control for transmission and distribution stores,revenue returns, staff records, and payroll for the Jabalpur District (2,200employees). Expansion of existing computer applications and introduction ofnew ones, considered essential to MPEB's proper management and operation, arenot possible however due to the limited capab:ilities of the existing dataprocessing facilities. In this regard, the computer services should beextended to cover new areas such as system operation (plant dispatch, loadmanagement, interruption analysis, demand and consumption analysis),managerial accounting, budgetary control, project management and costcontrol. In addition, the existing services should also be extended to coverbilling for all consumers and inventory control for all power generationstores. These improvements are part of the proposed Project. It was agreedthat the consultants required for the upgrading of MPEB's data processingfacilities will be retained by December 31, 1984.
Audit
2.08 The audit of MPEB is undertaken by the Comptroller and Auditor-General of India, who has satisfactory completed the audit report for 1981/82 with substantial emphasis on MPEB-s performance as a commercially orientedentity. It was agreed that Madhya Pradesh shall cause the Board to furnishthe Bank, not later than nine months after each fiscal year, with itsfinancial statements for such year as certified by an independent auditor andnot later than twelve months after the end of such year, the audit report bysaid auditor.
Transmission and Distribution Losses
2.09 At present MPEB-s transmission and distribution losses are about22.2% of the energy supplied, which is the highest in India. MPEB attributesthe high losses mainly to low load density (kW/Km2 ), restrictions on powersupply and to the extension of the low tension distribution system. In

-14-
MPEB's financial projections system losses have been progressively reduced toreach 18% in 1989/90 and contained at that level. However, the measuresrequired to produce this gradual reduction in system losses have yet to beconfirmed. MPEB and GOI have been asked to submit, by negotiations, a planof specific and quantified measures designed to gradually reduce the systemlosses to 18% by 1989/90; this plan should address both technical andnontechnical losses, and include proposals to reduce each category withannual targets to be achieved. The Indian delegation furnished to the Bank aprogram for the control and reduction of system losses. However, the programneeds to be worked out in further detail to meet the Bank-s requirements.Therefore, it was agreed that MPEB will provide a more detailed programsatisfactory to the Bank before May 31, 1984, and control its energy lossesin accordance with the agreed program.
Insurance
2.10 MPEB follows standard practices for insuring elements being procuredfor ongoing projects against total or partial loss. For permanentinstallations MPEB holds policies which conform to the accepted utilitypractices in India in terms of the nature and amount of coverage.
Taxes
2.11 SEBs are liable to income tax; however, because of the nature andsize of the investment program MPEB is not charged tax payments. Due to theintensive capital expenditure of MPEB between 1983/84 and 1991/92, an incometax liability will not arise in the foreseeable future and accordingly, a taxequalization reserve is not necessary. Besides, GOI is now considering arecommendation of the Committee on Power to exempt SEBs from income tax.

-15-
III. THE PROJECT
Background
3.01 The proposed 500 MW hydropower station under the Project is locatedin the Bastar District in the State of Madhya Pradesh, some 1,200 kmsoutheast of New Delhi on the Indravati river (Map No. IBRD 17747). Theproject was prepared by CEA, CWC, and MPEB staff and was submitted by GOI forBank consideration in September 1982. Two preparatory missions visited Indiain October 1982 and June 1983, and appraisal took place in October 1983.
3.02 GOI, as part of its policy to rationalize the use of the country'senergy resources and to make a more efficient use of its power generatingpotential, has decided to emphasize hydropower development. India's powersystem is predominantly thermal, based on coal fired plants, and the absenceof a balanced blend with hydropower has led to either improper and expensiveoperation of thermal stations as peaking facilities or, even worse, peakshortages. This situation is particularly serious in the Western Regionwhere 78% of the capacity is thermal and in MP where 90% of the total is coalfired plant. The chronic peaking shortages in the region have resulted inwidespread load shedding, overloading of the existing plants, increasedoperating costs and, as a consequence, less than required thermal unitmaintenance. The proposed Project, which is the least cost option for theWestern System expansion, is geared to alleviate this situation.
3.03 In parallel with the more intensive development of its hydropowerpotential, GOI is committed to the improvement of the performance andutilization of the thermal plant already in place. Due to a number offactors, thermal plant availability in India (65%-70%) is much less than whatwould be a reasonably good performance (about 80%) for India's conditions.The main reasons for this situation appear to be: a) lower than expectedquality of coal, leading to overloading of coal handling facilities and torapid wearing of the equipment, b) poor quality of some equipment componentsresulting in increased forced outages, c) problems with instrumentation andmonitoring of the units, and d) impossibility of performing propermaintenance due to system overloading. In order to remedy this situation,GOI is considering a major national thermal rehabilitation program. However,the problems and issues to be faced in a nationwide program of this magnitudeare not fully clear and a smaller pilot project is indicated as a firstphase. Such a pilot project of this nature has been included as part of theproposed Project, with the intention to replicate it in other States.

-16-
Project Objectives
3.04 In addition to the primary objective of increasing the generatingcapacity of the state of Madhya Pradesh and thence of the Western Region,the project will assist GOI in achieving objectives on which the Bank has
agreed, namely:
(a) More efficient use of existing plant, through the implementationof the pilot program of thermal plant rehabilitation in MadhyaPradesh, and
(b) Improvement of MPEB operations by expanding and modernizingdata processing services to cope with the commercial andmanagerial needs of the Board.
In addition, to assist in the definition of electricity meteringpolicy in in India, GOI has agreed to carry out a study on metering practicesin a number of selected states which is expected to be completed before May1986. Terms of reference for a proposed metering study were providedpreviously to GOI by the Bank and these have been taken into account indefining the scope of the GOI study. The results of the study will be madeavailable to the Bank for comments.
Project Description
3.05 The proposed project will include the following components:
(a) The construction of a 500 MW hydropower station, including:
(i) A powerhouse housing 4x125 MW turbogenerating sets andassociated electrical and mechanical equipment.
(ii) A combined gravity rock-fill dam about 90 m high and 1,650 mlong in the Indravati River.
(iii) A water conductor system composed of a head race tunnel ofabout 12 m in diameter and 3,000 m long, a surge tank, and fourpressure shafts about 400 m long and 6 m in diameter;
(iv) About 5 km of open tailrace channel;
(v) Step-up transformers (11/220 kV), switchyard equipment, andabout 5 km of 220 kV double circuit transmission line toconnect the project, to the nearby existing Barsoorsubstation.

-17-
(b) The execution of a thermal plant rehabilitation program in theState of Madhya Pradesh, including the purchase and installation ofelements for repair and upgrading of the thermal units.
(c) The expansion and modernization of the MPEB data processingfacilities, including development of software and purchasesof necessary computer equipment.
(d) The necessary site services and facilities.
(e) The associated consulting, engineering, training, andadministrative services required to carry out parts (a) to (d)of the project.
Transmission
3.06 Load flow analyses carried out by CEA for the Western Regional gridindicated that it will be necessary to reinforce the existing Barsoor-Bhilaitransmission system when the project is commissioned. MPEB's medium terminvestment program includes for this purpose a 400 kV single circuit line (tobe initially energized at 220 kV) between the two substations. The line isnot financed under the proposed Project but assurances were obtained thatMPEB will complete the necessary transmission works before December 31, 1990,and that the detailed engineering for this transmission system will becompleted not later than June 30, 1986.
Project Cost
3.07 Table 3.1 shows a summary of project costs. The total cost of theProject, including contingencies but excluding about US$85 million in taxesand duties is estimated at US$638 million equivalent, of which US$213 million(33% of the base cost) represents the foreign exchange costs. Interestduring construction adds another US$214 million to the financing required. Acapitalized front end fee on the proposed Bank loan adds approximately afurther US$0.4 million. The project cost estimates are based on December1983 actual prices for similar works. Price contingencies, amounting toabout 27% of the base cost, are based on expected inflation rates of 7% forFYs84 and 85, 8% for FYs86 and 87, and 6% thereafter for local costs, and7.5% for FY84, 7% for FY85, and 6% thereafter for foreign costs. Physicalcontingencies of about 15% on civil works and 5% on mechanical and electricalequipment have been allowed, amounting to about 11% of base cost. The costof civil works is based on recent quotations received in India for similarprojects and on updated State rates applicable to Government contracts inMadhya Pradesh. The cost of the turbo-generator sets has been estimatedafter consultations with manufacturers of major rotating equipment. The costof electrical and mechanical equipment is also based on data on recentpurchases of similar items by MPEB. The cost of the elements of the thermalrehabilitation program was estimated on the basis of quotations for similar
I

-18-
equipment and materials received by MPEB. The cost of the consultingservices required for the implementation of the Project was estimated atUS$11,500 per man-month for foreign consultants and at US$3,500 equivalentfor local consultants, including fees, travel, and subsistence expenses. Anamount of 10% of the base cost has been assumed for engineering andadministration. Interest during construction has been added, assuming that80% of the cost would be financed through borrowings from GOMP (paras 2.01and 3.08). The rates for GOMP loans to MPEB have been established by theState Government as follows: 1983/84, 7.4%; 1984/85, 7.5%; 1985/86, 7.6%;19886/87, 7.7%; 1987/88, 7.7%; 1988/89, 7.8%; 1989/90, 7.9%; 1990/91, 8.0%;1991/92, 8.1%. The front end fee on the Bank loan has been calculated at0.25 of 1%, assumed to be capitalized under the loan. Annex 13 presentsdetailed cost estimates for the project.
Table 3.1: Project Cost Summary
% of--- Rupee Million -- US$ Million---- Foreign % of Total
Local Foreign Total Local Foreign Total Exchange Base Costs
Land and Relocation 220.0 - 220.0 22.0 - 22.0 - 4.2Preliminary Works 143.0 - 143.0 14.3 - 14.3 - 2.7Dam 1,364.0 511.5 1,875.5 136.4 51.2 187.5 27.3 35.8Water Conductor System 368.6 124.2 492.8 36.9 12.4 49.3 25.2 9.4Civil Works Power House 91.8 17.1 108.9 9.2 1.7 10.9 15.7 2.1Tail Race Duct and Channel 215.0 21.5 236.5 21.5 2.2 23.7 9.1 4.5Miscellaneous Civil Works 22.0 - 22.0 2.2 - 2.2 - 0.4Turbo Generators and
Auxiliary Equipment 827.5 674.4 1,502.0 82.8 67.4 150.2 44.9 28.7Station Auxiliary Services 71.0 27.1 98.2 7.1 2.7 9.8 27.6 1.9Step Up Transformers 78.6 10.7 89.2 7.9 1.1 8.9 12.0 1.7Switcnyard and Transmission
Line 59.5 8.1 67.6 5.9 0.8 6.8 12.0 1.3Thermal Plant Rehabilitation 175.0 175.0 350.0 17.5 17.5 35.0 50.0 6.7Training, Consulting Services,and DPU upgrading 15.0 15.0 30.0 1.5 1.5 3.0 50.0 0.6Total Base Cost 3,651.0 1,584.6 5,235.6 365.1 158.5 523.6 30.3 100.0
Physical Contingencies 437.7 140.8 578.5 43.8 14.1 57.8 24.3 11.0Price Contingencies 1,011.5 402.3 1,413.8 101.1 40.2 141.4 28.5 27.0
Total Project Cost 5,100.2 2,127.7 7,227.9 510.0 212.8 7I278 29.4 138.1Interest during construction - -
Bank - 414.0 414.0 - 41.4 41.4 100.0 7.9Other 1,729.0 - 1,729.0 172.9 - 172.9 30.1
Front-end fee on Bank loan - 4.0 4.0 - 0.4 0.4 100.0 -Total financing required 6,829.2 2,545.7 9,374.9 682.9 254.6 937.5 22.7

-19-
Project Financing
3.08 The proposed Bank Group financing for the project amounts to US$300.4million, representing 47X of the total cost, net of duties and taxes. Ofthis total, SDR 134.4 million (US$143 million equivalent) will be financedfrom IDA's Special Fund under stanidard terms for such credits, and US$157.4million (including the capitalized front end fee of about US$0.4 million)will be an IBRD loan at the prevailing variable rate of interest to be repaidover 20 years, including a 5 year grace period. Bank Group funds willfinance about US$200 million (79%) of the total foreign exchange costs andUS$101 million (15%) of local costs, net of taxes and duties. MPEB willcover 20% of the total financing required (US$187 million equivalent), andthe balance, US$450 million equivalent, will be financed by GOI, throughGOMP, in accordance with the onlending terms outlined in para 2.01. It hasbeen agreed that GOI will seek to finance about US$85 million equivalent,representing the foreign component of the turbogenerator sets and associatedequipment, through suppliers' credits, export credits or commercial bankloans, if the contract for turbogenerators is won by a foreign supplier. Allcost overrun, interest rate and foreign exchange risks will be borne by theGOI. Assurances were obtained that MPEB and GOT, through GOI4P, will providefor the necessary funds for project implementation in a timely manner. Itwas also agreed that, if cofinancing is arranged for the turbogenerators, theBank would seek to reallocate any Bank Group funds not required for thispurpose to other elements of the project as appropriate. Table 3.2 shows theproposed financing plan.
Table 3.2: Project Financing Plan
(US$ Million)
Local Foreign Total
IBRD Loan 28.3 129.1 157.4IDA Special Fund Credit 72.6 70.4 143.0GOI/Cofinanciers 395.0 55.1 450.1MPEB internal generation 187.0 - 187.0
Total 682.9 254.6 937.5
The US$55.1 million in foreign exchange not financed by the Bank correspondsto interest on the IBRD loan, (about US$41.4 million) and to part of theforeign component of locally procured equipment (about US$14 million).
Construction Schedule
3.09 The project will be executed over a period of 7.5 years, startingearly 1984. Commissioning of the first unit is expected in October 1989 with

-20-
the other 3 units following at 3 months intervals. The last unit is expectedto be commissioned by June 1990. Final works on the dam, not affecting
operation of the units, will be completed by September 1991. To achievethis, the following schedule needs to be met:
Award of Contracts for Dam October 20, 1984Award of Contract for the Wiater
Conductor System October 20, 1984Award of Contract for the Excavation
for the Powerhouse August 1, 1984Award of Turbogenerators Contract November 30, 1984Award of Contract for the Tail
Race Channel October 20, 1984
The proposed construction schedule prepared by HPEB, shown in Annex 14, isconsidered realistic.
Project Engineering
3.10 The Project site has been investigated for several decades butsystematic studies began only in the early sixties. Since then GSI hascarried-out the geological site investigation, including about 3,500 m ofexploratory drilling. Moreover, between 1965 and 1979, CWC collected andanalysed hydrological information, developed the project concept and preparedpreliminary designs. These works served as the basis for the formal adoptionof the project by GOI in 1979. Since then, designs have been refined andadditional explorations have been carried out as needed. Following theIndian practice in this respect, CWC has been responsible for the civilengineering of the project and CEA for ,he electromechanical aspects. Bothorganizations have experience in similar projects as they have served as theengineers for most of the hydropower and irrigation schemes in India forseveral decades. The engineering for the hydroelectric plant has beencompleted at a level sufficient for bid invitations and detailed constructiondrawings are under preparation. Bids for major civil works will be invitedby late May 1984.
3.11 At the request of the Bank Group, MPEB appointed, in July 1983, a DamReview Panel (DRP), consisting of independent experts retained under terms ofreference acceptable to the Bank, to oversee the technical design andconstruction aspects of the Project. DRP in its first meeting in August1983, concurred with the general layout of the Project. In addition, theBank Group retained specialists in geology, hydrology and concrete dams toassist the appraisal mission in carrying out the technical review of theProject. After their review, the Bank Group consultants found the Projecttechnically sound and endorsed the proposed layout and design. Theconsultants proposed a number of modifications to the designs and location ofthe dam to improve the reliability and economy of the Project, These changesdo not imply substantial alterations to the Project as proposed by GOI and

-21-
would be accommodated during the completion of the final design. Moreover,although nearby geological exploration and surface geology of the modifieddam site location indicate a sound foundation, the consultants recommended aprogram consisting of about 1,350 m of additional deep borehole drilling, toconfirm the geological conditions and the final foundation treatment. At thetime of negotiations 35% of the total exploration program had been completedunder the gravity section of the dam revealing a problem free foundation asexpected.
Project Implementation
3.12 MPEB will be the implementing agency for the Project. CEA and CWCwill provide engineering and consulting services to MPEB. Theirresponsibilities will include, but are not limited to, the preparation oftender documents, specification and construction drawings, the review ofcosts, and general technical assistance during project construction. MPEBhas assigned part of its staff to work on project design with and under thedirection of CEA and CWC. In addition, it has been estimated that about 400man-months of private consulting services, as outlined below, will berequired for the project, of which about 130 man-months are expected to beexternal and 270 local consultants. MPEB has also created a projectexecuting unit under the Chief Engineer and proposed a 3 year staffing planwhich will be reviewed annually with the Bank Group. The organization(Annex 16) and functions of the unit are satisfactory. This unit would beresponsible for the overall field construction management and supervision.
3.13 MPEB has units experienced in general construction management,procurement, store management, etc. which will assist the Project unit, whenneeded. MPEB, and the Bodhghat executing unit in particular, might needassistance in contract management and in the supervision of tunnelling work.In fact, MPEB's staff has had limited exposure in the areas of internationalcontracts management and underground excavation works. The appraisal missionestimate that around 200 man-months of consulting services will be requiredfor this purpose. The proposed Project provides for this assistance. It isestimated that assistance will be needed in project management, and damconstruction (95 man-months), tunnel construction (60 man-months) andspecialized consulting services in various aspects as needed (about 45man-months).
3.14 MPEB staff have prepared a unitwise preliminary diagnostic of theneeds for the rehabilitation of thermal plants including cost estimates.This assessment was used in defining the scope of the rehabilitationcomponent of the Project. However, in view of the nature of the worksinvolved, the rehabilitation program will be executed in the following phasedmanner:
(a) review of the MPEB proposal by specialized consultants andconfirmation, and, revision if needed, of the physical works
-22-
to be carried out, including their economic justificationand ranking in merit order, relative priorities andof the necessary improvements in operation and unit monitoringpractices, including an evaluation of the potential costsavings to the system;
(b) preparation of the implementation plan comprising detailedschedule for purchases, determination of quantities,specifications and tender documents, schedule for execution ofworks, manpower estimates, training, power substitution,administrative measures, monitoring system, etc; and
(c) physical execution of works and training of operationsand maintenance staff.
It was agreed that, in regard to the improvement of the operations andmaintenance practices, MPEB will also prepare, before March 31, 1985 adiagnostic for discussion with the Bank identifying the areas for improvementand proposing the scope for further consultants review. The proposed termsof reference for the planning and implementation of this component areincluded as Annex 15.
3.15 The thermal rehabilitation component will be executed by MPEB withthe assistance of consultants retained in accordance with terms of referenceacceptable to the Bank Group. It is estimated that about 100 man-months ofconsulting services would be needed. MPEB has extensive experience withdifferent sizes of thermal units totalling over 2,000 MW and staffqualifications and numbers are considered adequate to properly carry out therehabilitation work. MPEB agreed to recruit and appoint consultants forassisting in the identification, preparation and execution of the pilotcomponent of the project for thermal station rehabilitation in accordancewith terms of reference acceptable to the Bank Group, not later than December31, 1984.
3.16 The upgrading of the data processing facility in MPEB will includethe development of additional software, purchase of computer equipment andtraining of staff. It will be executed with the assistance of consultantsand in accordance with terms of reference satisfactory to the Bank Group.Arouand 100 man-months of consulting services are estimated to be requiredafter a review of the studies already available on the Subject. Theconsultants would assist MPEB in: a) defining the scope and priority of thenew computer applications or the expansion of the existing area, b)formulating a plan for its implementation including selection of hardware andsoftware, according to GOI's norms and practices, c) setting a trainingprogram for MPEB staff and d) assisting in the implementation of the expandedsystem. Assurances were obtained that consultants for assisting in theimp:Lementation of the upgrading of MPEB data processing facility will beretained not later than December 31, 1984.
Procurement
3.17 Procurement arrangements for the project are summarized in Table 3.3.

-23-
Table 3.3: Procurement Arrangements(Million of US$) 1/
Project Element Procurement Method TotalICB LCB Other N.A.3/ Cost
A. Civil Works
Dam 237.5 237.5(143.0)2/ (143.0)
Water Conductor System 47.8 47.8(28.7) (28.7)
Tail Race Channel 30.8 30.8Other Civil Works 31.2 31.2
(8.7) (8.7)
B. Equipment
T-G sets and auxilliary eqpt. 88.1 89.2 88.1(88.1) (88.1)
Main step-up transformers 8.4 8.4(8.4) (8.4)
Other equipment 3.5 33.6 37.1(3.5) (3.5)
Transport, insurance, erection 33.3 33.3(4.6) (4.6)
C. Training, Consulting Servicesand DPU upgrading 3.8 3.8
(2.0) (2.0)
D. Land and Relocation 27.8 27.8(-) (-)
E. Engineering and Administration 60.4 60.4(-) (-)
F. Thermal plant rehabilitation 9.0 11.0 11.4 31.4(9.0) _(4.0) (13.0)
Total 425.1 75.8 48.5 88.2 637.6(280.7) (8.7) (10.6) (-) (300.0)
1/ Amounts net of duties and taxes.2/ Figures in parentheses indicate Bank financed portion.3/ Not subject to commercial procurement.
-24-
The 3 major civil works contracts for the dam, water conductor system, andtail race channel will be awarded after ICB, and the balance (civil works forthe powerhouse, access roads, site buildings, staff quarters, and siteutilities) under LCB procedures acceptable to the Bank. Prequalificationwill be required for the 3 major civil works contracts. Major local firmsare expected to be competitive for the civil works. Since the civil works ofdam will be financed from IDA's Special Fund, only certain selectedcountriesl/ would be eligible to participate in the procurement of this item.The turbogenerators, the main step-up transformers and the steel plates forpenstocks and gates, amounting to about US$100 million, will be subject toICB whereas miscellaneous equipment, amounting to about US$44 million, willbe procured under LCB procedures acceptable to the Bank Group. Foreignsuppliers will not be precluded to participate in LCB. It is expected thatlocal manufacturers will be competitive for all the equipment contracts.Most of the items necessary for the thermal rehabilitation program areexpected to be subject to ICB (boilers, turbine rotors, pumps, etc.), some ofthem, however, might need to be procured through limited tendering if theamounts involved are small or the number of suppliers is limited, or throughdirect purchases in the case of proprietary items. MPRB will furnish inadvance for Bank approval lists of the items to be procured through limitedtendering or direct pruchase. About 75% of the goods, works and services forthe project will be procured under ICB. Local contractors, competing underICB, will have 7.5% preference margin for civil works and local manufacturersa 15% preference or the applicable duty, whichever is less, for supply ofgoods. Consultants would be selected in accordance with Bank guidelines.All civil works contracts with an estimated cost of US$3 million or moreequivalent will be subject to Bank Group's prior review. All equipmentcontracts with an estimated cost of US$800,000 or more equivalent would alsobe subject to prior Bank review. Prior review will capture about 85% of theestimated cost of the elements subject to commercial procurement. Othercontracts would be subject to selective post-award review.
Disbursements
3.18 Disbursements of IDA/Bank funds will be made against: (a) 100% ofCIF price of imported goods; (b) 100% of the ex-factory cost of locallymanufactured goods; (c) 50% of local expenditure for other items procuredlocally; (d) 100% of consultants' services; and (e) 60% of the civil works.Disbursements would be fully documented except for (a) payments under civilworks contracts for one or more progress payments not exceeding Rs300,000each, and (b) payments for locally procured items of equipment not exceeding
11 The eligible countries as of March 31, 1984 are: Australia, Belgium,Canada, Denmark, Finland, France, Germany, Iceland, Ireland, Italy,Luxembourg, New Zealand, Norway, Sweden, United Kingdom, and Part DwoCountries.

-25-
Rs150,000 each. Such disbursements will be made against statements ofexpenditures (SOEs), the documentation of which will not be submitted to theBank Group but retained for inspection by the supervision missions. Thestandard procedure for auditing SOEs will apply. Annex 17 shows theestimated disbursements schedule as derived from the construction program,considering the normal commercial payment terms for the types of contractsenvisaged for this project. The schedule is considered realistic for thiskind of project. Since there is no previous information on typicaldisbursement profiles for hydro power projects in India, (this is the secondBank Group financed hydro station in India), no meaningful comparison can bemade in that respect. However, the Project's disbursement profile fitsclosely the Bankwide pattern for similar power projects. The closing datewould be June 30, 1992.
Water Rights
3.19 The Indravati river, in which the project is located, is aninterstate river flowing from Orissa into Madhya Pradesh. Furtherdownstream, it forms the boundary between Madhya Pradesh and Maharashtra.The joint utilization of the Indravati is regulated by the agreements reachedamong the States. The agreements are part of the final report of theGodavari Water Disputes Tribunal. According to the agreement, Orissa willensure at its border 45 billion cubic feet in the Indravati and itstributaries at 75% dependability. The planning of the Bodhghat project takesinto account the interstate agreements. Thus, there are no standinginterstate water rights issues regarding this project.
Land Acquisition and Resettlement
3.20 Total land area required for the project is about 13,250 ha of whichabout 4,650 ha (35%) is private property, 5,480 ha (41%) is State ownedforest land, and the balance (24%) is owned by the Revenue Department ofIndia. The surveying and valuation of the private plots, have been alreadycompleted and the notifications of purchase to the landowners have beenissued. Valuation of property (houses, fruit bearing trees etc.) is alsounderway. Land for compensatory afforestation and relocation of outsees hasalso been identified and is already owned by the State.
3.21 About 2300 families are expected to be displaced during 6-7 yearsconstruction and reservoir filling period, of which about 75% are tribals.MPEB has prepared a resettlement program setting priorities for the transferof the affected population in a sequence consistent with the construction ofthe project. The Government of Madhya Pradesh has constituted since 1982 aRehabilitation Committee under the chairmanship of the Bastar DivisionalCommissioner. This committee is represented by district level officers ofRevenue and Tribal Welfare, and other concerned departments and electedrepresentatives of the people of the affected region. The committee isresponsible for the identification of suitable areas for resettlement of the

-26-
outsees from the project area and to ensure that the affected population areprovided with alternative means of subsistance in addition to payment ofadequate compensation for any private properties acquired. The committeewill also oversee the execution of the environmental protection program (para3.22). Of the 2300 families to be relocated 519 own more than 5 acres ofland, 403 own less than 5 acres, and the balance are landless peasants. Allwill receive 5 acres plots each and adequate cash compenssation asapplicable. MPEB has already selected four adjointing tribal areas wherestate land is available to compensate the affected population. Sufficientfunding provision have been made in the project estimates for acquisitionof land and properties and no problems are expected in this regard.Sufficient funds have been also allocated for the construction of housing andrelated infrastructure and facilities to relocate the displaced population.It was agreed that MPEB will report quarterly, starting in December 1984, onthe progress of the resettlement program. MPEB will also provide, by June30, 1985, a plan for proposed Tribal Training Center at Barsoor, which willprovide training for tribals affected by land subsurgence.
Environmental Aspects
3.22 The Project has been cleared by the Department of Environment (DOE),GOI, and by the Wild Life Wing of the Madhya Pradesh State Forest Department.The studies carried out by the Forest Department indicate that the projectarea does not have any flora or fauna or any rare species which would sufferby the construction of the project. DOE has indicated that the projectauthorities should take a number of measures to promote preservation of wildlife, minimize soil erosion, and prevent health problems as a consequence ofthe project. Adequate funding provisions have been made in the projectestimates to carry out the environmental protection program including thecompensatory afforestation of around 5,000 ha, and the promotion of fishfarming in the reservoir itself. Since a number of the envisagedenvironmental actions need to be planned in further detail assurances wereobtained that MPEB will furnish the Bank Group, before June 30, 1985, with:
a) Detailed plan for the wildlife buffer zone aroundthe perimeter of the reservoir shore line includingmap, schedule, staffing and detailed budget.
b) Details of the fisheries and water management program(locations, budget, staff, schedule).
c) Details of the compensatory planting component(sites, schedule, detailed budget, etc.).
Project Operation
3.23 The catchment area of the Indravati river at Bodhghat (15,280 km2)amounts to 37% of the total basin area and the project is located in the

-Z7-
middle range land of the basin. As mentioned in para 3.19, the interstateagreements have been considered in the planning of the project and there areno meaningful water uses downstream of the powerhouse than may in any mannerconstrain the plant operation as planned. The average annual inf ow into thereservoir over a period of 34 years has been estimated at 5287 Mm of which4998 Mm (95%) occur during the monsoon period (June to October) and thebalance during the Son-monsoon season (November to May). Live reservoircapacity is 3715 Mm or 70% of the average annual inflow (74% of the averagemonsoon season inflow). According to the inflow series, the reservoirfilling can be accomplished in one year, as planned, with 90% probability.
3.24 Reservoir operation analysis indicate that with the full abstractionof Orissa's water share, as per the interstate agreements, the proposedproject will generate 104 MW (911 GWh) of firm power at 90% dependability and241 GWh annually as secondary energy during the monsoon season. During theinitial 10-15 years of operation, however, generation will be more sinceOrissa's development of water uses is planned in two stages. In this initialperiod the firm power will be 111.5 MW (966 GWh) and the annual secondaryenergy, 380 GWh. The plant is planned to be operated as a peaking facility.It is expected that, when fully commissioned, the plant will operate fivehours daily during the dry months at full capacity and between nine and sevenhours daily during monsoon, allowing adequate time in the season forscheduled maintenance of the units. Charts C-1 to C-4 show typical dailydispatch of the station in different wet and dry months in 1990-91. Detailsare provided in Table T-1.
Project Monitoring
3.25 MPEB has agreed to submit quarterly reports covering physicalprogress, consultants work progress, costs, disbursements, and administrativeaspects of the project. In addition there will be annual reports on thefinancial position and management situation of the Board. Progress on theloss reduction program will be reported quarterly and evaluated against theagreed program (para 2.09). Special provision has been made to monitor thepilot thermal plant rehabilitation project including the evaluation ofresults (Annex 15). Finally, assurances have been obtained duringnegotiations that MPEB will arrange, in a manner satisfactory to the Bank,for periodic inspections of the works constructed under the project in orderto ensure their safe operation and proper maintenance.
Project Risks
3.26 There are no extraordinary technical risks associated with theProject since the works to be constructed are well within the boundaries ofknown engineering technology. Necessary modifications to the layout anddesign concept of the Project have been introduced to improve safety andreliability of the proposed structures. Confirmatory site exploration haveindicated a sound foundation for the dam. Reservoir watertightness and bank
-28-
stability has been confirmed by the Bank Group's independent consultants.Sediment loads have been investigated and studies show that the 700 miLlioncubic meters of dead storage would be sufficient for around 100 years, ortwice the economic life of the project, which is considered satisfactory.The risks associated with potential poor construction, supervision orcontract management have been kept within acceptable limits by the provisionof appropriate consultant assistance to MPEB as needed. The risk of aninadequate supply of funds to the project is low, considering that MPEB'sannual contribution to it would represent less than 5% of its annualinvestments in 1983 and is expected to remain so during projectimplementaion. Thus, the project does not pose an unduly heavily burden onMPEB's finances. Satisfactory assurances were obtained during negotiationsthat the necessary GOI contribution of funds to the project will be allocatedin 1984/85 and in the Seventh Five-Year Plan starting 1985/86.

-29-
IV. FINANCIAL ANALYSIS
Background to SEBs Finances
4.01 The financial operations of SEBs are regulated by the Electricity
(Supply) Act of 1948, amended from time to time to accommodate changes inthe environment of the subsector. In June 1978, several amendments wereintroduced to enable SEBs to reorganize their finances along commerciallines. The States, however, have not progressed much in adopting cormimercialpractices, mainly because of anomalies in the Act. SEBs are allowed to avoidoperating losses by not paying interest on Government loans, or by charging
less than full depreciation on their assets in operation; in addition, theyare not capitalizing interest during construction. Recently, followingdiscussion with the Bank Group, GOI has proposed new amendments to the Act,aimed at removing the legal obstacles to the adherence by the SEBs to thecommercial principles of utility operations. These amendments would (i) setfinancial objectives for SEBs based on accounting practices; (ii) outlineproper accounting procedures for handling debt service and the capitalizationof interest during construction; and (iii) introduce uniform commercialaccounting. These amendments were approved by Parliament in August 1983(Annex 3). During negotiations GOI has agreed that the Electricity (Supply)Amendment Act of 1983 shall come into force not later than April 1, 1985.
4.02 In line with the requirements established in the Third RuralElectrification (Loan 2165-IN) to qualify for financial asssistance, fourteenSEBs gave formal undertakings, which were endorsed by their StateGovernments, to introduce measures that would improve their financialperformance. These included: (a) the realization of a net cash generationof not less than 20% of their average annual investment, starting in 1982/83;and (b) the limitation of the subsidies paid by the States to their SEBs tocover rural electrification losses, to a proportion acceptable to the BankGroup.
MPEB Financial Performance
4.03 Prior to Loan 2165-IN, MPEB was required under earlier Bank Groupagreements to achieve a rate of return of at least 9.5% on its net fixedassets in operation, based on their historical value. MPEB met thisrequirement in 1978/79 and 1979/80. However, it fell short of this target in1980/81 and 1981/82 with rates of return of 8.2% and 7.8% respectively.Furthermore, MPEB realized only a 5% net cash generation instead of therequired 20% iTn 1982/83 and it is expected that the net cash generation for1983/84 will amount to only 1% (Annex 20). This low cash contribution to

-30-
investment is partly attributable to heavy MPEB investments during the periodas well as to less than required tariff increases.
4.04 Tariff increases in the past have favored agricultural and householdconsumers and as a result industrial tariffs increased between 1978/79 and1982/83 at an average annual rate of 20%, while low voltage tariffs decreasedin real terms. In January 1984, the average tariff paid by bulk andindustrial consumers, representing about 75% of the total consumption, was ata level of about 90% of the LRMC while that for low voltage consumers, whoaccount for 25% of total consumption, was at a level of about 36% of the LRMCof supply (Annex 18). In order to achieve the required 20% net cashgeneration in 1984/85, the average revenue would have to be increased byabout 20% by April 1984. As for 1985/86 to 1991/92, yearly increases rangingbetween 2% and 7% would be required. The heavy initial increases requiredare partly a consequence of the lumpy investments being carried out by MPEBfor a major capacity expansion to be commissioned in the coming two or threeyears. Such increases would have a more significant effect on the lowvoltage consumers since their tariffs are considerably less than the economiccost of supply. However substantial increases to the domestic consumers areextremely difficult in view of the low consumption (only 25 kWh/month perconnection) and the need to maintain a basic minimum supply at affordableprices. Similarly it is GOI s policy to maintain reduced tariffs for basicirrigation uses on social considerations. The low tension consumption forirrigation averages about 85 kWh/month per connection. In view of thesereasons at time of appraisal the State Government felt that a 20% increase inApril 1984 would be unattainable. Consequently, during negotiations, theIndian delegation sought more time for complying with this covenant andhence, it was agreed to accept their proposal for a gradual realization ofthe cash generation target as follows: 8% in 1985/86; 17% in 1986/87; and20% in 1987/88. The targets would be achieved through the combined resultsof tariff increases, cost control, improved thermal efficiency, improvedbilling and metering, and loss reduction. It was also agreed that a newfinancing plan based on these targets will be prepared by GOI and GOMP andwill be provided to the Bank before May 31, 1984. The tariff increasesrequired to achieve the gradual realization of the cash generation covenantwill be about 16.4% at the beginning of 1985/86, 9.4% in 1986/87, and 6.7% atthe beginning of 1987/88. However, these increases may be revised on thebasis of the new financing plan to be provided by GOI.
4.05 In 1979 thirteen LRMC studies were prepared by individual SEBs, underthe guidance of the Bank Group. These studies, after being discussed withGOI, have led the Bank to derive a uniform methodology for the calculation ofLRMC in India-s SEBs as well as the relevant computer program. The BankGroup provided GOI, in March 1982, with the details of this methodology forits consideration and comments. However GOI has not responded to the BankGroup proposal in this regard. During appraisal it was found necesssary tocalculate the LRMC tariff for MPEB. This calculation was prepared on thebasis of an earlier study of LRMC carried out by the Board with the guidance

-31-
and assistance of the Bank Group. Because of the need for a uniformmethodology for the calculation of LRMC tariff in all SEBs, GOI agreed torespond to the Bank-s proposed methodology before October 31, 1984.
Billing and Collectioil
4.06 At the end of FY83 MPEB had about 2,145,000 consumers, of which434,000 (20%) were large industrial and commercial consumers, 1,311,000 (61%)domestic, 373,000 irrigation pumps and 27,000 general consumers. Meters areread monthly except for the low voltage sales, where meters are read everytwo months. Bills are issued every month for all consumers. The bills forlow-voltage consumers in the month in which meters are not read are basedupon average consumption in the preceding fiscal year. In 1982/83 about 95%of MPEB consumers were billed regularly, and about 72% of the revenue wasfrom HT consumption (950 consumers with individual demand of 5 MW and above).About 94% of the revenues from all categories of consumers are collectedduring the billing year (Annex 21) and accounts receivable during the last 3years have been less than the equivalent of 3 months billing, an acceptablelevel of arrears in India.
MPEB-s Financial Projections
4.07 CEA has prepared MPEB-s financial projections covering the periodbetween 1983/84 and 1991/92, based on financial data and information providedby MPEB. CEA used the approved annual investments of the Sixth Five-Yearplan for 1983/84 and 1984/85 and the provisional annual investment figures ofthe Seventh Plan which will commence from 1985/86. These investments areexpressed in current prices, escalated in accordance with the priceprojections used by the Bank Group. The other assumptions used by CEA toprepare the financial projections are included in Annex 21. However, thefinancial projections suffer two principal shortcomings: (a) the projectedtariff increases are lower than needed to achieve the 20% internal cashgeneration required by the Bank Group, and (b) the annual expenses foroperation and maintenance are understated. Consequently, the attachedfinancial projections have been prepared to reflect the gradual realizationof the cash generation covenant besides taking in consideration realisticassumptions for operation and maintenance expenses (Annex 21).
4.08 Presently, the security deposits collected annually are included indetermining internal cash generation. Consequently, changes in the size ofthe deposits alters the level of cash generation. At the end of 1982/83,the deposits amounted to about 0.76 of the monthly sales during that fiscalyear. In the financial projections prepared by CEA, a two-month level ofaccumulated security deposits has been assumed. Since GOI and MPEB haveindicated that raising the security deposit is the SEB-s prerogative and isachievable, agreement was reached during negotiations that MPEB willgradually raise the level of consumer cash security deposits to reach two

-32-
months equivalency of sales by 1989/90 based on annual targets provided bythe Indian delegatiorn and found acceptable
Future Financial Situation
4.09 MPEB-s financial situation is expected to develop over the projected
period as follows:
Table 4.1: MPEB Projected Financial Situation 1983/84-1991/92
Rate of Return on Net Internal CashNet Fixed Assets Generation - as % Tariff
Operating in Operation of 3 Year Average IncreasesFiscal Year Ratio (Historically Valued) Investment Assumed 1/
84 98 8.1 185 101 - 186 93 8.1 8 16.487 84 8.4 17 9.488 89 11.6 20 6.789 92 10.3 22 90 93 9.8 20 3.791 97 8.1 20 3.092 97 7.8 20 5.3
This projected financial situation is based on the gradual realization ofthe cash generation to achieve 20% in 1987/88 and the required tariffincreases.
Debt/Equity Situation
4.10 SEBs obtain most of the funds for their investment by borrowing fromthe State Governments. This practice has resulted in a debt oriented cap.italstructure with almost no equity. Currently 67% of MPEB's outstandinglong-term debt is in the form of loans from GOMP, resulting in a debt/equityratio of about 98/2. Although the States are permitted to convert theirloaus to SEBs into equity or to make equity contributions to SEBs'investments, the States have not taken any steps in this direction. The BankGroup has been discussing this issue with GOI, which is aware of theseriousness of the situation. GOI and the Bank Group will continue thediscussion in future to seek an acceptable arrangement in this regard.
1/ In real terms.

-33-
Financial Plan
4.11 MPEB's estimated financial requirements for the period 1984/85
through 1991/92, (the period of construction of the proposed project) and thesources of funds are summarized as follows:
Table 4.2: MPEB Financing Plan 1984/85 through 1991/92
Rupees US$ Million PercentageRequirement Million (Equivalent) (%)
Annual Investment:Capital Expenditure 46,576 4,657.6 91.5
Interest during construction 3,967 396.7 7.8Total Investment 50,543 5,054.3 99.3
Other Investment 162 16.2 0.3Change in Working Capital (1505) (150.5) 0.4
Total Requirement 49,200 4,920.0 100.0
Source of Funds
Gross Cash Generation 35,240 3,524.0 72Less: Debt Service 27,104 2,710.4 55
Contribution to Investment 8,136 813.6 17Borrowing 40,184 4,018.4 81Staff Superannuation Fund 880 88.0 2
Total Sources of Funds 49,200 4,920.0 100.0
To finance its investment program (Annex 22), MPEB will depend on borrowingfrom GOMP and others to meet about 81% of its requirement during theprojected period. In accordance with the undertaking given under the ThirdRural Electrification (Loan 2165-IN) MPEB will realize from 1984/85 to1991/92 a total net cash generation equal to about 17% of the totalinvestment program for the period.
-34-
V. PROJECT JUSTIFICATION AND ECONOMIC ANALYSIS
Least Cost System Expansion and Project Sizing
5.01 In September 1982, CEA completed a 15 year least cost expansion planfor each one of the five regional power systems (para 1.13) in India. Thecomputer model used for the exercise (WASP III, adapted) takes the committedprojects as fixed input and the new hydro and thermal projects, with theirassociated capital and operating costs, as variables to determine the optimumexpansion sequence to meet the forecast demands. Generally, the results ofthe plan indicate that, among the different options, the one emphasizinghydropower development is usually the least cost one and that high forcedoutage rates increase the costs significantly. The plan also indicates thatmine-mouth coal fired plants should be generally favored against load centerones. In the Western Region expansion program, Bodhghat was considered as acommitted project. To confirm that the project remains part of the leastcost expansion, the Western Region program was updated to: a) treat theproject as a variable, b) take into consideration slippages that have occuredin ongoing and future projects since the plan was prepared, c) update demandforecasts and d) use economic costs.
5.02 The present worth of the updated, previously optimized, expansionprogram (investment, fuel, and O&M costs) with Bodhghat was compared withthe most realistic alternative plan without the proposed project. Thisalternative would include a pit head thermal station in the Mand-Raigarh areawhich would be added as base capacity displacing the less efficient and oldthermal units towards the peak operation. Gas turbines option as a peakingalternative was found to be more expensive than the mode of operationmentioned above. The thermal equivalent capacity for Bodhghat has beencalculated considering the lower availability of the thermal units whencompared with the hydro ones, as 840 MW. The necessary allowances for theassociated transmission have been included in the base case (with Bodhghat)and in the alternative.
5.03 Costs of the two alternative expansion series have been expressed ineconomic prices. CIF prices have been applied where possible, otherwise astandard conversion factor of 0.8 has been applied. Unskilled labor wasvalued at 0.75 of the market wage. The economic cost of coal at the pitheadwas estimated as its long run marginal cost of extraction due to its

-35-
non-tradable naturel/ (RsI72/ton). Operation and maintenance for thermalinstallation has been included at 2.5% for thermal and 1% for the hydro(Annex 24). A summary of the results follows:
Present Worth of PlanDiscount rate With Bodhghat Thermal Alternative
(Million Rs)
12% 61,403 66,05410% 72,052 78,0628% 86,234 94,173
Capacity Optimization
5.04 The optimum capacity of Bodhghat is 500 MW. To test the optimumcapacity, 400 MW and 300 MW have been analyzed. It has been assumed that ifBodhghat is reduced it would be necessary to install equivalent thermalcapacity in the system which will operate at the base displacing the rest ofthe plants towards a more peaking operation. Given the shape of the loadduration curve and the loading pattern when Bodhghat is commissioned, thisoperation would imply that part of the medium range thermal installationswould operate at a lower than present load factor and in a more inefficientmanner, although for less time than before the introduction of the new basecapacity. This net effect on fuel costs for the system has been consideredfor the optimization analysis, the net incremental system costs of a capacitylower than 500 MW at Bodhghat are as follows in million Rs:
Discount Rate Capacity Net Incremental System Costs(MW) (Million Rs)
8% 300 1018400 637
10% 300 812400 521
12% 300 658400 433
As it can be seen, capacities of Bodhghat lower than 500 MW result in higherpresent worth of system expansion. A summary of calculations and assumptions
1/ Indian coals have generally low calorific value (4500 kcal/kg) and highash content (40-45%) which render them non-competitive for exportmarkets.

-36-
is shown in Annex 24. Site limitations do not permit the development of ;morethan 500 MW at Bodhghat due to the impossibility of safely accommodating twopower tunnels (which would be required for higher capacities) through thenarrowest sections of the ridge under which the water conductor system hasbeen projected.
Cost Benefit Analysis
5.05 A two stage approximation approach has been adopted for thequantification of economic benefits arising from an expansion of generatingplant that is integrated into an existing and growing system: (i) averageretail tariffs in the Region have been assumed to represent a proxy for theminimum willingness to pay for power; and (ii) in order to quantify someadditional consumer surplus beyond this minimum, the cost incurred byindustrial consumers in maintaining and operating standby generating setshas been assumed to represent a proxy for industrial consumers' maximumwillingness to pay for continuous power supply.
5.06 The incremental amount of energy sold is adjusted to account forsystem losses typical of the Region. The weighted average of expected 1984tariff revenue at retail level in the Region has been estimated atRsO.536/kWh (USc54/kWh), and converted to border prices for purposes of thecomparison with economic cost. The industrial tariff revenue is replaced bythe observed average willingness to pay for continuous power supply,amounting to about RsO.64/kWh (USc6/kWh) in economic terms (Annex 23).
5.07 Corresponding to the definition of economic benefits as willingnessto pay at the retail level, additional costs of transmission and distributioninvestment (including operating and maintenance expenses) have been allocatedto the cost of the expanded system in line with the general Regionalinvestment pattern. Benefit and cost streams as well as the ERR calculationsare presented in Annex 24.
5.08 The minimum economic rate of return is about 11%, falling to about9.2% if more pessimistic cost and benefit assumptions are tested. The trueinternal rate of return is likely to be considerably higher than the minimumquantifiable estimate if the consumers' and derived producers' surpluses cfindustrial, agricultural, and commercial consumers are taken into account.It would be even higher if indirect benefits accruing to the Indian economyare fully considered. Benefits accruing to the non-industrial consumers arelikely to be understated by the use of the tariff as benefit proxy. Usingonly retail tariffs as measure of the benefit, the internal rate of return ofthe program is about 8.5%, falling to about 7.3% with more pessimisticscenarios. These results indicate that retail tariffs including electricityduty in the Region are economically inadequate to ensure an acceptablefinancial return on the proposed expansion program.

-37-
5.09 It is not possible to prepare a meaningful quantitative economicjustification of the thermal plant rehabilitation program at this stage dueto its pilot nature. Adequate provisions have been made for the consultantsto assess the cost effectiveness of the different actions to be taken and ofthe program in its entirety. Preliminary estimates indicate that some 100 MWof additional power could be obtained with the program at an average costof US$250/kW, which is indicative of its high cost-effectiveness.
Justification for Bank Participation
5.10 Bank participation in the project would facilitate the continuingdialogue with GOI about the achievement of agreed sector objectives. Thisproject will offer the Bank the opportunity to be directly involved for thefirst time in a SEB-owned project enabling it to promote the implementationof managerial and financial procedures established for the sector (commercialaccounting, adequate cash generation, improved management, etc). On thetechnical side the standards currently used for preparation of engineeringand contract documents intended for international bidding need to beimrpoved. In fact, there is no substantial experience in this regard in thehydropower sector in India, since most of the existing projects have beenconstructed through a combination of local contractors and force account.With the increased emphasis on hydropower in India and increased externalfinancial assistance for hydropower projects engineering standards more inline with the international procurement practice will be necessary. Thisproject would expose CWC and MPEB to major international procurement andthrough the envisaged independent consultants assistance it is expected thatsubstantial improvements in the engineering standards can be achieved to beused in future projects. The project also addresses one of the more pressingneeds in India, the better use of existing thermal facilities. It isexpected that based on the results of the proposed thermal plantrehabilitation pilot project, GOI will have a better understanding of theissues involved in the preparation of a more ambitious, project. Finally theproject will serve as a vehicle for studies on electricity meteringpractices, leading eventually to a definition of a general policy in thisrespect, and to better billing and collection practices.

-38-
VI. AGREEMENTS AND RECOMMENDATION
6.01 The following agreements were reached at negotiations:
(a) Loans from GOMP to MPEB will be repaid over a period of25 years with the rate of interest then applicable for GOMPlending to MPEB or 7.5% p.a. whichever may be higher(para 2.01);
(b) MPEB will furnish for Bank Group approval, before October 31,1984, the proposed system of accounts for the Project, includingmanuals, regulations and report formats (para 2.06);
(c) MIPEB will introduce commercial accounting from April 1,1985. MPEB will retain local consultants to assist inthe implementation of the system. TOR for these consultantswill be furnished to the Bank by October 31, 1984 (para 2.06);
(d) MPEB will furnish a detailed loss reduction program beforeMay 31, 1984. MPEB will implement the electricity lossreduction program agreed with the Bank Group (para 2.09);
(e) The metering study in selected states will be completed byMay 1986 (para 3.04);
(f) MPEB will complete the necessary transmission works toevacuate the power from the project before 1990. Detailedengineering for these transmission facilities will be completednot later than June 30, 1986 (para 3.06);
(g) GOI wiLl seek cofinancing for the turbogenerator sets ifthe contract is won by a foreign supplier after ICB(para 3.08);
(h) Consultants for the thermal plant rehabilitation programand for the upgrading of the data processing unit willbe retained no later than December 31, 1984 (paras 3.15
and 3.16);
(i) MPEB will furnish before June 30, 1985: i) Details for the
organization of the Tribal Training Center at Barsoor,ii) Details of the fisheries and water management program,and iii) Details of the compensatory planting program(paras 3.21 and 3.22);
-39-
(j) MPEB will furnish to the Bank a detailed plan for the wild
life buffer zone before June 30, 1985 (para 3.22);
(k) The Electricity (Supply) Act of 1983 shall come into force
not later than April 1, 1985 (para 4.01);
(1) MPEB shall realize a net cash generation equal to 8% of itsaverage annual investment in 1985/86, 17% in 1986/87 and 20%in 1987/88. GOI and GOMP will provide to the Bank beforeMay 3l, 1984, a new financing plan based on these targets(para 4.04); and
(m) MPEB will gradually raise the level of consumer cash securitydeposits from consumers to reach two months equivalencyof sales by 1989/90 based on a program acceptable to the BankGroup (para 4.08).
(n) GOI will respond to the Bank-s proposed methodology for thecalculation of the LRMC before October 31, 1984 (para 4.05);
Recommendation
6.02 The proposed Project is suitable for a Bank Loan of US$157.4 millionand an IDA Credit (Special fund) of SDR 134.4 million (US$143 millionequivalent).

INDIA
BODHGHAT HYDROELECTRIC PROJECT
Energy Generation, Sale and Pattern of Energy Consumption - All India
82-83Description 1951 56-57 60-61 65-66 68-69 73-74 78-79 79-80 80-81 81-82 (Prov.)
Installed Capacity (MW) 1835 2886 4653 9027 12957 16664 26680 28448 30214 32344 35363
Electricity Generated(GWh) 5858 9662 16937 32990 47433 66689 102523 104627 110821 122010 131525
Electricity Consumption(GWh) (Utilities only) 4793 7959 13953 26735 37352 50246 77293 78124 82473 90237 94226
Per Capita Generation(KWh) 20.80 30.90 43.90 73.81 97.82 126.26 159.60 160.00 166.20 182 194
Per Capita Consumption
(KWh) (Utilities only) 13.30 20 70 31.90 53.70 70.80 87.15 120.48 119.40 123.70 132 139
Consumption Pattern (%)
Domestic Light &Small Power 12.40 11.70 10.70 8.80 8.50 9.20 9.80 10.76 11.28 11.50 NA
Commercial Light &
Small Power 6.90 6.80 6.10 6.20 5.70 6.00 5.60 5.96 5.95 5.98 NA
Industrial Power 63.70 66.90 69.40 70.60 69.30 64.60 61.35 58.86 58.60 58.75 NA
Railway/Traction 6.90 5.10 3.30 4.00 3.30 3.00 2.83 2.95 2.82 2.78' NA
Agriculture Pumps 4.30 4.00 6.00 7.10 9.30 12.60 15.56 17.23 17.48 16.71 NA
Public Water Works,
Sewage Pumping, Public
Lighting & Others 5.80 5.50 4.50 3.30 3.90 4.60 4.86 4.24 3.87 4.28 NA
Total Z 100.00 100.00 100.00 100.00 100.00 100.00 100.00 100.00 100.00 100.00
NA - Not Available

-41- ANNEX 2
INDIA
BODHGHAT HYDROELECTRIC PROJECT
Projections of Energy Requirement and Peak Demand
on Utility Sysems - All India 11
Region Scenario 1984-85 1989-90 1994-95 2000-01
Electricity Requirements - GWh(at Power Station bus)
Northern High 49411 77666 116420 178836Low 47173 71713 104943 155215
Western High 50406 76382 112979 175626
Low 47458 68480 97096 144020Southern High 40314 60032 86583 133368
Low 37983 53777 74016 108361Eastern High 27393 41356 59916 91900
Low 25595 36516 50111 72206
North-Eastern High 2120 4028 6943 13051
Low 2004 3710 6299 11772
Peak Demand MW
Northern High 9563 14938 22213 34025Low 9157 13906 20193 29779
Western High 8618 13211 19541 30377
Low 8221 11935 17052 25293Southern High 7204 10709 15444 23789
Low 6835 9669 13306 19480
Eastern High 4767 7263 10523 16140
Low 4458 6463 8869 12779North-Eastern High 443 855 1495 2865
Low 420 792 1370 2635
1/ Demand forecasts prepared for the National Power Plan by CEA, using
different methods for different consumer categories. The industrial
demand forecast is based on empirical relationships between growth of
electricity consumption and growth of value added in Industry; irrigatioupumping forecasts are dependent on the planned rate of new pump
connections, the expected utilization rates, and the replacement rate ofdiesel pumps. Residential and commercial use is extrapolated from pastrelationships over time. Two scenarios, depending on assumptions of
higher or lower growth of industrial value added, have been developed.

INDIA
BODHGHAT HYDROELECTRIC PROJECT
Electricity (Supply) Act, 1948
Approved Amendments, August 1983
ORIGINAL PROPOSED APPROVED
S.59(Addition/Deletion/Modification) (Addition/Deletion/Modification)
General principles for Board's Subsection (1) of Section 59 shall be Subsection (1) of Section 59 isfinance - (1) The Board shall, substituted by the following:- substituted by the following:-after taking credit for anysubvention from the State "The Board shall, after taking credit "The Board shall, after taking creditGovernment under section 63, for any subvention from the State for any subvention from the Statecarry on its operations under Government under section 63, carry Government under section 63, carrythis Act and adjust its tariffs on its operations under this Act and on its operations under this Act andso as to ensure that the total adjust its tariffs so as to ensure adjust its tariffs so as to ensurerevenues in any year of Account that the total revenues in any year that the total revenues in any yearshall, after meeting all of Account shall, after meeting all of Account shall, after meeting all Iexpenses properly chargeable expenses properly chargeable to expenses properly chargeable to .to revenues, including revenues, including operating, revenues, including operating, Ioperating, maintenance and maintenance and management expenses, maintenance and management expenses,management expenses, taxes (if taxes (if any) on income and profits, taxes (if any) on income and profits,any) on income and profits, depreciation and interest payable on depreciation and interest payable ondepreciation and interest all debentures, bonds and loans, all debentures, bonds and loans,payable on all debentures, leave such surplus which shall not leave such surplus as is not less thanbonds and loans, leave such be less than 3% of the net fixed three percent, or such higher percentage,surplus, as the State Govern- assets employed by rhe Board or such as the State Government may, by notifica-ment may, from time to time, higher percentage of such assets as tion in the Official Gazette, specify inspecify. the State Government may, from time this behalf, of the value of the fixed
to time, specify." assets of the Board in services at the(2) In specifying the surplus beginning of such year.under subsection (1), the StateGovernment shall have due regard For the purposes of this subsection valueto the availability of amounts of the fixed assets of the Board in serviceaccrued by way of depreciation at the beginning of the year means theand the liability for loan original cost of such fixed assets as re-amortization and leave:- duced by the aggregate of the cumulative
depreciation in respect of such assets(a) a reasonable sum to calculated in accordance with the provisions
contribute towards the of the Act and consumer's contributions forcost of capital works and service lines.
(b) where in respect of theBoard a notification hasbeen issued under sub- tsection (1) of sectiorn 12-A, °
00Zca

ORIGINAL PROPOSED APPROVED
S-59
a reasonable sum by way ofreturn on the capitalprovided by the StateGovernment under subsection(3) of that section and theamount of the loans (if any)converted by the State Govern-ment into capital under sub-section (1) of Section 66-A.
S.67
Priority of liabilities of Board - Section 67 to be substituted by the Section 67 to be substituted by the(1) If in any year, the revenue following:- following:-receipts are not adequate to enablecompliance with the requirements of "Priority of Liabilities of the Board "Priority of Liabilities of the BoardSection 59, the Board shall after - The Board shall distribute the - The Board shall distribute themeeting its operating, maintenance surplus of the revenues in any year surplus referred to in subsection (1)and management expenses after after meeting all the expenses of Section 59, to the extent availableprovision has been made for the referred to in subsection (1) of in a particular year, in the followingpayment of taxes (if any) on income Section 59, to the extent such order, namely:-and profits, distribute the revenue surplus is available and the amountsreceipts, as far as they are avail- accrued by way of depreciation for (i) repayment of principal of anyable, in the following order, namely:- the year, in the following order, loan raised (including redemp-
namely:- tion of debentures or bonds(i) payment of interest on loans issued) under section 65 which
guaranteed under section 66; (i) repayment of principal of any becomes due for payment in theloan raised (including redemp- year or which became due for
(ii) repayment of principal of tion of debentures or bonds payment in any previous yearany loan raised (including issued) under section 65 which and has remained unpaid;redemption of debentures of becomes due for payment in thebonds issued) under section 65 year or which became due for (ii) repayment of principal of anywhich becomes due for payment payment in any previous year loan advanced to the Board byin the year; and has remained unpaid; the State Govt. under section 64
which becomes due for payment(iii) payment of interest on loans (ii) repayment of principal of any in the year or which became due
guaranteed under section 66; loan advanced to the Board by for payment in any previous yearthe State Govt. under section 64 and has remained unpaid;
(iv) payment of interest on sums which becomes due for paymentpaid by the State Government in the year or which became due (iii) payments for purposes specifiedin pursuance of guarantees for payment in any previous year in subsection (2) of section 59under Section 66; and has remained unpaid; in such manner as the Board may U
decide. °(v) payment of interest on loans and if any balance is left thereafter,
advanced to the Board by the the same shall be utilized for other r
State Government under section purposes specified in subsection (2) )64 or deemed to be advanced of section 59 in such manner as the 0

ORIGINAI. ROPOSEI) APPROVED
S-67
under substation (2) of Board inay decide.section 60;
(vi) repayment of principal ofany loan guaranteed by theState Government undersection 66 which becomes duefor repayment in the year orwhich became due for paymentin any previous year and hasremained unpaid;
(vii) repayment of principal of anyloan advanced to the Boardunder section 64 whichbecomes due for payment in theyear or which became due forpayment in any previous yearand has remained unpaid:
and if any balance amount isleft thereafter, the sameshall be utilized for theother purposes specified insection 59 in such manner asthe Board may decide.
(2) If for any reason beyond thecontrol of the Board, the revenuereceipts in any year are notadequate to meet its operating,maintenance and managementexpenses, taxes (if any) onincomes and profits and theliabilities referred to inclauses (i) and (ii) of sub-section (1), the shortfall shall,with the previous sanction of the
State Government, be paid out of - A
Its capital receipts.
A new Section 67-A to be inserted as A new Section 67-A to be inserted as
following:- following:-
"If for any reasons beyond the control Any interest which is payable on loans t
of the Board revenues in any year are advanced under section 64 or deemed to m
not adequate to meet all the expenses have been advanced under section 60 t
referred to in subsection (1) of to the Board by the State Government
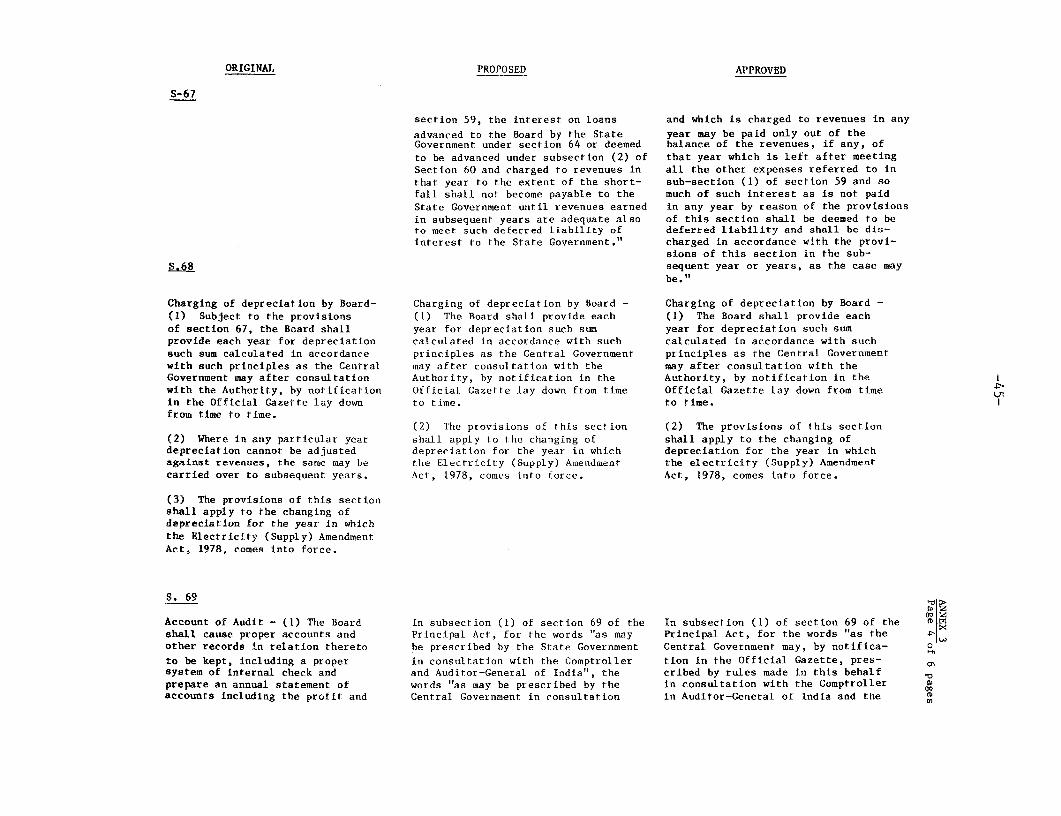
ORIGINAL PROPOSED APPROVED
S-67
section 59, the interest on loans and which is charged to revenues in any
advanced to the Board by the State year may be paid only out of theGovernment under section 64 or deemed balance of the revenues, if any, ofto be advanced under subsection (2) of that year which is left after meetingSection 60 and charged to revenues in all the other expenses referred to inthat year to the extent of the short- sub-section (1) of section 59 and sofall shall not become payable to the much of such interest as is not paidState Government until revenues earned in any year by reason of the provisionsin subsequent years are adequate also of this section shall be deemed to beto meet such deferred liability of deferred liability and shall be dis-interest to the State Government." charged in accordance with the provi-
sions of this section in the sub-S.68 sequent year or years, as the case may
be."
Charging of depreciation by Board- Charging of depreciation by Board - Charging of depreciation by Board -(1) Subject to the provisions (1) The Board shall provide each (1) The Board shall provide eachof section 67, the Board shall year for depreciation such sum year for depreciation such sumprovide each year for depreciation calculated in accordance with such calculated in accordance with suchsuch sum calculated in accordance principles as the Central Government principles as the Central Governmentwith such principles as the Central may after consultation with the may after consultation with theGovernment may after consultation Authority, by notification in the Authority, by notification in thewith the Authority, by notification Official Gazette lay down from time Official Gazette lay down from timein the Official Gazette lay down to time. to time.from time to time.
(2) The provisions of this section (2) The provisions of this section(2) Where in any particular year shall apply to the changing of shall apply to the changing ofdepreciation cannot be adjusted depreciation for the year in which depreciation for the year in whichagainst revenues, the same may be the Electricity (Supply) Amendment the electricity (Supply) Amendmentcarried over to subsequent years. Act, 1978, comes into force. Act, 1978, comes into force.
(3) The provisions of this sectionshall apply to the changing ofdepreciation for the year in whichthe Electricity (Supply) AmendmentAct, 1978, comes into force.
S. 69
Account of Audit - (1) The Board In subsection (1) of section 69 of the In subsection (1) of section 69 of the m M
shall cause proper accounts and Principal Act, for the words "as may Principal Act, for the words "as theother records in relation thereto be prescribed by the State Government Central Government may, by notifica- 0
to be kept, including a proper in consultation with the Comptroller tion in the Official Gazette, pres-system of internal check and and Auditor-General of India", the cribed by rules made in this behalfprepare an annual statement of words "as may be prescribed by the in consultation with the Comptroller maccounts including the profit and Central Government in consultation in Auditor-General of India and the m
5

ORIGINAL PR(POSED APPROVED
S-69
loss account and the balance sheet with the Comptroller and Auditor State Government.in such form as may be prescribed General of India and the Stateby the State Government in consult- Governments" shall be substituted. No change in subsection 69(2) to (5).ation with the Comptroller andAuditor-General of India. No change in subsection 69(2) to (5).
(2) The accounts of the Boardshall be audited by the Comptrollerand Auditor-General of India or bysuch person as he may authorize inthis behalf and any expenditureincurred by him in connection withsuch audit shall be payable by theBoard to the Comptroller andAuditor-General of India.
(3) The comptroller and Auditor-General of India or any personauthorized by him in connectionwith audit of the accounts of theBoard shall have the same rights,privileges and authority inconnection with such audit as theComptroller and Auditor-General of ;>
India has in connection with theaudit of Government accounts andin particular shall have the rightto demand the production of books,accounts, connected vouchers andother documents and papers, and toinspect any of the officers of theBoard.
(4) The accounts of the Board ascertified by the Comptroller andAuditor-General of India or anyother person authorized by him inthis behalf together with the 1
5audit report thereon shall beforwarded to the Authority andto the State Government within six omonths of the close of the year towhich the Accounts and audit report o
relate, and that Government may >
issue such instructions to the Board nin respect thereof as deems fit andthe Board shall comply with suchinstructions.

ORIGINAL PROPOSED APPROVED
S-69
(5) The State Government shall -(a) cause the accounts of the Boardtogether with the audit report thereonforwarded.to it under subsection (4)to be laid annually before the Statelegislature; and
(b) cause the account of the Boardto be published in the prescribedmanner and make available copiesthereof on sale at a reasonable price.
e4
rQt4z
0
OQ
a >m

INDIA
BODHGHAT HYDROELECTRIC PROJECT
Energy Generation, Sale and Pattern of Energy Consumption - Western Region
82-83Description 1951 56-57 60-61 65-66 68-69 73-74 78-79 79-80 80-81 81-82 (Prov.)
Installed Capacity(MW)I/ 520 839 1360 2266 2999 3552 7373 7809 8335 8875 10045
Electricity Generation(GWh) 2688 3209 5016 9051 11176 17768 31243 32077 34953 37549 40735
Electricity ConsumptionUtilities (GWh) 1701 2776 4109 7548 10632 15519 24210 24834 26437 28329 29800
Consumption Pattern (%)
Domestic Light &Small Power 9.03 8.56 9.17 8.80 8.60 8.53 16.14 10.37 10.70 10.96 NA
Commercial Light &Small Power 6.23 6.29 6.10 5.82 5.52 5.51 9.91 5.64 5.56 5.85 NA
Industrial Power 64.98 68.54 72.04 74.02 72.71 70.22 38.73 63.48 62.43 61.93 NA
Railway Traction 16.82 13.43 9.33 6.51 4.65 4.65 8.79 4.23 4.86 3.53 NA
Agriculture Pumping 0.25 0.43 0.93 2.66 5.65 7.99 19.54 11.80 12.87 12.59 NA
Public Water Works,Sewage Pumping,Lighting & Others 2.69 2.75 2.43 2.19 2.87 3.10 6.89 4.48 3.58 5.14 NA
Total 100.00 100.00 100.00 100.00 100.00 100.00 100.00 100.00 100.00 100.00
NA - Not Avail-able
1/ Including share of capacity in Central Sector facilities (720 MW at the end of FY83).

-49-
ANNEX 5
INDIA
BODHGHAT HYDROELECTRIC PROJECT
Western Region - Installed CapacityAs of 31/3/1983
HYDRO THERMALName of Installed Name of InstalledScheme Capacity (MW) Scheme Capacity (MW)
1 2 1 2
GUJARATUkai 300 Ukai 640
Dhuvaran 588Gandhinagar 240Uttran 67.5A.E. Company 327.5Wanakbori 420Small Thermal/Diesel 33.6
Sub-total 300 Sub-total 2316.6
MADHYA PRADESHChambal Complex 193 Korba 540(MP's share)
Satpura (MP's Share) 807.5Amarkantak 300
Sub-toal 193 Sub-total 1647.5
MAHARASHTRAKoyna Complex 920 Nasik 910Purna 22.5 Koradi 1100Bhatgar-Vir 25 Bhusawal 482.5Vaitarna 60 Khaparkheda 90Radha Nagri 4.8 Paras 92.5Tata 285 Uran Gas Turbine 240
Trombay 330Parli 270
_______ Small Thermal Diesel 30Sub-total 1317.3 Sub-total 3545
CENTRAL SECTOR- Chola 96
Tarapur (Nuclear) 420Korba (S.T.P.S.) 210
Sub-total - Sub-total 726Total (Hydro) 1810.3 Total (Thermal) 8235.1
Total Installed Capacity asof 31/3/1983 = 10045 MW
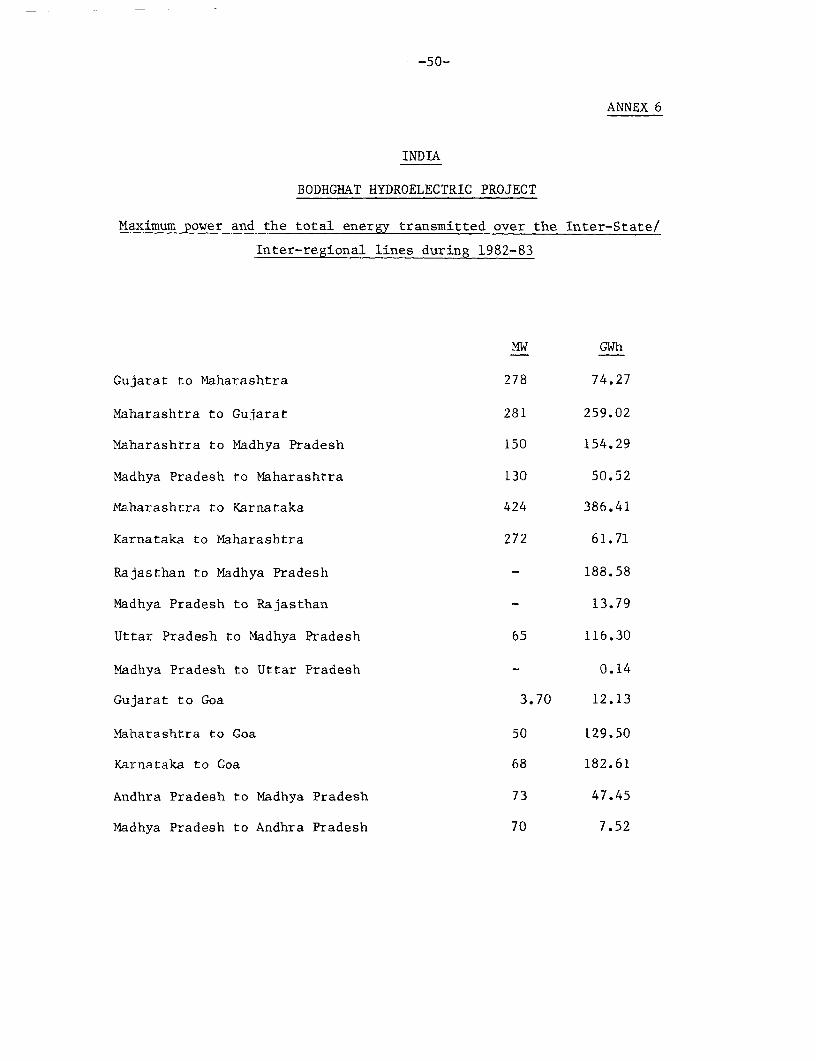
-50-
ANNEX 6
INDIA
BODHGHAT HYDROELECTRIC PROJECT
Maximum power and the total energy transmitted over the Inter-State/
Inter-regional lines during 1982-83
MW GWh
Gujarat to Maharashtra 278 74.27
Maharashtra to Gujarat 281 259.02
Maharashtra to Madhya Pradesh 150 154.29
Madhya Pradesh to Maharashtra 130 50.52
Maharashtra to Karnataka 424 386.41
Karnataka to Maharashtra 272 61.71
Rajasthan to Madhya Pradesh - 188.58
Madhya Pradesh to Rajasthan - 13.79
Uttar Pradesh to Madhya Pradesh 65 116.30
Madhya Pradesh to Uttar Pradesh - 0.14
Gujarat to Goa 3.70 12.13
Maharashtra to Goa 50 129.50
Karnataka to Goa 68 182.61
Andhra Pradesh to Madhya Pradesh 73 47.45
Madhya Pradesh to Andhra Pradesh 70 7.52

INDIA
BODHGHAT HYDROELECTRIC PROJECT
Western Region - Power Supply Position
--------------------------------Actual--------------------------------- ---------------------------Forecast-------------------------- ---------1974/75 1973/76 1976/77 1977/78 1978/79 1979/80 1980/81 1981/82 1982/83 1983/84 1984/85 1985/86 1986/87 1987/88 1988/89 1989/90 1990/91 1991/92
InstalledCapacity(MW1/ 4535 5525 5744 6190 7389 7809 8335 8875 10045 11595 13137 14606 15326 16526 18401 21636 23621 24486
PeakAvailability(HW)1/ 3273 3888 3897 4348 4714 4810 5308 5537 6200 7070 8010 9140 10020 10990 12050 13210 14290 15450
PeakDemand(rW)2/ - - - - - - - - 7500 8150 8800 9550 10350 11200 12150 13200 14300 15000
Surplus(Deficit)(NW) - - - _ _ _ _ _ (1300) (1080) (790) (410) (330) (210) (100) 10 (10) (50)
EnergyAvailability(GWh)l/ 0764 21984 24724 26929 29808 30273 33212 35494 38506 44500 48800 51000 200 59800 63400 69200 82600 89300
EnergyRequirement(GWh)2/ - _ _ _ _ _ _ _ 44545 47100 50900 55200 59800 64800 70200 76300 81400 88300
Surplus(Deficit)(GWh) - - - - - _ _ (6039) (2600) (2100) (4200) (3600) (5000) (6800) (7100) 1200 1000
1/ CEA figures as furnished during Project Appraisal. |
2/ Calculated on the basis of the National Power Plan projections starting with the actual 0peak in 1982/83.
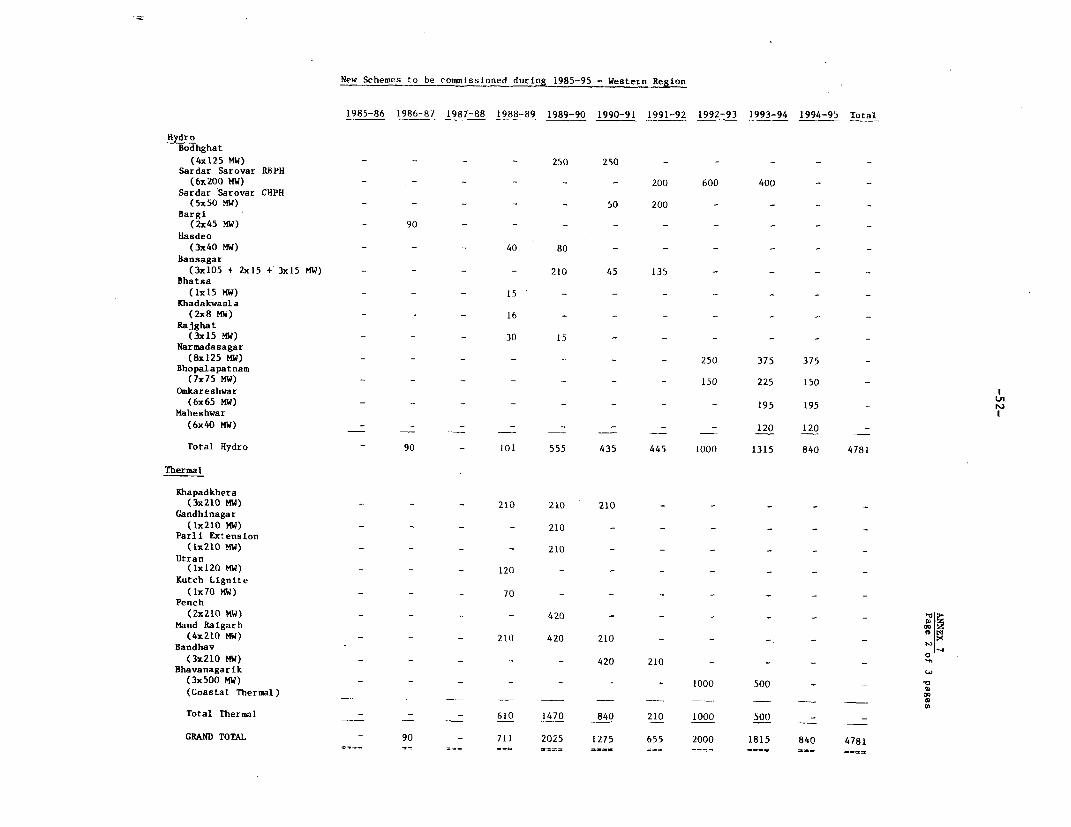
New Schemes to be commissioned during 1985-95 - Western Region
1985-86 1986-87 1987-88 1988-89 1989-90 1990-91 1991-92 1992-93 1993-94 1994-95 Total
HydroBodhghat
(4x125 MW) - _ _ _ 250 250 - - - - -
Sardar Sarovar RBPH(6x200 MW) - _- - 200 600 400 - -
Sardar Sarovar CHPH(5x50 MW) - _ _ _ _ 50 200 - - - -
Bargi(2x45 MW) - 90 - - _- -_ _ _ _
Haadeo(3x4O MW) - - - 40 80 - - - - - -
Bansagar(3x10⁵ + 2xl5 + 3xl5 MW) - - - - 210 45 135 - _ _ _
Bhatsa(IxI5 MW) - - - 15 - - - - _ _ _
Khadakwasla(2x8 MW) - - - 16 - - - - - - -
Rajghat(3x15 MW) - - - 30 15 - - - -
Narmadasagar(8x125 MW) - - - - - - - 250 375 375 -
Bhopalapatnam(7x75 MW) - - - - - - - 150 225 150 -
Omkareshwar(6x65 NW) - - - - - - - - 195 195 -
Maheshwar(6x40 MW) _ _ _ _ _ _ - 120 120 -
Total Hydro - 90 - 101 555 435 445 1000 1315 840 4781
Thermal
Khapadkhera(3x210 MW) - - - 210 210 210 - - - - -
Gandhinagar(lx210 MW) - - _ - 210 - - - - - _
Parli Extension(0x210 MW) - - - - 210 - - - - - -
Utran(1x120 MW) - - _ 120 - _ _ _ _ _ _
Kutch Lignite(Ix7O MW) - - _ 70 - _ _ _ _ _ _
Pench(2x210 MW) - - - - 420 - - - _ _ _
Mand Raigarh(4x210 MW) - - - 210 420 210 - _ _ _ _ X
Bandhav -(3x210 MW) - - - - - 420 210 - - - -
Bhavanagarik(3x500 MW) - - - - - - - 1000 500 - -
(Coastal Thermal) __
Total Thermal - - - 610 1470 840 210 1000 500
GRAND TOTAL - 90 - 711 2025 1275 655 2000 1815 840 4781-, e = = = = == X= = D>D "1 = = = = = =--- --- _ ....

Commissioning Ptogramme of Ongoing Schemes - Western Region
InstalledCapacity 1983-84 1984-85 1985-86 1986-87 1987-88 1988-89 1989-90 1990-91
A. Hydro
Ukai Left Bank Canal 5 - - 2x2.5 -
Kadana 240 - 1x60 2x60 1x60 - - - -
Paithan 12 - lx12
Bhira Tailrace 80 _ - 1x40 1x40 - - - -
Tillari 60 - - lx60
Bhandardara 43.5 -- - lxlO - 1x33.5
Pawana 10 - - - lxlO - - -
Pench 160 - - 2x80 - -
Total Hydro - 72 395 110 - 33.5
B. Thermal
Ukai (5th Unit) 210 1x210 - - - - -
Wanakbori 630 lx210
Wanakbori Extn. 630 - 1x210 1x210 lx210
Kutch (Lignite) 140 - 1x70 1x70
Sikka 120 - - - lx120
Sabarmati 110 - - xlO - - - - -
Gandhinagar Extn. 210 - - - - - 1x210
Satpura 8th & 9th 420 1x210 -
Korba West 420 2x210 -
Korba West Extn. 420 - 1x210 lx210
Birsingpur 420 - - - 1x210 - - -
Chandrapur-I 210 lx210 - - - - - -
Chandrapur Extn. 420 - 1x210 1x210 - - - -
Chandrapur-IV Unit 500 - - - - - - 1x500 -
Parli IV Unit 210 - - lx210 - - - - -
Trombay 500 1x500 - - - - - - -
Chandrapur VI Unit 500 - - - - - - - lx500
Central Sector
Korba S.T.P.S. St. I 1130 2x210 lx21() - - 1x500
Korba S.T.P.S. St. II 1000 - - - _ _ lx500 1x500 -
Vindhyachal 1260 - - - - 2x210 2x210 2x210 -
Total Thermal(MW) - 2180 840 950 400 1200 1340 1420 500
C. Gas Turbine w|
Urban Gas Turbine 240 - - 2x60 2x60 - - -
GRAND TOTAL 1550 1542 1465 630 1200 1373.5 1420 500 '
OQ
a

INDIA
BODHGHAT IHYDROELECTRIC PROJECT
MADHYA PRADESH ELECTRICITY BOARD (MPEB)
Power Supply Position
1975 1976 1977 1978 1979 1980 1981 1982 1983 1984 1985 1986 1987 1988 1989 1990 1991 1992
Installed capacity (MW) 772 772 892 1132 1132 1315 1511 1631 1841 2261 2471 3088 3088 3193 3768 4268 5358 5358
Peak availability (MW) 647 717 733 806 900 922 1103 1188 1383 1377 1649 1842 2103 2258 2613 3231 3691 3902
Peak demand (HW) - - - - - - - 1498 1675 1879 2131 2410 2722 3065 3446 3869 4333 4845(as per 11th Annual
Power Survey)
Deficit (MW) - - - - - - - 310 292 502 482 568 619 807 833 637 642 943
Energy availability (MKlWH) 3658 4173 4585 5214 5375 5605 5900 6458 7418 8841 10711 12845 13976 15523 18082 20936 22743 24377
Energy requirement (MKWH) - - - - - - - 8616 9688 10782 12227 13841 15640 17642 19865 22328 25052 28058(as per 11th A.P.S.)
Deficit (MMH) - - - - - - - 2158 2270 1941 1516 996 1664 2119 1783 1392 2309 3681

INDIA
BODHGHAT HYDROELECTRIC PROJECT
Energy Generation, Sale and Pattern of Energy Consumption - Madhya Pradesh
Description 1951 56-57 60-61 65-66 68-69 73-74 78-79 79-80 80-81 81-82 82-83
Installed Capacity (MW) 39 82 268 311 699 777 1318 1528 1630.5 1630.5 1840.5
Electricity Generated(GWh) 73 169 477 1208 2030 3268 5243 5722 5952 6520 7681
Electricity ConsumptionUtilities (GWh) 58 140 406 1028 1578 2541 4278 4347 4578 5027 5877
Consumption Pattern (x)
Domestic Light &Small Power 25.56 18.01 11.19 7.23 7.39 6.43 6.30 6.95 7.61 7.65 7.55
Commercial Light &Small Power 12.86 9.66 5.12 2.59 4.02 5.47 4.57 4.79 4.81 4.60 4.21
Industrial Power 39.74 55.21 74.26 84.44 81.40 77.02 72.68 73.78 73.21 72.39 71.36
Railway Traction - - - - - 2.28 2.37 2.37 2.47 2.83 2.50
Agricultural Pumping 0.33 0.49 0.96 1.14 2.44 4.95 6.58 7.75 7.49 7.42 9.41
Public Water Works,Sewage Pumping, Lighting& Others 21.51 15.63 8.47 4.60 4.75 3.85 7.50 4.36 4.41 5.11 4.97
Total 100.00 100.00 100.00 100.00 100.00 100.00 100.00 100.00 100.00 100.00 100.00

INDA
BODHGHAT HYDROELECTRIC PROJECT
MADHYA PRADESH STATE ELECTRICITY BOARD (MPEB)
Category Wise Units Sold in GWh
Compound GrowthYear Ending March 31 1974 1975 1976 1977 1978 1979 1980 1981 1982 1983 Rate
Domestic 152.02 173.93 195.972 212.35 245.53 272.54 302.54 350.32 385.24 443.7 12.4%
Commercial 125.25 144.36 161.193 172.87 185.59 195.36 206.45 218.72 231.47 247.66 7.0%
L.T. Industrial 165.65 184.35 232.598 255.37 260.89 290.57 298.94 313.88 350.93 393.70 9.9%
H.T. Industrial 1748.04 1917.07 2427.37 2548.414 2889.3 2958.61 2910.39 3027.22 3293.48 3800.74 8.9%
Railway Traction 58.03 67.37 84.65 98.12 99.01 101.5 102.88 112.86 142.38 146.79 10.2%
Irrigation 125.75 161.77 170.481 227.51 250.69 279.08 326.91 332.27 373.62 553.21 16.6%
Water Works 67.16 73.75 85.501 95.566 107.50 150.65 155.12 164.41 176.73 186.73 12.3%
Street Light 25.84 26.23 27.302 29.07 34.44 33.08 34.23 35.98 42.06 47.32 7.7% 0'
Licencees 73.78 32.57 - 3.57 6.36 7.31 17.41 22.48 34.18 54.77 6.7%
Outside the State 378.65 142.81 1.94 3.08 3.55 3.3 3.85 4.83 4.02 3.17 0.0%
Total Sale 2920.17 2924.18 3388.01 3738.63 4246.00 4292.00 4358.72 4582.98 5034.00 5877.79
C)-

INDIABODHGHAT HYDROELECTRIC PROJECT
Madhya Pradesh Electricity BoardOrganization Chart
Board
Miember MemberCh-irmn Ex-Officro Es-Officio Membeer
_ _ _ _ Engy Sect y Finance Sect y Genorstrion son Finssco
GOMP GOMP
Chairman
~~~~_ __ 7 __.I_
Secretaty MPEB Niernbyer Genrafion Member Trarnsmission Memnber Finance Chief Engineer& Distribution Hydel
Board Meeting Opration & Maintenance Co Mmercial Activities Finonce & Accounts OperatonPersonnel Load Despotch Stores Cost Accounting Construction
Statistics ProJects Design & Purchases Internal AuditTraining Projects Construction Rural Electricitication Stores Accounts
dinistration Projects Chief Engineers Regional Chief Engineer
Operation
Wcxid Bank-25748 °
(D0m

INDIA
BODHGHAT HYDROELECTRIC PROJECT
MADHYA PRADESH STATE ELECTRICITY BORAD (MPEB)
Analysis of Madhya Pradesh Electricity Board's Staff StrengthAs on March 31, 1983
CivilGenera- Trans- Distri- Engine- Projecttion mission bution ering ------------------------------- Staff carrying out functionsO&M o&M O&M & O&M & Thermal Hydel Trans- Sub-trans common to activities mentioned
Category Constn. Constn. mission mission in previous columns Total
1. Top Management 7 3 5 2 1 2 1 1 5 272. Middle Management 31 19 21 7 10 12 7 6 12 1653. Engineers 439 293 583 197 200 125 130 209 132 23084. Accounts, Audit &
Administrative Personnel 14 - 57 - 4 4 - - 85 1645. Cost Accountant - - - - _ 9 96. Chemist 64 - - - - - - - - 647. Computer Personnel - - - - - - - - 107 1078. Technical 1344 537 1222 145 205 264 126 274 75 41929. Skilled 2740 2522 3076 453 94 18 279 848 189 1021910. Un-skilled 2597 435 16332 1657 149 10 1459 1704 325 2466811. Meter Reader - - 363 - - - - - - 36312. Support Staff 3198 1495 10983 382 853 671 449 634 2038 20703 0n
Total 10434 5304 32682 2843 1516 1106 2451 3576 2977 62989
13. Daily Wage Worker - - - - - - - - 29636
NOTES:
1. The above figures give the number of sanctioned posts as on March 31, 1983.2. There is no sanctioned strength of daily wage workers and they are engaged as per work needs.3. There are no vacancies in categories No. 1 to 7.4. The extent of vacancy in categories No. 8 to 12 varies from 7.5 to 10%.5. On an average basis 50% of staff carrying out common functions is engaged in activities related to project & construction & 50% on 0&M.6. Similarly a part of staff for O&M in the Distribution & Civil Eng. activities also performs sizeable construction works. As a result about 8658
posts out of a total of 35525 posts in column 5&6 are utilised for construction works also. The total No. of regular persons engaged in construct-ion activities thus comes to 8058+8749 (total col. 7,8,9&L0)+1488 (50% of col. ll)-18895.
7. The strength of O&M personnel comes to 44094.8. Daily wage workers engaged in O&M works comes to 10% of total numbers of 29636, rest is engaed in construction work.9. The annual rate of growth of employees strength has been nearly 8 to 10% in the past. However, in coming 3 years, except meeting full staff
requirement of Thermal & Hlydel projects and project works, the Board would be exercising control over staff iucrease and establishment expenditure NoIin pursuance of the emphasis laid by Government of India and Planning Commission over reducing employees strength and expenditure. |X
'0

- 59 -
ANNEX 12Page 1 of 3 pages
INDIA
BODHGHAT HYDROELECTRIC PROJECT
MADHYA PRADESH STATE ELECTRICITY BOARD (MPEB)
In-House Training Course Organized by the Madhya Pradesh Electricity Board'sInstitute During Last Three Years (April 1980 to March 1983)
Number of Courses Number ofOrganised During Persons
Course the 3 year period Trained
A. REGULAR COURSES
1. Graduate Engineers Induc-tion Training Course 7 317
2. Diploma Engineers Induc-tion Training Course 50 975
3. Chemists Induction TrainingCourse 3 12
4. Lineman Refresher Course 21 729
5. Accountants and OfficeAssistants Refresher Course 29 795
B. SPECIAL COURSES FOR MANAGERS 1/
6. Project Management (Engineer/Accountant) 3 81
7. Computer Concepts 2 42
8. Industrial Safety 1 19
9. Maintenance of Transformers 4 222
1/ With the assistance of other training institutions.

ANNEX 12Page 2 of 3 pages
IN-HOUSE TRAINING
PROJECTIONS FOR COMING 3 YEARS
Number of Number ofA. REGULAR COURSE Courses Trainees
1. Graduate Engineers InductionTraining Course
a) Civil engineers 6 150b) Electrical Engineers 3 150c) Electronics Engineers 2 50d) Mechanical Engineers 2 50
2. Diploma Engineers InductionTraining Course 6 300
3. Lineman Refresher Course 12 360
4. Accountants and OfficeAssistant Refresher Course 24 720
B. SPECIAL COURSES FOR MANAGERS
5. Project Management 3 100
6. Computer Concepts 3 75
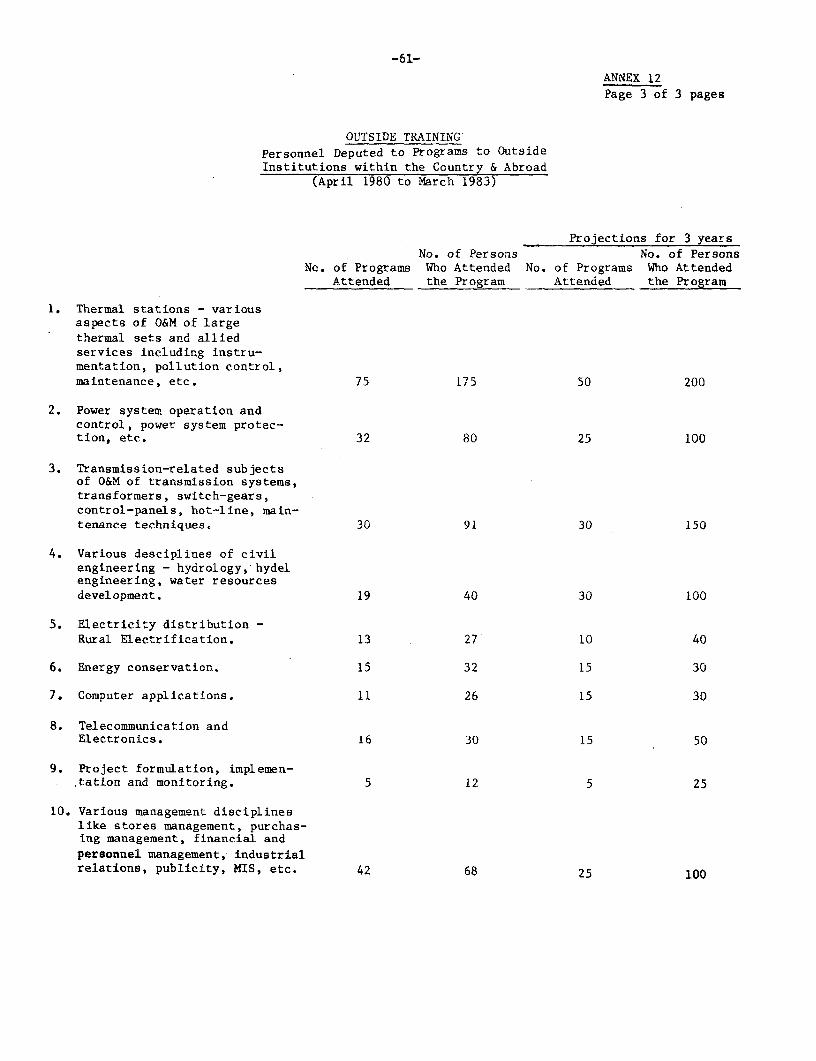
-61-ANNEX 12Page 3 of 3 pages
OUTSIDE TRAININGPersonnel Deputed to Programs to OutsideInstitutions within the Country & Abroad
(April 1980 to March 1983)
Projections for 3 yearsNo. of Persons No. of Persons
No. of Programs Who Attended No. of Programs Who AttendedAttended the Program Attended the Program
1. Thermal stations - variousaspects of O&M of largethermal sets and alliedservices including instru-mentation, pollution control,maintenance, etc. 75 175 50 200
2. Power system operation andcontrol, power system protec-tion, etc. 32 80 25 100
3. Transmission-related subjectsof O&M of transmission systems,transformers, switch-gears,control-panels, hot-line, main-tenance techniques. 30 91 30 150
4. Various desciplines of civilengineering - hydrology, hydelengineering, water resourcesdevelopment. 19 40 30 100
5. Electricity distribution -Rural Electrification. 13 27 10 40
6. Energy conservation. 15 32 15 30
7. Computer applications. 11 26 15 30
8. Telecommunication andElectronics. 16 30 15 50
9. Project formulation, implemen-tation and monitoring. 5 12 5 25
10. Various management disciplineslike stores management, purchas-ing management, financial andpersonnel management, industrialrelations, publicity, MIS, etc. 42 68 25 100

INDIAPODHGHAT HYDROELECTRIC PROJECT
Detailed Cost Estidates
Base Costs TotalBase Costs + Price Incl.
(Rupee Million) Foreigr Exchange Cont. on Cont.------------------------------------------------------------------------- ---------------- Base Costs (USS$83/84 84/85 85/86 86/87 87/88 88/89 89790 90/91 91/92 Total z Amount (US$ Million) Million)
1. INVESTMENT COSTS
A. CIYIL VMKS
LAND AND RELOCATION 4.0 26.0 39.0 46.0 46.0 39.0 - - - 200.G 0,0 0.0 24.2 27.8PRELIMINARY KOS 13.0 58.5 45.5 13.0 - - - - - 130.0 5.0 0.0 14.0 16.1DMN GRAVITY SECTION - 144.5 170.8 262.8 302.2 302.2 39.4 39.4 52.6 1,314.0 30.0 3?4.2 165.0 18Y.8DAM ROCKFILL SECTION 9.8 26.0 35.7 52.0 58.5 74.7 45.5 13.0 9.8 325.0 30.0 77.5 41.5 47.8INTAKE RS - 5.1 15.3 15.3 i5.3 - - - - I1O 10.0 5.1 6.0 6.9TWIELS AND SURGE TAWE - 28.3 42.5 56.6 56.6 '6.6 28.3 14.1 - 283.0 30.0 84,7 35.5 40.9POWER HOUSE - 16.8 16.8 16.8 12.6 12.6 8.4 - - :4.0 15.0 12.6 .10.2 11.7TAIL RACE CHANNEL - 21.5 43.0 43.0 43.0 32.3 21.5 10.7 - 215.0 10.0 :. 26.8 30.81ISCELLAIEOUS - - - - - 5.0 5.0 5.0 5.0 20.0 0.0 C. 3 0 3.4
Sub-Total CIVIL VORKS 26.8 326.7 408.6 505.5 534.2 522.4 148.1 82.3 67.3 2,622.0 23.5 615.8 326.2 375.2S. EOUIPNENI
TURDOGENERATORS AND AUXILIARY EQUIPMENT - 117.8 294.5 294.5 - 235.6 235.6 - - 1,178.0 52.0 612.6 144.7 151.9STATION AUXILIARY EOUIPMENT AND SERVICES - - - 7.7 23.1 23.1 15.4 7.7 - 77.0 30.0 23.1 10.1 10.9STEP UP TRANSFORMERS - - - 7.0 21.0 21.0 21.0 - - 70.0 10.0 7.0 9.4 9.9SWITCHYARD AIL.TFANSUISSION LINE - - - 5.3 15.9 15.9 15.9 - 53.0 10.0 5.3 7.6 7.96ATES, PENSTOCNK AND OTNER MECHANICAL EQUIPMENT - 17.1 57.9 43,5 39.7 17.0 13.2 6.6 - 195.0 3u.; 56.5 23.7 27.2
Sub-Total EQUIPMENT - 134.9 352.4 352.7 89.1 312.5 301.1 30.2 - 1!573.0 44.7 706.5 195.7 207.8C. TRANSPORTP INSURANCE AND ERECTION - 20.6 51.5 54.1 8.6 51.7 50.4 4.1 - 241.2 30.0 72.3 30.3 33.3D. THERIW' PLANT REHAUILIIATION - 17.5 87.5 105.0 70.0 ?0.P - - - 350.0 50.0 ;71., 42.3 42,3E. TRAININ6 AND CONSULTING SERVICES - 3.0 4.5 6.0 6.0 4.5 3.0 3.0 - 30.0 50.C 15.5 ".8 3.8F. ENGINEERING AND ADMINISTRATION 2.7 46.2 76.1 85.8 62.3 83.5 44.9 11.3 6.7 419.5 0.0 ).5 '2.5 55.4
Total INJESTMgEIIT COSTS 29-4 548,9 980.7 1,109.1 770,4 1,044.7 547.5 130.9 74.0 5.235.6 30.3 --- 84-6 S50.8 722.8Total IASELINE COSTS 29.4 548.9 980.7 1,109.1 770.4 1,044.7 547.5 130.9 74.0 5i235.6 30.3 1,584.6 650.8 722.8
Phvsical Contingencies 4.4 66.5 101.3 116.1 98.8 113.4 50.4 16.6 11.1 578.5 24.3 140.8 - -Price Contingencies - 22.1 122.0 238.2 241.1 405.3 255.7 77.1 52.2 1,413.8 28.5 402.3 - -
S33.8 637.4 1,203.9 I4,63.5 1110.3 1,563.4 853.6 224.6 137.4 7.227.9 29.4 2,127.7 650.8 722.8
Taxes - 62.5 183.9 201.5 46.5 183.5 164.8 8.8 - 851.5 0.0 0.0 - 85.2Foreisn Exchanse 3.4 167.9 377.5 462.1 273.1 473.1 286.5 50,0 34.1 2,127.7 00 0. 0 2;2.
1/ Aount includes: Land (about $11 million), Plantation (about US$3.5 million), Housing and relatedinfraetructure (about US$3.5 million) Cash. compenation (about US$2.0 million), Training Centre,Wildlife Protection and other envirotmental measures (about US$4.2 million).
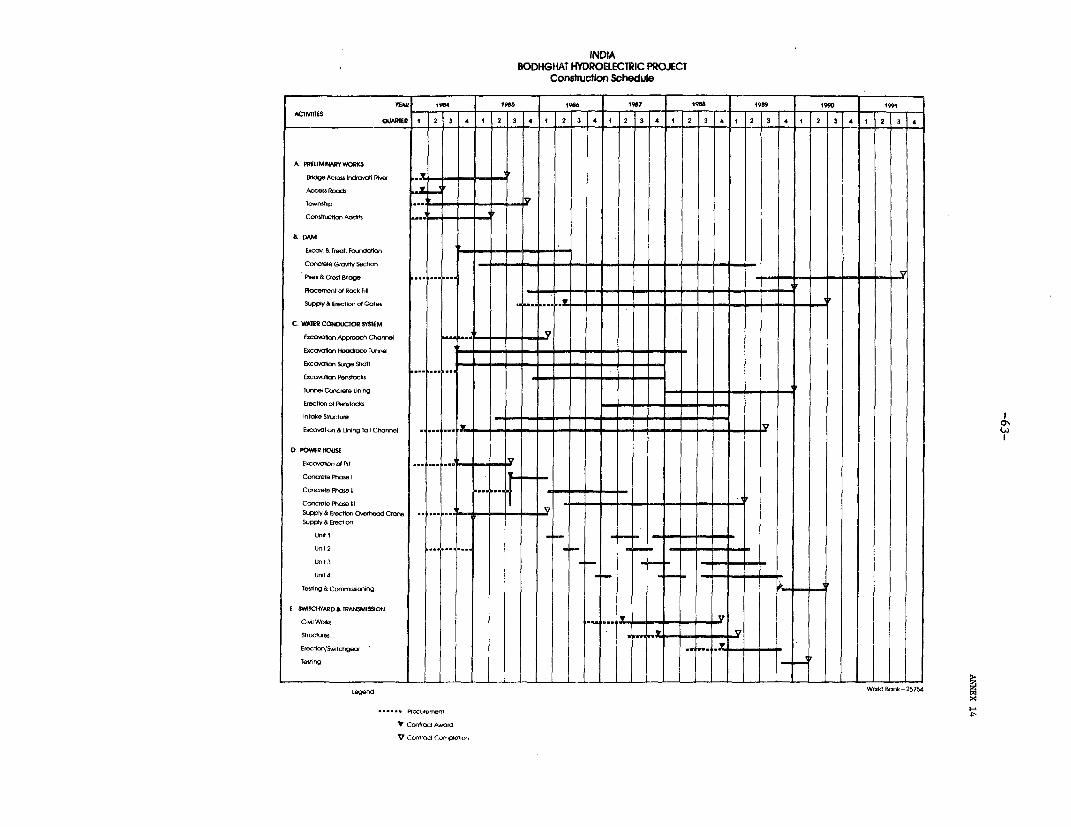
INDIABODHGHAT HYDROELECTRIC PROJECT
Constructlon Schedule
W 1954 1993 1re 19B7 19BB 19B9 1990 19"ACIMtIES I1~ - -
QUARTER 1 2 3 4 1 2 3 4 1 2 3 4 3 2 3 4 1 2 3 4 1 2 3 4
A PREUMINARYWORISS
Ondge Across Indr fiatl Riero
Acce tRodjs.
Toernthnp..…
Cotrtictin Acdrts
EaCes & Treat. Fourrdatktn - _ _ _ _ _
Corrorete Gao Styecton S _ _ _ c
Pir& Crent Bfdge ...........
Placement of4cmk F.1l
Suflp rrp& tonarGtes . .t. -_ _ _ _
C. WATER CONDLICTOR SYSTEM
EsCIoatlon Appach Channel
Excavation Headroe Tunnel… I
Fxcohn entcks P k -. _ _ _
Tunnel Ccrrcete Lonng
Eretion N Perrstkd
Intake SIitur"e-…- - - - - -
Excovaton & Lining Tall Channel . L -_ _ -_ _ _ _ r -_…V
D POWER HOUSE
CECrvt-of Atl ... .... _ r Jr__I Concete Ptor I
SopplYhFrEcton OverTred Cone - - -
Suwpv & Erection
UnIt I
umf 2 .. .... .. __Y_______...II
UnIt 3
UnIt 4
estIng & Co-mljsslonrng
E SVY.ICKVARD & TRANSMISSiON
Crl Wmor lr
Test1_n__I
Legencd Wotd Bank-25754
... P rorenrent
Y Contract Aword
V Contrct cornplet,on

-64-ANNEX 15Page 1 of 3
INDIA
BODHGHAT HYDROELECTRIC PROJECT
Thermal Plant Rehabilitation
Suggested Terms of Reference
Objective
1. The objective of the work is to formulate and execute a program toupgrade the performance of the existing thermal plant in the most costeffective manner. The program will include, but not limited to, a review andimprovement of the physical installation, the operational procedures, theplant management and support services, and the identification of the trainingneeds of the staff. Consultants would assist in the preparation andimplementation phases as needed.
Phases
2. The proposed program is to be developed in three phases whose precisescope will depend upon the results of the precedent phase. GOI and MPEB havecarried out diagnostics of the physical conditions of the units which will betaken as a basis, to be verified and modified as appropriate by theconsultants. The general scope of each phase is described in the followingparagraphs.
Phase I
3. During phase I MPEB staff and the consultants would identify andselect the corrective actions to be proposed in the program, including theireconomic justification and ranking in merit order. In this phase MPEB staffand the consultants should in particular:
(a) Review the already existing reports or studies on the subjectprepared by GOI and MPEB.
(b) Confirm, modify or expand the proposals contained in the abovedocuments through visits and inspections to the units,discussions with MPEB staff, and review of the existinginformation about the units performance and operation.
(c) Review and analyse the operation practices, the reliability,accuracy and relevance of the data being collected by MPEP,the quality of their analysis and the use being made of theinformation.
(d) Review the practices for maintenance planning and scheduling.

-65-
ANNEX 15Page 2 of 3
(e) Assess the need for staff training and for administrativechanges in the operation and maintenance if needed.
(f) Review the support systems like management of spares, fuel,etc.
(g) Assess the quality of the monitoring system, andappropriateness of the instrumentation being used.
(h) Develop cost estimates for the different corrective units andprepare a cost-benefit analysis to rank them in merit order.
4. At the end of this phase I the consultants will prepare a report withtheir findings and recommendations, the cost estimates, and a tentativeimplementation plan.
Phase II
5. During this phase MPEB and the consultants will develop a detailedimplementation and monitoring plan to carry-out the measures selected underphase I. In addition the consultants will assist in the development of theengineering, technical specifications, drawings, and packaging of theprocurement. Among other aspects the following should be considered:
(a) Organizational set-up for implementation
(b) Procurement schedule including recommended packaging andprocurement procedure to be followed (ICB, LCB, etc.) foreach package
(c) Repair schedule for each unit considering its operationalcommitments and the options for power substitution
(d) Staff needed to carry-out the program by speciality and timing
(e) Training program of the staff
(f) Program for changes in procedures and practices
(g) Monitoring for physical progress, cost control and results ofthe program, including the preparation a model for progressreports.

-66-
ANNEX 15Page 3 of 3
Phase III
6. MPEB with the assistance of consultants as needed would implementthe program and evaluate the results.

INDIABODH4GHAT HYDROELECTRIC PROJECT
Proposed Fild OrganizatIon
Chef ENinweD
D _Ot D_ lAt Dil Engts
hct Rebt Chl Eun
Bkckshnm act DDcn
. Eng D S- ESup.Eng. Enn E. Engn En
Waltd et-25751DW EnWs D, Engm DN Ergm ~ ~ ~ ~ ~ ~ ~ ~ ~ ~ ~ ~ ~ ~ ~ ~ ~ ~ ~ ~ ~~0

-68-
ANNEX 17
INDIA
BODHGHAT HYDROELECTRIC PROJECT
Schedule of Estimated Disbursements(US$ Million)
Bank FYand Semester Half Yearly' DIsbursement Cumulative Cumulative (w°)
1985 I 3.2 1/ 3.2 1II 21.2 24.4 8
1986 I 21.0 45.4 15II 18.0 63.4 21
1987 I 27.0 90.4 30II 30.0 120.4 40
1988 I 36.0 156.4 52II 27.0 183.4 61
1989 I 33.0 216.4 72II 36.0 252.4 84
1990 I 12.0 264.4 88II 12.0 276.4 92
1991 I 9.0 285.4 95II 6.0 291.4 97
1992 I 3.0 294.4 98II 6.0 300.4 100
1/ Including front-end fee of about US$0.4 million.

-69-
ANNEX 18
INIDA
BODHGHAT HYDROELECTRIC PROJECT
MADHYA PRADESH ELECTRICITY BOARD (MPEB)
Cost Versus Realisation Rate for Supply to DifferentCategories of Consumers
LRMC Per Unit Realisation Rate Perin 1983 Unit in 1982-83
(Worked Out for VIth Plan)(Paise/Unit) Paise/Unit
1. Balco (220 kV) 42.71 39.90
2. Industries (132 kV) 56.92 47.30
3. Railway Traction (132 (kV) 56.96 55.80
4. Caustic Soda, Amlai (33 kV) 62.04 49.40
5. H.T. Water-Works (33 kV) 62.04 52.12
6. Licensees (33/11 kV) 62.04 8.89
7. Other H.T. Industries (33 kV) 62.04 58.73
8. Domestic L&F and Power (LT) 128.42 42.86
9. Commercial L&F and Power (LT) 222.55 87.25
10. Public Lighting (LT) 177.43 37.34
11. Irrigation (LT) 111.49 25.57
12. LT Water Works (LT) 85.39 44.20
13. LT Industries (LT) 142.84 55.31
Average 81.55 49.07

-70-ANNEX 19
INDIA
BODHGHAT HYDROELECTRIC PROJECT
MADHYA PRADESH ELECTRICITY BOARD (MPEB)
Statement Showing the Category-wise Demand & Collectionsin Respect of HT Consumers During the Year 1982-83
(Rs. in Million)
Revenue Billed Collection
1. Industrial 1723.33 1703.74
2. Collieries 248.13 236.65
3. Licences 3.28 2.62
4. Water Works 80.44 79.36
5., Paper Mills 52.51 57.05
6., Textiles 172.83 110.90
7. Railway Traction 82.85 90.84
8. Mohra LIS 3.66 2.79
Total 2367.03 2383.95
9. L.t. Consumers 949.89 912.11
Total 3316.92 3196.06
NOTE: Both billing and collection are inclusive of any duty/taxes.

INDIA
BODHGHAT HYDROELECTRIC PROJECT
MAHDYA PRADESH ELECTRICITY BOARD (MPEB)
Tariff
--------- FY79 FY80-------- ---------FY81…-------- - - FY82------- ---------FY83----------Energy Fuel Total Energy Fuel Total Energy Fuel Total Energy Fuel Total Energy Fuel TotalCost Cost Cost Cost Cost Cost Cost Cost Cost Cost Cost Cost Cost Cost Cost
Paisa/ Paisa/ Paisa/ Paisa/ Paisa/ Paisa/ Paisa/ Paisa/ Paisa/ Paisa/ Paisa/ Paisa/ Paisa/ Paisa/ Paisa/Unit Unit Unit Unit Unit Unit Unit Unit Unit Unit Unit Unit Unit Unit Unit
1. Domestic 32.76 - 32.76 36.74 - 36.74 42.08 - 42.08 39.74 - 39.74 42.86 - 42.86
2. Commercial 46.30 - 46.30 49.12 - 49.12 51.10 - 51.10 83.04 - 83.04 89.25 - 87.25
3. L.T. Industries 30.77 - 30.77 35.53 - 35.53 43.88 - 43.88 57.29 - 57.29 55.31 - 55.31
4. H.T. Industries &Power Intensive 15.75 8.66 24.41 21.26 8.75 30.01 35.32 8.44 43.88 34.54 15.06 50.60 35.15 16.34 51.49
5. Railway Traction 25.96 10.66 36.62 30.86 10.66 41.52 41.49 8.35 49.84 39.29 15.60 54.89 38.60 17.17 55.77
6. Irrigation 29.06 - 29.06 32.09 - 32.09 33.30 - 33.30 28.06 - 28.06 25.57 - 25.57
7. Water Works 16.05 10.66 26.71 15.60 10.66 26.26 31.33 8.35 39.68 32.37 15.60 47.97 33.19 17.17 50.36
8. Street Light 36.91 - 36.91 38.07 - 38.07 41.07 - 41.07 44.11 - 44.11 37.34 - 37.34
9. Licensees/Co-operativeSocieties 6.38 - 6.38 7.16 - 7.16 7.31 - 7.31 8.09 - 8.09 8.89 - 8.89
10. Outside State 10.17 - 10.17 10.76 - 10.76 12.51 - 12.51 12.65 - 12.65 - - -
11. Average Rate of Realisa-tion for the Year - - 26.07 - - 32.06 - - 36.04 - - 45.00 - - 49.70
0
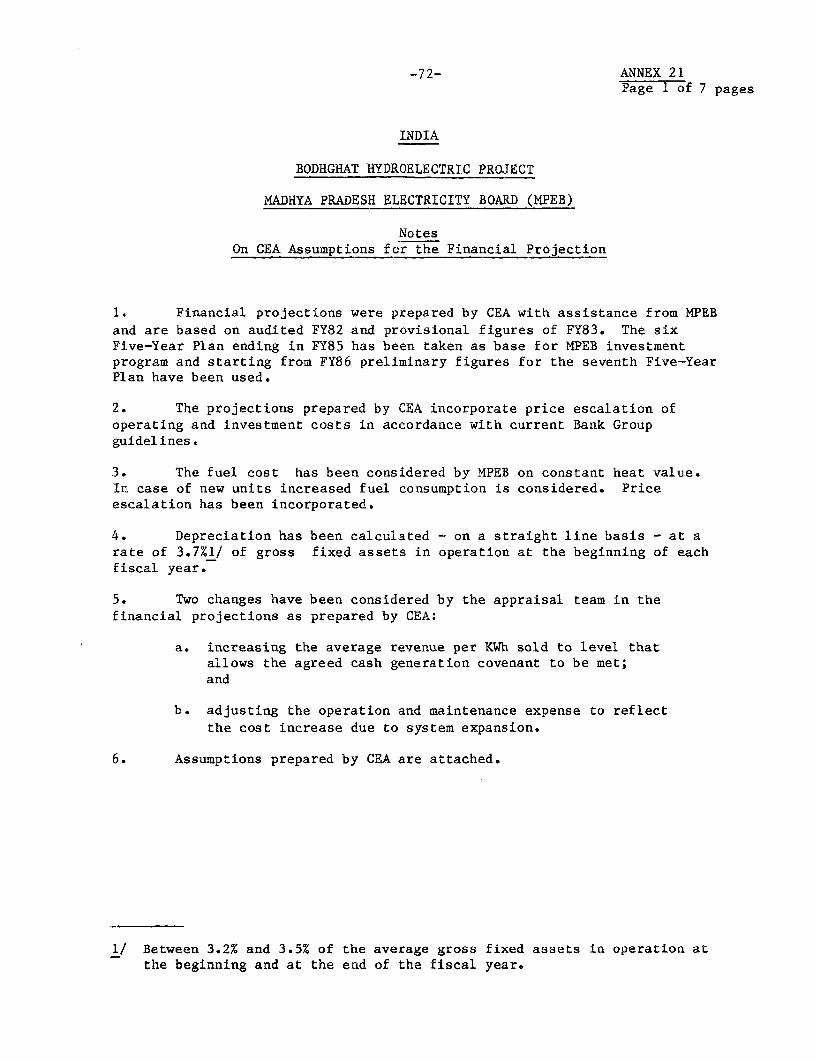
-72- ANNEX 21Page 1 of 7 pages
INDIA
BODHGHAT HYDROELECTRIC PROJECT
MADHYA PRADESH ELECTRICITY BOARD (MPEB)
NotesOn CEA Assumptions for the Financial Projection
1. Financial projections were prepared by CEA with assistance from MPEBand are based on audited FY82 and provisional figures of FY83. The sixFive-Year Plan ending in FY85 has been taken as base for MPEB investmentprogram and starting from FY86 preliminary figures for the seventh Five-YearPlan have been used.
2. The projections prepared by CEA incorporate price escalation ofoperating and investment costs in accordance with current Bank Groupguidelines.
3. The fuel cost has been considered by MPEB on constant heat value.In case of new units increased fuel consumption is considered. Priceescalation has been incorporated.
4. Depreciation has been calculated - on a straight line basis - at arate of 3.7%1/ of gross fixed assets in operation at the beginning of eachfiscal year.
5. Two changes have been considered by the appraisal team in thefinancial projections as prepared by CEA:
a. increasing the average revenue per KWh sold to level thatallows the agreed cash generation covenant to be met;and
b. adjusting the operation and maintenance expense to reflectthe cost increase due to system expansion.
6. Assumptions prepared by CEA are attached.
1/ Between 3.2% and 3.5% of the average gross fixed assets in operation atthe beginning and at the end of the fiscal year.

-73-ANNEY 21Page 2 of 7 pages
Financial Projection
Assumptions(Prepared by CEA)
1. Station Consumption
This is provided for on the following basis:
(i) Thermal Generation 9.65%
tii) Hydro Generation 0.5%based on current experience.
2. Operation & Maintenance CharRes
These include salaries and wages to employees, repairs andmaintenance and other establishment charges. In addition to providing forescalations according to inflation rates given by the World Bank, additionalexpenses relating to new generating stations and associated transmission anddistribution lines to be brought into operation have also been included inthe projections in the respective years.
3. State Electricity Duty
This is provided for @ 4.15 paise per KWh according to the currentrate in force.
4. Central Excise Duty
The current rate is 2 paise per KWh on net generation after exclusionof sales to agriculture and ot'her exempted categories which is assumed forprojections.
5. Interest -
Taking into account the trends already established, interest rateshave been reckoned as follows:
For the Year % For the Year %ending 31st ending 31st
March _ March
1984 7.4 1989 7.41985 7.5 1990 7.91986 7.6 1991 8.01987 7.7 1992 8.11988 7.7

-74-
ANNEX 21Page 3 of 7 pages
6, Interest on Capital Works under Construction
This is apportioned in the ratio of average net fixed assets(excluding consumers' contributions) to average capital works in progresscomputed with reference to opening and closing figures of each year. UIpon31st March 1985 when the commercial system is expected to come into forcecapitalisation of interest on works in progress is not provided inprojections for purposes of Balance sheets in accordance with currentpractice. With effect from 1st March 1985 this will be accounted for in thebooks also. Accordingly, that portion of capitalised interest relating tothe assets has been accounted for under the relevant heads, namely the fixedassets in use and the capital works in progress, in the projected BalanceSheets also.
7X, Net Income
With effect from 1st April 1985 the Board is expected to earn aminimum rate of return of 3% after providing for all charges includinginterest in accordance with the amended Electricity (Supply) Act.Accordingly, the projections provide for a clear surplus of 3% from the yearcommencing from 1st April 1985.
8. Securitv Deposits from Consumers
it is proposed to collect from the consumers in cash deposit to theextent of 2 months equivalent of sales by 31st March 1989 providing gradualirncrease from the year commencing from lst April 1985.

MADUYA PRADESH STATE ELECTRICITY BOARD OwPEB)
Actual and Forecast Income Statement 1978/79 - 1991/92(Ra Million)
Provi----- - -- - -- A tual - -- - -- - - sional --- - - - - - - - - - - - - - - --ForecaaL ---- --- - - - - -- - - - - - - -
Year Ending March 31 1978/79 1979/80 1980/81 1981/82 1982/83 1983/84 1984/85 1985/86 1986/87 1987/88 1988/89 1989/90 1990/91 1991/92
Energy Sales (%Th 4292 4359 4583 5034 5878 7037 8569 10327 11293 12605 14755 17168 18649 19989Sales Revenue (Ps/KWh) 26.7 32.6 35.4 45.0 49.7 53.7 53.7 62.5 68.4 73.0 73.0 75.7 78.0 82.1
lncome
Electricity Sales 1147 1417 1645 2259 2919 3778 4601 6454 7724 9203 10771 13001 14553 16420Miscellaneous Income 70 91 88 130 145 165 176 194 214 236 261 288 318 351RB Subsidy 191 251 280 229 400 100 195 - - - - - - -State Electricity Duty 106 151 171 172 244 292 356 429 469 523 612 712 774 830
Total Income 1514 1916 2184 2790 3708 4335 5328 7077 8407 9962 11644 14001 15645 17601
Expenses
-JPower Purchases 95 72 103 142 140 149 328 405 437 651 1303 1857 2485 3037Fuel 263 359 549 864 1090 1277 1618 2013 2406 2732 2938 3385 3608 4022Operation & Maintenance 373 443 555 683 811 963 1113 1346 1613 1898 2259 2628 3092 3638Depreciation 160 193 243 302 348 498 640 754 991 1077 1214 1497 1833 2084Central,_xise Duty 68 82 95 94 115 138 168 198 217 237 265 293 308 319State Electricity Duty 106 157 171 172 244 292 356 429 469 523 612 712 774 830
Total expenses 1075 1306 1716 2257 2748 3317 4243 5145 6133 7118 8591 10l72 12100 13930
Operating Income 439 610 468 533 960 1018 1085 1932 2274 2844 3053 3629 3545 3671Previous Years Adjustment - - - - 34 - - - - -Interest Expense 168 209 359 457 651 919 1127 1418 1647 1742 208i 2591 3008 3207
Net Income 271 401 1.09 76 343 99 ( 42) 514 627 1102 972 1038 537 464 m
Rate of Return a
Eucluding ElectricityDuties 12.2% 13.7% 8.2% 7.8% 10.5% 8.1% 8.1% 8.4% 11.6% 10.3% 9.8% 8.1% 7.8% X
Including Electricity aOutiesa 17.3% 19% 12.9% 11.7Z I411.4% 1105% 10.1% 10.7% 14.6% 13.3% 12.52 10.6% 10l3%

MADdYA PRADESH STATE ELECTRICITY BOARD (MPSEB)
Actual and Forecast Net Cash Generation - 1978/79--1991/92(Rs Million)
Provi----- Actual----- sional ----------------------------------- Forecast-----------------------…--------
Year Ejn March 31 1980/81 1981/82 1982/83 1983/84 1984/85 1985/86 1986/87 1987/88 1988/89 1989/90 1990/91 1991/92
Catital Assets Formation
Capital Outlay 2011 2595 2956 3342 4062 4924 5187 5632 6011 6466 6850 7344
Interest to be Capitalized 331 403 438 395 413 410 491 695 710 554 480 627
Total 2342 2998 3394 3737 4475 5334 5778 6327 6721 7020 7330 7971
Debt IService:Interest 1690 860 1089 1314 1540 1828 2138 2417 2791 3145 3488 3834Less - to be Capitalized 331 403 438 395 413 410 491 695 710 554 480 627Interest Expense 359 457 651 919 1127 1418 1647 1742 2081 2591 3008 3207
Loan Repayments:State Government - - 378 447 510 600 715 820 950 1072 1193 1296
Others 83 139 187 184 255 413 399 353 390 432 228 244
Total - Debt Service 442 596 1216 1550 1892 2431 2761 2915 3421 4095 4429 4747
Cash Generation:Operating Income 468 533 960 1018 1085 1932 2274 2844 3053 3629 3545 3671Other Revenues
Depreciation Earned 243 302 348 498 640 754 991 1077 1214 1497 1833 2084
Consumer's Contribution 25 45 63 71 79 87 97 108 119 133 147 164Consumer's Security Deposits 19 17 14 13 143 82 383 141 465 240 398 331
Total - Cash Generation 755 897 1385 1600 1947 2855 3745 4170 4851 5499 5923 6250 'XUn
Less - Debt Service 442 596 1216 1550 1892 2431 2761 2915 3421 4095 4429 4747 °
Net Cash Generation 313 301 169 50 55 424 984 1255 1430 1404 1494 1503 o
Net Cash Generation/Capital AssetsFormation 13% 10% 5% 1% 1% 8% 17% 20% 20% 20% 20% 20%

MADHYA PRADESH ELECTRICITY BOARD (MPSEB)
Actual and Forecast Sources and Applications of Funds(Rs Millions)
Provi------Actual---- sional - Forecast----------------------------------
Year Ending March 31 1980/81 1981/82 1982/83 1983/84 1984/85 1985/86 1986/87 1987/88 1988/89 1989/90 1990/91 1991/92
SourcesInternal SourcesOperating Income 468 533 960 1018 1085 1932 2274 2844 3053 3629 3545 3671
Other Revenues - 34Depreciation 243 302 348 498 640 754 991 1077 1214 1497 1833 2084
Gross Internal Sources 711 835 1342 1516 1725 2686 3265 3921 4267 5127 5378 5755
Less Debt ServiceAmortization 83 139 565 631 765 1013 1114 1173 1340 1504 1421 1540
Interest 690 860 1089 1314 1540 1828 2138 2437 2791 3145 3488 3834
Less Interest During Const. - - - - - 410 491 695 710 554 480 627
Interest Expense 690 860 1089 1314 1540 1418 1647 1742 2081 2591 3008 3207
Total Debt Services 773 999 1654 1945 2305 2431 2761 2915 3421 4095 4429 4747
Net Internal Sources (62) (164) (312) (429) (580) 255 504 1006 846 1031 949 1008
Consumer Security Deposit 19 17 14 13 143 82 383 141 465 240 398 331
Consumers' Contributions 25 45 63 71 79 87 97 108 119 133 147 164
Net Cash Generation (18) (102) (235) (345) (358) 424 984 1255 1430 1404 1494 1503
External SourcesBorrowing
1rom Government 1443 1768 2118 2010 2757 3488 3335 4068 4010 4087 3774 4188
From Othe1 s 761 1008 1136 1077 1jk2 1374 1347 1320, 1381 1424 .1221 1238
Total Borrowing 2204 2776 3254 3087 3929 4862 4682 5388 5391 5511 4995 5426
Staff Superannuation Fund 26 50 57 65 75 85 95 105 115 125 135 145
TOTAL SOURCES 2212 2724 3076 2807 3646 5371 5761 6548 6936 7040 6624 7074
Applications x
Capital Assets 2011 2595 2956 3342 4062 5334 5778 6327 6721 7020 7330 7971
Investment 6 6 16 19 22 20 20 20 20 20 20 20 ° '
Variation in Working Capital 194 131 79 (554) (438) 17 ( 37) 401 195 - (726) (917) 'J
Sundries Adjustments 1 (8) 25 _ _ _ _ - - -
00
TOTAL APPLICATIONS 2212 2724 3076 2807 3646 5371 5761 6748 6936 7040 6624 7074 a

.'£-, -jy
MDHYA FRADESII STATE ELECARICITY BOARD (§PEB)
Acktual and Forecast Ba.ance Seet - 1978/79 -1991/92
Provi-
Year P.uding Marcih 31 1978/79 1979/80 MGM80/81 981/82 1982/83 1983/84 1984/85 1985/86 1986/87 1987/S8 1988/89 1989/90 1990/91 1991/92
Assets
Gross Fixed Assets 5191 6529 8119 9482 13456 17296 20380 26787 29110 32816 41584 50908 57901 61783Cumulative Depreciation 1062 1255 1497 1792 2140 2638 3278 4032 5023 6100 7314 8811 10644 12728
Net Fixed Assets inOperation 4129 5274 6622 7690 11316 14658 17102 22755 24087 26716 34270 42097 47257 49055
Capital Works UnderConstruction 4064 5016 5437 6669 5651 5153 6131 5058 8513 11134 9087 6783 7120 11209
Investments end Intangible 104 36 42 58 74 93 115 135 155 175 195 215 235 255Working Capital (Net) ( 326) ( 504) ( 310) ( 179) ( 100) ( 654) (1092) (1075) (1112) ( 711) ( 516) ( 516) (1242) (2159)Cumulative Losses - - 4 331 426 722 1177 663 36 - - -
Total Assets 7971 9822 11795 14569 17367 19972 23433 27536 31679 37314 43036 48579 53370 58360 en
Liabilities
Capital ContributionFrom Consumers 227 252 277 322 385 456 535 622 719 827 946 1079 1226 1390From Government 7 7 7 7 7 7 7 7 7 7 7 7 7 7
Total Capital Contribu-tion 234 259 284 329 392 463 542 629 726 834 953 1086 1233 1397
Reserve & Surplus 153 218 - - - - - 1066 2038 3076 3613 4077Borrowing From Government 4990 6230 7673 9441 11181 12744 14991 17879 20499 23747 26807 29822 32403 35295
- Fromi Others 2346 2831 3509 4378 5327 6220 7137 8098 9046 10013 11004 11996 12989 13983
Total Borrowing 7336 9061 11182 13819 16508 18964 22128 25977 29545 33760 37811 41818 45392 49278
Staff Superannuaeion Fund 108 147 173 223 280 345 420 505 600 705 820 945 1080 1225Security Deposit From f
Consumers 122 137 156 173 187 200 343 425 308 949 1414 1654 2052 2383 D
Interest to GovernmentNot Due Under Section 67 18 _ - 25 - -- - - - -
Total Liabilities 7971 9822 11795 14569 17367 19972 23433 27536 31679 37314 43036 48579 53370 58360 a:z=fiS ~ ~ . .. .....1 ....= .....S .....Bl .....51 .....l:S ...Id Yl= ===w Z^IIIY 3 ZI ^C3

INDIA
BODHGHAT HYDROELECTRIC PROJECT
MADHYA PRADESH STATE ELECTRICITY BOARD (JIPEB)
Investment Pro ramcRTs[Min)
Expend i ture
Total Before 83/84-
Project Cost FY83/84 83/84 84/85 85/86 86/87 87/88 88/89 89/90 90/91 91/92 91/92
I. Generation
(a) Thermal
Satpura II (1x210 MW) 1775 1407 368 - - - - - - 368
korba West (3x210 MW) 3829 2247 849 557 176 1- - - - 582
Birsinghpur (2x210 MW) 3554 310 120 405 450 475 500 700 594 - 3244
Others - New Thermal 6100 - - - - - 400 300 1100 2100 2200 s!OO
(b) ILydro
Pench (2x80 MW) 812 320 50 150 292 - - - - - - 492
Bargi (2x45 MlW) 605 205 170 150 80 - _ - - - 400
Bansagar (2x10⁵+5x15 MW) 3185 150 182 292 650 865 680 366 - - - iO35
tlasdeo Banigo (3x40 HW) 450 - 50 80 120 120 70 10 _ 568 450
Bodhghat (4x125 MW) 7896 35 637 1140 1366 1097 1473 1006 594 548 7916
Minli Hydra 751 - 10 30 52 87 104 110 117 120 121 751
(c) Thermal - CommissionedBefore 38 29 5 4 - - - - - - 38
Total Generation 28995 4639 1813 2276 2924 2913 2901 3019 2827 2814 2889 2z;376
II. Transmission & Distribution
(c) Transmission - - 595 605 634 632 710 630 700 700 700 5906
(d) Sub-transmission - 455 430 494 507 591 556 591 560 571 4755
(e) Rural Electrification - 392 389 461 464 479 480 471 467 477 4080
(f) Others and Replacement - 87 96 101 106 112 116 122 128 126 1004
Total Transmission & Distribution 16777 102 1529 1520 1690 1709 1892 1782 1884 1855 1884 1-745
Total Investment - Before Price )
Contingencies) 45772 5651 3342 3796 4614 4622 4793 4801 4711 4669 4773 40121
Price Contingencies 13764 - - 266 720 1156 1534 1920 2309 2661 3198 13764
Total - Including Price Contingencies 59536 5651 3342 4062 5334 5778 6327 6721 7020 7330 7971 53885
Escalation Factor - 1.070 1.156 1.250 1.320 1.400 1.490 1.570 1.670

-80-ANNEX 23Page 1 of 2 pages
INDIA
BODHGHAT HYDROELECTRIC PROJECT
Calculations for Cost Benefit Analysis
Energy Sales from the Project
1. These are calculated as the annual power sent out (after auxiliaryconsumption) minus the average losses for the region, estimated to be at 18%at the time of project commissioning.
Period Generation Auxiliary Consumption Energy Sold 1/(GWh1i (GWh) (GWh)
(Years)
1-10 977 19.5 78511-50 911 18.2 732
Tariff Revenues
2. To estimate the minimum proxy for the benefits in the region:
Share of Average tariffState Regional Consumption in 1983/84
(%) Paise/kWh
Madhya Pradesh 18 64.3Gujarat 28 63.3Maharashtra 54 44.8
Weighted Average - financial 53.6- economic 42.9
Industrial Willingness to Pay
3. A proxy for industrial willingness to pay for continuous power supplyis obtained as the average between the regional industrial tariff in theregion (Rs 0.52/kWh financial and Rs 0.41 economic) and the cost incurred byindustrial consumers for the purchase and operation of diesel standbygenerating sets to back up public supply.
1/ Only firm energy has been considered for this analysis.
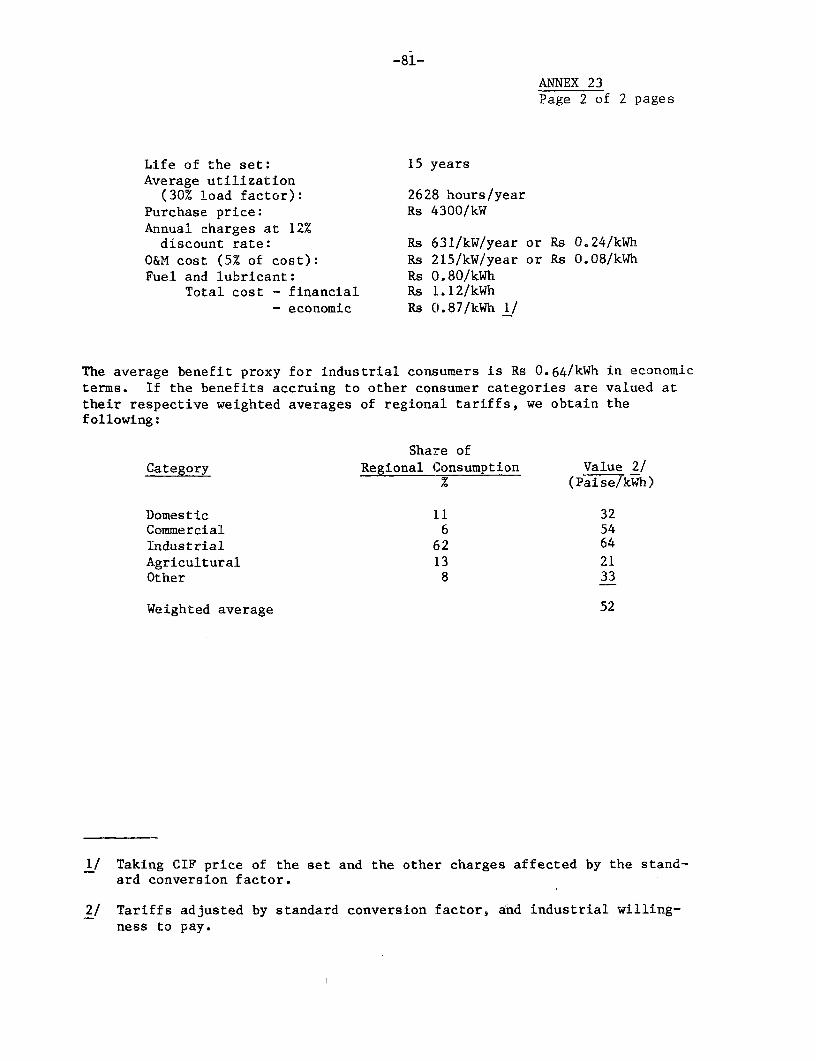
-81-
ANNEX 23Page 2 of 2 pages
Life of the set: 15 yearsAverage utilization
(30% load factor): 2628 hours/yearPurchase price: Rs 4300/kWAnnual charges at 12%discount rate: Rs 631/kW/year or Rs 0.24/kWh
O&M cost (5% of cost): Rs 215/kW/year or Rs 0.08/kWhFuel and lubricant: Rs 0.80/kWh
Total cost - financial Rs 1.12/kWh- economic Rs 0.87/kWh 1/
The average benefit proxy for industrial consumers is Rs 0.64/kWh in economicterms. If the benefits accruing to other consumer categories are valued attheir respective weighted averages of regional tariffs, we obtain thefollowing:
Share ofCategory Regional Consumption Value 2/
X (Paise/kWh)
Domestic 11 32Commercial 6 54Industrial 62 64Agricultural 13 21Other 8 33
Weighted average 52
1/ Taking CIF price of the set and the other charges affected by the stand-ard conversion factor.
2/ Tariffs adjusted by standard conversion factor, and industrial willing-ness to pay.

_N9DIA
BODHGHAT HYDROELECTRIC PROJECT
Least Cost Solution and Sat!eEm ERR
(Million RS)
Investment Cost CM0 Fuel Costs _ Total Costs 1/ Incremental Incremental BenefitsT Herma - Tler rmaT Production Sales @
Years W/Bodhghat Alternative W/Bodhghat Alternptive W/lBodhat Alternative W/Bdhat Alternative _G9r G/h Rs0>43!kWhRsO<kWh
1 (1983/84) 210 179 270 2392 1369 1071 1769 14713 3998 4013 5198 52134 6224 6172 3 3 8097 8045 129 106 46 555 9500 10195 4 4 12354 13049 430 353 152 1836 9744 10662 41 41 63 58 12748 13661 349 286 123 1487 7269 8176 420 499 184 273 10093 11148 1146 940 404 4878 6149 6288 623 717 1564 1543 10186 10398 10323 8465 3640 43889 3724 3748 655 765 2364 2341 7843 7954 15517 12724 5471 6362
10 2629 2629 727 828 3032 3386 7188 7643 23212 19034 810§ 986711 1987 1084 1013 1114 4005 4618 7305 8019 31955 26203 11267 1358312 1084 1259 1050 1151 5504 6279 7938 8814 41387 33937 14592 1759313 - - 1070 1171 5504 6279 6574 7799 41387 33937 14592 1759314-35 - - 1070 1171 5504 6279 6574 7454 41387 33937 14592 17593
Present Worth@8% - - - - - - 86234 94173 - - -C@ 10% - - - - - - 72052 78062 _ _ _@ 12% - - - - - - 61403 66054 -_ _
ERR - - - - - - - - - 8.43 10.73Cost 10% up - - - - - - _ - - 7.56 9.56Benefits 10% down - - - - - - 7.31 9.21
1/ Including necessary transmission and distribution investments.
(Dm ro a-
0 .

(Million Rs)
System Fuel Cost of
Cost of Thermal Transmission Incremental Costs Alternative Net Incremental Costs
Year Investment Costs Bodhchat 1/ Substitution Line & Subst. (Net) Combination2/ of less than 500 MW
500MW 400 MW 300 IW 120 MW 2x120 MW 12 Mw 200 MU 40llWMV 1 U0OUT
1-PY84 47 45 44 45 44
2 298 282 265 282 2653 494 458 419 458 419
4 663 615 562 615 5625 731 675 613 76 144 9 760 766
6 608 568 523 113 216 26 707 7657 205 267 166 176 336 52 495 554
8 114 104 92 195 372 79 378 5439 77 71 64 69 132 8 148 204
10-35 32 31 27 16 30 3 27 63 77 123
Present Worth
@ 8% 2646 3283 3664 637 1018
@ 10% 2447 2968 3259 521 812@ 12% 2276 2709 2934 433 658
o >
1/ All costs are in economic terms
2/ Alternative combination is equal to the cost of Bodhghat with reduced capacity plus the respective thermal substitution.

-84-Annex 24Page 3 of 3
Optimization Analysis - Basic Assumptions
- Equivalent thermal capacity per 100 MW hydro assumed to 120 MW thermalunit (the closest practical size to the equivalent thermal capacity for100 MW hydro) to be added to an existing plant.
- Unit economic cost estimated at 5000 Rs/kW (based on economic costs forFarakka minus common works not needed for additional units in existingplants).
- The unit can be commissioned after five years of construction start.
- Additional units assumed to be located at Mand-Raigarh.
- Transmission 220 kV line CD/C).
- Cost of fuel at pithead (including oil for start ups and flamestabilization): RsO.18/kWh.
- Fuel consumption 0.7 kg/kWh at base, 0.85 kg/kWh at peak as per CEA records.
- Transmission losses: 2%
- Auxiliary consumption for the thermal station: 9%
- Annual O&M charges for thermal unit 2.5% of cost, and 2% for transmissionlines.

-85-ANNEX 25
INDIA
BODHGHAT HYDROELECTRIC PROJECT
Documents in Project File
1. Project Report - Madhya Pradesh Electricity Board - March 1983
2. Report on First Meeting of Dam Review Panel - August 1983
3. Bodhghat Hydroelectric Project - Review of Project Design -Dr. Othmar J. Rescher - December 15, 1983
4. Bodhghat Hydroelectric Project - Geological Review - Dr. J. Newbery -November 1983
5. Bodhghat Hydroelectric Project - Hydrological Review - Dr. J.V. Sutcliffe -
November 1983
6. Bodhghat Hydroelectric Project - Technical Memorandum on Electro-MechanicalInstallation - CEA - November 1983
7. Optimization of installed capacity of Bodhghat Hydroelectric Project -CEA - November 1983
8. Economic Justification Studies for Bodhghat and Sardar Sarovar Projects -CEA - November 1983

IND IA
BODEHIiAT HYDROELECTRIC PROJECT
Load Duration Curve Western R_eion
July 199fl August 1990 December 19 ° --- __.YDRO Capaciy Capaciy apacit apaiPOWER STATIONS A_ A_rHRS. Avai. Eneigy _a± Enera RS. Av iaI.. Eag S
UkTai _____ 150 81 18 3_ 00 119 _ 13.5 300 108 12 300 81 9
R..P. Sagar, G. Sagar, J. Sagar 166 59 12 187 _65_j 12 187 44 8__ 165 44 9
Koyna 2,393 PH. 850 319 13 910 357 13 1010 239 8 935 239 9
Vaitharna + Bhatghar 76 1g 8 76 20 9 76 14 6 76 14 6
Tata 228 140 17 228 154 23 254 105 14 254 105 14
Tillari 120 13 4 180 15 3 180 10 2 120 10 3
Kadana 60 19 ll 120 21 6 120 15 4 120 15 4
Pench 160 25 5 160 28 6 160 19 4 180 19 8
Bira TR Paithan Pawana ani___ 144 19 5 144 21 5 144 14 3 144 14 3N. Sagar 375 218 20 500 240 16 500 164 11 500 164 11
Bargi _--__________ ______ 90 35 13 90 39 15 90 26 10 90 26 10
Ban Sagar 180 158 24 180 '174 24 180 119 24 180 119 24
Bodhghat 375 94 9 500 103 7 500 70 5 500 j! 5
RBPH 600 304 17 600 334 19 400 228 19 600 228 13
CRH1 8Q 37 7 180 40 8 180 27 5 180 27 5C___ 18 37 7__ ____ __ . f _
Omkareshwar 65 57 24 65 63 24 65 43 22 65 43 22
| Maheshwar 1 40 35 24 - 139 - 40 26 22 40 26 22
Ghat Ghar 125 23 6 25 25 7 125 17 5 125 17 5

INDIABODHGHAT HYDROELECTRIC PROJECT
Typical Plant DispatchAverage Load Duration Curve - Westem Region
August 1990
PERCENT OFMONTHLY PEAK
100 s
Legend:
Thermal Base
E lHydro
Gas & Old Thermal
90-- E]~~~~~~~~~~~~~~~~ Load Nat Met
0 5 10 15 20 2
HOURS rt'
World Bank-25745

INDIABODHGHAT HYDROELECTRIC PROJECT
Typical Plant DilspatchAverage Load Duration Curve - Western Region
December 1 990
PERCENT OFMONTI-KY PEAI<
1 00-
Thermal Baise
Gas & Old Thermal
90] Load Not Met
B -
HOURS n
World Bank-25746

INDIABODHGHAT HYDROELECTRIC PROJECT
Typical Plant DispatchAverage Load Duration Curve - Western Region
March 1991
PERCENT OF
MONTHLY PEAK
Legend:
Thermal Base
Hydro
xSEEN, ~ ~ ~ ~ ~ ~~~~~~~~~~~]Gas & Old Thermal
90 Au CD] Load Not Met
bu-~~~~~~~~~~~~~~~~~~~~~~~~~~~~~~~~~~~~~~~~~~~~~~~~~~~~~~~~~~~~~~~~~~~~~~~~~~~~~~~~~~~~~~~~~~~~~~~-
° 5 10 15 2'0 24
HOURS
World Bank-25747
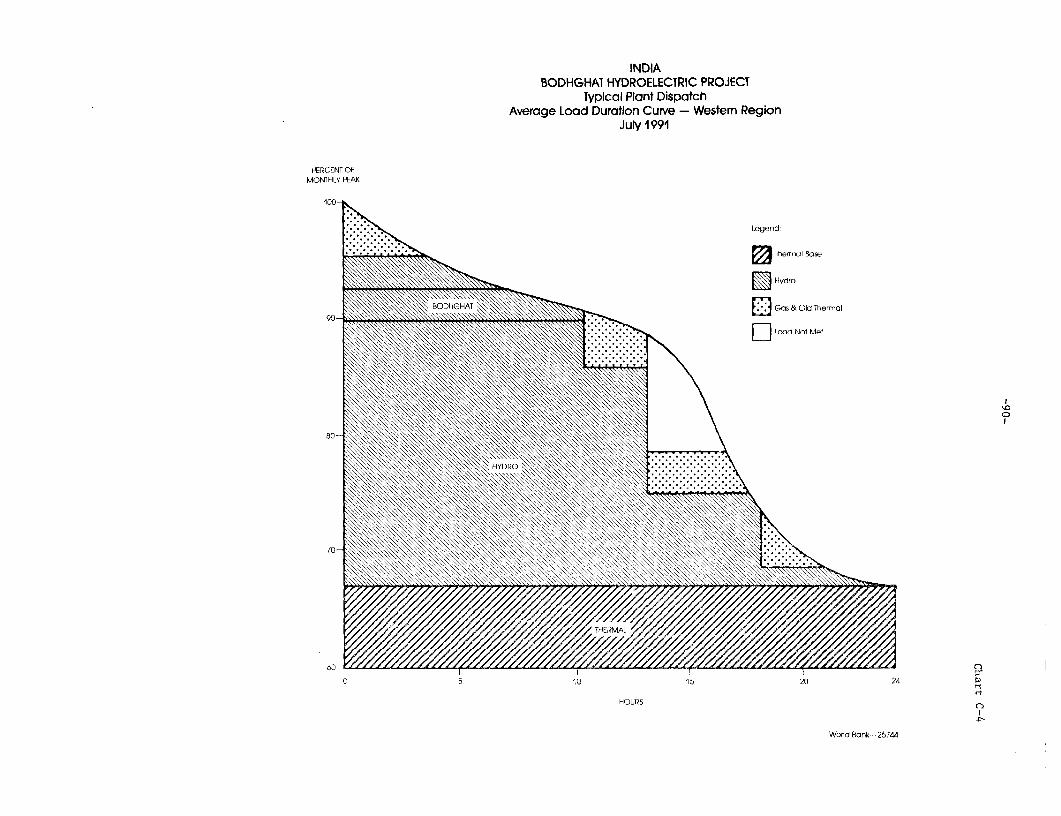
INDIABODHGHAT HYDROELECTRIC PROJECT
Typical Plant DispatchAverage Load Duration Curve - Western Region
July 1991
PERCENT OFMONTHLY PEAK
100-K
* * * t X ~~~~~~~~~~~~~~~~~~LegendThermul Base
Hydro
90- Ez ~~~~~~~~~~~~~~~~~~~~~~~~~Gas & Old Thermal
90-~~~~~~~~~~~~~~~~~~~~~~~~~~~~~~~~~~~~~~~~~~~
O 5 10 15 2024D
rrtHOURS r
World FBonk--25744

-91-
OO;Gsw oosucWCaOJ
___ x__ K a _ _ _ _ _ _ _ _ _ _ _ __ _ _ _ _ _ _ _ _ _ _
n~~~~~~~~~~ e 1 1 1 1 1 1 1 1 1 1 1 1 1 1 I I I

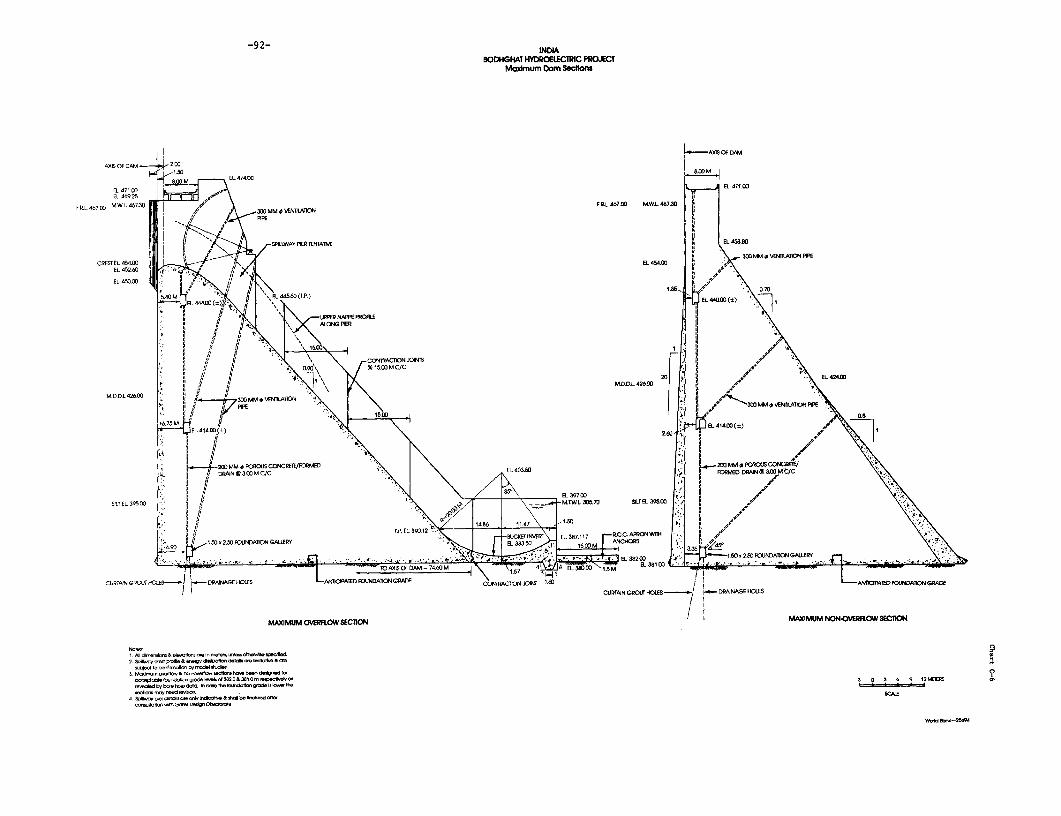
-92- INDIA
BODHGHAT HYDROELECTRIC PROJECTMadxnum Dom Section
| !AXL9 OF DAM
AXIS OF DAM 2.W50
7E 474 _ EOOM 1
EL 47100 EL 4100
FRL46700 MWL46730 3 PI0 MM 0 LA7IO R L 467 0 MW.L. 46720 3
~~, / ~~~ PIPE
SFILLWAY RER TENTAITNE EL 4500DO
CRI I| S EL 4 , 300 MM$mVENnLAIIONPPE
OEEL 452 0O < ,r; EL 4540 E 0;EL 450.00~~~~~~~~~~~~~~~~~~~~~~~~~~~~~~~~~~~~~~~~~~~~~~L440
EL 452.00 .7 4i T P) 1.E5, 0.70
54004 EL44003(t) : '. EL1
FL003. 426.03 ' EL 424EL'
P~~~~~~0 ,! VE . 1ATLONS E ,;
M.LDDL42bOO0 f; I _303 MM4VbNLAThM N MM |\I..TION PIPE
EL 414.007(b:) 2,- 414.00(6) l2.60,
20D MM o DOR,uMNM3POROUS CONCRERMFED 200 MM 0 POROU5SCOPJCREI/DRAIN ~~~~~ 3.00 M C/C ~~~~~EL 403.50 CORS 0100 OW-CE
S?LT EL WS 00 |EL 397.00
SETEL 30570 ,~~~~~~~~~~~~~~~~~~. _____ NEYPE~~~~~~~~~-- -MWL 3470 SILTEL 390001 .
14.8 11,47 1 150 At
, VP L3sa2 rSE TEL307.117 00C.ONATOO WIY | R PROWT
TiO AXI OF DAM 74.60 M E 1004 EL301 o 1 -
CURA N HLEG -01 M1- 0 HOLES 4*l4ICI,AED V,DATON GRADE CO oANcmC1PA50D INtMON CWDE
CU5A0N S0O6 HoLEs 0 DRht
NAGE HOLES
MAXIMUM OVERRFOW SECTION MAXIMUM NON-OVERROW SECTON
14 All enkln &eyobo,s h In nele unnoe 9-
2. Splh7 to colnllV01 10 ryoo sltudsXlwmr Ou blnr oetlo obm rbl-olSlD lal* t,00 on e dt
l0b4byo gOd. n d820E l 381l0e w*b 3 0 3 6 0 12ME1035 o
4 8611 oletdeldIsoleolllOlttdEOtbo broil selnolOad liter SCALE~~~~~~~~~~~~~~~~~~~~~~~~~~~~~~~~~~~~~~SALcoyoItot,otd S,ll Ode D+> o>fl Igt OotoateSKW
cCnsuEelon 9 m E; s ow~~~~~~~~~~~~~~~~~~~~~~~~~~~~~~~~~~~~~~~~~~~~~~~~~~~Wol06-50


5A95-~ ~ ~ ~ ~ ~ ~ ~ ~ ~ ~~~ ~~~~~~~~~~~~~~~~~~~~~~~~~03e.94 SDSQI DP03
------ --------------- t/1 S N5 Slb --------- _ _ _ _ _ -__ _ __ _ __ _ _ _ _ _ _ _ _ _ _ __ _ __-_-__-_-__-_-__-_--_-_--_-_--_-_--_-_-- _- __-_-__-_- __-_-_--_-
I13robd DIMlD}130 iY JVHeHC3-V011NI


-94-
INDIABODHGHAT HYDROELECTRIC PROJECTLongitudinal Secion of PoweR House
N.SL
,~~~2RRRR _ ~ _- _ __ _ ___ __ __ _ ___ __ __ __ __ __N.L_------E-
21M 0MWDEBERM
2, UWBEMRREBM
CRAWABEW EISUM
2 ~ ~ ~ ~ ~ ~ ~ ~ ~ ~ ~ ~ ~ D YAIIN SAL RYW n

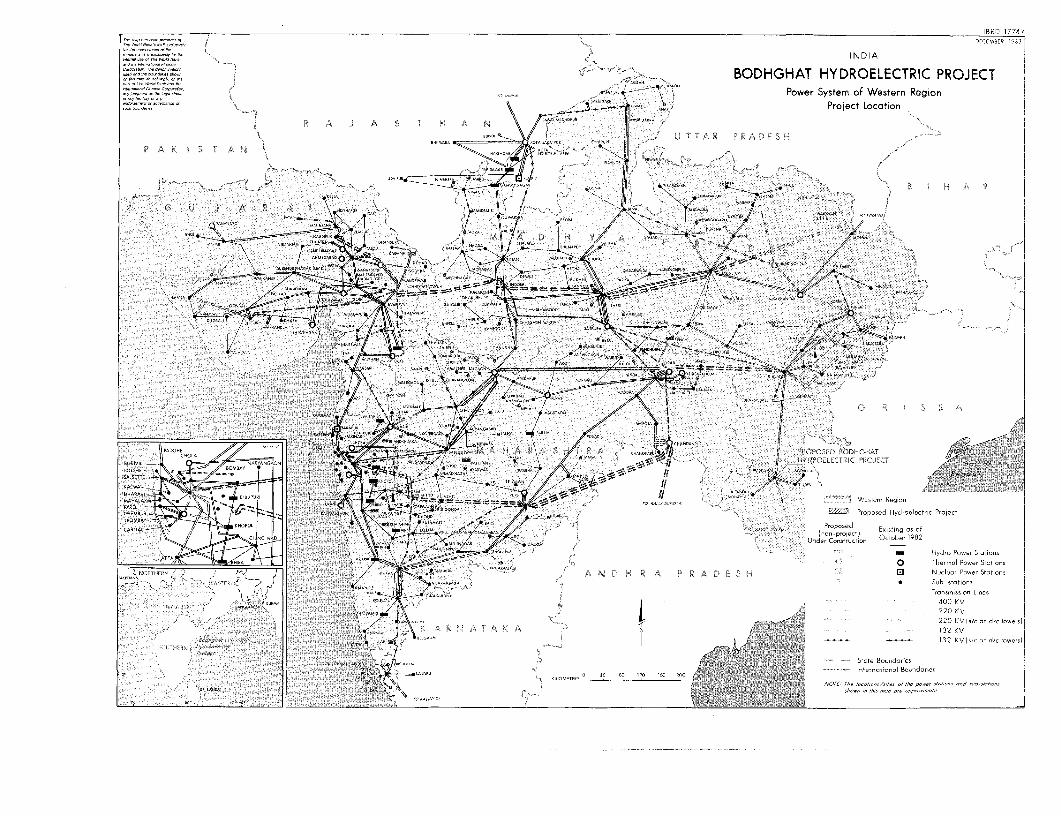
I8RD 1774/OECEMBER 3
INDIA
BODHGHAT HYDROELECTRIC PROJECTwe i oS 1Ds World GADZ dnd 1 AUlt t FMK IAChtOAtIi Pow er System of Western Region
Project Location
, . . . |~- .i'i,~ rewe > JcweOFJ ryD
T-i
0,~~~~
x s /H ~ ~ ~ ~ ~ ~ ~ 'S C = = t~~~~~05 0 o icru / v )HIKIU l
D"UlalAN W.,[- R.gc- r. , Pl 5cISOce 7 S - sS c , soil
. .r .,:: @CGLDeSH OW KO!irU cc ccFic | 40 0
: .. ~~~~~~~~~~~~~~~~~~~~~~~~ccrs+ ;1 U.1A i 0 * . . t- . > 2KV|/qndc 4towe 1
L-E.LWT; Pr.p-I Hy,;l~cfrc
D.-'--r- .1-fDALA * -r.i. G7A rMAll XE-I a Ul 5i f,A ct cc Nc . .. . ..- icOtsteBun sw
IOU N ; SAPH WIDFLI - . K LOAGETE75 C 3; ?S, nN cecsong gi' i . t11 -Intrnia7ol cccdoii'
~~~~~~i.P icoo :yAMDr0 pL> & rrs ROOSO r
ii 5' 1 I/ Seiciilc -- Weclere Region~~~~~~~h-. PE- S.f,
.1- I.E ~~~~~~~~~~~~~~~~~~~~~~~~~e 220~~~~~~-Im ir PoeK toie
cower 1i -~~~~~~~~~~~~~~~~~~~~~~~~~ - * S 8~~~~~~~~~~~~~~2 KVelens " --
ii- i Reisci5iii j ~~~~~~~~~~~~~~~~~~~~~~~~~~~~~~~~~~~~~~~~~~122 KV
ii- Si - - ~~~~~~~~~~~~~~~~~~~~~~~~~~~~~~~~~~~~~~~~~~~~~~122KV I , -E-UT I~FI


![SINGH / STATE BANK OF INDIA BHA]RAVLAL SINGH / MPEB VIJAY PAL / .MPEB JAN KALYAN GRIH MR.SAH.SANSTHA SHIV LAL YAN GRJH SURAJNLAL BANK OF BARODA ! RAT AN S PAWAIYA](https://img.dokumen.tips/doc/110x75/5ad353827f8b9aff738dd93c/singh-state-bank-of-india-bharavlal-singh-mpeb-vijay-pal-mpeb-jan-kalyan.jpg)