Embed Size (px)
DESCRIPTION
World Bank Experience in the Privatization Process. Presented at the Water Policy in the Americas Roundtable 21 September 2000 by Ventura Bengoechea. Outline. Situation Circa 1990 Reform Process in LAC The Role of the WB Achievements Unfinished Agenda Challenges Ahead - PowerPoint PPT Presentation
Citation preview

World Bank Experience in the Privatization Process
Presented at the Water Policy in the Americas Roundtable
21 September 2000by
Ventura Bengoechea
Outline
Situation Circa 1990 Reform Process in LAC The Role of the WB Achievements Unfinished Agenda Challenges Ahead Learning from Real Cases
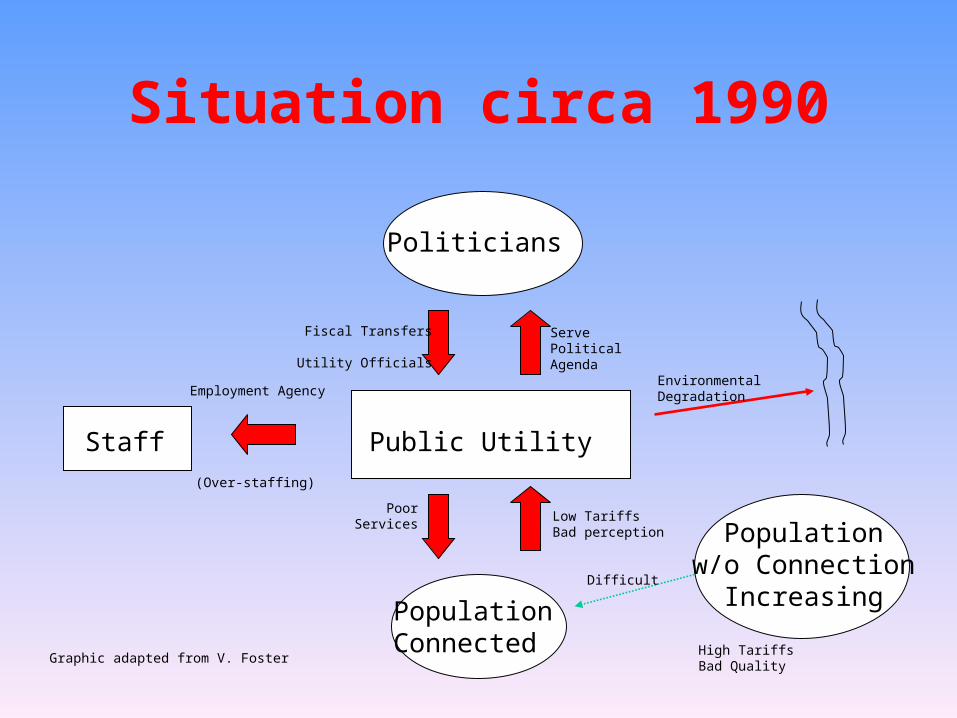
Situation circa 1990
Politicians
Public UtilityStaff
PopulationConnected
Populationw/o Connection
Increasing
Employment Agency
(Over-staffing)
PoorServices
Low TariffsBad perception
Graphic adapted from V. Foster
ServePoliticalAgenda
Fiscal Transfers
Utility Officials
High TariffsBad Quality
EnvironmentalDegradation
Difficult
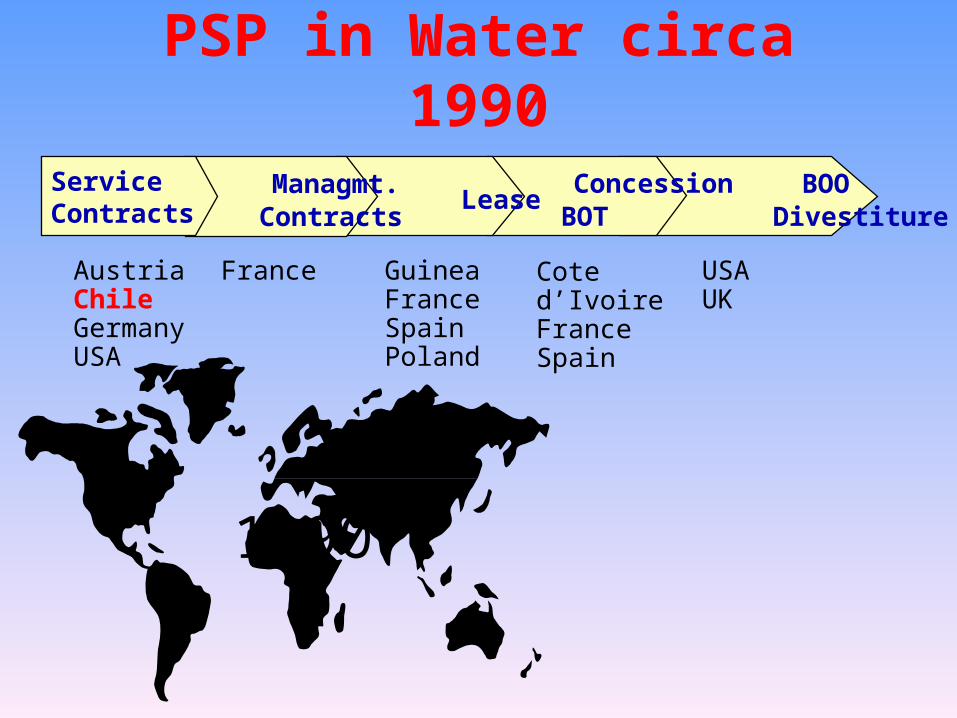
1990
AustriaChileGermanyUSA
France GuineaFranceSpainPoland
Cote d’IvoireFranceSpain
USAUK
BOO Divestiture
Concession BOT
Lease Managmt. Contracts
Service Contracts
PSP in Water circa 1990

The Reform ProcessPoliticians
Private/Public UtilityStaff
MorePopulationConnected
Populationw/o Connect.
Efficient Service
GoodServices Adequate Tariffs
Graphic adapted from V. Foster
Sector Strategy
Tariffs & ServiceQuality Regulation
Incentivesfor Connections
EnvironmentalImprovements
Regulators

The Role of the WB
Advise on Reform Issues Dissemination of Best Practices Study Tours for Policy Makers as
well as Labor Unions Financing of Transaction Advisers TA and Training for Regulators Financing and Equity to the PS
Achievements through PSP
Water Service Improvements Increased W&S Coverage Cash Flow Generation & Financing Increase in Sector Investments Customer Attention
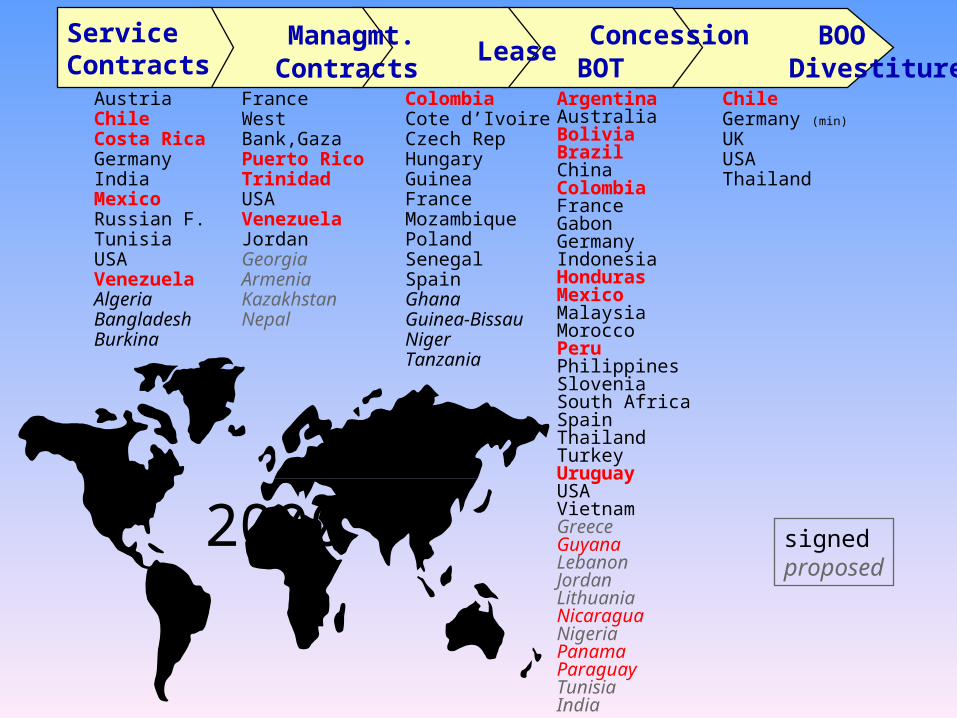
2000
AustriaChileCosta RicaGermanyIndiaMexicoRussian F.TunisiaUSAVenezuelaAlgeria Bangladesh Burkina
FranceWest Bank,GazaPuerto RicoTrinidadUSAVenezuelaJordanGeorgiaArmeniaKazakhstanNepal
ColombiaCote d’IvoireCzech RepHungaryGuineaFranceMozambiquePolandSenegalSpainGhanaGuinea-BissauNigerTanzania
ArgentinaAustraliaBoliviaBrazilChinaColombiaFranceGabonGermanyIndonesiaHondurasMexicoMalaysiaMoroccoPeruPhilippinesSloveniaSouth AfricaSpainThailandTurkeyUruguayUSAVietnamGreeceGuyanaLebanonJordanLithuaniaNicaraguaNigeriaPanamaParaguayTunisiaIndia
ChileGermany (min)
UKUSAThailand
signedproposed
BOO Divestiture
Concession BOT
Lease Managmt. Contracts
Service Contracts


Year (Figures in millions) 2000 2015Population 500 650Access to Water 350 550Access to Sewer 200 400Access to WW Treatment 10 100Privatized Services 30 200Public Service 470 450
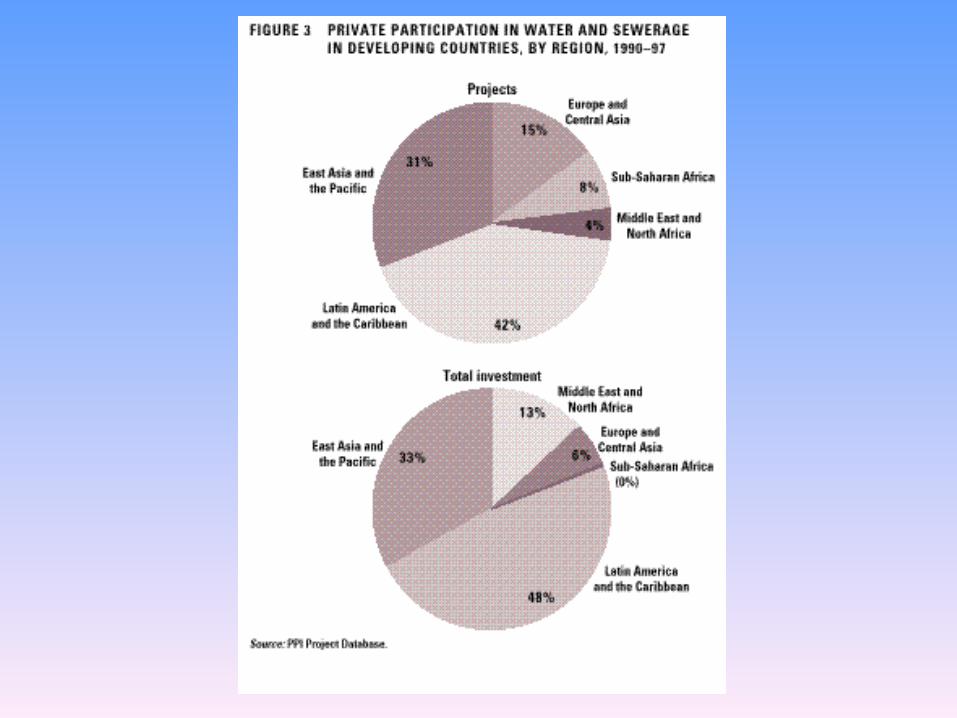
A Prospective View for Latin America
Investments through 2015 US$100 Billion or US$6-7 B/yr
Expected by Year 2030 Technological Changes ...
Private Sector’s Role as: Lenders, Operators, Investors
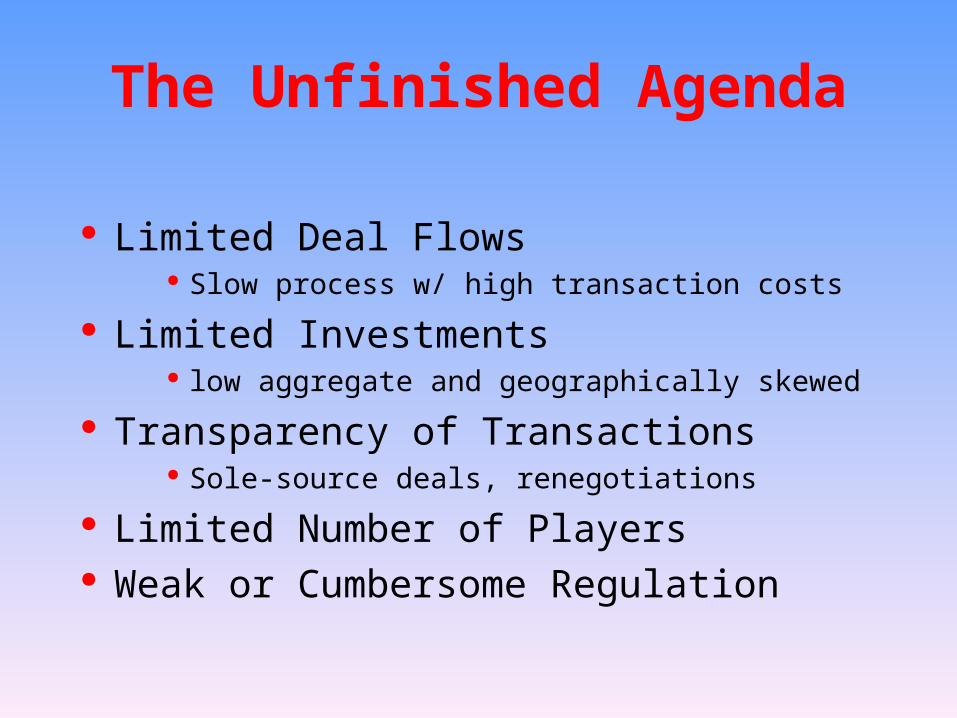
Limited Deal Flows Slow process w/ high transaction costs
Limited Investments low aggregate and geographically skewed
Transparency of Transactions Sole-source deals, renegotiations
Limited Number of Players Weak or Cumbersome Regulation
The Unfinished Agenda

Huge Investment Needs PS Services to the Poor PSP for Medium & Small Towns Increase Number of PSP, especially
small providers Targeted Subsidies Regulation of Services and Standards
The Challenges Ahead
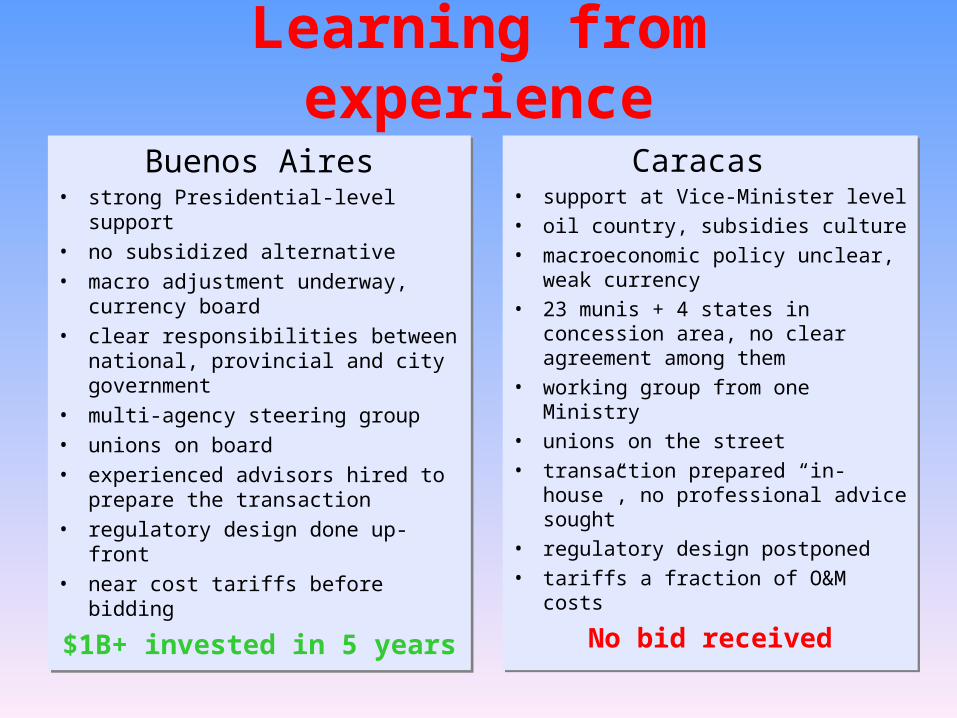
Buenos Aires• strong Presidential-level support
• no subsidized alternative
• macro adjustment underway, currency board
• clear responsibilities between national, provincial and city government
• multi-agency steering group
• unions on board
• experienced advisors hired to prepare the transaction
• regulatory design done up-front
• near cost tariffs before bidding
$1B+ invested in 5 years
Caracas
• support at Vice-Minister level
• oil country, subsidies culture
• macroeconomic policy unclear, weak currency
• 23 munis + 4 states in concession area, no clear agreement among them
• working group from one Ministry
• unions on the street
• transaction prepared “in-house”, no professional advice sought
• regulatory design postponed
• tariffs a fraction of O&M costs
No bid received
Learning from experience
Case Study: The BA Concession
The Achievements made in 4 years:– Rehabilitation/Renovation– Water Quantity & Quality– Expansion of Water & Sewer Networks
Tariff Evolution & Financial Outlook The Concerns:
– Infrastructure Surcharge– New Environmental Objectives– Lack or Subjectivity of Regulations– Tariff Structure and Demand Management

Rehabilitation & Renovationof the Water Distribution Network(cumulative in kms)
Year 1 Year 4Year 3Year 2
TargetAchieved
1.000
800
600
0
400
200
252
134
427439
584633
796 817
Achievements in BA through 1996

5
Water quality in network
%
ChlorineChlorineTurbidity Bacteriological
50
40
30
20
0
10
Year 1Year 2Year 3Year 4
50 %
13%
4 % 4 %
31 %
6 % 4 % 3 %8 %
4 %
2 % 0 %
Achievements in BA through 1996

Water expansion population served(Thousans of
inhabitants served
cumulative)
TargetAchieved
1.500
1.200
900
0
600
300 180221
448569
761869
1.358
1.121
Year 1 Year 4Year 3Year 2
Achievements in BA through 1996
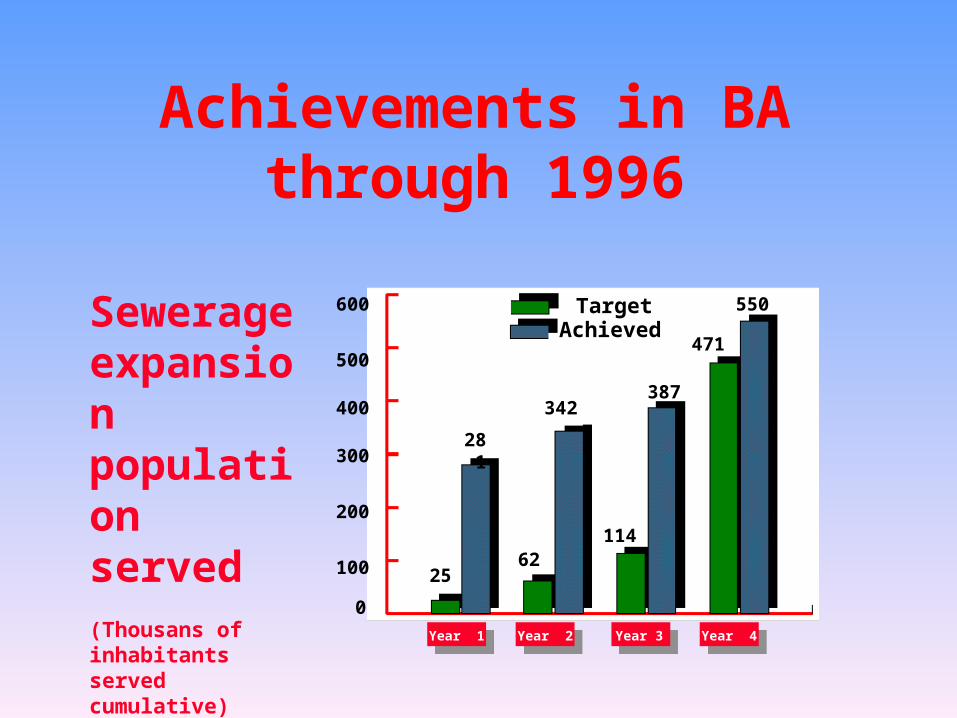
Sewerage expansionpopulation served(Thousans of inhabitants served cumulative)
TargetAchieved
400
300
0
200
100 25
281
62
342
114
387
471
550
Year 1 Year 4Year 3Year 2
500
600
Achievements in BA through 1996
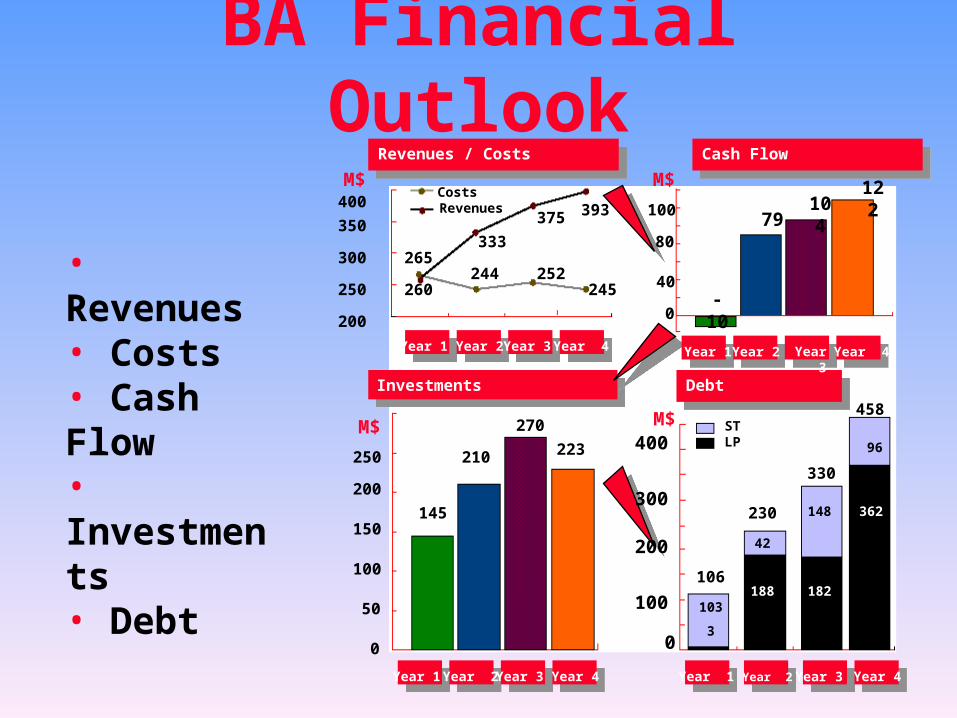
145
Year 1 Year 2Year 3 Year 4
210
270
106
50
100
150
200
250
0
Revenues / Costs Cash Flow
Year 1 Year 2 Year 3 Year 4
Debt
223
230
330
458
3
188 182
362
103
42
148
96400
300
200
0
100
M$M$
M$ 12210
479
-10
M$
250
300
350
400
200
Costs Revenues
265
260
333
244
375
252
393
245
100
80
0
40
Year 1 Year 2Year 3 Year 4
42
Investments
STLP
Year 1Year 2 Year 3
Year 4
• Revenues• Costs• Cash Flow• Investments• Debt
BA Financial Outlook

Tariff vs Consumer Price Index Evolution in BA through 1996
0.50.60.70.80.91.01.11.21.31.41.5
August 92 May-93 July 94 December 96
Price index
Tariff
1.081.13 1.17
0.731
0.83
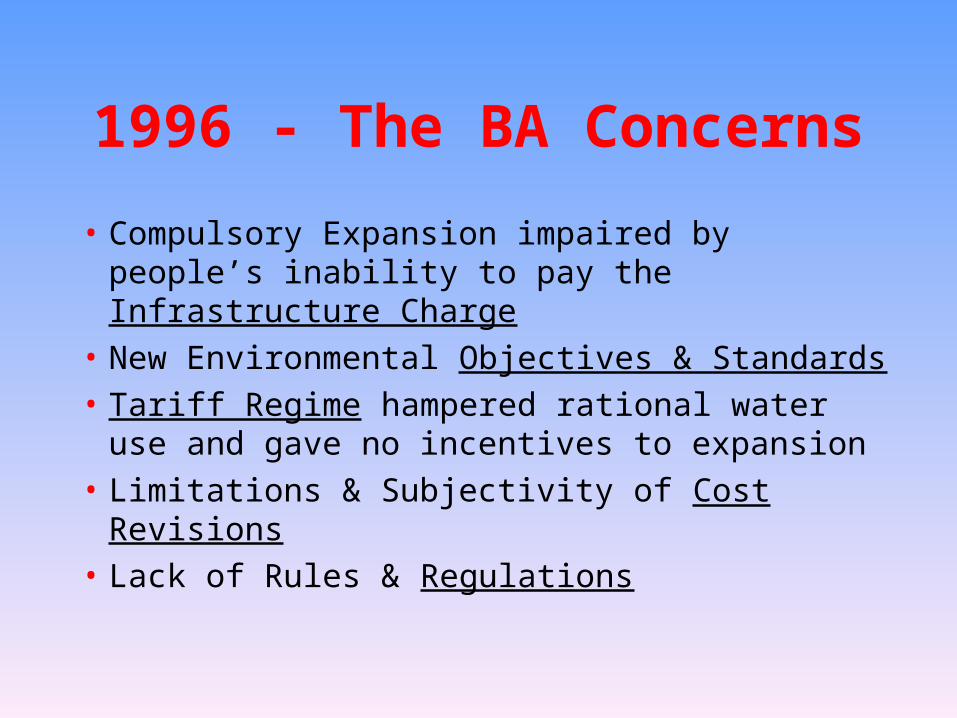
1996 - The BA Concerns
• Compulsory Expansion impaired by people’s inability to pay the Infrastructure Charge
• New Environmental Objectives & Standards
• Tariff Regime hampered rational water use and gave no incentives to expansion
• Limitations & Subjectivity of Cost Revisions
• Lack of Rules & Regulations
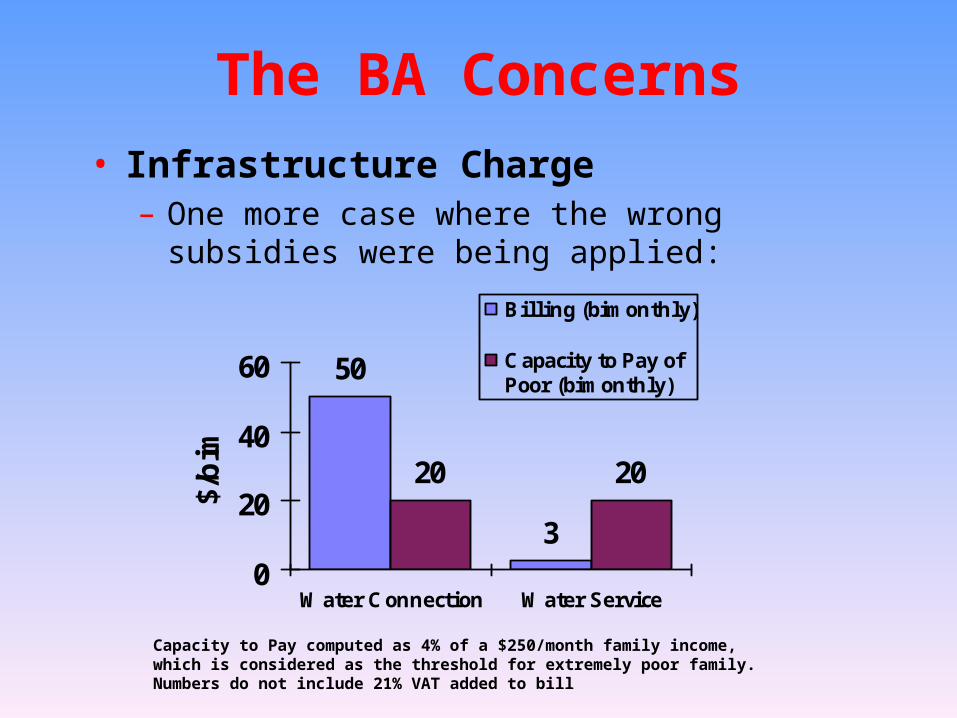
50
3
20 20
0
20
40
60
Water Connection Water Service
$/b
im
Billing (bimonthly)
Capacity to Pay ofPoor (bimonthly)
The BA Concerns• Infrastructure Charge
– One more case where the wrong subsidies were being applied:
Capacity to Pay computed as 4% of a $250/month family income, which is considered as the threshold for extremely poor family. Numbers do not include 21% VAT added to bill

TotalPopulation
(Millions)
Low income
Population
(Millions)
Ratio
Served Area 7,5 0,8 10%
Expansion Area 2,5 1,2 50%
The BA Concerns
Socioeconomic Outlook: 50% of the population to be incorporated belong to the lowest income group.
• Regulatory Issues– Need to incorporate new environmental
objectives (Matanza-Riachuelo) & standards– Cost Revision Trigger (7%) no longer valid– Definition and Measurement of Efficiency– Need for an appropriate Risk Allocation – Overall economic equilibrium of the concession
The BA Concerns
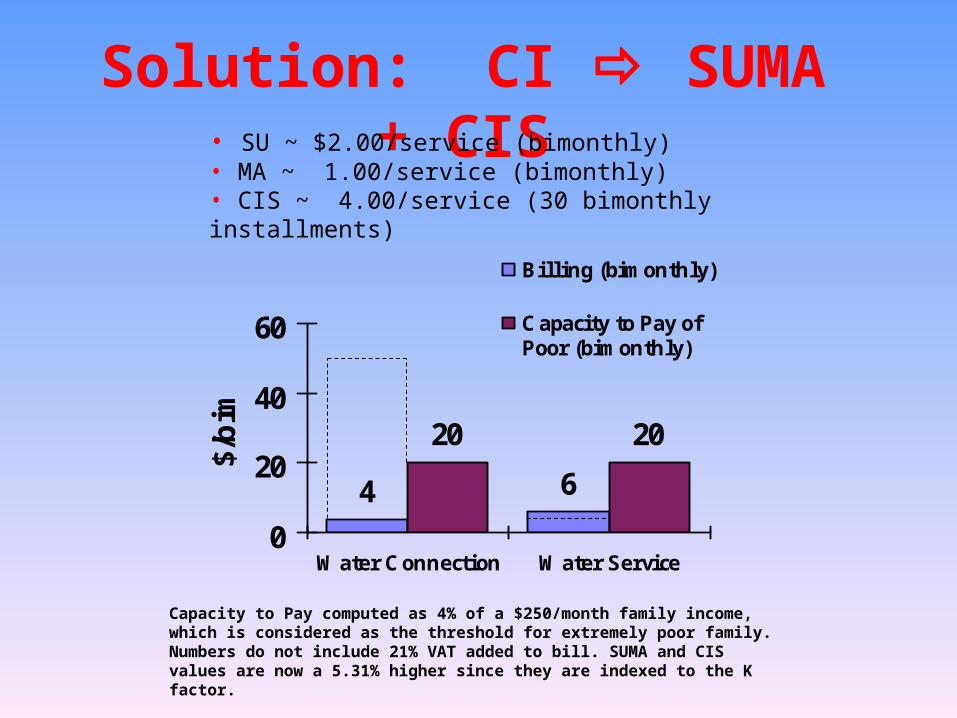
4 6
20 20
0
20
40
60
Water Connection Water Service
$/b
im
Billing (bimonthly)
Capacity to Pay ofPoor (bimonthly)
Solution: CI SUMA + CIS
Capacity to Pay computed as 4% of a $250/month family income, which is considered as the threshold for extremely poor family. Numbers do not include 21% VAT added to bill. SUMA and CIS values are now a 5.31% higher since they are indexed to the K factor.
• SU ~ $2.00/service (bimonthly)• MA ~ 1.00/service (bimonthly)• CIS ~ 4.00/service (30 bimonthly installments)
The Aguas Argentinas Case:New Economic Regulation
• From price-cap to benchmark model.
• Tariff Equilibrium:– Formalize relationship between Revenues,
Investments, Operating Expenditures and Capital Employed (Debt+Equity)
– Achieve Financial Equilibrium of the Concession.
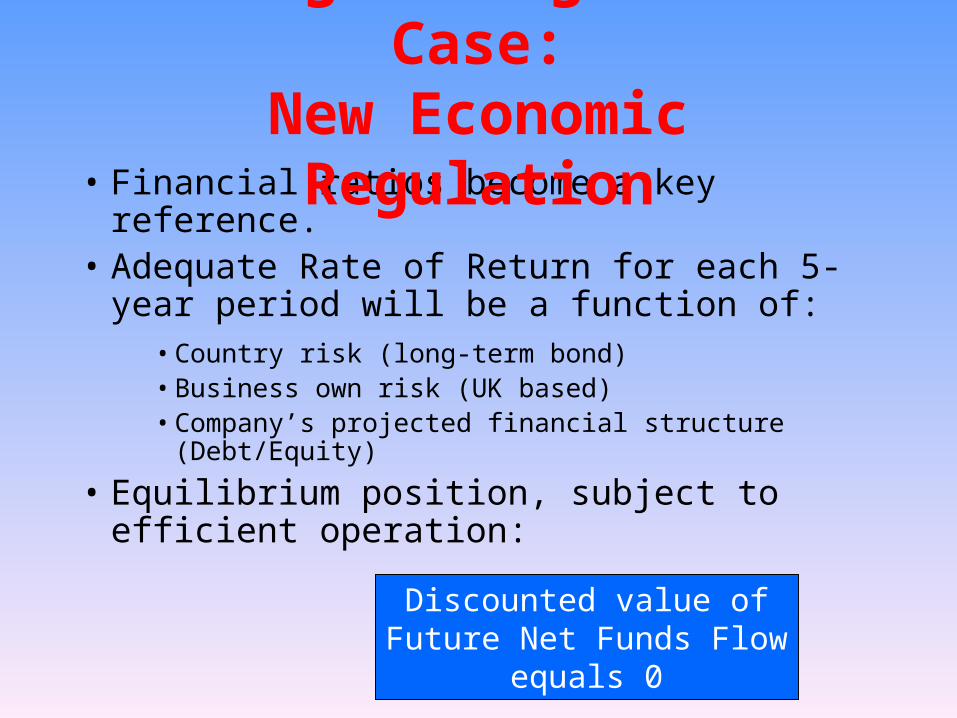
• Financial ratios become a key reference.• Adequate Rate of Return for each 5-year
period will be a function of:• Country risk (long-term bond)• Business own risk (UK based)• Company’s projected financial structure
(Debt/Equity)
• Equilibrium position, subject to efficient operation:
Discounted value of Future Net Funds Flow equals 0
The Aguas Argentinas Case:New Economic Regulation