Embed Size (px)
Citation preview

22247 vol 2.March 2000
7X7 VOICES FROM
T-THE VILLAGE
A COMPARATIVE
FC X H STU DY zII_
-7 ~ OF
COASTAL
MANAGEMENT
PACIFIC ISLANDS
PACIFIC ISLANDS DISCUSSION PAPER SERIESNuJMBER 9
4 4 EAST ASIA AND PACIFIC REGION
~~~ ~~~~~ ~PAPLJA NEW GUINEA AND PACIFIC ISLANDS COUJNTRY MANAGEMENT UNIT
Pub
lic D
iscl
osur
e A
utho
rized
Pub
lic D
iscl
osur
e A
utho
rized
Pub
lic D
iscl
osur
e A
utho
rized
Pub
lic D
iscl
osur
e A
utho
rized

DISCUSSION PAPERS PRESENT RESULTS OF COUNTRY ANALYSES UNDERTAKEN BY THE DEPARTMENT AS PART OF ITS NORMAL
WORK PROGRAM. TO PRESENr THESE RESULTS WITH THE LEAST POSSIBLE DELAY, THE TYPESCRIPT OF THIS PAPER HAS NOT
BEEN PREPARED IN ACCORDANCE WlTH THE PROCEDIJRES APPROPRIArE FOR FORMAL PRINTED TEXTS, AND THE WORLD
BANK ACCEPTS NO RESPONSIBILITY FOR ERRORS. SOME SOIURCES CITED IN THIS PAPER MAY BE INFORMAL DOCUMENTS
THAT ARE NOT READILY AVAILABLE. THE FINDINGS. INTERPRETATIONS, AND CONCL-USIONS EXPRESSED IN THIS PAPER ARE
ENTIRELY THOSE OF THE AUTHOR(S) AND SHOULD NOT BE AT-TRIBUTED IN ANY MANNER TO THE WORLD BANK. TO ITS
AFFILIATED ORGANIZATIONS, OR TO MEMBERS OF ITS BOARD OF EXECUTIVE DIRECTORS OR THE COUNTRIES THEY REPRESENT.
THE BOUNDARIES, COLORS. DENOMINATIONS, AND OTHER INFORMATION SHOWN ON ANY MAP IN THIS VOLUME DO NOT IMPLY
ON THE PART OF THE WORLD BANK GROUP ANY JUDGMENT ON THE LEGAL STATUS OF ANY TERRITORY OR THE ENDORSEMENT
OR ACCEPTANCE OF SUCH BOUNDARIES.

r ~~~~~~~-,- V-rj
VOICES FROM THE VILLAGE:
A COMPARATIVE STUDY OFCOASTAL RESOURCE MANAGEMENT
IN THE PACIFIC ISLANDS
March 2000Final Report
A World Bank Report

Copyright * 1 999The International Bank for Reconstruction and Development/THE WORLD BANK181 8 Street, N.W.Washington, D.C. 20433, U.S.A.
All rights reservedManufactured in the United States of AmericaFirst printing (draft version) June 1999Second printing (draft version) July 1999Third printing (final version) March 2000
Discussion Papers present results of country analyses undertaken by the Department as part of its normal workprogram. To present these results with the least possible delay, the typescript of this paper has not been preparedin accordance with the procedures appropriate for formal printed texts, and the World Bank accepts no responsi-bility for errors. Some sources cited in this paper may be informal documents that are not readily available.
The findings, interpretations, and conclusions expressed in this paper are entirelv those of the author(s) andshould not be attributed in any manner to the World Bank, to its affiliated organizations, or to members of itsBoard of Executive Directors or the countries they represent. The World Bank does not guarantee the accuracy otthe data included in this publication and accepts no responsibility for any consequence of their use. The bound-aries, colors, denominations, and other information shown on any map in this volume do not imply on the partof the World Bank Group any judgment on the legal status of any territory or the endorsement or acceptance ofsuch boundaries.
Accompanying reports to this study include:
World Bank (2000a). Voices from the Field: A Comparative Studv of Coastal Resource Management in the PacificIslands - Summary Report. Pacific Islands Discussion Paper Series No. 9A. East Asia and Pacific Region, PapuaNew Guinea and Pacific Islands Country Management Unit. The World Bank, Washington, D.C.
World Bank (2000bj. Voices from the Field: A Comparative Study of Coastal Resource Management in the PacificIslands - Site Visits and Nationa/ Summaries Annex. East Asia and Pacific Region, Papua New Guinea and PacificIslands Country Management Unit. The World Bank, Washington, D.C.
The material in this publication is copyrighted. Requests for permission to reproduce portions of this documentand requests for copies of this report or accompanying reports should be sent to:
Mr. David ColbertPapua New Guinea and Pacific IslandsCountry Management UnitEast Asia and Pacific RegionThe World Bank1 818 11 Street, NWWashington, DC, U.S.A. 20433Fax: (1) 202-522-3393E-Mail: Dcolbertl @worldbank.org
Photos by Sofia Bettencourt, Bob Gillett, and Noah Idechong

I!!
g ---- . ~~~~~~~~~~~~~~~~~s4oflsa AaN 10 ikiPWWflS
6Z ............................... slinsaod am4pel!ueno Jau,4oL... .................... -snsoN vaQ, jo uoielaidialui5Z.. s's'IeuV alPiWAi!Ill,A
.SZ. lUWSSaSSV aAlj!Ieleno
SZ. JI.. 3l sSa::)nS *IA
zz .uoiwueicaluil pue slinsaoN XaN jo AiewwnS.Z .suo0!4caJa pUW I ajp esaV
6 L...... S LIOI PDAPD-10d81 .. DueIldwoD pOAWD,J1dL1- ~.f.. . sjj!qe lelsUOD LI) Spua)j pJ)AiOdSL.1J0Jl jO flun JOd qDLIPD U! SpUWJL PDA!aDJadS. ss nS J0 suo!ida)kad A
.s~~~~~~~~~~~~~~~~~~~i~~~~~~~~~~~~~s~~,:: Apnh JJ13 'A
01 ..... .................... .** . ... SLI0lP!L;UIj p)up su°oticinssV AO)l6................................. sllnsaua,l lo sisAleuV
6......... .ss.D..S .u!Duanjluj s0ol:De8. s.DD..S 40 Sjo eiz!puj9... .. .......................... AaAjns al!S l Suiluwaldwl9 ***..*.*. u°!}p las al!S
. uo0lDalDs AJlunoDs . . .. . .. . ........................... . . ... ..... w ea_L ApniS atu,
S.. ssajppv sanssl AdN. ]J0MdaLuPJ] ID!V'\IPuv
b .dDudipflV AdN I)ue SdA!I4d[9q ApniS
.s ... - snss. AdN
I.- -'sadId!JUid SUIAI0A]
. sdJJfosadI le4sI?0) 40 dDuelioduuI
L.--------------------uOiPflpOJ1UI *1
...........-- ...................-...--..--..-*-..*-..--. -- -............................... sa....pn.....S...snolA........Jd 'IIa!l :) x
IA.*--------------------------------------------------------suo!1e.AaJqq. pue swUAua) '
A.S~~~~~~~~~~~~~~~~~~~~~~~~,-I1puliW 3~Fu MOUI I
°N dSPd
sXualuoj jo aIe

Page No.
VIl. Key Issues ........................................................... 33Conflicts .......................................................... ............ 33Government Support for Community Initiatives ............................................... 34Relevance of National and Local Management Regulations ...................................... 35Characteristics of Open Access Areas ...................................................... 36Partnerships ................................................................... 38Marine Sanctuaries ......................................................... 41Alternative Income Generation ......................................................... 43Limitations of Community-Based Management ................................................ 45Are Coastal Resource Management Objectives Being Met? ....................................... 47
Vil. Key Lessons Learned ......................................................... 49Key Lessons Learned ......................................................... 49General Recommendations ......................................................... 51Country-Specific Recommendations ....................................................... 54Suggested Areas for Future Research ....................................................... 55
Annex A: Key Lessons Learned in the Implementation of the Study Survey ............................... 57
Annex B: Quantitative Methods and Results ..................................................... 59
Bibliography ........................................................... 85
Map IBRD 30365
iv

Acknowledgements
The World Bank wishes to express its appreciation to the Governments of Fiji, Samoa, Solomon Islands, Palauand Tonga for their support of the study. The authors are also grateful to the Secretariat of the Pacific Community(SPC), the South Pacific Regional Environmental Programme (SPREP), the Forum Secretariat, the University of theSouth Pacific (USP), the South Pacific Applied Geoscience Commission (SOPAC), non-governmental organiza-tions and several research organizations for their assistance.
The study was conducted by a regional team led by Robert Gillett (regional study coordinator), and includedEsaroma Ledua (in Fiji), Noah Idechong (Palau), Foua Toloa (Samoa), Michelle Lam (Solomon Islands), andTaiamoni Pifeliti (Tonga). Ofisa Esera, Namulauulu, Alifereti Tawake, and Nelson Kile assisted with the site sur-veys in Samoa, Fiji and the Solomon Islands. Isoa Korovulavula and Aliti Vunisea helped develop the participato-ry rural appraisal methods used in the study and assisted in the initial design. Dianne Russell and Garry Prestonprovided key inputs to the questionnaire development. Lisette Wilson assisted with data coding. Samu Bruce andTevita Waqavakatonga provided clerical support. Paul Geraghty (in Fiji), Pesi Fonua (in Tonga), Lafitai Fuatai (inSamoa), Salome Samou (Solomon Islands) and Kathy Kesolei (in Palau) commented on the questionnaire andinterview process from a local perspective. The study team is also deeply grateful to all other field assistants andfacilitators who accompanied the team to individual sites.
The World Bank team was led by Sofia Bettencourt, and comprised Jeffrey Muller and Herman Cesar (quantitativeanalysis), Hanan Jacoby (econometric advice), Richard Pollnac (survey advice and factor analysis), John Virdin(summary report), Cecilia Belita (Task Team Assistant), Lilian Pintea (GIS support), and Phil Sawicki (editorialreview). The study was conducted under the direction of Klaus Rohland, Country Director, Pacific Islands, Geof-frey Fox, Sector Director, Rural Development and Natural Resources, East Asia and Pacific, and Malcolm Bale,Sector Leader, Strategy and Policy, EASRD.
Peer revievwers included Allan White, Tim Adams, John Cordell, John Dixon, and Louise Scura. The study team isalso grateful for the advice provided by Andy Hooten and John Parks.
The study benefited from the advice of a regional committee comprising Richard Pollnac, Tim Adams, JulianDashwood, Garry Preston, Lui Bell, Sue Miller, Peter Hunnam, Ray Clark, Andrew Smith, and Gerald Billings.The study team is grateful for the assistance provided by Mr. Peniasi Kunatuba, Mr. Ken Cokanasiga, and Mr.Maciu Lagibalavu in sponsoring the study design workshop in Suva in June 1998. The team is also thankful to Dr.Transform Aqorau (Forum Fisheries Agency) for his review of the study findings on the countries' legislativeframework, and to Ruud Koning (Groningen University) for his review of the econometric results. Commentsreceived from various experts on the June 1999 draft report were deeply appreciated. The team also wishes toacknowledge the contribution of Bob Johannes, who led much of the early work in the Pacific on community-based coastal resource management.
This study was funded by the World Bank Papua New Guinea and Pacific Island Country Unit, the AusAID/WorldBank Pacific Facility, the Netherlands Environmental Trust Fund, the Overlays Program funded by the Danish TrustFund for Environment and Socially Sustainable Development, and The World Bank Knowledge Management.
Finally, the authors are grateful to the village leaders and residents of the 31 communities surveyed under thestudy. It is hoped that the study captures well their opinions and recommendations to improve the future condi-tion of coastal resources in the Pacific Islands.
v

Acronyms and AbbreviationsAIG Alternative income generation
AUSAid Australian Agency for International Department
BCN Biodiversitv Conservation Netwvork
BDM Beche-de-mer
CPUE Catch per unit of effort
CRM Coastal resource management
EASRD Rural Development and Natural Resources Unit, East Asia and Pacific Region,the World Bank
FADs Fish aggregation devices
FAO Food and Agriculture Organization of the United Nations
GEF Global Environmental Facility
ICLARM International Center for Living Aquatic Resources Management
ICZM Integrated coastal zone management
Km Kilometer
NCDS National Center for Development Studies, Australian NationalU n iversitv
NGOs Non-governmental organizations
OLS Ordinary least squares
PNG Papua New Guinea
PRA Participatory rural appraisal
SPC The Secretariat of the Pacific Community
SPREP South Pacific Regional Environmental Programme
URI/CRC University of Rhode Island's Coastal Resource Center
US$ United States Dollar
WB World Bank
Vice-President: lean-Michel Severino, EAPVPDirector: Klauis Rohland, FACNISector Director: Geoffrev B. Fox, FASRD)Task Team Leader: Sofia Bettencourt, FASRD

Executive Summary
INTRODUCTION TO THE STUDY The study sought to address the following questions:What are the factors external to the communities that
The lives of the people who live on the 2,700 islands are most likely to affect coastal resource manage-of the Pacific are closely intertwined with the ocean. ment? What are the site-specific characteristics thatIn this vast ocean area of 30.6 million square kilome- influence management success? Which managementters, Pacific Islanders continue to depend heavily on processes are most conducive to successful coastalthe marine life in the coastal waters for food and resource management? Also surveyed were the per-income. Much of the culture of the islands - its way ceptions of community groups regarding coastalof life, traditional beliefs and recreation -is linked resource trends, the need for external assistance, theto the coastal areas. relevance of national legislation to the communities,
the effectiveness of partnerships between communi-Coastal areas, however, are facing many challenges. ties and external organizations, and lessons learnedPopulation growth and the need for cash income from marine sanctuaries and income-substitutionhave led to overexploitation of fish and shellfish policies. Given the uncertainties that still surroundresources. The lagoons, coral reefs, and shores are these complex issues, the study's conclusions are pre-being threatened by pollution, siltation, and the con- sented as key lessons learned, and the recommenda-struction of coastal infrastructure facilities. Moreover, tions are kept as specific as possible.the government agencies of most of the islands arenot structured in a way that would enable them to To assess the impact of coastal management, smallcarry out the integrated efforts that may be needed to focus groups were asked about their perceptions ofdeal effectively with the threats to coastal resources. trends in four major indicators:
In 1998-99, the World Bank sponsored a survey of * catch per unit of effort;coastal communities in five Pacific Island countries - * habitat condition;Fiji, Palau, Samoa, Solomon Islands and Tonga. The * threats to coastal resources, andpurpose of the study was to strengthen the under- * compliance with resource management rules.standing, among the region's coastal managers, of thefactors that contribute to the successful management The perceptions about changes in these indicators dur-of coastal resources. The study was based on a six- ing the past ten years were obtained through interviewsmonths survey of 31 coastal communities and was with 133 focus groups, composed of either elders,carried out by a regional team composed of a study women, or men resource users. In addition, the studycoordinator based in Fiji and a national consultant in team collected information from various communityeach of the five countries. A World Bank team assist- sources on factors that may affect management success:ed in the study design, final analysis, and reporting. external factors, such as natural disasters and national
policies; site characteristics, such as the quality of localThe study relied primarily on community perceptions leadership; and management processes, such as interac-of trends in the condition of coastal resources and tion with external partners (e.g., fisheries agencies) andfactors affecting resource management at the village the involvement of village stakeholders in decisionslevel. There were two reasons for this approach. First, regarding resource use. The answers from the communi-there had never been a comprehensive ecological ty were complemented by study team observations ofsurvey of the condition of coastal resources in the site conditions and interviews with representatives ofPacific Islands, and the time and costs that would government agencies and external partners.have been required were beyond the scope of thisstudy. Second, most of the decisions that have an The findings of the study are described in Chapters Veffect on coastal resources are made by local com- toVIII. Chapter V summarizes the.site characteristics.munities based on their own perceptions of resource Chapter VI reports on community perceptions ofconditions. A better understanding of these percep- resource trends. ChapterVII describes the quantitativetions was therefore believed to be essential to help analysis of the factors that influence managementPacific Island countries and donor agencies formulate success, and Chapter VIII presents findings on the keyappropriate coastal resource management policies issues addressed by the study. The results chapters areand programs. organized independently, allowing readers to select
sections that best meet their interests. Lessons learned
vii

and specific recommendations are summarized in Simple management rules work best... In general,Chapter IX. the following types of rules were perceived as
achieving the most compliance:KEY RESULTS * national regulations which were seen to be
. . ~~relevant to the community and which wereCoastal resources are perceived to be declining...Community groups were generally pessimistic subsequently adopted by village leaders asabout resource trends. Only 10 percent of the local rules;responses stated that catch per unit of effort had * national rules enforced by buyers or exporters,improved over the last decade, and only 3 percent such as the national ban on trade in crocodilesassociated such an improvement with manage- in the Solomon Islands; andment interventions. Perceptions about habitat con- .marine sanctuaries closed seasons for s ecificditions and threats to coastal resources were more * imannes anctules, rclsedseastrucific
.. ~~~~~o the repne seeing. ............ fisheries, and rules restricting destructive fish-optimistic, with about half ing practices (e.g., a ban on night diving).negative trends. Several of the communities whereresource were perceived to be declining were vil- The results of the study also indicate that the sim-lages with low population densities, suggesting pIer the national rules, the better they are under-that even in remote areas, the impact of a few effi- the ndtiolled by betal ties.cient commercial fishers on the exploitation offragile coastal resources should not be overlooked. while open access constrains communityOverall, the study results indicate the need for action. Eight of the 31 villages lacked any mecha-much greater attention to coastal resource man- nisms to exclude outsiders from using their coastalagement throughout the region. site. With one possible exception, none of these
... and the nature of the threats to coastal open access sites had developed local rules forresources a pp,ears to be changing. Communities managing coastal resources. By contrast, all of theperceived pollution as the fastest rising threat to restricted access sites had adopted local manage-coastal resources, while destructive fishing was ment rules, indicating that the authority to restrictcoastal resources, while destructive fishing was . .. perceived to have declined the most. Threats access by outsiders is a powerful incentive forcaused by overfishing, siltation, and mining fell community-based management. Compared withbetween these two extremes. Overfishing and restricted access sites, open-access communitiesbewe ths tw exrms ,vrihn n perceived threats to coastal resources to bedestructive practices, however, were commonly prevdtrast osa eore obidertivied practie, how eer, were commo increasing faster and felt less capable of dealingidentifiredouraes am the st itat. with local threats. Open access communities also
tended to have less awareness of the benefits of
The outlook for coastal resources is perceived to be coastal resource management.bleak... Respondents at 21 of the 31 sites believed Most alternative income generation programs docoastal resources would continue to decline in the not appear to have been successful in reducingfuture. In village after village, people whose liveli-hood depended on the health of coastal resources pressure on tal resources... an ternalargued for stricter enforcement of existing regula- pams in ifc hav iruc lternativetions and additional restrictions on commercial har- shore tuna fishing and deep slope fishinga- tovesting. Thereopt decrease pressure on coastal fisheries. Communitymism: in Samoa, respondents at five of the six sites peceas atethe stal sisherie thatybelieved that resources would improve in the future perceptions at the study sites idicate that thesebecause of recent community management efforts. programs have generally not been successful Inbecause of recent community management effort, , reducing pressure on coastal resources. Commer-And in Luaniua (Ontong Java, Solomon islands), the cial aquaculture operations were seen to be facingcommunity adopted an extended ban on their own marketing difficulties. Tuna fishing did, in somefishing for trochus and beche-de-mer despite cases, provide by-catch at the village level, butdepending on coastal resources for 70 percent of there was a perception that crew members weretheir income. This suggests that communities are often not coastal fishers. At several sites, villagerswilling to make sacrifices to gain long-term benefits stated that the ice plants introduced to support off-if they are aware of the potential benefits and are shore fishing had actually helped opened up newguided by strong local leadership. markets for fresh coastal products and therefore
viii
increased their exploitation. This suggests a need to 14 of the study sites. In general, communities hadexplore income generation opportunities outside favorable impressions of the sanctuaries' impact.the fisheries sector, should they exist. Compliance was perceived to be goocl, and key
species were thought to be increasing in abun-... and some of the most valued partners play pri- dance. The communities also felt, in general, thatmarily an advisory role to the communities. Fif- the sanctuaries would be sustained into the future.teen study sites (48 percent) were being assisted Perhaps as relevant as their management role,by external partners in managing their coastal sanctuaries seemed to act as catalysts in increasingresources. In general, communities perceived the community awareness of the benefits of coastalbenefits of partnerships to outweigh their short- resource management. The study team found,falls, but communities and external partners tend- however, that greater attention needs to be paid toed to have different perceptions about the benefits ensuring that the results of ecological monitoringof the partnership. Local communities focused on are available to villagers, that no-take rules insideshort-term, tangible benefits, while external part- sanctuaries are strictly enforced, that sanctuariesners were more interested in process-oriented are properly located and sized, and that villagersresults (e.g., strengthening local management clearly understand the sanctuaries' objectives andinstitutions). Communities perceived unkept benefits. Moreover, while the benefits of sanctuar-promises, inadequate consultation, and slowness ies were generally perceived to be positive, theyin achieving results as the main flaws of the part- did not eliminate the need for other managementnerships, while the external partner focused on interventions.the failure of villagers to fulfill their commitments.The study also found that while external partners Communities need help... Community-basedfelt that they had made strong efforts to provide management was found to be deficient in fiveinformation to the communities, there was often major areas: first, the villagers felt that some formlittle evidence that villagers had absorbed the of outside assistance was needed to handleinformation provided. coastal pollution, mining operations, commercial
overfishing, and other threats such as dredging,In general, partnerships fell into two categories: construction of causeways and drilling for oil.those which were largely initiated by the external Second, nearly 40 percent of the villages lackedpartner (Category A), and those where the commu- mechanisms to control their own fishing effort.nity itself requested the assistance (Category B). Where such mechanisms existed, external part-Category A partnerships tended to be found at sites ners had acted as catalysts for community action,of internationally recognized biodiversity impor- or the village benefited from strong local leader-tance, and often involved the introduction of new ship and from a high dependence on coastalprocesses at the village level. Although the time resources. Third, communities had difficulty inneeded for these processes to be absorbed was enforcing local rules when it was unclear whethermuch longer than for Category B partnerships, the the rules conflicted with national laws (this wasdonors supporting Category A partnerships tended particularly true in Fiji and the Solomon Islands).to have a shorter funding horizon than the nation- Fourth, communities might need access to expertal agencies and local NGOs which were typically advice on technical aspects of resource manage-involved in Category B partnerships. Mechanisms ment. And finally, many communities seemed toto ensure longer-term funding for Category A part- lack ways to prevent their leaders from engagingners should therefore be considered. Community in private business interests which may conflictsatisfaction with Category B partnerships seemed with their management responsibilities towardsto be pronounced. These external partners were the community.perceived as fulfilling the role of an 'honest bro-ker', provicling quick and sound management ... yet coastal resource management seems to beadvice to the communities. Often, these partner- receiving low priority. In general, the study foundships relied on little more than technical support a need for greater government attention to coastaland awareness raising, and were effective at rela- resource management. Only one fourth of the stafftively low levels of funding. time of national fisheries agencies was estimated
to be spent on coastal management matters.Sanctuaries seem to act as catalysts for communi- Given the low priority accorded to coastal man-ty awareness of the benefits of coastal resource agement, it is not surprising that only about 40management... Marine sanctuaries were found at percent of the villages had been visited by a gov-
ix

ernment official to discuss coastal resource man- collaboration to address land-based threats to coastalagement issues during the last decade. Half of the habitats.sites visited were also receiving funding supportfrom dconors, suggesting that donor assistance is Among site-specific factors, sites with good localbeing used in some cases as a replacement for leadership arid com plex ecosystems hacd signifi-much needed government support. cantly lower perceptions of threats to coastal
resources. Communities which shared the benefitsFurther collaborative efforts are needed, but per- or losses of management equally among theirhaps of a different kind than presently provided. members perceived more positive catch trendsOverfishing was the most frequently perceived and lower threats than other communiities sur-cause of catch declines and one of the most impor- veyed. The presence of pollution at a site causedtant threats found at the study sites, vet in many perceived habitat trends to be worsening. Popula-cases it could not be addressed adequately by cur- tion growth rates and density did not appear torent regulations. Programs may be needed to have a negative impact on the perceptions of suc-strengthen the communities' awareness of the cessful management of coastal resources. Howev-need to restrict their own fishing effort, and to er, the presence of nearby settlements resulted inrestrict the issuance of commercial licenses. In perceptions of worsening habitats and increasingidclition, many of the threats that, in the view of threats. The presence of niodern fishing technolo-respondents, require some form of external assis- gy led generally to perceptions of increased catch-tance -- for example, coastal pollution, mining, es, reflecting iniproved access to distant fishing(ooastal infrastructure construction -cannot be grounds. More educated villages tended to per-controlled only by the institutions that traditionally ceive worsening habitat trends, presumably due tohave a niandate for coastal resource management higher awareness of human impact on coastal1he fisheries and environmental agencies). Mech- habitats. High local awareness and effective localanisnis are needed to coordinate government assis- enforcement were also seen as iniportant factorsltance across multiple sectors, a major institutional in management success.difficulty in Pacific Islands where inter-departmen-tal cooperation remains weak. The study also indi- Are stated perceptions true perceptions? Percep-(ated that the type of research that coastal com- tions of resource trends were founcl to be remark-muriities most need niay not require complex stock ably consistent at any particular site. With theassessment, but instead a better understanding of exception of habitat trends, the study found no sta-the socio-economic incentives that affect resource tistically significant differences between the per-use, ancl the development of simple technical solo- ceptions of the focus groups of similar characteris-tions to assist communities in managing their tics. Perceptions of compliance with managementcoastal resources. rules appeared to be the only indicator where there
might be a clear incentive to underreport the inrci-Which factors affect perceived success at the site dence of violations, but the indicator remains Llse-level? The relatively small number of sites, along with ful to compare the perceived compliance with thedata constraints, made it difficult to distinguish the various management rules.eftects of multiple factors on perceived indicators ofsuccessful resource management. However, some The present study departed froni conventional survey-eneral conclusions can he drawn. Aniong factors methods bv relying heavily on the perceptions ofexternal to the site, natural disasters (e.g., cyclones) coastal communities. This produced useful insightswere significantly associated with the perception that as well as some unexpected findings that are relevantfish catches were recovering and habitats had to the management of coastal resources in the Pacif-improved following a major event. The study also pro- ic. This experience indicates that in future studies,vicded indications of the national policies that may be careful attention should be given to the views ofneedel to SLipport community-based management of coastal communities. It is those villagers who arecoastal resources: simple and clear national regula- dependent on coastal resources, who play a majortions, an enabling framework facilitating the adoption role in the success of any nianagement system, andand enforcement of local rules, awareness programs who have the greatest stake in whether the systeniaimecl at local leaders, assistance on technical succeeds or fails.aspects of resource management, and inter-sectoral
s

1. Introduction
IMPORTANCE OF COASTAL RESOURCES' J, X .r%
Pacific Islanders are closely linked to theircoastal environment. For the 2.6 million peoplewho inhabit the small islands of the Pacific, thecoastal areas are vital to their nutrition, welfare,culture, and recreation.
Fish and other marine resources provide PacificIslanders with US$262 million in annual rev-enues and 39 percent of the total animal proteinin their diet, compared to 1 6 percent for peopleworldwide. Without subsistence fisheries, indi-vidual countries would have to import an addi-tional US$3-8 million a year in substitute foods.Tourism, which is also highly dependent on thequality of the coastal environment, provides theislands with an estimated US$1 billion in grossrevenues annually (World Bank, 1995; Laureti, C*LOA s
1992; Dalzell and Adams, 1994; Pacific Busi- ,P..,,
ness, 1 998). And the coral reefs, mangrove sys-tems, and rocky barriers of the coastal habitats rplay a key role in erosion control, reducing the - -L islands' vulnerability to cyclones, tidal waves,and other natural disasters. I >. > v
For centuries, ways of dealing with the ocean i have shaped the culture of Pacific Islanders, and 1 0-aquatic sports, marine totems and taboo areas /continue to be essential aspects of the Pacific /way of life. K L - -
a-w~~ 13u A Pa.NIt4c-,
EVOLVING PRIORITIES 1-1A,66A pjCVA-.IUA .I
The way Pacific Islanders interact with theircoastal resources has been evolving throughout Figures 1 and 2. A typical coastal area in the Pacific (Aleipata,
Samoa). Figure 2 shows a community demarcation of theirthe region. Historically, many coastal commu- coastal area in Galoa, Fiji. The community coastal boundariesnities did not distinguish between land and extend from the land to the outer edge of the reef, delineatedcoastal waters in setting village boundaries. by the two reef passages.The village territory simply extended to theouter edge of the reef (see Figures 1 and 2). Toallow for coastal resources to regenerate, com-munities adopted local management rules such coastal resources. In recent years there has been aas special areas where harvesting was prohibit- growing awareness that centralized managemented. People from outside the community were has not been effective and that local communitiesoften excluded from harvesting inside commu- must have greater involvement in coastal manage-nity waters. ment efforts.
These traditional systems have proven remark- At the national level, fisheries agencies are generallyably resilient to recent challenges, such as the responsible for coastal resource management. Esti-introduction of laws entrusting national gov- mates from this study indicate, however, that lessernments with the responsibility for managing than one fourth of the working time of fisheries agen-
cies is spent on coastal management. The remainingFor a definition of coastal resources, see Chapter II. is typically spent on routine administration and fish-
IN FRODU(T1)N I

eries development. In some countries, the emphasis * Weak Institutional Coordination. Governmenton coastal management may have actually declined agencies in many Pacific island countries arein recent years. structured along sectoral lines (fisheries, tourism,
public works) with weak central planning agen-Environmental agencies are relative newcomers to cies. This kind of structure makes it difficult tocoastal management and often operate in partner- carry out the integrated efforts that may be need-ship with nongovernmental organizations NGOs) in ed to manage the coastal environments of smallpromoting marine conservation programs. The sepa- island countries.ration behteen fisheries and environmental groupsalso extends to regional organizations. The Secretari- * Low Awareness. Among many high level policyat of the Pacific Community (SPC) provides manage- makers, there is little awareness that coastalment assistance on coastal fisheries to its 22 island resources mav be declining to critical levels andmember countries and territories, while the South that management is necessary for their recovery.Pacific Regional Environmental Programme (SPREP)is involved in marine conservation and integrated * Technical Challenges. Since the early 1970s,coastal zone management (ICZM).' The impact of conservation experts have favored the creation ofconservation programs on coastal areas is unclear, closed areas (sanctuaries) as a better way to man-but attempts at ICZM have met with limited success age coastal ecosystems than other forms of man-to date. agement, such as outright bans on fishing for par-
ticular species or harvesting quotas. The relativeKEY ISSUES effectiveness of sanctuaries as opposed to other
forms of management is not well known, howev-The Pacific Islands face numerous challenges in man- er. Similarly, the impact of alternative income-aging their coastal environments: generation programs (such as aquaculture) in
relieving overexploitation of coastal resources* Population and Economic Pressures: Between remains largely unknown.
1970 and 1990, the Pacific Island populationgrew by 2.2 million people, an annual growth Pacific Island communities play a vital role in coastalrate of 2.3 percent. Combined with a low annual resource use. Community decisions to manage andeconomic growth of 3.1 percent in recent years use coastal resources are based on local perceptionsand weak prices for agricultural commodities and the socio-economic factors judged to be impor-such as copra and taro, the commercial harvest- tant at the local level. A better understanding of theseing of coastal resources has intensified, leading to perceptions is therefore essential to help Pacificoverexploitation (NCDS, 1994; World Bank, Island governments and external donors formulate1998). appropriate national policies and coastal programs.
This study provides this perspective from the point of* Ecological Degradation: Pollution and sedimen- view of 31 communities in five countries (Fiji, Palau,
tation caused by poor logging practices, human Samoa, Solomon Islands and Tonga). The authorswaste and agricultural run-off have contributed to hope that the study findings will contribute to anthe degradation of coastal habitats. In Samoa, the improved knowledge of the factors that affect coastalcosts of urban pollution in terms of lost reef fish- resource management throughout the Pacific.eries revenue are estimated at about US$1 70 perhectare per year (World Bank, 1995; Zann,1991).
ICZ.M seeks to use inter-sectoral approaches to deal with the mul-tiple threats affecting coastal zones.
Voices from the Village: A Comparativer Study of Coastal Resource Management in (hl Paci ili Is aneds

11. Previous Studies
The great majority of surveys of coastal resources on The Biodiversity Conservation Network (BCN), aPacific Island countries have focused on biological grant program administered through the Worldassessment. There have also been numerous anthro- Wildlife Fund, The Nature Conservancy and thepological and socioeconomic studies of coastal World Resources Institute, conducted an evaluationareas but, for the most part, these have been case of 20 projects in the Asia and Pacific region in 1998studies of individual communities, countries, or to determine whether or not micro-enterprises creat-regional reviews (see, for example, Adams and ed to provide alternative sources of income to com-Ledua 1997; Adams 1997; Crocombe 1994; Eaton munities helped achieve conservation goals (Salaf-1985; Holthus 1991; Hviding and Ruddle 1991; sky, N. et al., 1999). The study sample consisted ofJohannes 1994, 1978; Munro and Fakahan 1993; 48 micro-enterprises. Conservation impacts werePreston and Wright 1990; Ram 1981; UNDP 1991; measured based on perceptions of the reduction ofVeitayaki 1990). Case studies are important to gain threats to the site, a measure of future conservationin-depth knowledge about a particular site's condi- success, and ecological monitoring data. The studytions, but the different methods used can make cross- results, released in September 1999, found thatsite comparisons difficult. micro-enterprises could be an effective tool for con-
servation but only when used in conjunction withThis study used a baseline-independent method sim- other management interventions and under particu-ilar to the ICLARM-URI/CRC survey of villages in the lar conditions. The study found, however, that cashPhilippines (Pomeroy, Pollnac et al., 1996 and 1997)' benefits were not necessary for conservation suc-which investigated community perceptions of cess. More important were non-cash benefits such aschanges in social and economic variables resulting improved village facilities, an increased sense offrom the implementation of the Central Visayas empowerment, or better environmental conditions.Regional Project. The project, funded by the World The BCN survey benefited from a rigorous method-Bank, included community-based management inter- ology built around a single hypothesis (BCN 1998,ventions in coastal areas, such as the establishment of 1999). A modified version of the threat reductionmarine sanctuaries and artificial reefs. The survey index developed by BCN was used in this study.relied on respondents' perceptions of changes in suchindicators as local income, community conflict, and In 1997, the World Bank conducted a review of Inte-control over resources prior to and after the project. grated Conservation and Development projects inThe results indicated that level of education, income Indonesia at 21 national parks. The study's findingsfrom outside the household, and the ability of com- were based on site visits, reviews of project docu-munity members to cooperate with each other were ments, and interviews. The study found that therethe most relevant variables in explaining the project's were weak links between conservation and develop-perceived impact on human behavior. The impacts ment activities, and concluded that large develop-on natural resources and household well-being were ment projects and weak regional planning were oftenexplained primarily by the perceived level of degra- a greater threat to the parks than the activities ofdation prior to the project implementation, the com- nearby inhabitants (World Bank, 1997). White, Halemunity ability to work together, and the degree of et al. (1994) also produced a comprehensive reviewcommunity participation in project planning. The of lessons of experience with collaborative and com-survey is now being expanded to villages in both the munity-based management systems in coral reefs.Philippines and Indonesia.
While much has been learned through the contribu-The ICLARM/URI study benefited from the fact that tion of studies such as those and other socio-eco-all of the villages surveyed were subjected to com- nomic reviews, overall knowledge of the effective-mon project interventions. On the other hand, the ness of different types of coastal managementstudy was conducted in a relatively small number of remains fragmentary.villages, and hence the variables which explainedsuccess could not be compared at the site level.
'Pomeroy, Pollnac et al. (1997) also review the available literatureon factors which may be important in determining coastal man-agement success.
I'REVIOLU, Sr im [M 3

II1. Methods
STUDY OBJECTIVE AND KEY AUDIENCES logical survey of coastal conditions, let alone paneldata, existed for the Pacific. There was also no com-
The objective of this study was to strengthen the mon project intervention across many sites thatunderstanding of factors contrihuting to the success- would allow for an evaluation of coastal manage-ful management of coastal resources in the Pacific ment impact. Conducting an ecological survev wasIsland region, from the perspective of coastal com- ruled out for several reasons: first, it would havemunities. The study was targeted to coastal resource required surveys in more than one season, and thismanagers in the Pacific at the governmental, NGO, was beyond the timing and funding available for theand regional organization levels. Secondary audi- study. Second, a survey of this type would produceences included the communities surveved, policv- only a baseline: it would have been difficult to dis-makers, and coastal management experts worldwide. tinguish any long-term trends.
STRATEGIC CHOICES Given the above challenges, the survey team used abaseline-independent methodology which relied on
The study originated from a request by the Fiji Fish- community perceptions of ecological trends over aeries Director in 1997 to assess the strengths and lim- period of a decade. The advantage of this approach isitations of community-based management in coastal that a time dimension - the perception of changes -areas. Subsequent discussions with regional experts can be added to what is essentially a spatial data set,and NGOs indicated that a comparative study of this thus enriching the analysis.;type would provide a useful contribution to emergingcoastal management initiatives in the Pacific Islands. Aside from a rapid assessmenit of the sites' conditionsIt was felt, however, that focussing the study in Fiji carried out by the study team, little attempt waswould iimit its relevance to the region. On the other made to validate community perceptions. Whetherhand, applying it to a large number of countries might or not they reflect the state of the resources, theyoverlook socio-cultural traits unique to each country. influence local decision making and need to heA focus on five countries - Fiji, Palau. Samoa, understood as stated.Solomon Islands, and Tonga - was therefore chosena- the optimal scope for the study. ANALYTICAL FRAMEWORK
In selecting the number of sites to be surveyed, the For the purposes of the study, coastal managementstudy team considered the trade-offs between in- success at a sitei was thought to depend on the fol-depth coverage of only a few sites or a less cornpre- lowing factors:hensive analvsis of a larger number of sites. The finalchoice of 31 sites was made based on the available Perceived Successi =function of (Ext;, Site;, Processi)funding and the need to have a sufficient sample toconduct a quantitative analysis. where
The term "coastal resources" generally includes both Perceived Successi is measured by community perceplions ofliving and non-living components of the zone of various ecological indicators at a particular sitei aswaters from the shoreline to the outer edge of the reef determined by:(or, where no reef exists, the open ocean). Only livingresources and their habitats were included in the Ext - factors external to the site which mav affect successeg.,study. Successful coastal resource managenment was major cvclones)defined to include all interventions that contribute toimproved overall benefits from resource use. It also Sitei - intrinsic site factors, such as socio-cultural characteris-included interventions that meet conservation goals tics (e.g., leadership), pressure on resources (e.g., pop-in protected areas (such as turtle protection). ulation density, and ecosystem characteristics
In order to understand the factors influ gthe sue- Processi - processes relevant to management at the site level,influencing such as how the community shares the benefits and
cess ot management of coastal resources, a surveyteam would ideally obtain data for different sites and losses from resource use.different years. Such data with both a spatial and atime dimension is referred to as a panel data set The study team is grateful to Richard Pollnac, Ruud Koning and
Hsiao 1986). Unfortunately, no comprehensive eco- Herman Cesar for their suggestions on this section.
a Voices fron: the Village: A Comparative StLidv of Coastal ResoLrr e ManagerTlent iri ahe Paul( iC Is Wands

KEY ISSUES ADDRESSED
Within the above framework, the study sought toassess the following issues: Advisory Committee
* Factors external to the community that are likely Assistance in Key Design Aspects, Results Review
to attect site management;
* Key site-specific characteristics that influence Regional Study Teammanagement success; and Study and Survey Design, Implementation,
Qualitative Analysis, Reporting, Dissemination
* Processes most conducive to site management. / Regional Coordinator r,-d i, Fiji)
Fiji Palau Samoa Solomons TongaThe study also sought to address a number of 'burn- National Expert Na.o-al Expert National Expert National Expert Nt I V,1lxprt
ing issues" relevant to coastal management: I
* Community perceptions about key ecological World Bank Teamtrends; Study Design, Coordination, Quantitative
• The optimal roles of commiunities and govern- Analysis, Final Reporting, International Dissemination
ments in coastal resource management (e.g.,what are some of the limitations of community- Figure 3. Study Team Composition and Responsibilities
based management and where is external assis-tance most needed?);
in each country helped adjust the survey to local* The relevance of national coastal management conditions.
regulations;An 11-member advisory committee assisted the studly
- Perceived constraints of open-access regimes; emi h ia eino h uvymtos h' ~~team In the final design of the survey methocls. The
- Perceived effectiveness of external partnerships; advisory team included coastal management expertsfrom SPC, SPREP, the University of South Pacific, the
• Lessons learned from marine sanctuaries; and Food and Agriculture Organization of the UniteclNations (FAO), NGOs, and an anthropologist
- Perceived impact of income-substitution pro- involved in the ICLARM-URI/CRC initiative (seegrams. Chapter II). The advisory panel and the study team
held a workshop in Fiji in June 1998 to discLIss siteTHE STUDY TEAM selection, identification and refinement of success
factors, and the survey questionnaire. Following aThe study was implemented through the collabora- training session on PRA, the regional team tested thetion of a regional team responsible for carrying out questionnaire at the village of Mua-i-vuso near Suva.the survey, and a World Bank team responsible for Based on this test, the questionnaire was extensivelythe quantitative analysis (Fig. 3). revised, and minor adjustments continued to be
made during the first three site surveys.The regional team included a regional coordinator inFiji who worked with a local consultant in each The World Bank team initiated the study, collaborat-country. The five local consultants were selected on ed with the regional team in the design, carried oLitthe basis of their expertise, knowledge of the country, the quantitative analysis of the study's results, andability to use participatory appraisal methods, compiled the final report.commitment to the study, and ability to workindependently. Two were seconded from government COUNTRY SELECTIONagencies, one was from a local NGO, and two wereprivate consultants. During the initial design, the The five study countries were chosen from the threeteam was also assisted by two specialists in major island groupings in the Pacific (Melanesia,participatory rural appraisal (PRA)." A cultural advisor Polynesia, and Micronesia) to represent a range ot
coastal management conditions which the stuclyPRA techniques are simple visual tools that are used for partici- team wanted to examine (Box 1):
patory planning. They includce, for example, simple resource maps(see Figure 9), or pairwise comparisons of resource importance,where respondents are asked simply to state whether a certainresource x" is more important than resource "y".
METs IOS

Box 1: Country Selection days each. Three or four "supplementary" sites werealso selected for less-detailed analysis. Site visits in
Fiji: A country with strong, but eroding traditions of supplementary sites averaged two days each.traditional marine management, which isexposed to many threats found in other Pacific For the purposes of the study, a site was defined asIsland countries; the coastal area perceived by the community to be
Palau: A country with solid NGO involvement in within its ability to manage. This generally coincidedcoastal management that has made strong with the coastal area adjacent to the community andetfbrts to improve public awareness of coastal excluded fishing grounds in distant waters. The loca-management problems, and where coastal tion of the sites and their characteristics are discussedresources are exposed to poaching from South- in Chate itieast Asian countries; in Chapter IV.
Samoa: A couintrv with a recent interest in community- IMPLEMENTING THE SITE SURVEYbased management of coastal resources and theestablishment of marine sanctuaries;
The site surveys took place between julv and Decem-Solomon A couintrv with complex ecosystems whereIIslomands country with complex fecosystems wheredatin ber 1998. Country surveys were completed in FijiIslands: coaistal resources are SuIffering from degradation
causecl bv overexploitation, over-population (July-August 1 998), Tonga (August-September),and lan7d-based activities; Samoa (September-October), Solomon Islands Octo-
Tonga: A country with no modern marine tenure sys- ber-November and Palau December. Tr ensuretols, contain7ing many low islands and central- consistent interpretation of the questionnaire acrossized coastal management. all sites, the regional coordinator joined the national
consultants in the first half of each country survey.
SITE SELECTION PRA tools, structured questionnaire interviews, studyteam observations, and open-ended questions were
The 31 study sites were selected in consultation with used to collect information for the survey. Prior to vis-the study's advisory team, national consultants, gov- iting each village, the study team collected censusernment agencies, NGOs and other groups at the data, maps, and other information about each site.national level. The sites were not selected at random, Each visit began with the customary formalities; anbut were chosen to cover a range of conditions earlier contact was sometimes needed to work outwhich were believed to influence management suc- the timing of the survey. Where deemed appropriatecess (Fig. 4). by the local consultants, the villagers were compen-
sated for the time spent with the survey team inaccordance with local practices.
The study team used a multi-level questionnaire fordifferent informants (Fig. ). The first meeting washeld with village leaders and was used to collect gen-eral information on the village, key populationgroups and village history. The degree of village con-trol over access to coastal waters, and past external
Range or Conditions Used for Site Selection shocks affecting coastal resources (e.g. cyclones)were also assessed during this meeting. At focus sites,
SuCcessful Site s ....... Non-successful Sites the meeting with community leaders was followed byNon-Conservation Sites Conservation Sites a large village meeting where PRA tools were used toConiiuLlity Fstablished Externally Established create site maps and collect general information onFunctionin) 0usioriairv Absent tor inoperational) CMT resource use. This general meeting helped stimulate
Marine Tenure (CMds the interest of villagers in the study, and to discoverLolse Islsnd .High Islands the names used in the vernacular for coastal habitats
and resources: villagers might understand a reet sys-tem as including many different habitats, such as reef
Figure 4 - Site Selection Criteria passes, the wave impact zone, an outer reef flat, etc.(Figs. 6-8).
The study team selected 2 or 3 "focus" sites in each Information on specific factors, such as education,country for in-depth analysis. Focus sites were those dependence on resources, and integration into mar-believed to result in the most significant lessons of kets was collected from appropriate groups that is,experience. Site visits in focus sites averaged five teachers, women, shopkeepers. Information about
6) Voices from the Village: A Comparative SIudy of (toasta RK oSLac& Vlanagelcnlt in hc Pc ii( Isflalnds

- _ !^ z b -
The Study Survey: A Multi-Level Questionnaire
Level Target Respondent Information Collected
National Fisheries Divisions Level of management support;(5 countries) Environmental Divisions enabling legislation; political will
Journalists Awareness by high level decisionmakers
Site (31 sites) Study Team , Secondary site information (e.g.population)
Village Leaders' Meeting * Village history, tenure systems, shocks
Large Village Meeting - Site map, resources, habitats,resource use patterns (using PRAtools)
Knowledgeable Elder(s) O Management rulesVillage Teacher - Village education
Key Women 0 Dependency on resources, socialRespondent(s) cohesionShopkeeper/Fishers , Integration into MarketsKey Respondents , Leadership, decision making, conflict
resolutions, destructive fishingKey Respondent(s) - PartnershipsKey Respondent(s) - Alternative Income Generation
Partners or Knowledge- - Sanctuariesable InformantStudy Team Ecological Observations: Degree of
Development; Land use; FinalObservations
Mini-Focus Elders, women and men , Perceptions of success; AwarenessGroups(133 inter-views)
Others Interview with Site Partnership process, perceived effec-Partners tiveness
Figure 5. The Study Questionnaire
such sensitive matters as village leadership and con- cess and awareness of coastal management -and
flicts was collected from key respondents. The study objective site characteristics which could be subjectteam also conducted rapid site assessments to deter- to response bias, such as past conflicts with poachers.mine the type of land use, ecological conditions, and In the latter case, the answers were verified by posingthe level of village development (for example, the same question to one or two other respondentswhether there was public electricity available 24 until a consistent answer was obtained. Perceptionshours a day). of management success, which are subjective by
nature, were obtained through interviews with smallThe study distinguished between information which focus groups of resource users (see "Indicators ofwas clearly subjective - such as perceptions of suc- Success").
METHODS 7

An abbreviated version of the questionnaire wasapplied to supplementary sites. At the national level,country specific information was obtained throughinterviews with fisheries and environmental agencies.Information on public awareness was obtainied byasking a newspaper editor how often articles oncoastal resource management appeared in the nation-
[ al press. On sites assisted bv external partner organi-zations (e.g. governments or NGOs), the study teamalso interviewed the partner agency to assess theirviews of the partnership process. Lessons of experi-ence learned during the implementation of the survevare summarized in Annex A.
INDICATORS OF SUCCESS
There is no precise definition of what constitutes suc-cessful management of coastal resources. It coLild bedefined as the ecological impact of management, butit could just as easily be its impact on householdincome. For two reasons, the study considered onlyperceived ecological impact. First, the human impactis more difficult to assess due to the countries' differ-ent socio-economic conditions; and seconcd, theimpact of management on coastal resources is usual-ly considered to be the most relevant issue to coastalmanagers in the Pacific.
Since no baseline data on the studv sites were avail-able, the study team used a method similar to that ofthe ICLARM-URI/CRC survey (Pomeroy and Pollnac1997). To mimic a time climension, comniunityrespondents were asked to state their perceptions ofecological trends over a period of about a decade. Asguideposts, the study team used easily remembered
| ~ w, s //z- a>rrz | events, such as the military coup in Fiji arid a cycloneI e ¢we t , I in Samoa. Respondents were then asked whether thev 0 rbgNss 61 ""' - . | indicator was stable, declining or improving. If| 11^.~ IC { .,.§+, C.,declining, they were asked whether it was declining
"a lot", or declining "a little". This allowed the study{ tc<rs t %@ncitwa<++(A) | team to group the responses into a simple five point
| *sa-b-u3 [ , ordinal scale, as shown in Fig. 9.
Improving a lot .... 5
S improving ; - trrb | Improving a little ... 4t 0~~ < > .x | =7* Improvingl
-, 25 -tfo | | > Stable - o. Stable ..... 3
Declining lDecining a lirtie 2
t < ~~~~~~~~~~~~~~~~~~~~~~~~~~~~~~~~~~~~~~~~~~~~~~~~~~Declining a lot t l ...... 2
Figures 6-8 (from top to bottom): Resource user groups Declining a lot 1draw site maps in Mua-i-vuso, Fiji; a women user groupwith a completed site map in Satitoa, Samoa; a site map
in Kia, Solomon Islands, showing the location of key Figure 9. Perceptions of Trends in Indicators of Impact (forhabitats and resources. CPUE and Habitats)
8; X)i,(e, fr:,m the Villalge: A (Corrp, ar.tiV\' StudV i ( ,Ol,.tll RCSc Mire c Meinijgcilell 1w th ,,, ii h Isil(slnd

The study collected the following "perceptions of and one-third were village elders (Fig. 10). In total,success" or "indicators of success": the study collected the perceptions of 133 focus
groups across all sites.* Trends in Perceived Catch per Unit of Effort of
Key Resources. In the absence of other factors, one 7of the first signs of successful management is anincrease in catch per unit of effort (CPUE). Using 1
the five-point scale shown in Fig. 9, respondentswere asked for their perceptions of CPUE trends ofthree key resources. Respondents were allowed toselect the resources that were most important tothem. CPUE trends were phrased in terms of easi-ly observable measures -for example, how longit took to fill a bucket with fish. - -.
* Trends in Condition of Habitats. Respondentswere asked to state their perceptions of trends forthree key habitats, previously identified with the .help of maps drawn by resource users (see Fig. 8). Figure 10. A focus group interview in Satitoa, Samoa.
Respondents were asked to state their perceptions of trends in* Trends in Threats to the Site. Respondents were catch per unit of effort of key resources, habitats, threats, and
asked to state three key threats affecting their site their assessment of compliance with management rules. Eachand to report the extent to which the threats had focus group interview lasted 60-90 minutes.
diminished or increased over the past decade. Ascale similar to that in Fig. 9 was used, but since FACTORS INFLUENCING SUCCESSthreats negatively affect the success of a site, avalue of "5" in this scale (threats have increased The study also collected information on factors judgeda lot) meant a worse trend than a value of "1" to influence the successful management of coastal(threats have been reduced a lot). resources at the site level. These are referred to as
"success factors" throughout the study (see Chaptera Assessment of Compliance. Compliance with VI). Since it was not possible to know ahead of time
existing management rules was the only indicator which questions would best reflect a particular factor,that did not rely on trends. It was assessed as the two or three questions were asked for each factor.perceived compliance at the present time, using a With few exceptions, all factors were collected at thefour-point scale ("4" indicating full compliance site level. Some factors external to the site had to beand "1'" indicating no compliance). All respon- collected at the national level -such as "enablingdents at each site were asked about their percep- legislation," or the extent to which national legisla-tions of compliance with the same five manage- tion encouraged community-based managementment rules, which had previously been identified (Table 1). In addition, information on some variablesby a knowledgeable villager with no connection judged to be important to management success -forto the respondents. This was done to prevent pos- example, traditional knowledge, attitudes towardssible bias (as respondents might tend to choose coastal management and concern for future genera-rules that were easier to comply with) and to tions -could not be captured accurately within theobtain a fairly good sample of compliance per- short time allotted to each site survey.ceptions across different management rules. Tothe extent possible, the five rules included at least ANALYSIS OF THE RESULTSone indigenous management rule, a nationalrule, and a "conservation" rule (i.e. those rules The study results are outlined in Chapters IV to VII.introduced specifically to protect a particular Chapter IV shows the characteristics and location ofcoastal resource or habitat). the study sites. Chapter V examines the indicators of
success. Chapter VI relates these indicators to explana-Simple PRA techniques were used to help obtain the tory "success factors". Chapter VIl examines keyinformation. Perceptions were gathered from small coastal management issues addressed by the study.focus groups of two to six respondents. Six groups (onaverage) were interviewed at each focus site, and The study relied on a mixture of qualitative andthree groups at each supplementary site. To ensure a quantitative analysis to produce the final results.representative cross-section of resource users, one- Qualitative analysis provided insights into the rea-third of the groups were men, one-third were women sons for perceived trends (Chapter V), as well as most
MLTHOD, 9

Table 1: Potential Factors Affecting Coastal Management Success
External Factors Site-Specific Factors Process Factors
Government support to community initiatives Strength and quality of leadership Presence of external partnersPolitical will ->r Social cohesion Community involvement in coastalEnabling legislation At Strength of marine tenure management planning and implementationAvailability of external funds and support -'r Dependency on coastal resources Conflict resolutionEmphasis on coastal management Awareness of management benefits/ Quality of external partnerships
(from the part of national agencies) .r Attitudes towards management Extent to which management is based on customPrivate sector activities Cultural requirements to harvest (presence of indigenous management rules)Perceived relevance of national management Population density Benefit/cost sharing arrangements
rules Settlement patterns Participation by user groups in managementAwareness of high level decision makers ,' Conflicts decisionsExternal shocks: Conservation value Flexibility of management
Natural disasters Population homogeneity Presence of movers ansd shakers'Market shocks Village education Information flowPolitical events Integration into markets Continuous external inputsDestructive fishing technology shocks Village ageDevelopment projects Existence of clear boundariesPollution shocks Population growvth
Type and intensity of external threatsLevel of community dlevelopmentHigh islands vs. low islandsResource svstem productivityPresence of non-contiguous fishing areasTourism developmentPr 'ate sector developmentLand useProximity to urban centers
Factors in bold were those identified b' the advisory commnittee as the most important to management success prior to the start of the survey.* Information on these fictors w'as collected at the national level. Ali other factors were col//crled at the site level.
of the results on key management issues (Chapter tors on the perceptions of success in accordanceVII). The quantitative analysis relied on the following with the study's analytical framework. Thistechniques: analysis was used to isolate the effect of individ-
ual factors: for example, it analyzed the impact* Descriptive statistics such as frequency distribu- of natural disasters on the perceptions of suc-
tions (Chapters V and VII) were used, for example, cess, while holding all other factors constant.to describe the percentage of sites visited by gov-ernment officials during the past decade, or the i Principal component analysis was used to grouppercentage of responses perceiving habitat the four perceptions of success indicators into andeclines. "aggregate perceived success" index (Chapter V).
It was also used to see how particular "factors of* Non-parametric statistics were used to interpret success" were associated (Chapter VI); it allowed
the perceptions of success (Chapter V). This the team to see, for example, whether villagesanalysis allowed the team, for example, to deter- with high social cohesion tended also to havemine whether certain types of threats (e.g. pollu- strong local leadership.tion) were perceived to be increasing while otherthreats were declining; and what types of man- * Simple correlations were used to see how cer-agement rules were perceived as having the high- tain variables varied together -for example, toest degree of compliance. The statistics compared see whether countries that recognize marinethe differences between the mean perception rat- tenure systems also have a relatively highings given for the different rules to determine prevalence of indigenous management ruleswhether they were statistically significant. A sig- (Chapter VI). This statistic was used only as anificant result indicated that certain rules were last resort, since correlations do not isolate theindeed perceived as being more complied with effect of individual variables. However, it wasthan others. useful in cases where a clear cause-effect rela-
tionship could not be proven.e Econometric analysis (Chapter VI), including
ordinary least squares and ordered probit analy- Annex B provides details on the quantitative methodssis, was used to model the impact of various fac- used by the study.
1(0 oVoices from thc Village: A Comparative Study of Co, stal Resour( e Management in the Pa, lic Islaids

KEY ASSUMPTIONS AND LIMITATIONS it was agreed that the indicator remained useful as areflection of local perceptions and to compare rela-
The analysis had to take into consideration the com- tive trends across different resources and site charac-plex structure of the data, which were structured at teristics.four levels: countries (5 in number), site characteris-tics (31), focus groups (133) and, for each focus A major objective of the study was to shed light ongroup, perceptions of different resources, habitats, how different factors affected the success of coastalthreats and compliance with management rules (377 resource management. Several issues made this esti-to 665 observations, depending on the indicators). mation particularly challenging. First, the existingAll observations were used in the econometric analy- knowledge on which factors are most important forsis. The data were corrected for statistical errors that coastal management success remains scarce. A largemay arise from clustering at different levels (see number of variables had to be considered, with littleChapter VI). Simple frequency distributions for the guidance as to which ones were the most important.perceptions of success also used the full sample Second, although perceptions of success were col-(Chapter V). Where it was important to present the lected from 133 focus groups, most explanatory vari-average results per site - for example, to display the ables varied only across 31 sites. This constrained themost important threats per country - the number of number of 'degrees of freedom' and consequently theobservations in focus sites was made equal to that of number of variables that could be used in the analy-supplementary sites. To compare perceptions of suc- sis." Third, the survey was the first of its kind in thecess between different resources, habitats or threats, Pacific Islands, and there was no way to know whichthe study team faced a methodological difficulty: survey questions would work best in the varied socio-most non-parametric statistical tests assume that the cultural settings of the sites.observations are independent. While the differentfocus groups were independent, the ratings given to In the absence of baseline data and a common inter-three different resources by the same focus group vention across the sites, it is inherently difficult towere not. To minimize this problem, the study team prove a cause-effect relationship between successcreated a semi-independent set of observations factors and perceptions of success. Many of the pol-which eliminated any duplicate observation within a icy and management process factors were by naturefocus group: for example, if the group gave the CPUE "endogenous". It is difficult to determine, for exam-trend for two kinds of reef finfish, only one was ple, whether trends were perceived to be improvingincluded in the sample (the one ranked highest in because of a visit by a government official or becauseimportance). government officials tended to visit sites with poor (or
good) trends. The same difficulty determining causal-In interpreting the study results, it is very important to ity arose with such factors as the presence of externalrecall that the sites were not chosen at random. They partners, conflicts, dependency on resources, andwere selected according to specific criteria (see Fig. most policy variables (see Chapter VI).4). The results are therefore those derived from the 31study sites and should not be considered fully repre- While perceptions were stated over a ten-year period,sentative of Pacific Island conditions. most explanatory variables reflected conditions at the
time of the survey. For the purposes of analysis, it hadThe CPUE indicator needs to be interpreted with to be assumed that site conditions had not changedcare: first, community perceptions can differ from significantly during the period. This is not an unrea-reality. The study results should therefore be viewed sonable assumption about many of the socio-culturalas the perceptions of the study communities, rather and ecological characteristics of the site (e.g., num-than the actual status of coastal resources in the Pacif- ber of ecosystems), but it may be more problematicic. Second, a negative or positive trend does not for other variables included in the analysis (such asalways reflect a failure or success of management. dependency on resources). In addition, there is theCPUE could be increasing simply because of possibility that there were inherent site characteristicsimproved technology. For this reason, the study team not captured by the study which could account foranalyzed not only the perceived trends, but also the variations in stated perceptions. While the studyreasons given for the trends (Chapter V). The poten- attempts to deal with these constraints as far as possi-tial limitations of the CPUE indicator were discussed ble, they should be kept in mind when interpretingwith the study advisors early in the study design, and the results.
If a sample is limited, the data do not have sufficient variance todistinguish between the effect of many different variables.
METHOD' 11

IV. The Study Sites
The 31 sites ranged in size from 0.6 square kilometers Eight sites, including all sites in Tonga and Cooksin andin Papa (Samoa) to 2,360 square kilometers in Luani- Honiara Fishing Village in the Solomon Islands, lackedua (Ontong Java, Solomon Islands). The sample any form of customary marine user rights and wereincluded two urban sites (Koror in Palau and Honiara operated under open access regimes. All of the remain-Fishing Village in the Solomon Islands), tive peri- ing sites had some form of customary marine tenure.7urban sites and twenty-four rural sites. Several of therural sites were very isolated and lacked regular trans- Classifying the sites according to their conservationportation. status was a difficult task. The only recent list of
marine conservation areas is that of the 1 999-2002Village populations ranged from 67 in Niu (Solomon Action Strategy for Nature Conservation in the Pacif-Islands) to about 17,000 in Koror (Palau). The average ic Island Region (SPREP, 1998). This list is flawed,population density was 218 per square kilometer (of however, as it includes several sites where the con-the site), but this varied considerably between the servation value is doubtful, while other sites recog-small Samoan sites, which averaged 1,026 persons nized nationally as conservation areas are not includ-per square kilometer, and the larger sites in the ed (e.g., Aleipata in Samoa). Community-basedSolomon Islands, with an average population density conservation areas are defined as "any area . . .of only 11. Population growth was relatively low in wherein resources are either protected to somethe study sites, an average of 2.1 percent a y,ear. Half degree or managed for sustainable use, or both, withof the six sites in Tonga and two sites in Fiji had neg- the active involvement and support of communityative population growth (Figure 11 and Table 2). resource users and owners." This classification is so
broad that it encompasses nearly all study sites. For
Solomon Islands Sic LocationsPalau
;- ,; * FoceIs
16 2.1 .o,*y AK7'.,$F A * SuppleimienitalA ( _~~~~~~~~
J SC If: .1 K C [-1trE Samoa
*~ ~ ~ ~ ~~~~~~a I ] -j1 '
N~~-N. --- ---
R2fm \ .- A-s
e ># , -F*gure I 1.Lo1ca1tino teStud?rte s of hav1 e ight (u ; a
N Cs St ' n IC:1 ,1e0. 500 100? 1ca0
Figure 11. Location of the Study Sites
- In thco custmomr\ marine teonure systems prevalent in the Pacific,traditional asers often have the right bhut not alwvays the ability) toexclucle nontraditional users from the site's coastal territory.
12 V,) (es frumii the Vi lage: A CVmparn iteV StuLs l ( (iit,l1 RC0o,r5e, Mmlfl.g(,eKilI n the Pa, rifi Islands

Table 2. Key Characteristics of the Survey Sites
AlternativePopulation Ease of 0 Income Income
Site Density Urban/ High/ No. Marketing from Strength Sancti- GenerationConservation Esternal Size (People/ Peri- Low Ecosys- Village Perishable Fisheries/ Of Marine aries (AIGs)
Country Site Nanme General Location Type Site? Partners? Ikm') Site Area) Urban? Island tems Develop. Products... Tourism Tenure--' Present? Introduced?
Fl, DrorcirraJ SE Vii Levu. near Ressa river delta Suppl No No 1 30.0 L.i yes Highi 3 Medi-um F,ss 84 Mediumn No, YesCanuisaanuj Verata SE Viti cvii, SY OsValai) Focus Yes* Yes 13000 0.2 No High 10 Mediumo Eass 601 Strong Yes NioScIsuI Northern I iA group, ott Vanuabala\r' Focus Yes- No t,.5 13.' No I ligh 7 Loss NediLunm 60 Strongest Yes NoCaloa (Glod 11, off NW Vartua Lece Suppl. No No 1,655 ( 0.2 No Loss 8 Lose Easy 80 MediLirri No NoVunivuta N Central Vaciua Levn Suppl. Nio No 1t 0 3.i No High 7 Medium Fdse 50 \Veak Nii NoNakac\aga Mali Isl , Off N Central Vaniia I ev.r Suppl. No Yes 220.0 (i.6 Yes Lose 3 rIse Las\ 80 Strong Nio No
Tonga Koulo I iuka Island, Hiapa iiConis. Area Suppl. Yes* No 12.0 18.8 Yes I ow 8 High Eass 33 Open Ai,lss Nor Yeslofanga lIofarrga Ilarid, Ha'apai Cons. Area Fncus Yes? No 20.11 60 No Lois 7 Low Medfim 40 Open Access No YesF,ilev,ui SW Kapa Island, Vasau Group Fo(L is Yes"' Yes 5.1) 28.2 'Yes High 6 itediLJm Eas 35 Open Access )es Yesluarnenr\ale Eastern Vavau Suppl. No No, 2.0 181.0 No High 6, Itigh Easy 10 Open Access No NioNukuhetulu N Central Tongatapu lsl. Suppl. Yes* Yes 3.0 121.7 Yes I ligh 3 High Easy 10 Open Ac,re(ss No NoHa'atafu I laatatah NMiriiie Reserve. NW longatapu Suppl Yes Yes 4.0 61.3 No High 6 High Easv 411 Operi Access Nii No
Samoa Lusi Safata, S Central Coast of Upolu Focus Yes' Yes 4.5 177.8 No High 8 High Faws 20 Weak Yes )esSatitoa Aleipata. Eastern End of LUpolu For us Yes'' Yes I.-, 4()(.0 No High I. I ligh Easy 25 Strong Yis YesMaciase N Central Savaii Focus No No 1.3 132.3 No High 7 High Easy 50 Strongest No YesPapa Western endi of Savai Suppl. No No 0.f 1,246.7 No High 1 Loss NtediLum 5 Strorngest No NoSlosiolo N Central LJpolu, east of Apia SLppl Yes' e es 1.2 2, 00 0 No High .3 High raFs, 5 Strongest Yes YcsLedidalii N Cenitral B polu, west of Apia Suppl No No I LI 1,700.0 No High 4 1 ligh Eas3 () Strongest No No
Soloirolins Fishing Village Honiara Focus No No 22.1 36.4 Yes High 10 High Ease .S Open Acr ess No YesLuaniua Ontiing lava Atoll FeuCLIs Yes" No 2,360.0 0.7 No I ow 7 Low Difficult 70 Strorng Nco YeslKia Arnrdeon Marine Cons. Atea, N\vM Isabel FocUs Yes' Yes 1.2'()4.0 1.3 No High 5) Lose Medi l1rl 81 Stronlg Yes Yes(ioorksin Arnavon Nlarine Cons., Wagina Island Suippl. Yres' Yes 112.0 5.4 No High 7 Lows Ntediui 70 Open Access Yis YesNaro Western end of CGadaciranal Suppl. Yes" No 10.0 32.2 No High 9 Mediurns EaSy 30 Strongest Yes NoNiu Nil Isl., Marass Soruid, E CGuadalcanial Suppl. No, Nio 25.0 2 7 No I ors 7 Los Medium 30 Strong No YesOnne Nlarovo Lagooc. Western Provience Suppl. ers' Yes 48.0 1 7 Nio H.gh 9 Loss etedisim 43 Strong Yes Yes
PalanL Ngisral Central L Baheldaoh Island fLi(nus Yes' Yes 4 5 25.3 No High i8 Medisim Euss 17 Strongest Yes 'iSKa'yangel Kayangel Atoll, off N Rabieldrlro Focus Yes' Yes 1050 1.7 No Lois 8 MediuM Ntediumil 33 Strongest Yes YesPeleliu Peleli Isl., SF Koror Suppl Ni Nio 71.0 8.1 No I ligh 7 Nledrum Ease 43 Sirongest No No,Koror Near Ngerukeir id/Ngerumekaol:
Ngemelis area, Koror Srippl. Yes' Yes 663 0 25.5 'Yes High 8 lligh Edse 35 Strongest Yes YesMelekeork Central E Babeldaob, S Ngirwal suppk Yes*
5No 11.0 23.7 No High 3 redrurn Ease 19 Stringest No Yes
NgaremlengLi NgeremerULu irentral W Babeldaoh Suppl. Yes? Yes 26.0 10 8 No I ligh 7 High Eass 27 Stronigest Yes Yes
Sites in:Fiji 6 Focus Sites 12 Conservatirn Sites 20 Aig. Site Size 262 m' Lrharn.Pern-Lrba t. . V/llage Edse ol Strength ot Tenure Sites iv Sanictraiiees 14loniga 6 Development Marketing:Sanmoa 6 Supplevrerrttrr 1t9 Non-Consercat Sites 11 Ruial 24 High 12 Easyv -r Strorygest 12 Sites ti'o Sarcretries: 17.
Solomons . Alediurra Y A leditini 8 Strong 7Pilaiul 6 Site's us Partners 15 Avg. Pop DensitVs:18 1 ligh Island/s: 7 Loiw 10 Dr/ifcuut I Medium 2
Sites is/ro Partnrers 16 Line Islatrds 24 iveak 2 Sites is ith AICs 19Open Aceess 8 Sites ir o Alts 12
Total 31 Average No. (ri FCosYstems: 7 Ar erage 9st In(srme truorri Fisheriesl7ourisnr 41 "
* Site Listed ri Regional Action Plan for Nature Conservation tor the Pacific Islands SPREP, 19953.r- Ste Not isted in regional list but eilher ia) recognied hi the co`Untry as a consersation area, or b6 where cruneminitv is sindertac ng ronservaton activities.
Es- Fe of niarketirig: Easy -Traders conie to the site andrir vilage ellers can a(cess corsets for perishable products; Nedim - Flan be done but involves niuch plannrngscosts, Difficult Very dlrrieulviurpossrhleIntegratiorn hu markets refeis only to perishable products since trade in orin-perishable predcrits is not normally constrained he distances.
- Strongest: vIllage leaders hase the pourer if thes so seishi to exclude alrioi-v lagers, Strong- (l(age leaders hLae the pouer to esclude All rorir--ousronar, Lusers: Mediumr-l,aders ouiside Ire illaige have the powerr to esclude i-ts,ser Wnk-not Is...e to ec,denuiridere,L Open Access - Traditional icsr rights nrin-estent or erouieci This factor s-, der seci trom nrterve,\ss seith communitv ledders.

the purposes of this study, sites which were listed in cent). Six sites depended heavily on coastal areas forthe regional Action Strategy, recognized nationally as food, while eight had access to alternative sources ofconservation areas, or which were found to have fresh meat or fish (Fig. 12).community-based interventions contributing tocoastal resource conservation (e.g., sanctuary areas) Seven of the sites were low-lying islands, while 24were classified as conservation sites. Using this des- were high islands. The sites were well distributed withignation, the study sample included 20 conservation respect to the level of village development: about 30and 11 non-conservation sites. percent lacked amenities such as public transportation
and electricity, while 40 percent had a relatively highAbout half (15) of the study villages had i"external level of development. About half of the sites attractedpartners" or external organizations assisting the com- tourism or private sector investments.munity in managing coastal resources. With oneexception (Nakawaga, Fiji), all partner-assisted sites Residents of most of the villages in Palau usedwere also conservation areas. advanced fishing techniques, while most of the sites
in Samoa, Solomon Islands, and two sites in TongaThe percentage of village income derived from fish- did not. The proportion of fishing harvest said to beeries or marine tourism ranged from nearly zero in taken by outsiders was particularly high at Fijian sitesLealaalii (Samoa), to 84 percent in Dromuna (Fiji), (an average of 48 percent). As many as 77 percent ofwith an average of 41 percent. the sites -all those without open access regimes -
had adopted indigenous rules for managing coastalDependence on coastal resources was highest in Fiji resources, and about half had established marineand Solomon Island sites, and was generally inverse- sanctuaries. Further details on individual site are pro-ly proportional to remittances, which were particu- vided in a separate Appendix to this report (see Worldlarly high in Tongan and Samoan sites (about 30 per- Bank, 2000b).
Degree of Dependency on Coastal Resources at the Study Sites
Subsistence Dependency Income Dependency(as " of total income)
20 to 40`, %essthanLow 10 1 sites. 20°
Medium 8 sites) sites)(1 7 sites)
N=31 sites
Figure 12. Community Dependence on Coastal Resources at the Study Sites.
14 Voices from the Village: A Conmparative Studcy of Coastal Rcsource Management in the Pacific Islands
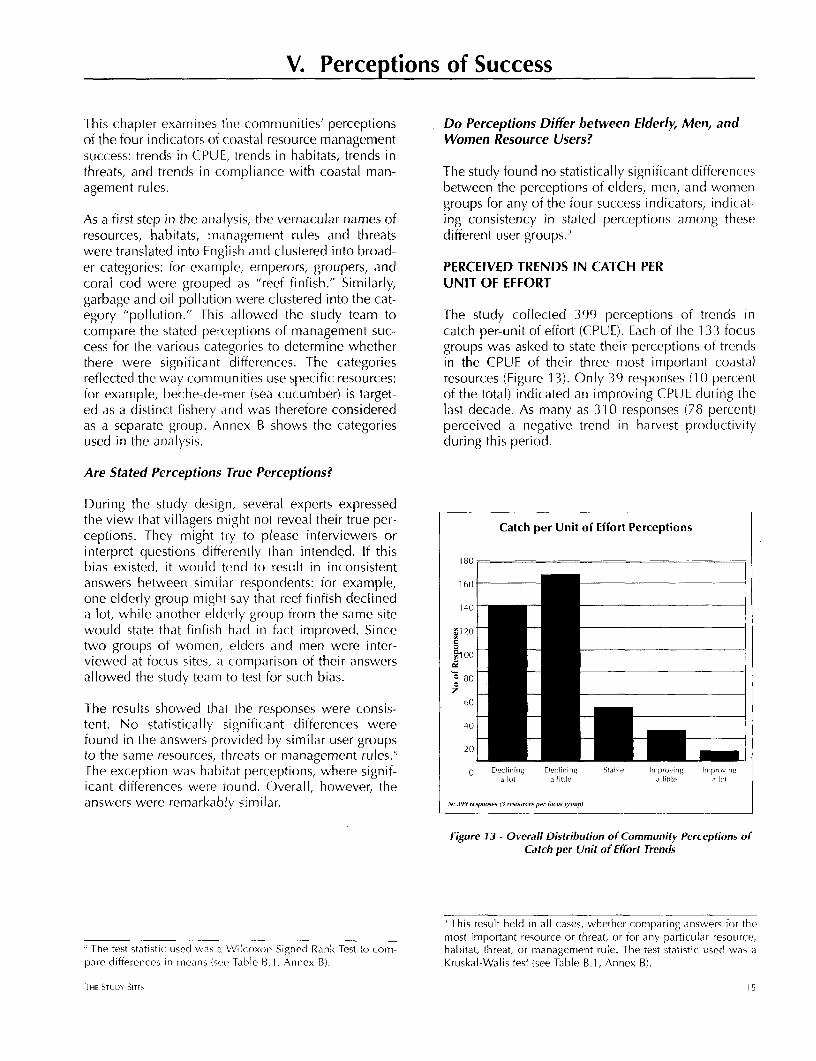
V. Perceptions of Success
This chapter examines the communities' perceptions Do Perceptions Differ between Elderly, Men, andof the four indicators of coastal resource management Women Resource Users?success: trends in CPUE, trends in habitats, trends inthreats, and trends in compliance with coastal man- The studv found no statisticallv significant differencesagement rules. between the perceptions of elders, men, and women
groups for any of the four success indicators, indicat-As a first step in the analysis, the vernacular names of ing consistency in stated perceptions among theseresources, habitats, management rules and threats different user groups.'were translated into English and clustered into broad-er categories: for example, emperors, groupers, and PERCEIVED TRENDS IN CATCH PERcoral cod were grouped as "reef finfish." Similarly, UNIT OF EFFORTgarbage and oil pollution were clustered into the cat-egory "pollution." This allowed the study team to The study collected 399 perceptions of trends incompare the stated perceptions of management suc- catch-per-unit of effort (CPUE). Each of the 133 focuscess for the various categories to determine whether groups was asked to state their perceptions of trendsthere were significant differences. The categories in the CPUE of their three most important coastalreflected the way communities use specific resources: resources (Figure 13). Only 39 responses (1(0 percentfor example, beche-de-mer (sea cucumber) is target- of the total) indicated an improving CPUE during theed as a distinct fishery and was therefore considered last decade. As many as 310 responses (78 percent)as a separate group. Annex B shows the categories perceived a negative trend in harvest productivityused in the analysis. during this period.
Are Stated Perceptions True Perceptions?
During the study design, several experts expressedthe view that villagers might not reveal their true per- Catch per Unit of Effort Perceptionsceptions. They might try to please interviewers orinterpret questions differently than intended. If thisbias existed, it would tend to result in inconsistent 180
answers between similar respondents: for example, 160
one elderly group might say that reef finfish declined _a lot, while another elderiv group from the same site 14(
would state that finfish had in fact improved. Since ;120 _
two groups of women, elclers and men were inter- iviewed at focus sites, a comparison of their answers 00 C
allowed the study team to test for such bias. ' 80_
The results showed that the responses were consis- 60 _
tent. No statistically significant differences were 4(0
found in the answers provided by similar user groups _ *to the same resources, threats or management rules., 20 _ **
The exception was habitat perceptions, where signif- 0 Declini,n De:l,inpn Sta(le Imprl,,,-g Impr-,,g
icant differences were found. Overall, however, the lot hat c a htth 1
answers were remarkably sinmilar. N: 399 re-pOne- 3 --ourcesper,fo-, ..roup)
Figure 13 - Overall Distribution of Community Perceptions ofCatch per Unit of Effort Frends
This result held in all cases, whether comparing answers for themost important resource or threat, or for any particular resource,
The test statistic usecd was a 'v'icoxon Signecl Rank Test to com- habitat, threat, or management rule. The test statistic used was apare differences in means (Sr' Tahle Bl 1, Annex B). Kruskal-Walis test (see Table B.1, Annex BI.
THE STLIDa SITJ I I 5

1i lirre 1'vere onl\ 11 Table 3. Reasons Stated for Perceptions of Improving CPUEresponses in six sites
percent of the total) Site Resource Trend Reason Stated for the Improving Trend
\vttere per eptions Of Ucunivanua, Fiji Finfish 5 Ban or[ external ((mimeri al fishimigFinfish 5 Stripped i SULII igCX elrlal ens liunp,in improving CPUE VunivutU, Fiji Shellfish 4 Efort has hian riciecpil;fllpnS l[ie ar( (atihing iln-h (instead)
o,ere thought to be Koulo, Tonga Berhe-de-Mter The noreIT hirvestdri, Ihe morc they ro
cola torI to0) on )aSM I Lofanga. Tonga Emperor , Expanding into ne(s tishwn arC asrel,ited to coastal ~~Giant ClamT 4 N/Aesoli rGt e malnage- Seaweed N \Amiee. t hiese includecl Falevai, longa WNrasse 4 FxpanuldigrfishinglAcanthuridae 4 1 x1rdr tishingp rea
2OveBt lon Ot Yueanekivlac, Tonga Lobster 4 GOl a iew Sri dini l isfarsr (13 n5 erous r Ugc5h lWaters
sclot rc tive fish iinc) Turho 4 Protelerl spe( ies adl reoi pe ar arrir,m of it, so thes do not elxploitt Fiaatafu, Tonga Bec he-cie-Mer 4 The more it harvestel, the mine it groim
sites), creation ot Urrhin 4 Gleanin' is done in dlitricoet ircl, allowing other areas t oreplenishsanctuaries r 2 sites), Turbo 4 Gleanin- is dlone ill clirerre i arem, iS ollong other areats to replenishC ontrols in hadrvestino Octopus 4 Greater knorreipge miadLimilirrits 5ith 0 toli)rsalh itatCOntrol in havestin Giant Clamn 4 Fe-,s peoiple ndive these' dlvsparticular species Fusi, Sanmoa Tu'tle 4 Lrnknowrn. (sclone anrn nr,rs lgiverninl itna2 sitesi, and a ban on Trevallv 4 Banning dlynarirting
Mullet 5 Recovier iroif earn I (l'riGsi oneGlOrna I flislhermen Crab 4 Banon (in.clentiscliv tirip thiroirsI site), with one site Big urchin 5 N/A
Smiall urchiin 5 N/Ai_isi c iting two Satitoa, Sanioa Giant Clarn m Fish li irisM\tic rent manage- Manase, Samoa Soldier Fish 4 Enfor(ementiott hair oii dlc4rciCivc iihihigr m ilanilerna.tive inc(orire
1leu lit rL les. ThlSe ources lor 2 ris herm(1(1 \hii Itrgr ldiiet I c islimont ru Li les. he IMullet 4 fftective Irir of] PNC Kiai liih proisorniaijoritv or the rea- Surgecin Fish 4 Eflectivc hair oil P'\G tai,
sil (n -iven tor CPUF Tuirho 4 Ettec(ti\e han on P'\N k,rs aTu rbo 5 N/A
improwvements v.ere Papa, Samoa Turbo I ess pcolel harvncstiriLi I roeI a to to nian- ODster 4 Peoiple eSpi.' alI wo riven lishi, e i\mavv,iv fro,il thei ear haLornrl tlhe ini Crab 4 The srhift otf illa e( inlainni r(1SUcri ill ess X[plOitaGtiorn
-irils ll eX~Kw, Solon olulsl Finfish 4 Virv hi areia lor r hnripn a.d tic svillagi hras' rreaS tlhit ire urrrxlroitecdClUild talIlin g pri(es, (ooks in Solomon isl. Finrish 4 lecic nolops tha np-s impri roved tnliii hilogvippr nul ation move- Ngisal, Palau Btcherde-Joer 5 The arci liBin beenr ricisei-ir
ntr is alternative Giant Clam It t Km angel, P'alau Giant Clam 4 Gin/n u holrr rimue ci s1 traiii sting ( tirirs iS ( ironlitlc(lnwnts~~ alternative ~~Giant Clami 4 N/Act()cr(-eS ot i ncortTtO, Ngaremlengui, Palaci Beche-de-Mer 4 Fee people Imian c
and reot nverv trom(.PU 'F Trend: 4-1mproinrep a little; 5-lmpriiinrr a lorN' 4 Fr -srs. B iir- Rein n0t oiter
f \ C lonos Table 3).
Ihe reasons for perceived declines in CPUF were cause for CPUE decline. At three sites where cause-aIlso examined. Excess fishing (usually caused by an ways were builIt Koulo, Tuanekivale, and Ngiwal),in reiase in commercial extraction) was the most fre- respondents perceived them as responsible for nega-olue nt an\swer provided. Other reasons included tive trcn(ds in CPUE. Perceived causes for CPUEdestructive fishing practices, improvements in fish- decline also differed bV Country: external fishersing technology, cyclones, increased population, the were frecluently cited in Fiji, destructive fishing inuise( ot nets and night diving, siltation, pollution, Samoa, populationi increase in the Solomon Islands,(oral destruction, and habitat degradation. The use and speed boat disturbances in Palau.(t nets and night diving were frequently cited as a
c; ( c i )el,rgced lthat some sites might have new fisheries, andh.ii hrris (oUil a((ruirnt for a perceived initial decline in CPUF.1' 1¢f e cr 'he ,rst mi joritv of the focus groups failed to note anv
fll.i, r ( ilnps r iri the retative imtportance of resources over the;m<it -S(i'iri.ire
Vo(ice, rorom thle vil &Ig(: AIm lpil,l.tlive"ld. o1,fl ,, R , cW,u1(c Nixia-( M rlie.<>nt inl tie P,i( if Islalnds

Do Perceptions of CPUE Trends Vary by ResourceGroup?
4-
The study found no statistically significant differences .in the CPUE trend perceptions for the variousresource groups (Fig. 14). However, pairwise com-parisons indicated that the perceived CPUE of beche- Dde-mer (BDM) may be declining more than that of C -shellfish, clams, reef finfish, and octopus.,,
PERCEIVED TRENDS IN COASTAL HABITATS
The study collected a total of 396 perceptions of . . . . . . .
trends in key coastal habitats. Although the most 0 ' _common perception was that habitats were declining , -, C -
(206 responses or 52 percent of the total), 88 E
responses (22 percent) perceived an improvement in 0
habitat trends (Fig. 15).Figure 14. Distribution of CPUE Perceptions
The reasons given for the perceived trends varied by among Resource Groups
habitat type (Table 4). For coral reefs, reef flats, sea-grass, and mangroves (the most important habitatsidentified by the communities), the reasons given forperceived declines included cyclones, increases insiltation, pollution, destructive fishing, and natural Habitat Perceptionsprocesses. With the exception of bans on mangrovecutting, the reasons offered for mangrove and sea- |grass improvement were unrelated to coastalresource managenment. Some of these, such asincreased sedimentation and causeway construction, lwere actually cited as reasons for cleclines in othertypes of habitats and CPUE trends. | an !The majority of the reasons given for improvements | zof reef habitats, by contrast, were related to manage- 4(0 11ment practices - these included compliance with flexisting rules, fishing closures, and prohibilion of '
destructive practices such as derris root use (a fishpoison). n,h ro. ltahle Improving Improving
1 it 1010 tle alot
|N: 3116 ... p--s r gh.hill, prr fi-,us,r.-p)l
Figure 15. Overall Distribution of CommunityPerceptions of Habitat Trends
The study used a Kruskal-Walhis test to determine whether therewere statistically significant differences in the average CPUE trendstated for the different groups (see Table B.], Annex B). Pairwisecomparisons used a Mann-Whitney rank test to compare the aver-age CPUE rating for two resources groups at a time. The Mann-Whitney rank test for beche-de-mer (as compared to otherresources) was only significant at the 10 percent level.
Tiir STt DE SiIEl 17

Table 4. Reasons Stated for Improved and Declining Trends in Coastal Habitats
Perceived PerceivedImproved Declining
Trends Trends(No. of (No. of
Habitat Responses) Main Reason for Improved Trends Responses) Main Reasons for Declining Trends
Reef 1 2 Bans on certain types of fishing 26 CyclonesLess Derris root use Destructive fishingGood rule enforcernent Infestation bvy crown-ot-thorns starfishReet closures Wea ther changes
(oral extrac(tionNa turalI processesCoral smashing (luring fishing operations
Reef Flat 3 Natural recoverv 11 CVclones(Good compliance tvith rules Destruictive fishing, especial/cy derris use
Manorove 2h6 Cutting ban 27 Developments projects in or nearNatural processes and/or re-vegetation mangrove areasWeaker current due to causeway PollutionIncreased sedimentation Cutting of mangroves for firewood and
building materialsPopulation increaseIncreased siltation
Seagrass 20 Shallower water therefore more habitat 4(0 CyclonesLess disturbance Increased siltationIncreased siltation Natural causesNatural processes Speedboats(:iauseovav construction PollutionNot sure. Filled in hv sand
Not sure
Mosi cornnion reasons in bold.
Do Perceptions of Habitat Trends Varyby Habitat? 4T
The studv results indicated that there were si-nificantvariations in the perceived trends of the various habi- Ttats (Fig. 1 6).- Pairwise comparisons showed that -
seagrasses were perceived to be declining less thaninter-tidal areas and lagoons. Similarly, mangrovehabitats were perceived as having declined less thaninter-tidal areas, lagoons, and reefs.
I I I_
~~~~~~~C C
Figure 16. Distribution of Perceived Trends byHabitat Group
Kruskal-Wallis tied p-value < ).0001.
I 1< Voices from the Village: A Cempa rative St. d1 oi (wasL Rt soUI)I1 (M n,1liilgErne nt in t he P> it( IWsc

PERCEIVED COMPLIANCE Table 5. Reasons Stated for Perceived Compliancewith Coastal Management Rules
The study collected 648 perceptions of compliance Lack of Compliance Full Compliancewith management rules. Each focus group was asked Countrv
how it perceived the compliance with five coastal Fiji Needforincome Respectforchiefmanagement rules previously identified for the site. Outsiders dlo not follow rules Respect for customs
Lack ot enforcement Strict punishimentTurtle eating part of culture Has seen the dcmaage of
The majority of the responses indicated full compli- Rules unknown destructive practicesance with management rules (334 responses or 51 Tonga Aware of rule and its henefitspercent of the total). About 15 percent of the respons- Easr to detect violationses (94) believed that there was no compliance and Samoa Poorenforcement Goodenforcement
that the rules were simply ignored (Fig. 1 7). earof heingatinedEasy to cdetect violations
Table 5 shows the reasons most often given for poor Solomon Need for income Pro(luct cannot he soldIslands Pour enforcement hbuyers don't purchasetand good compliance. Poor compliance was per- Turtles are traditional food Good enforcementceived to he associated with poor enforcement, Need for food Afraid of police and courts
of the rules, a need for income, and tur- E~~~awy unknown Respect for chief's decisionunawareness of the rules, a need for income, and tur- Over-populationtle-eating habits (in Fiji, Solomon islands, and Palau). Palau Poor enforcement Cannot be soldPerceptions of full compliance were most often asso- Cannot resist turtle food (huyers will not purchiase)
Unaware of law Good enforcementciated with the existence of deterrents for violations, Strong penaltiesrather than voluntary restraint. Afraid of fines
Easy to monitor compliance
Do Compliance Assessments Vary by Type of Rule?Compliance with Management Rule Perceptions
Compliance assessments seemed to vary significantly 3s0by type of rule (Fig. 18).'' Pairwise statistical testsshowed that protected areas, closed seasons, and 300destructive fishing practice rules (e.g., bans on derrisroot) were perceived as resulting in significantly bet-ter compliance than rules such as size limits, bans on 0oothe harvest of certain species, and restrictions on out- 50
siders.1' The study found, however, no statistical dif- z 0ference in the perceived compliance between con- 100 -servation rules and other types of rules.' o URules enforced by buyers or exporters were another t
No We,ak Gocc FuLtype of rule that was perceived to have high com- Compla--v CW;pbneak o-p once 0Lmp nc,
pliance. Compliance with turtle rules, by contrast,was generally perceived to be poor (see Chapter VI N 64N __________IP________'____
"Relevance of National and Local Management Figure 17. Compliance with Coastal ResourceRegulations"). Management Rules
Perceptions of Compliance by Type of Rule(Percentage of total stated perceptions)
FLU, ompI 30ce
(ev-c , ompl a Ore i
weak coprne ill_e
No ,omplian-e
nWi, iii'', 2i1'; 35%,O 45'], '319, vOW,, 7?0'.,
Jl Ired reve,, to), prolet tedrarLs, f loved sesun-. J,41h, prcc tc reill Os' = X4 iKruskal-Wallis tied p-value result < 0.0001. * Restrict,e.... ... o...s,ders, s517( ii,it, .pecies hba,, iN = 10,'Mann-Whitney rank test significant at 5%'/ level.Conservation rules were defined as those whose purpose is to Figure 18. Perceived Compliance with Coastal Management
conserve a particular species or habitat. Rules by Type of Rule
THE STUDY S TF 1 t)

Do Compliance Assessments Vary by theOrigin of the Rule? Perceptions of Compliance by Origin of Rules
A question which has policy implications is whetherperceived compliance varies according to the origin I H
of the management rule -for example. are rulesestablished by the community itself rlocal rules)complied with more often than national rcgulations(national rules)? Statistical analysis showed thatlnational rules that have been adopted as local ruleswere perceived as achieving greater compliancethan either purely local or purely national rules (Fig. ____
19). These are national rules such as bans (:n thc use In e` .0 4 ,rof derris root which were seen as relevanit at thelocal level, and subsequently adopted and enforced (,,Q;½.,hi-
by local leaders.
Figure 19. Perceived Compliance with Coastal ManagementRules by Origin of the Rule
PERCEIVED THREAT TRENDS
The focus group sessions produced a total of 377 Threat Trend Perceptionsperceptions of trends in threats to coastal resources. 1,
Fig. 20 shows the distribution of threat perceptions.A total of 189 responses (50 percent of the totah per-ceived threats as having increased over the pastdecade, while 140 responses (37 percent) perceiveda decrease. 6 _
z°4)
Do Trend Perceptions Vary by Threat? 2 (
Variations in the perception of trendIs by ty'pe of -r C- - F!I
threat are displayed in Fig. 21. Pairwise comparisonsshowed that pollution was perceived to be increas- V, 96re,po ... h,biat, p,, fo.,,, , ri-p'
ing faster than other threats to coastal resources, Figure 20. Overall Distribution of Community Perceptions ofwhile destructive fishing practices were perceived to Trends in Threats to Coastal Resourceshave declined the most.
Fig. 22 shows the distribution of threats reported tohave either decreased or increased substantially.Destructive fishing accounted for 56 percent of thethreats perceived to have declined a lot. Pollution -7.
and overfishing (primarily commercial fishingc 0 onlthe other hand, accounted for 23 percenit and 38 per-cent of the responses on threats perceived to be -
increasing a lot.I~~~~~~~~~~~~
The Mann-Whitnev rank test was signifi(cant al the .' l,rvel.'Destructive fishing' (e.g., poison or explosives lishing was sepa-rated fromn 'Overfishing' in the survey since it relates to practices Figure 21. Distribution Perceived Trendsthat are generally outlawed. Destructive fishing d(id not include by Type of Threatcyanide poison use, which was not reported itn the slu(dv sites.
2() vo)i(;sls 17+)lmml tie Vil aiX c: A (ompai.ative StLdy ot CwslaC keotsiur Vtanigement in ilc> Pa c Islanlds

Threats Perceived to Have Been Reduced a Lot Threats Perceived to Have Been Increasing a Lot
he, 1,lll r l;l< S- drimrnr ah.llw/
D)(llr 1) t.11 .. l)lt r(s4r'jn l-tt
F h%~~~~~~~~~~~ Lll N1~~~~~Iifel n
Fur2 Dist of Ta T of n~~~~~ n 0=1510
( los,.
Figure 22. Distribution of Threat Types of Perceived Trend
Which Threats Can be Handled by the Communityand Which Require Outside Help?
Threats Which the Community Feels
In general, respondents felt that destructive fishing It Can Handleand certain types of overfishing were threats that Seaim;2 tat.i
could be handled at the communitv level. Outside _help was believed necessary, however, in clealing vcrshii,hg
with pollution, overfishing by outsiders, and otherthreats such as dredging, construction of causeways,and drilling for oil (Fig. 23).
O thr ru\
Sites in Samoa and Tonga differed greatly in theirviews of the degree to which the communities could Mining P.llutl'n
handle threats to coastal resources. Respondents in s,,,,-,,,,, ,0
Tonga, where there is an open access system and lit-tle local management, felt that local communities Threats Which Require a Mixcould handle only 22 percent of the most important of Community and Outside Helpthreats and that outside support was neecled for asmany as 72 percent of the threats. By contrast, ScdIm,id t o
Samoan respondents felt that the communities couldhandle 61 percent of the threats, and that the remain-ing could be addressed through a combination ofcommunity and outside help (Samoan sites weresmaller, though). In Fiji, Solomon Islands and Palau, 0-&,hing lulk,n
communities felt that the majority of the most impor-tant threats required a mixture of community and 1h-
outside help.v ,,
The study team made an assessment of whether the Threats Which Require Primarilymajority of the perceived threats identified by the Outside Helpcommunities at each site could potentially be han- Sc, mcno=
dled at the local level. For example, the use of derrisroot was deemed to be addressable locally, while OverfishingA h ntru Ig,
upstream siltation (largely beyond the control of the Icommunities) was not. The next step was to deter-mine whether most of the threats that could beaddressed locally were in fact being handled by the PilIu:ir
23
Figure 23. Threats and Degree of Outside Help RequiredThis includecl 72 percent of the threats in Fiji anid Palau, and 62
percent in the Solomon Islands.
TiFE STL n SITES

comimunities. The results are summarized on Table 6 Fiji Sites - Most Important Threatsbelow. Thev indicate that at nearly half of the siteswhere it was believed that threats could be managedlocally, the threats were not being addressed by thecommunity ,see also Chapter VIl "Limitations of Com-Munity-Based Management Regimes"). hi l
Table 6. Extent to which Threats were beingAddressed by Local Communities
No. of SitesYes No Tonga Sites - Most Important Threats
Are imo:st threalts addressable at the 21 10local levell (68 t) (23%)0/
Are locallv manatgeable threats actually 11 10 I _hbeing add ressed? 52K,) (48%) Wr 4b'
Are there Differences in the Most Important Threats by NI(lCountry?
There appeared to be differences in the most importantthreats by country (Fig. 24). 1 Overfishing and destructivefishing were deemed to be very important threats in Samoa,Tonga, and Fiji sites. By contrast, communities in SolomonIslands anci Palau sites identified a multiplicity of threats,many of them originating from activities on land. Some of a,the threats were unexpected: algae blooms, for example,were mentioned in Susui (Fiji), Kia (Solomon Islands), andNgiwal (Palaui. The construction of causeways was per-ceivecd as having a detrimental effect on coastal resources atall locations where causeways were found, namely Kouloand Tu'anekivale in Tonga, and Ngiwal (Palau). Distur- .,<.,,'',,
bances caused by outboard motorboat engines were notedin Luaniua (Solomon Islands) and most sites in Palau. Solomon Islands Sites - Most Important Threats
AGGREGATE TREND PERCEPTIONS Se n,IrI ( I
The suivev used four indicators of the impact of coastalresource managerment - perceptions of trends in CPUE, I iY
habitats, threats, and compliance. Could these indicators becombined to give a multi-dimensional picture of perceivedecological trencis? (> ---
To test this, the study team used the aggregate responsesgiven hv each focus groups to the four indicators-their Palau Sites - Most Important Threatsperception of all threat trends affecting a site, for example. Sydi:: [h'> erThese aggregate answers were not used elsewhere in the 22'.
analysis because they masked important variations acrossresources, habitats, threats, and management rules. Theywere also generally more optimistic than perceptions aboutspecific resources, habitats, or threats. This may indicate O.r,i'l that targeted resources tend to be in worse shape than site .2,resources as a whole. Alternatively, it may indicate that -
respondents find it more difficult to state perceptions for , ;|such an abstract concept as all the threats affecting theirsite. Figure 24. Most Important Threats to Coastal Resources by
Country Reported at the Study Sites
t his takes inito account only the most important threat reportedhV aCCh EOCUS ,roup.
'Voices from the Village: A (nniparativer Str,,o ( S ,.a'.dr K 0w . ,r, N t cnwnt ir , l -c 1' Isrsailanls

The aggregate responses for all four indicators were lar characteristics, indicating that the methodologycombined into an "aggregate perceived success index" accurately captured the communities' perceptions ofusing a principal component analysis (Chapter III). The ecological trends. If there had been inter-group differ-focus group responses were then averaged for each site, ences, the smaller samples taken at supplementary sitesgiving an overall score. The results showed a fairly even -where only three focus groups were interviewed-distribution of study sites across the index. might have been insufficiently representative of the
sites' conditions. The results indicate that this was not aThe above scores were then compared with the study major problem in the survey.team's own assessment of site "success", based on rapidecological observations and the team's own judgment of There were two exceptions to the above conclusion.management impact (Table 7). The team found quite a Habitat perceptions were found to differ across groupsfew differences between its own assessment and the of similar characteristics. This could, however, be dueassessments of the communities, which could be due to to different interpretations of a particular habitat: an eld-the different criteria used. Some sites judged as moderate erly group could be referring to the reef pass while asuccesses by the study team were perceived by local second elderly group might be thinking about the reefinhabitants as having poor ecological trends. Conversely, flat. The fact that the same focus groups showed no sig-several sites where residents felt that the trends were nificant differences in responses to the other three indi-improving were considered moderate failures by the cators suggests that the answers were robust.study team. In the first instance, the communities' pes-simistic assessment was largely due to perceptions of a While there was no major incentive to misstate CPUE,worsening trend in CPUE. The study team's positive habitat, and threat perceptions, there could have beenassessment, on the other hand, was based on the success incentives to overstate the degree of compliance. Viola-of specific management rules and a high level of local tion of management rules is a sensitive subject. Vil-awareness. All of the second type of sites had open access lagers might suspect that the study was associated withregimes. The study team's low assessment of these sites enforcement or might have been reluctant to portraywas based on the lack of management and the relatively the community negatively to outsiders. Thus, the pro-high level of resource degradation. The communities' pos- portion of responses (51 percent) asserting full compli-itive assessments were based primarily on perceptions of ance with coastal management rules may be too high.good compliance and improvement in habitats. Despite this potential bias, the study found no evidence
that compliance perceptions were inconsistent, and theSUMMARY OF KEY RESULTS AND INTERPRETATION indicator remains useful in comparing the perceived
compliance between different management rules.The study was based on the assumption that stated per-ceptions reflected the true perceptions of the villagers. One of the most surprising results of the study was theFrom experience in the field and comparison of results, overwhelming perception that resources were declining.it appeared that this was generally true. The study found Out of 399 responses, only 3 percent perceived anstrong consistency in the perceptions of groups of simi- increase in CPUE that was associated with management
Table 7. Comparison of Village Perceptions with Study Team's Assessment
Site Village Perceptions Study Team Assessment
Sites with Perceived Negative Ecological Trends by the Villagers but Judged Moderately Successful by the Study TeamLuaniua Aggregate Success Index: -0.84 Study Team Assessment: Moderate Success
CPUE: 8% stable/increasing * Despite strong commercial pressure on beche-de-mer, trochus, and giantHabitats: 330/0 stable/increasing clam, resources are still moderately abundant.Threats: 23% stable/decreasing . There is indigenous management, and local leaders are somewhatCompliance: 47% full/good successful in restricting local effort;
Many people feel that bans are good and should be extended.Onne Aggregate Success Index: -0.56 Study Team Assessment: Moderate Success
CPUE: 0% stable/increasing . Taboo area appears successfulHabitats: 77% stable/increasing . Good understanding of the need for resource managementThreats: 5
/5% stable/increasingCompliance: 330% ful l/good
Sites with Perceived Positive Ecological Trends by the Villagers but Judged Moderately Unsuccessful by the Study TeamTu'anekivale Aggregate Success Index: + 1.49 Study Team Assessment: Moderate Failure
CPUE: 33% stable/increasing * Overfished resourcesHabitats: 88% stable/increasing . Sedimentation from causewayThreats: 75% stable/increasingCompliance: 93% full/good
Ha'atafu Aggregate Success Index: + 1.36 Study Team Assessment: Moderate FailureCPUE: 78% stable/increasing * Degraded fisheries resourcesHabitats: 77%/ stable!increasing * Lack of indigenous rulesThreats: 0% stable/decreasing * Outsiders appear to ignore national rulesCompliance: 1000% full/good
THE STUDY SITFS 23

interventions. Since most study sites were implementing The analvsis of threat perceptions indicates that commu-some form of coastal management, the paucity of man- nities perceived pollution as being the most rapidly risingagement rules cannot be faulted for this result. Rather, threat, while destructive practices were perceived to havemore attention needs to paid to the causes of unsuccessful declined the most. In general, the study found potentialmanagement. In addition, the fact that many of the causes for stronger communitv action in handling local threats.of perceived CPUE and habitat declines-such as siltation, However, the fact that many of the fastest rising threatspollution, and poaching-cannot be effectively addressed were beyond the control of the coastal villagers and couldthrough community action has important implications for not he handled through fisheries managemenit alone indi-future coastal management in the Pacific Islands. cates that more needs to be clone to assist local commu-
nities-particularlv in addressing land-based threats,The study found that successful management was associ- infrastructure impacts isuch as that caused hy cause-ated most often with coral reefs than with other habitats. ways), and commercial harvests by external operators.The perceived faster decline of inter-tidal areas, lagoonsand reefs relative to other habitats mav reflect the relative The differences between the study team's assessment andimportance attached by communities to these habitats, the perceptions of local villagers Table 7) could be due torather than actual ecological differences. On the other the different criteria used. The study team assessed the sitehand, the results are consistent with experience in other conditions at one point in time and included judgmentsregions, which indicates that reefs tend to be among the about the existence of management and deg,ree ofcoastal habitats most impacted by human activities, but awareness that were not directly comparable to the vil-also among those most likely to recover from manage- lagers' perceptions of ecological trends. A similar dliscrep-ment. The results indicate that special attention should be ancy between community perceptions ancl that of projectdevoted to inter-tidal areas, lagoons and reefs in view of managers was founcl by Pomerovy Pollnac et al. 1 (97) intheir perceived importance to local communities. a survey of coastal communities in the P'hilippines.
Study results showed relatively good compliance with Community perceptions appear nevertheless to be affect-buyer-enforced regulations, protected areas, closed sea- ed by site-specific factors, such as the degree of aware-sons and restrictions on destructive fishing practices. The ness, dependency on resources, and the productivity ofstudy also revealed particularly good compliance for the sites'natural ecosystems (see Box 2). The relevance ofnational rules adopted by local leaders and the impor- these factors is discussed further in Chapter VI.tance of effective enforcement at the site level. Theimplications of these findings are discussed further inChapter VIII.
Box 2 - How do Community Perceptions Compare Across Sites of Different Characteristics?
Ontong Java vs. Honiara Fishing VillageLuaniua on Ontong Java atoll has often been cited as a success storv in communitv coastal resource management. On the other hand, HoniaraFishing Village with its degraded environment appears to be an obvious management failure. The residents of these sites do not see it this wav.At Luaniua, none of the CPUE trends for 24 identified resources were perceived to be positive or stable over the past ten years. Furthermore,none of the groups at Luaniua anticipated a stable or increasing CPUE in the near future. The residents of Honiara Fishing Village, however,were much more optimistic. Six of the perceptions for 21 resources indicated stable CPUEs and two of the focus groups believed the CPUEtrend would remain stable in the future.How can the communities perceptions be so counter-intuitive? The answer may be related to biological, behavioral, and psychological factors.The most likelv are:* The Honiara Fishing Village is located in an area which is biologically more productive than Luaniua. There are tw4o major rivers flowing into
the Honiara site. There is no such nutrient and freshwater input into Luaniua.* Manv Fishing Village residents are able to compensate for a drop in CPUE by ranging further afield and using more efficient gear (longer nets
or larger boats). At Luaniua, the villagers do not have the luxury of exploring alternative fishing grounds, as their atoll is located more than150 km from the closest neighboring island.
* At Luaniua the residents are more involved with coastal resource management than at Honiara Fishing Village where there are few, if any,vlocal management rules for coastal resources. In short, the Luaniua residents have invested more energy in coastal management and thereforemay be more sensitive to changes in their coastal resources. Hence, thev could be quick to noticesuch changes as declines in CPUE.
* There are a variety of alternative income sources in Honiara Fishing Village, but little besides coastal resources in the isolatedLuaniua. Like a person with only a small balance in a bank account, people in Luaniua are worried about resource levels, and mav le moresensitive to any changes in their harvest.
The above suggests that management interventions may be particularly critical in small, resource poor, isolated islands wvith a highdependency on coastal resources.
The latter result shoultd he interpreterd with )111( (daution1, 'irnec
there may have been a tendenrcy to underreport illegal prac ties con-dructed by the villagers themselves. Nonetheless, this reSLIt hel(d infurther analvsis 'see Chapter VI' anid couldl not bh explaiined solelv
hv a dceclineo in destrL1c:tiVC prŽctleti ea in alny particlUlar ( OLintr isu(c-has Samoa).
)4 v/oi:es tronm the VilL.,ge: ,\ (0111AV Sllrl.tx(.'L1ld 8 (:If }t3 4<s,l 'Mli.g 1 l ill dw P1(8 h(l il shwlk(l

VI. Success Factors
While Chapter V examinecl the commLinities' percep- * Type and intensity of threats. This factortions of success, this chapter analyzes how different appeared to be very important, particuJarly whenfactors - site characteristics, factors external to the involving siltation.sites, and factors related to management processes-affect perceived management success. A qualitative * Effectiveness of enforcement. Communities per-assessment of the most important factors is provided ceived poor enforcement as a major reason offirst, followed by the results of the quantitative analy- non-compliance with management rules.sis. Major findings are summarized at the end of thechapter. The chapter relies largelv on econometric MULTIVARIATE ANALYSISmethods ancl may appeal primarily to reaciers with aquantitative background. The methods used for the The quantitative analysis relied primarily on multi-quantitative analysis are explained in further detail in variate, discrete variable modeling2/ to examine theAnnex B. effect of individual variables on perceptions of suc-
cess, while holding all other variables constant.QUALITATIVE ASSESSMENT
The analysis used all CPUE, habitat, threat, and com-Based on field observations, the following factors pliance perceptions for the dependent variables. Inappeared to be the most important in influencing order to do this, a correction had to be made tocoastal management success: account for the complex structure of the data, which
were structured at four levels -country, sites, focus* Government support for local management ini- groups, and, for each focus group, perceptions for dif-
tiatives. Interviews at sites where government ferent resources, habitats, threats and rules. Withinsupport had been substantial (e.g., sites in Samoa) each of these four clusters, the observations were cor-suggest that this is an important factor in man- related, causing most estimators which assume inde-agemnent success. pendent observations to result in biased standard
errors. To avoid this, the study team used a correction* Natural disasters. Cyclones were often cited as a that allowed the standard errors to be calculated
major cause of habitat decline. Conversely, many under the assumption of stratified, clustered, randomrespondents notecd improvements in catch per sampling (with stratification by country ancl cluster-unit of effort after clevastating cyclones. ing by site). These estimators allow for correlation
within the clustering units, and yield variance esti-- Introduction of new or destructive technology. mates which are approximately unbiased or biased
Destructive fishing practices, suclh as poison fish- towards more conservative estimates.'ing and the introduction of more efficient fishingtechnology, were the seconcl andI third most fre- This model may be viewed as a special case of aquent reasons citecl for CPUE declines (after more specific model involving separate equations forexcess harvesting). each resource, threat, habitat and rule category. Had
there been equal sample sizes for each of these equa-* Qualityof localleadership. The cluality of village tions, it would have been possible to estimate these
leadership appeared to influence the degree of specific models and test for the equality of the coeffi-enforcement, acloption of management rules, cients. However, given the unequal and in someattitLicles towards destructive practices, and col- cases small samples, it was necessary to assume thatlaboration with external partners in restricted the regression coefficients were equal across the dif-access sites. Leadership quality dicl not appear to ferent equations, i.e., that factors such as populationhave the same importance in open-access sites. density affected the CPUE of reef finfish and beche-
de-mer in the same manner. This allowed the team to* Greater awareness of management benefits and
of the impact of destructive fishing practices. Discrete variable modeling is appropriate when the dependentThis seemed to be a major factor in the adoption variable is not continuous. In the study sample, the four indicatorsof effective management actions, such as well- of success were measured on an ordinal scale and their distribu-enforcecl bans on clestrLuctive practices and adop- tion was modeled hy an ordered probit model. The "aggregate
perceived success" index is continuous and was therefore mod-eledl by ordinary least squares regression. In practice, no major
awareness of the impact of destructive practices clilferences were found between these two estimation methods.also appeared to be important. See Stata H1999), Vol. 1: 321-333; Vol. 4:15-30.
PERC(FI'O1 )NS I * I,'

Table 8. Results of the Multivariate Analysis for Success Factors - Basic Model
CPUE Habitat ThreatSuccess Factors Trends Trends Trends' Compliance Aggregate Success
Ordered Probit Mlde/s Ordinarv l.eaist Squ.res
Palau' 0.394 0.356 0.436 1 .107** 0.1 68Samoa' 0.300 -0.731 0.121 0.672 -(.065Solomon Islands' -0.179 -0.216 0.079* -0.326 -0.9 3(Tonga 0.254 0.476 1.870** 1.247* 0.2 66Recent Government Visits -0.099* -0.007 0.121** 0.023 -0. 152**Income Dependence on Coastal Resources 0.006 0.008 0.005 0.()05 0.()01Natural Disasters 0.489** 0.378* 0.188 0.404* 0.751**Quality of Leadership 0.098 0.097 -0.359** 0.084 0.256*Inabilitv to Exclude Outsiders 0.194* 0.069 -0.227** 0.166 0.191*Presence of tPollution -0.104 -0.709** - 0.362** -().:314*Population Density 0.000** 0.000 -0.000* 0.0-0 0.()((Number of Ecosystems 0.080 -0.094 -0.147** 0.168 0.119Equal Sharing of Cost/Benefits 0.2 199* 0.080 -0.43(*. 0.210 01. 318*1Presence of Destructive Fishing Practices - -0.652*-Presence of Land-Based Threats' - 0.478*Presence of Overfishing Threats' - - .284Type of Rule: National rules adopted locallv -- - 0.924**Type of Rule: National rule, -- -0.193Constant (,for OLS regression) - - -. 767>*First ordinal rating- 1.269** -1.199** -2.310** 1.731 ISecond ordinal rating 2.500** -0.062 -1.414** 2.220-Third ordinal rating 3.083** 0.741 -0.947 2.889-Fourth ordinal rating 3.752** 1.653** -0.27!3
N 399 396 377 442 '1 F-Stat Degrees of Freedom 13 14 13,14 15 12 15, 12 13,14Probability Value of F test 0.0022 0.0302 ().()001 (0.0(049 ().111107R-square (0.52
-Threat trends are rated inversely to the other indicators, i.e. a high rating indicates an increasing threat.-This is analogous to the constant on ordlinary least squares regressions.
* The significance of these variables needs to be assessed in comparison with the omitted variables: "Fiji" (for countries), "other threats" (for preseml(:eof specific threatst, and "indigenous rules" (for types of rules).Significance levels: * significant at p<O.1; ** significant at p <0.05.
build a general model for CPUE, habitats, threats and included variables to account for country-specificcompliance.2 An aggregate success model was also effects. The "presence of indigenous rules" factor wasderived using the "aggregate perceived success subsequently dropped from the analysis because itindex" introduced in Chapter V. was highly and negatively correlated with the Tongan
sites, which lacked indigenous rules.As explanatory variables, the study team selected theten factors that appeared to be the most important for For the threats and compliance indicators, specificmanagement success (see Table B.5, Annex B). The dummv variables (coded "1" for presence and "0" forfactors were chosen based on empirical evidence, the absence") were also included. For the threat indica-qualitative assessment, and input from the study's tor, three variables were inserted to account whetheradvisory committee. They included government visits the threat was a destructive fishing practice, a land-to the sites, dependence on coastal resources for based threat (such as siltation, pollution, logging andincome, natural disasters, quality of leadership, the mining), or overfishing. For the compliance indicator,inability to exclude outsiders, presence of pollution, two dummy variables were inserted to indicatepopulation density, ecosystem diversity, presence of whether the management rule for which the compli-indigenous rules and a factor reflecting the degree to ance assessment was stated was a national rule, orwhich a village shared the benefits and losses of whether it was a national rule adopted locally. Signif-resource management among its members ("equal icance was then compared to the omitted variables,sharing of costs/benefits"). In addition, the model "all other threats" and "indigenous rules". The results
of this basic model are shown in Table 8.'' If separate coefficients for each resource category had beenallowed in a multi-equation model, then many more parameters Numerous variables were excluded from the basicwould have had to be estimated, and the standard errors would model because of analvsis limitations and, in somehave been higher. Table B.1 1 (Annex B) shows the results of a spe- cases, because the survey had failed to measure thecific equation model for reef-related trends. In practice, the results variable reliably. National-level variables could not bewere similar to those obtained through the general model shownin this chapter. included because they tended to be highly endoge-
26 Voices from the Village: A (Comparalive Studv of (oastal Resource Management i the 'lacjific Islands

nous (see below). In addition, they only varied at the management issues), and "income dependence" (thenational level and hence would have been perfectly percent of income derived from coastal resources andcorrelated with the country variables. Similarly, sever- tourism). It is not possible, for example, to determineal management process factors (e.g., conflicts, length whether dependence on coastal resources leads toof partnership) were excluded because of endogeneity management interventions or whether deterioratingproblems or because they would have limited the trends lead to a change in the degree of dependence.sample size. I These variables were analyzed primari-ly through qualitative assessments (Chapter VII). The presence of endogenous factors can bias the
results of the analysis. The study team attempted toDegree of awareness and enforcement effectiveness, control for endogeneity by estimating a two-stagetwo success factors found to be important in the qual- least squares model, in which the two factors wereitative analysis, could not be included in the model regressed against a set of instrumental variablesbecause they depend on site characteristics and explaining government visits and income depend-processes (i.e., they are not intrinsic explanatory vari- ence without otherwise being related to the per-ables). Enforcement effectiveness was captured by the ceived success indicators. Unfortunately, no goodcompliance success variable. instruments could be found in the data set to explain
these two factors, and the instrumental variablesEndogeneity. Endogeneity arises when a clear model resulted in imprecise estimates (Annex B).cause/effect relationship between explanatory anddependent variables cannot be demonstrated. Two of Given the weakness of the instrumental variablesthe explanatory variables in the basic model were model, the basic model was estimated again exclud-believed to be endogenous: "government visits" (the ing the two endogenous variables (Table 9). Althoughlast time an official visited the site to discuss coastal some variables changed in significance, there was
Table 9. Results of the Multivariate Analysis for Success Factors - Without Endogenous Variables
CPUE Habitat ThreatSuccess Factors Trends Trends Trends" Compliance Aggregate Success
Ordered Prohit Models Ordinary Least Squares
Palau' 0.174 0.011 0.166 0.889** 0.237Samoa' 0.198 -0.949* -0.127 0.481 0.015Solomon Islands' -0.096 -0.289 0.76W -0.462* -0.797"Tonga' 0.498 0.271 1.140** 0.867 0.897Recent Government VisitsIncome Dependence on Coastal Resources - -Natural Disasters 0.523-' 0.364** 0.112 0.391* 0.815-"Quality of Leadership 0.032 0.077 -0.281** 0.106 0.161Inability to Exclude Outsiders 0.099 0.054 -0.114 0.205** 0.062Presence of Pollution -0.082 -0.707** 0.363** -0.269Population Density 0.000 -0.000 -0.000* 0.000 0.000Number of Ecosystems 0.097 -0.072 -0.145** 0.173* 0.145Equal Sharing ofCost/Benefits 0.131* 0.040 -0.371"- 0.206* 0.229**Presence of Destructive Fishing Practices -- 0.6061* -- -
Presence of Land-Based Threats -- -- 0.482* -- -
Presence of Overfishing Threats' - 0.343Type of Rule: National rules adopted locallyv - - - - - - 0.915"" - -
Type of Rule: National rule' - - -0.169 - -
Constant (for OLS regression) -1 .830**First ordinal rating - 0.971* -1.615** -2.623"* 1.445* - -
Second ordinal rating 2.1 79"" -0.489 -1.739"* 1.941 **Third ordinal rating 2.751** 0.311 -1.278"" 2.602** --
Fourth ordinal rating 3.42 5** 1.226* -0.615
N 399 396 377 442 124F-Stat Degrees of Freedom 11,16 11,16 13,14 13,14 11,16Probability Value of F test 0.1203 0.0150 0.0000 0.0029 0.0164
R-square 0.48
Threat trends are rated inversely to the other indicators, i.e. a high rating indicates an increasing threat.This is analogous to the constant on ordinary least squares regression and indicates the ratings on the ordinal scale dependent variable.
' The significance of these variables needs to be assessed in comparison with the omitted variables: "Fiji" (for countries), 'other threats" (for presenceof specific threats), and "indigenous rules" (for types of rules).Significance levels: * significant at p<0.1; "* significant at p <0.05.
'' Information associated with partnerships could only be assessedat the 15 sites which had external partners. Including these vari-ables in the analysis would have cut the sample size by half.
PERC['rlONS OF SLJ ( FSs 27

strong consistency in the standard errors and onilv a success index . It is likelv that leadership is also sig-mninor variation in the coefficients of the two models. nificant in determining other trencds hut may not have
been wvell captured by the survey cquestionnaire.-?INTERPRETATION OF KEY RESULTS
Exclusion of Outsiders. The "inahility to exclude out-Country Effects. Among the study countries, sites in siders' variable was puzzling at first. Given the near-Samoa had better perceived CPUE trends than sites in 1v pertect correlation between open access and Ton-Fiji and the Solomon Islands, hut worse habitat trends gan sites, open access sites appeared to have worsethan sites in Palau or Tonga. Tonga and Solomoni sites threat trends than sites withi restricted atccess, whichhad significantly worse trends in threats than Palau, is consistent wvith empirical evidence. The resultsSamoa, or Fiji. 4 Perceived compliance with manage- indicated. howeve r that in aIl other sites, the lessment rules was better in Palau sites than in Fiji and capable the viila-e was in excluding outsiders, thethe Solomon Islands. Tongan sites also seenied to fare better the compliance C PUF and threat trends. Onebetter in perceived compliance than sites in the possible explanationr was that sites which were ableSolomon Islands and slightly better than sites in Fiji. to exclucle outsiders also had a highi incidence of
threats whichl tvpically could not be handled by theGovernment Support. Given the endogeneitv issue, commuLnity. But cloe s the ability to exclude outsidersno conclusions could be drawn from the economet- help control threats which can be handled locally? Toric analysis regarding the impact of recent govern- explore this qluestion further, the study team relatedment visits on perceived coastal management suc- the variable to threats whiichl the community believedcess. However, indicationis from sites where there is it could handle. When this variable was included, thesubstantial governiment support to village-level man- coefficient was no loinger significant, which is consis-agement indicate that this factor may be quite impor- tent with the finding that mnany coMmunities are nottant in influencing management success. handlinig local threats effectively (see Chapter Vi). It is
also possible that sites with strong customary marineDependence on Resources. "Income deperndence," teniure traditions are more sensitive to compliancethe second endogenous variable, did niot appear to violations (,Box 2'.play a determining role in any of the perceptions ofsuccess. A similar result was obtained whern model- The inabilitV to exclude outsiders is not a continuousing the degree of dependence on coastal resources variable, and the results need to be interpreted withfor subsistence purposes. Experience at somile sites cautLion Wh(then h Vari.14le was decomposed into its(e.g., Galoa) suggests that the more dependent the unrderlying cate'oi se it showed that in cases wherecommunitv is on coastal resources, the more difficult decisions to ext ludre outsi(lers wvere made at aboveit is to put harvesting controls into place. On the the village level Ie.g. byv pliaraount chiefs in Fiji), theother hand, most sites that were effective in limiting sites tendled to have sionificantIv negative trends intheir own harvesting (e.g., LuaniLia) were highly CPUE and low comlpliai ce. This is consistent withdependent on coastal resources. It is therefore possi- villagers reports in Fiji that non-resident leadersble that in sonie instances dependence acts as a occasionallv granit licenses to outside fishermen,deterrent and in other instances as an incentive for a practicte that was viewved negatively by the com-communit' action in coastal resource management. mun-ities- .
Natural Disasters. The significance of "natural disas-ters" was consistent with the qualitative result find-ings, indicating rapid resource recovery following acvclone event.
Becalse the Ilte Os il) cL ctioin' in the ori,ginril Survey weretfounl to bIce irh(bi ld.(' KtLtl' ituid l [ rti itw da ,cneral assessment
Quality of Leadership. "Quality of leadership" ,s O 15K thi r hr it'I dii s!ip 5'.,.'t low. mediorn, or high
appears to be important in controlling threats and of ral.eity. This h.iS ii Ot d Oil th obise)ved lot 1. respe(ct command-moderate significance in determining the aggregate ed hv the chios. ai t'heir 'lihi t\ to de l 'itih (coastal management
ejiorts. W hile in ,gener,d ptoi)t mIooek ri-cire that explanatoryvarialles f. tolitomnilnc or')in.il rtkin,' higdhi. mel(cil-1m, loo)bi' transformrned illOn c1U,lM'. f.urrctierl', ardor ,lFjsis inrtlicatecl
that treating quialil o it'adur,h r . ( tini UO.U1, did iioti itfe(t theIin,ll re,sults '('.r A\ n(-\ 13B
The significncre was testecl through an adjusted \V'ald test. Ihe As inclic,tec i)\ the Sl' itii(itl ,otd po>itivt' sign io thec Tongaresults reilect mean ditferences across counitries after controlllii g v.arthire.tor other factors anc not differences in raw meanst. The OesuLIl1 It1\. a i>o iutletI re'ent trends in coon.itries with
Threat trenris need to be interpreted as the reverse of other stroing nit ae tetnre sach El' 'a KmdU where poacrhinig hy externaltrenrls: i.e., a negative and sigiiiicant relationshitl merans that sites fishers s inc rem s'-t R Inhaices, pers,onal (0IliilluLnication). Thiswith goocd leadershpi) tencl to have hetter control over threats. c'ttect w.as noa , 10e11 (r (cacptUroa hv the Palatu (countrv dummy.
it'. '\ ,. ( i r,,rt 1 ,eI i', V i[r>1w: .S ( azirir',l -S i-l AI( . ' i- ( i- ( .11 ,(' ' a11( i' r r,lli.g 'lrl'rl il hrlf i).r Stic s.'i.ncis

Given the difficulties in interpreting the variable, per- cause of coastal resource decline in the Pacific ashaps the most that can be said is that in restricted previously believed.access sites, the study found no strong evidence thata village's ability to exclude outsiders influenced per- Equal Sharing of Costs and Benefits. A significantceptions of success. A principal component analysis, variable associated with most success indicators washowever, suggested that the ability to exclude out- the extent to which management benefits and costssiders is associated with a higher number of indige- were shared equally among community membersnous rules and the presence of clear site boundaries ("equal sharing of costs/benefits"). This is consistent(Annex B). with study findings that unequal distribution of bene-
fits is one of the most important causes of intra-villageNumber of Ecosystems. The greater the "number of conflict (see Chapter VIl).ecosystems," the lower the perceived threats, indicat-ing that in ecologically richer areas threats are spread OTHER QUANTITATIVE RESULTSover a greater number of habitats. Thus, habitat dete-rioration may not be perceived to be as acute than in How do External Factors Influence Success?lower diversity areas. As seen, the structure of the survey was not con-
ducive to a quantitative assessment of the impact ofType of Threat. The presence of "pollution" seemed national policies on coastal resource management.to have a significantly negative effect on perceived However, some conclusions can be drawn fromhabitat trends. Consistent with the findings of Chap- simple correlation coefficients and qualitativeter V, "destructive fishing practices" appeared to be assessments (Chapter VII). Correlation coefficients doincreasing more slowly than other threats at the studv not assume a cause/effect relationship. They simplysites. There was also some evidence that "land-based examine whether perceptions of success are high (orthreats" were rising faster than other threats, except low) at sites possessing certain characteristics. Afor overfishing. significant coefficient indicates that the two vary
together. The key disadvantage of this analysis is thatType of Management Rule. The results of the it does not isolate the effects of a particular factor.multivariate analysis confirmed the earlier study Supportive national legislation, for example, could befindings that "national rules which have been adopt- negatively correlated to habitat trends in a certained locally" had significantly higher perceived com- country, but this could simply mean that factors otherpliance than either purely national or local rules. No than legislation are affecting local habitats.significant differences were noted in the perceivedcompliance with purely national or purely local Enabling Legislation. There is little evidence from therules. correlation analysis that national legislation is related
to the perceptions of success at the site level. ThePopulation Growth and Density. Population growth study team examined three regulatory variables:rates ("population pressure") did not seem to affect (a) whether the government recognized marine userperceptions of success. The results seemed to indi- rights; (b) an index of enabling legislation supportingcate, however, that the higher the population density, community-based management; and (c) a fisheriesthe lower the perceived threats and the better the legislation index. These variables tended to be signif-CPUE. The study team believes that this apparently icantly -and negatively -related to perceived suc-contradictory finding may reflect the fact that the cess. This could mean that countries with strongvariable is likely capturing other site characteristics: enabling legislation (e.g., Solomon Islands) are alsofor example, sites with high population density experiencing worsening ecological trends for reasonstended to have relatively undeveloped fishing tech- unrelated to legislative support.nology. When technology was accounted for in theCPUE model, population density was no longer sig- By contrast, national recognition of customarynificant.' Perhaps more significant is the indication marine tenure and enabling legislation in support ofthat population pressure may not be as relevant a community-based management were highly correlat-
ed to the presence of indigenous rules at the site level
A study reviewer suggested that sites with higher populationdensity may have access to tinnedl fish as an alternative source ofprotein. They coulcd therefore exert less pressure on coastalresources than more remote (or sparsely populated) sites. Howev-er, the correlation between population density at the study sitesancd access to tinned fish (or meat) was relativelv low (0.08).
PER( ST 1(JNS ()01 ST IT 29

(Table 10). But how does enabling legislation relate to important factors such as support for community-the presence of national rules adopted locally (which level initiatives. The degree of government support atseem to have the highest compliance)? The correla- the site level is discussed further in Chapter VIl.tion analvsis indicates that a legislative frameworkallowing communities to adapt national rules to their External Shocks. Shocks were defined as majorown conditions appears to be the more important events affecting the coastal resources of a site. As pre-enabling factor. This type of rules were found prima- viously discussed, natural disasters appeared to haverily in Samoa, which does not recognize customary the strongest impact on perceived trends. Amongmarine tenure (hence the negative correlation shown other shocks, the introduction of destructive tech-in Table 10). nologies was negatively correlated with perceived
compliance.Table 10. Correlation Between Indigenous Coastal
Management Rules and Enabling Legislation Which Site Characteristics Appear to Influence Per-at the National Level ceived Success?
Presence of Qualitative and quantitative analyses revealed aPresence of National Rules number of site characteristics that seemed to signifi-
Correlation between Indigenous Rules Adopted Locally cantly affect perceptions of success: communityRecognition of Customary awareness, quality of leadership, type and intensity ofMarine Tenure' 0.58- -0.25* threats, and ecosystem diversity all appeared to beEnabling Legislation important.Supporting CommunityManagement 0.40*' -0.12*** To explore further the impact of other site character-National Legislation Allowing istics on perceived management success, the studyCommunities to Adapt NationalRules to Own Conditions N/A 0,23*** team built two variations of the basic model, which
.significant at p001 Frthsndx,seaheincluded sets of additional site characteristics (see***significant at p <0001 a_ For this Index, see Table 14, Chapter Vl. Table 12).
External Support for Coastal Resource Management. The models showed that village education appearedThe proportion of staff time dedicated to coastal to have a negative impact on perceived habitatresources management in national fisheries agencies trends. This could indicate that communities with awas significantly correlated with perceived success. higher level of education are more aware of habitatThe frequency of newspaper articles on coastal degradation or, alternatively, that educated commu-resource issues (a proxy for awareness among high- nities tend to be located close to urban areas wherelevel decision makers) was also positively related to habitat destruction is more common.perceived success, except for habitat trends (Table11). By contrast, the level of donor financing (annual Settlement patterns appeared to have a negativebudget spent per area of country) was related only to effect on perceived habitat and threat trends, but aperceptions of compliance, but this factor is known to positive effect on compliance. The conservationbe important in countries such as Samoa. Political value of a site appeared to be negatively related towill was not well captured by the questionnaire, but habitat trends. This could indicate that these sites areit is likely to play an indirect role in influencing other subject to high levels of habitat degradation. The
level of fishing technology was found to have a posi-Table 11. Correlation between External Support and tive impact on perceived CPUE. The most logical
Perceived Success of Coastal Resource explanation is that sites with better fishing technolo-Management at Study Sites gy and larger boats are able to explore alternative
CPUE Habitat Threat fishing grounds. The analysis found no significantCorrelation between Trends Trends Trends Compliance effect for tourism benefits, cultural requirements to
harvest, social cohesion, or ease of marketing. OnlyFisheries Departments at Tongan sites were cultural harvesting requirements°/n Staff time dedicated hretnto coaStalf e resrcated (e.g., communal harvests for a feast or a funeral)to coastal resource management 0.158*-* -0.133*** -0.294*** 0.171** sufficiently large to have a bearing on management
success.Frequency of newspaperarticles on coastalmanagement 0.145*-* -0.152*** -0.411*1- 0.142**- A number of other site characteristics could only be
tested through simple correlations with the percep-Annual donors budgetper sq. km -0.020 -0.022 -0.010 0.173*** tions of success variables (see Table B.2, Annex B).-**Significant at p<0.01 level.
.0 'Voices from the Village: A Comparative Study of Coastal Resource Management in the Pacific Islands

Table 12. Significance of Additional Site Characteristics'
CPUE Habitats Threats' Compliance Aggregated Success
Success Site Characteristics Model l:
Percentage of completed village projects: Social Cohesion 0.003 0.011 -0.001 -0.010 0.016Village Education 0.004 -0.013** -0.002 -0.005 -0.003No. of close-by villages: Settlement Patterns -0.003 -0.014** 0.0081* 0.013** -0.0(04Ease of marketing perishable products: Market Integration -0.116 0.057 -0.055 -0.059 0.062Presence of External Partners -0.153 -0.146 0.460** 0.205 -0.076
Site Characteristics Model Il:Cultural Requirements to Harvest -0.135 -0.116 0.133 0.131 -0).0)21Level of Fishing Technology 0.621** -0.033 0.196 -0.344 0.231No. of ecological features: Conservation value -0.017 -0.238** 0.012 -0.049 -0.131Benefits from tourism -0.090 0.078 0.034 0.076 -0.051
Significance levels: * significant at p<0.1; ** significant at p <0.05.- Complete model results are shown on tables B.18 and B.19, Annex B.
- - Ordinary least squares regression results. The ordered probit results were almost identical.Threat trends are rated in the inverse: a high rating indicates an increasing threat.
Urban sites were associated with higher threats, but Which Key Processes are Most Conducive toalso with higher compliance. The age of a village Management Success?appeared to be positively correlated with more posi-tive habitat, compliance and threat trends. Sites locat- Management processes tend to be highly endoge-ed in high islands seemed, in general, to have lower nous. It is not certain, for example, whether sanctuar-threats and better compliance than sites located in ies have helped improve resource trends or whetherlow islands. High islands can include highly produc- they were introduced as a response to decliningtive areas (e.g., large lagoons with substantial estuar- trends. While this section provides a few quantitativeine and mangrove systems) that are generally more results, management processes related to conflict,resilient to harvesting pressure than low islands or external partners, the introduction of sanctuaries, andatolls. The presence of clear site boundaries, on the alternative income generation were primarily ana-other hand, was negatively correlated with compli- lyzed qualitatively and are discussed in Chapter VII.ance, but this could be due to the inability of the cor-relation coefficient to distinguish between the effect It was seen in the basic model that equality of bene-of other factors. fits and losses was an important predictor of per-
ceived success. The fact that external partners wereThe way site characteristics were associated across the found to be associated with higher threat trendsstudy sites was assessed with a principal component (Table 12) may simply indicate that the partners tendanalysis. Sites with high social cohesion also tended to to intervene in sites which naturally attract higherbe older settlements, have better systems of leadership, threats. The multivariate analysis, however, showedhave higher education, and have better compliance no significant differences in perceptions of successwith management rules (see Table B.21, Annex B). between conservation and nonconservation sites.Larger sites tended to have greater ecosystem diversityand other important conservation features (e.g., pres- The principal component analysis indicated that sitesence of turtle-nesting areas, sea bird rookeries). Sites with external partners were associated with the pres-with greater diversity of land use tended to have high- ence of sanctuaries and the introduction of alterna-er conservation value, larger populations, and more tive income generation. The presence of indigenousabundant coastal resources. Sites with highly devel- rules was generally associated with local control overoped fishing technology also had a high dependence resources and a higher benefit derived from externalon coastal products and were generally further away site users. Curiously, villages which shared the bene-from urban markets. The level of village development fits and losses of management equally among itswas positively associated with the degree of market members also had a relatively low participation ofintegration, but negatively associated with depend- youth and women in decisionmaking. Pure democra-ence on coastal resources for subsistence use. cy (one person, one vote) was not found at any site.
On the other hand, all village governance systemshad mechanisms to give most segments of the com-
PERCLIMOIlNS OF SUCCESS i1

Table 13. Most Significant Success Factors Found at the Study Sites - Summary Results
Factor Effect on Perceived Success Indicators
Etternal Factors:NatUral dlisastcrs T CPUE 1 habitats c' comp an(el 1 aggregated su(cess
Site Characteristics:High oLqalitV of village leadership 1 threats aggregate(7 su( cessL _vger numher ox coastal ecosystems .I threatsl'resell(c ol oollution Cl habitats (omplian(e I aggregate(d su(cess ^l'resence of clestructive fishing practices .l threatsi resenc(e ot land-hased threats ' threats *
I ligher village educatio(l habitatslresence of other settlements nearby .I habitats 'P threats ' comilia' neI Higher fishing technology ' CPUE[Higher number of conservation/ecological features I habitatsAss areness of management benefits Qualitative assessment indicates that it is important to overall su(cess
Management Processes:Ir(lual shmrng of benefits/losses of management ' CPUE 1 threats ' compliance ' aggregated successPresent e of national rules adopted locally ' complianceFfic( tivseness or entorcement Qualitative assessment inrlicates that it is importanit to overall Su(ccess
1Ind(ictes that the tactor causes the indicator to be rising faster; 1 indicates that the factor causes the indi(ator to he declining iaster"Aiorregated su(cess represents a weighted measure of all four success indicators derived through principal ( omponent and7vsis.
leullsr sienificant a ,t the 10 percent level).
munity a say in the decisionmaking process. Collabo- community initiatives is believed to be important, butration among neighboring communities appeared to its impact could only be assessed qualitatively (seebe important in Fiji, where coastal areas are com- Chapter VII).monly shared by several villages.
Open access sites were generally associated withSUMMARY OF KEY RESULTS higher perceived threats to coastal resources. How-
ever, contrary to current thinking, the study failed toThe previous sections discussed the interpretation of find a significant relation between the ability tothe findings on key success factors. Table 13 summa- exclude outsiders and perceived success. Similarly,rizes the most important success factors found by the higher population density did not appear to result instudy and their relation to the perceived success indi- worsening perceived trends at the study sites.cators.
Population growth, ease of marketing, social cohe-For several potentially important factors, the study sion, income dependence, cultural requirements toresults were inconclusive: a cause/effect relationship harvest, and tourism benefits were not found to bebetween national policies and coastal management significant in influencing perceived success at thesuccess could not be demonstrated through the quan- study sites.titative analysis. The level of government support to
Voices from the Village: A Corinpa atiso t( o1S d\ ( WoSIal tis,ourrc Managenemnt in the Pacifin Islands

VI 1. Key Issues
This chapter examines a number of coastal manage- practices of excluding outside users from communityment issues based on the study findings. The issues waters is not consistent with the Constitution, whichinclude: does not recognize exclusive user rights."' Samoa pre-
sented both some of the best examples of conflict res-* Coastal resource use conflicts; olution as well as some of the worst conflicts, with
some disputes involving physical violence and* The level of government support to community destruction of property.
initiatives;Six sites (19 percent of the sample) reported intra-
* The relevance of different coastal resource man- village conflicts. These generally arose when certainagement rules; individuals or families were seen as benefiting dis-
proportionately from external commercial opera-* Characteristics of open access sites; tions. Examples include traditional leaders benefiting
from licenses issued to external fishers, or the* External partnerships; involvement of certain community members in a new
tourist resort or a pearl 'farm. Specific examples of* The perceived effect of sanctuaries as a coastal local conflicts reported at the study sites are shown
resource management tool; on Box 3.
i The perceived impact of alternative income gen- Box 3. Examples of Coastal Resource Useeration programs; and Conflicts Reported at Study Sites
i Limitations of community-based management. Conflicts Over Resource Use
The results are based on simple descriptive analysis of Galoa, Fiji: Resource use conflicts occurred mainlythe survey results as well as study team observations. with outsiders. A few years back, a group of Nausori
fishers were chased from the site. Prior to this, the Tiki-CONFLICTS na meeting had made a resolution that no outsider
should he granted a fishing license, but the Tui Lekutuignored the decision. The incident was reported to the
Of the 31 sites, 26 (84 percent) reported conflicts Tikina Concil and the Provincial Council, where it waswith outsiders regarding coastal resource use. These resolved.conflicts usually fell into three categories: conflicts Luaniua, Solomon Islands: Resource use conflicts arosewith poachers; disputes over boundaries; and dis- when commercialization of resources became impor-putes with external commercial operators. The most tant. A major catalyzing event occurred when a Luani-commonly reported conflict was poaching and other ua businessman brought in a collection vessel andforms of unauthorized fishing, frequently involving made ownership claims on reefs adjacent to his land.night diving or collection of commercial species such This event led to a temporary breakdown of alternatingas trochus. The second most common conflict ed in a weakenmng of chreesflating bans, and resultinvolved boundary disputes and conflict over off- resources. Conflicts also arose over the ownership ofshore reef ownership. This occurred even in Fiji floating logs, which were important for canoe buildingwhere, starting in 1958, the Native Fisheries Com- and firewood. The chiefs usually resolved this type ofmission spent years delineating fishing rights bound- conflicts. Little conflict was reported with non-Ontongaries. Several sites reported conflicts with outsiders Java people.over commercial operations, particularly when it Peleliu, Palau: Ongoing boundary disputes causedinvolved commercial licenses to external fishers. conflicts between Koror state rangers and Peleliu fish-
ers, mainly over trochus harvests and fishing in KororExternal disputes seemed to vary by country. In the state's no-take zones. There was also some conflictSolomon Islands sites, conflicts involving residents between net fishers and tourism diving operations.from open access sites occurred when they tres-passed on nearby coastal areas where local commu-nities had exclusive use rights. No physical alterca-tions were reported in Tongan sites, perhaps because Under Article 104 of Samoa's Constitution, all land lying belowof cultural traits. In Samoan sites, conflicts appeared the high water mark is vested in the State. Legally, therefore, allto arise because the village councils' long-established Samoans have equal access rights to coastal areas.
SUCCLSS FA,'T(OR' 33

Table 14. Indicators of National Assistance to Coastal Resource Management
SolomonFiji Tonga Samoa Islands Palau
1. Enabling LegislationDoes the Legislation:
Authorize traditional users to define marine boundaries for exclusive use? Yes \o No Yes YesRecognize customary marine tenure? Yes \o \o Yes YesAllos communitv representatives to legallv implement indigenous rules? so \o Yes Yes YesAllow for comnmunities to adapt national rules to their own conditions? No No Yes No YesAllow local leaders to enforce legislation? Yes No Yes Yes YesProvide for a forum for conflict resolution? No Yes Yes No NoAre there traditional mechanisms of conflict resolution not requiring national laws? Yes Yes Yes Yes YesProviric for flill agreement fronm coastal users before a coastal area is cleclared
as i conservation/protected area? \o No Yes Yes YesProvide for lull agreement from coastal users before perniits are given for coastal development No Yes Yes Yes NoPercentage Of "Yes" answers 44% 33% 78%/, 78% .8%
11. Agency Support to Coastal Resources ManagementFisheries Divisions:Estimateclr Staff-Tire Allocated to Fisheries Management Activities 12% 20%( 350., 15%") 17Support tO COmmunity Initiatives in Coastal Resource Management Yes Yes Yes Yes YesEnforcement Support to Coastal Resource Management Medium Minor Minor Major MinorCollection of Statistics on Commercial Coastal Production tMajor Mediusm Major Medium MediumCollection of Statistics on Subsistence Fisheries Medium Minor Minor Absent MinorStock Assessment for Coastal Fisheries Medium Minor Medium Minor MinorEnvironment Divisions:Support tri Community Initiatives in Coastal Resource Management Yes Yes Yes Yes No
1lI. Estimated Annual Donor Assistance per Square Kilometer of Surface (US$)* 21 114 194 16 666
Responses are as stated during an interview with Fisheries and Environmental Agencies' staff, and could reflect the subjective judgoents of the respondents.Likelv to be Underestimated.
iOVERNMENT SUPPORT FOR COMMUNITYINITIATIVES Government Visits to Study Sites forINIT IATIVESCoastal Management Assistance
Government support for community-based manage-ment is often seen to be a key contributor to coastal resource management success. Although this could visea witsin 1ites
Yea~~~~~~~~~~~~~~v ~~~~~~48':,,,~not be demonstrated through the quantitative analy- sSes
sis (Chapter VI), the evidence collected by the study 42%)
remains useful in analyzing the level of governmentassistance at the study sites.
Table 14 summarizes the various indicators of nation- Visited Nr... thrn
al assistance to local-level coastal management ini- as Ago.tiatives, according to information provided by seniorgovernment officials. The proportion of public Figure 25 Government Visits to Study Sitesexpenditures allocated to coastal management wouldprovide a good indication of national priorities, butthis information was not available for most of the est proportion of recent visits (two-thirds of the sites).countries. The estimated proportion of fisheries agen- Half of the sites visited were also receiving externalcies' staff time devoted to coastal resources manage- donor assistance in coastal resource management,ment averaged 23 percent in the study countries. suggesting that part of the visits were being support-
ed by donor funds. The results indicate that localPerhaps a better indicator of government support is management of coastal resources does not rank highhow recently an official visited the villages to provide among government priorities.advice on coastal resources management (Fig. 25).Fifteen sites (48 percent) had never been visited, and Can government support for community-based man-an additional 3 sites had not received a visit in the agement be effective? Recent efforts by the govern-previous 10 years. Fiji and Samoan sites had the high- ment of Samoa indicate that it can (Box 4).
14 'Voices from the Village: A Comparative Studs of Coastal ResouLrce Mtanagement in tht Pacific Islands
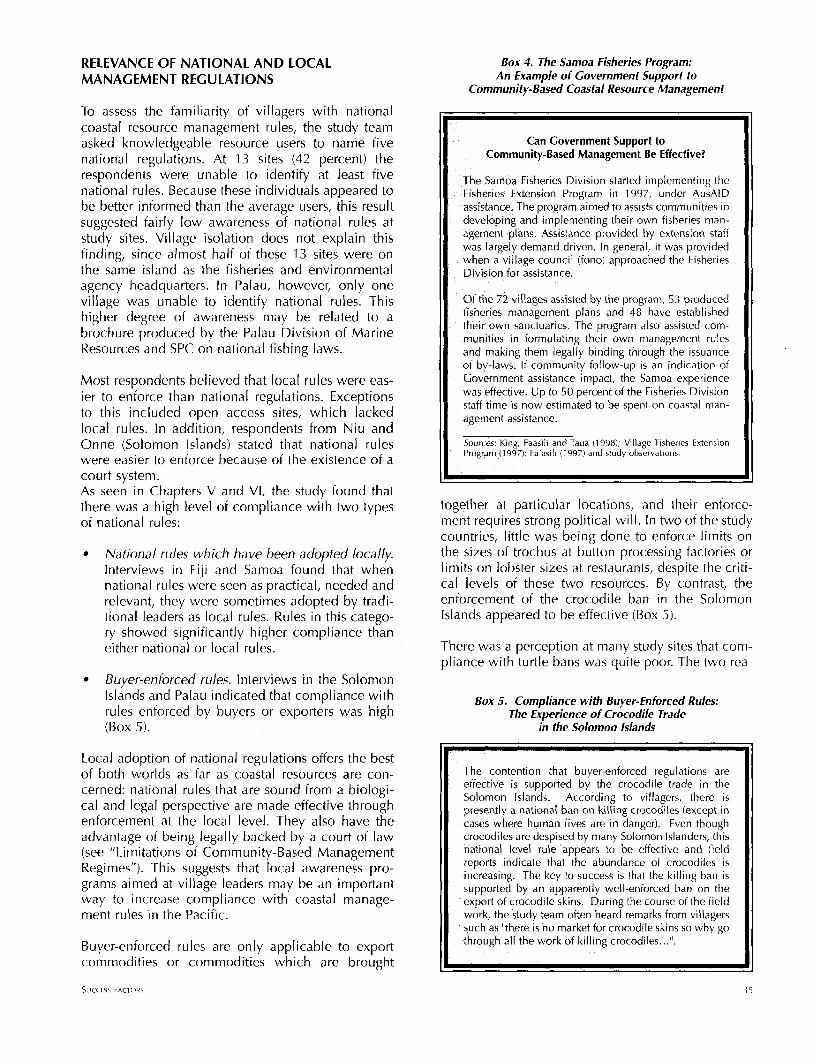
RELEVANCE OF NATIONAL AND LOCAL Box 4. The Samoa Fisheries Program:MANAGEMENT REGULATIONS An Example of Government Support to
Community-Based Coastal Resource Management
To assess the familiarity of villagers with nationalcoastal resource management rules, the study teamrasked knowledgeable resource users to name five Can Government Support tonational regulations. At 13 sites (42 percent) the Community-Based Management Be Effective?respondents were unable to identify at least five The Samoa Fisheries Division started implementing thenational rules. Because these individuals appeared to Fisheries Extension Program in 1997, under AusAlDbe better informed than the average users, this result assistance. The program aimed to assists communities insuggested fairly low awareness of national rules at developing and implementing their own fisheries man-study sites. Village isolation does not explain this agement plans. Assistance provided by extension stafffinding, since almost half of these 13 sites were on was largely demand driven. In general, it was providedsince almost when a village council (fono) approached the Fisheriesthe same island as the fisheries and environmental Division for assistance.agency headquarters. In Palau, however, only onevillage was unable to identify national rules. This Of the 72 villages assisted by the program, 53 producedhigher degree of awareness may be related to a fisheries management plans and 48 have establishedbrochure produced by the Palau Division of Marine their own sanctuaries. The program also assisted com-munities in formulating their own management rulesResources and SPC on national fishing laws. and making them legally binding through the issuance
of by-laws. If community follow-up is an indication ofMost respondents believed that local rules were eas- Government assistance impact, the Samoa experienceier to enforce than national regulations. Exceptions was effective. Up to 50 percent of the Fisheries Divisionto this included open access sites, which lacked staff time is now estimated to be spent on coastal man-local rules. in addition, respondents from Niu and agement assistance.Onne (Solomon Islands) stated that national rules Sources: King, Faasili and Taua (19981; Village Fisheries Extension
were easier to enforce because of the existence of a Program (1997); Fa'asili (1997) and study observations.
court system.As seen in Chapters V and VI, the study found thatthere was a high level of compliance with two types together at particular locations, and their enforce-of national rules: ment requires strong political will. In two of the study
countries, little was being done to enforce limits on* National rules which have been adopted locally. the sizes of trochus at button processing factories or
Interviews in Fiji and Samoa found that when limits on lobster sizes at restaurants, despite the criti-national rules were seen as practical, needed and cal levels of these two resources. By contrast, therelevant, they were sometimes adopted by tradi- enforcement of the crocodile ban in the Solomontional leaders as local rules. Rules in this catego- Islands appeared to be effective (Box 5).ry showed significantly higher compliance thaneither national or local rules. There was a perception at many study sites that com-
pliance with turtle bans was quite poor. The two rea-* Buyer-enforced rules. Interviews in the Solomon
Islands and Palau indicated that compliance with Box 5. Compliance with Buyer-Enforced Rules:rules enforced by buyers or exporters was high The Experience of Crocodile Trade(Box 5). in the Solomon Islands
Local adoption of national regulations offers the bestof both worlds as far as coastal resources are con- The contention that buyer-enforced regulations arecerned: national rules that are sound from a biologi- effective is supported by the crocodile trade in the
Solomon Islands. According to villagers, there iscal and legal perspective are made effective through presently a national ban on killing crocodiles (except inenforcement at the local level. They also have the cases where human lives are in danger). Even thoughadvantage of being legally backed by a court of law crocodiles are despised by many Solomon islanders, this(see "Limitations of Community-Based Management national level rule appears to be effective and fieldRegimes"). This suggests that local awareness pro- reports indicate that the abundance of crocodiles isRegimes").. increasing. The key to success is that the killing ban isgrams aimed at village leaders may be an important supported by an apparently well-enforced ban on theway to increase compliance with coastal manage- export of crocodile skins. During the course of the fieldment rules in the Pacific. work, the study team often heard remarks from villagers
such as "there is no market for crocodile skins so why goBuyer-enforced rules are only applicable to export through all the work of killing crocodiles...".commodities or commodities which are brought .
SUCCEss FACTORS 35

sons cited for poor compliance was that the rLiles Box 6. National Coastal Managementconflict with the communities' cultural obligations Regulations vs. Simplicity(such as the custom, at some sites, of giving turtles tothe chiefs) and that "turtle meat was just too tempting An example of a national rule affecting community man-to resist.'A xml fanainlrl fetigcmuiymnagement which is not simple is Section 13 on the protection
of native customary rights in the current Fiji Fisheries Act:Another key observation was that simple rules (e.g., aban on dynamite fishing) seemed to enjov a greater 'Notwithstanding anything contained in the Rivers andunderstanding than more complicated arrangements Streams Act, it shall be an offence for any person to take fish(e.g., a ban on harvesting trochus between January on any reef or any kay (cockle) or other shellfish bed in anyan(e.g.mjoiyofteloa,ulswresml area in respect of which the rights of any mataqali or otherand May). A majority ot the local rules were simple division or subdivision of the Fijian people have been regis-(Fig. 26), and their perceived compliance was signif- tered by the Native Fisheries Commission in the Register oficantly greater than compliance with more complex Native Customary Fishing Rights, unless he shall be amem-regulations. It also appears that many national rules ber of such mataqali, division or subdivision of the Fijianthat directly affect community management are so people who does not require a license under section 5 to
complex hat theybaffle lcal bene ciaries and aretake such fish or shall first have obtained a permit to do socomplex that they baffle local beneficiaries, and are from the Commissioner of the Division in which such areaconsequently ignored (Box 6). is situated provided that such permits shall not be necessary
in the case of persons taking fish (other than by way of tradeor business or as an employee of a person carrying on the
Prevailing Local Management Rules trade or business of a fisherman) with hook and line, or withat the Study Sites a spear or portable fish trap which can be handled by one
person; and any such permit may exclude fishing for par-ticular species of fish, or may exclude fishing in aniy partic-ular areas, or may exclude fishing by any particular meth-
Simp[c 1W-1lls ......I l l 10 l l l l ! | l | ( 1)lilill ( 1ods, or may contain any combination of such exclusions".
Sentences often heard at the study sites were that "the sim-pler the management arrangement, the better it will be
fl I | 11 l | \JQllt;> . understood by simple villagers," and that "the villagers4`~~~~,, ~~~understand bans.".
N=97
Open access sites shared the following characteristics:Figure 26. Types of Local Rules Found at Study Sites * Lack of Indigenous Rules. Except for Honiara
Fishing Village,' all open access sites lackedFinally, the study's finding that sanctuaries, closed local management rules (Fig. 27). The prevailingseasons and restrictions on destructive fishing prac- attitude was, "why should we place restrictionstices were perceived as being better complied wvith on ourselves if these rules cannot be applied tothan other types of rules (Chapter V) suggests that outsiders"? The existence of open accessmore should be done to apply and enforce these appeared to be a powerful disincentive to the cre-types of regulations. ation of local rules. Since knowledge of national
rules was weak, the net effect at these sitesCHARACTERISTICS OF OPEN ACCESS AREAS appeared to be a near-absence of coastal
resource management.Coastal management experts generally consider openaccess conditions - where there is no restriction of * Conflict. Even though the study could not deter-access to a coastal area -as a constraint to the effec- mine whether conflicts over coastal resource usetive management of coastal resources. were more prevalent at open access sites, most of
the conflicts at the two Solomon Island sitesEight of the sites (26 percent) were open access areas: appeared to be with neighboring communitiesthey included all six sites in Tonga, and the Honiara which had restricted access to their waters. InFishing Village and Cooksin in the Solomon Islands. Tonga, fishing by outsiders in waters adjacent toIn Tonga, the 1875 Constitution, the 1887 Royal the community tended to cause villagers to feelProclamation, and the Land Act of 1927 abolished "angry inside."traditional claims of local control over fishing areasand gave all Tongans the right of equal access tonational waters. In the two Solomon Island sites, l Residents in Honiara Fishing \Village identified six local rules, butopen access prevailed because the villages were manv villagers seemed unaware of them or indicated that theyresettled in areas owned by the government. applied to very small coastal areas directly in front of village houses.
36 Voi( es fronii the Village: A compa rativ,e StUdrV of ( oastal R(JI Ko'( (, Manragemniei l the P'iacific Islands

The Relationship Between__ _ . _ Marine Tenure and
Solomon Islands Indigenous Rules
Restrict,d access sites ithPalau c>,. A -digenousnraes
* s Open access sites with
inigwnous sales.~~~~~~~~~~~~~~~~~~p ,- sit ,11trOll.etrW
; -mi I Samoa
n 0 -t 6 c er(s
N ~ ~-" 0 x14 ' eJ C 0 20P-Aert
~~~~~~ ~~~~~Tangoa
Figure 27. Relationship between Open Access Conditionsand Local Coastal Management Rules
Less Effective Management of Threats. As seen Awareness of Management Benefitsin Chapter VI, Tongan sites perceived threats as Open Access Sitesincreasing faster than sites in other countries. Inaddition, six of the eight open access sites = %nranked threats to coastal resources higher than (A79ae
the average for all sites. Tongan sites also felt thatas many as 72 percent of the most importantthreats could only be controlled with help fromoutside the community. This suggests that localcontrol of threats is thought to be less effective
refers to proportion of tocus groups intcr, jeweedwhere open access prevails. It should be noted, at open access sites; N=34however, that no discernible differences couldbe detected in the perceptions of CPUE, habitatsand compliance between open access and Awareness of Management Benefitsrestricted access sites. Non-Open Access Sites
-- - fls Una-ire* Less Awareness of Management Benefits. Percep- Avware
tion interviews included several questions aimed 91/i;at judging awareness of the benefits of resource Amanagement among respondents". The studyteam then made a subjective judgment on whetherthe focus group seemed aware of the benefits.There was generally a lower level of awareness inopen access sites (Fig. 28). This is perhaps to be atnreieonoproporiwofefacussr uis, i=9,e,ss
expected, since the absence of local rules meansthat residents in open access areas are less Figure 28. Awareness of Coastal Resource Management Benefitsexposed to coastal management (Box 7). Among Villagers in Open Access and Restricted Access Sites
Experts on coastal resource management usuallybelieve that open access is an important disincentiveto effective coastal resource management. The resultsof this study support that view. PARTNERSHIPS
Several external organizations were involved in" Questions includecd asking why certain trends were perceived as several ter31 organities in involvastaldeclining or increasing and asking what could he done to improve assisting the 31 communities in managing coastalthe situation in the future. resources. A total of fifteen sites (48 percent) had
SUccEss FA TORS 37

Box 7. Open Access versus external partners (Fig. 29). With the exception ofRestricted Access Ha'atafu (Tonga), all of the partnerships had been
established during the 1990s. Since the presence ofan external partner was used as a criterion in site
Open Access vs. Restricted Access - The Case of selection, it is not possible to draw conclusionsHoniara Fishing Village and Naro regarding the prevalence of partnerships in the study
The fishing village in Honiara is a typical open-access countries. It was observed, however, that partnershipssite while Naro, another study site on the same island, is were not common in Fiji but were widespread ina more typical Melanesian community with a restricted Samoa (government-type partnerships) and Palauaccess regime. The two villages differ considerably in (NGO-type partnerships). Seven external partnerstheir degree of urbanization, commercial orientation, were NGOs (in Fiji, Solomon Islands and Palau),religion, and alternative employment. Nonetheless, seven were government agencies (in Samoa, Tonga,some contrasting features are worth noting: Fiji, and Palau), and one was an individual volunteer
*At Naro, solutions offered to reverse declines in catch (in Tonga).per unit of effort revolved around management, espe-cially effort reduction: "taboo areas", "allow reef to The study was not designed to judge the effectivenessrecover", "bans", 'more effective enforcement and omanagement" were typically cited. At Honiara Fish- of external partnerships, but some insights into theiring Village, many of the solutions offered revolved effectiveness can be gained from comparing the per-around better technology, alternative fishing grounds, ceptions of the community and of the external part-and restrictions on external polluters and vessels. ner on key aspects of the partnerships (Table 1 5):
* Although Naro was more remote than the Honiara * Perceived partnership benefits. CommunitiesFishing Village, there was a greater knowledge ofnational regulations. tended to emphasize short-term, tangible benefits
(such as the US$200 prize awarded to the best. Although Honiara Fishing Village is an unrestricted giant clam circle in Tonga)", while external part-
urban area, residents felt that only 25 percent of the ners emphasized process-oriented benefits, suchharvest was caught by people from outside the vil- as reinforcement of a village's traditional man-lage. Bv contrast, Naro people felt that 40 percent oftheir harvest was caught by outsiders, even though agement efforts. This suggests that if a partnershipthey were regularly excluded from village waters. can produce some short-term benefits to keep theThis could reflect a higher sensitivity of Naro people community interested, longer-term benefits maytowards what they perceived to be a violation of their be more attainable.site rules.
._______________________________________ * Perceived flaws in partnerships. Community per-ceptions of the partnerships flaws frequentlycentered on unkept promises, inadequate con-
Partnership sultation, and slowness in achieving benefits.F ______ Partnership From the perspective of external partners, the
-m a s key failures of the partnerships were villagers
Sites with external not fulfilling their commitments.t * 8,r,)zo < ~~~~~~~~~~~~parterS
,i. 00 , A S . wSites without external * Decision to address the problems. In as.20 .. e,,et, many as half of the partnerships, commu-
, ._._._ __nity representatives believed that the deci-
-) g Ir: !.Sz-et ' /' pX Samoa sion to address coastal management was- -- / 0ji "-/-~ ,&i T r taken by the external partner. Many part-
jif- / t 0, 50 'DC YK-melrA ners, on the other hand, perceived the ini-tiative as coming from the community.
o 100 26o
Tonga A
N~~~o sO I n, v, -.rmter "
Figure 29. Location of Sites with External PartnershipsClam circles involve arranging giant clams in such a way that it
maximizes the potential for fertilization.
38 Voices from the Village: A Comparative Study of Coastal Resource Managemnerit in ihe V,a,ific Islands

Table 15 - Coastal Resource Management Partnerships: Examples of Community and Partners' Perceptions
Decision toAddress the
Perspective Problem Key InterventionsSite in:* from: Taken by: Key Perceived Benefits Key Perceived Flaws Key Threats By External Partner
Fiji Community Both Recognition and support of gilinet ban None Waste from timber mill Establishing a reef conservation area;by the Government; Night diving Community based management planGovernment commitment to assist Sand mining and monitoringin monitoring;
Partner Village Well managed traditional fishing area; NoneNearshore resource abundance increased.
Tonga Community Partner The possibility of replenishing the reefs Village council was not involved Damage to corals due to Introduction of sanctuarywith clams; iron bars used in reef fishingThe US$200 won for best clam circle
Partner Partner Establishment of a clam sanctuary Failure to get the villagers toDemonstration that community can actively maintain the sanctuaryimplement conservation measures
Samoa Community Village An increase in fish abundance in Not fulfilling promise of trochus/ Use of derris root and laundry Production of management plans andthe fish reserve mussel introduction bleach for poison fishing, maintenance of giant clams
dynamiting, small mesh sizesand overfishing
Partner Village Establishment of a fish reserve Lack of community commitment
Solomons Community Unclear Increased awareness Too much talk and no action Night diving, live reef fish Provision of information andAssistance in building eco-tourism lodge Very slow trade, net fishing, garbage, assistance with participatory planningResource increases in taboo areas Unkept promises of visits to the over-population, motorized
village canoes
Partner Village Reef closure More technical support andIncreased awareness information could have beenChanging uses of coastal products givenStrengthened community structuresCommitment to sustainable usePlan for coastline replanting and management
Palau Community Village Maintaining enthusiasm for management Flaws will become evident only in Road construction, outboard Information and advice for theover the long-term; several years when it wili be engine disturbance, establishment of a conservationRekindled enthusiasm for conservation; apparent whether closed area has overharvesting, siltation area; Monitoring and informationChildren awareness recovered dissemination to the community
Partner Village A focal point for cooperation among Conservation objectives andvillagers which transcends community benefits still not definedfractions
* The sites are not identified, since it was not the study's intention to provide comparisons of partnership impact.

* Information Absorption. The study found con- (ii) Category B: These were partnerships where thesiderable differences in the perspectives of com- partner had been asked by the community to helpmunities and external partners regarding infor- with a village management initiative (e.g., themation provided by external partners. At one establishment of a village sanctuary) or for help invillage, for example, the residents said that no emulating a neighboring village's initiative.resource management information had been pro-vided to the village, or at best had been provid- Sustainability can be a major concern in Category Aed to only a few individuals. On the other hand, partnerships. Category B partnerships were usuallythe external partner said that much information associated with a more durable in-country presence,had been provided by way of 1 00 copies of two such as a national NGO or a government agency. Sat-videos, booklets in the local language, and dis- isfaction with Category B partnerships (both by thecussions in churches and schools. At another partners and the communitv) seemed to be pro-site, the partner organized several workshops, nounced. Several villagers commented that having anprovided posters and publications, and provided external 'honest broker' who could be relied upon toseveral long- and short-term consultants to assist give quick and sound management advice was morethe community. Despite these efforts, the resi- important than a more elaborate partnership. Natu-dents' awareness of the partner's objectives rally, this is appropriate when the goals of the partnerappeared to be low. A typical answer was, and the community coincide -category B partner-"something about not killing turtles." Similar ships may not be able to address certain conservationfindings appeared at other sites. The findings needs. It is unlikely, for example, that a communitysuggest that even in small communities, the time would request assistance in restricting cultural tradi-and resources required for full consultation and tions, such as the eating of turtles. For these situa-raising of awareness can be very high. tions, a Category A partnership may be more appro-
priate. Although the time frame required for Category* Introduction of new processes and institutions. A partnerships was much longer than that for Catego-
Study results indicated that it can take a long time ry B partnerships, donors supporting Category A part-for external partners to introduce new processes nerships generally had a shorter funding horizon thanor institutions intended to change the way the national agencies and local NCOs which typicallycommunity operates. In some cases, this process supported Category B partnerships.can exceed the partners' funding horizon.
Findings in this section are consistent with the grow-* Site Threats and Partnerships. Comparison of ing realization in the Pacific Island conservation
partners' interventions with the types of threats community that longer-term funding is needed tofound at the study sites indicated that partners support local marine conservation initiatives. The his-typically operate through community manage- tory of Category B partnerships in Palau and Samoament plans, which may be insufficient to address (where the amounts spent per target village on coastalsome of the external threats (e.g., waste from a resource management assistance can be as low astimber mill, pollution, road construction). Control US$270 per year) also indicates that at sites whereover threats is also a dynamic process. At one the community is willing to take action on coastalstudy site the partner was successful in reducing management, external partners can be effective withone threat, only to have another emerge that the relatively low levels of funding.partnership was unable to address. This suggeststhat management plans need to be kept flexibleto address rapid changes in threats to coastalresources.
Despite the above constraints, all sites with partner-ships perceived benefits to be substantially greaterthan failures.
Overall, partnerships fell into two broad categories:
(i) Category A: These included partnerships wherethe initiative to work at the site was taken by theexternal partner. These partnerships were typical-ly found at conservation sites of recognized inter-national importance.
40 Voices from the Village: A Comparative Study of Coastal Resource Managernent in the Pacific Islands

MARINE SANCTUARIES .>,I_
Marine sanctuaries have received much attention inthe Pacific region. Given the uncertainties involved W in estimating sustainable stock levels in multispecies pTfisheries, many scientists argue that sanctuaries are IV P.preferable to regulations involving specific species orfishing gear. Sanctuaries, the experts argue, allowresources to reproduce and grow undisturbed, con-tributing both to species protection within the sanc- 4 -tuary as well as replenishment of surrounding areas.
Several study countries - most notably Palau andSamoa - have placed high reliance on sanctuaries asa coastal resource management tool. Given thesestakes, some experts worry what will happen if thesanctuaries fall short of expectations. Could faith in Figure 30. A village sanctuary in Upolu, Samoa. The sanctuaryall management interventions dissipate? Are sanctu- boundaries are delineated by wooden stakes.aries seen as an excuse to do little else?
A variety of terms are used in the Pacific to describe It appears that older sanctuaries were created by nation-marine sanctuaries: taboo areas, conservation areas, al governments without much dialogue with nearbyand fish reserves are some of the most common. For communities, whereas the newer sanctuaries werethe purposes of this study, the term "sanctuary" started either by the communities themselves (4 sites) ordenotes a coastal area in which all extractive activi- with the assistance of an external partner (7 sites).ties have been banned for substantial periods of time(Fig. 30). Community perceptions of the impact of sanctuaries
*F i g. 3 0). were generally favorable. The abundance of keyAlthough most of the 14 sanctuaries found at the study species inside sanctuaries was perceived to besites were established in the last five years, one sanctu- increasing (Table 16). Negative trends were men-ary dated from 1956 and another from the mid-I 970s. tioned only in two relatively older sanctuaries in
Table 16. Summary of Communities' Perceptions of Sanctuaries at Study Sites
Years Since Introduced Perceptions of Trends in TargetSite Establishment Through Key Species Species Abundance
Ucunivanua 1.2 NGO Partner Anadara, Mud Lobster Improving a littleOther Shellfish: No change
Susui Long ago Village Finfish: closure Large improvement after closurefor one year
Falevai 8 Individual Giant Clam: Improvement after one yearPartner
Ha'atafu 20+ Government UnknownFusi 3 Government Groupers: Improving a little
Other Finfish: Improving a lotGiant Clam: Stable
Satitoa 1 Government Caranx, Mullet, Emperor: Improving a lotSolosolo I Village Finfish: Improving a littleKia 3 NGO Partner Turtles: Improving a little
Trochus, Beche-de-mer, Giant Clam Improving a lotCooksin 3 NGO Partner Turtles, Beche-de-mer, Giant Clam: Improving a little
Trochus, Milkfish: Improving a lotOnne 1 NGO Partner Beche-de-mer, Trochus, Reef Fish: Improving a little
and Village Giant Clam, Lobster: Improving a lotNgiwal 1 Village UnknownKayangel 2 Village Parrotfish: Improving a little (monitoring results)Koror 42 Government Dugong: Declining a little
Trochus: Improving a littleTurtle, Giant Clam, Groupers: Improving a lot
Ngaremlengui 14 Village Dugong, Giant Clam: Declining a littleTurtle: StableRabbitfish: Improving a little
SUCCESS FACTORS 41

Palau. There was also considerable optimism about * Sanctuary Location and Size. Location and sizethe sustainability of sanctuaries. At 10 of the 14 sites appear to be critical to a sanctuary's effectiveness.(71 percent), community members believed the sanc- The closed area needs to cover a substantial parttuary would continue to exist after five years (Fig. 31). of the habitat of the targeted resources. At theCompliance with closed areas was also perceived to same time, many communities are reluctant tobe significantly better than compliance with rules close down their richest fishing grounds. As asuch as size limits or bans on catching certain species result, sanctuaries in many villages were either(Chapter V). very small or were situated in barren areas, under-
mining their effectiveness.
Will the Sanctuary Be There One curious finding was that villagers perceived large5 Years from Now? increases in resource abundance even where it did
not appear to be biologically possible. For example,several respondents claimed that there had been
Yes remarkable increases in finfish in a small sanctuary71 %) Unclear located in a barren sand habitat. This finding was dis-
2 sites cussed with several biologists, who had encountered_14%. similar cases where villagers perceived overstated
benefits from sanctuaries. It appears that part of this0sO, perception may have been caused by curiosity about
Ilite the impact of the sanctuary and, hence, a much clos-N=14sites er scrutiny of the area by the community.
Figure 31. Communities Perceptions of These findings suggest that sanctuaries provide a ben-Sanctuary Sustainability efit that transcends their ecological impact. The pres-
ence of a sanctuary in a community seems to act as acatalyst for increasing interest, knowledge, andawareness of coastal resource management. Abstract
Despite the generally favorable perceptions from the discussions of management may be too sophisticatedcommunities, the study found three issues involving for many villagers, but a visible area in which har-sanctuaries that should be addressed in future coastal vesting is banned seems to provoke thought and dis-management interventions: cussion leading to greater understanding of manage-
ment issues. The study team was told on several• Availability of monitoring information. The study occasions that even if a sanctuary had no impact on
found only a few sites where monitoring records resource abundance, it could be considered success-were readily available to the community, even ful if it increased community awareness of manage-though monitoring had been carried out in most ment issues.cases with the assistance of external partners.When this happens, the value of monitoring as ALTERNATIVE INCOME GENERATIONa way to maintain community support can eas-ily be lost. One of the most common strategies used in the Pacif-
ic to reduce pressure on coastal resources is to pro-• Enforcement. At many sites, poaching was the mote alternative sources of income (AIGs). This strat-
main reason for community discussions on egy is based on the assumption that much of thewhether a sanctuary should continue to exist. A overexploitation is caused by a need for cash andtypical attitude was that, "community X is poach- food, and that communities would harvest less if theying, so why should we ban harvesting so that had other ways to generate income. Income generat-community X can benefit"? At several locations, ing programs introduced for the explicit purpose ofparticularly where large sanctuaries had been alleviating pressure on coastal resources were foundestablished, there was an expectation that the at 18 sites (58 percent of the total). They includedsanctuary would be opened up once resources aquaculture (10 sites), tuna fishing (10 sites) and deepwere replenished. In one village in the Solomon slope fishing (10 sites), with some sites having moreIslands, this led to feelings of disappointment andan increase in poaching when an external partnerwas perceived to have failed to keep a promise toopen up the sanctuary. ~' Lessons of experience from other regions indicate, however, that
occupational mobility among traditional fishers tends to be low(R. Polinac, personal communication).
42 Voices from the Village: A Comparative Study of Coastal Resource Management in the Pa(itis Island.

than one activity. Tourism, farming, handicrafts, and most of the benefits went to the most affluent com-infrastructure work were also found at various sites, munity members, since ownership of a large boat wasbut in general these were not introduced as a coastal often a prerequisite for participation in the program.resource management strategy. Table 1 7 (see nextpage) shows the community perceptions of the three Deep Slope Fishing. Promotion of deep slope fish-most common alternative income programs. eries in the Pacific started in the early 1 970s through
the efforts of the then South Pacific Community (SPC).Aquaculture. For the most part, the benefits of aqua- Much of the promotion was carried out through fish-culture programs were perceived to be poor (Box 8). eries centers, which provided ice, fishing gear, and aSix out of ten communities with such programs marketing venue for the catch. Of the ten study sitesbelieved that aquaculture had brought no significant where deep slope fisheries had been introduced,benefits. None of the communities perceived aqua- respondents at three said that there was a moder-culture to have reduced exploitation of coastal ate/substantial reduction of exploitation of coastal
resources, while six perceived no significant impact.Box 8. Introducing Aquaculture as an Alternative Villagers at three sites said the ice plants introducedSource of Income: the Example of Fusi, Samoa to support deep slope fishing had actually intensified
exploitation of coastal resources because the iceenabled villagers to market their catch in distant
Fusi Village was fortunate to have been the recipient of urban markets.many aquaculture projects over the years: they includ-ed green mussels (1984), Pacific oysters (1986), and Respondents were also asked whether fishers wouldgiant clams (1996). FAO (1992) noted that the lagoonnear Fusi had "considerable potential for bivalve cul- be willing to change their occupation, as a mecha-ture." During the survey the study team assessed the vil- nism for reducing pressure on coastal resources. Atlage's market access and found that it was quite easy to 14 sites (80 percent of the total), respondents saidmarket perishable products. Fusi also received solid they would be willing to change if the alternativetechnical assistance during these efforts. occupation offered better income. Asked whether
Despite allthese favorable conditions, Fusi residents feel they would be willing to change to non-fishing occu-that the results have been disappointing. The study pations, respondents at 10 sites responded affirma-team asked several groups in Fusi about the benefits of tively (Fig. 32). However, there were substantial dif-past aquaculture efforts. The replies indicated that there ferences across sites and countries. At sites wherewere very few or no benefits to date. This raises ques- there was a strong reluctance to change, villagers saidtions as to the impact of similar aquaculture projects inother sites with less favorable conditions. that fishing was a hobby which provided both cash
and food, unlike other forms of employment.
resources, while two communities said it was too In answer to questions about the best alternativeearly to tell. Several respondents said that the prob- income programs to alleviate pressure on coastallem with subsistence-type aquaculture was the large resources, villagers mentioned agriculture (6 sites),amount of work required relative to fishing. Com- carpentry/carving (3), tourism (2), handicraft produc-mercial aquaculture operations were frequently per- tion (2), aquaculture (2), fishing, eco-forestry, sports-ceived as facing difficulties with marketing their fishing, and government jobs (1). Palau accounted forproducts. three of the sites where alternative income programs
were perceived as relatively successful. All of theseTuna Fishing. Pacific Island tuna stocks are generally three sites benefited from multiple income opportuni-believed to be abundant. Thus, deep tuna handlining, ties in tourism, farming and construction. Evenlong-lining, and fish aggregation devices (FADs) to though the sample is small, these results suggest thatfacilitate artisanal tuna fishing have been commonly a broader range of income opportunities may need tointroduced as alternative income generation pro- be explored in any future alternative income genera-grams. At six of the ten sites where tuna fishing had tion programs".been introduced, villagers perceived no significantreduction in pressure on coastal resources. At twosites, however, it was felt that there had been a mod-erate to substantial reduction, in part due to the avail-ability of tuna by-catch sold at the village level. In theview of villagers at one site, the new artisanal tunafishery did not necessarily divert much effort awayfrom coastal areas, because the crews on the new Lessons of experience from other regions indicate, however, thatvessels were not coastal fishers (they were said to be occupational mobility among traditional fishers tends to be lowfarmers or mechanics). There was also a feeling that (R. Pollnac, personal communication).
Suc(Iss FACTORS 43

Table 17. Community Perceptions of Impact of Key Alternative Income Generation Schemes
Sites AQUACULTURE DEEP SLOPE FISHING OFFSHORE FISHING
Was Coastal Resource Was Coastal Resource Was Coastal Resource
Type Benefits Extraction Reduced? Benefits Extraction Reduced? Type Benefits Extraction Reduced?
1 Seaweed Very little Not significantly2 4 boats now involved Moderately - snapper now FAD Only a few trips
in deep slope tishing makes up most of the 4 isnre made by people Not significantlyboats'catch from this village
3 I sLUhsidi7ed vessel; 2 Substantially -vessels now use thetechnique
4 Ciant (lam Irip to workshop; Too early to determine Income for 2 fishermen Moderately FAD N/A Moderate reduction during21.0 free baby clams; good weatherToo early to judgeother benefits _
5 Green mussels None Not significantly rAlia tuna N/A N/APacific Oyster boatsGiant Clam
6 Giant Clam None yet Too early to determine Employment, some food Some but not great because Alia tuna Employrnent/Food Not significantlydeep slope fishermen were boats;former farmers FAD
< 7 Alia tunia Frnployment/Food Substantially: all by-catch soldboats in village
8 Giant Clam None (all clams died N/Awithin two weeks)
9 FAD Occasional fishing by Not significantly because thet8 of 2 5 motori7ed canoes which fish aroundvillage canoes FADs would fish in offshore areas
1 0 Seaweed None Not significantly11 Giant Clanm None Not significantly Availability of ice Ice has increased opportunity to FAD FAD lasted only N/A
market coastal products in urban ofne weekareas, so effort on coastal resourcesmay have increased
12 Availability of ice allows Not significantly as villagers mustfor inarketing of fresh fish share a vessel and fishing groupsin urban area must wait up to one year for
_ __ ! their turn13 G iant Clam Cash Not significantly N/A Not significantly
2 Corals
> 14 _ _ No benefits Notsignificantly i
15 Shrimp Shrimp -US$39(0 Not significantly Tuna Techniques learned still Not significantly -only smallMilkfish trom 3 harvests trollirng used todlay amount of tuna trolling at presentGiant Clam Giant Clanm None
1 6 Training in deep slope May have increased pressure on Tuna/ Training in bottomiish May have increased pressure ontechniques; coastal resources as the ice intended Bottomfish Techniques; coastal resources as the iceAvailability of ice for tuna/bottomfish can now be used f Center Ice availabilitv intended for tuna/bottomfish
3 ; or coastal resources can now he used to marketcoastal resources
17 Giant Clam N/A N/A18 _Training, some income Not significantly because during u Unspecifiedi Training, some income Not significantly because during
easterly winds it is too rough to fish offshore easterly winds it is too roughoutside the reef fishing to fish outside the reef
w; FADs - Fish Aggregation Devices; Alia -type of tuna boat in Samoa. N/A Response not provided.

Would Fishers be Willing to Change their Box 9. Can Communities RestrictOccupation away from Coastal Resources? Their Own Harvesting Effort?
Many residents in Susui, a village in the Lau IslandsYes group (eastern Fiji) perceive excessive local fishing
14 sites) effort to be a major problem. Overfishing by Susui vil-lagers was the major reason cited for declines in shell-fish, finfish and beche-de-mer. The village leadership
No * I i _ authority appeared intact, the quality of leadership was\ 0 | ~(] site) perceived to be high, and all six focus groups inter-
viewed appeared to be aware of the benefits of coastalresource management. Despite these favorable condi-
Not sure,' tions, none of the indigenous rules addressed locali=1 7 sit~~ (2 sites) effort restrictions.
N=1 7 sites
Restricting local effort can be difficult for socio-econom-Would Fishers be Willing to Change their ic reasons. Some communities, however, are willing toOccupation to a Non-Fishing Alternative? make this sacrifice for longer-term gains. For years,
Ontong Java in the Solomon Islands imposed alternatingbans on beche-de-mer and trochus. During the visit to
o(4 Tel Luaniua Village in Ontong Java (Solomon Islands), thestudy team was told that this scheme had been suspend-ed indefinitely for a variety of reasons. The study teamoffered its opinion on the desirability of the scheme and
Yes / avbe/, spoke about its benefits during a wrap-up meeting0 sites depends attended by community members. In late January 1999,
_ _ (3 sites)) l the team learned that Luaniua Village had not only rein-stated the management regime, but placed a two-yearban on harvesting both trochus and beche-de-mer.
N=14 sites
Nine sites appeared to be actively enforcing restric-Figure 32. Community Perceptions of tions to reduce local harvesting effort. Their key char-
Occupational Alternatives acteristics are summarized in Table 18. The sites had
two fairly frequent characteristics: the presence ofLIMITATIONS OF COMMUNITYBASED external partners (6 sites) and large fishing grounds (3MANAGEMENT sites). This suggests that the presence of partners may
serve as a catalyst for community action."5 There wereThe experience of Pacific Island countries with cen- only three sites where the community restricted itstrally based coastal resources management, as men- own harvesting effort without the presence of exter-tioned earlier, has been poor. There is a growing con- nal partners (Galoa, Luaniua and Naro). Those sitessensus among experts that much of the management differed in many ways, but they shared a high quali-needs to be carried out by local communities. Others ty of leadership and, with the exception of Naro, aargue, however, that reverting to old systems of com- heavy dependence on coastal resources.munity management may not be possible because ofchanging conditions. Observations at the study sites Table 18. Study Sites Enforcing Management Rules toshed some light on the potential limitations of com- Restrict Local Fishing Effortmunity management and may help to identify areaswhere external help IS most neededu. St ehrceitc
wucunivanua Very large site, external partnerMany communities do not appear to be effective in Galoa Very large site
Many communities do not appear to be effective in Nakawaqa External partnerrestricting their own harvesting effort. Overfishing Solosolo very small site, substantial formal employment,was one of the key threats to coastal resources iden- external partnertified at the site level, and was the most frequently Luaniua Very large site, few cash income alternativesgiven reason for harvest declines. With the exception Naro Relatively low dependence on coastal resourcesof open access sites and sites where indigenous rules Onne External partnerNgiwal External partnerwere made by leaders external to the village (e.g., Kayangel Moderately large area, external partnerhigh chiefs in Fiji), most communities had adopted NIA-Not avaiablemechanisms to restrict outsiders from their coastalwaters. However, 12 villages (39 percent) lacked anyrules dealing with restrictions on local fishing (Box 9).
SUCCESs FACTORS 45

Some threats cannot be addressed solely by local Communities may need technical back-up. Indige-communities. It was seen before that in a third of the nous Pacific Island communities possess a wealth ofstudy sites (10 sites), the majority of the threats to knowledge about their coastal resources which pro-coastal resources could not be addressed solely by vides the basis for local management decisions.the community (Table 6, Chapter V). Even in sites However, they may lack access to recent biologicalwhere most of the threats could be handled locally, findings which could assist them in improving localthere were particular threats that were perceived to management - for example, how long trochus lar-require outside help. These included logging, silta- vae float before settling, a factor that is important intion, infrastructure developments such as roads, the establishment of trochus reserves. At several sitescauseways and dredging, various forms of pollution, there was eagerness to learn more about the techni-and poaching by outsiders. It was also mentioned that cal aspects of management, such as in Satitoamany communities did not appear to be dealing (Samoa), where women groups asked the study teameffectively with threats that ordinarily could be han- to inform them on how best to restore an importantdled at the community level. In general, this situation invertebrate resource. The provision of expert advicewas found (i) in open access areas lacking indigenous also could be important to sites where local beliefsrules; (ii) where new threats were rapidly appearing; can be detrimental to management, such as in(iii) where rules were made by chiefs whose authori- Ha'atafu (Tonga), where several residents erroneous-ty covered several villages; and (iv) where the per- ly claimed that the more beche-de-mer was harvest-ceived threats to one group in the community bene- ed, the more it grew.fited another group in the community.
Increasing commercialization can lead to conflict ofThere are uncertainties about the legal status and interest when village leaders become direct benefi-enforcement of customary laws. At several sites, par- ciaries. As seen earlier, commercial operationsticularly in Fiji and in the Solomon Islands, village appeared to be responsible for much of the conflictleaders complained that there was little they could do within the communities. It was observed at severalto punish offenders within the village. Social sites that commercial enterprises which normallyostracism may have been effective in the past, but its would have been restricted by local managementeffectiveness seemed to have declined in recent were able to circumvent the rules by formingtimes. Although customary law is recognized in many alliances directly with village leaders. Because thesePacific Islands, it is usually allowed if it does not con- enterprises were relatively new, many communitiesflict with national law, and there are uncertainties seemed to lack ways to prevent conflicts of interestabout whether punishments such as physical beatings between the leaders' management responsibilitiesand property fines are consistent with national laws, towards the community and their business interests.which require due process."
The study findings indicate that further efforts may beIn the isolated villages of Niu and Onne in the needed to both catalyze community action and toSolomon Islands, the study team was told that nation- assist communities in their management efforts.al laws were easier to enforce than indigenous rulesbecause of the existence of a court system. In othersites (e.g., Kia) there was a heavy reliance on policefor enforcement, rather than traditional village insti-tutions. At several sites in Fiji, constraints on theenforcement of village rules appeared to have a neg-ative effect on the effectiveness of local management.Palau did not appear to have the same problembecause of a close correspondence between "com-munities" and "states," and the status accorded tostate rules. In Samoa, it appears that national recog-nition of village by-laws has helped to make localenforcement effective, but many indigenous rules donot have by-law status and may conflict with nation-al laws. This problem was not found in Tongan sitesbecause of the absence of indigenous rules.
For an examination of this subject from a legal perspective, seePulea (1 993).
46 Voices from the Village: A Comparative Stud' of Coastal Resource Management in the Pacific Islands

ARE COASTAL RESOURCE MANAGEMENT If this observation holds true through future research,OBJECTIVES BEING MET? the information needed for site management can be
seen in a different light. Although considerable effortIt is often argued that the objectives of coastal has been devoted to quantitative stock assessment inresource management and conservation programs in the Pacific, an examination of the 97 local manage-the Pacific are to optimize benefits from resource use. ment rules found at study sites revealed no obvious
cases where they would not have been adopted with-This was not found at the study sites. Although the out such research. Rules on minimum size of trochusgoals of community-based management were rarely may be the exceptions. This indicates that lack ofexplicitly stated, they tended to be much more basic: complex stock assessment work may not be as muchpreventing further decline or the collapse of impor- of a constraint to coastal resource management in thetant resources, preventing habitat degradation Pacific as previously believed. Perhaps more urgentthrough control of destructive fishing techniques, and are efforts to further understand the socio-economicconserving endangered species. The political will, incentives affecting coastal resource management atmanagement tools, and social context of the 31 sites the local level, complemented by simple and welldid not appear to be anywhere near capable of targeted ecological research with direct managementachieving objectives that revolved around yield opti- application. This finding may have implications formization. future coastal management work in the region.
SUCCESS FACTORS 47


Vil. Key Lessons Learned
"Our children will find it difficult to support daily needs" (Nakawaga, Fiji)"If regulations are enforced (resources) will improve,otherwise continue to decline" (Tu'anekivale, Tonga)
"All gone... " (Kia, Solomon Islands)
"If present rate of depletion persists, there will be noresources in 10 years" (Koror, Palau)
"With conservation efforts on sanctuaries and bans ondestructive fishing, things should get better" (Satitoa, Samoa)
KEY LESSONS LEARNED What Will be the Resource Trends in theNext Ten Years?
This study sought to address a number of questionsrelevant to the management of coastal resources inthe Pacific Islands: What are the community percep- DellItions of key ecological trends? What are the factors /most likely to affect site management? What are thelimitations of community-based management and Decline
where is external assistance most needed? The study W 7
also examined the relevance of national legislation tocoastal communities, and the perceived effect of part-nerships, marine sanctuaries and alternative incomegeneration programs at the site level. These are com-plex issues for which a definite answer cannot beobtained without further research. However, a nurm- Figure 33. Community Perceptions of Future Trendsber of lessons can be derived from the study which for Coastal Resourcescan help guide future efforts in coastal resource man- areas adjoining urban centers and densely populatedagement in the Pacific. villages are generally overexploited, coastal
resources at isolated sites are still sustainable.P7 TheCommunity groups in general perceived coastal community perceptions obtained through this studyresources to be declining. The quotations shown challenge the view that coastal resources in isolatedabove were extracted from survey questionnaires and locations remain healthy. Several sites whereillustrate how villagers viewed the future of their resource trends were perceived to be worsening werecoastal resources. They also reflect one of the most relatively isolated and had low population densities.important findings of this study: in general, commu- This suggests that the impact of a few efficient com-nities believed their resources had declined over the mercial fishers on the exploitation of fragile coastalpast ten years. Moreover, some 21 of the 31 sites (67 ecosystems should not be overlooked.percent) believed that coastal resources would con-tinue to decline in the future in the absence of strong Communities perceived very few recovering trendsinterventions (Fig. 33). In the midst of this somber that were related to management. The study teamoutlook there was, however, an element of hope: five found surprisingly few examples where perceivedout of six sites in Samoa believed that resources improvements in coastal resources were associatedwould improve because of recent management with management interventions. Where this was cited,efforts. This holds some hope that with immediate it involved the prevention of destructive practices, sanc-interventions, the perceived decline of coastal tuaries, controls in harvesting of particular species, andresources in the Pacific Islands can be contained. bans on external fishers.
Some coastal management experts and policy makers For further discussions on coastal resource status and populationin the Pacific believe that while resources in coastal pressures, see Adams, Daizell and Farrnan (1997).
KEY ISSUES 49

Few national regulations were seen to be relevant at The most effective external partners play the role ofthe local level. The study found that communities honest brokers. Partnerships between communitieswere not familiar with many of the national rules and external institutions assisting them in the man-designed to manage coastal resources. In general, the agement of coastal resources appeared to be mostsimpler and clearer the national regulations, the more effective where the external partner played the role oflikely they were of being followed at the local level. an honest broker, providing technical expertise onRules enforced by buyers/exporters were also per- demand and building upon existing institutions andceived to have high compliance. A surprising finding processes. External partners seeking significantfrom the study was the perceived high compliance changes in these processes may need to remainwith national rules adopted locally rules by tradition- involved for longer periods than would normallv beal leaders. These rules were perceived to have better supported by donor financing.compliance than either purely national or purelylocal rules, pointing to the need for outreach and Most alternative income generation programs wereawareness programs targeted at local leaders. not perceived to be successful. The study findings on
alternative income generation suggest that programsSome threats were perceived to be rising faster than focussing primarily on fisheries and aquaculture alter-others. Overall, communities perceived pollution as natives have not been successful in reducing pressurethe fastest growing threat to coastal resources, while on coastal resources. In some cases, the introductiondestructive fishing was perceived as having declined of ice plants to assist offshore and deep slope fisheriesthe most. Overfishing, destructive fishing, pollution, appears to have opened up new markets for coastaland siltation -in the Solomon Islands and Palau - resources. This suggests that should there be futurewere perceived to be the most important threats to efforts to create alternative income generation pro-coastal resources at the study sites. grams, a wider range of income opportunities outside
the fisheries sector should be explored.Communities need external help. The fact that land-based threats and commercial fishing (another fast- Open access constraints community action. Openrising threat) cannot for the most part be handled by access regimes seemed to severely constrain localcommunities alone leads to an inescapable con- action. Most open access sites lacked local rules toclusion: communities need external help in man- manage coastal resources and placed a high relianceaging their coastal resources, albeit perhaps of a on government interventions to help alleviate threats.different kind than presently received. At the same Even though compliance with existing regulationstime, the study found that more could be done by the was perceived to be good, study team observationscommunities themselves to restrict local harvesting indicated that resources were heavily degradedand to control local threats. The study also found through overexploitation. When asked what the com-that communities had difficulties enforcing local munity could do to improve coastal resource trendsrules when they were seen to conflict with national in the future, a villager from an open access site gavelaws, and in preventing abuses of authority by tradi- what may be a typical answer: "Nothing. We thinktional leaders. we have overfished the resources and will have to
look at other people's sea resources (we will beCatalytic actions can be effective. The study found forced to steal other people's reefs)."several examples where catalytic processes wereeffective in triggering community action: marine What are the external factors most likely to supportsanctuaries seemed to play an important role in site management? Even though no definite conclu-increasing community interest and awareness in sions could be reached, the study provided somecoastal resource management. The crocodile ban in indications of the type of national programs that maythe Solomon Islands also appeared to have increased be needed to support community-based managementlocal awareness of coastal management impact. Sev- of coastal resources: simple and clear national regu-eral villages in the Solomon Islands reported that lations, an enabling framework facilitating the adop-because the crocodile ban had been so successful, tion and enforcement of local rules, assistance tothey now saw the advantages of using bans for other communities on demand on the technical aspects ofmarine resources. Visits by external coastal manage- resource management, and further inter-sectoral col-ment experts seemed also to be an effective way to laboration among government agencies andconvey ideas to the communities in a different way upstream communities to address land-based threats.than their usual interaction with external partners.Finally, the presence of external partners seems to What are some of the most relevant site characteris-have acted, at some sites, as a catalyst for communi- tics? The study findings could help guide regionalty efforts to restrict their own harvest. and national coastal resource management programs
seeking to prioritize site interventions. If the objective
:,() Voices from the Village: A Comparative Study of Coastal kesource Management in the Pacific Islands

of the program is to target sites with the most urgent few conflicts caused, for example, by surroundingneeds, priority should go to areas which are resource- settlements or an unequal sharing of the benefits ofpoor (e.g., isolated atolls), highly dependent on commercial resource exploitation.coastal resources, and subject to the severest threats.
What are some of the processes most conductive toNational programs could have different goals, how- successful management?Among management process-ever. If the objective is to select sites with the greatest es, the capacity of the community to regulate its ownchances of success, priority should be given to sites harvesting effort and effective local enforcement seemwhere there is high natural resilience to ecosystem to be among the most important determinants of per-degradation and fewer external threats (in particular, ceived management success. This suggests that a keythreats which cannot be controlled at the site level). element of external interventions should be programsKey socio-cultural criteria might include the presence aimed at raising the awareness of local leaders of theof wise and respected traditional leaders and some need for and benefits of local effort reduction. Thedegree of awareness of the benefits of coastal emergence of new threats also calls for flexible andresource management. To the extent possible, the adaptive management systems capable of handlingsites should benefit from restriction of access by out- threats as they arise.siders to the village fishing area. There should also be
Table 19. Examples of Community Recommendations for Future Actionto Improve the Status of their Coastal Resources
Country Recommendations
Fiji Better enforcement of existing regulationsStop issuing licenses to outsiders (commercial fishermen)Moratoriums (especially for shellfish) and bans on specific resources (except for subsistence)Bans on destructive practices, night diving and compressorsAlternative income generation and better education for children to increase job opportunitiesSet up marine reserves
Tonga Enforce national regulationsStop destructive fishingPartition coastal areas into village zones; Close traditional areas to outsiders and give villagers authority to make localrules; outsiders can keep user rights but subject to village regulationsAwareness programs of the benefits of the laws and impact of destructive fishing practicesRestrict quantities harvestedImpose seasonal bans and closuresStop or reduce fishing in inshore areas
Samoa Enforcement of village rules and heavy penaltiesIncrease severity of penalties especially for outsiders/poachers; Village council should amend penalties to be a littlemore severe: e.g., 40-50 sows for violation of village marine rulesStrengthen village councilsEnforce and restrict destructive fishing practicesReduce harvestingSet quotas, size limitsEncourage alternative income generation (in tourism)
Solomon Islands Set aside more conservation/taboo areas; enforce tabu areas strictlyBan important species (e.g. trochus, beche-de-mer) for 1-2 years, or even as long as 3-4 yearsLengthen periodic closures (up to 5-10 years); open only to subsistence fishingBan commercial sales of important species;Alternate bans and impose seasonal closuresSet quotasDevelop alternative sources of income (land based)Keep outsiders out
Palau Establish more conservation areasEstablish and implement bul (taboo) systemProtect nursing, spawning aggregation sitesBoats should have designated passages to avoid damaging important habitatsSeasonal restrictions and bansLimit exportsMore awareness programs for both locals and foreignersProhibit non-Palauans from fishing around the reefReinforce focus on pollutionEnforce size limits; ban gill nets; stricter enforcementReseed clam areas and develop mariculture
Most frequent recommendations in bold.
KEY ISSUES

GENERAL RECOMMENDATIONS 2. Integrate coastal resource management withmanagement of activities on land. The study
The recommendations made by the communities indicates that coastal resource management inthemselves to improve the condition of their coastal the Pacific Islands cannot be treated solely as aresources were revealing. In village after village, peo- fisheries management issue. Several of the keyple whose livelihood depended on exploitation of threats are land-based: infrastructure develop-coastal resources argued for stricter enforcement of ment, pollution, and deforestation all affectexisting rules and additional regulations to limit har- coastal resources in ways that neither the localvesting. In some cases, the call for stricter action communities nor fisheries or environmentalcame from traditional gleaners who viewed commer- agencies can control on their own. Lack of cohe-cial harvesting as threatening their subsistence needs. sive coastal use policies among the responsibleMore generally, the recommendations seemed to institutions also constrains their effectiveness.reflect a wish to subordinate the individual needs of There is an urgent need for government institu-the most efficient and destructive operators for the tions with different responsibilities over coastallong-term benefit of the community (Table 19). areas to collaborate with local communities in
responding to the intersectoral nature of theseThe adoption of extended bans on fishing for trochus coastal management challenges. Donors andand beche-de-mer by Luaniua (Ontong Java), a vil- other external partners should also recognize thatlage in the Solomon Islands which depends on a narrow sectoral focus is unlikely to meet cur-coastal resources for 70 percent of its income, shows rent needs.that communities can be willing to make large sacri-fices for long-term benefits if thev are aware of the 3. Target national legislation more closely to localbenefits of management and have strong local lead- needs. The effectiveness of national coastal man-ership. In general, however, communities could be agement legislation could be improved by:doing more to regulate their own harvest and managelocal threats. Purely centralized or purely communi- * Campaigns to disseminate national rulesty-based systems are unlikely to succeed in address- more broadly to traditional decisionmakers;ing the challenges facing coastal resources in thePacific. Rather, co-management systems capitalizing * A supportive legal framework to encourageon each partner's comparative advantage are likely to community leaders to adopt relevant nation-be needed. The recommendations which follow sug- al legislation as village rules, e.g., in the formgest ways where external interventions could be bet- of by-laws;ter targeted to support and strengthen this approach. * Further enactment and effective enforce-
ment of buyer/exporter enforced rules,1. Restrict harvesting effort. The study indicates which appear to have high compliance at
that overfishing is one of the most important the local level;threats found at the study sites. This problem isonly likely to worsen in the future and cannot be * Legal experts assisting governments inaddressed solely through enforcement of current reviewing national management rules shouldlaws. Steps should be taken to the increase the pay careful attention to ensure that the rulescommunities' ability to regulate fishing effort. are simple and understandable at the localThis may require: level. Consultation with village leaders and
resource users could help tailor these rules* Raising the awareness of traditional leaders more closely to community needs. Lessons of
about the benefits of regulatory measures to experience from previous legislative reviewsrestrict or ban certain types of commercial and perspectives other than from officials ofoperations; the national government should also be
obtained.* Provisions in national legislation which per-
mit greater control over the level of commer- 4. Support collaborative and stronger enforcement.cial harvesting effort, such as restrictions on Study results indicate that compliance with man-the number of commercial licenses; agement rules depends on the existence of effec-
tive deterrents for violations. It is recommended* Imposing point-of-export or point of collec- that national governments support collaborative
tion restrictions on traded coastal resources enforcement with lower levels of government and(e.g., trochus processing factories); and community leaders. It is also recommended that
coastal managers help publicize successful prose-* Judicious creation of marine sanctuaries; cutions and associated penalities.
52 Voices from the Village: A Comparative Studv of Coastal Resource Management in the Pacific islands

5. Increase management assistance to coastal com- account traditional structures and local sys-munities. While there is growing recognition of tems of governance.the value of community-based coastal resourcemanagement, the level of support provided by 6. Promote sound external partnerships for coastalgovernment agencies does not appear to be suffi- resource management. The study revealed acient to meet the needs of coastal communities. It number of characteristics of good external part-is recommended that fisheries and environmental nerships which should be considered in futureagencies realistically appraise the present level of programs:assistance to coastal resource management inview of the urgent need to reverse current trends. * A long-term commitment by the externalThere should be a recognition that, in many partner to work with the community;cases, what is needed is an "honest broker"arrangement in which the communities can * The provision of information to the commu-obtain quick, impartial, and sound technical nity in many different forms as a central fea-advice. Such short-term assistance, combined ture of the partnership;with awareness raising, appears to be the mosturgent needs at the present time. Accordingly, it * An efficient administrative support;is recommended that fisheries and environmentalagencies establish programs to give coastal com- * Reliance by the external partner on indige-munities periodic management-oriented visits nous institutions and processes to the greatestand/or advice through appropriate media (e.g., extent possible;radio).
e Production of tangible benefits early in the* National government agencies should help collaboration;
prioritize external donor assistance for com-munity initiatives in coastal resource man- * Promotion of solutions which are technicallyagement. Donor assistance should be tied to and financially sound;encouraging a long-term government com-mitment to community assistance rather than * Partner efforts to act primarily as a catalyst forbeing seen as freeing up government community-driven decisions.resources to be used for other purposes.
7. Promote marine sanctuaries. The study found* In general, environmental agencies have good reasons to promote a greater use of marine
more experience in community-level coastal sanctuaries in the Pacific region, given both theirmanagement work and in attracting the inter- perceived impact on conservation and their cat-est of external partners. Conversely, fisheries alytic role in generating community interest indepartments are more involved in actual coastal resource management. However,coastal resource decision making. There is resource users should understand that creating aclearly a greater need for fisheries, environ- sanctuary does not eliminate the need for othermental, and other relevant departments to management interventions. The following con-collaborate more closely in supporting com- siderations should be taken into account in estab-munity needs. lishing marine sanctuaries:
* There is a need to develop stronger incen- * All stakeholders should have a clear under-tives for government provision of manage- standing of the sanctuary's objective and howment assistance. The work of coastal exten- long the sanctuary is to remain closed;sion workers should be sufficientlyrecognized and rewarded. * All resource users should be made aware of
the realistic benefits that can be expected* The importance of regional organizations from a sanctuary as well as the time frame for
should not be overlooked. More efforts could these benefits. Exaggeration of the benefits isbe directed at coastal resource management likely to be counterproductive in the longassistance, which appears to receive less term;donor support than aquaculture, for example.The International Waters Program coordinat- * The community should understand that ben-ed through SPREP would also be a good efits of a sanctuary are related to its size andopportunity to develop a Pacific solution to location. It is unlikely, for example, that aintegrated coastal planning which takes into small sanctuary placed on a sandy habitat
KFY ISSUES A s

will produce substantial increases in resource COUNTRY-SPECIFIC RECOMMENDATIONSabundance;
Fiji* Poaching can undermine community support
to keep a sanctuary closed. Therefore, sur- * It is recommended that Fiji reactivate buyer/veillance and enforcement of strict "no-take" exporter enforced rules, given their perceivedrules are crucial to a sanctuary's viability; effectiveness in Palau and the Solomon Islands;
* The results of ecological monitoring are * To the extent possible, the strengths of the Fijianimportant in ensuring continuing community chief system should be built upon. Communitysupport for the sanctuaries, if they can leaders should be sensitized to the benefits ofdemonstrate increases in resource abun- important national legislation on coastal resourcedance. Steps should be taken to ensure that management and encouraged to promote itsmonitoring records are made available to adoption at the community level.resource users.
* National authorities should emphasize the impor-8. Use alternative income generation programs tance of community restrictions on local harvest-
cautiously. The study found that alternative- ing effort. Conversely, local communities mayincome generation programs relying on aquacul- need help in controlling the issuance of licensesture, offshore fishing, or deep-slope fishing have to external fishermen.not, in general, been successful in reducing har-vesting pressure on coastal resources. It was also * The honorary fish warden system allowing spe-noted that several of the more successful external cific community members to carry out preven-partners did not provide alternative income as tion, detection, and enforcement of fisheries lawspart of their assistance to the communities. This should be further enhanced.suggests that should future alternative incomegeneration programs be supported, they may Tonganeed to take a broader look at the range of poten-tial income opportunities available to the com- * One recommendation overshadows all others.munity (including, where appropriate, tourism, The failure of centrally-based management,user fees, agriculture, retailing). Past experience together with the urgent need to prevent furtheralso suggests that alternative income generation declines in coastal resources, indicate that aprograms should be directly linked with site man- change from the present open access system isagement, rely on existing marketing channels, needed. Giving communities the ability to restrictand take into account the occupational patterns outsiders from fishing in inshore areas and toand business capacity of the target beneficiaries. adopt local management rules consistent with
national regulations would provide a powerful9. Conservation programs. Many of the preceding incentive to conserve resources in the future.
suggestions are relevant to marine conservationprograms in the Pacific. Two additional recom- Samoamendations are offered:
* Assistance to the establishment of new sanctuar-* The study found that perceived compliance ies should consider their appropriate placement
with turtle regulations was very low. It is rec- and dimensions, in order to minimize any dis-ommended that a detailed review of success- crepancies between the communities' expecta-es and failures in turtle management be con- tions and the likely ecological benefits of theducted, from both an historic and regional sanctuaries. Sanctuary monitoring should alsoperspective. seek to distinguish between the impact of recent
management interventions and natural cyclone* Communities perceived coral reefs, inter-tidal recovery, as there is a risk that lack of perceived
areas and lagoons as among the most threat- improvements in resource abundance couldened of the coastal habitats. Should this find- undermine future community support for sanctu-ing be supported by future ecological sur- aries.veys, priority attention should be given to themanagement of these habitats. * Care should be taken to integrate externally-
sponsored coastal management projects into thework programs of government departments.
54 Voices from the Village: A Comparative Study of Coastal Resource Management in the Pacific Islands

* An effort should be made to develop a national is recommended that additional governmentpolicy on coastal resource management, to har- resources be channeled to coastal resource man-monize village fisheries management plans, agement programs and that government agenciesestablish guidelines for marine protected areas, be encouraged to play a stronger role in coastaland enact village by-laws. resource management;
* Since destructive fishing appears to be worse in * In accordance with community recommenda-Samoa than in any other of the countries sur- tions, there should be greater reliance on tradi-veyed, consideration should be given to stronger tional closure systems (but, and greater protec-enforcement of penalties for their use. tion of important spawning and nursery grounds.
The impact of motor boats on coastal habitatsSolomon Islands should also be minimized by restricting the zones
where the boats are allowed to pass.* Given the perceived level of resource degrada-
tion, it is recommended that a major effort be SUGGESTED AREAS FOR FUTURE RESEARCHundertaken to encourage communities to adoptnew local rules, such as enforcement of taboo A number of areas for future research are suggestedareas and periodic fishing closures for certain by the study:species or areas.
* Comparison of community perceptions with* National regulations should be publicized more ecological assessments of coastal resource sta-
widely. tus. While an understanding of community per-ceptions is essential for national coastal resource
- The importance of coastal resource management management policies, they do not necessarilyshould be recognized in the work programs of the reflect the real status of coastal resources at a par-fisheries and environmental agencies, and ticular site. It would be important to complementnational and provincial staff should be encour- the results of this study with a rigorous ecologicalaged to make more frequent visits to coastal assessment across a large number of sites, andcommunities. Activities of donors and non- taken at different points in time. This could servegovernmental organizations should not be con- two purposes: first, it would serve to confirmsidered a substitute for this assistance. local perceptions of regional resource trends; sec-
ond, it would allow a better targeting of aware-- Because in many villages there is the perception ness efforts in sites where community perceptions
that aquaculture is an alternative to coastal were found to differ from ecological reality.resource management, care should be taken todispel that view. * An analysis of the institutional mechanisms to
address land-based threats. A Pacific solution to- Given the impact of land-based threats on coastal integrated coastal zone management is urgently
resources, it is recommended that efforts be made needed to address land-based threats to coastalto involve government agencies, traditional lead- resources. This needs to take into account theers, community groups, and external partners in sectoral structure of most Pacific Island govern-efforts to address their upstream impacts on ments and the nature of donor support.coastal areas.
* Institutional arrangements for co-management.Palau Based on the results of this study, further research
is needed on the optimal arrangements for co-* A clear development policy for the sustainable management between coastal communities and
management of coastal areas in Palau needs to be national governments.developed;
* The feasibility of future alternative income gen-* The roles of the national government, local gov- eration programs. Given the perceived low suc-
ernments, and traditional leaders in coastal cess with fisheries-based alternative income pro-resource management may need to be further grams, there is a need to investigate whetherclarified; income alternatives outside the fisheries sector
remain a viable option to alleviate pressure on* Given community perceptions of rapidly declin- coastal resources in the Pacific.
ing coastal resources and the reliance of thePalau economy on healthy coastal ecosystems, it
KEY ISSUES 55

* Impact of national policies. Further research The present study departed from conventional surveyshould be conducted on the impact of national methods by relying heavily on the perceptions ofpolicies on coastal resource management success. coastal communities. This produced useful insights as
well as some unexpected findings that are relevant to* The impact of population pressure on coastal the management of coastal resources in the Pacific.
resource exploitation. The findings of this study This experience indicates that careful attentionindicate that population pressure may not be as should be given to the views of coastal communities.important a factor in coastal resource exploitation It is those villagers who are dependent on coastalas previously believed. If confirmed, this could resources, who play a major role in the success ofindicate that more attention needs to be paid to management, and who have the greatest stake incontrolling the impact of the most efficient fishers whether the system succeeds of fails.on coastal resources. The study results on thissubject, however, remain indicative and warrantfurther investigation.
56 Voices from the Village: A Comparative Study of Coastal Resource Management in the Pacific Islands

Annex A. Key Lessons Learned in theImplementation of the Study Survey
This study was the first of its type in the Pacific Island Expected. The lack of empirical theory on whichregion. As with any untested methodology, parts of to base a prioritization of success factors was athe survey produced better results than others. The major constraint to the study. It forced the studyfollowing lessons of experience are offered for the team to collect information on a large number ofbenefit of future survey teams. factors, which limited the time available for qual-
itative assessments. The relatively small numberv Lesson 1. Collaboration Among Experts Pays Off. of sites also constrained the analytical ability to
The study relied on collaboration between distinguish between the different factors. Theexperts of many different backgrounds: a region- study was also less successful in analyzing theal team and advisory panel with solid experience impact of policy and process variables on coastalin the region, and a World Bank team with a resources. Finally, some factors - e.g., quality ofquantitative background. Inputs were obtained leadership, social cohesion, traditional knowl-from fisheries experts, anthropologists, resource edge and tenure - were very difficult to captureeconomists, econometricians, biologists, partici- accurately. It is suggested that in the future thesepation specialists, traditional orators, and even factors be assessed through aggregated socio-cul-sports champions, who facilitated discussions tural indices aimed at capturing the multi-facetedwith the communities. At times, the experimental nature of these variables.nature of the survey design and analysis was frus-trating to the study team, but the study would not / Lesson 5: Some Indicators of Success Were Bet-have succeeded without this collaboration. ter than Others. Among the indicators of success,
perceived CPUE trends and threat trends wereV Lesson 2. It Can Take a Long Time to Develop found to be the most reliable. The compliance
the Survey Instrument. Contrary to expectations, indicator had inherent bias problems, but led toit took a full eight weeks to develop the study useful comparisons between different types ofquestionnaire. The initial participation of the management rules. The habitat indicator provid-national experts and community specialists was ed little additional value: in many instances,essential to revise the questionnaire and adjust it respondents perceived habitats as the 'origin ofto field conditions. Even with extensive testing, the resource' and hence their perceptions werethe reliability of some questions could only be similar to those about CPUE. Given time con-assessed after the survey had been applied. It was straints (each perception interview took an aver-important to include 2-3 questions per factor, age of 60-90 minutes), it is recommended thatsince it allowed the team to select the most reli- this indicator be dropped in future surveys, andable variables for the analysis. replaced with a stronger emphasis on the reasons
why certain trends are felt to exist.V Lesson 3: Some Aspects Worked Better than
Expected. The participatory rural appraisal (PRA) V Lesson 6: Accept the Village Pace. The studytools, in particular the site maps, were very use- team had to adjust to the pace and events of theful in stimulating initial interest and allowing the village life, and allow for inevitable interruptionsstudy team to understand how communities per- in the survey plan. At one site, the team was near-ceived their habitats and resources. The five- ly attacked by a crocodile, who was found tryingpoint scale used for the indicators of success was to climb into the house they were sleeping in. Atalso easily understood by the villagers. The abili- another village the team was interrupted by a tra-ty to deconstruct perceptions of success in differ- ditional banishment, followed by a brawl, aent habitats, threats, and management rules and funeral, and a long honorary title ceremony.to compare their relative rating was an unexpect- While undoubtedly a longer stay would haveed benefit from the study. The qualitative assess- helped gained further trust and collaborationment of key issues and the extent to which the between the study team and the villagers, givenstudy relied on quantitative techniques also the very intensive survey questionnaire, five daysexceeded the initial expectations at the study was probably the maximum time that villagesconcept stage. were able to provide without outlasting the
team's welcome. The best information vwas col-V Lesson 4: Some Aspects Worked Worse than lected in the initial two days of the visit. Under
ANNEX A 57

the survey's time and budget constraints, this key disadvantage is bias. As with the complianceimplied tradeoffs between collecting large indicator, there may be reasons why respondentsamounts of quantitative data and obtaining more would want to respond a certain way -theyqualitative information necessary to derive les- could be reluctant to admit that a particularsons of experience. Another important observa- indigenous rule had failed, for example. Thistion is that it was very difficult to sample the approach would also have to rely on wellrespondents randomly. The rigid traditional struc- informed respondents, able to associate thetures of many Pacific Island communities made it impact of particular rules with resource trends.difficult to walk into a household and start aninterview. Hence, focus groups were arranged I/ Lesson 9: To Evaluate Policies and Processes,through large village meetings, or through the Endogeneity Needs to be Addressed. In futureassistance of village leaders. surveys, there may be merit in identifying instru-
mental variables affecting key endogenous policyv Lesson 7: Stated Perceptions have Limitations and process variables - for example, to collect
but Need to be Understood. Stated perceptions information on what determines government vis-can be influenced by several factors, such as par- its to a site or what influences a partner's siteticular site characteristics or awareness of respon- selection. This would allow for a quantitativedents. Hence, a '3' stated at a particular site could assessment of how these policies and processesbe equivalent to a '5' stated at a different site. The affect perceived success.degree of bias that this introduces depends onhow well the cause of the variation is captured by Based on this experience, how should a future surveythe survey instrument. While many factors were be formulated? First, it would be useful to comple-taken into account, awareness is by itself an ment it with ecological impact assessments taken atimpact variable and it should not be treated the different points in time. This could make it possible tosame way as other exogenous success factors. compare stated perceptions with standard monitoringHowever, there may be grounds to include a results and derive an actual estimate of the status ofproxy variable for awareness (e.g., education) in coastal resources. Second, the survey should be morefuture perception analyses. judicious in the number of explanatory factors col-
lected. It is hoped that the findings of this studyV Lesson 8: Trends in Success Variables were would help orient this selection. Third, it may be use-
Sometimes Unrelated to Management. In future ful to conduct a random site selection to be repre-surveys of this type, there may be merit in relat- sentative of the region's conditions. Fourth, the sur-ing more closely the perceptions of CPUE and vey should make an effort to collect explanatorythreat trends to specific management interven- variables of key policy and process factors. Fifth, thetions. One way this could be done would be to survey should develop a series of questions to captureask respondents to state the trend from the time a difficult variables, such as leadership and socialspecific management rule was introduced. This cohesion. Finally, it is recommended that surveys ofapproach would have the advantage of allowing this type reserve one to two days at a site for purelya closer assessment of management impact. The qualitative assessments and village discussions.
58 Voices from the Village: A Comparative Study of Coastal Resource Management in the Pacific Islands

Annex B. Quantitative Methods and Results
This technical annex provides details on the method- Initially, six data sets were created. The first data setology used in the quantitative analysis and the main included data collected at the national level andquantitative results. The annex begins by describing involved 5 observations. The second data set includ-the process of constructing and refining the data set ed data collected at the site level and thereforeused in the quantitative analysis. Next, the annex included 31 observations. The last four data setsdescribes how indicator categories were aggregated included data collected from the focus groups on thein order to facilitate the analysis. This is followed by four indicators of perceptions of success: catch pera description of how nonparametric statistics were unit effort (CPUE) trends, habitat trends, threat trends,used to provide preliminary information about the and compliance assessments. Each focus group wasindicators of success. The annex concludes by asked to provide their assessment of the CPUE trenddescribing the econometric analysis, including for three resources, the habitat trend for three habi-model selection, econometric methods used, and tats, the threat trend for three threats, and assessmentestimation results. of compliance with five management rules. Given the
133 focus groups, this resulted in data sets of 399A. DATA SET CONSTRUCTION AND REFINEMENT observations for CPUE, 396 observations for habitats,
377 observations for threats, and 648 observations forData was collected at three levels: national, site, and compliance assessment.focus group. First, national questionnaires were usedto collect data from fisheries and environmental These six individual data sets were combined into aagencies. Next, community level data were collected single data set by replicating the national and siteat 31 sites. These 31 sites were divided into 12 focus level data to fill in the 665 rows of observations forand 19 supplementary sites. At the focus sites, six to the compliance assessment. Missing observationseight focus groups were interviewed to collect data were added to the CPUE, habitat, and threats dataon their perception of success. At the supplementary sets to add them to this data set. Thus, the final datasites, three focus groups were interviewed. A total of set contained 665 rows of data and 1 72 columns of133 focus groups were interviewed at the 31 sites. questions.. However, most of the explanatory data inThe stratified nature of the data collection process the data set varied across only 31 sites or 5 coun-dictated how the final data set was constructed. tries, while data on the indicators of success varied
across either 399 or 665 observations. Exceptions toEach site survey, including both site and focus group this were specific explanatory variables associateddata, was coded into an Excel file in the field. Given with indicator categories - for example, whether thethe large size of the site survey, the qualitative data management rule was national or local. These var-was eliminated from these files. Excel macros were ied across all 377 to 648 observations, dependingused to make the focus and supplementary site files *on the indicator.consistent so that they could be combined into a sin-gle data set. Finally, the site level data were separat- B. AGGREGATION OF INDICATOR CATEGORIESed from the focus group level data. Throughout thisprocess, the coded files and resulting data sets were Resource Categorieschecked against the paper surveys to ensure dataerrors were not introduced as the data set was con- Focus groups provided their perceptions of CPUEstructed. Additionally, all of the questions in random- trends for three resources. The resources mentionedly selected site files were checked against the paper by the 133 focus groups were then grouped into thesurveys. Randomly selected questions across all of 14 resource categories shown in Figure B.1.the site files also were checked against the paper sur-veys. Finally, if coding issues could not be resolved Habitat Categoriesby consulting the paper surveys, the field study teamprovided clarifications. Focus groups also provided their perceptions of habi-
tat trends for three habitats. The habitats identified byThe five national questionnaires also were coded in the 133 focus groups were then grouped into 7 habi-the field. The qualitative questions were eliminated tat categories (see Figure B.2).from the national questionnaires. Once again, thecoded files were checked against the paper surveys toensure that errors were not introduced as the data setwas created.
ANNEX B 59

Rule Categories threats as: pollution; siltation/sedimentation/defor-estation; destructive fishing; mining; overfishing; or
Focus groups provided their compliance assessment other. Additionally, the focus groups were askedfor five management rules. The management rules "which threats can the village handle and whichmentioned by the 133 focus groups were then require outside help?" Threats were then classifiedgrouped into 10 management rule categories (see according to their responses: "threat can be handledFigure B.3). by village"; "threat requires outside help"; and "threat
requires a mixture of village/outside help".Threat Categories
The threats identified by focus groups were classifiedduring the site surveys. The field study team classified
Figure B. I Resource Groups and Associated Resource Names
FISH
Reef Finfish Inshore Finfish Semi-Pelagicsemperor larval fish euthynnus (bonito)finfish milk fish sharkreef fish mulletsea perch rastrelliger 1siganidae (rabbit fish) rastrelliger 2travally lethrindae (hoputu)wrassegrouperacanthuridaebalistidaecoral codeelsnappersoldier fishsurgeon fishtrigger fishunidorn fish
INVERTEBRATES
Shellfish Crabs Clams Reef Holothurids Impact-Zonebivalve shells crab clam sea urchin (tukumisi) Mollusksgafarium (to'o) mangrove crab giant clam (tridacna) anemone (lumane) turbokaloa'a (kaikoso) mudcrab Oyster trochusmodiolus (kuku) prawn topulangishellfish
spider conch (lambis)strombus gastropod Octopus Jellyfish BDM Lobster
octopus jellyfish BDM (sea cucumber) lobster (crayfish)
OTHERS
Seaweed Turtleseaweed turtleseagrass
60 Voices from the Village: A Comparative Study of Coastal Resource Management in the Pacific Islands

Figure B.2 Habitat Groups and Associated Habitat Names
Reefs Seagrass Lagoons Inter-tidal Areasbarrier reef seagrass lagoon landward of barrier reef inter-tidal areabarrier reef flat patch reefs and sea grass lagoon near barrier reef inter-tidal sandy beachcoral reef seagrass and associated coral lagoon patch reef rocky inter-tidalfringing reef lagoon seaward of reef sandy beach inter-tidal arealive reef lagoon/inside BIR stony area inter-tidaloffshore patch reef centre of lagoon stony placeouter reef flat inshore lagoon rocky shoreouter reef flat BDM (reef and open) areasouter reef zone DABreefreef flatinshore reeftrochus reefpasswave impact zone
Mangrove 1 Sandy Areas Estuary/River Mouthsmangrove muddy gravel sand estuary
sandy area estuary Lotosamisandy beach river mouth
Figure 8.3 Management Rule Groups and Associated Management Rule Names
Destructive Fishing Practices Rules Size Limits & Other Rules Restrictions on Outsiderschloroxing ban clam size limits exclude outsiderscompressor ban lobster size limits fishing by non-OJ residents bandamselfish netting size limits fishing license required for outsidersderris ban trochus size limit no license for outsidersdynamite ban turtle rules outsider spear fishing banexplosive fishing travally rule outsiders require permissionfish fencing ban PL 4-18 (catch restrictions) restrictions on fishing in other clan's reefsfish fencing ban (seasonal) BDM and white teat fish limits restrictions on outside fishingfish poisoning ban dugong protection law tourist catch and release lawgillnet ban ban on outside fishinghookah bannet mesh size limitsnight diving banPNG Kava banPNG Kava growing ban Closed Seasons Area Restrictionsscuba fishing ban grouper closed seasons tabu areanetting ban except for festivals mangrove crab seasonal limits tabu area (trochus reef)coral pounding reef fish seasonal ban netting ban (inside of reef)
Saturday fishing ban ban on catching baitfish in front of villageSunday fishing ban ban on catching tridacna in front of villagetrochus closed seasons
2 year kaikoso ban turtle closed seasonalternating trochus-BDM ban kanahe fishing seasonal closureBDM ban Commercial Fishing Restrictionscoral collection ban commercial fishing banconditional crocodile ban commercial teleher fishing bancrayfish with eggs ban commercial tridacna sale banpearl oyster ban Protected Area Rulesturtle ban conservation area rulessmall fish and invertebrates ban marine conservation areas
reserve areareserve fishing ban Permits & Licenses
Other Rules sanctuary rules dive permitsmangrove export ban conservation area for clams boat registrationharvest to chief clam circle rules fishing license fees
ANNEX B 61

C. DESCRIPTIVE AND NON-PARAMETRIC These nonparametric test statistics were applied toSTATISTICS ANALYSIS see if the indicators of success varied across the dif-
ferent categories (i.e., different resources for CPUE,Before conducting the econometric analysis, vari- different habitats, different threats, and different man-ous descriptive and ncnparametric statistics were agement rules). Typically, the Kruskal-Wallis test sta-calculated. tistic was first calculated to determine if all of the dif-
ferent categories were equivalent in terms of the per-Explanatory Variables ception of success measure. If the test statistic was
significant (indicating that some of the categories didVarious descriptive statistics were calculated for the come from different distributions), then the Mann-large number of explanatory variables contained in Whitney U was used, pair by pair, to determinethe data set. Correlation coefficients were calculated which types differed. The results are presented in thefor over 120 potential explanatory variables with the following sections.four indicators of success. Since many of the explana-tory variables were either ordinal or categorical, three The structure of the study's data set created some dif-different types of "correlation" coefficients were cal- ficulties for calculating these non-parametric statis-culated (depending on the variables type): Pearson tics. The observations in the data set were not inde-correlation coefficient, Cramer's V, and the Spearman pendent, since the data set was based on repeatedrank correlation coefficient. Additionally, for close to sampling from each focus group (i.e., each focus100 of these explanatory variables, additional group provided perceptions of CPUE trends for threedescriptive statistics and graphs were calculated: resources). Furthermore, a single focus group couldmean, standard deviation (of the mean), standard provide multiple measures on a single indicator cat-error (of the mean), minimum and maximum, a his- egory (e.g., a focus group may provide CPUE trendstogram, and a bivariate scattergram of the variable for both wrasse and emperor fish, both of which fellagainst the 31 sites. in the "reef finfish" category). The second problem
was solved by creating a "semi-independent" sampleDependent Variables which ensured that any particular focus group pro-
vided, at most, one indicator measure per indicatorThe data collected from the focus groups on the per- category. With this problem solved, limiting the dataceptions of success were analyzed using a number set to a particular indicator category ensures anof descriptive and non-parametric test statistics. In independent sample (i.e., only one response pergeneral, the purpose of the analysis was to assess focus group). However, some of the non-parametrichow the different indicators of success varied across statistics which are based on comparisons acrossdifferent categories. For example, focus groups were indicator categories rely on the "semi-independent"asked to provide their perceptions on the CPUE sample which could have a single focus group pro-trend for three different resources (e.g., shellfish, viding an indicator measure to more than one indi-reef fish, and trochus). Descriptive and nonparamet- cator category.ric statistics were then used to determine whetherperceptions of CPUE trends were higher for reef fish The Kruskal-Wallis test statistic was also used tothan for shellfish. determine whether the indicators of success varied
across the different focus group types (i.e., men,Nonparametric statistics were used, given the highly women, and elders). These test statistics were calcu-non-normal distributions of the four indicators of suc- lated after limiting the data set to a single indicatorcess. The two main non-parametric statistics used category, thus ensuring an independent sample. Thewere the Kruskal-Wallis test and the Mann-Whitney test statistic was calculated for four resource cate-U test. The Kruskal-Wallis test is a nonparametric ver- gories (CPUE), seven habitat categories, six threat cat-sion of a one-way analysis of variance by ranks and egories, and seven rule categories. None of the testtests the null hypothesis that all categories come from statistics were significant at the 10 percent level, indi-the same distribution. Similarly, the Mann-Whitney U cating that perceptions of success were very consis-is the nonparametric version of a two group unpaired tent across the different group types. This test statistict-test and tests the null hypothesis that two categories was also calculated using the entire sample (nocome from the same distribution. Both test statistics longer an independent sample), and once again nonetest whether there is variation across categories. The of the test statistics were significant at the 1 0 percentprimary difference is that the Mann-Whitney U statis- level (see Table B.1).tic is used when two categories are being comparedand the Kruskal-Wallis test statistic is used when three Additionally, a Wilcoxon signed rank test was used toor more categories are being compared. assess whether similar focus group (i.e., two groups of
men, or two groups of women) from the same site
62 Voices from the Village: A Comparative Study of Coastal Resource Management in the Pacific Islands
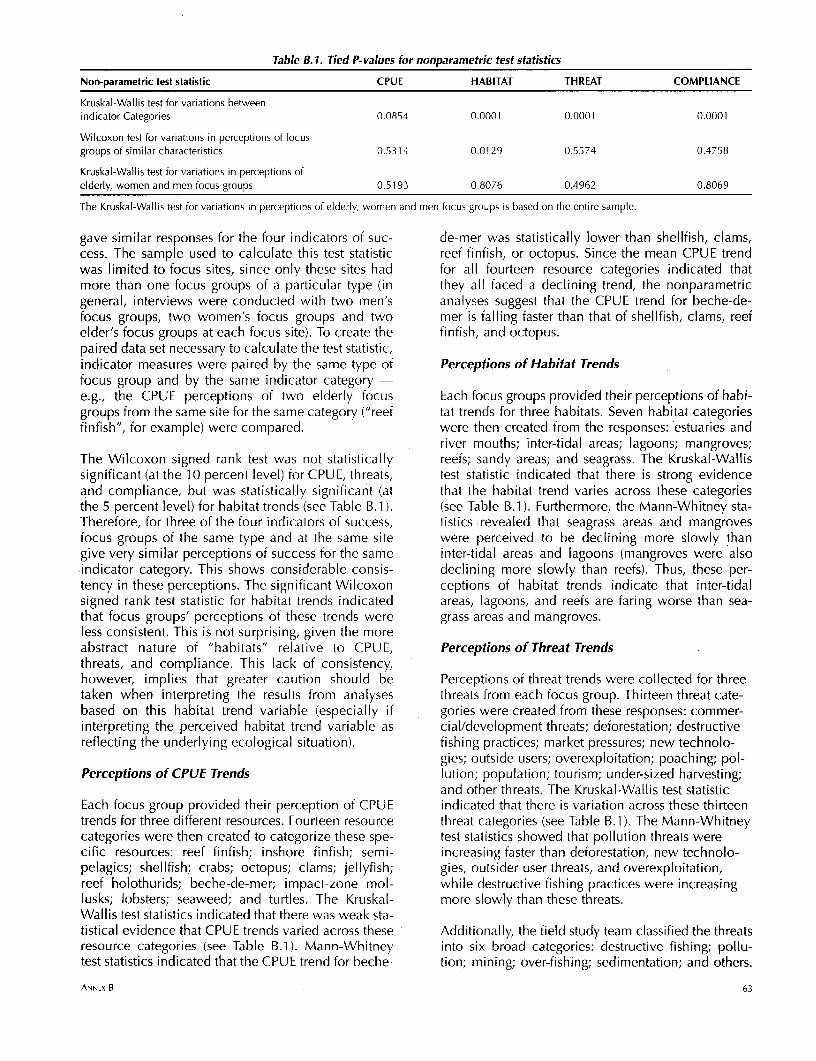
Table B. 1. Tied P-values for nonparametric test statistics
Non-parametric test statistic CPUE HABITAT THREAT COMPLIANCE
Kruskal-Wallis test for variations betweenindicator Categories 0.0854 0.0001 0.0001 0.0001
Wilcoxon test for variations in perceptions of focusgroups of similar characteristics 0.5314 0.0129 0.5574 0.4758
Kruskal-Wallis test for variations in perceptions ofelderly, women and men focus groups 0.5193 0.8076 0.4962 0.8069
The Kruskal-Wallis test for variations in perceptions of elderly. women and men focus groups is based on the entire sample.
gave similar responses for the four indicators of suc- de-mer was statistically lower than shellfish, clams,cess. The sample used to calculate this test statistic reef finfish, or octopus. Since the mean CPUE trendwas limited to focus sites, since only these sites had for all fourteen resource categories indicated thatmore than one focus groups of a particular type (in they all faced a declining trend, the nonparametricgeneral, interviews were conducted with two men's analyses suggest that the CPUE trend for beche-de-focus groups, two women's focus groups and two mer is falling faster than that of shellfish, clams, reefelder's focus groups at each focus site). To create the finfish, and octopus.paired data set necessary to calculate the test statistic,indicator measures were paired by the same type of Perceptions of Habitat Trendsfocus group and by the same indicator category-e.g., the CPUE perceptions of two elderly focus Each focus groups provided their perceptions of habi-groups from the same site for the same category ("reef tat trends for three habitats. Seven habitat categoriesfinfish", for example) were compared. were then created from the responses: estuaries and
river mouths; inter-tidal areas; lagoons; mangroves;The Wilcoxon signed rank test was not statistically reefs; sandy areas; and seagrass. The Kruskal-Wallissignificant (at the 10 percent level) for CPUE, threats, test statistic indicated that there is strong evidenceand compliance, but was statistically significant (at that the habitat trend varies across these categoriesthe 5 percent level) for habitat trends (see Table B.1). (see Table B.1). Furthermore, the Mann-Whitney sta-Therefore, for three of the four indicators of success, tistics revealed that seagrass areas and mangrovesfocus groups of the same type and at the same site were perceived to be declining more slowly thangive very similar perceptions of success for the same inter-tidal areas and lagoons (mangroves were alsoindicator category. This shows considerable consis- declining more slowly than reefs). Thus, these per-tency in these perceptions. The significant Wilcoxon ceptions of habitat trends indicate that inter-tidalsigned rank test statistic for habitat trends indicated areas, lagoons, and reefs are faring worse than sea-that focus groups' perceptions of these trends were grass areas and mangroves.less consistent. This is not surprising, given the moreabstract nature of "habitats" relative to CPUE, Perceptions of Threat Trendsthreats, and compliance. This lack of consistency,however, implies that greater caution should be Perceptions of threat trends were collected for threetaken when interpreting the results from analyses threats from each focus group. Thirteen threat cate-based on this habitat trend variable (especially if gories were created from these responses: commer-interpreting the perceived habitat trend variable as cial/development threats; deforestation; destructivereflecting the underlying ecological situation). fishing practices; market pressures; new technolo-
gies; outside users; overexploitation; poaching; pol-Perceptions of CPUE Trends lution; population; tourism; under-sized harvesting;
and other threats. The Kruskal-Wallis test statisticEach focus group provided their perception of CPUE indicated that there is variation across these thirteentrends for three different resources. Fourteen resource threat categories (see Table B.1). The Mann-Whitneycategories were then created to categorize these spe- test statistics showed that pollution threats werecific resources: reef finfish; inshore finfish; semi- increasing faster than deforestation, new technolo-pelagics; shellfish; crabs; octopus; clams; jellyfish; gies, outsider user threats, and overexploitation,reef holothurids; beche-de-mer; impact-zone mol- while destructive fishing practices were increasinglusks; lobsters; seaweed; and turtles. The Kruskal- more slowly than these threats.Wallis test statistics indicated that there was weak sta-tistical evidence that CPUE trends varied across these Additionally, the field study team classified the threatsresource categories (see Table s.1). Mann-Whitney into six broad categories: destructive fishing; pollu-test statistics indicated that the CPUE trend for beche- tion; mining; over-fishing; sedimentation; and others.
ANNEX B 63

The Kruskal-Wallis statistic indicated that there was Additionally, the field study team classified rules intovariation across these categories as well. Mann- the following categories: local rules; outside rules;Whitney test statistics supported the previous results locally-adapted outside rules; local conservationthat perceived pollution threats were increasing faster rules; and outside conservation rules. A Kruskal-Wallisthan over-fishing, sedimentation, and other threats, test statistic indicated that there was variation acrosswhile destructive fishing practices were increasing these categories. Mann-Whitney statistics further indi-more slowly (destructive fishing practices were cated that locally-adapted outside rules had betterincreasing more slowly than mining threats as well). perceived compliance than the other rule categories.
Perceptions of Compliance D. CORRELATION BETWEEN PERCEPTIONS OFSUCCESS AND EXPLANATORY VARIABLES
Compliance assessments were collected for five man-agement rules for each focus group. Ten rule cate- Pairwise correlation matrices were calculated for thegories were then created: area restrictions (e.g., taboo four indicators of success and a large number of theareas); closed seasons; commercial fishing restric- explanatory variables. These correlation coefficientstions; fishing practices restrictions; permits; protected were particularly useful for assessing the relationshiparea rules; restrictions on outsiders; size limits; between the indicators of success and explanatoryspecies bans; other rules. The Kruskal-Wallis test sta- variables which could not be included in the multi-tistic indicated that there was variation in perceptions variate regressions. The correlation coefficients wereacross these rule categories (see Table B.1) and grouped by site characteristic; external factors, andMann-Whitney statistics helped divide these cate- process factors.gories into two types: relatively high and low compli-ance. The relatively high compliance rules included: Site Characteristicsarea restrictions; closed seasons; fishing practicerules; and protected area rules. The relatively low Thirty site characteristic variables were correlatedcompliance rules included: restrictions on outsiders; with the four indicators of success (see Table B.2).size limits; and species bans.
Table B.2. Pairwise correlation coefficients with site characteristics
Explanatory Variables CPUE HABITAT THREAT COMPLIANCE SUCCESS
inability to exclude outsiders 0.1403** 0.1519** 0.1 702*** 0.1499** 0.1182quality of leadership 0.0658 0.1023* -0.1087* 0.1905- 0.2382**percent projects completed 0.1166* 0.1075* -0.192** 0.367** (.4541 **education level 0.1071* 0.0246 -0.1477** 0.1967** 0.3354**marketing perishable goods 0.0676 -0.1565** -0.1 714** 0.0937* 0.1647distance to urban center -0.0766 -0.0248 0.1 596** -0.236** -0.22*village age 0.1065* 0.12991* -0.3523** 0.2113** 0.4185**number of close villages 0.0334 -0.1801 ** 0.1513** 0.056 -0.081cultural requirementto harvest 0.0418 0.0768 -0.0134 0.1475** 0.1357clear site boundaries -0.0972 -0.0851 -0.1024* 0.2133** -0.1878*Population density 0.0525 -0.082 -0.2511** 0.0877* 0.1876*Population growth rate -0.1184* -0.2801 ** 0.1302* -0.2451 ** -0.3629**Awareness of actions -0.0387 -0.1476** -0.1964** -0.1696** -0.0997number of indigenous rules -0.073 -0.3096** -0.1818** -0.142** -(0.1542level of fishing technology -0.0733 0.0694 0.2928** -0.088* -0.1 87*income dependence -0.0794 -0.0002 0.2115** -0.242** -0.331**Subsistence dependence -0.1 386** -0.085 0.3277** -0.2531 ** -0.3788**Pollution -0.0297 -0.2167** 0.3122** 0.0594 -0.1 874*Destructive fishing 0.1811 * 0.0385 -0.3735** 0.1944** 0.4072**Conflicts 0.0366 -0.1191 * 0.2229** -0.0839* -0.2089*village development 0.1191* -0.0514 -0.1873** 0.3236** 0.2907**high island 0.0556 0.0088 -0.2621** 0.1012** 0.2143*number of ecosystems -0.0658 -0.0854 0.11* -0.1417** -0.2446**habitat diversity -0.1316** -0.1571** 0.0432 -0.2581** -0.3338**Contiguous fishing areas 0.0995* -0.0749 0.2082** 0.2067** 0.0585receives tourism benefits 0.01 0.02 -0.0744 -0.0754 -0.0211land use diversity 0.0208 -0.1761** -0.0145 0.046 -0.0756urban site -0.0648 -0.0567 0.2493** 0.0771* -0.1 564private sector development 0.0108 -0.0769 0.005 -0.0463 -0.0981Conservation site 0.0022 -0.0183 0.0156 0.0972* 0.0988
Notes: * = p<0.05: ** = p<0.01.
64 Voices from the Village: A Comparative Study of Coastal Resource Management in the Pacific Islands

Table 8.3. Pairwise correlation coefficients with external factors
Explanatory Variables CPUE HABITAT THREAT COMPLIANCE
justification for outside rules 0.0756 0.0246 -0.2815** 0.1813**government visit -0.0302 0.0036 -0.2063** 0.0733agency support to crm -0.0872 -0.1918** -0.1 998** -0.2607**supportive national legislation -0.0799 -0.2611** 0.1834** -0.188**national legislation for fisheries -0.1 294** 0.161 ** 0.401 ** -0.1 665**government recognizes user rights -0.2263** -0.0963 0.2426** -0.2597**frequency of newspaper articles on crm 0.1453** -0.1519** -0.4114** 0.1418**crm priority in national develop plan -0.0505 -0.2043** -0.1653** -0.2634'*percent of fisheries staff working on crm 0.1 581 ** -0.1 333** -0.294** 0.1 709**annual donors budget on crm -0.0202 -0.0215 -0.0104 0.1725**natural disasters 0.1549** -0.1122* -0.1206* 0.1053**market shocks -0.0407 0.0631 -0.081 0.0674development project shocks -0.0968 0.1606** 0.0005 -0.0521destructive fishing technology shocks -0.0914 0.036 0.005 -0.1 867**
Notes: * = p<0.05; ** = p<0.01.
External Factors and methods; basic model results; estimation resultsfor alternative model specifications; and open access
Fourteen external factor explanatory variables were and indicators of success.correlated with the four indicators of success (seeTable B.3). Many of these variables were collected Model Selectionthrough interviews with fisheries and environmentalagencies. These variables could not be included in Two factors made selecting the model to estimate par-multivariate regressions (which also include country ticularly challenging. First, there was an almost com-dummy variables), since they would have been per- plete lack of empirically testable models in the litera-fectly correlated with the country variables included ture on coastal resource management. Second, thein that analysis. literature on coastal resource management spans var-
ious disciplines, resulting in a large number of poten-Process Factors tial variables to explain successful coastal resource
management. These two factors result in a large num-Eleven process factor variables were correlated with ber of potentially important variables to include inthe indicators of success (see Table B.4). The poten- the model with little of no theory to guide the selec-tial endogeneity of most of these variables excluded tion process.their use in the multivariate regressions.
Furthermore, the nature of the data set required limit-E. ECONOMETRIC ANALYSIS ing the number of variables included in the model.
Although data on the indicators of success were col-The primary objective of the econometric analysis lected from 133 focus groups, most explanatory vari-was to determine the factors which contributed to ables were collected at the site level. Because of this,successful coastal resource management in the the effective degrees of freedom were limited to thePacific Islands. The following econometric issues are 31 sites. The choice of variables to include in thediscussed below: model selection; estimation issues model was further complicated by the presence of
Table B.4. Pairwise correlation coefficients with process factors
Explanatory Variables CPUE HABITAT THREAT COMPLIANCE
partner present 0.03 -0.0481 -0.0083 0.0641length of partner involvement 0.1041 0.0975 0.4218** -0.0421quality of partnership -0.0776 -0.2837** -0.1764* -0.0358village role in partnership -0.1389 -0.1283 0.1859* -0.1393*clear goals of partnership -0.0509 -0.2531** -0.0315 0.1142*indigenous rules have changed with time -0.1070* -0.1649** -0.0487 -0.2283**influential individuals present 0.1147 -0.0336 -0.2192** 0.2378**partner has provided information -0.1131 -0.2125** 0.0506 -0.1041indigenous rules present -0.1267* -0.2495** -0.1478** -0.2037**sanctuary present 0.0553 -0.0357 -0.1343** 0.0557alternative income generating activities -0.0141 -0.1112* 0.1337** 0.0367
Notes: = p<o.o5; ** p<0.01.
ANNEX B 65

Table B.5: Variable names and their description
VARIABLE NAME DESCRIPTION
Dependent VariablesCPUE perception of changes in catch per unit effort over the past decadeHabitat perception of habitat trends over the past decadeThreats perception of threat trends over the past decadeCompliance perception of level of compliance with management rulesSuccess Factor scores from a principal component analysis used to weight the four indicators into an aggregated
success variable
Explanatory VariablesPalau Country dummy variable for Palau ("1 Palau site; "0" - Other sites)Samoa country dummy variable for Samoa ("1 Samoa site; "0" - Other sites)Solomon country dummy variable for Solomons ;I" - Solomons site; "0" - Other sites)Tonga country dummy variable for Tonga (A" - Tonga site; ̀0" - Other sites)government visit index of last year a government official visited the siteincome dependence percent of income from coastal resources and tourismnatural disasters dummy variable for whether the site had experienced a natural disasterquality of leadership study team's assessment of the quality of site leadershipinability to exclude outsiders ordered variable measuring the inability of local leaders to exclude outsiderspollution dummy variable of whether pollution threats were identified at the sitepopulation density ratio of village population to the site size (persons/km square)number of ecosystems number of distinct ecosystems identified by the study team equality factor factor scores for a principal component capturing the degree of equality and involvement of user groups in
coastal resource managementthreat type-destructive fishing threat type dummy variable for presence of destructive fishing practices threatsthreat type: land-based threats threat type dummy variable for presence of land based threatsthreat type-over fishing threat type dummy variable for presence of over fishingrule type-local/national rules rule type dummy variable reflecting presence of locally adopted national rulesrule type-national rules rule type dummy variable for presence of national rules
variables collected through national questionnaires, tured the most important determinants of successfulwhich only varied across the 5 countries. This rela- coastal resource management as determined by thetively complex structure of the data set placed signif- literature, the Study's expert workshop, and theicant constraints on which variables could be includ- results of the qualitative analysis. The ten independ-ed in the basic model. ent variables selected included: government visits;
income dependence; natural disasters; quality ofIn the end, five basic models were estimated. These leadership; inability to exclude outsiders; pollution;models were similar in terms of their explanatory population; equality factor; and presence of indige-variables and differed by their dependent variables. nous rules. Four dummy variables also were includ-The five dependent variables used in the analysis ed to capture country fixed effects. In addition,were: CPUE, habitat, threats, compliance, and suc- dummy variables were included to capture the dif-cess. CPUE measures the focus group's perception of ferent indicator "categories": different categories forthe ten year trend in catch per unit effort for specific CPUE; different habitat categories; different threatresources. Habitat measures the focus group's per- categories; and different categories of managementception of the ten year trend for specific habitats. rules for the compliance indicator (see Table B.5).Threats measures the focus group's perception of the While most of the explanatory variables varied onlytrend in specific threats. Compliance measures the across the 31 sites, the category explanatory vari-focus group's perception of the level of compliance ables varied across all 377-648 survey observations,with specific management rules. as did the dependent variables.
Data were collected on each of these four indicators Numerous variables were excluded from the initialof success for specific resources, habitats, threats, and specification because of the constraint on degrees ofrules. In addition, measures of the "overall" level of freedom and, in some cases, because the survey hadthese four indicators were also collected. A factor failed to measure the variables reliably. Furthermore,analysis was conducted on these four overall indica- a number of different questions from the survey couldtors and the factor scores were used as weights to proxy for a particular variable included in the initialconstruct an aggregate success variable. basic model. These various proxies for each variable
were analyzed to determine which worked best in theAn initial specification of the basic model was basic model. This analysis involved both calculatingselected by choosing the ten variables which cap-
66 Voices from the Village: A Comparative Study of Coastal Resource Management in the Pacific Islands

correlation matrices and estimating alternative speci- Survey Structurefications of the basic model.
Three different surveys were used to collect the nec-The results from this analysis resulted in a number of essary data. The first two surveys were used at thechanges to the initial specification of the basic model. focus and supplementary sites where most of the dif-First, the presence of indigenous rules was dropped ference was in the number of focus groups inter-from the model because it was almost perfectly cor- viewed (three in the supplementary sites and six torelated (negatively) with the Tonga country dummy eight in the focus sites). The third survey was used tovariable. The pollution variable also was dropped collect national level data from the fisheries and envi-from the threats model, since it was partially captured ronmental ministries in each country. The differentby the land-based threat type dummy variable. A levels at which data was collected resulted in a rela-number of proxies were also switched in the basic tively complicated data set.model: population density was used instead of popu-lation growth; income dependence was used instead In total, 133 focus groups were interviewed in 31of a question measuring the degree of subsistence sites in five countries. Additionally, each focus groupdependence on coastal resources; and the indexed was asked to provide trends for three resources (forversion of government visits was used instead of a CPUE), three habitats, three threats, and five manage-dummy version. ment rules (for compliance). Thus, the data set con-
tained four data levels (or strata): country, site, focusAfter the final set of explanatory variables was deter- group, and specific resource, habitat, threat or rule.mined, the two sets of dummy variables were tested This structure results in a maximum number of obser-for their contribution to the basic model by calculat- vations on the dependent variables of 377 to 399 foring a test statistic for their joint significance as well as CPUE, habitats and trends and 665 for compliance.examining the estimation results when they were The survey involved multistage sampling, i.e. the datadropped from the model. The country dummies were were clustered at the country, site, focus group andjointly significant at the 5 percent level for the CPUE, within focus group levels. Within each cluster, thethreats, compliance, and success regressions, but not observations are correlated and are not independent.jointly significant in the habitat regression. Given Because most econometric estimators assume inde-their high level of significance in four of the five pendence, the standard errors would tend to beregressions and the likely important role of country biased if no correction was done to take into consid-fixed effects, the country dummies were kept in all eration the clustering of the data. To accommodatefive basic models. the complex structure of the data set, the analysis
used a correction that allowed the standard errors toSimilarly, the joint significance of the indicator cate- be calculated under the assumption of stratified, clus-gory dummies was tested in the CPUE, habitat, tered, random sampling (with stratification by coun-threats,-and compliance regressions (such indicator try and clustering by site). The variance estimatorscategory dummies are not appropriate for the success used in the analysis allow for any amount of correla-regression since it is an aggregate measure based on tion within the clustering units, and allow for sec-"overall" resources, habitats, management rules and ondary clustering. While not explicitly accounting forthreats trends). The indicator category dummies were clustering by focus group, the standard error calcula-jointly significant at the one percent level in the tion accounts for this by allowing for a flexible corre-threats and compliance regressions but not significant lation structure within sites. In multistage designsin the CPUE and habitat regressions. Given these such as the one used by this study, the correlationresults, the indicator category dummies were yields variance estimates that are either approximate-dropped from the CPUE and habitat regressions but ly unbiased or biased towards more conservative esti-kept in the threat and compliance regressions. mates (see Stata Manual, Release 6, Vol. 1, pages
321-333, and Vol. 4, pages 15-30). Therefore, theEstimation Issues and Methods standard errors should be approximately correct.
A number of estimation issues had to be addressed. Additionally, some of the variation within the finalThe first resulted from the structure of the survey, with level of the data set (for specific resources, habitats,data collected at the country, site, and focus group rules, and threats) is controlled for by including indi-levels. Another issue resulted from the ordinal nature cator type dummy variables as described earlier.of some of the dependent and explanatory variables.The last key issue was the endogeneity of some of the The single equation ordinary least squares (OLS) orexplanatory variables. ordered probit model may be viewed as a special
case of a more general multi-equation model inwhich there is a separate equation for each resource
ANNEX B 67

(threat, etc.) thus allowing the regression coefficients it is not possible to determine whether dependenceto vary by type. Had there been equal samples for leads to success or whether lack of success leads toeach such equation, it would have been feasible to dependence.estimate this more general model and to test for theequality of the coefficients across equations. The potential endogeneity of these two variables wasHowever, given the unequal and in some cases small addressed in two ways. First, an instrumental vari-samples, it was necessary to impose the restriction ables regression attempted to control for their endo-that all the regression coefficients except for the inter- geneity in the basic model. Unfortunately, since thecepts are equal across equations, leading to a single- survey was not designed to identify and collect dataequation OLS or ordered probit model. Single cate- on good instruments, instruments had to be chosengories indicator models were estimated for the most from the data collected. Ultimately, five variablesfrequently cited resources, habitats, etc, and are dis- were chosen to serve as the two endogenous vari-played in Table 8.10. Aside from the survey design ables: ease of access to the site; level of private sec-issues discussed above, the standard errors for this tor development; level of tourism development;single-equation model are correct provided that the whether the site was located on a high island; and thecross-equation restrictions that were imposed are overall level of village development.indeed valid. If separate coefficients for eachresource had been allowed for in a multi-equation In addition to the instrumental variables regression,model, then many more parameters would have had the basic model was re-estimated excluding the twoto be estimated and the standard errors would have endogenous variables. The results from this regres-been commensurately higher. sion were compared to the basic model estimates to
assess whether including these potentially endoge-Ordinal Dependent and Independent Variables nous variables had a large impact on the estimates of
the exogenous independent variables.Another feature of the data set was that most of thedependent and three of the explanatory variables Model Estimation Resultswere ordinal instead of continuous variables.Because of the ordinal nature of the dependent vari- Various models were estimated using different meth-ables, an ordered probit model was estimated to ods in an effort to address the estimation issues raisedcheck the robustness of the ordinary least squares above. In all cases, the basic model is the point of(OLS) regression estimates. Additionally, the ordinal departure for addressing these estimation issues.explanatory variables were converted into dummy Given the basic model results, first the endogeneityvariables to assess the impact of treating them as con- issue was addressed and then the ordinal data issue.tinuous variables on the model estimates. This section presents the model results and the next
section interprets these results.Endogeneity
Basic ModelTwo of the explanatory variables used in the basicmodel were considered to be endogenous. The The final specification of the basic model includedgovernment visits variable measured the last time a country dummy variables for all five regressions.government official visited the site. It is possible that However, there were two differences between the fivegovernment visits lead to improvements in the indi- basic model regressions. First, indicator categorycators of success. Alternatively, government officials dummy variables were included in the threats andmay visit sites because they are successful (or compliance regressions and not in the other threebecause they are having serious problems). A priori, regressions. Second, the pollution variable wasit is not possible to state whether government visits dropped from the threats regression since the type ofcause success or vice versa. threats present at the site was already picked up by the
threat type dummy variable for land- based threats.The variable income dependence measures the per-cent of income from coastal resources and tourism. The coefficient estimates for the OLS estimation ofThe results from the qualitative analysis suggest that the final basic model are presented in Table B.6. Insites which are more dependent on coastal resources the basic model and all of the following regressions,will have higher incentives to manage them well and the survey structure was accounted for by setting thetherefore will be more successful. It is also possible strata and clusters at the country and site levels,that sites with a deteriorating resource base (i.e., respectively.unsuccessful sites) will become more dependentupon the remaining resources. Once again, a priori,
68 Voices from the Village: A Comparative Study of Coastal Resource Management in the Pacific Islands

Table B.6: Regression coefficients for the basic model
INDICATORS
Independent variables CPUE HABITAT THREATS COMPLIANCE SUCCESS
Palau 0.338* 0.306 0.558 0.961** 0.168Samoa 0.351** -0.656 0.175 0.507 -0.065Solomon -0.144 -0.229 1.040** -0.378 -0.930**Tonga 0.273 0.473 2.124** 1.011 0.266government visit -0.083** -0.015 0.11 7** 0.018 -0.152**income dependence 0.005* 0.007 0.008 0.003 0.001natural disasters 0.390** 0.365* 0.223 0.333* 0.751 **quality of leadership 0.083 0.088 -0.417** 0.083 0.256*inability to exclude outsiders 0.1 57** 0.074 -0.268** 0.151 0.191*Pollution -0.057 -0.678** 0.196 -0.314*population density 0.000 0.000 -0.000** 0.000 0.000number of ecosystems 0.063 -0.078 -0.139** 0.155* 0.139equality factor 0.192** 0.072 -0.446** 0.133 0.318**Constant 0.609 2.666** 4.151** 0.632 -1.767**threat type-destructive fishing - - -0.688** -
threat type: land-based threats - - 0.526*threat type-over fishing - - 0.318rule type-local/national rules - - - 0.713**rule type-national rules - - - -0.211
Number of observations 399 396 377 442 124R-squared 0.1201 0.1745 0.4520 0.2599 0.5239F statistic 9.26 3.99 18.08 6.56 6.49F stat degrees of freedom 13, 14 13, 14 15, 12 15, 12 13, 14Probability > F 0.0001 0.0153 0.0000 0.0011 0.0007
Notes: * = p<0.1; * = p<0.05.
Models Addressing the Endogenous Variables Issue address the endogeneity issue. First, the endogenousvariables were dropped from the basic model (see
One of the problems with the basic model was that Table B.7).the government visits and income dependence vari-ables were likely endogenous (the negative coeffi- Second, the government visits variable was droppedcient on the government visits variable in the CPUE, from the regression, and the income dependencehabitats and success regressions and the positive variable was replaced with the remittances variable.coefficient in the threat regression supports this con- The remittances variable measured the percent ofjecture - government officials might be visiting sites income from external sources and is potentially lesswhich were having more problems). Three different endogenous than the income dependence variable.regressions were run to try to address this endogene- The coefficient on the remittances variable was onlyity. First, an instrumental variables (IV) model was significant at the 10 percent level in the successestimated. Compared to the basic model, standard regression. Comparing this regression with the basicerrors were much higher, the magnitude on many model, the standard errors were very similar, whilecoefficients changed considerably, and some coeffi- some variation in the magnitude of the coefficientcients switched signs. The higher standard errors in estimates (but not their signs) resulted in some vari-the IV model compared to the basic model suggested ables being significant in one regression but not in thethat good instruments for these endogenous variables other. This was also true for the regression where bothdid not exist in the present data set. Looking at the endogenous variables were dropped from the regres-first stage regressions supports the weakness of the sion: standard errors were remarkably consistent,instruments, since the set of instruments was not while some variation in the magnitude of the coeffi-jointly significant in any of the first stage regressions. cients affected whether individual variables were sig-Finally, the magnitude and sign of the coefficient esti- nificant or not.mates was not very consistent between the IV andbasic models. Overall, the IV model appeared to be a Models Addressing the Ordinal Data Issuesparticularly weak model, given the survey data set.
Four of the dependent variables and three of theThe lack of good instruments meant that it was not explanatory variables were ordinal. The issue of ordi-possible to correct for the endogeneity of these two nal dependent variables can be solved by estimatingvariables through a two-stage least squares regression an ordered probit model (see Table 13.8). The resultsmethod. Thus, two other approaches were used to from this ordered probit model were very consistent
ANNEX B 69

Table B.7: Regression coefficients for the basic model without endogenous variables
INDICATORS
Independent variables CPUE HABITAT THREATS COMPLIANCE SUCCESS
Palau 0.155 0.026 0.170 0.830** 0.237Samoa 0.269 -0.838* -0.150 0.382 0.015Solomon -0.078 -0.278 0.791* -0.458* -0.707*Tonga 0.484 0.340 1.352** 0.793 0.897government visitincome dependencenatural disasters 0.421** 0.362* 0.136 0.327** 0.815**quality of leadership 0.025 0.068 -0.358** 0.099 0.161inability to exclude outsiders 0.078 0.055 -0.164** 0.173 0.062pollution -0.047 -0.681** - 0.193 -0.269population density 0.000 -0.000 -0.000** 0.000 0.000number of ecosystems 0.079 -0.060 -0.125** 0.158* 0.145equality factor 0.116** 0.032 -0.407** 0.130 0.229**constant 0.851** 3.017** 4.626** 0.807 -1.830**threat type-destructive fishing - - -0.657**threat type: land-based threats - 0.519*threat type-over fishing - 0.385rule type-local/national rules - - 0.71 0**rule type-national rules - - - -0.200
Number of observations 399 396 377 442 124R-squared 0.1012 0.1680 0.4369 0.2583 0.4775Fstatistic 4.21 3.78 25.49 7.15 3.24Fstatdegreesoffreedom 11, 16 11,16 13, 14 13, 14 11,16Probability > F 0.0048 0.0081 0.0000 0.0004 0.0164
Notes: * = p<0.1; * = p<0.05.
Table B.8: Regression coefficients for the ordered probit model
INDICATORS
Independent variables CPUE HABITAT THREATS COMPLIANCE SUCCESS
Palau 0.394 0.356 0.436 1.107**Samoa 0.300* -0.731 0.121 0.672Solomon -0.179 -0.216 0.979** -0.326Tonga 0.254 0.476 1.870** 1.247*Government visit -0.099* -0.007 0.121** 0.029Income dependence 0.006 0.008 0.005 0.005Natural disasters 0.489** 0.378* 0.188 0.404*Quality of leadership 0.098 0.097 -0.359** 0.084Inability to exclude outsiders 0.194* 0.069 -0.227** 0.166Pollution -0.104 -0.709** 0.362**Population density 0.000*" 0.000 -0.000* 0.000Number of ecosystems 0.080 -0.094 -0.147X* 0.168Equality factor 0.219** 0.080 -0.430** 0.210Cut 1 1.269** -1.1 99** -2.31 0** 1.731 *Cut 2 2.500** -0.062 -1.414** 2.226Cut 3 3.083** 0.741 -0.947 2.889Cut 4 3.752** 1.653** -0.273 -Threat type-destructive fishing - - -0.652**Threat type: land-based threats - - 0.478*Threat type-over fishing - 0.284Rule type-local/national rules - - - 0.924**Rule type-national rules - - - -0.193
Number of observations 399 396 377 442F statistic 5.14 2.87 11.27 4.75F stat degrees of freedom 13, 14 13, 14 15, 12 15, 12Probability > F 0.0022 0.0302 0.0001 0.0049
Notes: = p<0.1; ** = p<0.05.
70 Voices from the Village: A Comparative Study of Coastal Resource Management in the Pacific Islands
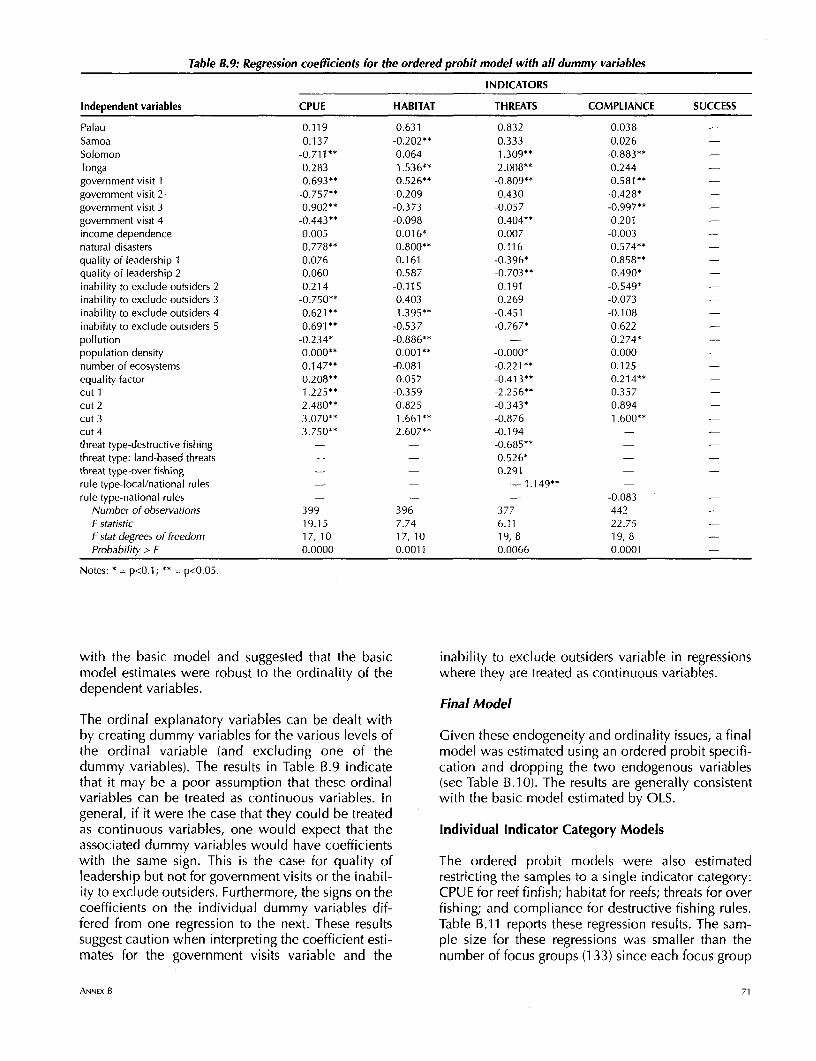
Table B.9: Regression coefficients for the ordered probit model with all dummy variables
INDICATORS
Independent variables CPUE HABITAT THREATS COMPLIANCE SUCCESS
Palau 0.119 0.631 0.832 0.038 -
Samoa -0.137 -0.202** 0.333 0.026 -Solomon -0.711 ** 0.064 1.309** -0.883** -
Tonga 0.283 1.536** 2.008** 0.244 -government visit 1 0.693** 0.526** -0.809** 0.581 ** -government visit 2 -0.757** -0.209 0.430 -0.428* -government visit 3 0.902** -0.373 -0.057 -0.997** -government visit 4 -0.443** -0.098 0.404** 0.201 -income dependence 0.005 0.01 6* 0.007 -0.003 -
natural disasters 0.778** 0.800** 0.116 0.574** -quality of leadership 1 0.076 0.161 -0.396* 0.858** -
quality of leadership 2 0.060 0.587 -0.703** 0.490* -
inability to exclude outsiders 2 0.214 -0.115 0.191 -0.549* -
inability to exclude outsiders 3 -0.750** 0.403 0.269 -0.073 -
inability to exclude outsiders 4 0.621** 1.395** -0.451 -0.108 -
inability to exclude outsiders 5 0.691 ** -0.537 -0.767* 0.622 -
pollution -0.234* -0.886** - 0.274* -population density 0.000** 0.001 *0.000* 0.000number of ecosystems 0.147** -0.081 -0.221** 0.125 -equality factor 0.208** 0.057 -0.413** 0.214** -cut 1 1.225** -0.359 -2.256** 0.357 -cut 2 2.480** 0.825 -0.343* 0.894 -cut 3 3.070** 1.661 ** -0.876 1.600** -cut 4 3.750** 2.607** -0.194 - -threat type-destructive fishing - - -0.685** -
threat type: land-based threats - - 0.526* -
threat type-over fishing - - 0.291rule type-local/national rules - - - 1.149** -
rule type-national rules - - - -0.083Number of observations 399 396 377 442 -
F statistic 19.15 7.74 6.11 22.75 -F stat degrees of freedom 17, 10 17, 10 19,8 19,8 -
Probability > F 0.0000 0.0011 0.0066 0.0001 -
Notes: * = p<O.1; ** = p<O.O5.
with the basic model and suggested that the basic inability to exclude outsiders variable in regressionsmodel estimates were robust to the ordinality of the where they are treated as continuous variables.dependent variables.
Final ModelThe ordinal explanatory variables can be dealt withby creating dummy variables for the various levels of Given these endogeneity and ordinality issues, a finalthe ordinal variable (and excluding one of the model was estimated using an ordered probit specifi-dummy variables). The results in Table B.9 indicate cation and dropping the two endogenous variablesthat it may be a poor assumption that these ordinal (see Table B.10). The results are generally consistentvariables can be treated as continuous variables. In with the basic model estimated by OLS.general, if it were the case that they could be treatedas continuous variables, one would expect that the Individual Indicator Category Modelsassociated dummy variables would have coefficientswith the same sign. This is the case for quality of The ordered probit models were also estimatedleadership but not for government visits or the inabil- restricting the samples to a single indicator category:ity to exclude outsiders. Furthermore, the signs on the CPUE for reef finfish; habitat for reefs; threats for overcoefficients on the individual dummy variables dif- fishing; and compliance for destructive fishing rules.fered from one regression to the next. These results Table B.11 reports these regression results. The sam-suggest caution when interpreting the coefficient esti- ple size for these regressions was smaller than themates for the government visits variable and the number of focus groups (1 33) since each focus group
ANNEX B 71
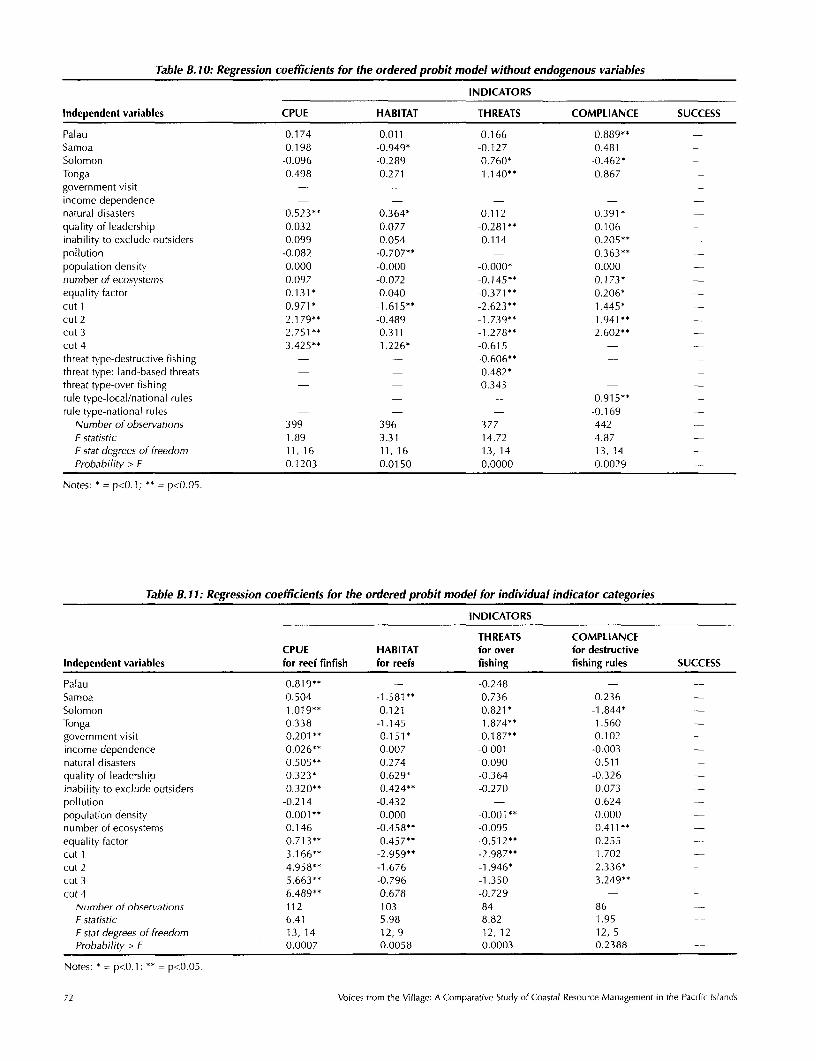
Table B. 10: Regression coefficients for the ordered probit model without endogenous variables
INDICATORS
Independent variables CPUE HABITAT THREATS COMPLIANCE SUCCESS
Palau 0.174 0.011 0.166 0.889**Samoa 0.198 -0.949* -0.127 0.481 -Solomon -0.096 -0.289 0.760* -0.462* -Tonga 0.498 0.271 1.140** 0.867 -government visitincome dependencenatural disasters 0.523** 0.364* 0.112 0.391*quality of leadership 0.032 0.077 -0.281** 0.106inability to exclude outsiders 0.099 0.054 -0.114 0.205**pollution -0.082 -0.707** - 0.363**population density 0.000 -0.000 -0.000* 0.000 -numberof ecosystems 0.097 -0.072 -0.145** 0.173* -equality factor 0.131* 0.040 -0.371** 0.206* -cut 1 0.971 * -1.615** -2.623** 1.445* -cut 2 2.179** -0.489 -1.739** 1.941 ** -cut 3 2.751** 0.311 -1.278** 2.602** -cut 4 3.425** 1.226* -0.615 - -threat type-destructive fishing - - -0.606**threat type: land-based threats - - 0.482*threat type-over fishing - - 0.343 - -rule type-local/national rules - - - 0.915**rule type-national rules - - - -0.169 -
Number of observations 399 396 377 442F statistic 1.89 3.31 14.72 4.87 -Fstatdegreesof freedom 11, 16 11, 16 13, 14 13, 14Probability> F 0.1203 0.0150 0.0000 0.0029
Notes: = p<0.1; ** = p<O.05.
Table B. 11: Regression coefficients for the ordered probit model for individual indicator categories
INDICATORS
THREATS COMPLIANCECPUE HABITAT for over for destructive
Independent variables for reef finfish for reefs fishing fishing rules SUCCESS
Palau 0.819** - -0.248 - -Samoa 0.504 -1.581** 0.736 0.236 -Solomon 1.019** 0.121 0.821* -1.844*Tonga 0.338 -1.145 1.874** 1.560 -government visit -0.201** -0.151* 0.187** 0.102 -income dependence 0.026** 0.007 -0.001 -0.003 -natural disasters 0.505** 0.274 0.090 0.511 -quality of leadership 0.323* 0.629* -0.364 -0.326 -inability to exclude outsiders 0.320** 0.424** -0.270 0.073 -pollution -0.214 -0.432 - 0.624 -population density 0.001 0.000 -0.001'* 0.000 -number of ecosystems 0.146 -0.458** -0.095 0.411**equality factor 0.713** 0.457** -0.512** 0.255cut 1 3.166** -2.959** -2.987** 1.702 -cut 2 4.958** -1.676 -1.946* 2.336* -cut 3 5.663** -0.796 -1.350 3.249**cut 4 6.489** 0.678 -0.729 - -
Number of observations 112 103 84 86 -F statistic 6.41 5.98 8.82 1.95 -F stat degrees of freedom 13, 14 12, 9 12, 12 12, 5 -Probability > F 0.0007 0.0058 0.0003 0.2388 -
Notes: * = p<0.1; ** = p<0.05.
72 Voices from the Village: A Comparative Study of Coastal Resource Management in the Pacific Islands

was allowed to choose the resources and threats for some of the explanatory variables were measured atwhich they would provide CPUE and threat trends. different points during this ten year period (e.g., nat-Thus, while 112 focus groups gave CPUE trends for ural disasters) while some of the dependent variablesreef finfish, only 84 gave threat trends for over fishing. were measured at the time of the survey. For the lat-Additional regressions based on different indicator ter group of variables, it had to be assumed that theycategories become more problematic as the samples measured site attributes that had not changed sincebecome smaller (e.g., only 47 focus groups provided before the beginning of the past decade if they wereCPUE trends for beche-de-mer, the second most often to be considered as "explanatory" variables. The lackmentioned resource). of dependent and explanatory variables whose timing
was appropriately matched (i.e., the explanatory vari-Comparing the results from these two sets of regres- able taking place before the dependent variable) rais-sions reveals that they are qualitatively very similar. es concerns over the ability to discern a causal rela-This suggests that aggregating across different tionship between these variables.resources, habitats, threats and rules, as was done inthe first set of models, does not affect the qualitative CPUEnature of the estimation results (although, of course,there were some differences between the coefficient Looking across the various models estimated, it wasand standard error estimates for the two sets of mod- possible to assess whether there was strong or weakels since they were based on different samples). evidence for a particular variable being a determi-
nant of catch per unit effort (CPUE). There was strongInterpretation of the Coefficient Estimates statistical evidence that the variables Samoa, govern-
ment visits, natural disasters, inability to exclude out-Assessing the significance of individual coefficient siders, and the equality factor were significantlyestimates required looking across the different mod- related to CPUE (see Table B.12). However, the gov-els to determine whether or not the statistical evi- ernment visits variable had both endogeneity anddence was strong. The results from the previous sec- ordinality problems and the inability to exclude out-tion indicated that the variables government visit and siders variable had ordinality problems. The inter-income dependence were likely endogenous. While pretation of the remaining significant variables is dis-their endogeneity did not appear to have a major cussed below.impact on the estimates of the other variables, it didmake interpretation of their coefficient estimates very The significant positive sign on the Samoa variabledifficult. The ordinal nature of the variables govern- indicated that Samoa had a higher CPUE relative to Fijiment visits and inability to exclude outsiders also (the excluded country dummy variable). Natural disas-made interpretation of their coefficient estimates dif- ters also had a positive impact on perceived CPUEficult. Once again, however, it appeared that the which may be explained by ecosystem recovery aftercoefficient estimates for the other variables were natural disasters. Another possible interpretation is thatrobust to the ordinality of these variables. natural disasters destroy fishing boats and gear, reduc-
ing total fishing effort and increasing CPUE. Finally, theAdditionally, there were a number of non-statistical sites rating higher on an equitable sharing of benefitsissues which had to be considered when interpret- and losses from coastal resource management hading the results from any of the regression models. more positive CPUE trend perceptions.Perhaps most important among these nonstatisticalissues was the fact that the dependent variables Habitatmeasured the focus group's perceptions of success,which may have differed from an ecologically based The various models for the habitat trend dependentmeasure of success. Local perceptions are likely to variable indicated that there was strong evidence thatbe a crucial element of successful ecological man- the natural disasters and pollution variables were sig-agement, but different factors may be significant nificant determinants of perceived habitat trends (seedeterminants of perceptions of success and success- Table B.1 3). As in the CPUE regressions, natural dis-ful ecological management. asters had a positive impact on the habitat trend (with
a similar interpretation). In contrast, the presence ofAnother nonstatistical issue was the timing of the pollution threats had a negative impact on habitatdependent and explanatory variables. Three of the trends. The natural interpretation is that pollutiondependent variables were measures of the percep- threats result in worse habitat trends.tions of the trend over the past ten years. By contrast,
ANNEX B 73

Table B. 12: Regression coefficients for CPUE
CPUE Regressions for different Model Specifications
no endogeneity probit modelIndependent variables basic model model probit model with dummies final model
Palau 0.338* 0.155 0.394 0.119 0.174Samoa 0.351** 0.269 0.300* -0.137 0.198Solomon -0.144 -0.078 -0.179 -0.711** -0.096Tonga 0.273 0.484 0.254 0.283 0.498government visit -0.083** - -0.099*income dependence 0.005* - - 0.006 0.005natural disasters 0.390** 0.421** 0.489** 0.778** 0.523**quality of leadership 0.083 0.025 0.098 - - 0.032inability to exclude outsiders 0.1 57** 0.078 0.194* - - 0.099pollution -0.057 -0.047 -0.104 -0.234* -0.082population density 0.000 0.000 0.000** 0.000** 0.000numberof ecosystems 0.063 0.079 0.080 0.147** 0.097equality factor 0.192** 0.116** 0.219** 0.208** 0.131*constant 0.609 0.851 **-cut 1 - - 1.269' 1.225** 0.971 *cut 2 - - 2.500** 2.480** 2.179**cut 3 - - 3.083** 3.070** 2.751**cut 4 - - 3.752** 3.750** 3.425**
Notes: * = p<0.1; ** p<0.05.
Table B. 13: Regression coefficients for Habitat
Habitat Regressions for different Model Specifications Independent variables
no endogeneity probit modelIndependent variables basic model model probit model with dummies final model
Palau 0.306 0.026 0.356 0.631 0.011Samoa -0.656 -0.838* -0.731 -1.202** -0.949*Solomon -0.229 -0.278 -0.216 0.064 -0.289Tonga 0.473 0.340 0.476 1.536** 0.271government visit -0.015 - -0.007 - -
income dependence 0.007 - 0.008 0.016* -
natural disasters 0.365* 0.362* 0.378* 0.800** 0.364*quality of leadership 0.088 0.068 0.097 - 0.077inability to exclude outsiders 0.074 0.055 0.069 - 0.054pollution -0.678** -0.681 -0.709** -0.886** -0.707**population density 0.000 -0.000 0.000 0.001* -0.000number of ecosystems -0.078 -0.060 -0.094 -0.081 -0.072equality factor 0.072 0.032 0.080 0.057 0.040constant 2.666** 3.01 7**cut I - - -1.199** -0.359 -1.615**cut 2 - - -0.062 0.825 -0.489cut 3 - - 0.741 1.661** 0.311cut 4 - - 1.653** 2.607** 1.226*
Notes: * = p<0.1; * = P<0.05.
Threats its and inability to exclude outsiders variables facedordinality problems.
There was strong statistical evidence that a largenumber of variables were significant determinants of Possible interpretation of the remaining variables wasthreat trends (see Table B.14). These included: as follows. Both the Solomon and Tonga dummy vari-Solomon; Tonga; government visits; quality of leader- ables were positively related to threats. Since a high-ship; inability to exclude outsiders; population densi- er threat rating indicates greater threats, this resultsty; number of ecosystems; the equality factor; and indicated that both the Solomons and Tongan sitesdestructive fishing practices threat type. Non- had a higher level of threats relative to Fijian sites.statistical problems with some of these variables Since all six Tonga sites were characterized by operencourages caution in interpreting the statistical access (out of a total of eight open access sites in theresults. Once again, the government visits variable data set), the Tonga variable was a close proxy of thewas likely endogenous, and both the government vis- presence of open access. With this interpretation, the
74 voices from the Village: A Comparative Study of Coastal Resource Management in the Pacific Islands

Table B.14: Regression coefficients for Threats
Threat Regressions for different Model Specifications Independent variables
no endogeneity probit modelIndependent variables basic model model probit model with dummies final model
Palau 0.558 0.170 0.436 0.832 0.166Samoa 0.175 -0.150 0.121 0.333 -0.127Solomon 1.040** 0.791 0.979** 1.309** 0.760*Tonga 2.124** 1.352** 1.870** 2.008** 1 .140**government visit 0.117** - 0.121 ** -income dependence 0.008 - 0.005 0.007natural disasters 0.223 0.136 0.188 0.116 0.112quality of leadership -0.417** -0.358** -0.359** - -0.281inability to exclude outsiders -0.268** -0.164** -0.227** - -0.114pollutionpopulation density -0.000** -0.000** -0.000* -0.000* -0.000*number of ecosystems -0.139** -0.125** -0.147** -0.221** -0.145**equality factor -0.446** -0.407** -0.430** -0.413** -0.371"*constant 4.151 ** 4.626** -cut 1 - - -2.310** -2.256** -2.623**cut 2 - - -1.414** -1.343* -1.739**cut 3 - - -0.947 -0.876 -1.278**cut 4 - - -0.273 -0.194 -0.615threat type-destructive fishing -0.688** -0.657** -0.652** -0.685** -0.606**threat type: land-based threats 0.526* 0.519* 0.478* 0.526* 0.482*threat type-over fishing 0.318 0.385 0.284 0.291 0.343
Notes: * = p<0.1; ** = p<0.05.
positive sign on the Tonga country dummy indicated Compliancethat sites with open access conditions had higher lev-els of threats. There was relatively strong statistical evidence that
the variables Palau and local/ national rules were sig-The quality of leadership variable has a negative nificant determinants of perceived compliance (seerelation with threats, indicating that threats trends Table B.15). The positive coefficient on the Palauwere perceived to be better where there was variable indicated that perceived compliance wasstronger local leadership. Additionally, the negative better in Palau relative to Fiji. The positive coefficientsign on the equality factor indicated that more equi- for the local/national rules variable indicated thattable distribution of losses and benefits lowered the national rules that were locally adopted had greaterperceived threat trend. Finally, the greater the num- perceived compliance than purely local rules (theber of ecosystems at a site, the lower the perceived excluded dummy variable).threats, possibly indicating that ecologically richerareas allow threats to be spread over a greater num- There was weaker evidence that natural disasters ledber of resources. to greater compliance, but the interpretation of this
result was less clear than in the CPUE and habitatOne particularly puzzling relationship was the nega- regressions. Finally, there was also somewhat weakertive coefficient on the population density variable, evidence that the Solomon variables had a significantindicating that greater population density lowers coefficient (see Tables B.1 7 and B.22). The negativethreats. The magnitude of the coefficient was small, sign on the Solomon coefficient would indicate thatsince the population density variable was measured perceived compliance was lower in the Solomonon a much larger scale from the other variables, rang- Islands relative to Fiji.ing from a fraction to 2,500 (there was wide variationin both village population - the numerator - and site Successsize - the denominator).
There was strong statistical evidence that theFinally, comparing the different types of threats, Solomons, government visits, natural disasters vari-destructive fishing practices appeared to have a lower ables, and the equality factor were significant deter-threat trend relative to the "other threats" category. minants of the aggregate success indicator (see TableThere was weak evidence that land based threats B.1 6). There was weaker evidence that the quality of(including pollution, sedimentation, and mining) had leadership, inability to exclude outsiders, and pollu-a higher threat trend than the excluded "other tion also determined perceptions of success.threats" category. However, the government visits and inability to
ANNEX B 75

Table B. 15: Regression coefficients for the Compliance
Compliance Regressions for different Model Specifications
no endogeneity probit modelIndependent variables basic model model probit model with dummies final model
Palau 0.961** 0.830** 1.107** 0.038 0.889**Samoa 0.507 0.382 0.672 0.026 0.481Solomon -0.378 -0.458* -0.326 -0.883** -0.462*Tonga 1.011 0.793 1.247* 0.244 0.867government visit 0.018 0.029income dependence 0.003 - 0.005 -0.003natural disasters 0.333* 0.327** 0.404* 0.574** 0.391*quality of leadership 0.083 0.099 0.084 0.106inability to exclude outsiders 0.151 0.173 0.166 - 0.205**pollution 0.196 0.193 0.362** 0.274* 0.363**population density 0.000 0.000 0.000 0.000 0.000number of ecosystems 0.155* 0.158* 0.168 0.125 0.173*equality factor 0.133 0.130 0.210 0.214** 0.206*constant 0.632 0.807 - - -cut 1 - - 1.731* 0.357 1.445*cut 2 - 2.226 0.894 1.941 **cut 3 - 2.889 1.600** 2.602**rule type-local/national rules 0.713** 0.710** 0.924** 1.149** 0.915**rule type-national rules -0.211 -0.200 -0.193 -0.083 -0.169
Notes: * = p<0.1; ** = p<0.0S.
Table B. 16: Regression coefficients for Success
Success Regressions for different Model Specifications
no endogeneity probit modelIndependent variables basic model model probit model with dummies final model
Palau 0.168 0.237Samoa -0.065 0.015 -Solomon -0.930** -0.707* -Tonga 0.266 0.897 -government visit -0.152**income dependence 0.001natural disasters 0.751** 0.815** -quality of leadership 0.256* 0.161 - -inability to exclude outsiders 0.191 * 0.062pollution -0.314* -0.269population density 0.000 0.000 -number of ecosystems 0.139 0.145 -equality factor 0.31 8** 0.229** -constant -1.767** -1.830** - -
Notes: * = p<0.1; ** p<0.05.
exclude outsiders variables need to be interpreted Open Access and Indicators of Successwith some caution, given the endogeneity and ordi-nality issues. Although there were problems with the inability to
exclude outsiders variable because of its ordinality, itThe negative coefficient on the Solomon variable was still puzzlingthatthis variable had a positive signindicated a lower aggregate perceived success in the in the CPUE regression and a negative sign in theSolomons relative to Fiji. Once again, both the natu- threats regression. In other words, it appeared thatral disasters and the equality factor variables were weaker marine tenure in restricted access sites werepositively related to perceptions of success. Similarly associated with a more positive CPUE trend and ato other regressions, quality of leadership had a posi- lower level of threats. The interpretation of thesetive impact while pollution had a negative impact on results requires further discussion.the aggregate success indicator (although the statisti-cal evidence was relatively weak).
76 Voices from the Village: A Comparative Study of Coastal Resource Management in the Pacific islands

First, the ordinality issue is likely a major constraint up differences among the non-open access sites.on how the inability to exclude outsiders variable can Therefore, the positive coefficient in the CPUE basicbe interpreted. The ordered probit model with model needs to be interpreted as saying that "amongdummy variables for the levels of the inability to non-open access sites, a lower ability to exclude out-exclude outsiders variable indicates that not only do siders was associated with a higher CPUE trend."these dummy variables have opposite signs within a Similarly, the negative coefficient in the threatssingle regression, but individual dummy variables regression needs to be interpreted as "among non-switch signs across the four regressions. This result open access sites, a lower ability to exclude outsidersindicates that treating the variable as a continuous was associated with a lower threat trend." However,variable is likely not a good assumption. even these qualified interpretations are puzzling.
The cause of this problem is likely the result of the A number of additional regressions were estimated towording of the question in the survey: assess whether the results from the basic model were
robust to different model specifications. First, the"What best characterizes the marine user rights of this Tonga observations (i.e., open access sites) werevillage: dropped from the basic model. Unsurprisingly, these
results were very similar to the basic model, which• The village leaders would have the power, if they included the Tonga sites and a Tonga country dummy
so decided, to exclude all non-villagers from the (the inability to exclude outsiders variable was signif-site. icant at the 5 percent level in both the CPUE and
threats regressions).* The village leaders would have the power, if they
so decided, to exclude all outsiders except other Next, a dummy variable was created which waspeople with traditional user rights over the site equal to one if either of the first two responses from
the inability to exclude outsiders variable were* Traditional leaders external to the village have the picked. A model was estimated using this dummy
power to exclude all outsiders except people variable in place of the inability to exclude outsiderswith traditional user rights over the site variable. This dummy variable was less significant in
the CPUE regression (only significant at the 10 per-@ Not possible to exclude outsiders because they cent level) but still significant at the 5 percent level in
do not obey traditional user rights the threats regression.
* Traditional user rights inexistent or eroded. Open Finally, to investigate the threat regression further, anaccess prevails." interaction variable was created by multiplying the
inability to exclude outsiders variable with a dummyThe first two possible responses and the final variable which indicated whether the threat could beresponse seem to represent a natural order from total handled at the local level. This interaction variable ispower to exclude outsiders to total open access. The intended to capture the idea that local managementthird and fourth responses, however, address some- regimes should only be expected to manage threatswhat different issues. The third response, in particu- that can be handled at the local level. When thelar, was prevalent in sites in Fiji, where paramount inability to exclude outsiders variable was replacedchiefs who may not be village residents had the right with this interaction variable, it was no longer signif-to issue licenses to external fishers (an act that was icant in the threat regression (whether estimated withseen negatively by the communities). Given the OLS or an ordered probit model).mixed nature of the possible responses, it is not sur-prising that the dummy variables for the individual Summarizing the results from these various models, itlevels of the ordinal variable switched signs within appeared that the inability to exclude outsiders vari-and across regressions. able has a significant problem in terms of its ordinal-
ity. Additionally, the interpretation of its coefficientEven if these ordinality problems did not exist and the estimates was complicated by the inclusion of thevariable could be correctly treated as a continuous Tonga country dummy, which is a good proxy forvariable, there were additional issues in terms of how open access sites. Finally, when the variable was cor-the variable's coefficient estimate should be interpret- rected to account for which threats can be handleded. Since all of the regressions include a Tonga coun- locally, it was no longer a significant determinant oftry dummy variable which is a close proxy for open the perceived threat trend.access sites, the inability to exclude outsiders picks
ANNEX B 77

Table B. 17: Additional variables and their descriptionVARIABLE NAME DESCRIPTION
Project completion percent percent of community projects attempted that were completed (a proxy forsocial cohesion)
Education percent of village population with secondary and tertiary educationPartnership presence of a management partner at the siteEase of marketing perishables ease of marketing perishables at the siteClose villages number of close villages (a proxy for settlement patterns)Cultural harvest requirement presence of cultural requirements to harvest coastal resourcesLevel of fishing technology level of fishing technology at the siteNumber of ecological features number of distinct ecological features (e.g., turtle nesting areas, rookeries)Local benefits from tourism does the community receive benefits from tourism?Conservation site is the site designated a conservation site?Sanctuary presence of a sanctuary at the siteRule type 2-destructive
fishing practices rule intended to limit destructive fishing practicesRule type 2-protected area rules rule intended to conserve protected areasRule type 2-outsiders restricted rule intended to restrict access by outsidersRule type 3-simple rules rule is a simple ban or other easily understood ruleRule type 4-conditional rules rule is a conditional rule such as seasonal ban or size limitsRule type 4-simple rules rule is a simple banRule type 5-conservation rule is a conservation rule
Alternative Specifications ables are significant determinants of perceptions ofsuccess.
In addition to the basic model (and the associatedmodels which attempted to address some of the main The OLS and ordered probit models indicated the fol-estimation issues), a number of alternative specifica- lowing relationships: education had a negativetions were estimated to shed light on other aspects of impact on perceived habitat trend; partnerships werecoastal resource management in the Pacific. A com- associated with higher threats; and the presence ofplete listing of the variables used in these alternative close villages decreased the habitat trend andspecifications is given in Table B.1 7. These variables increased the threat trend but decreased the compli-were included in the different models to address spe- ance assessment. There were some puzzling resultscific questions. here. The fact that partnerships were associated with
higher levels of threats may indicate the variable isThe Extended Model: OLS and Ordered Probit endogenous. Also, the negative relation betweenEstimation education and habitat trend may indicate that more
educated sites are more aware of habitat degradation.An extended version of the basic model was estimat- Finally, the presence of close villages had a mixeded by both OLS and ordered probit with very similar impact on the various indicators of success: a positiveresults to the basic model (see Table B.18 for the influence on compliance but a negative impact onordered probit results for CPUE, habitat, threats, and the other trends.compliance, and the OLS results for success). The fivevariables added to the basic model were: project Site Characteristics Modelcompletion percent (a proxy for social cohesion),education, partnerships, ease of marketing perish- An important issue in coastal resource managementables, and close villages. In general, the extended is how management funds should be allocatedmodel attempts to determine if these additional vari- among competing sites to ensure success. A variety of
78 Voices from the Village: A Comparative Study of Coastal Resource Management in the Pacific Islands

Table B. 18: Ordered probit coefficients for the extended model (OLS results for success)
INDICATORS
Independent variables CPUE HABITAT THREATS COMPLIANCE SUCCESS
Palau 0.344 0.283 0.146 1.154** 0.053Samoa 0.358** -1.250** 0.127 0.641 -0.165Solomon -0.007 -0.511 0.805** -0.686* -0.731Tonga 0.010 -0.437 2.330** 1.597** -0.034Government visit -0.114** -0.161* 0.139** 0.064 -0.203**Income dependence 0.005 0.005 0.004 0.004 0.000Natural disasters 0.546** 0.543** 0.064 0.271 0.753**Quality of leadership 0.093 0.338 -0.547** 0.072 0.276Inability to exclude outsiders 0.257** 0.311** -0.381** 0.047 0.219Pollution -0.076 -0.847** - 0.391 ** -0.436**Population density 0.000** 0.001 -0.001 0.000 0.000Numberof ecosystems 0.122** -0.017 -0.177** 0.068 0.132Equality factor 0.229** 0.006 -0.442** 0.279** 0.303**Project completion percent 0.003 0.011 -0.001 -0.010 0.016Education 0.004 -0.013** -0.002 -0.005 -0.003Partnership -0.153 -0.146 0.460** 0.205 -0.076Ease of marketing perishables -0.116 0.057 -0.055 -0.059 0.062Close villages -0.002 -0.015** 0.008** 0.013** -0.004Cut 1 1.860** -0.145 -3.214** -0.373 -Cut 2 3.094** 1.040 -2.310** 0.136Cut 3 3.678** 1.879** -1.837** 0.811Cut 4 4.351 2.823** -1.150 -Constant - - - -2.885**Threat type-destructive fishing - - -0.598*Threat type: land-based threats - - 0.551 *Threat type-over fishing 0.384Rule type-local/national rules - - - 0.945**Rule type-national rules - - - -0.119
Number of observations 399 396 377 442 124R-squared - - - - 0.5419F statistic 3.97 5.22 10.83 2.97 4.81F stat degrees of freedom 18, 9 18, 9 20, 7 20, 7 18, 9Probability> F 0.0200 0.0078 0.0018 0.0728 0.0104
Notes: * = p<0.1; ** = p<0.05.
site characteristics was included in a single model to Basic Model plus Sanctuary Variableassess which factors were associated with success(see Table B.19). In general, the model did not pro- Similarly, the sanctuary variable, when added to thevide particularly strong evidence on which of these basic model for the habitat regression, was not a sig-additional characteristics were good predictors of nificant determinant of the habitat trend.success. In fact, none of the additional site character-istics were statistically significant in more than two of Alternative Rule Type Specificationsthe five regression models.
Finally, a number of different categories of manage-Basic Model plus Conservation Site Variable ment rules were tested in the compliance regression.
The basic model included two dummy variables: out-The conservation site variable was added to the basic side rules and local/national rules (with the dummymodel to assess whether conservation status had a variable for local rules excluded). Four alternativesignificant impact on perceptions of success. The rule type specifications were tested: fishing practiceconservation site variable was not significant in any rules, protected area rules, and restrictions on out-of the five regressions. siders (with the dummy for "other" rules excluded);
ANNEX B 79

Table B. 19: OLS regression coefficients for the site characteristics model
INDICATORS
Independent variables CPUE HABITAT THREATS COMPLIANCE SUCCESS
Palau -0.418 0.119 0.824 0.932* -0.442Samoa 1.003** -0.812* 0.465 0.394 0.428Solomon -0.445 -0.319 1.680** -0.538 -0.918Tonga 0.601 0.062 1.346** 0.794 0.800income dependence -0.003 0.01 6** 0.005 0.005 0.002quality of leadership 0.059 0.006 -0.248 -0.016 0.043inability to exclude outsiders 0.039 0.077 -0.076 0.084 -0.108pollution 0.029 -0.473** 0.171 -0.231population density 0.000 0.000 -0.001* (0.(00 0.000number of ecosystems 0.092 -0.039 -0.260** 0.093 0.09:3project completion percent -0.012* 0.004 0.006 0.004 0.005marketing perishables 0.027 0.147 -0.149 -0.057 0.205close villages 0.002 -0.010** 0.007** 0.005 0.001cultural harvest requirement -0.135 -0.116 0.133 0.131 -0.021level offishingtechnology 0.621"" -0.033 0.196 -0.344 0.231number of ecological features -0.017 -0.238** 0.012 -0.049 -0.131 1ocal benefits from tourism -0.090 0.078 0.034 0.076 -0. ()1constant 1.742** 2.267** 3.924** 1.566 -1.161threat type-destructive fishing - -0.647*threat type: land-based threats - - 0.615**threat type-over fishing - - 0.410rule type-local/nationaI rules - - - 0.767""rule type-national rules - - - -0.111
Number of observations 399 396 377 442 124R-squared 0.0961 0.2057 0.4177 0.2608 0.4118F statistic 2.97 5.89 29.77 7.92 1.68F stat degrees of freedom 17, 10 17, 10 19, 8 19, 8 17, 10Probability> F 0.0419 0.0035 0.0000 0.0027 0.2(028
Notes: = p<0.1; ""= p<0.05.
simple rules (with the dummy variable for "all other" determine if there are patterned relationships withinrules excluded); simple rules and conditional rules each of the 5 sets of variables. To accomplish this(with the dummy variable for "other" rules excluded); goal, each set of variables was factor analyzed usingand conservation rules (with the dummy variable for the principal component analysis technique andnonconservation rules excluded). The results are pre- varimax rotation (an orthogonal rotation). Thesented in Table B.20. screen test was used to determine the optimal num-
ber of factors to be rotated. The results of theseOf the four alternative specifications, the binary clas- analyses are presented in Tables B.23 through B.27.sification of rules as simple rules versus all other rules Interpretations of these principal component analy-showed that simple rules had greater compliance. ses for each of the five sets of variables accompanyThere was also weak evidence that simple rules were the tables.more complied with than other rules when thedummy variable was included for conditional rules. With the factor analysis completed, component
scores were created to represent the position of indi-F. FACTOR ANALYSIS vidual villages on each of the components. The com-
ponent scores are the sum of the component coeffi-Given the relatively large number of explanatory cients times the sample standardized variables. Thesevariables, a factor analysis was used to determine if coefficients are proportional to the component load-there were patterned interrelationships within the ings. Hence, items with high positive loadings con-data. The resulting "factors" may represent more tribute more strongly to a positive component scoregeneral phenomena that can then be examined in than low or negative loadings. Nevertheless, all itemsterms of their relationship to the dependent vari- contribute (or subtract) from the score. Hence, itemsables. Sixty-four variables were included in the fac- with moderately high loadings on more than onetor analysis. The first step was to examine the vari- component (e.g., village age in the analysis presentedables to determine if there are any obvious group- in Table B.21) contribute at a moderate level to theings. This resulted in 5 obvious categories: social, component scores associated with each of the com-ecological, economic, coastal zone management ponents. This type of component score provides theprocess, and shock variables. The next step was to bestrepresentation of the data since they are stan-
80 Voices from the Village: A Comparative Study of Coastal Resource Management in the Pacific Islands

Table B.20: Regression coefficients for compliance assessment for various categories of rule types
COMPLIANCE ASSESSMENT OLS REGRESSION RESULTS
broad rule conservationIndependent variables basic rule types four rule types simple rules types rules
Palau 0.961** 0.233 0.911"' 0.935** 0.829*Samoa 0.507 0.474 0.465 0.494 0.446Solomon -0.378 -0.896** -0.504* -0.509* -0.522Tonga 1.011 0.785 0.553 0.538 0.631government visit 0.018 -0.031 -0.014 -0.016 0.013income dependence 0.003 0.001 0.004 0.004 0.003natural disasters 0.333* 0.001 0.265 0.248 0.336quality of leadership 0.083 0.057 0.140 0.142 0.095inability to exclude outsiders 0.151 0.022 0.161 0.161 0.152pollution 0.196 0.279** 0.150 0.146 0.142population density 0.000 0.000 0.000 0.000 0.000number of ecosystems 0.155* 0.121 0.068 0.074 0.121equality factor 0.133 0.037 0.102 0.108 0.130constant 0.632 1.888** 1.215* 1.216* 0.922rule type-local/national rules 0.713** -
rule type-national rules -0.211 - - - -rule type-fishing practices - 0.228 - -rule type-protected area rules - -0.562 - - -rule type-outsiders restricted - -0.169 - -rule type-simple rules - - 0.343** -rule type-conditional rules - - - -0.140rule type-simple rules - - - 0.439*rule type-conservation - - - - -0.108Number of observations 442 431 648 648 442R-squared 0.2599 0.3107 0.2448 0.2462 0.2259F statistic 6.56 9.67 9.21 13.43 6.66F stat degrees of freedom 15,12 16,11 14, 13 15, 12 14, 13Probability > F 0.0011 0.0003 0.0001 0.0000 0.0008
Notes: * = p<0.1; ** p<0.05.
dardized with a mean of zero and a standard devia- items loading highest on each of the two componentstion of one. These component scores can then be in Table B.21 provides some indication of patterns ofused in a multivariate regression analysis. interrelationships of the items in the sample villages.
In turn, these patterns can be interpreted as dimen-Social Variables sions of social variables.
The principal component analysis of the social vari- The items loading most highly on component oneables is displayed in Table B.21. The majority of the (either negative or positive) refer to rules (e.g., bound-
Table B.21. Principal component analysis of social variables
Principal Components
Explanatory Variables Local Control Competence
Inability to exclude outsiders 0.880 0.089Other villages with traditional user rights 0.765 -0.106Number of indigenous rules -0.735 -0.368Ratio of village to traditional users -0.692 0.044Boundaries clear to villagers -0.668 0.277Boundaries clear to outsiders -0.588 -0.189Number of outside rules 0.516 -0.011Completed development projects (percent) 0.044 0.775Secondary & tertiary education (percent) -0.005 0.678Compliance with local decisions 0.024 0.618Village age -0.492 0.558Quality of leadership 0.270 0.490Level of conflict 0.246 -0.441Extent to which village discusses issues 0.128 0.314Important decision makers outside village -0.374 -0.198
Eigenvalues 3.971 2.595Percent of total variance 26.472 17.301
ANNEX B 81

Table B.22. Principal component analysis of ecological variables
Principal Components
Explanatory Variables Ecosystem Diversity Land Use Diversity Population Pressure
Site size 0.780 0.007 -0.022Turtle nesting area 0.764 -0.004 -0.230Invertebrate abundance 0.762 0.110 0.190Sea bird rookery 0.758 -0.053 -0.012No. of distinct ecosystems 0.508 0.306 -0.133Abundance of resources 0.242 0.763 -0.087Forest land available -0.333 0.756 0.045Diversity of land use -0.310 0.642 0.253Conservation value 0.031 0.603 -0.639Population 0.177 0.542 0.141Traditional user pop. density -0.428 -0.114 0.749Traditional user population 0.033 0.172 0.650Population growth rate 0.236 0.377 0.597Fish spawning area 0.472 0.143 0.518Village population density -0.340 0.044 0.454Conservation area 0.004 0.242 -0.429Urban area -0.031 -0.014 0.311One village island 0.300 -0.140 -0.308Alternate fishing area -0.216 -0.494 0.226High island -0.472 0.494 0.221
Eigenvalues 3.844 3.106 2.899Percent of total variance 19.218 15.530 14.497
aries and user rights) and enforcement. Using a cut- tems. The high loading for number of distinct ecosys-off magnitude of 0.4, the variables loading negative- tems supported this interpretation. There were alsoly were: number of indigenous rules; ratio of village relatively high loadings associated with the presenceto traditional users; boundaries clear to villagers; of turtle nesting areas, bird rookeries, invertebrateboundaries clear to outsiders; and village age. The abundance, and fish spawning areas -all suggestingvariables loading positively were: inability to exclude ecosystem diversity. Most of the items loading highoutsiders; other villages with traditional user rights; on the second component were related to land useand the number of outside rules. This factor can be diversity. The moderate loading associated with ainterpreted as representing the degree of local con- high island clearly supports this interpretation, sincetrol. The factor included sites that: had strong indige- there are more distinct terrestrial ecological zones onnous rules; were able to exclude outsiders; and did high islands. Size of population, but not populationnot have conflicting control over their resources (i.e., density, also had a moderate loading on this compo-few outside rules and non-villagers with traditional nent, probably because with more land use options auser rights). large population can be more widely spread through-
out the available area. Finally, component three con-items loading a high positive on component two can sisted primarily of population pressure related vari-be interpreted as reflecting internal community com- ables. The moderate loading of fish spawning areapetence. The level of conflict variable (which loads was difficult to interpret, but the loading was mini-highly negative) reflected a lack of organizational mally different from its loading on the first compo-competence. The bottom two variables in the table nent. Together, the three components accounted forhad relatively low loadings on both factors and can 49 percent of the variance in the ecological variablesbe disregarded in this analysis. Together, the two data set.components accounted for 44 percent of the vari-ance in the data set, a modest but respectable Economic Variablesamount.
The three components resulting from a principalEcological Variables component analysis of the set of economic variables
accounted for 70 percent of the variance in the dataThe principal component analysis of the ecological set (Table B.23). Items loading highest on the firstvariable set is displayed in Table B.22. The variables component were related to commercial, high tech-loading highest on the first component in Table B.22 nology fishing. Items loading highest on the secondwere related to ecosystem diversity. The larger the site were all related to tourism development, and the twothe greater the chance there are numerous ecosys- loading highest on the third component were related
82 Voices from the Village: A Comparative Study of Coastal Resource Management in the Pacific Islands

Table B.23. Principal component analysis of economic variables
Principal Components
Explanatory Variables Commercial Fishing Tourism Development General Development
Level of resource use technology 0.815 0.064 -0.054Perishable market proximity -0.804 0.010 0.063Coastal products & tourism income (/o 0.654 0.076 -0.434Level of tourism development 0.018 0.904 0.098Resort area present -0.147 0.888 -0.170Degree of benefits from tourism 0.355 0.709 0.136Ease of marketing perishables -0.050 0.168 0.847Level of village development -0.370 0.190 0.773Dependence on subsistence/shell fishery 0.013 0.301 -0.633
Eigenvalues 2.025 2.273 1.968Percent of total variance 22.501 25.254 21.865
Table B.24. Principal component analysis of coastal zone management process variables
Principal Components
Explanatory Variables Intervention Control Equality
Presence of major partner 0.877 0.077 0.015Presence of a sanctuary 0.862 0.002 0.244Alternative income opportunities 0.540 -0.098 -0.228Local benefit from outside users 0.059 0.807 0.020Indigenous rules for crm -0.010 0.672 0.110Young involved in decision making -0.166 0.669 -0.523Losses from crm shared equally -0.260 -0.118 0.704Benefits from crm shared equally 0.165 0.277 0.605Females involved in decision making -0.285 0.297 -0.323
Eigenvalues 2.011 1.745 1.364Percent of total variance 22.347 19.384 15.156
to village development and marketing infrastructure. External Shock VariablesIt is not surprising that dependence on subsistencefishing had a high negative loading on the third com- The principal component analysis of the shock vari-ponent, since this variable is usually associated with able set is presented in Table B.25. The first compo-a lower level of development in Pacific Islands. nent of the analysis of the shock variables was relat-
ed to shocks external to the local community, bothCoastal Zone Management Process Variables natural and manmade. It is important to note that nat-
ural shocks (natural disasters such as typhoon, tsuna-The principal component analysis of the coastal zone mi, etc.) loaded negatively on this component, andprocess variables resulted in three components, the manmade external shocks (e.g., market for pro-accounting for 57 percent of the variance in the data duction, political events) loaded positively. Hence, aset (see Table B.24). The first component reflected high negative value would indicate external naturalaspects of intervention such as the presence of exter- shocks and a high positive would indicate externalnal partners, existence of sanctuaries, and the devel- manmade shocks. The second component reflectedopment of alternative income generating opportuni- primarily local shocks, such as pollution and devel-ties. Local control over the resources was the com- opment projects. This component was "reflected"mon thread that tied together the variables loading (high negative loadings), implying that a high nega-high on the second component. The final component tive score indicates the presence of these localreflected the equal sharing of both benefits and loss- shocks, while a high positive indicates their absence.es from coastal resource management. Involvement Finally, the third component was difficult to interpretof females in decision making did not load highly on since it had only one high positive loading, otherany component. shocks, which were not specified in the survey, and a
high negative, fishing technology. Together, the three
ANNEX B 83

Table B.25. Principal component analysis of shock variables
Principal Components
Explanatory Variables External Local Mixed
Natural disaster -0.752 0.356 0.178Pollution 0.068 -0.777 -0.007Market 0.579 0.330 0.159Political event 0.622 0.094 -0.119Development project -0.170 -0.771 0.109Fishing technology 0.288 0.192 -0.720Other shocks 0.078 0.076 0.815
Eigenvalues 1.410 1.485 1.265Percent of total variance 20.138 21.217 18.069
components accounted for 59 percent of the variance These 14 factors were then regressed against the fivein the shock data set. indicators of success. The results of these regressions,
however, were not particularly robust and were moreMultiple Regression Analysis using the Factor difficult to interpret than the regression analysis usingAnalysis Results individual variables. In the end, the quantitative
analysis incorporated the results of the factor analysisThe principal component analysis of 64 explanatory by using the equality factor in the regressions report-variables, divided into 5 logical groupings, resulted in ed in the previous section.a total of 14 factors.
84 Voices from the Village: A Comparative Study of Coastal Resource Management in the Pacific Islands

Bibliography
Adams, T. and E. Ledua (1997). Inshore resources Fa'asili, U. 1997. The Use of Village By-Laws inmanagement and conservation: current trends Marine Conservation and Fisheriesand alternate strategies. Paper prepared for the Management. Pacific Science AssociationPacific Science Association Inter-Congress meet- Intercongress, 1 3-1 9 July 1 997. Suva, Fiji.ing, Suva, Fiji, July 1997. South PacificCommission, Noumea, New Caledonia. Fa'asili, U. et al. 1997. Fisheries Extension Manual.
Guidelines for Extension Staff. Western SamoaAdams,T. (1997). The interface between traditional Fisheries Extension and Training Project.
and modern methods of fishery management in Ministry of Agriculture, Forests, Fisheries andthe Pacific Islands. Draft paper for: Ocean and Meteorology, Apia, Samoa.Coastal Management, South PacificCommission, Noumea, New Caledonia. FAO (1992). The Inshore Resources of Upolu,
Western Samoa: coastal inventory and fisheriesAdams, T., P. Dalzell and R. Farman (1997). Status database. Field Report No.3, FAO/UNDP Project
of Pacific Islands Coral Reef Fisheries, SAM/89/002. Apia, Samoa.Proceedings of the 8th International Coral ReefSymposium, 2: 1977-1980. FAO (1997). The Sustainable Contribution of
Fisheries to Food Security in the Oceania Sub-Biodiversity Conservation Network (1 998). Region of the Asia-Pacific Region: Review of
Analytical Framework and Communications Food Security Issues and Challenges in the AsiaStrategy, Biodiversity Support Program, World and Pacific Region. UNDP TSS1 Project -Wildlife Fund, Washington, D.C. Ras/95/01T, Gillett, Preston and Associates,
Lami, Fiji.Biodiversity Conservation Network (1999 in prepa-
ration). Overall Analytical Results, Biodiversity FAO/AusAID (1 998). Tonga fisheries sector review.Support Program, World Wildlife Fund, Food and Agriculture Organization of the UnitedWashington, D.C. Nations and Australian Agency for International
Development, Volume One, Rome andCrocombe, R. (1994). Workshop overview. Canberra.
Traditional Marine Tenure and SustainableManagement of Marine Resources in Asia and Gillett,R., K. Ruddle, R. Johannes, M. Pelasio, and E.the Pacific. International Ocean Institute Hviding (1 993). Bibliography of Pacific IslandOperational Centre, University of the South Traditional Fishery Practices, pages 40-69 inPacific, Suva, Fiji. South Pacific Commission 1993). Workshop on
People, Society and Pacific Islands FisheriesCrossland, J. and R. Grandperrin (1 979). Fisheries Development and Management - Selected
Directory of the South Pacific Commission Papers. Inshore Fisheries Research Project,Region. South Pacific Commission, Noumea, Technical Document No. 5, South PacificNew Caledonia. Commission, Noumea, New Caledonia.
Dalzell, P. and T. Adams (1994). The Present Status Holthus, P. F. (1991). Coastal Resource Use inof Coastal Fisheries Production in the South Pacific Islands: Gathering Information forPacific Islands. Working Paper Number 6, 25th Planning from Traditional Resource Users.Regional Technical Meeting on Fisheries, South Tropical Coastal Area Management, 5 (2): 11-14.Pacific Commission, Noumea, New Caledonia.
Holthus, P. F. (1997). Coastal and MarineEaton, P. (1985). Land Tenure and Conservation: Environments of Pacific Islands: Ecosystem
Protected Areas in the South Pacific. Classification, Ecological Assessment andSPREP/Topic Review 1 7, South Pacific Traditional Knowledge for Coastal Management.Commission, Noumea, New Caledonia. Chapter 21 in G. A. Maul (ed.). Small Island
Oceanography. Coastal and Estuarine Studies,Vol. 314. American Geophysical Union.
BI3LIOGRAPHY 85

Hsiao (1996). An Analysis of Panel Data. Cambridge Pacific Business (1998). Tough Time for Tourism.University Press, Cambridge, U.K. September 1998, Associate Media Ltd., Suva,
Fiji.Hviding, E. and K. Ruddle (1991). A Regional
Assessment of the Potential Role of Customary Pomeroy, R., R. Pollnac et al. (1996) ImpactMarine Tenure Systems in Contemporary Evaluation of Community-Based CoastalFisheries Management in the South Pacific. FFA Resource Management Projects in theReport#91/71. Forum Fisheries Agency, Honiara, Philippines. International Center for LivingSolomon Islands. Aquatic Resources Management (ICLARM) and
University of Rhode Island, Kingston, RhodeJohannes, R. E. (1994). Government-Supported, Island.
Village-Based Management of Marine Resourcesin Vanuatu. FFA Report#94/2, Forum Fisheries Pomeroy, R., R. PolInac et al. (1997). EvaluatingAgency, Honiara, Solomon Islands. Factors Contributing to the Success of
Community-Based Coastal ResourceJohannes, R. E.(1 978). Traditional Marine Management: The Central Visayas Regional
Conservation Methods in Oceania and their Project -1, Philippines. Ocean and CoastalDemise. Annu.Rev. Ecol.Syst., 9:349-64. Management, Vol. 36, Nos. 1-3, pp. 97-120.
Kearney, R. and T.Hundloe (1989). Review of Pollnac, R, and R. Pomeroy (1996). EvaluatingACIAR/ICLARM research on the culture of com- Factors Contributing to the Success ofmercially important invertebrates in the Pacific Community-based Coastal ResourceIslands. Australian Centre for International Management Projects - A Baseline IndependentAgriculture Research. Method. Anthropology Working Paper No. 54,
Anthropology Department and CoastalKendall, M., A. Stuart and J.K. Ord (1983). The Resources Center, University of Rhode Island,
Advanced Theory of Statistics (Volume 3: Design Kingston, Rhode Island.and Analysis, and Time Series). Charlese Griffinand Company Limited, London. Preston, G.L. and A. Wright (1990). Issues in South
Pacific Fisheries Development and ManagementKing, M., U. Fa'asili, and T. Taua (1998). in the 1990s. Paper presented at the ACP/EC
Community-based Management of Subsistence Assembly Meeting, Port Moresby. South PacificFisheries in Tropical Regions. Joint Paper pre- Commission, Noumea, New Caledonia.pared for the Regional Workshop on EconomicStrengthening of Fisheries in Small Island Preston, G.L. (1997). Review of Fishery ManagementDeveloping States, 14-18 September 1998. Apia, Issues and Regimes in the Pacific Islands. SouthSamoa. Pacific Regional Environmental Programme,
Apia, Samoa, South Pacific Commission,Laureti, M. (ed.). (1992). Fish and Fishery Products: Noumea, New Caledonia, and South Pacific
World Apparent Consumption Statistics Based Forum Fisheries Agency, Honiara, Solomonon Food Balance Sheets, 1961-1990. Food and Islands.Agriculture Organization of the United Nations,Fisheries Circular No 821 Revision 2. FAO, Pulea, M. (1993). An overview of constitutional andRome, Italy. legal provisions relevant to customary marine
tenure and management systems in the SouthMorrison, D. F. (1 976). Multivariate Statistical Pacific. Report 93/23, Forum Fisheries Agency,
Methods. Second Edition. McGraw-Hill, Tokyo. Honiara, Solomon Islands.
Munro, J. and S. Fakahan (1 993). Appraisal, Ram, V. (1981). The Socio-Economic Structure ofAssessment, and Monitoring of Small-scale Fisheries in Small Island Economies in the SouthCoastal Fisheries in the South Pacific Region. Pacific: Case Study of Fiji Islands. MS Thesis,Chapter 2 in: A. Wright and 1. Hill, Nearshore University of the South Pacific, Suva, Fiji.Marine Resources of the South Pacific, Instituteof Pacific Studies, Suva, Fiji. SAS (1998). StatView Reference Manual. SAS
Institute. Cary, North Carolina.NCDS (1994). National Center for Development
Studies at the Australian National University
86 Voices from the Village: A Comparative Study of Coastal Resource Management in the Pacific Islands

Sasabule, J. A. (1991). Fish Marketing and World Bank (1997). Investing in Biodiversity: ADistribution: A Case Study of Rural Fishermen in Review of Indonesia's Integrated ConservationWestern Province, Solomon Islands. Gizo, and Development Projects. Draft Report, TheInternational Centre for Ocean Development. World Bank, Washington, D.C.Western Province, Solomon Islands.
World Bank (1998). Enhancing the Role ofSiegel, S. and N. J. Castellan, Jr. (1988). Non- Government in the Pacific Island Economies.
Parametric Statistics for the Behavioral Sciences World Bank, Washington, D.C.- Second Edition. McGraw-Hill Book Company,New York and St. Louis. World Bank (1 998). A Comparative Study of Coastal
Resource Management in the Pacific IslandsSalafsky, N., B. Cordes, J. Parks, and C. Hochman Region - Concept Paper. World Bank,
(1999). Biodiversity Support Program: Evaluating Washington DC.Linkages Between Business, the Environment,and Local Communities - Final Analytical World Bank (2000a). Voices from the Field:Results from the Biodiversity Conservation A Comparative Study of Coastal ResourceNetwork. World Wildlife Fund, Washington, Management in the Pacific Islands. SummaryD.C. Report. Pacific Islands Discussion Paper Series,
No. 9a. East Asia and Pacific Region, PapuaSouth Pacific Regional Environmental Programme New Guinea and Pacific Islands Country
(SPREP). (1998). Action Strategy for Nature Management Unit. The World Bank, WashingtonConservation in the Pacific Islands Region, DC.1999-2002. Apia, Samoa.
World Bank (2000b). Voices from the Field:STATA (1999). STATA Vol. I User's Guide, and Stata A Comparative Study of Coastal Resource
Reference Manual, Volume 4, Su-Z. Stata Press Management in the Pacific Islands. Site VisitsCollege, Staton, Texas. and National Summaries Appendix. East Asia
and Pacific Region, Papua New Guinea andUnited Nations Development Program (1991). Kuria Pacific Islands Country Management Unit. The
and Aranuka Socio-Economic Profiles. Integrated World Bank, Washington DC.Atoll Development Project, Kiribati.
Wright, A. and L. Hill (eds) 1993. Nearshore MarineVan Pel, H. (1961). A Guide to South Pacific Resources of the South Pacific. Information for
Fisheries. South Pacific Commission, Noumea, Fisheries Development and Management.New Caledonia. Institute of Pacific Studies, Suva, Forum Fisheries
Agency, Honiara, and International Center forVeitayaki, J. (1990). Village-Level Fishing in Fiji: A Ocean Development, Canada.
Case Study of Qoma Island. University of theSouth Pacific, Suva, Fiji. Zann (1991). The Inshore Resources of Upolu,
Western Samoa. Coastal Inventory and FisheriesWhite, A. T., L. Z. Hale, Y. Renard and L. Cortesi Database. FAO/UNDP Field Report No. 5. Food
(1 994). Collaborative and Community-Based and Agriculture Organizations of the UnitedManagement of Coral Reefs: Lessons from Nations and United Nations DevelopmentExperience. Kumarian Press, West Hartford, Programme. Apia, Samoa.Connecticut.
World Bank (1995). Pacific Islands Economies:Sustainable Development of Fisheries. ReportNo. 1461 5-EAP. The World Bank, Washington,D.C.
BIBLIOGRAPHY 87


N, he I I I I t ' 1400 MnaaIs. (US) 1600 1700 180° 1700 10 1500
LC ts) MARSHALL Voices from the Villoge:. IS,ANC)S z y .,ISL,N.S_ PAlNU n . e . a . _ AComparative Study of Coastal ResourcePALAUAthIsad 10
oo t - v \ - -7 g Management in ePacificfslands
FEDERATED STATES iNORTH PACIFIC OEANOF MICRONESIA
.\~~~~~~~~~~~~~~~~~~~~~~~~~~~~~~~~~~~J ( dUS) I-A it IQ,
NAURU
INDONESIA PAPUA-, KIRIBATI
. NEWGUINEA *-
100 M-J-ille,- nK x,@4, 8 < W9is rn__-
Y- Wo \fHis andF]
VANUATU CTk
Niue ~~~~~~~~~~Frnch Pa~olye-200 So _Nt'f 200-
C _P J( 24FiC -.... ; _ ..._ _ _ __ __._ _ ___ ___ -__.-.
1700 TROPiC 5F CAPRIC'160 1500AUSTRALIA
.SOUTH PACIFIC OCEAN e FOCUS SITE LOCATIONS Q SUPPLEMENTAL SITE LOCATIONSFIJI: SAMOA: PALAU:
i1 Dromuna 13 Fusi 26 Ngiwal-30' Lord Hov~~~~~~~~~( m N- (Aus) Kara6 300- 2 Ucunivanuci 14 Satitoc 27 Kayangel
3 Susui 15 Manose 28 Peleliu4 Galoa 16 Papa 29 Koror5 Vunivutu 17 Solosolo 30 Melekeok
-} LINES OF DEMARCATION 6 Nakawaga 18 Lealoalii 31 Ngaremlengui-- : INTERNATIONAL BOUNDARY TONGA: SOLOMON ISLANDS:
7 Koulo 19 Fishing Villogema-. ie~u thissp,6ymawwD d eTsse,* .NEW 8 Lofanga 20 Luaniua
'-~ ~ ~~~~~~~~~7 boxcm calm, .. nomnakm O*eti , A, ^.f 9 Falevoi 21 Kia rsI , onhis.op lnot pin*,hp o,uT,he Wodd Bunk 10 Tu'anekivale 22 Cooksinc_4 ,o ) Gr,uuantneksglrof r y, ur-eWY 11 Nukuhetulu 23 Naro
.,dunwe.nt ~~~~~~~~~ ~~ _ -~~~~ 12 Haoatalu 24 Niuo140 - 0, 1600 1700 1800 25 Onne 0.
I I I


The World BankEast Asia and Pacii R g a
Papua New Guinea and Pacific Islands Country Managemeut Unit1W1n H Street, NW
Washington, DC 20433 000

bi * *4 W 4 ' *
PACIFIC ISLANDSDISCUSSION PAPER SERIES
THE USE OF FIRST AND SECOND LANGUAGES
IN EDUCATION (No. 1)
NADINE DUTCHER, 1 997
ASPECTS OF THE INDUSTRY, TRADE AND MARKETING
OF PACIFIC ISLAND TROCHUS (No. 2)
ICECON, 1997
PACIFIC ISLANDS STAKEHOLDER PARTICIPATION
IN DEVELOPMENT: SAMOA (No. 3)
ANTONY HOOPER
PACIFIC ISLANDS STAKEHOLDER PARTICIPATION
IN DEVELOPMENT: TONGA (No. 4)
KERRY E. JAMES
PACIFIC ISLANDS STAKEHOLDER PARTICIPATION
IN DEVELOPMENT: KIRIBATI (NO. 5)
BARRIE MACDONALD
PACIFIC ISLANDS STAKEHOLDER PARTICIPATION
IN DEVELOPMENT: SOLOMON ISLANDS (No. 6)
TARCISIUS TARA KABUTAULAKA
PACIFIC ISLANDS STAKEHOLDER PARTICIPATION
IN DEVELOPMENT: Fiji (No. 7)
WILLIAM SUTHERLAND
PACIFIC ISLANDS STAKEHOLDER PARTICIPATION
IN DEVELOPMENT: VANUATU (No. 8)
DARRYL TYRON
SUMMARY REPORT
VOICES FROM THE VILLAGE: A COMPARATIVE STUDY
OF COASTAL RESOURCE MANAGEMENT IN THE
PACIFIC ISLANDS (No. 9A) ;, /
WORLD BANK
u an'Io h e t .>-d B-lk }
Fa,-i\ Ain .d Pac,dfc Rgi-)Papua (,uinea and P.,cifc fIslanrd, s ouIr klMai agemeht l tlit
Wdshingt,mn, DC 211433-10 II(s1t

![Inclusione, innovazione, formazione SPUA 2… · P Ilaria Beretta [a cura di] L’umanesimo della smart city Inclusione, innovazione, formazione U SA Pensa MULTIMEDIA](https://img.dokumen.tips/doc/110x75/5f0d26287e708231d438eaa1/inclusione-innovazione-formazione-spua-2-p-ilaria-beretta-a-cura-di-laumanesimo.jpg)


![University of Utahmiller.biology.utah.edu/courses/3315/minkScans/scan0029.pdf · 2019. 11. 9. · p]emu! al-Il saôueleqd alpp!L1] saxalå spua»g aoeJ]ns leipaw pue lenuaA saôueleqd](https://img.dokumen.tips/doc/110x75/5fe5cfcea4d18018ce4fabcc/university-of-2019-11-9-pemu-al-il-saueleqd-alppl1-saxal-spuag-aoejns.jpg)


![University of Utahmiller.biology.utah.edu/courses/3315/minkScans/scan0010.pdfmoqle saxalå moqla spua»g moqla spua»g moqla spue»g sp]emyoeq elndeos p]e/vuo] smawnq Sllnd pue sruawnq](https://img.dokumen.tips/doc/110x75/5f37c0ad3888072e2d5f1013/university-of-moqle-saxal-moqla-spuag-moqla-spuag-moqla-spueg-spemyoeq.jpg)


![ralphbu.files.wordpress.comnsa!p Suruepva unz 'UêPJOMêî uap pun pupll-pqnoa uaqos -!MZ Ippow pun a9uppBêM -u!uqosqunp 'UOSJOd OJd Iqeza90M '4!saq u! .1aqp 'spua]l aqo!luqe pu!S](https://img.dokumen.tips/doc/110x75/5e6eef87c42c9602092d3da3/nsap-suruepva-unz-upjom-uap-pun-pupll-pqnoa-uaqos-mz-ippow-pun-a9uppbm.jpg)
![University of Utahmiller.biology.utah.edu/courses/3315/minkScans/scan0028.pdfspua»g spua»g suana pue sexelå suana pue saôueleqd spualxa med sale10] pue puooas saxalå NOIL3V snaueoleo](https://img.dokumen.tips/doc/110x75/5fd511b743102156cb037a3c/university-of-spuag-spuag-suana-pue-sexel-suana-pue-saueleqd-spualxa-med.jpg)


![University of Utahmiller.biology.utah.edu/courses/3315/minkScans/scan0025.pdf · sale10H sale101d qô!lll sale108 qô!141 slonppy slonppv spua»g quillpll!q spua»g p]emuno pue slonpqy](https://img.dokumen.tips/doc/110x75/5ffea4184ef3ff26124e18db/university-of-sale10h-sale101d-qlll-sale108-q141-slonppy-slonppv-spuag-quillpllq.jpg)


