Embed Size (px)
Citation preview

Document of
The World Bank
FOR OFFICIAL USE ONLY
Report No. 2843a-IN
INDIA
STAFF APPRAISAL REPORT
GUJARAT IRRIGATION II PROJECT
(IN TWO VOLUMES)
VOLUME II - SECTOR REPORT
April 9, 1980
South Asia Projects DepartmentAgriculture Division C
This document has a restricted distribution and may be used by recipients only in the performance oftheir official duties. Its contents may not otherwise be disclosed without World Bank authorization.
Pub
lic D
iscl
osur
e A
utho
rized
Pub
lic D
iscl
osur
e A
utho
rized
Pub
lic D
iscl
osur
e A
utho
rized
Pub
lic D
iscl
osur
e A
utho
rized
Pub
lic D
iscl
osur
e A
utho
rized
Pub
lic D
iscl
osur
e A
utho
rized
Pub
lic D
iscl
osur
e A
utho
rized
Pub
lic D
iscl
osur
e A
utho
rized

CURRENCY EQUIVALENTS
US$1.00 = Rupees (Rs) 8.40 1/
WEIGHTS AND MEASURES (METRIC SYSTEM)
1 meter (m) = 3.28 feet (ft)
1 kilometer (kin) = 0.62 miles (mi)1 hectare (ha) 3 = 2.47 acres (ac)1 million cubic meters (Mm , = 810 acre-feet (ac-ft)1 thousand million cubic
feet (TMC) = 28.32 Mm3
I cubic foot per second (cusec) 0.028 cubic metyrsper second (m Is)
1 ton = 1,000 kilograms (kg)
I ton = 2,205 pounds (lb)
1/ Until September 24, 1975, the Rupee was officially valued at a fixedPound Sterling rate. Since then it has been fixed against a "basket"
of currencies. As these currencies are floating, the US dollar/Rupeeexchange rate is subject to change. Conversions in this report havebeen made at US$1.00 to Rs 8.40, which represents the projected ex-change rate over the disbursement period.
FOR OFFICIAL USE ONLY
PRINCIPAL ABBREVIATIONS AND ACRONYMS
ADC - Area Development CommissionerB&C - Building and Communications DepartmentCAD - Command Area DevelopmentCADA - Command Area Development AuthorityCCA - Cultivable Command AreaG(P - Gross Domestic ProductGOG - Government of Guj aratGOI - Government of IndiaGWRDC - Guj arat Water Resources Development CorporationHYV - High Yielding VarietyID - Irrigation DepartmentLBC - Left Bank CanalLDB - Land Development BankMIP - Medium Irrigation ProjectRBC - Right Bank CanalRWS - Rotational Water SupplySDP - State Domestic Product
FISCAL YEAR
Government of Gujarat and Agencies - April 1 - March 31ARDC, Cooperatives - July 1 - June 30Commercial Banks - January 1 - December 31
GLOSSARY
Amul - Kaira District Cooperative Milk Producer's UnionBajra - Pearl milletJowar - SorghumTaluka - A sub-division of a district
I This document has a restricted distribution and may be used by recipients only in the performanceof their official duties. Its contents may not otherwise be disclosed without World Bank authorization.

I

INDIA
GUJARAT IRRIGATION II PROJECT
VOLUME II - SECTOR REPORT
Table of Contents
Page No.
I. INTRODUCTION ...... 1.........................................
II. THE STATE OF GUJARAT ...................................... 4
General ....... 4The Economy - Recent Trends ..... *. . . . . . .............................. . 4Employment ................................................. 6Socio-Economic Conditions ........... ... . ..................... 8- Population ....... ............................ 8- Rural Incomes .............. a........................... 8
Public Services ............................................................ 9- Transport ............................................... 10- Power ................................................... 10
III. THE AGRICULTURAL SECTOR .................................... 10
General .................................................... 10Climate .................................................... 11Topography and Soils ....................................... 11Land Use ................................................... 12Crops and Cropping Patterns ................................ 12Agricultural Production Trends ........................... .. 16Future Crops and Their Demand on the Irrigation System ..... 18ConcLusion .............................................................. 20
IV. THE IRRIGATION SUB-SECTOR ........ 20
Need for Irrigation . . .. ...... . . .. . . ................................ . 20Water Resources and Irrigation Potential ................ ... 21Past Development ........................................... 22- General Trends ............ .. . ................. ........... 22- Surface Irrigation Projects ........................... .. 24- Groundwater .............................................. 25
This report was prepared by Ms. A. Duncan, Mr. C.J.R. Bridge and Mr. P.Ljung, with contributions by Messrs. G. Finlinson and W.G. Rodger. Ms.D. Walters and Mrs. P. Gibson assisted with the statistical analysis.

ii
Table of Contents (continued)
Page No.
V. ASSESSMENT OF GUJARAT'S PAST IRRIGATION PROGRAM .. ........... 26
A. Irrigation Investments ...................... ................ 26General ............................ ......................... 26Economic Viability of Irrigation Investments . ............... 28
B. Utilization of Irrigation Potential . ......................... 29General .................... ....... .. .. .... ........ 29Irrigation Technology ....................................... 29Assumptions about Hydrology, Water Losses and CropWater Requirements ........................................ 30
Organizational Aspects .................... .................. 30Agro-Climatic Factors .................... . ........ ........ 33
C. Project Preparation ...... . ............ ... . .............. 34General . . ........................... 34Design of the Distribu'tion System .......................... 35- General ........... ...................................... 35- Alignment of Channe:Ls and Location of Outlets .. .......... 35- Cross Regulators ................... .35- Size of Chaks ... . ............... 35- Lining of the DistriLbution System ....................... . 38Commissioning Period ................... .. , 38Operation ..................... . .39
- Water Allocation Procedures ..... ......................... 40Maintenance ................................................. 42
VI. RECOMMENDATIONS FOR NEW PROJECTS .. # .......... ............. 42
General ......... ............................................ 42Planning Process .................... .... I ................... 43Project Preparation .......................................... 43Design Standards - .... . .... . .......... 43Construction Standards . . .............. 45Operational Procedures . . . .................... 45Organizational Changes ...................... . .. . 46
LIST OF ANNEXES
Annex 1 - Future Crops and Cropping P8.tternsAnnex 2 - Groundwater Resources

iii
Table of Contents (continued)
SUPPORTING TABLES AND MAPS
TABLES
T-1 - District-Wise PopulationT-2 - Characteristics of Rural PopulationT-3 - Farm Characteristics - District-WiseT-4 - Regional and Occupational Distribution of Income and AssetsT-5 - Area Under High Yielding Varieties in Gujarat StateT-6 - Fertilizer Consumption in Gujarat StateT-7 - Trends of Area Under Selected Major CropsT-8 - Trends for Yields of Selected Major CropsT-9 - Trends for Production of Selected Major CropsT-10 - Summary of Present and Forecast Groundwater BalancesT-11 - Irrigation Area as a Percent of Gross Cropped Area, Gujarat StateT-12 - Area Irrigated by Source as a Percent of Net Irrigated AreaT-13 - District-Wise Distribution of Irrigation by Minor SchemesT-14 - District-Wise Distribution of Irrigation by Major and Medium SchemesT-15 - Irrigation Trends Under Major and Medium SchemesT-16 - Utilization of Public Sector Irrigation InvestmentsT-17 - Utilization of Selected Major and Medium Schemes
MAPS
IBRD 13202R - Isohyets and Irrigation NeedsIBRD 13203R - Soils and SalinityIBRD 14606 - Major and Medium Irrigation ProjectsIBRD 14923 - Socio-Economic Sub-Regions

I
I

INDIA
GUJARAT IRRIGATION II PROJECT
Staff Appraisal Report
VOLUME II - SECTOR REPORT
I. INTRODUCTION
1.01 This volume gives an overview of Gujarat's irrigation sector. Itis the second comprehensive review that the Bank has undertaken 1/ of aState's existing irrigation project and its future program, with the objec-tive of identifying improvements in the planning, design, construction, oper-ation and utilization of these investments. The study also provides a frame-work within which to evaluate the extent and scope of the Bank's involvementin a State's irrigation program: in this State, the Bank Group is alreadyfinancing the Gujarat Irrigation Project (Credit No. 808-IN), and, with theproposed project 2/, would be involved at all levels of Gujarat's irrigationprogram. General issues of national policy, however--e.g., land tenure,agricultural prices, subsidies and credit--are outside the scope of the study.
1.02 The experience from Bank-financed projects in other States indicatesthat the findings and conclusions reached during these sector reviews areapplicable to most irrigation projects in the semi-arid zones of India. Thelow yields and especially the "underutilization" of irrigation potential havebeen major concerns of the Government of India (GOI) and the States. Numerousstudies and committees have dealt with the problem. 3/ In an attempt toremedy the situation, command area development (CAD) programs, focussing pri-marily on development below the government outlet--i.e., on the constructionof field channels, drains and land shaping--have been initiated in most irri-gation projects. It has become increasingly clear, however, that the lack of
1/ For the first sector review, see Maharashtra Irrigation II Project,Volume II, IBRD, Report No. 2529a-IN, September 13, 1979.
2/ The proposed project would consist of financing a five-year time sliceof Gujarat's irrigation program. The components of the project wouldbe three new major schemes (Damanganga, Heran and Karjan); partialmodernization of the State's largest irrigation scheme (Ukai-Kakrapar);development of parts of the Saurashtra coast, where groundwater is af-fected by saltwater intrusion from the sea; and various items of techni-cal assistance. For details, see Volume I of this report.
3/ See for example the Report of the Irrigation Commission, Ministry ofIrrigation and Power, New Delhi, 1972; and the Report of the WorkingGroup on Irrigation (Major and Medium Irrigation Program, 1978-83), GOI,Ministry of Agriculture and Irrigation, Department of Irrigation, NewDelhi, January 1979.
-2-
on-farm development is only a partial explanation for the low yields andunderutilization; and that the major constraints to higher yields and expan-sion of the irrigated areas are found between the dam and the government out-let.
1.03 Project design, water allocation and canal operation procedureshave changed little since the nineteenth century, when the prime objective ofirrigation was to provide insurance against droughts and famines. As a re-sult, most existing projects cannot provide a timely and reliable water sup-ply at the farm gate which is a prerequisite for productive, high valueagriculture. Because the water supply is unreliable, on-farm developmentis resisted by the farmers and has only a limited impact on the performanceof agriculture in the command areas. CAD works and improvements in irriga-tion infrastructure and project management are, thus, complementary and rein-force each other.
1.04 The recommendations in this review are made within the context ofGOI's and the Government of Gujarat's (GOG) development objectives: the pursuitof economic growth with a redistribution of incomes and wealth. Agriculturaldevelopment is perceived as a means of achieving both these goals, given that:
"...in a predominantly rural economy the key to alleviating povertyis to accelerate the growth of agricultural incomes...Extending thebenefits of irrigation to additional areas and optimising utilizationwill play an important role in promoting agricultural development...A substantial stepping up) of the utilization of the irrigationpotential created already, has to be obtained." 2/
Further, agricultural growth and the expansion of irrigation facilities arethe key to the removal of unemployment and significant underemployment, throughdirect effects on the agricultural sector and through indirect effects on thenon-agricultural sector.
1.05 Growth. The development of irrigation facilities has been a majorfactor in the growth and stabilization of agricultural productivity in Gujarat,both through an increase in the cropping intensi:y, and through a rapid growthin irrigated yields. Because of Gujarat's erratic rainfall, reducing the impactof drought is an important, though not unique, benefit of irrigation. Theagricultural sector still accounts for about 40% of the State's income, andprovides employment directly to about 65% of the labor force -- and indirectlyto a significant proportion of the non-agricultural population, through thedevelopment of agro-based industries and the mult:iplier effect on the State's
1/ Draft Five Year Plan, 1978-1983, Volume I, page 9.
2/ Development Program 1979/80, Budget Publication No. 19 Government ofGujarat, February 1979.

- 3 -
economy. Thus any growth in the agricultural sector will tend to raise outputand employment in the economy as a whole. The improvements in planning, design,construction, implementation and operation of irrigation systems to be intro-duced under the credit 1/ are designed to improve the utilization of irrigationinvestments, and thus their potential contribution to the growth of the economy.
1.06 Gujarat's agriculture has long been oriented towards cash crops,especially cotton and groundnuts. However, in recent years there has been arapid increase in the production of high-value fruit, vegetables and spices,crops for which there is buoyant demand generated by the growing urban popula-tion of the industrial belt between Ahmedabad and Bombay. A reliable supplyof these high-value cash crops would also form the basis of an expanding food-processing industry, which would help alleviate Gujarat's non-agriculturalunemployment problem. As most of Gujarat's fastest growing industries arehighly capital-intensive, further concentration of investment in such indus-tries will aggravate both income and employment inequalities.
1.07 Distribution. As well as providing general distributional benefitsthrough the development of agriculture, the proposed irrigation investmentsare also likely to result in more specific inter-regional and inter-farmerincome redistribution. The three new major schemes and the modernizationcomponent are all located in the poorest and most backward areas of the State.The small farmers and landless laborers will benefit through increased produc-tivity of the land, the former through direct income increases, and the latterthrough increased employment opportunities.
1.08 However, just as serious as the inter-regional imbalances are theinter-farmer inequalities, which have in many cases been exacerbated by theintroduction of irrigation. The improvements in planning, design, construction,implementation and operation to be introduced under the proposed credit wouldhelp prevent -- and in the old schemes, redress -- the present deficiencieswhich allow the farmers at the head of the system to take water at the expenseof those at the tail-end.
1.09 In conclusion, Gujarat's agriculture is tending increasingly awayfrom subsistence crops and towards cash crops: wherever reliable irrigationis available, there has been a rapid expansion of the area under fruit, vege-tables and spices. This is particularly true of Southern Gujarat -- wheremost components of the proposed project are located -- because the soils aresuitable and demand is strong in the nearby industrial belt. Irrigationinvestments in this area are thus a key element in Gujarat's developmentstrategy, not only in terms of the growth and employment they are likely togenerate, but also in terms of their income redistributional effect, and oftheir positive impact on regional balance.
1/ See Chapter VI of this Volume, and Volume I, para 1.17.

- 4 -
II. THE STATE OF GUJARkT
General
2.01 The State of Gujarat, covering an area of 19.6 M ha, has a popula-tion of about 32.0 M (1979). By most indicators it is one of the more advancedStates of India. It is fairly urbanized and has a large modern manufacturingsector. However, agriculture has a predominant influence on the State's eco-nomy and continuous economic progress is largely dependent on the removal ofconstraints to further agricultural growth, particularly through the expan-sion of irrigation.
The Economy - Recent Trends
2.02 Although Gujarat's economy is still dominated by the agriculturalsector, by Indian standards iit is relatively industrialized. The followingtable summarizes the present structure and recent growth trends of theeconomy:
Shares of Growth /aGross Domestic Product 1960/61 - 77/78Gujarat tndia Gujarat India% Average 1973/74-77/78 % p.a.---
Agriculture, Forestry,Logging and Fishing 36 44 2.9 /b 2.3
Mining, Manufacturing,Construction, etc. 29 23 3.3 4.7
Transport, Communication,Trade, Hotels, etc. 18 17 3.2 4.9
Banking, Insurance, PublicAdministrative and OtherServices 17 16 3.7 4.3
TOTAL 100 100 3.5 /b 3.5
Per Capita Gross Domestic Product 0.7 1.1
/a Exponential trend, fitted through least square regression./b Adjusted to exclude the extreme drought years of 1972/73 and
1974/75; the inclusion of these excepticnally low values distortsthe regression results.
2.03 In Gujarat, the agricultural sector accounts for about 36% of netdomestic product, a relatively small share, compared with 44% in the nationaleconomy. As a corollary, the share of the secondary sector (mining, manufac-turing, construction, etc.) is relatively large at nearly 30%, compared withthe all-India average of 23%. The shares of the other sectors in Gujarat aresimilar to those of the whole country.

- 5 -
2.04 Over the period i960/61-1977/78, both the Gujarat and Inojaneconomies experienced a similar overall growth rate, at 3.5% p.a., but witha different sectoral distribution, and different per capita growth rates.Due to Gujarat's rapid population growth rate, per capita incomes almoststagnated, increasing at only 0.7% p.a., compared with a national growth rateof 1.1% p.a. At the national level, the agricultural sector, which grew atonly 2.3%, proved a major constraint on the growth of the whole economy, whileall other sectors were particularly dynamic--notably transport, communication,trade, hotels, etc., which grew at nearly 5% p.a.. The growth of Gujarat'snon-agricultural sectors was less marked, partly because they started from ahigher base than those in the Indian economy.
2.05 The relative stagnation of the secondary sector in Gujarat(mining, manufacturing, construction, etc.) can be related principally tothe sluggish performance of the textile industry. In 1961/62, this industryaccounted for 66% of the value added in the industrial sector, but by 1976/77its share had declined to 34%:
% Share of Value Addedin the Industrial Sector 1/1961/62 1976/77
Textiles 66 34Chemicals 12 21Cement 2 1Machinery (Electrical and Others) 3 7Others 17 37
All Industries 100 100
The poor performance of Gujarat's textile industry was the result of factorsat the national level such as weak demand, price controls, and policies toprotect the handloom sector that had a corresponding effect on the textileindustry throughout India: between 1951 and 1975, national industrial produc-tion of textiles grew at only 1.4% p.a.
2.06 In absolute terms, the fastest growing sectors of Gujarat's economyhave been mineral production, especially of petroleum products, and manufac-turing of chemicals, whose share in the industrial sector increased from 12%to 21% in the period since 1961/62. However, these industries are highlycapital-intensive and have few linkages with the rest of the State's economy.Thus, they have not increased consumer incomes significantly and they havelargely failed to generate growth in other sectors. Manufacturing of machineryhas more than quadrupled since 1960/61, but it started from a low base and,currently, it accounts for only 8% of value added in manufacturing. Thedynamic growth of this sub-sector, which was fueled by the expanding demandfor irrigation pumps and engines, illustrates the strong linkages that existbetween agriculture and other sectors of the economy. Another example of theentrepreneurship for which the Gujarates are famous is the rapid growth ofIndia's export-oriented diamond cutting industry which is based in Suratdistrict. In spite of the impressive expansion of many manufacturing sub-
1/ Socio-Economic Review, Gujarat State, 1978/79, p. 20.

-6-
sectors, the dominant size of the textile industry has meant that the overallgrowth of the manufacturing sector has been welL below the all-India average.The sluggish performance of manufacturing has in turn affected transport,trade and services, which have grown relatively slowly.
Emplment
2.07 The labor force cornstitutes 31% of the total population. Its parti-cipation rate among the tribal population is significantly higher (over 40%)than for the population at large. About 67% of the labor force is employedin agriculture and allied activities with cultivators and agricultural laborersaccounting for 43% and 22%, respectively. Thus, about one-third of the agricul-tural workers are landless. Most of these landLess laborers are concentratedin the southern coastal areas where they constitute approximately half of theagricultural labor force.
Sectoral Composition Share of Stateof the Labor Force Domestic Product
… ----------.- ________%…_________________
Agriculture and alliedactivities of which: 67 36- cultivators (43)- laborers (22)- others - forestry, (2)fshing, etc.
Mining, manufacturing,construction, etc. 14 29
Transport, communication,trade, hotels, etc. 10 18
Banking, insurance, publicadministrative and otherservices 9 17
TOTAL LABOR FORCE 100 100
As productivity and incomes in the agricultural sector are among the lowestin the economy, any increases in agricultural productivity will have majorincome distributional benefits, as well as providing a stimulus to the non-agricultural sectors.
2.08 While the secondary sector (here defined as mining, manufacturing,construction, etc.) accounts for nearly 30% of State Domestic Product (SDP),it employs only 14% of the labor force. Industrial employment is heavilyconcentrated in the agro-based industries: over 60% of industrial workers areemployed in the food, drink and tobacco, textiles, wood, paper and leathergroups. Nearly half of all industrial workers are employed in the textileindustry.

-7-
Average No. ofWorkers EmployedDaily in Working
Industrial Sector Factories (1977)
Food, Drink and Tobacco 10.9Textiles 47.8Wood, Paper, Leather, etc. 3.7Chemicals and Chemical Products 9.9Mining, Metals and Minerals 13.2Machinery and Equipment 9.9Repair Services 2.2Other 2.4
TOTAL 100.0
At present, the fastest growing industries--chemicals and minerals--are alsoamong the most capital-intensive. If non-agricultural employment is to groweven at the same rate as the urban population, then the more labor-intensiveindustries, such as food, drink and tobacco, wood, paper, leather, etc. willhave to expand rapidly. Between 1960 and 1969, employment grew between 15%and 20% p.a. in the following industries: dairy products; canning and pre-servation of fruits and vegetables; grain mill products; bakery products.These growth rates were exceeded only in electrical machinery, bicycles andjewelry. 1/ If Gujarat's agricultural production--particularly of the high-value crops--grows rapidly, then the incentive for investing in the formergroup of industries is likely to be strong on both the demand and the supplyside. On the supply side, the timely and reliable provision of cheap inputs--such as cotton, mangoes, and fish for canning, dairy products, tobacco,leather, etc.--are likely to be as important as the existence of a strongmarket. Markets for the output of these industries are likely to be buoyantin Ahmedabad, Surat, Bombay, the rest of India and even the Middle-East.
2.09 However, even if labor-intensive industries expand rapidly, theyare unlikely to grow sufficiently within the next 20 to 30 years to absorb thecurrent un- and under-employment in the rural sector, let alone the expectedincrease in the population of working age. For the foreseeable future, then,the principal source of increased employment opportunities for the rural popu-lation will have to come from the agricultural sector, where more than two-thirds of the labor force are currently employed. Most of this increase willcome from the intensification of agriculture through irrigation, which wouldalso require significant amounts of labor in the construction phase.
2.10 Agricultural development will thus play a central role in the devel-opment of the whole economy over the coming decades, as the major potentialsource of increased incomes and employment for the majority of Gujarat's popu-lation; as a source of inputs for the agro-based industries which form an impor-tant part of Gujarat's industrial sector; and as the generator of increased de-mand for the output of all non-agricultural sectors of the economy.
1/ Artha-Vikas, Journal of Economic Development, Vol. IX, Nos. 1-2,January-July 1973, p. 147.

Socio-Economic Conditions
2.11 Population. Gujarat has one of the highest birth rates in Indiaand its 32.0 M population is increasing by about 2.6% per year. With about30% of its population living in towns and cities, it is, next to Maharasthraand Tamil Nadu, the third most urbanized of the States. Although the threelargest cities--Ahmedabad (population about 2 M), Surat and Vadodara--are alllocated on the Gujarat mainland, the Saurashtra peninsula, with an extensivenetwork of small and medium sized towns, is the most urbanized part of theState.
2.12 About 21% of the population belongs to traditionally disadvantagedgroups; scheduled tribes (14%) and scheduled castes (7%). The tribal popula-tion is heavily concentrated in the "backward" rural areas of the eastern hillregion--where the new major schemes are located--while the people of scheduledcastes are widely dispersed throughout the State. A relatively high participa-tion rate for women is characteristic of tribal agriculture, and the practicesare still fairly primitive: limited use is made of implements, fertilizers,pesticides or improved seeds, and even shifting cultivation is still practicedin a small area. Special prc,grams 1/ have been initiated for accelerating thepace of development of these "backward" areas. Provisions for these programsamount to 3.6% of the 1979/80 budget.
2.13 Rural Incomes. Rural areas of Gujarai: are characterized by a rela-tively equ'al distribution of income. 2/ In a normal year, about 40% of therural population have incomes below the poverty line (US$75). However, thereare large regional variations in the incidence of poverty. These incomedifferences (see Table T-4 for a detailed breakdown) can be explained largelyby ecological factors and the historic evolution of agriculture in the State.A significant variable in explaining variations in household expenditure is thecropping, or irrigation intensity of the village. 3/
2.14 The southern and central parts of the mainland, with high rainfalland relatively fertile soils are densely populat:ed with small farms and alarge proportion of landless households. Kutch and Saurashtra, with low and
1/ Such as the Five-Year Tribal Area Sub-Plan, the Integrated Rural Develop-ment Program; the Small Farmers' Development Agency; the Program forMarginal Farmers and Agriculturtal Laborers; the Drought Prone Area Pro--gram; etc.
2/ Since 1960/61, the Gini coefficient (an incicator of distribution) forconsumption in rural areas has ranged between 0.24 and 0.30, averaging0.28.
3/ Pravin Visaria: "Size of Land Holding, Living Standards and Employmentin Rural Western India, 1972-73", Preliminary Draft, October 1978.Joint ESCAP-IBRD Project on the Evaluation of Asian Data on IncomeDistribution, Working Paper No. 3.

- 9 -
unreliable rainfall and less fertile soils, have traditionally not been ableto support a large population, which is clearly reflected in the farm sizedistribution for the State (para 2.15). With the advent of irrigation andmodern farming practices, some of the low rainfall areas' natural disadvan-tages have been removed. These factors and the concentration of tribal peoplein the eastern hill region and the many small farms and large number of land-less laborers in the southern coastal plains largely determine the regionaldistribution of poverty in Gujarat (1970/71):
% of Poor in theRegion /a Rural Population
Eastern 76North Plains 41South Plains 64Dry Areas 53Saurashtra 52
/a See Map IBRD 14923.
2.15 Another determinant of regional variations in living standards, butless significant than the village cropping intensity, is the variation in farmsizes. Farms in the low rainfall areas are significantly larger than in highrainfall areas: (see Table T-3 for a regional breakdown).
High Rainfall Low RainfallFarm Size Gujarat Mainland Gujarat Saurashtra and Kutch
(ha) % of farms % of area % of farms % of area % of farms % of area
Below 1 23.8 3.0 30.6 5.0 5.6 0.51 - 2 19.1 6.8 22.0 10.4 11.3 2.52 - 5 30.1 23.9 29.5 30.5 31.5 15.95 - 10 17.4 29.9 12.7 28.2 30.0 31.9Above 10 9.6 36.4 5.2 25.9 21.6 49.2Total 100.0 100.0 100.0 100.0 100.0 100.0AverageFarm Size 4.1 ha 3.1 ha 6.8 haMedianFarm Size 2.5 ha 1.9 ha 5.3 ha
2.16 Tenancy legislation, giving tenants ownership rights to the landthey previously rented, has been strictly enforced in Gujarat. Dependingon the type of tenancy, the land has been transferred to the tenants eitherwith or without payment to the former owners. Tenants have either paid forthe land in installments or have taken loans for this purpose from GOG orland development banks. According to the 1970 Agricultural Census, 97% ofall holdings were fully owned; 2% were partly owned and partly rented; and1% wholly rented.
Public Services
2.17 Both the urban and the rural areas are served by a well developednetwork of primary schools and 98% of the pupils live within two kilometers
- 10 -
from their school. Primary school enrollment is 60% above the national averageand the literacy rate (36% in 1971) is one of the highest in India. However,the drop-out rate is high, and secondary school enrollment is only half of thenational average.
2.18 In rural areas, the number of doctors and health centers per 1,000persons is significantly above the national average. The provision of safedrinking water is a serious problem in this drought prone State, where thegroundwater is unreliable and often saline: GOG estimates that only aboutone-third of the 18,300 villages in the State have an adequate supply. Themost severely affected districts are Panchmahals, Vadodara, Junagadh, Kutch,Kheda and Rajkot. However, COG is increasing its efforts, and plans to sup-ply most villages with a reliable water supply by the end of the current fiveyear plan.
2.19 Transport. While the State is well-connected by railroads and air-routes, its road network has lagged behind compared with other States: Gujaratranks fifteenth in terms of road length per hundred square kilometers and perthousand of population. Out of 18,300 inhabited villages, only 6,200 haveall-weather communications and 5,200 have fair-weather roads. The inadequateroad network has acted as a constraint to a more rapid agricultural development.However, over 95% of the population lives within 3 km of a bus route.
2.20 Power. Progress in rural electrification has improved in the lastfew years and about 44% of the villages (8,100 out of 18,300) and 156,000 pumpsets are now connected. But (Jujarat still lags behind many other States: inTamil Nadu and Haryana, for instance, all villages have electricity, althoughthe per capita consumption of electricity is about 20% lower than in Gujarat.This is largely a reflection cof the capital-and ?ower-intensive developmentof the manufacturing sector that Gujarat has adopted in recent years. GOGplans to electrify almost all remaining villages by the end of the currentfive year plan.
III. THE AGRICULTURAL SECTORt
General
3.01 Gujarat's erratic rainfall imposes a severe constraint on its rainfedagriculture: yields of most crops are below the national average. However,they have increased faster than in most other parts of India, largely as aresult of improved varieties and farming practices. An important characteristicof the cropping pattern is the relatively small proportion of the sown areaunder foodgrains--it has declined from 47% in 1960/61 to 44% in 1978/79, com-pared with a national average of 73% in 1977/78--and the relatively high andincreasing proportion of the area under high-value cash crops. In value terms,this factor more than offsets the low yields, so that the value of productionper agricultural worker is the fourth highest in India.
3.02 A factor which will 4affect the future of agricultural developmentin Gujarat is the rapid growth of the urban population; as urban incomes tend

- 11 -
to be higher and to rise faster than agricultural incomes, so the demand for
higher value food crops--such as fruit and vegetables, sugar, spices and con-diments, dairy products, poultry, eggs and groundnut oil--is likely to increasemore rapidly than the demand for foodgrains over the next few decades, Whereverirrigation is available, the more perishable crops, such as fruit and vegetables,are likely to be heavily concentrated around the urban growth centers, or closeto a major road. As a response to the demand generated by the industrial stripbetween Ahmedabad and Surat, the central and southern parts of the State arelikely to be transformed over the next few decades into areas with concentratedbelts of market gardening and mixed farming.
Climate
3.03 Gujarat has a tropical monsoon climate with temperatures that aresuitable for gear-round cropping. Dailg minimum and maximum temperaturesrange from 13 - 27 C in January to 27 - 41 C in May. Annual rainfallranges from less than 300 mm in the Northwest to over 2,000 mm in a smallarea in the Southeast, with most parts of the State receiving 500-800 mm.About 95% of the rainfall occurs during the June-September monsoon. However,variations in the timing and quantity are great, and in more than 60% of theState, the rainfall is very unreliable (i.e. the coefficient of variabilityis over 40% 1/).
3.04 The low and uncertain rainfall, combined with limited irrigationfacilities, has made Gujarat susceptible to droughts and famines. The latestdrought years were in 1972/73 and 1974/75 when foodgrain production fell 50%below its normal level. Especially hard hit were rice and groundnut growerswho, on the average, lost two-thirds and three-quarters of their crop, respec-tively. In large parts of the State, there was complete crop failure whichled to severe malnutrition in spite of sizeable famine relief expenditures(about US$100 M following each of the two droughts). Although these droughtswere more severe than any other during the last two decades, drought in Gujaratis a regular occurance: since 1900 the State has experienced severe foodscarcity not less than 25 times -- averaging once in about every 3 years.
Topography and Soils
3.05 The State divides naturally into three geographical units: theGujarat mainland, the Saurashtra peninsula, and Kutch. Mainland Gujarat com-prises extensive alluvial plains flanked by hilly terrain in the east. Theland slopes gently towards the west and southwest and is traversed by theState's four major rivers (Tapi, Narmada, Mahi and Sabarmati) and numeroussmall streams. At frequent intervals, the major rivers cause widespreadfloods in the coastal areas. Due to the low gradient, natural drainage isinadequate in the northern and central-western part of the mainland; asso-ciated with the poor drainage are water-logging and salinity. Most of the
1/ This criterion was adopted by the Irrigation Commission (1972); thecoefficient of variability equals the standard deviation dividedby the mean.

- 12 -
southern mainland has deep black soils. The central mainland has sandy loamsoils in the western part and medium deep black soils in the eastern part.The soils of the northern mailand range from sandy alluvium in the hilly areasalong the Rajasthan border to sandy loam at lower elevations. Coastal allu-vium dominates along the Gulf of Khambhat.
3.06 The central part of the Saurashtra perninsula is elevated and theland slopes very gently towards the coast and the plains of the Gujaratmainland. Most of the rivers originate in this central table land and runradially into the sea. The central portion of the peninsula is characterizedby low hills of coarse and shallow residual soils, underlain by porous disin--tegrated rock, alternating with deeper clay loam or clay alluvial basins.Along the Gulf of Khambhat and the Arabian Sea, coastal alluvium predominates,while the soils along the Gulf of Kutch are sandy alluvium. In the coastalareas, the water table is shallow and some localized areas of salinity andhigh boron content occur. In recent years, over-exploitation of groundwaterhas resulted in an increasing problem of salt water intrusion along the sou-thern coast.
3.07 The Kutch land mass is crescent shaped, sloping towards the GreatRann in the north and the Little Rann and the Bay of Kutch to the south.The soils are generally derived from sandstones and limestones and are coarsein texture with satisfactory .internal drainage. Large areas are affected bysalinity arnd the Great and the Little Rann of Kutch are, without reclamation,unsuitable for agricultural production.
Land Use
3.08 About 9.8 M ha (52% of the reporting area 1/ in the State) is undercultivation. The forest area is only 1.6 M ha (3%) and cannot be reducedfurther without disturbing the ecological balance. About 3.8 M (20%) areeither barren, uncultivable, or put to non-agricultural uses. Officially,cultivable waste land accounts for 2.2 M ha (12%), but most of this land islocated in Kutch and has--without irrigation--ex-remely low production poten-tial. 2/ The remaining 1.4 M ha (8%) are either fallow or used as permanentpastures and grazing land. Thus, in practice, there is little scope for in-creasing the net cultivated area except through reclamation of desert, salineand ravine areas.
3.09 The cropping intensity (107%) is one oif the lowest in India.However, this figure gives a somewhat misleading picture of the intensity ofland use, since almost one-fifth of the area is cultivated with two seasonalor perennial crops. Given the low rainfall, the intensity of cultivation
1/ Land use is reported for an area of 18.8 M ha while the official estimateof the State's area is 19.6 M ha. Water bodies account for a part of thedifference between the two estimates, but the difference is mainly due toincomplete coverage of the land use surveys.
2/ Before 1970, about 1.4 M ha of cultivable waste land in Kutch was classi-fied as uncultivable.

- 13 -
cannot be significantly increased without irrigation. Further increases inagricultural incomes are primarily dependent on (i) continued yield increasesin rainfed areas; (ii) expansion of irrigation; and (iii) shifts in the crop-ping pattern to higher value crops.
Crops and Cropping Patterns (Tables T-5 to T-9)
3.10 There are three cropping seasons in Gujarat: kharif (June-October),rabi (October-February), and hot weather (March-June). Most of the croppingtakes place during kharif, utilizing the monsoon rainfall. In rabi, crops aregrown on residual soil moisture or with irrigation. Except in limited areaswith perennial irrigation, no cultivation is done during the hot weatherseason.
3.11 The climate and soils are suitable for cotton, groundnuts andtobacco, and Gujarat produces about one-quarter of India's cotton and ground-nuts and one-third of its tobacco. The area under tobacco (90,000 ha) issmall, but groundnuts and cotton are the most widely grown crops in theState, accounting for about 1.9 M ha (or one-sixth of the cropped area) and1.8 M ha, respectively.
3.12 Foodgrains--primarily pearl millet (1.5 M ha), sorghum (1.0 M ha),wheat (0.7 M ha), paddy (0.5 M ha) and maize (0.3 M ha) and pulses (0.4 M ha)--account for less than half the cropped area. As a result, Gujarat is seriouslydeficient in foodgrains; in a normal year, production is about 4.3 M tons,compared to estimated requirements 1/ of 5.7 M tons.
3.13 Pearl millet is the most important foodgrain, accounting for 30-35%of total production. It is grown as a rainfed kharif crop throughout theState, but is of lesser importance in the southern part. Since Independence,yields have increased at an annual rate of 5.4% largely as a result of success-ful research. Hybrid varieties were introduced in the mid-1960s and, atpresent, two-thirds of the area is covered by these varieties. However,since only 9% of the crop is irrigated, the average yield remains relativelylow (0.8 tons/ha).
3.14 Sorghum is grown as a food and fodder crop throughout the State.The kharif crop is almost without exception rainfed and the rabi crop ismostly grown on residual soil moisture. Short-duration HYVs are available,but because of their relatively poor fodder value, they are rarely used.Grain yields are extremely poor (0.4 tons/ha).
3.15 Wheat is the most popular rabi crop. High yielding varieties wereintroduced in 1967 and production has increased rapidly (8% p.a.). Abouttwo-thirds of this increase was due to improved yields and one-third due toexpansion of the wheat area. One-third of the crop is grown on residual
1/ Assuming: (i) a per capita daily requirement of 16 oz. (0.454 kg); and(ii) seed requirements and storage and transport losses amounting to10% of production.

- 14 -
soil moisture, especially in Ahmedabad and Kheda districts. Irrigated wheat,which is grown throughout the State, yields close to 2.5 tons/ha compared to0.7 tons/ha for the unirrigated crop. Wheat and coarse grains are the staplefood of the Gujarates.
3.16 Irrigated paddy (accounting for one-third of the rice area) isusually transplanted and gives an average yield of about 2.5 tons/ha. Therainfed paddy, with a yield of about 1.3 tons/ha 1/, is usually drilled. Highyielding varieties are primarily grown under irrigation. Since paddy requiresmuch more water than upland crops, paddy cultivation is concentrated in thesouthern part of the State, where soils and climate are favorable.
3.17 Maize is grown in the eastern hill areas where it forms and importantcomponent of the tribal diet. Like other kharif foodgrains, it is rarelyirrigated. However, hybrid varieties are gaining in popularity and now accountfor one-fifth of the area. The average rainfed yield (1.1 tons/ha) is higherfor maize than for any other foodgrain in the State.
3.18 Cotton is grown primtarily in the central and northern parts of themainland and in the northern part of Saurashtra. Quality has received moreemphasis in cotton than in other crops; in the 1970s, short staple cottoncontributed nearly two-thirds of the total production while it now accountsfor less than one-fifth of the crop. Gujarat produces over 50% of India'smedium, 30% of its long, and 60% of its extra-long staple cotton. SinceIndependence, the area of irrigated cotton has increased twenty-fold, butstill less than one-quarter of the cropped area is irrigated. Over thisperiod, yields have increased at an average rate of 2.3% p.a. mainly due tothe expansion of the irrigated area. Research emphasis has been on yields andquality, but little attention has been paid to the development of short dura-tion varieties for double cropping.
3.19 Groundnuts are grown primarily at Saurashtra under rainfed condi-tions. The yield is highly influenced by the rainfall; in the drought yearof 1972/73, the average yield was only 0.20 tons/ha while it reached 1.24tons/ha three years later. It is also affected by a number of diseases.which makes it a risky crop. The production of other oilseeds (especiallycastor) increased rapidly during the 1970s, primarily because of increasingyields, but also due to acreages expansion.
3.20 Tobacco is concentrated in a small area in Central Gujarat withfavorable climate and soils. Since it is a high value cash crop, cultivationpractices are well advanced and about half the crop is irrigated. Since theearly 1960s, yields have increased rapidly (by 4.6% p.a.) and are presentlyabout 1.5 tons/ha. The quality is low and the tobacco is primarily usedfor local cigarettes.
3.21 Sugarcane is the most important perennial crop grown under irriga-tion (58,000 ha). About half of this acreage is located in the command area
1/ Equivalent to about 0.8 tons/ha of milled rice.

- 15 -
of the Ukai-Kakrapar project. In this, and neighboring areas in Surat andValsad districts, the processing system is well developed. However, bothyields (about 60 tons/ha) and sugar recovery (about 9.7%) are low and haveremained stagnant since the early 1960s.
3.22 Other Cash Crops. With a large urban population in the State andeasy access to Bombay market, the market prospects for fruits and vegetablesare excellent. Mangoes are the principal fruit crop, grown primarily underrainfed conditions in the southern-most district of Valsad and, to a lesserextent with irrigation, along the Saurashtra coast. The second most importantcrop is banana, which is grown mainly with irrigation in Surat district.Vegetable production is also concentrated in the coastal areas of the Gujaratmainland. The main exception is potato, which has its principal area of pro-duction in the Banaskantha district. Other vegetables include onions,tomatoes, cauliflower, brinjal, ladies fingers and cabbage. Statisticson area, yield and production of most fruit and vegetables are virtuallynon-existent. 1/ However, based on fragmented revenue data on cropped areas,distribution of planting materials and turn-over in major markets, it appearsthat the production of fruit and vegetables increased at a rate of at least5% p.a. and possibly as much as 10% p.a. Most spectacular is the 19% annualgrowth rate for potato production since 1960/61, largely due to the introduc-tion of improved seeds and expansion of cold storage facilities.
3.23 Livestock and Dairying is an important feature of Gujarat's agri-culture. In 1974/75, the number of female buffalo, which provide most of theState's milk, was 2.1 M. Much of the stimulus for Gujarat's dairy industry hasbeen supplied by the Kaira District Cooperative Milk Producer's Union (Amul),which comprises 794 primary societies, with a total of 235,000 members. Itprocesses some 600,000 liters of milk per day, largely for supply to Bombay,and its dairy products are sold nationwide. Amul has been a powerful force inmodernizing the dairy industry; it maintains 580 artificial insemination cen-ters, popularizes green fodder cultivation and operates a cattle feed com-pounding factory. Its economic impact is illustrated by a recent socio-economic survey 2/ which showed that 56% of the incomes of farm households inthe Kaira District are derived from dairying. The success of Amul is beingspread over the State and, presently, there is a well established network ofsome 2,000 dairy cooperatives organized into 12 district unions.
3.24 The number of poultry and pigs increased very rapidly between 1972and 1977, at an annual rate of 23.4% and 3.3%, respectively. Poultry breedingfarms have been established and GOG is planning to institute a State eggsmarketing federation.
1/ Fruit and vegetables appear to account for about 8% of total agriculturalproduction and about 20% of the value of the output from irrigated areas.Since these crops are likely to increase in importance in the future, thelack of reliable statistics on the cultivation of fruits and vegetablesis a serious impediment to agricultural development planning.
2/ V. J. Vyas and N. J. Jodha, "Contribution of Dairying to Rural Economywith Particular Reference to Small and Marginal Farmers", in Dairyingas an Instrument of Change International Dairy Congress, India, 1974.

- 16 -
Agricultural Production Trends (Tables T-7 to T-9)
3.25 The early years after Indenpendence were characterized by a rapidacreage expansion; between 1950/51 and 1955/56, the cropped area increasedfrom 8.5 M ha to 9.5 M ha. Cotton accounted for half of this increase, fol-lowed by groundnuts, wheat and pearl millet. In the period up to the mid-1960s, the cropped area expanded much more slowly (by 0.6 M ha). However,
there were significant changes in the cropping pattern. The groundnut areamore than doubled, to somewhat over 2.0 M ha; this expansion took placelargely at the expense of the area under foodgrains (especially millets).An increase in the yields of most crops was comnbined with an expansion ofthe cultivated area and a shift towards high-value cash crops. As a result,between 1952/53 and 1964/65, the value of agricultural production grew fasterin Gujarat than in any other State.
3.26 Two factors changed the agricultural scene in the mid-1960s: (i)the potential for an expansion of the net cultivated area had largely beenexhausted; and (ii) high yielding varieties (HY'Vs) for a number of foodgrainswere introduced on a large scale (Table T-5). Most spectacular was the almosttripling of wheat production between 1965/66 ar.d 1978/79. About two-thirds ofthis increase was due to yield increases and one-third due to expansion of thearea under wheat. Similarly, the yields of the other major cereals increased
rapidly, but the cropped area declined; thus, the output of other cerealsgrew at an annual rate of about 3% compared to about 7.7% for wheat. However,much of the transformation that was associated with the "green revolution"took place between 1965/66 and 1971/72.
3.27 Largely because of favorable weather, all the indicators of agri-cultural performance--area, yield and production--reached a peak in 1971/72,a level which they only just regained in 1978/79. Fertilizer consumption(Table T-6) increased very rapidly from 1960/61, at a rate of 18.3% p.a.; it
doubled between 1965/66 and 1970/71, and again 'etween 1970/71 and 1978/79,in spite of the drastic price increases and supply problems over the 1974/75period. The use of modern vaLrieties of pearl millet, paddy and especiallywheat has spread quickly since 1971/72, but after an initial spurt, the use ofcotton HYVs has shown a recent decline. The area irrigated from groundwater
has grown very slowly compared to the rapid expansion of the 1960s.
3.28 There are a number of explanations for this mixed performance: (i)the weather--1972/73 and 1974/75 were extreme drought years and 1973/74 hadless than normal rainfall; (ii) the declining cotton yields and area sown; 1/(iii) increased costs of fuel affected the profitability of well irrigation;(iv) fertilizer prices were drastically raised in 1975/76; and (v) rapid
changes in output prices--foodgrain prices boomed during 1973 and 1974, fellduring 1975 and 1976 and rose again slightly in 1977 and 1978. Groundnut and
1/ Cotton is such a dominant crop in Gujarat's cropping pattern, that anymajor change in the cotton performance also affects total agriculturalproduction. The decline in yields was probably caused partly by diseaseand partly by a change in varieties.

- 17 -
cotton prices also declined in 1975 but increased in 1976 and 1977. The com-
bination of changing absolute and relative prices made crop planning extremelydifficult for the farmers. The perceived risks of droughts and falling pricesreduced the incentive for private farm investments.
3.29 However, the impact of the weather tends to obscure the underlyingtrends in Gujarat's agricultural development. Furthermore, the picture isdistorted by the lack of production statistics for high-value cash crops suchas fruits and vegetables. Thus, to get a correct picture of agricultural pro-gress during the 1970s adn the prospects for future growth, it is necessary tolook at some more basic "progress indicators": after a set-back during theearly 1970s, fertilizer use is again accelerating and the consumption in 1978/79was double that in 1970/71. The use of modern varieties is increasing, and asa result, the four major cereals all reached record yield levels in 1977/78 or1978/79. The use of HYV cotton has shown a decline but the production ofpotato and castor, which are non-traditional crops, has increased more thanfive-fold over the last decade. The area irrigated from groundnuts has grownvery slowly compared to the rapid expansion of the 1960s.
3.30 The decline in private groundwater development is due partly tothe factors discussed in para 3.28, but also to the fact that the limitof available groundwater is being reached in some of the most important ground-water areas. Since private groundwater development appears to have been themajor contributing factor to the increase in gross cropped area during the1960s and accounted for at least one-third of the productivity increase duringthe same period, it is clear that the lost momentum in groundwater developmentis a major cause of the relative stagnation of agricultural production duringthe 1970s. This indicates that a rapid expansion of irrigation facilities isa preprequisite for sustained agricultural development in Gujarat.
3.31 Even though the stagnation of recent years can largely be explainedby a combination of unfavorable exogenous factors, it is likely that the easybenefits of the "green revolution" have already been reaped. To regain themomentum, GOG's present plans give emphasis to:
(a) strengthening the agricultural supporting services;
(b) strengthening agricultural research, with special focus ondrought and pest resistant HYVs;
(c) developing improved dry farming techniques, with specialemphasis on methods of soil moisture retention, and expan-sion of the soil conservation program;
(d) encouraging shifts in the cropping pattern to higher valuecrops, for example, replacing groundnuts with soybeans andhybrid castor;
(e) expanding the canal irrigated area and accelerating thepace of modernization on existing projects, includingdrainage of the water-logged areas, and conjunctive useof surface and groundwater;

- 18 -
(f) controlling salt-water intrusion alont the Saurashtracoastline.
3.32 Given the past success of agricultural research in the State and thewell-educated and progressive farmers, the pros3ects for a sustained growthrate of agricultural production are favorable even without the Narmada develop-ment. However, with the Narniada project, Gujarat is faced with the opportunity,not only of stabilizing and maintaining a growth of production in physicalterms, but also of significantly increasing the value of its agriculturaloutput through a shift in the cropping pattern towards high-value crops.
Future Crops and Their Demand on the Irrigation System (Annex 1)
3.33 Design standards for the few existing large-scale irrigation projectsin Gujarat (para 4.11) evolved largely during the nineteenth century when theprime objective of irrigation was to provide "drought insurance" to extensiveareas of foodgrains. Over time, cropping patterns and crop varieties havechanged and, as a result, existing projects cannot provide the timely andreliable water supply that is the prerequisite for profitable cultivation ofhigh yielding, high value crops. Projects designed and constructed todaywill reach their full maturity some twenty years in the future. Consequently,the standards used for the planning and design c,f new projects must be raisedto meet not only the requirements of presently grown crops, but also--as faras possible--the likely requirements of future crops. Although it is impossi-ble to forecast accurately the future irrigated cropping patterns, cropvarieties, and the resulting demands on the irrigation systems, enough informa-tion is available for a broad assessment of the direction of change. Ingeneral, the factors that determine the future requirements on the irrigationsystem can be divided into two groups: (i) factors determining the croppingpattern; and (ii) the characteristics of future crop varieties. Market pros-pects and the suitability of the soils are prominent among the factors in thefirst group; date of planning, timing of irrigations and crop duration areimportant factors in the second.
3.34 Future market prospects are determined by a variety of socio-economicfactors such as:
(a) Rural/urban consumption patterns;
(b) The proportion of rural/urban population and the shiftin the distribution over time;
(c) The growth and distribution of incomes; and
(d) The elasticity of demand for various products.
The interaction of these factors is incomplete, and different studies makedifferent projections of the growth of demand fo:P various products; but theyprovide a relatively consistent basis for the following ranking of the crops:
- 19 -
Growth of Demand Crops
High Vegetable oil, fruits, vegetables,condiments and spices, pulses,dairy products, eggs and fish
Moderately High Wheat, sugar, cotton
Intermediate Rice
Low Sorghum, millets and other coarsegrains
On the supply side, the crops' response to irrigation, their genetic potentialand the comparative advantages among the States in the production of differentcrops, all influence the irrigated cropping pattern in Gujarat.
3.35 As evidenced by high yields, Gujarat's climate and soils give it acomparative advantage in the cultivation of cotton, tobacco, fruit and vege-tables, condiments and spices. These crops, with groundnuts, already accountfor at least one-third of the State's agricultural output in value terms, andthis share is likely to increase in the future. As one of the most industrial-ized and urbanized of the States, and with a fast-growing urban population,Gujarat as the advantage of rapidly expanding markets close to its most produc-tive agricultural areas. Ahmedabad, Surat and the industrializing belt betweenthem; the well-developed transport network in this particular belt; and therelatively advanced marketing and storage facilities all provide strong incen-tives for the production of these high-value, high-income elasticity crops,many of which (such as fruit, vegetables and milk) are perishable.
3.36 The following changes are likely to occur in the future in Gujarat:
(a) high value cash crops will become more important and coarsegrains less important;
(b) the cropping pattern will become more complex;
(c) most future varieties will be of shorter duration thanat present;
(d) crops will be planted at the optimum time; and
(e) irrigations will be given at critical stages of cropgrowth.
3.37 These changes have the following implications for the planning,design and operation of irrigation projects:
(a) the water supply will have to be reliable, i.e. the farmersmust be assured that they can get water at the time the cropneeds it;

- 20 -
(b) the operation of the systems will have to be more flexible;
(c) the peak carrying capacity of the system will have to be higherthan at present.
Conclusion
3.38 Gujarat's agriculture is well-placed to become highly productive bythe next century. Its advantages are:
(a) climate and soils that favor the cultivation of fruit, vege-tables, condiments and spices and the development of a dairyindustry;
(b) progressive and commercially-minded farmers; and
(c) rapidly expanding markets close to its most productiveagricultural areas.,
One of the major remaining uncertainties is: can the irrigation systems bemade complete and responsive to enough to exploLt this potential?
IV. THE IRRIGATION SUB-SECTOR
Need for Irrigation
4.01 Based on the amount of rainfall and its variability, GOG has assessedthe need for irrigation as follows:
Annual Coefficient of Irrigation Percent ofRainfall Variability Needs State's Area
Less than 500 mm over 60% Exceptionally High 16%Less than 500 mm 40 - 60% Very High 21%500 - 1,000 mm 40 - 60% High 26%500 - 1,000 mm 20 - 40% Moderate 26%1,000 - 2,000 mm 20 - 40% ModErately Low 10%over 2,000 mm 20 - 40% Low 1%
4.02 According to this classification, Kutch, with an annual rainfallof 250 mm-400 mm has a very high to exceptionally high need for irrigation.In Saurashtra, the rainfall is higher (400 - 70C mm) and more reliable, andthe need ranges from moderate in the eastern part to very high along the Bayof Kutch. On the Gujarat mainland, with rainfall ranging between 500 mm and2,000 mm, the need for irrigation decreases from very high in parts ofBanaskantha district in the north to low in parts of Valsad District in thesouth. But, as evidenced by the highly variable paddy yields, this classifica-tion of "low" needs in the south is misleading as it does not take intoaccount the uneven distribution of the monsoon rainfall. Irrigation needs

- 21 -
in the south are therefore higher than would be expected on the basis of annualrainfall alone. It is also the only area in which there are large storagesystems still to be developed.
4.03 Moreover, in terms of income distribution, the irrigation needs ofthe south are very high. This region, the "Eastern" area, is by all indica-tors the poorest region of the State, and a large proportion of its ruralpopulation is tribal (para. 2.14 and Map IBRD 14923). The Damanganga, Heranand Karjan schemes to be financed under the proposed credit are located there(Map 14606).
Water Resources and Irrigation Potential
4.04 The distribution of Gujarat's water resources is heavily concen-trated in the southern and central parts of the gainland. Three mijor rivers(Narmada,3with a mean annual runoff of 44,800 Mm ; Tapi, 19,700 Mm ; and Mahi11,800 Mm ) flow through this area, which has a relatively high rainfall.The northern mainland, Saurashtra and Kutch, with high to exceptionally highneeds for irrigation, have limited surface and groundwater resources.
4.05 The State's groundwater resou5ces are about 100,000 Mm3 1/ and thesurface water resources about 82,000 Mm 2/. However, the potential fordevelopment of the surface resources is limited by a number of factors:
(a) All the rivers, except the Narmada and the Tapi, areseasonal, and more than 90% of the total flow occursduring the June-September monsoon when the need forirrigation is the lowest;
(b) In most parts of the State and especially in Saurashtraand Kutch, the topography is not conducive to the con-struction of large dams and the dam sites are typicallycostly to develop; and
(c) The Narmada, Tapi and Mahi rivers all have the majorpart of their catchments in other States and theavailability of water for Gujarat depends largelyon interstate agreements.
I/ Source: Information from State Groundwater Directorate, quoted in"Irrigation Agriculture in Gujarat: Problems and Prospects" byV.N. Asopa and B. L. Tripathi. Indian Institute of Management,Ahmedabad.
2/ Source: "Report of the Irrigation Commission", Ministry of Irrigationand Power, New Delhi, 1972.

- 22 -
4.06 Taking these constraints into account, the available water resourcesand the present utilization of irrigation water, which is estimated at 34% ofthe potential, are estimated as follows:
Potential Water Resources Presently DevelopedSur- Sur-
Are2 Ground /a face Ground /a face Percent of
(km ) Water /b Water Total Water /d Water Total Potential
----------------------------------- Mn 3---------------_--_______________
Narmada /e - - 9,870 9,870 - 0 0 0%MainlandGujarat 84,800 9,710 12,880 22,540 2,300 7,060 9,360 41%Saurashtra 64,700 3,050 2,090 5,140 1,860 1,460 3,320 65%Kutch 45,600 340 390 730 150 330 480 66%
Total 195,100 13,100 25,230 38,330 4,310 8,850 13,160 34%
/a Source: Information from State Directorate of Groundwater Investigations./b Includes recharge from both rainfall and surface irrigation systems./c Source: "Perspective Plan of Gujarat 1974--1984", GOG, February 1972.Id Net withdrawals, assuming 40% return flow from pump-equipped wells and
20% from manually-operated wells./e The Narmada water will be transferred outs:ide the basin and benefit areas
in all the major sub-divisions of the State but the water allocation isnot yet decided. Consequently, the surface water resources of Narmadahave been listed separately.
4.07 The total groundwater resources will probably increase significantly--excluding those areas where the aquifers are saline and likely to remain so--since at least 15-20% of the total surface water diverted in an irrigationproject is likely to percolate to the aquifer int the command area. In Mahi-Kadana and Ukai-Kakrapar the freshwater aquifers are already highly charged asa result of surface irrigation. Groundwater development will be influencedby:
(a) the cost of pumping and the supply of fuel, for both privateand public wells;
(b) the level of service offered by wells, compared withcanals;
(c) the yield of the aquifer.
Given the above, the conjunctive use of ground and surface water is likely to
play an important future role.
Past Development
4.08. General Trends. In 1950, the irrigated area in Gujarat was onlyabout 0.46 M ha (5% of the cropped area), almost exclusively served from wells.

- 23 -
A number of irrigation projects were started in the 1950s, but implementationwas slow, and not until the early 1960s did the development of surface irri-gation accelerate. The private development of groundwater was much more rapidand accounted for two-thirds of the increase in the net irrigated area between1950/51 and 1975/76 as shown below:
AdjustedAccording to Official Statistics Estimate /a
1950/51 1960/61 1965/66 1970/71 1975/76 1977/78 1977/78-M a_____________---------------M ha ------------------------------
Major andMedium 0.02 0.08 0.18 0.29 0.37 0.42 0.28
MinorSurface 0.04 0.04 0.04 0.05 0.06 0.07 0.07
Groundwater 0.40 0.57 0.86 1.08 1.15 1.27 0.94
Total 0.46 0.69 1.08 1.42 1.58 1.58 1.32
/a The results from the 1970/71 agricultural census indicate that thearea irrigated, according to official statistics, from major and mediumschemes might be over-estimated by 50-60% and from groundwater by about30%. The adjusted estimate assumed that: (i) the census figures arecorrect; and (ii) the relative error in the agricultural official stat-istics has remained unchanged since 1970/71.
4.09 According to official statistics, about 18% of the cropped area(1.76 M ha) is presently irrigated. This figure is less than two-thirds of
the national average (28%), and only two States (Madhya Pradesh andMaharashtra) have a lower percentage of its cropped area irrigated. Wheatand cotton have accounted for most of the expansion of the irrigated areasince Independence. The general trends in irrigation of major crops are:

- 24 -
1951/52 1960/61 1965/66 1970/71 1975/76 /a-------------- ' 000 ha- --------------------
Wheat IR 180.6 218.2 341.9 413.8 461.6RF 146.3 139.5 173.1 233.5 224.7
Paddy IR 51.8 66.5 96.1 165.0 145.7RF 424.9 466.7 440.1 346.1 313.5
Pearl Millet IR 44.0 39.1 42.4 69.3 163.3RF 1,947.3 1,395.8 1,609.2 2,041.8 1,752.5
Sorghum IR 43.8 32.3 56.7 38.3 30.1RF 1,555.3 1,282.7 1,235.3 1,266.3 1,064.4
Cotton IR 17.8 105.2 1.94.5 355.2 384.2RF 1,172.9 1,697.4 1,556.5 1,389.8 1,393.3
Groundnuts IR 3.0 21.9 11.6 21.9 33.0RF 753.0 1,959.7 2,054.2 1,755.7 1,607.7
IR - Irrigated RF - Rainfed/a This is the latest year for which figures are available.
4.10 Surface Irrigation Projects. At Independence, there were onlytwo small canal systems in Gujarat both of which dated back to the ninteenthcentury. A major reason for the almost complete lack of irrigation projectswas that Saurashtra, which combines a high need for irrigation with a reason-able potential, consisted of about 200 Princely States. Their technical andfinancial resources were limited and even minor schemes created conflictsover riparian rights. Moreover, the alluvial plains of mainland Gujarat didnot offer easily developed damsites.
4.11 In the early 1950s, three major schemes were started (Map 14606):Mahi Right Bank Canal (RBC) with a cultivable command area (CCA) of about143,000 ha; Kakrapar, CCA of about 225,000 ha; and Shetrunji, CCA of about57,000 ha. Mahi and Kakrapar were both diversion schemes, while Shetrunji hasa dam for storage of monsoon flow for use in the rabi and hot weather seasons.On all three projects, progress of storage and diversion construction wasrelatively rapid but canal construction lagged far behind. The Bank Group'sfirst loan or credit for irrigation development in India financed the construc-tion of Shetrunji's canal system (Credit No. 13-IN, 1961, US$4.5 M). Likeother Indian irrigation projects financed by the Bank Group at about the sametime, the Shetrunji project failed to achieve i:s agricultural potential dueto inadequate agricultural supporting services and lagging construction offield channels and drains. These problems led GOI, the State Governments andthe Bank Group to focus on the development of the distribution network, aswell as the construction of dams and canals.
4.12 Based on these experiences, the Kadana Irrigation Project (CreditNo. 176-IN, 1970, US$35.0 M) was the first of a second generation of BankGroup financed irrigation projects in India. I1: included: (i) a dam across

- 25 -
the Mahi River mainly to provide storage for the Mahi RBC; (ii) constructionof a Left Bank Canal (LBC) with a CCA of 11,000 ha; (iii) extension of theMahi RBC to serve 263,000 ha; (iv) construction of field channels, drainsand landshaping and financing of these works through institutional credit;(v) construction of market roads; and (vi) an agricultural support program.The Kadana project is now essentially completed, about two years behindschedule due to two extreme floods which seriously disrupted dam construction,and to other construction problems. A Project Completion Report is underpreparation.
4.13 The Ukai project was started in 1960 to provide carry-over storagefor the Kakrapar Project and to extend the CCA to cover a total of about375,000 ha. Up to 1977, an irrigation potential of 314,000 ha had been created,but only about 146,000 ha were actually irrigated. The canal system, especiallyin the old Kakrapar part, was not designed to meet the exacting requirements ofmodern high yielding varieties and inadequate drainage has created problems ofwaterlogging. The GOG is presently undertaking a major program of on-farmdevelopment, drainage and modernization works in the Ukai-Kakrapar command,part of which is to be financed under the proposed credit. Command areadevelopment is also in progress in the Shetrunji and Mahi-Kadana areas.
4.14 While the State's major irrigation works are concentrated on theGujarat mainland--only Shetrunji is located in Saurashtra and no major proj-ect is located in Kutch--the about 65 completed medium irrigation projects(MIPs) are located in all parts of the State. The dry areas of Kutch andSaurashtra have been given priority in the concentration of MIPs. However,because of the limited water resources in Kutch, only a few medium projectshave been built there.
4.15 Typically, tanks for storage of local runoff during the monsoonprovide only supplementary irrigation during the kharif season and the areairrigated varies substantially from year to year. The district panchayatsare responsible for the construction--with the assistance of the Public worksDepartment's Irrigation Wing--and the maintenance of tanks and other minorirrigation projects. Due to the large variations in monsoon rainfall andpoor maintenance, the water supply from these projects is unreliable, andthey have lower priority than major and medium projects. The exception isin the low rainfall areas of the State where there are few possibilities forlarger projects and where important social benefits can be derived fromminor irrigation projects.
4.16 Groundwater. For centuries, Gujarat farmers have used wells forirrigation. At Independence, the well irrigated area in the State was0.40 M ha. During the 1950s, the well irrigated area increased at an annualrate of about 3.5%, mainly due to the sinking of new wells. In the 1960s,the pace of development almost doubled and traditional lift methods such asPersian wheels, poise lifts and rope-buckets were rapidly replaced by pumpsdriven by diesel engines. In several areas, the limit of groundwaterresources is now being approached and the overall pace of developmentis slowing down. At present, there are some 700,000 wells, over half of whichare equipped with pumpsets, and about 2,500 tubewells.

- 26 -
4.17 In the hard rock areas of Saurashtra, large diameter open dugwellsmust be used. These wells depend on rains for annual recharge and the welldischarge varies substantially over the year. In years of low rainfall, manyof the wells are almost completely dry. In the alluvial areas, dug-cum-borewells are usually used. They are a development of the open dug well in thata boring of about 15 cm diameter is sunk in the bottom of the dug well in orderto increase the flow. These borings may be as deep as 100 m. A dug-cum-borewell in alluvium typically has three times as large capacity as dug well inhard rock areas, and the discharge is much more reliable. Most of the tube-wells are located in the northern part of the Gujarat mainland with deepalluvial soils. Public tubewells--slightly over half of all tubewells--areconstructed by the Gujarat Water Resources Development Corporation but areoperated and maintained by the district panchayats. Private tubewells areoften owned by a group of farmers.
4.18 Investigations of groundwater potential and the establishment of wellspacing criteria are the responsibility of the State Directorate of GroundwaterInvestigations. Gujarat is, so far, the only Indian State that has passedgroundwater legislation, but it has not yet become effective. In the mean-time, GOG relies on lending institutions for the enforcement of well spacingcriteria; this program has been any partially sluccessful.
4.19 There are two major problem areas in the State. One is locatedin the areas with a deep aquifer in Mahesana District, the other along thesouthern coast of Saurashtra. In the latter aresa, overdraft of the aquiferhas occured for about two decades. This has re,ulted in a worsening problemof salt water intrusion from the sea and each year a number of wells go out ofproduction and the area irrig;ated declines rapidly. The proposed projectwould finance the construction of small and medium sized surface irrigationschemes along the coast to replace the wells and, thus, take the pressure ofthe aquifer.
4.20 The IDA has supported the development of groundwater in the Statethrough the Gujarat Agricultural Credit Project (Credit No. 191-IN, 1970,US$35.0 M). This project financed, inter alia, construction of about 41,000wells and about 450 tubewells, and installation of about 45,000 pumpsets.
V. ASSESSMENT OF GUJARAT'S PAST IRRIGATION PROGRAM
A. Irrigation Investments
General
5.01 Since the beginning of the First Five Year Plan, GOG has made con-siderable efforts to expand the irrigation facilities of the State, primarilythrough investments in major and medium projects and through the support ofprivate groundwater development. In previous plans, irrigation has amountedto about one-sixth of the State's expenditures, but its share has now risen to25%. In each successive plan, the expenditures on major and medium projectshave increased significantly in real terms:

- 27 -
/aInvestments- Irrigation Potential Created
Area Cost per ha During During During Cumulative
Plan Period Plan Cumulative Plan Cumulative Plan Average------- Rs M-------- ------- '000 ha----- ---- Rs--------
First(1951/52-1955/56) 707 707 23 23 30,740 30,740
Second(1956/57-1960/61) 1,196 1,903 160 183 7,480 10,340
Third(1961/62-1965/66) 1,218 3,121 158 341 4,410 9,150
Annual Plans(1966/67-1968/69) 1,053 4,174 98 439 10,740 9,510
Fourth(1969/70-1973/74) 2,263 6,437 183 622 12,370 10,350
Fifth(1974/75-1978/79) 3,110 9,547 394 1,016 7,890 9,400
/a The all-India investment price index has been used to convert the invest-ments to constant 1978/79 prices.
/b These costs are calculated by dividing the expenditures by the number ofhectares of potential created during that period. They are not costs perha of potential created in any one project (para 5.04).
5.02 Thus, since 1951/52, GOG has invested a total of about Rs 9,547 M(US$1,137 M) in major and medium irrigation schemes. During the same period,the irrigation potential 1/ created has increased by 1.02 M ha, from 0.02 M hato 1.04 M ha. The average cost per ha of "irrigation potential created" duringthis period has been about Rs 9,400 which is about 30% higher than the nationalaverage. The higher cost can, to a large extent, be explained by a relativelack of good dam sites. However, the "utilization" (para 5.04) of the irriga-tion potential created is significantly lower in Gujarat resulting in a costof Rs 16,000 per irrigated ha, or about twice the national average: Thisconsiderable difference in cost is due to the following factors:
1/ The irrigation potential is calculated by a straight addition of theareas under all irrigated crops in the design cropping pattern, no matterhow much water the crops require, how long they stand in the field orwhat economic benefits they produce. The irrigation potential has been"created" when the Government system has been constructed down to outletsserving 40 ha blocks.

- 28 -
(a) The State has few really large-scale project possibilities,which--because of the economies of scaLe--would have resultedin a lower cost per ha;
(b) Many of the dam sites are expensive to develop due to arelatively flat topography;
(c) The inclusion of perennials in the cropping pattern--forwhich the climate of Gujarat is suited---reduces the areathat can be irrigated with a limited amount of water; and
(d) Many parts of Gujarat are drought-prone and, consequently,GOG has used low irrigation intensities in the design ofprojects in order to benefit as many farmers as possible;this means the distribution system is extended over largeareas, which results in a higher cost rer ha of irrigationpotential created.
Economic Viability of Irrigation Investments
5.03 The economic viability of GOG's irrigation investments is determinednot only by the investment cost per hectare, but also by the rate of projectimplementation and the resulting agricultural production. No comprehensivedata exist which permit an accurate estimate of the agricultural benefits thathave resulted from GOG's investments in major and medium projects. However,a project completion report on the Mahi-Kadana project recently undertaken bythe Bank shows a rate of return of 12% on the whole project, which is approxi-mately equal to the opportunity cost of capital. 1/ Most medium irrigationprojects appear to have a higher rate of return due to their shorter gestationperiods. The large Ukai-Kakrapar Project appears to have a lower rate ofreturn. For the whole investment program, it is Likely that the rate ofreturn has exceeded 12%, but that due to delays in construction 2/ and lagsin utilization, it has been below the national avierage. It should also benoted that the indirect economic and social benef:Lts are considerable in thisdrought prone State. Nevertheless, the analysis in the remainder of thischapter shows that it would be feasible to achieve higher economic returns bycorrecting existing deficiencies. In fact, by adopting the recommended designstandards GOG could, with a given investment budget: (i) irrigate a largerarea; (ii) benefit more farmers; and (iii) achieve a higher agricultural pro-duction in the command areas.
1/ The opportunity cost of capital for India is estimated at 12%.
2/ This is particularly the case in the Ukai project; although the dam wasnearing completion in 1970, practically no work was done on the canaland distributaries. The cost of the canal system was therefore very muchhigher than originally assumed and the benefits were also delayed.

- 29 -
B. Utilization of Irrigation Potential
General
5.04 As noted above, there is a great discrepancy in most major and somemedium projects between the irrigation potential planned and the "utilization"(see Table T-16). The data reveal that, although there have been some improve-ments in the degree of utilization, the ratio has remained below 50%. However,even this 50% understates the problem, as the "utilization" figures are theresult of a straight addition to the area irrigated in each season (regardlessof crop), whereas the "potential" figures result from adding the area irrigatedunder each crop over the entire year. In the "utilization" figures, theirrigated areas under two seasonals are thus double-counted, and those underperennials triple-counted, in this comparison between potential and utilization.
The apparently high utilization ratio for the Kakrapar system (Table T-17) canthus be explained largely by the predominance of perennials in the croppingpattern. unfortunately, data that would more accurately represent the utiliza-tion ratio are not available. These figures also indicate that the overallperformance of tubewells has been much superior to that of the major and
medium schemes; and that the performance of the minor schemes, though initiallyworse than the medium and major, has now overtaken the latter's.
5.05 The principal reasons for this "underutilization" are:
(a) the technical inadequacy of the irrigation system, resultingfrom deficiencies in the planning, design, construction,operation and maintenance of the projects;
(b) unrealistic assumptions about the available water supply, thecrop water requirements and the irrigation losses leading toa significant over-estimation of the area that can be irrigatedwith the water available;
(c) lack of appropriate assistance to farmers for on-farm development;
(d) inadequate agricultural supporting services;
(e) unsatisfactory coordination between the agencies involved inthe development and exploitation of the command area; and
(f) agro-climatic factors.
Irrigation Technology
5.06 The key to successful irrigation development is to provide a relia-ble water supply at the farmgate with a minimum of transit losses betweenthe dam and the plant. If the farmer has faith in the irrigation supply,he will be keen to develop his land and buy the inputs that are requiredfor successful cultivation of high yielding high value crops. In the remainderof this chapter, various aspects of planning, design, construction, operationand maintenance as they relate to the performance of major irrigation projects

- 30 -
in Gujarat are analyzed. The main conclusion of this review is that the tech--nology adopted in the past for major and medium irrigation projects is suchthat it cannot provide a reliable water supply at the farmgate. This conclu-sion is likely to apply to many Indian irrigatior. projects.
Assumptions about Hydrology, Water Losses and Crop Water Requirements
5.07 In many projects, the annual inflow into the reservoir, and thusthe area that could be commanded, have been overEstimated. This was the casefor Bhadar irrigation scheme, which was completed in 1963. Virtually no streamflow data was available, and an assumed 17% run off factor was applied to thelimited rainfall data available: during the 13 years of operation, the reser-voir filled only in 3 years. In 1972/73, a year of very severe water shortage,rabi and hot weather irrigation supplies were completely stopped and whateverwater was available was used to supply Rajkot city. The project authoritiesare now redefining the scope of the scheme.
5.08 GOG has traditionally assumed that the seepage loss in unlinedchannels is 8 cusecs/M sq. ft. Rather than actu-lly calculating the lossesusing these seepage rates and the wetted perimetEr of the project channels,percentage figures for the losses in different pE.rts of the system are usedin GOG's water balance calculations. Typically these figures imply an overallproject efficiency--i.e., from dam to plant--of 40-50%. Data 1/ from projectsin Gujarat and other parts of India indicate that the losses are three tofour time the losses assumed:
Name of the Losses Assumed Losses asProject and Name of the in the Initial Actually
State Canal System Planning Measured
Dantiwada(Gujarat) Left Canal 10% unlined 40% unlined
2% lined 6% linedPravara(Maharashtra) Main Canal 8 cusecs/M sq. ft. 25% to 56%
Jayakwadi Main Canal 10 cusecs/M sq. ft. 15 cusecs/MProject (main canals) sq ft.(Maharasthra) Distributaries 15 cusecs M sq. ft.
(distributaries)
Nagarjunasagar 8 cusecs/M sq ft. 36 cusecs/MProject (A.P.) Left Cianal sq ft.
Mula Project Main Cianal 10 cusecs/M sq ft. 25 cusecs/M(Maharashtra) Distributaries 15 cusecs/M sq ft. sq ft.
1/ "Guidelines for Planning, Design and Operation of Major Irrigation Systemsin India". Report submitted to the World Bank, by Y.K. Murthy, October1979. For a more comprehiensive summary of actually measured losses inIndian irrigation projects see Annex 3 of Maharashtra Irrigation II Project,Volume II. IBRD Report No. 2529a-IN, September 13, 1979.

- 31 -
Our estimate of overall efficiency in unlined projects is of the order of25-30% and 30-35% for major and medium projects, respectively. A sampleof existing major and medium 1/ projects in the State indicates that water-use efficiency in the rabi season is in the range of 25-30% for the majorschemes, and 25-45% for the medium schemes. As the efficiency is lower inthe kharif, an average for the year would be between 30% and 35%. The fol-lowing table summarizes the findings:
Average AverageRabi Area Rabi Dam Water Use Period of
Scheme Irrigated Release Efficiency /a Observations
(ha) (m3/ha) (%)
Ukai-Kakrapar-RBC 11,540 14,950 28.8 1971/72-1976/77Shetrunji 7,530 16,440 26.2 1965/66-1977/78Bhadar 7,080 9,480 45.4 1973/74-1976/77Macchu II 2,920 8,950 48.0 1973/74-1976/77Heran I 240 20,700 20.8 1972/73-1976/77Weighted Average 34.0
/a Assuming an average water requirement of the cropping pattern of
4,300 m 3/ha.
5.09 Water requirements for most crops and field losses are underestimatedin most Project Reports. This is especially the case for projects planned inthe 1950s and 1960s before the high yielding varieties were introduced. Formost kharif crops, the design water requirements are only about two-thirds ofthose actually required. The reason is that the estimates are based on therequirements in a "normal year" when rainfall is fairly evenly distributed overthe season. In Gujarat, drought spells of three to four weeks or sometimeslonger occur in the middle of the monsoon which immediately raises the waterrequirements.
5.10 The cumulative effect of too optimistic planning assumptions (regard-ing crop water requirements and irrigation losses) is that the irrigationpotential often is overestimated by 50% or more. Thus, the "irrigation poten-tial"--as defined in project reports--sets unrealistic targets for what canbe achieved in projects designed and constructed to present standards. Orput in another way, most projects in Gujarat probably utilize the de factopotential available at the present level of technology when actual losses andcrop water requirements are taken into account.
Organizational Aspects
5.11 Organizational factors (c, d, and e in para 5.05) have been exhaus-tively discussed and analyzed, inter alia, in the reports of the IrrigationCommission (1972) and the Agricultural Commission (1976). In order to achieve
1/ For a review of the efficiency found in medium projects see Appraisal ofGujarat Irrigation Project (Credit No. 808-IN), Annex 2, Page 17.

- 32 -
an effective coordination between irrigation management and agriculturalsupporting services and to assist the farmers to carry out on-farm development,GOG has established three Command Area Developmelnt Authorities (CADA): onefor Mahi-Kadana; one for Ukai-Kakrapar; and one for a group of smaller pro-jects in Northern Gujarat and Saurashtra. Each CADA is headed by an AreaDevelopment Commissioner (ADC) who reports to the Secretary, Agriculture.Although the CADAs have had some positive impact on irrigation utilizationand agricultural development in the project areas, they have failed to liveup to the high expectations that the Irrigation and Agricultural Commissionsestablished for their performance. There are a number of reasons for theirrelatively modest achievements; among the reasons are:
(a) the CADAs do not have any staff of their own and the ADCsfulfill only a coordinating function. The parent depart-ments (the Agriculture and Irrigation Departments) retainfull technical and partial administrative control of theirfield units;
(b) there is no professional cadre of traired and experiencedland development and water management specialists who canoperate the system in full response to agriculturalrequirements or who can properly advise farmers on landdevelopment and irrigation practices;
(c) the incentive system for the agricultuTal and irrigation staffis such that they regard the work under CADA as only a tempo-rary assignment in their careers;
(d) the ADCs are frequently transferred. Because of the lack ofa permanent, professional CADA staff, the ADC provides theonly unifying force in the projects. However, with thelimited term (often only a year) that an ADC serves, thereis little continuity in policies and few clear objectivesfor the CADA work;
(e) the present practice of financing communal field channelsand field drains through agricultural credit has createdgreat administrative difficulties. Sinze some farmers inthe command areas (for example, those who are locatedclosest to the irrigation outlet) have little to gain fromthe construction of field channels, they are re:Luctant tohelp finance works that will benefit other farmers in thechak most. This means that the land development staff hasto spend a significant part of their time in persuadingfarmers to participate. Furthermore, the administrativecost of providing the credit is high and, because of thelimited gains that some farmers make from the on-farmworks, the default rate is high. The two latter factorsare putting a severe strain on the land development banksand are now threatening their financial viability; and

- 33 -
(f) no systematic research work on land development and watermanagement is carried out in Gujarat. As a result, thereis no firm technical guidance for the CADA's work.
5.12 However, until irrigation projects are planned, designed and con-structed in such a manner that they can deliver a reliable water supply toeach farmer in the command area, there is only a limited scope for CADA toimprove the utilization of irrigation potential and increase crop yields.Thus, improvements of irrigation infrastructure and CAD/on-farm works arecomplementary and reinforce each other.
Agro-Climatic Factors
5.13 Agro-climatic factors have, so far, received insufficient attentionin the analysis of the slow uptake of irrigation. However, there appearsto be a general behavioral pattern of the farmers in India related to theamount of rainfall: in the low rainfall, drought-prone areas, the benefitsof irrigation are obvious and the farmers rapidly switch from rainfed toirrigated crops. The same thing appears to be true in higher rainfall areaswhere the climate and soils allow a switch from rainfed coarse grains toirrigated paddy. However, the uptake of irrigation is much slower in areaswith intermediate rainfall (say 700-1,200 mm) where, in a normal year, farmerscan grow a rainfed crop without too much risk and where the quantity of wateravailable does not allow an easy switch to water consuming crops such as paddyand perenni'al crops. Most of mainland Gujarat falls into this category.
5.14 In the intermediate rainfall areas of Gujarat, the predominant food-grain crops under rainfed conditions are pearl millet and sorghum. The localvarieties of kharif and rabi sorghum and pearl millet give low yields underirrigation. The high-yielding/hybrid varieties of sorghum have not spread--except in the traditional grain-producing areas of Vadodara, Bharuch and Surat--possibly as a result of the low fodder/grain ratio. Uptake of the high-yielding/hybrid varieties of pearl millet has been rapid, but the high incidenceof downy mildew has caused a recent decline in the area grown. Paddy is asuitable irrigated kharif foodgrain, but is confined to the central and south-ern mainland districts. Wheat is the only widely-grown foodgrain that hasresponded well to irrigation, and that has not been subject to pests anddisease--hence the rapid growth in the area grown. To give high and stableyields, kharif foodgrains should be planted in June before the start of themonsoon, but under present GOG procedures for allocating water and operatingirrigation projects, most farmers do not get the first irrigation until thelatter part of July. Consequently, the farmers in canal commands still orienttheir planting operations around the onset of the monsoon rains and thusrealize only part of the potential benefits from irrigation. It seems clearthat a much larger number of farmers would apply for and depend upon kharifirrigation if the first irrigation was given before rather than after themonsoon rains have started.
5.15 Successful cultivation of irrigated cotton requires expensive inputsand is difficult to fit into GOG's irrigation seasons; moreover, recently ithas been subject to serious pest attacks. Furthermore, water logging is aserious problem encountered by cotton cultivators in some surface irrigation

- 34 -
schemes; for example, the rising groundwater table in Ukai-Kakrapar has led toa decline in the area under cotton. Cash crops such as fruit, vegetables,spices and condiments typically give higher incomes when irrigated but thefrequency and reliability of canal supplies are inadequate for a profitableand risk-free crop. The cultivation of such crops--for which the climateand soils of Gujarat are ideal:Ly suited--is constrained by the water supplyand the high cost of the on-farm investments required. To sum up, the farmersin the low to moderate rainfal:L areas of the Gujarat mainland have only a limi-ted choice of crops that can be profitably grown under canal irrigation. How-ever, if the canal supplies are made more reliable, and the irrigation seasonsare adjusted to coincide with the optimum planting dates of the major seasonalcrops, then the range of profitable crops would be much greater and the useof irrigation water in kharif would become the rule.
C. Project Preparation
General
5.16 One major reason for the apparently low utilization of irrigationpotential is the inadequate preparation of major and medium irrigation projects.Not enough staff and funds are made available to carry out the necessary datacollection, survey work, evaluation of different alternatives, etc. Projectreports that are submitted for approval are based on investigations thattypically have been carried out several years before the report is issued.After approval, the report becomes the basic document for implementation ofthe project. It is not uncommon that the last patt of a major project iscompleted in accordance with a project report prepared some 15 years earlierand based on investigations done 20 years ago.
5.17 Over the last two decades, new high-yielding crop varieties havebeen introduced, market conditions have changed drastically, the use offertilizer has become a widespread practice; as a result, the comparativeadvantages of various crops have changed. The new crop varieties have differ-ent demands in terms of quantity and timing of irrigation. During the lastfew years, the stock of technical knowledge has increased significantly.Various project designs have been tried out in other projects and experienceis becoming increasingly available to indicate how these designs function inpractice. Time has also been available for further stream flow measurements,monitoring of canal losses in the already completed projects, soil surveys,etc. All this additional data, together with the experience from operatingprojects--if properly utilized--could have provided the basis for refinementsin the designs of on-going and new projects. Planning of irrigation projectsin the future must be a continuous process into which there is a systematicfeedback of experience from projects already under implementation and operation.
5.18 Under the Gujarat Irrigation Project (Credit No. 808-IN), GOG isstrengthening its preparation for medium irrigation projects, and the majorprojects proposed for financing under the Gujarat :[rrigation II Project havebeen prepared to higher standards than in the past. However, there is still

- 35 -
scope for further improvements in the hydrological and agricultural data basesand in their use for project preparation.
Design of the Distribution System
5.20 General. The distribution system--distributaries, minors and sub-minors--is the most critical factor of an irrigation project in determiningits performance. However, with present staffing priorities, it is the partof the project that receives the least attention. At present, only aboutone-tenth of the total engineering effort invested in the project goes intothe survey, design and construction of the distribution system. As a conse-quence, the distribution system is "under-engineered" and constitutes theweakest link in the water's route from the river to the field. The followingdiscussion focuses on some of the major deficiencies in the design of thedistribution network.
5.21 Alignment of Channels and Location of Outlets. In existing projectsthe alignment of many channels is poor and a large number of outlets areincorrectly located. The main reasons are: (i) maps used are not detailedenough for proper alignment of the channels and correct positioning of theoutlets; (ii) the manpower input for survey and design is too low for suf-ficient accuracy in the work. As a result, large areas are, in fact, notcommanded; and (iii) division of responsibility for the lay-out, design andconstruction, and a lack of coordination between the respective governmentagencies results in large areas being out of command. In other areas, farmersbreak the channels to irrigate land not served by the outlets. Poor alignmentof the channels, high seepage losses and lack of control in the distributionsystem seriously affects the water supply to the tail portions of distri-butaries and minors resulting in very unreliable supply to the tail outlets.To improve the quality of survey and design of the distribution system, themanpower allocation to this phase of project implementation has to be signi-ficantly increased.
5.22 Cross Regulators. There is a general lack of cross regulators inthe distribution system and off-taking channels and outlets cannot draw theirfull discharge when the flow in the parent channel is below the design dis-charge. In the absence of proper cross regulation, excessive flows aremaintained in the distribution network in order to ensure that the water levelis high enough for the offtakes to operate adequately. Another consequence ofthe lack of cross regulation is that farmers build small bunds at the bottomof the channels in order to get the full flow from the outlets. To overcomethis problem, some offtakes and outlets have been set at the bottom of theparent channel with the result that silt and debris interfere with the oper-ation of the offtakes and outlets. The lack of cross regulation in thedistribution system results in: (i) unreliable flows in the smaller channelsand through outlets; (ii) excessive operational losses; and (iii) highermaintenance costs.
5.22 Size of Chaks. At present, the farmers are responsible for waterdistribution and for maintenance of the channels below the chak outlet. Ex-perience from existing project shows that cooperation between farmers isvery limited and that the field channels are poorly constructed and maintained.

- 36 -
In most cases, the farmers closest to the outlets take more than their shareof water, and the losses in conveyance of water to the tail-end are excessive.As a result, the distribution of water is both inequitable and inefficient. Astudy of 88 chaks (average size about 40 ha) in the Ukai Kakrapar Projectgivbes an indication of the benefits that accrue to farmers located in theupper, middle and lower third of the chak:
Annual IntensityLocation of Irrigation
Upper Third 117%Middle Third 98%Lower Third 78%
5.23 The inequity inside the chak increases with the size of the chak 1/and so do the water losses in the field channels. A review of irrigation datacollected for the study mentioned above indicates that the field channellosses are related to the size of the chak in the following manner:
Field Channel Losses as % of theSize of Chak Flow at the Outlet to the Chak
(ha)
8 14%20 22%40 32%80 39%
5.24 With some chaks as large as 200 ha, often some 50 farmers have tocoordinate their irrigation schedules and agree on maintenance of the communalchannels inside the chak. The inequities in water distribution and the poormaintenance of field channels that have been observed during field visits toMahi-Kadana, Ukai-Kakrapar and other projects in Gujarat, clearly show thatsuch large groups of farmers cannot cooperate sufficiently to operate thechaks. There are three main reasons for this: (i) the rich and powerfulfarmers are at an advantage over the smaller farme:rs; (ii) the benefits ofchannel maintenance and equitable water distibution are unevenly distributedover the chak and thus, some farmers--usually locat:ed near the outlet--haveno incentive to participate in the maintenance; and (iii) when the outlet islocated at least 1 km away from the field, the irr:igator cannot properly checkthat there are no breaches on the field channel--from natural or man-madecauses. The only feasible solution at this stage of development is for the
1/ Field inspections and discussions with farmers indicate that the fields'located at the tailend of the field channel ol-ten suffer from waterstress resulting in lower yields than those achieved on fields near theoutlet. This compounds the inequities that are the result of differentirrigation intensities in different reaches along the field channel. Thelarger the chak, the longer the field channel and, thus, the greater theinequities.

- 37 -
Government to be responsible for the water distribution much further down inthe system. 1/ This can be achieved through (i) a significant reduction of thechak size and (ii) enforcement of a fixed irrigation schedule for each farmer--for instance, rotational water supply (RWS). Improvements in this area wouldencourage lining of the field channels to reduce conveyance losses and to makethe supply to the individual farmer more reliable; indeed, recent experimentswith RWS on the Mahi-Kadana scheme have given positive results.
5.25 Lining of the Distribution System. In association with the GujaratIrrigation Project, GOG adopted for medium projects a policy of lining thewhole canal system down to outlets serving 8 ha blocks, which will be the gene-ral criterion for the components under the proposed project. Detailed analysesof the benefits of lining have been carried out for medium irrigation projectsin Gujarat 2/ and major projects in Maharashtra. 3/ The estimated projectefficiencies change with the amount of lining as follows: 4/
1/ This conclusion is supported by, inter alia two studies carried out bythe Indian Institute of Management in Ahmedabad: "Irrigation System,on-farm development and extension service in Chambal Project, Rajasthan"by V.N. Asopa, S.C. Bhatnagar, B.M. Desai, A.H. Kalro and P.N. Shingi and"Command Area Development in Mahi-Kadana" by V.N. Asopa and B.L. Tripathi.In both studies, the farmers' attitudes towards cooperative water distri-bution was investigated and the conclusion from Chambal is applicable tofarmers in both project areas: "Indeed, they (the farmers) wanted the(water allocation) system to be more rigorous and generally did not favorfarmers' participation either individually or in groups, in decision-making relating to the distribution of water" (page 169).
2/ See: Appraisal of the Gujarat Irrigation Project, IBRD Report No. 1943a-IN, May 18, 1978.
3/ See: Maharashtra Irrigation II Project: Volume II - Sectoral Back-ground, IBRD Report No. 2529a-IN, September 13, 1979
4/ Note that the efficiencies depend on various factors such as topography,soils, depth to groundwater table and method of systems operation. Thus,the figures in the two columns are not strictly comparable. However, whenread "vertically", the estimated efficiencies give a consistent pictureof the improved performance at higher levels of technology.

- 38 -
Amount of Lining Overall Project Efficiency
Gujarat MaharashtraMedium Projects Major Projects
Fully unlined system,40 ha chaks 32% -
Canals above 100 cusecslined, remaining systemunlined, 40 ha chaks - 34%
System fully lined to40 ha outlets 42% 43%
System fully lined to8 ha outlets or towithin 1,000 ft fromfurthest field 51% 49%
5.26 Available cost data indicate that investments made in lining of thecanals and distribution system give an economic rate of return of about 20%,which is considerably higher than for investments made in unlined projects.Cost estimates for the medium projects in Gujarat and the major projects inMaharashtra indicate that linirng of sub-minors/water courses from the 40 ha tothe 8 ha level increase the project cost by 6 - 7T but result in an increasein the irrigated area by 15-20%.
5.27 In the Karjan and Heran Projects, the cost of lining the sub-minorsand water courses from the 20 ha level to the 8 ha level would increase projectcost 2-3% and help increase the irrigated area some 8-10%. 1/ Lining minorsand water courses not only reduces the seepage losses but--more importantly--also ensures the structural integrity of the channel and thus allows water tobe distributed in a more equitable and reliable fashion. As a result, farmersare more likely to get the right amount of water at the right time.
Commissioning Period
5.28 No large scale construction activities can be carried out withouterrors and mistakes. When any irrigation project starts to operate, it will befound that some outlets are incorrectly positioned, that a contractor has notfollowed the specifications for the construction of a control structure, thatthere is a need for a cross regulator in a critical location, etc. Usually itis relatively cheap to correct these mistakes--provided it is done soon afterthe work have been completed--and it results in significant benefits. However,
1/ Based on the data from Ukai-Kakrapar the fie]d ditch efficiency wouldincrease from 0.78 to 0.86 or by 10% when the chak size is reduced from20 ha to 8 ha. This gain would, to a minor extent, be offset by losses inthe lined sub-minor, but the net increase in irrigated area would be atleast 8%.

- 39 -
no budget or staff allocations are made for this purpose. Even though eventualmajor construction errors are corrected, there is no "fine-tuning" of thesystem and, as a result, the projects do not yield their potential benefits.In order to fully utilize these major investments each part of a projectshould go through a two year commissioning period 1/ when the system can beadjusted and necessary modifications carried out. During this period, theoperating and construction staff would share the responsibility for the systemand a special budget allocation should be made for this purpose.
Operation
5.29 There is ample evidence that many of the kharif crops, in most partsof the State, give higher yields if they are planted in June rather than inJuly. Late planting of kharif crops also delays planting of rabi crops withresulting adverse impact on yields. In some cases, the late harvest of thekharif crop can even preclude the cultivation of a rabi crop. This wasclearly illustrated by the small area under rabi crops in Mahi-Kadana lastyear when storage water was available for the first time. The approval ofwater applications comes only after the reservoir has started to fill up inmid-July and most farmers cannot get the first irrigation with the end ofJuly. This usually results in too late a planting date, especially if theapplication is rejected and the crop has to be grown under rainfed conditions.Being "risk minimizers" the farmers plant with the first monsoon rains at theend of June or beginning of July and go for a "low technology package" underthe assumption that they might not get any irrigation water. Only in the caseof drought during the late stages of the crop will they think that irrigationis worth the water charge, and thus, apply for water. Consequently, in normalyears, the potentital for kharif irrigation is greatly underutilized, espec-ially in the medium and high rainfall areas. The available evidence indicatesthat timely irrigations in kharif result in yields that are significantlyhigher than under rainfed conditions. Thus there is a need for a fundamentalchange in the incentive system for kharif irrigation. The following modifica-tions would lead to substantial production increases in most major projects:
(a) Starting the kharif irrigation season in June rather thanin July. This would require carryover storage in the res-ervoir, 2/ which--it is commonly argued--would be costlyin terms of evaporation losses. However, carryover storageis anyhow provided in most major projects since they havesignificant areas under perennial or hot weather crops orthey provide water for power generation or domestic andindustrial uses. Thus, carryover storage for an earlierstart of the kharif season would only add marginally to
1/ The commissioning period should cover the first two years that any areais under irrigation. Thus, it would not result in a delay of the startof irrigation.
2/ In some cases, it may be difficult to provide carry-over for pre-monsoonirrigation. However, because of the large economic benefits from earlierplantings, pre-monsoon irrigation should be the rule and later start ofthe irrigation season an exception.
- 40 -
reservoir evaporation losses. Many times, these marginallyhigher evaporation losses are off-set by lower water re-quirements for kharif and rabi crops since they can utiliseavailable rainfall and soil moisture better if they areplanted early; and
(b) Establish kharif water as a right for each farmer in thecommand area and adjust the operational procedures in sucha way that all farme!rs are routinely provided with both pre-monsoon water and with supplementary irrigation supplieswhenever the monsoon rains are insuffizient. 1/
5.30 Water Allocation Procedures. According to the Bombay IrrigationAct and Canal Rules, each farmer is entitled to The amount of water that isrequired to fully irrigate the crops for which he has obtained a sanction.The Canal Inspector is supposed to ensure that the farmers do not use exces-sive amounts of water and that each one get the water he is entitled to.Although this procedure has, in general, prevented gross abuses, it does notpromote an efficient and equitable use of water inside the chak. Because thefarmer is, in principle, entitled to an adequate amount of water at theboundary of his field he has little incentive to reduce the losses between theoutlet and his field. 2/ One way of promoting efficient and equitable use ofwater inside the chak would be to make the Government responsible for waterdeliveries down to 8 ha outlets. However, further advances towards thisobjective would be made if water allocations were determined for each farmerin accordance with a fixed rotational schedule. In this schedule, the farmer'swater right would be defined at the outlet rather than at the field, whichwould provide an incentive for the farmers to rec.uce losses inside the chakand on their fields. Rotational water supply can be introduced within theframework of the existing Irrigation Act if the sanctioned area under irriga-tion and the estimated water requirement for each crop are used as the basicparameters that determine the time allocation to each farmer. The maindrawback of the sanctioning system in effect at present is that the farmerswill apply for water for crops which maximizes their return per irrigatedhectare. However, water is a scarce resource with a high economic value andthe o4jective from the society's point of view is to maximize the returnsper m of water.
5.31 At present, a farmer who gets a sanction for a crop with high waterrequirements typically increases his income much more than a farmer who gets asanction for a crop with low water requirements. With the present system ofsanctioning crops on an area basis, a relatively small group of farmerspreempt a large share of the water and, thus, get a major share of the bene-fits. Since there will never be enough water for all the farmers in a commandto grow high value, high water using crops, equity requires that the amount ofwater a farmer can use -- in accordance with his sanction -- has to be
1/ Even where there is no carry-over storage on hot weather irrigation.
2/ Any savings in conveyance would, in principal, benefit farmers in otherparts of the project.

- 41 -
rationed. This is difficult to do under present sanctioning procedures.However, if rotational water supply is introduced, each farmer would receivea fixed quantity of water at a predetermined time. 1/ The logical extensionof the rotational water delivery system would be to base the quantity of wateron the size of the holding rather than on what crops tVe farmer intends togrow. Say, for example, each farmer would get 2,000 m /ha of water for hisholding in rabi; he would be free to use this water to irrigate any crop hechooses. He might use the water to irrigate wheat on one-third of his land orto irrigate gram on two-thirds of his holding.
5.32 To allocate water in volumetric terms rather than giving sanctionsbased on the crops to be irrigated would probably require a change in theIrrigation Act. However, such a change would give some significant benefits:
(a) The farmers would select crops and adopt irrigation practicesthat would maximize the returns to water--as a consequence,the economic benefits to the society would be maximized;
(b) A few farmers would not be able to appropriate an unfair shareof the irrigation benefits, which is the case in the Kakraparcommand at present; and
(c) The administrative procedures would be significantly simpli-fied to the benefit of both the farmers and GOG.
(d) The cropping pattern would become more complex;
(e) Most future varieties would have shorter duration thanat present;
(f) Crops would be planted at their optimum dates; and
(g) Irrigations would have to be given at critical stages ofcrop growth.
5.33 These changes have the followng implications for the planning, designand operation of irrigation projects:
(a) The water supply has to be reliable, i.e., the farmersmust be ensured that they can get water at the time whenthe crop needs it;
(b) Operation of the projects, will no longer be done in accor-dance with the traditional irrigation seasons, insteaddifferent crops will be planted at different times, whichrequires a more flexible operation of the system; and
(c) The peak carrying capacity of the system has to be higherthan at present.
1/ Quantity = Number of irrigations x time x outlet discharge.

- 42 -
Maintenance
5.34 The maintenance of taost irrigation projects is deficient becauseof: (i) unreliable water supplies and thus interference by farmers (para5.22); (ii) limited permanence of staff; and (iii) insufficient funds, allo-cated as a flat rate per ha, rather than on a careful assessment of actualmaintenance needs. Improved standards for the design and operation of newprojects, assuring a reliable and timely water supply, and the establishmentof a separate CAD Department, with its own cadre of land development andwater management specialists, would help overcoma the first two problems.However, an increased budgetary allocation--for works and materials as wellas establishment--is a prerequisite for improved maintenance. The budgetallocation for a scheme should be based on an anlual maintenance programwhich identifies the works required in each segment of the scheme.
VI. RECOMMENDATIONS FOR NEW PROJECTS I/
General
6.01 In most major and medium irrigation projects in Gujarat, actualcrop production is significantly lower than the potential production thatcould be obtained for the level of investment in irrigation infrastructure.This shortfall is due to two factors:
(a) Yields are much lower than potential yields; and
(b) The irrigated area is much smaller than the area thatthe projects have been designed to irrigate (the"irrigation potential").
6.02 The low yields and--especially--the "underutilization" of irriga-tion potential have been major concerns of GOI and GOG. In an attempt toremedy the situation, CAD programs--focusing primarily on development belowthe Government outlet, i.e., on the construction of field channels, drains andland shaping--have been initiated in most major irrigation projects. The dataanalyzed in this volume indicate that a lack of on-farm development is only apartial explanation for the low yields and the underutilization of irrigationpotential. It has become increasingly clear to I3A and to GOG that majorconstraints to higher yields and expansion of the irrigated areas are alsofound between the dam and the Government outlet.
6.03 Actual water losses are much higher than assumed in the design ofthe canal systems, which reduces the irrigated area far below the plannedtarget. Consequently, the underutilization of irrigation potential is largely
1/ These recommendations are generally applicable to all new major projects.However, as presented here they apply primarily to Damanganga, Heranand Karjan.

- 43 -
fictional because there is little possibility for projects designed and con-structed to present standards to serve the area that they have been assumedto irrigate.
6.04 Consequently, there is an urgent need to improve the planning,design and operation of these projects with the objective of making the watersupply at the farm gate more reliable. The recommendations summarizedbelow are aimed at achieving this objective.
6.05 Planning Process
(a) Planning of irrigation projects would be a continuous processinto which there is a systematic feedback of experience. Tomake this possible, a continuous monitoring and evaluationprogram is required to feed back information to the plannersfrom current experience on the construction and operation ofthe project under implementation and from other projects. Forthis purpose, the project preparation and monitoring cells wouldbe suitably strengthened; and
(b) A systematic experimental and research program would be under-taken so that fully developed and evaluated technologies areavailable when the time is ripe to introduce them. This meansthat research has to be started today on technologies that willbe needed and ready for introduction 10-15 years from now.Provision for this would be made under the Project.
6.06 Project Preparation
(a) A continued upgrading of existing procedures for collectinghydrological data from rivers feeding the project, includingthe continual collection and evaluation of monthly flow recordsand the use of computerized reservoir operation studies;
(b) Systematic classification of the command area for irrigability(on the basis of detailed topographical, soil and drainagesurveys, etc); and
(c) Preparation of periodic reviews (i.e., at approximately fiveyear intervals) to highlight socio-economic changes in theproject areas (e.g., labor and farm power availability) whichinfluence cropping patterns and water demand.
6.07 Design Standards
(a) Increased professional manpower made available for the survey,planning and design of the minor distribution system;
(b) Appropriate large-scale survey work to permit proper align-ment of minor conveyance channels and outlets;

- 44 -
(c) Design of the required number of cross regulators in themain and distributary canals allowing the network to beoperated efficiently at two-thirds of design depth.
(d) Lining of the entire! conveyance system from the dam intakedown to irrigation turnouts that serve approximately 8 hablocks. 1/ (Implied in this criterion is the objective thatno field should be further away from a lined channel than300 m.) The lining would be of high quality as to reduceconveyance losses and maintenance;
(e) A piped distribution system (from minors down) would be pro-vided wherever sufficient natural head is available unlessit is economically not viable. Turnou:s from this systemwould typically serve 8 ha blocks;
(f) The minor distribution system would be planned "from thetail-up". Thus the alignment of minors and sub-minors would bedecided first after a tentative layout of the field channelshas been prepared;
(g) Chak sizes should be based on topography, soils, croppingpatterns and farm sizes, but would in general not exceed20 ha. For operational purposes, the chaks would be
'broken up in 8 ha sub-chaks each served by a gated turn-out;
(h) Measuring devices (such as standing wave flumes and V-notchweirs) would be provided throughout the system down to theGovernment outlet;
(i) Service roads would be provided along all channels with acapacity above 50 cusecs and all weather bicycle/motorcylepaths along all minors;
(j) A master plan of the drainage system would be preparedtogether with the irrigation system and in coastal areasdrains would be provided with tidal regulators; and
(k) A modern communication system would be provided in thecatchment area (for flood control purposes) and at variouscontrol points on th[e canal, the dam and the divisionalheadquarters.
1/ The Damanganga project area has high rainfa'Ll and heavy soils. Sinceample water would be available in the river, the lining would beextended by down to the 20 ha level. However, the turnouts wouldserve 8 ha blocks. Furthermore, distributaries, with a capacitybetween 10 cusecs and 100 cusecs, would be Lined selectively dependingupon the estimated seepage losses from unlined channels.

- 45 -
6.08 Construction Standards
(a) The irrigation system (lined distributaries, minors, sub-minors and unlined field channels from the 8 ha turnout tothe farm-gate), and the drainage system and road networkswould be constructed simultaneously by the Government andcompleted on a block-by-block basis; where necessary tofacilitate the irrigation drainage works the road networkwould be constructed in advance of the other components;
(b) A commissioning period of at least two years would be intro-duced. During this period required adjustments to the systemwould be done and a special budgetary provision would bemade for this purpose. The commissioning would be on ablock-by-block basis;
(c) The organization for monitoring implementation performance(both in quality and quantity terms) would be suitablystrengthened at both project and Sachivalaya level; and
(d) An existing dam review panel composed of specialists inengineering geology, flood hydrology, dam design and con-struction, would be maintained during project implementation.This panel would meet periodically as required, but not lesstehan once in 12 months, to review and evaluate all data anddesign and construction practices, and make specific recom-mendations to GOG concerning: embankment safety; foundationand abutment integrity; and spillway capacity.
6.09 Operational Procedures
(a) Water deliveries to the farmers would be on rotational basisin accordance with predetermined schedules established forthe rabi and hot weather season. GOG would examine how rota-tional deliveries can be introduced during the kharif seasonwhen rainfall is subject to significant variations;
(b) Before the start of each irrigation season, every farmer undera distributary/minor would be notified by CADA of his allo-cation for water for the forthcoming season and the way thesupply will be made available to him (rotational interval).The allocation would be based on (i) the seasonal availabilityof water; (ii) the cropping pattern and the calculated waterdemand for this pattern for the minor/distributary under which

- 46 -
(c) Seasonal irrigation schedules would dEpend on the storageavailable in the reservoirs and would be established throughfortnightly assessments of project water requirements. Theseschedules would be based on updated rainfall and streamflowrecords, measured conveyance and distribution efficienciesand information feedback on actual crcpping patterns in thecommand area;
(d) Irrigation water for kharif crops, for which early planting isbeneficial, would be available at the beginning of June andthe project reservoirs would be operated to provide appropriatecarryover storage for pre-monsoon irrigation;
(e) The canals would be closed for maintenance for an appropriateperiod which would be determined and publicized each yar atthe beginning of June;
(f) Annual O&M budgets would be determined on the basis of adetailed operation and maintenance program for each segmentof the schemes; and
(g) The method of assessing water charges would be revised topromote the use of kharif irrigation.
6.10 Organizational Changes
(a) A separate CAD Wing for water management would be establishedin the Agricultural Department. It would be staffed withproperly trained land and water development specialists.Although initially the staff would be deputed to the CADWing, the objective is to transform the Wing into a separatedepartment for water management with its own cadre of landand water management specialists.
(b) Special Circles would be established under existing CADAs forthe Damanganga, Heran and Karjan command areas. The CADAswould be responsible for operation and maintenance of theprojects; organizing the farmers to establish (together withthe extension service) rotational water allocation schedulesand advising farmers on land development and irrigationpractices. When sufficient trained staff would be available,the CADAs would also be responsible for the survey, planningand design of the minor irrigation and drainage works.

47
ANNEX 1Page 1
FUTURE CROPS AND CROPPING PATTERNS
Foodgrains
1. The prospects for most kharif foodgrains becoming irrigated cropsare low, until a better variety of bajra can be developed--that is diseaseresistant and responds well to irrigation. The exceptions are paddy-whichat present, is confined to the high rainfall areas of the South, but whichwould probably spread as an irrigated kharif crops--and hybrid sorghum, whichresponds well to irrigation. Although Gujarat is a foodgrain deficit State,and there is therefore much unsatisfied demand, free inter-state movement offoodgrain and GOI social policies will prevent the price of foodgrains fromrising sufficiently to make them competitors for irrigation water--where thesupply is reliable--with the high value crops in kharif. In rabi, however,wheat is likely to remain the dominant irrigated crop (70% of it is alreadyirrigated). In summer, irrigated cereals will probably increase to someextent, because of their combined fodder and grain value, as mixed farming isa growing feature of State's agriculture. However, fodder crops with a highernutrient value, such as lucerne, are likely to spread faster.
Pulses
2. As a response to high and unsatisfied demand in this largely vege-tarian State, pulses, being an excellent source of protein, are likely togain an importance as a partly irrigated crop: farmers will demand a fewsupplemental irrigation for them in dry kharif periods and in rabi. Theymight also be increasingly grown on residual soil moisture after an irrigatedcrop. Although groundnuts are generally an unirrigated kharif crop, becauseof their sensitivity to water availability, they too would benefit significantlyfrom a few supplemental kharif irrigations in drier years. This crop willprobably continue to be grown on a large scale, particularly in Saurashtra,where its only unirrigated kharif competitor is pearl millet. AlthoughGujarat ranks only sixth among the States in its groundnut yields, they areabove the national average, and Gujarat is the largest producer in the country,with a share of 28% of total production.
Groundnuts
3. Even though Gujarates already have a per capita consumption ofgroundnut cooking oil which is more than double the national average (512grams/month compared with 223 grams/month), demand for this crop is never-theless likely to grow faster than for pearl millet; until a better pearlmillet variety can be developed, and until the Narmada system irrigatesSaurashtra, groundnuts will probably remain the dominant kharif crop inSaurashtra. Summer groundnuts, however, are likely to become an importantirrigated crop: the soils are suitable, summer prices are high, and marketingis well-developed.
48
ANNEX 1Page 2
Cotton
4. The future of cotton as an irrigated crop is uncertain. On the onehand, Gujarat is the largest producer of cotton in India (27%) and producesthe greatest amnount of superior quality cotton. A.fter wheat, cotton occupiesthe largest area under irrigation, mostly from grolndwater: the irrigatedproportion of the gross cropped area has risen froni 13% in 1967/68 to 20%in 1976/77. But on the other hand, irrigated yields have not shown any signi-ficant increase. One problem has been the prevalence of pest incidences.However, the successful pest control campaigns orginized under the T&V systemare showing great promise. Furthermore, total wor:Ld demand is projected togrow at only 0.9% p.a. to 1990; however, this average conceals differences ingrowth rates between grades, and demand for long-staple (irrigated) cotton, inwhich Gujarat has a comparative advantage, is likely to grow relatively fast.In conclusion, although the total area under cotton in Gujarat may decline overthe coming decades, the proportion of this crop in the total irrigated area islikely to remain roughly constant. Tobacco may slightly increase its share ofthe irrigated cropping pattern, as yields are high, and Gujarat cultivates thelargest area of tobacco in India. Its success in the command area of theMahi-Kadana project is remarkable. Fodder, particularly lucerne, is likelyto become an increasingly important year-round irrigated crop, especially insummer, when litle grazing is available for Gujarat's expanding livestockpopulation. Animal husbandry is less land-intensive than foodgrain productionand therefore offers prospects for faster and ultimately larger growth in theincome of very small landowners and for the employment of landless labor. Milkproduction is particularly labor-intensive and is traditionally carried out bythe women of the households: as these women often deliver the milk to thecooperatives, and receive the cash, its impact on the distribution of incomeboth between and within households is significant.
Sugarcane and Bananas
5. Although Gujarat's sugar yields rank on:Ly eighth among the States--and have not increased in the last few years--and sugar recovery is lowerthan that obtained in the main growing areas of Maharasthra, the area undersugarcane and banana - the major and medium irrigation schemes has increasedfrom 14.4% in 1965/66 to 20.5% in 1977/78. Unfortunately, separate data onthese two crops is not available for the major and medium schemes, but thetotal sugarcane area in the State grew by 2.8% p.a. between 1967/68 and 1976/77;assuming that most of this took place under surface irrigation, perhaps 2.0%of the 12.2% growth rate of sugarcane related to sugarcane. That leaves atleast 10% growth rate for bananas. Given its relatively low yield in Gujarat,the fact that the sugarcane area has grown at all seems surprising: fieldobservation and discussions suggest that as its growth has been concentratedmainly in the Ukai-Kakrapar project, its success could be related to thesize of land-holdings and the fact that it is a "lazy man's crop": absenteelandlords can derive a significant revenue from t:he land with a very lowmanagement input. This extensive sugarcane cultivation in areas of inadequatedrainage has led to severe water-logging problems, in Ukai-Kakrapar. As longas the water supply from surface schemes is unreliable, and as long as far-mers are not charged for water on a volumetric basis, then the proportion

49
Page 3
of the irrigated area under sugarcane is likely to remain constant or expand;in view of Gujarat's acute shortage of stored water, and its comparative dis-
advantage in sugarcane production, this represents a significant wastage of
scarce resources,
6. Bananas, on the other hand, show high yields, and the area underthis crop in major and medium schemes has grown at around 10% p.a.since1965/66. As it is a particularly perishable crop, its share of the irrigatedcropping pattern will probably continue to expand rapidly until it has exhaustedthe "transport possibilities", and it will then expand only in line with thetransport network. Demand of the crop is likey to expand rapidly, with
Ahmedabad, Surat, the industrial belt and Bombay being the principal markets.Harvesting and marketing are well-developed.
7. Other fruit: mango, chiku, coconuts, pomegranates, guavas andlimes. Most of these fruit crops receive some irrigation. There is a short-age of data on these crops, but there are indicators to suggest that the areais expanding rapidly: the Department of Agriculture and private nurseries aredistributing planting material at a rate of some 5,000 ha per annum. Distribu-tion and marketing is well organized in Cooperatives, at least one of whichhas established a canning factory for mangoes. Demand for these crops islikely to be very strong, from Gujarat, Bombay, all-India and even the Middle-East.
Vegetables
8. Although recent official data is lacking, all indicators show thatthe production of vegetables has grown very rapidly over the last twenty years.Between 1960/61 and 1973/74, potato production grew at an average annual rateof 22%, and yields increased at 16% p.a. over the same period. Market authori-ties consider that total vegetable production is growing by at lest 10% p.a.In a largely vegetarian State, demand for these crops grows rapidly as incomesrise; marketing is highly developed: many villages and cooperatives havetheir own trucks for speedy delivery to Bombay. As these crops require frequentand timely water deliveries, their share in the State's surface irrigatedcropping pattern is likely to increase only when water deliveries become morereliable, and as the road network expands.
Condiments and Spices
9. Condiments and spices are less perishable than fruit and vegetables,but require almost as many waterings; their expansion will depend as much onthe reliability of the irrigation systems, but less on the development of thetransport network. However, they face the similarly buoyant demand conditions,particularly with regard to the Middle-East, as their transportation cost is
relatively low.
Livestock and Dairy
10. The easy access to Bombay will also be a major factor in the growthor demand for these products. Dairy products and eggs, poultry and pigs is

50
ANNEX IPage 4
likely to increase rapidly. The collection, processing and marketing of dairyproducts is already highly developed. Hot weather fodder will therefore becomean increasingly important irrigated crop. The number of cows and buffalo hasgrown over the last twenty years, but more importantly, the quantity of milksold has increased dramatically; before the ma:rketing channels were operating,much milk wasted at the farm level. GOG is also making efforts to improve thevarieties and the veterinary services. While vyegetarianism is strong in theState, the demand for eggs will continue to grow rapidly; as the practicedeclines, demand for poultry, pigs and fish--which is generally higher inurban areas--will increase.
11. The reliability of the irrigation supply is much more importantfor high value cash crops than for most cereals. Thus, the projected futurecropping pattern requires a much more reliable supply than the croppingpattern than exists at present. The likely shift in the cropping patternis also towards a greater variation in crops.
12. The individual characteristics of futlire crops are difficult toforecast. However, the results of plant breeding and applied research overthe last two decades give a considerable insigh;: into the general trends forthe future. Those characteristics that are especially important for theplanning, design and operation of the irrigation systems are briefly dis-cussed below.
13. In the development of hybrids and HYVE, there has been an emphasison reducing the duration of the crop and significant reductions have beenachieved for sorghum and rice. It is likely that most crops will have ashorter growing season in the future that t)ey have today. However, the peakwater requirements (measured in mm/day or m /ha/day) are basically the same.If advantage is taken of the lower overall water requirements and a larger areais planted, the peak water requirements for a project as a whole will go up.Consequently, it is likely that the peak carrying capacity of the canal systemshould be higher in the future than what it is at present; and that the manage-ment of canal flows should be more systematic than at present.
14. Data from Maharasthra gives an indication of how much the yieldof most irrigated crops is reduced if the planting date is delayed. 1/The yield reduction for cotton and wheat illustrates the importance ofplanting the crops at the optimum date:
1/ See World Bank Staff Appraisal Report, Maharashtra Irrigation II Project,Volume II, Annex 2, Tables l:a-l:c for summary of selected research results.

51
ANNEX 1Page 5
Relative YieldCotton /a Wheat /b
Time of Planting ---- % of optimum---
Optimum Planting Date 100 100Planting Delayed - 15 days 88 83
30 days 74 6045 days 56 3860 days N/A 19
/a Average of trials carried out over three years (1971/72-1973/74) at the Cotton Research Station at Nanded.
/b Average of trials on six varieties carried out in 1977/78at the Wheat Research Station at Niphad.
This data would be applicable in areas of similar low rainfall in Gujarat,although not so much in the high rainfall areas of the South.
15. The magnitude of these reductions in yield implies that a delayin planting of 15-30 days might turn an expected profit into a loss. Overtime when more research results become available and when these results havebeen communicated to the farmers, there will be an increasing concentrationof the planting of crops around the optimum date. This implies that futuresystems must be designed and operated in such a manner that farmers can plantat the optimum time. The optimum planting dates will vary for the differentcrops which, together with the trend towards a more complex cropping pattern,require a much more flexible and complex operation of the irrigation systems;no longer can the operation be based on rigid assumptions about irrigationseasons.
16. Irrigation water will become increasingly scarce in Gujarat inthe future. Research show that the number of irrigations often can be reducedbelow the theoretical level without any significant yield decreases. Thus,it is possible to increase total production by spreading the same amount ofwater over a larger area. However, water stress during different stages ofcrop growth has a very different impact on yield. Water stress during somecrop stages might have a neglible impact on the yield while the same waterdeficiency might result in considerable impact on the yield while thesame water deficiency might result in considerable yield decreases if itoccurs at a critical stage of crop growth. Consequently, under irrigationis acceptable only if the farmers can be assured of irrigation at the criticaltimes. This is not the case in the existing projects in Gujarat. However,there will be a trend towards controlled underirrigation in the future. Thus,combined with a shift towards more uniform planting dates, implies that theoperation of the system has to be more flexible and reliable.
52
ANNEX 2Page 1
GROUNDWATER RESOURCES
Regional Hydrogeology
1. In detail, the geology of the area is complex and a wide variety ofrock types, ranging in age from Archaean-Pre-Camibrian through Mesozoic andTertiary to Quaternary, are represented. A simpler picture may be presentedfor a regional description of the hydrogeology. Ancient crystalline rocks,mainly granites and gneisses, outcrop adjacent t:o the north-eastern boundaryof the State with Rajasthan and Madhya Pradesh. Predominantly extrusive rocksof the Deccan trap series occur in most of the Saurashtra peninsular regionand in the southeastern part of the State, except for a coastal plain zone ofvarying width where tertiary and quoternary sedimentary deposits are present.Alluvial deposits underlie a broad belt of counl:ry through central Gujarat.Kutch is a complex of Trap rocks, Mesozoic and Tertiary sediments and recentalluvium. Hard rock varieties outcrop in about half the area of the State.Phreatic aquifers form the most general sources of groundwater. However, anumber of important aquifers which are to some degree confined have beendeveloped. Water quality is generally good at hiigher elevation, but thereare extensive regfions of saline water in low lying areas adjacent to theGulfs of Cambay and Kutch and the Rans of Kutch.
Groundwater Balance Studies
2. The GWRDC has prepared hydrogeological maps showing aquifer type andwater quality, and has drawn up balances for recharge and extraction on thebasis of talukas. Some 500 observation wells are annually monitored for waterlevel changes, measurements being made at the end of monsoon, at the end ofrabi and at the beginning of the monsoon. Special studies were also carriedout with UNDP assistance durjing 1971-74 in the marked overdraft area ofMehesana. The taluka level studies are subject to continual updating. TheGWRDC has initiated village area (level) studies in the past two years inspecific areas where there is high level of groundwater exploitation.
3. The GWRDC has used the following methodology Eor compiling waterbalances. Recharge from rainfall on alluvium (apart from low rainfallareas) is compouted using a version of the Chaturvedi formula: I = 2 (R-15)2/5, where I = infiltration (in inches) and R = mean annual rainfall (ininches). As the formula is considered unapplicable in dry areas, rechargeis taken as 10% of the mean annual rainfall for such zones. Recharge onhard rock aras are also taken as 10% of mean annual rainfall. Flow metanalysis to estimate underflow is used for confined aquifers. While theChaturvedi formula has been widely used in many States, it can give resultswhich are widely in error if it is used where rainfall, topographic, soiland drainage conditions depart markedly from the area (part of Uttar Pradesh)for which the empirical relationship was derived.

53
ANNEX 2Page 2
4. Deep percolation from surface water irrigation systems by seepagelosses from canal and tanks are accounted for b! applying an appropriateseepage rate (typically 8 cusecs per million ft ) to the wetted surfacethrough the period that water is contained. On-field losses from surfacewater irrigation are taken as 50% of the applied water.
5. Return flows from pumped wells for irrigation are taken as 40%of gross extraction, while return flows from manually operated irrigationwells are taken as 20% of gross extraction.
6. Uncontrollable losses of recharge to groundwater are taken as10% of completed recharge. This is a particularly important element of thewater balance in hard rock areas with deeply incised natural drainage.Uncontrollable losses on flat alluvial plains are generally less importantand could probably be completed eliminated with appropriate management.A general figure for losses cannot therefore be given--each area must beconsidered subjectively and any surface hydrology evidence reviewed beforeassigning a proportion to such losses.
7. The inventories of the various types of water points are obtainedmainly from the land records maintained by the State administration. Addi-tional information has been obtained from the records of LDB, ID and theAgriculture Department. The inventories were originally compiled at panchayatand taluk level during the GWRDC groundwater surveys and have been subsequentlyupdated annually. Gross draft from groundwater are computed using the fol-lowing norms:
Aneual Draft(m x 1,000)
Dug wells in alluvium and hard rock 3.7Dug wells in allulvium with pumpset 18.0Dug wells in hard rock with pumpset 12.0Public health and private shallow tubewell 100.0Government tubewell 180.0GWRDC tubewell 280.0
8. In computing areas irrigated by the various types of water points,the following norms for command areas were used:
Dug wells 0.6 haDug wells with pumpsets 2.4 haShallow tubewells 20.0 haDeep tubewells 60.0 ha

TABLE T-154
INDIA
GUJARAT IRRIGATION I3 PROJECT
District-Wise Population (1971)
Population 1971Percent Annual Labor ForceUrban Growth Participatio
Total Urban Rural Population Rate 1961-71 Rate
Kutch 850 215 635 25.3 2.0 33.0Banaskantha 1,265 125 1,140 9.9 2.4 31.0Zone I 2,115 340 1,775 16.1 2.3 31.8
Jamnagar 1,111 401 710 36.1 3.0 29.1Rajkot 1,624 624 1,000 38.4 3.0 29.7Surendranagar 845 228 617 27.0 2.5 30.7Bhavnagar 1,405 444 961 31,6 2.3 29.6Amreli 849 169 680 19.9 2.4 29.6Junagadh 1,657 488 1,169 25.5 2.9 30.2Zone II 7,491 2,354 5,137 31.4 2.7 29.9
Bharuch 1,110 194 916 17.5 2.2 35.3Surat 1,787 604 1,183 33.8 3.1 37.1Valsad 1,429 241 1,188 16.9 2.3 35.4Dangs 94 0 94 0.0 2.8 41.9Zone III 4,420 1,039 3,381 23.5 2.6 36.2
Kheda 2,451 487 1,964 19.9 2.2 29.2Panchmahals 1,849 207 1,642 11.2 2.3 36.6Vadodara 1,980 603 1,377 30.5 2.6 32.0
Zone IV 6,280 1,297 4,983 20.7 2.4 32.3
Sabarkantha 1,188 103 1,085 8.7 2.4 29.2Mahesana 2,092 396 1,696 18.9 2.5 28.2Gandhinagar 201 24 177 11.9 3.9 29.6Ahmedabad 2,910 1,956 954 67.Z 3.2 29.4Zone V 6,391 2,479 3,912 38.8 2.8 29.0
GUJARAT 26,697 7,509 19,188 28.1 2.6 3.1.4
(Urban: 3.5)(Rural: 2.2)

TABLE T-2
55
INDIA
GUJARAT IRRIGATION II PROJECT
Characteristics of Rural Population (1971)
Landless as% of Agric. Literacy Scheduled ScheduledWorkers Rate Castes Tribes
Kutch 37.2 22.9 10.0 5.4Banaskantha 20.3 13.0 10.1 6.6Zone I 26.4 16.5 10.1 6.1
Jamnagar 20.9 23.0 6.9 0.3Rajkot 24.9 28.5 7.5 0.0Surendranagar 40.3 22.1 11.3 0.8Bhavnagar 34.9 23.7 4.7 0.0Amreli 29.6 30.1 8.2 0.0Junagadh 29.5 23.4 8.6 0.6Zone II 29.7 25.1 7.7 0.3
Bharuch 60.2 31.9 4.8 50.5Surat 55.1 30.9 3.1 65.0Valsad 42.5 32.8 2.8 60.1Dangs 23.0 14.0 0.4 93.5
Zone III 51.5 31.4 3.4 60.1
Kheda 33.0 38.4 6.3 1.1Panchmahals 8.9 18.8 3.6 41.9
Vadodara 49.4 31.5 5.3 33.0Zone IV 28.1 30.0 5.4 23.4
Sabarkantha 22.4 29.0 8.9 16.3Mahesana 34.9 36.0 9.2 0.3Gandhinagar 42.1 39.8 6.3 0.2Ahmedab 48.1 31.7 11.1 0.5
Zone V 35.2 33.2 9.5 4.8
GUJARAT 34.3 28.3 6.9 18.3
(Urban - 54.8 6.6 3.0)
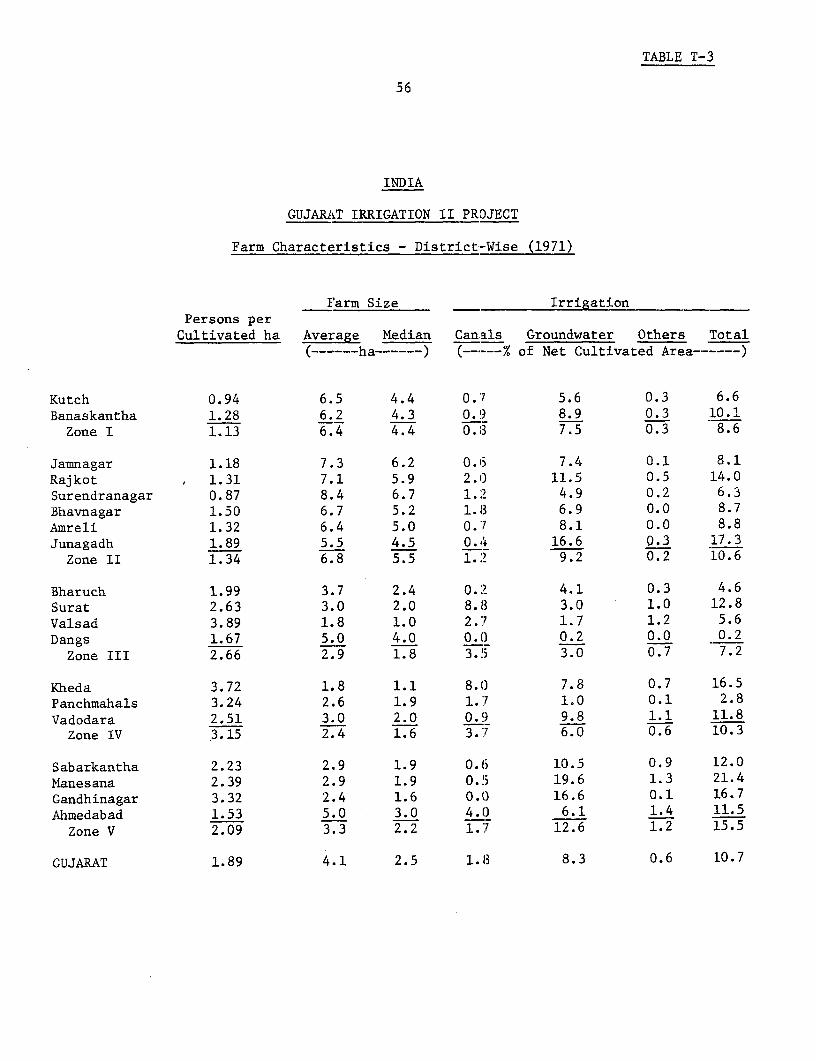
TABLE T-3
56
INDIA
GUJARAT IRRIGATION II PROJECT
Farm Characteristics - District-Wise (1971)
Farm Size IrrigationPersons perCultivated ha Average Median Canals Groundwater Others Total
(------ha…) (-----% of Net Cultivated Area…-----)
Kutch 0.94 6.5 4.4 0.7 5.6 0.3 6.6Banaskantha 1.28 6.2 4.3 0.9 8.9 0.3 10.1Zone I 1.13 6.4 4.4 0.63 7.5 0.3 8.6
Jamnagar 1.18 7.3 6.2 0.6 7.4 0.1 8.1Rajkot , 1.31 7.1 5.9 2.0 11.5 0.5 14.0Surendranagar 0.87 8.4 6.7 1.2 4.9 0.2 6.3Bhavnagar 1.50 6.7 5.2 1.3 6.9 0.0 8.7Amreli 1.32 6.4 5.0 0.7 8.1 0.0 8.8Junagadh 1.89 5.5 4.5 0.4 16.6 0.3 17.3
Zone II 1.34 6.8 5.5 1.2 9.2 0.2 :10.6
Bharuch 1.99 3.7 2.4 0.2 4.1 0.3 4.6Surat 2.63 3.0 2.0 8.8 3.0 1.0 12.8Valsad 3.89 1.8 1.0 2.7 1.7 1.2 5.6Dangs 1.67 5.0 4.0 0.0 0.2 0.0 0.2
Zone III 2.66 2.9 1.8 3.5 3.0 0.7 7.2
Kheda 3.72 1.8 1.1 8.0 7.8 0.7 16.5Panchmahals 3.24 2.6 1.9 1.7 1.0 0.1 2.8Vadodara 2.51 3.0 2.0 0.9 9.8 1.1 11.8
Zone IV 3.15 2.4 1.6 3.7 6.0 0.6 10.3
Sabarkantha 2.23 2.9 1.9 0.6 10.5 0.9 12.0Manesana 2.39 2.9 1.9 0.5 19.6 1.3 21.4Gandhinagar 3.32 2.4 1.6 O.O 16.6 0.1 16.7Ahmedabad 1.53 5.0 3.0 4.0 6.1 1.4 11.5Zone V 2.09 3.3 2.2 1.7 12.6 1.2 15.5
GUJARAT 1.89 4.1 2.5 1.13 8.3 0.6 10.7

INDIA
GUIJARAT IRRIGATION II PROJECT
Regional and occupational Distribution of
Income and Assets, Rural Guiarat 1972-73
Mean per capita expenditure per month Mean per capita land Mean household size
(in Rs) (in acres)
Household Occupation Household Occupation Houisehold Occupation
WCW Cult Ag. Lbr. Other WCW Cult Ag. Lbr. Other WCW Cult Ag. Lbr. Other
Region All 1 2 3 4 All 1 2 3 4 All 1 2 3 4
All 54.06 74.33 56.43 40.51 53.10 1.25 0.28 1.86 0.19 0.20 5.82 5.05 6.22 5.21 5.11
(31.78) (48.72) (31.54) (17.55) (31.55) (1.89) (1.13) (2.06) (0.77) (0.77) (2.70) (2.44) (2.73) (2.34) (2.81)
Eastern 44.11 65.28 43.50 34.16 56.61 0.96 0.18 1.31 0.11 0.09 5.67 4.94 5.94 5.45 4.28
(26.14) (36.91) (23.44) (14.02) (42.34) (1.32) (0,37) (1,42) (0.22) (0.19) (2.73) (2.49) (2.73) (2.44) (2.82)
Northern Plains 55.25 68.24 58.93 40.56 50.90 1.02 0.16 1.46 0.12 0.14 5.58 5.00 5.82 5.11 5.10
(29.40) (36.57) (30.41) (17,42) (24.98) (1.48) (0.44) (1.62) (0.34) (0.38) (2.49) (2.38) (2.52) (2.35) (2.28)
Southern Plains 59.34 87.91 66.23 37.24 60.47 0.96 0.49 1.70 0.06 0.15 5.54 5.08 6.00 5.09 4.96
(40,95) (60.91) (41.58) (13.87) (42.36) (1.71) (0.96) (2.06) (0.14) (0.41) (2.74) (2.28) (2.91) (2.22) (2.85)
Dry Areas 53.19 92.68 53.86 43.31 48.47 2.31 0.93 3.27 0.50 0.64 5.76 5.16 6.37 4.87 4.33
(27.56) (82.83) (19.47) (18.55) (16.25) (3.19) (3.13) (3.32) (1.89) (1.73) (2.70) (2.75) (2.62) (2.33) (2.50)
Saurashtra 57.51 68.17 60.87 49.14 47.92 1.47 0.08 2,32 0.36 0.12 6.54 5.11 7.14 5.48 6.13
(29.32) (31.40) (32.12) (20.61) (18.13) (1.74) (0.30) (1.73) (0.93) (0,36) (2.76) (2.47) (2.69) (2.34) (2.94)
NOTE: (a) WCW: White collar worker; Cult: Cultivation; Ag. Lbr.: Agricultural labor.
(b) Figures in parentheses show the standard deviation of per capita expenditlre, per capita land and household size. The means shown above are means of
the values for sample households.
Source: Joint ESCAP-IBRD Project on the Evaluation of Asian Data on Income Distribution, Working Paper No. 3; Size of Land Holding, Living Standards and
Employment in Rural Western India, 1972-73, by Pravin Visaria, October 1978.

58TABLE T-5
INDIA
GUJARAT IRRIGATION II ]'ROJECT
Area Under High Yielding Varieties in Gujarat State
Year Baira Jowar Maize Padcdy Wheat Cotton Castor( …0----'00 ha--------------------------)
Annual Plans
1966/67 20.8 0.4 3.1 0.4 0.7 - -
67/68 123.4 1.7 5.9 54.1 119.6 - -68/69 203.8 2.2 5.5 26.8 119.2 0.1 0.6
Fourth Plan
1969/70 274.4 8,1 4.1 45.1 175.0 4.4 0.670/71 557.3 4,8 4.7 49.1 174.3 23.8 1.671/72 663.6 3..0 5.5 60.7 261.0 44.5 3.572/73 923.9 3.1 7.0 83.4 232.8 184.3 16.573/74 1,102.7 11.0 16.2 88.1 314.7 363.7 22.5
Fifth Plan
1974/75 929.6 16.2 40.0 94.:L 329.2 346.8 46.875/76 1,292.5 79.2 47.8 171.6 452.0 238.3 31.876/77 980.8 37.5 48.9 178.0 506.4 171.3 33.777/78 1,045.9 32.1 57.5 216.3 582.3 198.3 80.278/79* 1,200.0 40.0 60.0 220.( 550.0 n.a. n.a.
*Provisional

5~9 TABLE T-6
INDIA
GUJARAT IRRIGATION II PROJECT
Fertilizer Consumption in Gujarat State
IndexYear N P K Total 1969/70 = 100
------------tons of nutrient-------------
Second Plan
1956/5757/5858/5959/60 6t639 3,160 - -60/61 7,386 3,524 161 11,071 11.74
Third Plan
1961/62 12,117 5,293 383 17,793 18.8762/63 14,161 7,686 681 22,528 23.8963/64 13,201 9,342 902 23,445 24.8664/65 25,824 13,136 2,309 41,269 43.7665/66 28,032 13,235 2,640 43,907 46.56
Annual Plans
1966/67 500316 12,935 3,551 66,802 70.8467/68 56,678 14,716 2,040 73,434 77.8768/69 67,059 23,501 3,345 93,905 99.58
Fourth Plan
1969/70 65,638 25,665 3,000 94,303 100.0070/71 105,711 51,923 6,646 164,280 174.2071/72 114,160 61,143 7,057 182,360 193.3872/73 113,806 54,639 10,612 179,057 189.8773/74 138,588 60,150 19,403 218,141 231.32
Fifth Plan
1974/75 86,131 35,443 12,593 134,167 142.2775/76 110,591 32,645 6,323 149,559 158.5976/77 131,493 51,834 11,675 195,002 206.7877/78 170,328 78,993 28,064 277,385 294.1478/79 191,965 93,078 35,626 320,669 340.04
Growth rate p.a. 1960/61 - 1978/79 18.30%

60 TABLE T-7
INDIA
GlJJARAT IRRIGATION II PROJECT
Trends ior Area Under Selected Major Crops
Average Annual Increase in Percent -
1949/50-1978/79) 1949/50-1963/64 1964/65-1978/79 1964/65-1978/79---- ---- Unadjusted---------------------) ---Adjusted 2/-
Bajra -0.7 -3.0 -1.5 -1.4(1.98)* (4.35)** (1.77)* (1-49)
Jowar -1.6 -1.2 -2.6 -2.4(9.34)** (3.08)** (5.17)** (6.47)**
Rice -0.4 +1.2 -1.4 -1.1(1.85)* (3.08)** (2.70)* (4.42)**
Wheat +1.5 +1.4 +2.5 +3.1(3.77)** (0.97) (2.14)* (4.13)**
Total Cereals -0.5 -1.4 -1.1 -0.8(3.27)** (3.72)** (2.13)* (2.07)*
Total Pulses -0.9 +0.7 -0.3 +0.3(2.50)* (0.75) (0.27) (0.64)
Foodgrains -0.6 -1.2 -1.0 -0.7(2.38)* (3.25)** (1.87)* (1.91)*
Groundnuts +3.4 +11.3 -0.9 -0.6(1.08) (11.00)** (1.44) (1.08)
Total Oilseeds +2.6 +8.3 -0.5 -0.3(5.25)** (10.97)** (0.41) (0.54)
Cotton +1.4 +4.3 +0.1 +0.2(4.41)** (4.65)** (0.29) (0.82)
Tobacco +1.5 +4.2 -0.6 -0.7(4.18)** (3.97)** (1.30) (1.28)
Sugarcane +7.0 +7.9 +3.2 +3.4(16.10)** (7.44)** (3.11)** (3.00)*
Potatoes +4.5 +2.9 +9.8 +10.0(5.16)** (1.43) (6.49)** (7.23)**
Chillies +0.3 +6.7 -3.7 -3.2(0.47) (3.68)** (3.24)** (2.81)*
Castor -0.4 +0.7 +4.0 +4.3(0.67) (0.45) (3.94)** (4.58)**
1/ Exponential trend, fitted through least square regression.2/ 1972/73 and 1974/75 were extreme drought years. The low rainfall in these years not
only affected the yields but also the cropped area. Since these two drought yearsoccurred almost in sequence and towards the end of the time period, they might seriouslydistort the regression results especially for the 1964/65-1978/79 time period. Thus, inthe "adjusted" time series, 1972/73 and 1974/75 have been excluded.
3/ t - values are given within parentheses.* - indicates that the coefficient is significant at the 10% level for a two-tail test.
** - indicates that the coefficient is significant at the 1% level for a two-tail test.

61TABLE T-8
INDIA
GUJARAT IRRIGATION II PROJECT
Trends for Yields of Selected Major Crops
Average Annual Increase in Percentl/1949/50-1978/79 1949/50-1963/64 1964/65-1978/79 1964/65-1978/79(--------------------Unadjusted---------------------) --- Adjusted 2/-
Bajra +5.2 +5.9 +2.5 +3.4(8.92)** (3.64)** (1.57) (2.62)*
Jowar +3.5 +2.5 +5.6 +6.2(7.07)** (1.87)* (3.97)** (6.85)**
Rice +3.0 +5.7 +4.1 +5.4(3.39)** (2.08)* (1.72) (4.27)**
Wheat +4.6 +1.8 +4.6 +4.5(14.58)** (1.97)* (8.46)** (7.79)**
Total Cereals +4.1 +4.6 +4.3 +4.9(10.16)** (4.04)** (3.46)** (5.11)**
Total Pulses +0.9 +2.4 +1.1 +1.3(2.75)* (2.36)* (1.30) (1.66)
Foodgrains +3.9 +4.4 +4.1 +4.6(9.80)** (3.97)** (3.44)** (4.94)**
Groundnuts +2.0 +3.8 +3.1 +4.8(2.24)* (1.92)* (1.01) (2.99)*
Total Oilseeds +2.5 +5.0 +3.3 +4.8(3.07)** (2.70)* (1.18) (3.19)**
Cotton +2.4 +2.5 +1.2 +1.4(5.82)** (1.67) (1.57) (1.91)*
Tobacco +3.8 +2.4 +5.0 +5.1(10.93)** (1.87)* (12.36)** (11.37)**
Sugarcane +0.1 +0.4 -0.4 -0.2(0.59) (0.40) (0.89) (0.66)
Potatoes +5.1 -1.3 +12.1 +12.0(4.80)** (0.57) (4.38)** (4.02)**
Chillies +1.4 +5.4 -0.5 -0.2(2.94)** (3.77)** (0.67) (0.34)
Castor +5.6 +1.3 +12.7 +13.0(7.72)** (1.17) (7.11)** (7.42)**
1/ Exponential trend, fitted through least square regression.2/ 1972/73 and 1974/75 were extreme drought years. The low rainfall in these years not
only affected the yields but also the cropped area. Since these two drought yearsoccurred almost in sequence and towards the end of the time period, they might seriouslydistort the regression results especially for the 1964/65-1978/79 time period. Thus, inthe "adjusted" time series, 1972/73 and 1974/75 have been excluded.
3/ t - values are given within parentheses.* - indicates that the coefficient is significant at the 10% level for a two-tail test.
** - indicates that the coefficient is significant at the 1% level for a two-tail test.

62TABLE T-9
INDIA
GCUJARAT IRRIGATION II PROJECT
Trends fcr Production of Selected Major Crops
Average Annual Increase in Percent 1/
1949/50-1978/79 1949/50-1963/64 1964/65-1978/79 1964/65-1978/79
---------------------Unadjusted----------------------- -- Adjusted 2/---
Bajra +4.5 +2.7 +1.0 +1.9(6.00)** (1.39) (0.47) (1.08)
Jowar +1.8 +1.3 +2.9 +3.7(3.39)** (0.93) (1.77)* (4.27)**
Rice +2.6 +7.0 +2.6 +4.3(2.59)* (2.37)* (0.93) (3.25)**
Wheat +6.5 +3.2 +7.2 +7.7(14.58)** (2.85)* (6.08)* (8.39)**
Total Cereals +3.6 +3.2 +3.2 +4.0(7.38)** (2.57)* (2.14)* (3.65)**
Total Pulses +0.04 +3.1 +0.8 +1.7(0.07) (1.77)* (0.55) (1.43)
Foodgrains +3.3 +3.2 +3.1 +3.9(6.82)** (2.47)* (1.97)* (3.54)**
Groundnuts +5.4 +15.5 +2.2 +4.1(4.65)** (7.04)** (0.70) (2.62)*
Total Oilseeds +5.2 +13.8 +2.8 +4.5(5.00)** (6.78)** (0.95) (2.91)*
Cotton +3.8 +7.0 +1.5 +1.9(7.58)** (4.35)** (1.72) (2.30)*
Tobacco +5.4 +6.5 +4.4 +4.4(12.42)** (2.92)* (7.91)* (6.85)**
Sugarcane +7.2 +8.3 +2.8 +3.2(14.07)** (7.04)** (2.34)* (2.58)*
Potatoes +9.8 +1.6 +23.2 +23.2(7.87)** (0.62) (11.47)** (10.43)**
Chillies +1.5 +12.6 -4.4 -3.7(1.57) (6.78)** (2.92)* (2.74)*
Castor +5.4 +1.9 +17.3 +17.9(5.10)** (0.8' (8.59)** (8.53)**
1/ Exponential trend, fitted through least square regression.2/ 1972/73 and 1974/75 were extreme drought years. The low rainfall in these years not
only affected the yields but also the cropped area. Since these two drought yearsoccurred almost in sequence and towards the end of tsae time period, they might seriouslydistort the regression results; especially for the 1954/65-1978/79 time period. Thus, inthe "adjusted" time series, 1972/73 and 1974/75 have been excluded.
3/ t - values are given within paLrentheses.* - indicates that the coefficient is significant at the 10% level for a two-tail test.
** - indicates that the coefficient is significant at the 1% level for a two-tail test.
INDIA
GUJARAT IRRIGATION II PROJECT
Summary of Present and Forecast Groundwater Balances
Surface
Mean Annual Estimated Net Draft % of Net Draft % of Irrigation
District Area Rainfall Recharge 1976/77 Recharge 1980/81 Recharge Scheduled
(kWm) (mm) (Mcm) (Mcm) (Mcm) (ha)
Ahmedabad 8,707 782 639 152 24 230 36 USabarkantha 7,390 749 898 444 53 509 57 30,770
Rajkot 11,203 594 771 436 56 454 59 27,940
Junagadh 10,607 844 598 347 58 368 62 61,940
Jamnagar 14,125 466 383 248 65 261 68 18,620
Kutch 45,612 340 336 154 46 192 57 19,840
Surendranagar 10,488 487 278 168 60 178 64 18,220
Amreli 6,760 515 400 333 83 348 87 6,100
Bhavnagar 11,155 620 619 331 54 353 56 23,480.
Valsad 5,238 1,071 1,091 67 6 79 7 70,850
Kaira 7,194 770 1,736 218 13 288 17 7,690
Vadodara 7,788 917 788 142 18 215 27 157,490
Surat 7,745 1,806 1,571 146 9 161 10 24,290
Banaskantha 12,702 758 944 237 25 305 32 10,530
Bharuch 9,045 877 595 66 11 117 20 13,360
Panchmahals 8,866 1,027 601 186 31 196 33 64,780
Mahesana 9,027 613 708 644 91 668 94 3,000
1/ Some local overdraft near city, but large surface irrigation development scheduled.
t?Ji

INDIA
GUJARAT IRRIGATION II PROJECT
Irrigated Area as % of Gross Cropped Area, Gujarat State
GrowthRate
Crop 1967/68 1968/69 1969/70 1970/71 1971/72 1972/73 1973/74 1974/75 1975/76 % p.a. 1/
All Crops 10.1 11.4 12.4 12.5 12.5 15.1 14.7 19.7 10.6 4.0
Foodgrains 10.3 12.5 12.5 11.6 12.0 13.9 12.3 17.9 16.4 3.7
Rice 24.3 28.2 26.3 28.2 29.1 40.7 37.0 24.8 31.8 0.2
Wheat 50.3 70.2 82.9 57.2 57.4 30.9 57.6 74.1 79.6 4.4
Total Cereals& Millets 11.1 13.6 13.5 12.5 13.0 15.0 13.3 19.1 17.8 3.7
Total Pulses 1.7 1.4 1.0 1.7 1.6 2.1 1.9 2.9 1.8 5.0
Maize 3.8 4.0 4.8 4.4 4.5 4.8 4.6 9.2 8.6 10.4
Jowar 3.9 2.8 3.6 2.5 2.8 3.7 3.8 10.0 2.7 0.3
Bajra 2.5 2.9 2.9 3.4 3.4 4.0 3.4 12.1 8.5 17.6
Cotton 12.8 12.9 12.9 18.4 15.7 19.8 19.1 18.9 21.6 7.0
Groundnut 0.8 1.1 1.1 2.1 2.1 1.3 1.4 2.9 2.0 7.5
Sugarcane 2/ 90.0 80.0 91.7 100.0 100.0 94.7 81.8 73.2 100.0 3.1
1/ Exponential trend fitted through least square regression.2/ Deviations from 100% are probably due to discrepancies in reporting.
Source: Estimates of Area and Production of Principal Crops in India: Directorate of Economics and Statistics.

65 TABLE T-12
INDIA
GUJARAT IRRIGATION II PROJECT
Area Irrigated by Source as % Net Irrigated Area
1960/61 1965/66 1969/70 1970/71 1971/72 1972/73 1973/74 1974/75
Government Canals 9.5 13.5 17.0 17.3 16.4 14.4 17.3 16.8
Private Canals 0.1 0.1 0.1 0.0 - - -
Wells 83.1 82.8 79.6 79.0 79.3 81.5 79.9 80.8
Tanks 1.9 2.8 2.5 2.7 2.9 2.6 1.8 1.5
Other Sources 5.4 0.8 0.8 1.0 1.4 1.5 1.0 0.9
Total , 100.0 100.0 100.0 100.0 100.0 100.0 100.0 100.0
Source: 1978/79 Socio-Economic Review, Gujarat State, Bureau of Economics and Statistics,G.Q.G., Gandhinagar.(1974/75 data supplied by Irrigation Department)

INDIA
GUJARAT IRRIGATION II PROJECT
District-Wise Distribution of Irrigation by Minor Irrigation Schemes
1965/66 1966/67 1967/68 1968/69 1969/70 1970/71 1971/72 1972/73 1973/74 1974/75 1975/76 1976/77 1977/78-7. of Total-~~~~~~~~~~~~~~~~~~~~~~~~~~~~~~~~~~~~~~~~~~~~~~~~~~~~~~~~~~~~~~~~~~~~~~~~~~~~~~~~~~~~~~~~~~~~~~~~~~~~~~~~~~~~~~~~~~~~~~~~~~~~~~~~~~~~~~~~~~~~~~~~~ --------- -------- -------- -------- ---------------------- of Total- - - ------------- --------- ~~~~~~--- -- -- - - -- - - -- - - -
Kutch 32.6 29.1 31.4 17.5 6.0 19.5 27.6 17.0 11.4 7.5 14.8 22.9 17.8
Banaskantha 0.7 0.5 1.1 1.3 0.1 1.2 1.2 1.4 2.0 1.9 1.5 2.7 2.6Zone I 33.3 29.6 32.5 18.8 6.1 20.7 28.8 18.4 13.4 9.4 16.3 25.6 20.4
Jamnagar 8.4 8.4 8.0 10.4 10.1 6.5 5.2 11.1 3.6 0.1 7.2 5.5 2.4Rajkot 5.8 4.6 6.1 11.7 8.2 9.2 11.2 4.4 1.2 18.3 14.2 11.2 8.5
Surendranagar 1.8 3.4 1.9 3.6 1.4 1.6 1.7 - 0.4 5.4 2.2 1.9 6.3Bhavnagar 9.5 12.2 3.7 10.5 14.4 8.3 7.7 1.6 6.7 8.6 2.2 4.7 3.3Amreli 5.1 4.2 4.2 5.6 4.1 4.0 4.9 3.2 2.2 7.8 4.0 2.7 2.5Junagadh 3.6 2.8 3.8 2.2 0.7 0.7 1.5 1.7 0.6 1.2 0.2 0.3 0.4
Zone II 34.2 35.6 27.7 44.0 38.9 30.3 32.2 22.0 14.7 41.4 30.0 26.3 23.4
Bharuch 0.6 2.4 2.3 3.1 5.7 3.7 3.4 5.0 3.1 2.3 3.3 3.1 3.2Surat 2.6 3.5 2.0 4.1 3.3 2.4 2.7 6.1 2.5 3.8 1.3 2.5 1.4Valsad - 0.0 - - 0.0 0.0 0.0 0.0 0.3 0.7 0.2 0.2 0.3
Zone III 3.2 5.9 4.3 7.2 9.0 6.1 6.1 11.1 5.9 6.8 4.8.8 8 4.9
Kheda 2.4 5.9 5.9 1.4 9.5 7.9 4.3 2.1 12.6 2.3 9.5 9.4 13.7Panchmahals 6.6 4.8 10.0 8.3 13.4 11.1 10.7 17.3 18.7 15.3 14.5 12.8 9.9Vadodara 16.0 14.2 16.0 15.6 21.8 18.8 15.4 25.2 27.8 23.8 20.5 15.7 11.7
Zone IV 25.0 24.9 31.9 25.3 44.7 37.8 30.4 44.6 91 6145 3A 35.3
Sabarkantha 1.0 1.5 1.1 3.0 0.7 2.1 0.8 2.7 2.2 0.9 1.7 1.5 1.2Mahesana 3.3 2.5 2.5 1.6 0.6 3.0 1.5 1.0 4.3 0.1 2.5 2.1 5.7
Ahmedabad - - - 0.1 - - 0.2 0.2 0.4 - o.2 0.8 9.1Zone V 4.3 4.0 3.6 4.7 1.3 5.1 2.5 3.9 6.9 1.0 4.4 4.4 16.0
GUJARAT STATE 100.0 100.0 100.0 100.0 100.0 100.0 100.0 100.0 100.0 100.0 100.0 100.0 100.0
'000 ha 32.5 28.9 42.9 34.3 32.9 40.4 38.5 22.3 27.1 19.8 40.1 49.4 56.9
Source: Irrigation Department, GOG

INDIA
CUJARAT IRRIGATION II PROJECT
District-Wise Distribution of Irrigation by Major and Medium Schemes
Growth Rateof Irrigated Area
1967/68 1968/69 1969/70 1970/71 1971/72 1972/73 1973/74 1974/75 1975/76 1976/77 1977/78 1967/68-1977/78
----------------------------------------------------% of Total----------------_______________________________ -_
Kutch 2.0 1.1 0.8 2.3 2.1 0.6 0.8 0.3 1.1 1.5 0.8 2.1
Banaskantha 7.3 6.0 2.1 6.8 4.9 4.0 6.7 3.6 7.0 7.5 7.6 8.6
Zone I 9.3 7.1 2.9 9.1 7.0 4.6 7.5 3.9 8.1 9.0 8.4
Jamnagar 2.2 2.4 3.0 2.1 1.7 2.5 1.7 0.3 1.8 2.3 1.5 -2.1
Rajkot 12.3 12.8 13.2 9.8 9.2 8.6 6.3 5.8 7.3 7.7 11.2 -0.4
Surendranagar 5.9 5.2 6.1 6.0 5.9 1.5 0.6 - 2.5 2.0 2.6 -8.3
Bharnagar 8.5 10.0 6.8 4.5 8.3 6.5 3.9 6.8 2.3 5.8 6.8 -1.2
Amreli 2.6 3.1 1.5 1.3 1.5 0.1 1.5 0.5 0.5 1.4 0.1 -15.5
Junagadh 1.0 0.6 0.6 0.4 0.6 0.5 0.3 0.1 0.3 0.6 1.0 3.8
Zone II 32.5 34.1 31.2 24.1 27.2 19.7 14.3 13.5 14.7 19.8 23.2
Bharuch - - - - - - - - - - - -
Surat 23.8 22.2 28.2 26.2 25.5 45.0 37.5 45.0 38.9 37.5 33.9 11.1
Valsad - - - - - - - - - - - -
Dangs - _ -
Zone III 23.8 22.2 28.2 26.2 25.5 45.0 37.5 45.0 38.9 37.5 33.9
Kaira 16.7 18,6 26.1 21.6 23.1 18.9 21.7 27.3 20.3 18.1 18.4 4.9
Panchmahals 1.8 2.0 2.0 2.0 1.5 1.9 1.7 1.9 1.6 0.9 1.2 3.2
Vadodara 1.4 0.9 1.4 1.4 0.8 1.1 1.8 0.6 0.7 0.8 0.7 -2.0
Zone IV 19.9 21.5 29.5 25.0 25.4 21.9 25.2 29.8 22.6 19.8 20.3
Sabarkantha 6.5 9.9 3.3 8.3 8.6 3.9 7.2 3.4 8.0 7.4 8.0 5.3
Mahesana - - - - 0.1 0.1 0.4 - 0.1 0.1 0.1 13.0
Gandbinagar - - - - - - - - - - - -
Ahmedabad 8.0 5.2 4.9 7.3 6.2 4.8 7.9 4.4 7.6 6.4 6.1 4.9
Zone V 14.5 15.1 8.2 15.6 14.9 8.8 15.5 7.8 15.7 13.9 14.2
GUJARAT STATE 100.0 100.0 100.0 100.0 100.0 100.0 100.0 100.0 100.0 100.0 100.0 4.9

68TABLE T-15
INDIA
GUJARAT IRRIGATION II PROJECT
Irrigation Trends Under Major and ledium Schemes
A. Trends in the Cropping Pattern of Manor and Medium Schemes
Jowar, Bajra Other TotalSugarcane & Other Cotton & Kharif Lucerne & Other Other Gujarat
Year & Banana Paddy Kharif Crops Tobacco Groundnut Wheat Crops Perennial Crops Crops State
1965/66 14.3 28.5 9.0 11.9 7.4 18.5 2.4 2.6 5.4 100.0
1966/67 10.3 30.1 11.4 13.1 12.9 12.2 2.0 2.0 6.0 100.0
1967/68 6.9 28.1 6.6 14.1 11.2 21.2 5.8 2.1 4.0 100.0
1968/69 8.8 31.0 10.4 13.7 11.7 14.2 3.2 2.1 4.9 100.0
1969/70 11.4 29.3 7.6 21.7 9.4 11.4 1.8 1.6 5.8 100.0
1970/71 7.4 30.3 4.8 20.1 4.6 21.6 5.4 1.1 4.7 100.0
1971/72 6.6 30.8 2.9 25.6 5.8 17.5 2.0 1.6 7.2 100.0
1972/73 13.9 30.2 12.6 19.2 12.9 6.3 1.4 1.2 2.3 100.0
1973/76 13.5 28.4 2.8 19.4 5.4 20.9 4.3 1.1 4.2 100.0
1974/75 13.3 30.4 9.7 16.2 6.1 14.1 1.7 1.7 6.8 100.0
1975/76 13.7 37.8 2.0 16.1 4.1 19.3 1.8 1.4 3.8 100.0
1976/77 20.6 28.7 2.8 14.9 4.4 20.3 3.7 1.6 3.0 100.0
1977/78 20.5 ' 28.8 2.3 16.4 6.1 13.9 3.1 2.0 6.9 100.0
B. Index of Area Irrigated by Crop in Major and Medium Schemes, 1965/66 = 100
1965/66 100.0 100.0 100.0 100.0 100.0 .00.0 100.0 100.0 100.0 100.0
1966/67 74.3 109.3 129.7 114.4 179.5 68.2 88.7 81.0 114.4 103.3
1967/68 64.0 131.9 98.2 158.6 203.7 152.7 325.8 112.1 96.8 133.7
1968/69 101.0 178.8 189.9 190.8 260.8 326.1 221.0 135.0 150.0 164.7
1969/70 109.8 142.4 116.6 253.2 176.9 85.8 103.1 86.1 147.8 138.5
1970/71 81.6 168.5 84.5 269.7 98.7 185.4 358.4 70.0 137.7 158.8
1971/72 67.9 157.9 47.2 316.3 114.1 138.1 124.4 87.7 195.3 146.3
1972/73 124.4 135.6 179.1 207.3 223.5 43.2 72.4 60.7 54.7 128.0
1973/74 159.8 168.4 52.0 276.4 123.8 190.8 305.5 74.5 132.1 169.2
1974/75 159.7 184.1 185.3 236.1 142.8 131.3 123.6 114.0 216.2 172.6
1975/76 180.7 251.3 42.0 257.4 104.5 197.4 143.2 103.8 133.2 189.5
1976/77 307.7 215.5 67.2 268.2 129.2 234.8 334.7 128.8 120.7 214.3
1977/78 330.8 233.6 58.2 319.2 192.0 174.1 303.4 175.3 296.8 231.4
C. Growth Rate
% p.a. growthrate 1/ 1965/66
- 1977/78 12.5 6.7 -8.0 8.2 -1.4 7.4 6.8 2.5 4.6 6.2
1/ Time trend fitted through least squares regression, and adjusted to exclude the drought years of 1972/73 and 1974/75.
Source: Irrigation Department, GOG.
INDIA
GWARAT IRRIGATION 11 PROJECT
Utilization of Pulblic Sector Irrigation Investments
Major and Median-, _ Minor ___________ Tubewells 1otal
(1) ()()(1) ()(3) (1) (2) (3 (1 (2)(3Potential /a Potential /a Potential /a Potential /a
Potential Available tilization (2)a. Iof (1) Available Utilization (2) as 7. of (1) Available Uti]iation (2) an 7. ot (1) Available Utilization (2 s % ofcreated utilized -'000 ha - 7. - '000 h -7. -000 h~~~~~~~~~~vaiabl I!ilia -i_o.-0011 uin-za7-.-
created utilired ---- 000 ha -- ------ --- ---- --- 2%------- ---------- ' 000 ha--------- ------- °/ ------- - ----------- ' 000 ha------- - ------ =/ --- ----- ----- ---- ' 000 ha ---- -- -- - -- --- -7 - ------
-by in
1955/56 1956/57 0.23 -- 0.93 -- 0.11 -- 1.27 --
1960/61 1961/62 1.83 0.84 45.9 1.26 0.11 8.7 0.30 0.22 73.3 3.39 1.17 34.5
1965/66 1966/67 3.41 1.86 54.5 1.41 0,29 20.6 0.48 0.34 70.9 5.30 2.49 47.0
1968/69 1969/70 4.39 2.49 56.7 1.56 0.33 21,2 0.63 0.41 65.1 6.c8 3.23 49.1
1973/74 1974/75 6.22 3.10 49.8 1.22 /b 0,20 16.4 0.81 0.65 80.2 8.27 3.95 47.9
1974/75 1975/76 6.80 3.67 54.0 1.23 0.40 32.5 0.83 '.39 47.0 8.86 4.45 50.2
1975/76 1976/77 7.61 3.85 50.6 1.27 0.49 38.6 0.86 0.24 27.9 9.74 4.58 47.0
1976/77 1977/78 8.36 4.16 49.8 1.14 /b 0.68 59.6 0.88 0.31 35.2 10.38 5.14 49.5
1977/78 9.24 -- 1.17 -- 1.00 -- 11.41 --
1978/79 10.16 -- 1.26 -- 1.20 -- 1 2,62 --
Source: Public Works Depart-ent (Irrugation Departmn-t)
-- : Not Available
/a The "Utilization" figures were taken froo the "Actual Irrigation i aintr and Medium Irrigat,o- Schemes" series, and sot from the "Statement sh-oin,g lrrigation Potential a1d U'tll-ati-l of
Major and Mediun Irrigation Projects is Cujarat State". Ac these '"actual irrigation" figures are thi result c,I a straight addLtis of i1le area - rrigated i.e nath season (regardless .f crop),
whereas the "potential` figsres are the result of adding the ar-a irrigated -nder each crop over tht entire year, the irrigated areas -ider tws-snasol..-I art do-ble-co--ted, an,d these oder
peren-ials triple-counted, when making thin esi-parison of potential and utilicati-m. lniefrt-.nately, no morn anes-rate data are anal nla .
/b Reappraised.

INDIA
GUJARAT IRRIGATION II PROJECT
Uitilization of Selected Major and Medium Schemes
61/62 66/67 69/70 74/75 75/76 76/77 77/78 Average
Scheme p U _/ P U U/P P U U/P p U U/P P U U/P P U U/P P U U/P P U U/P---'0000 a-ha---7.-- --'000 00 ha ha----% ------'000h- -ha --- --- '00-- a-000 -ha-- 7 ---- 00 --'000 -%------000- haha --- -.-- -a--'0000ha- ha -- - 000000 a---- - ---
Ukai - - - - - 12.2 9.0 74.2 60.2 14.0 23.2 111.0 9.0 8.1 135.0 13.6 10.0 79.6 11.4 28.9
Kakrapar 122.7 25.3 20.8 113.8 52.4 46.1 128.3 69.0 53.8 213.0 129.2 60.7 213.4 127.6 59.8 213.8 133.5 62.4 214.3 126.0 58.8 174.2 94.7 51.8
Mahi 51.8 6.3 12.1 106.8 28.5 26.7 95.5 64.7 67.8 132.0 84.5 64.0 138.8 74.6 53.7 155.8 69.8 44.8 177.8 76.5 43.0 122.7 57.8 44.6
Kadana - - - - - - - - - - - - - - - 5.0 - - 23.0 0.5 2.0 14.0 0.5 2.0
Dantiwada _ _ - 19.3 6.5 33.7 35.4 5.1 14,4 43.8 11.2 25.4 44.0 25.7 58.4 44.0 29.0 66.0 44.2 31.8 71.9 38.5 18.2 45.0
Shetrunji (Pali) - - - 34.8 13.0 37.4 34.8 7.9 22.6 34.8 12.8 36.8 34.8 3.6 10,3 34.8 14.6 41.8 34.8 18.6 53.3 11.7 33.7 19.0
Moti-Fatewadi 13.8 17.2 124.8* 26.6 17.8 67.0 13.0 12.2 94.2 19.8 13.6 68.8 19.8 28.1 141.6* 19.8 24.6 124.2* 19.8 25.4 128.2* 19.0 19.9 107.0*
Karicut - C - 9.6 - 9.7 2.6 26.8 10.5 0.9 8.3 10.2 1.7 16.3 10.2 7.9 77.2 10.2 9.0 88.0 10.2 9.4 92.1 10.2 5.9 51.4 0J
Bhadar - - - 3.0 7.2 235.9* 16.2 18.2 112.4 17.2 10.2 59,6 17.2 9.1 52.8 17.2 9.8 56.8 17.2 12.9 75.4 14.7 11.2 98.8
Sasoi 3.8 0.4 10.9 3.8 2.7 72.4 3.1 3.3 108.8 3.1 0.1 1.0 3.1 1.4 44.4 3.1 3.5 114.7 3.1 3.0 97.1 3.3 2.1 64.2
Hiran (S) - - - 2.4 0.3 13.6 2.4 0.7 28.4 2.6 0.2 5.7 2.6 0.3 10,7 2.6 0.5 19.0 2.6 0.7 ?6 2 9 6 0 '. A ''
Macchu II - - - - - - - - - 7.3 0.2 3.2 7.3 0.2 2.7 7.3 0.2 3.0 7.3 0.3 4.0 7.3 0.2 3.2
Brahmni 10,9 2.4 21.8 10.9 8.4 76.5 9.3 10.1 108.8 13.1 - - 13.1 5.3 40.7 13.1 4.6 34.8 13.1 6.6 51.6 11.9 6.3 55.7
Gujarat State 249.6 83.7 33.5 492.8 185.7 37.7 440.2 249.0 56.6 622.3 310.2 49.9 679.9 366.6 53.9 760.8 385.2 50.6 835.6 415.9 49.8 583.0 285.2 47.4
Gutjarat State (excl.Ukai-Kakrapar &Mahi-Kadana 75.0 51.9 69.2 272.2 104.8 38.5 216.5 115.3 53.3 265.0 87.4 33.0 267.4 150.5 56.3 275.1 172.9 62.8 285.6 199.3 69.8 236.7 126.0 54.7
1/ U/P%: Utilization as a % of potential, probably over-estimated by 20-30%, but this factor varies significantly between schemes.
*Unlikely to be accurate
NOTE: P = Potential created by the end of the previous year, i.e., that potential which is available for utilization in each year.
U = Utilization: these figures were taken from the "Actual Irrigation by Major and Medium Irrigation Schemes" series, and not from the "Statement showing Irrigation Potential and
Utilization of Major and Medium Irrigation Projects in Gujarat State". As these "actual irrigarion" figures are the result of a straight addition of the area irrigated in each
season (regardless of crop), whereas the "potential" figures are the result of adding the area irrigated ,,nder each crop over the entire year, the irrigated areas under two-seasonals
are double-counted, and those under perennials triple-counted, when making this comparison of potential and utilization. Unfortunately, no more accurate data are available.
Source: Irrigation Department, GOG

71
INDIA
GUJARAT IRRIGATION II PROJECT
MAJOR IRRIGATION PROJECTS
Index to Map Number 14606
Sr. CCANo. Name of Project ('000 ha)
COMPLETED
1. Dantiwada 54.662. Shetrunji 57.75
ON-GOING
3. Damanganga 56.114. Kakrapar 227.605. Ukai 190.906. Panam 30.997. Mahi Stage I 263.208. Mahi Stage II (Kadana) 19.499. Watrak 23.8910. Dharoi 57.9411. Karjan 55.7812. Heran 43.5513. Sukhi 19.12
FUTURE
14. Orsang 16.1915. Sipu 31.78

72
INDIA
GUJARAT IRRIGATION II PROJECT
MEDIUM IRRIGATION PROJECTS
Index to Map Number :L4606
Sr. CCA Sr. CCANo. Name of Project ('000 ha) No. Name of Project ('000 ha)
COMPLETED
16. Ver I 1.37 44. Ozat P.W. 3.24
17. Doswada 0.92 45. Ozat II 2.50
18. Heran P.W. 3.42 46. Hiran I 3.96
19. Karad 6.19 47. Sandroli -
20. Patadungri 5.07 48. Munjisar 3.46
21. Meshwa P.W. (10.77) 49. Moj 3.10
22. Moti Fatewade 29.15 50. Vartu 2.91
23 Kharicut Canal 10.53 51. Ghee 2.57
24. Karoldam (1.21) 52, Puna 1.03
25. Hathmati Weir (19.31) 53. Sasoi 4.32
27. Hathmati Dam 19.31 54. Sapda 1.13
27. Meshwa 24.33 55. Fulzar I 2.19
28. Rarnav I 3.24 56. Demi 4.21
29. Bhogavo I 3.24 57. Machhu I 10.42
30. Bhogavo II 0.61 58. Brahmani 30.36
31. Limbdi Bhogavo 4.22 49. Gajod 4.23
32. Goma 3.24 60. Kankawati -
33. Bhimdad 1.98 61. Sanadro 3.02
34. Ghe'lo 4.18 62. Niruna 2.71
35. Rangola 10.12 63. Kaila 3.56
36. Rojki 2.52 64. Rudramata 3.13
37. Malan 3.38 65. Suvi 2.08
38. Khodiar 9.87 76. Madhuwante 2.51
39. Surajwadi 1.35 79. Chhaparwadi (L) 1.13
40. Raval P.W. 1.35 81. Phophal 4.68

73
index to Map Number 14606 (cont.)
Sr. CCA Sr-. CCANo. Name of Project ('000 ha) No. Name of Project ('000 ha
41. Machhundri P.W. 3.24 82. Kalindri 2.10
42. Bhadar 26.59 85. Machhu II * 9.11
43. Gondli - 87. Kaswati 0.81
* Failed 11 August 1979.

74
INDIA
GUJARAT IRRIGATION II ]'ROJECT
MED:IUM IRRIGATION PROJECTS
Index to Map Number 14606
Sr. CCA Sr. CCANo. Name of Project ('000 ha) Nc. Name of Project ('000 ha)
ON-GOING
66. Saraswati 8.74 80. Chhaparwadi (J) 3.36
67. Sakhbhadar 3.86 83. Sorthi 2.14
68. Dhari 0.94 84. Fulzar II 0.73
69. Rajawal 0.41 86. Nara 1.79
70. Bagad 2.02 88. Gajansar -
71. Dhatarwadi 3.12 108. Baldeva 2.11
72. Raval II 6.14 110. Rami 1.89
73. Machhundri II 4.28 113. Wankaleshwar Bhey -
74. Shingoda 6.07 117.. Machhanala 3.03
75. Hiran II 9.51 130. Kalubhar -
77. Ambajal 0.94 141. Sani 4.72
79. Jhanjeshwari 4.05 154. Ghodatad 1.32

75
INDIA
GUJARAT IRRIGATION II PROJECT
MEDIUM IRRIGATION PROJECTS
Index to MaP Number 14606
Sr. CCA Sr. CCANo. Name of Project (1000 ha) No. Name of Project ('000 ha)
FUTURE
89. Manal Dam & 124. Vekri N.A.Kothar P.W. N.A. 125. Rupen N.A.
90. Nani Vahial N.A. 126. Bhakhari N.A.91. Delhi. P.W. N.A. 127. Chimnabai (Lake) N.A.92. Sindhumber N.A. 128. Rel (Dhanera) N.A.93. Tan - Amba N.A. 129. Nal-Lake N.A.94. Kelia N.A. 131. Kharo N.A.95. Jhuj N.A. 132. Lakhanka N.A.96. Kahndolpura N.A. 133. Sangawadia N.A.97. Sara N.A. 134. Datardi N.A.98. Antapur N.A. 135. Meghal 0.4099. Zhankhri 37.73 136. Vrajani 1.08100. Piparia N.A. 137. Amipur 8.06101. Lakhigam 0.79 138. Minsar N.A.102. Ver II 4.05 139. Vadala 0.63103. Sankara 1.64 140. Shedha-Bharathi N.A.104. Pigut 1.42 142. Vardai N.A.105. Kakdi - Anba N.A. 143. Weiron Bhadar N.A.106. Chopadvav N.A. 144. Karmal 1.40107. Dholi N.A. 145. Venu II 6.19109. Men 4.44 146. Und-Jivapur 4.62111. Deo 7.77 147. Aji III N.A.112. Umaria 2.19 148. Gadadharoi 3.31114. Hadaf 5.82 149. Bhahmani N.A.115. Edalwada 1.38 150. Bitaveladia N.A.116. Kabutary 1.82 151. Kalaghoda N.A.118. Bhadar (Mahi) 4.41 152. Mitti 1.78119. Mazam 6.53 153. Janghadia 0.55120. Bakrol N.A. 155. Bawia N.A.121. Vaidy 2.01 156. Mathal 1.04122. Gujai N.A. 157. Bhukhi 1.38123. Harnav II N.A.

IBRD 13202R
MARCH 1980
R A N A
A s ~~~GUJARATIsohyets and Irrigation Needs
8)_IDOHYETE OF MEAN ANNUAL RAINFALL (inmm
E.1 TATIONE OF MEAN ANNEAL RAINFALL Inmm
IRRIGATION NEEDE-
VERYI HICH NEED
54; I II H~~~~~~~~~~~~~~~IGH NEED
Z J MODERATE NEED
A A~~~~~~~~~~~~~~~~~~~~~7,~~~ >r...J 7~~~~~~~~~~7 ~LOA NEED)
~~OCV½~~~~¾~~~.~~) / / -...- ~~~~~~~DISTRICT BOLUNDARIRES
894 , 211 ~~~~~~~~~~~~~~~~~~~~~~ E~~~TATE BOUNDARIES
jC CNY~~~~~ 47 ~~INTERNATIONAL BOLUNDARIES
...... ...... )..
J5RF~~~~ CV> SO C-
C> ~ ~ ~ ~ ~ ~ ~ ~ ~ ~ ~ ~ ~ ~ ~ N E~~~~~~~~~~~~~AKIETAN,,'ŽC HIA
0 40 80 120 V4 / N
KILOMETERS ( .-
0 1 6 32 46 64 ''UEa oVlA ay
MILES IV-
SRIK LANKA


IBRD 13203R
700 ~ 750° MARCH 1980
250 250
R A4 INDIA
P A K I S T A N GUJARAT
' * * _zt,df ' ' ,+UF', ,' ,}\ ~.%Soils and Salinity
-~~~ ------- ---------- - --------------------------- ~--/ 4
AlI11W- S, sOy So is' t = E = = ~ = --== ':~'. ;' ', ,~,-:,-. '. .. ;: '. --.' ....... ., S \ .).to... 01DecnCso,nC SSol
MCAo- Elsk Sods
On-p B,o ,il,
Goeale, Th,e 1500 PPM ODf
['-' Vesy Hioh Sol, ty A, eC"
0 4C 80 l20 \; \ Ei \2 i\~~~~~~~~- l~~ -> >ti \; So; i0E tC Bosn's e
'9,
70°~~~~~~~~~~~~~~~~~~~~~~~~~~~~~~~~~~~~~~~~- , -, S - 000 ,s,.,0nC
. ' .__ .i._ . . I t
PAK.STAN, 6 HCTANS
e,.,.I fl- C 5'~~~~~ NDI
AP4 80 120 (./i KILOMETERS S n F hee
-200 0 16s 32 48 64 lOsssshsMnp-proIs h odOhsogfnsgCel C O gS0550 20- Asnon o
MILES Oosdos hn osSnso o5Sns, eSoaCo IsoWddg-sk-sdid
aCeSasOCCsd Os,d--o >SlI LANKA
700'


IBRD 14606OCTOBER 1979
INIDIA
R A MAJOR AND MEDIUM IRRIGATION PROJECTSP A K I S T A N >t.- GUJARAT IRRIGATION IIr PROJECTGUAT
00 ~~~~~~~~~~~~~~~COMPLETED 0NG01NG PROPOSED IRRIGATION 0
.. 50 D~~~~~~~~~ ~~AM SITESPOJC
\ -it
- x~~~~~J- ~~~ BANASKANTHA N MAJOR COMMANDOS
4 (2 " oi~~~~~~~~~2 /MAJOR ROADSR
i'>tj5 2.2C t47 '--- MAJOR RALOANS
61 m'0,11MH 2
-< KVf~~Hz J-< C,~~~, - BANS MATN 07 ........-. -. ONA ISTR(CT BOUNDARIES
-- -SNH~- TATE BOUNOARIEO
156 64 AGA A ARK IA 5 ~~~~~~~~~~~~~~~~~~~~~~~~~~~~~~~~~~~~~~ N~~~IVERS
C 145 ;S RENDR~~~~~~~~~~~~~~~~~~~~~AR 109 S~~~~~~~1 TO7 FOR EXPLANATION ORE SEPARATE TABLE
G,11- Kutch -DH~~~OO4 ~ 11w
141 10 50 ¾14
~~~~~G2~~~~~~~~130 09 - 2~~~~~~3937
N. .. 9. ,( N BAA H )ji'1
sos~~~~~~~~~~~~~~~~1 Kar I N
PORRANAR ~~~~~~~~~~~' 0 . .p,.,4b,Th,W..0~~~~~~~~~~~~~~~~~RHTA
AMRo N 47 ARL
Bo ~ ~ ~ ~~ >l1,<*02
PAKISTAN ~ SP LNk


IBRD 14923MARCH 1980
INDIA
R A4 GUJARATP AK I ST AN ASOCIO-ECONOMIC SUB-REGIONS
~~~~! (-VTE- ~~~~~~~~~~~~~~~~~~~~~~~SOEIO-ECONOMIE LA-REGIONS
'NS--. -. . V - ~~~~~~~~~~~~~~~~~~~~~~~~~~~~~~~~~~~~~~~~~~~REGION 2 EAOTRTN R.I
------- NAKA6 R ANy V/- REGION T, GRITS PLAINS9A&. W7/CV AN ± /\ REGION VOUTOY GRAIG
I REGION S. SVI)RAOHTRAiN. ~~ ~~~~~~~~~~~~~~~~~~~~0 SM5JORTON
EMAJOR VOGGO
~~~N ( ~~~~~~ AGAR) SBAKA&/1 ~~~~~~~~~~~~~~~~~~~~~ ~ ~ ~ ~ STATE ROUNESPPES
INTERNAT GNAL ES/SNAR ES
Z ~ ~ ~ ~ ~ ~ ~ ~ ~ ~ ~ ~ ~ ~ ~ ~ ~~~~~~~~~~~~~~~~~~~~~~~~~~~VRZ' RIVERS
/~~~~~~~~~~~~~~~~~~~~~~~~~~~~~~~~~~~~~~~~~~~ANO UC
N ~~~~~/EA / §o1t ' ?VA 4~~-' A AIN
V iN ±fVVW~~~~~~~~~ >~~~o -C(~~~~~Y -oN
Pofie~ ~~~~~~~~- L-x
'H'
II~~~~~~,-
PAKISTAN RI-IJTAN
DA ~ ~ ~ ~ ~ ~ ~ ~ ~ ~ 0 4,0 80 120 I N' I-
KILOMETERS
0 16 32 4,8 64
MILES10 -
ski LANKA


