Embed Size (px)
Citation preview

The World Bank
FOR OMCAL4 USE ONLY
Repot No. 6216
..
YUGOSLAVIA
NAFTAGAS PIPELINE PROJECT
(LOANS 916-YU AND 1264-2-YU)
PROJECT COMPLETION REPORT
May 22, 1986
Energy and Industry Staff
Tb1 iscemat bs a rsutctd db.M.S sod my be and by uIpleat euy to Oh peferme oftheir adaI ddm. lb cmtmu any se odhww_e be disdiued wthu Wdadd Bank authutloa.
Pub
lic D
iscl
osur
e A
utho
rized
Pub
lic D
iscl
osur
e A
utho
rized
Pub
lic D
iscl
osur
e A
utho
rized
Pub
lic D
iscl
osur
e A
utho
rized
Pub
lic D
iscl
osur
e A
utho
rized
Pub
lic D
iscl
osur
e A
utho
rized
Pub
lic D
iscl
osur
e A
utho
rized
Pub
lic D
iscl
osur
e A
utho
rized

THE WORLD SANK FOR OFFICIAL USE ONLYWashington. D.C. 20433
US.A.
Ofice cEO 0I4PCtU-CW47AlI
May 22, 1986
MEMORANDUM TO THE EXECUTIVE DIRECTORS AND THE PRESIDENT
SUBJECT: Project Completion Report on Yugoslavia - NaftagasPipe.line Project (Loans 916-YU and 1264-2-YU)
Attached, for information, is a copy of a report entitled "ProjectCompletion Report on Yugoslavia - Naftagas Pipeline Project (Loans 916-YU and1264-2-YU)" prepared by the Energy and Industry Staff. Under the modifiedsystem for project performance auditing, further evaluation of this projectby the Operations Evaluation Department has not been made.
Attachment
This document has a restricted distribution and may be used by recipients only in the performanceof their official duties. Its contents may not otherwise be disclosed without World Bank authorization.

FOR OMCIAL USE ONLYYUGOSLAVIA
NAFTAGAS PIPELINE PROJECT
(LOANS 916-YU AND 1264-2-YU)
PROJECT COMPLETION REPORT
TABLE OF CONTENTS
Page No.
Preface .... ... ........................ .. .......... .. ........... iBasic Data Sheet ..................... ................. .. iiHighlights ........... ........... v
PROJECT COMPLETION REPORT
I. INTOUTO .....,s...............
II. PROJECT PREPARATION AND APPRAISAL ....... ...... 3
Project P r e p a r a t i o n 3Project's Role in Long-term Paan 4Project De or i p t i o n 5Project Covenants and Amendments........................... 5
IlI. PROJECT IMPLEMENTATION, OPERATION AND COST............. 6Revisions to the Poo 3 e c t 6Project Implementation 7Project Costs .......... O . 8Performance of Co ns u l t a n t s 9
IV. OPERATING PERFORMANCE$........ ....... 9The Natural Gas 9arket .................... . 9Safety of Supply ...... 10Project's ................................... ....... . ...... 10
V. FINANCIAL PERFORMANCE ......................................... 11
Operating Results.................................... ...... 12Financial Covenants......................... . ... ...... ........ .13
VI. INSTITUTIONAL PERFORMANCE................... 14Organization and Management1......................... ........ 14Staff Development...... .......... ...... .. . ..... ... 15Management Consultants and Covenantsvenants.......... 16
VII. ECONOMIC PERFORMANCE..................... 16Project Achievements.hemn.ts.. . . ....... .. .. ........ 16Economic Rate of Return ' 17Least Cost Solution 18
This document hk a restricted distribution and may be used by recipients only in the perfonmanceof their offiil duties. Its contents may not otherwis be diclosed without Worid Bank authorlzuton.

TABLE OF CONTENTS (continued)
Page No.
VlII. BANK PERFORNANCE........................................... 18Overall Performance . . .......... 18Supervision... so.... *. .... ....... a .. *.* .... e* ......... e 18Working Relationship . 18Project Outcome * 19
IX. OCUIe 19
Annexes
1. Comparison of Estimated and Actual Project Costs08t8e...... 202. Schedule of Disbursements ................................ 213. Appraisal and Actual Financial Statements.****............
3.1 Income Statements of NGU. . .............. 243.2 Balance Sheets of NGU 253,3 Funds Flow Statements of NGU 263.4 Income Statements of Butangas/Energogasas............ 273*5 Balance Sheets of Butangas/Energogas................. 283.6 Funds Flow Statements of Butangas/Energogas.......... 29
4* Economic Anysss i s 305. Organization Charts of NGU and Energogasr............as.... 33
ATTACHMENT A: Comments from the Borrower (Energogas) 35ATTACHMENT B: Comments from toe Borrower (Vaftagas-Gas) 36
WS
IBRD No. 10308 (PCR)IBRD No. 103091R (PCR)

YUGOSLAVIA
NAFTAGAS PIPELINE PROJECT
PROJECT COMPLETION REPORT
Preface
Naftagas Pipeline Project, loan 916-YU, was signed on June 25,1973. Out of the loan amount, US$59.4 million, steps have been taken tocancel US$1,116,000 during the first half of 1986. To cover extraordinarycost increases and to ensure the gas supply needed for the Sarajevo AirPollution Project, an additional $11.0 million loan for the project, thesecond tranche of Loan 1264-YU, was signed on June 8S 1976, and was fully dis-bursed in June 1982, except for US$97,1700 which was cancelled.
This Project Completion Report (PCR), prepared by the Energy Depart-ment, is ba&sd on documents in the Bank's files, the findings of a Bankmission which visited Yugoslavia in Septeaber/October 1985 and documents anddata furnished by the Bcrrowers. Naftagas-Gas Unit (NGU) submitted acompletion report giving its views on the project implementation, which havebeen taken into account.
In accordance with the revised procedures for project performanceaudit reporting, this PCR was read by the Operations Evaluation Department(OED) but the project was not audited by OED staff.
Following atandard procedures, OED sent copies of the draft reportto the Government and the Borrower. Comments received from Naftagas-Gas andEnergogas have been reproduced as Attachments A and B to the report.

- ii -
BASIC DATA SHLET
YUGOSLAVIA
NAFTAGAS PIPELINE PROJECT - LOANS 916-YU AND 1264-2-YU
KEY PROJECT DATA(US$ million)
As of 7/31/85Original Disbursed Cancelled Repaid Outstanding
Loa.a Amount916-0 37.0 36.8 - 14.5 22.3916-1 22.4 20.9 - 8.8 12.1Sub Total of 916 59.4 57.7 - 23.3 34.4
1264-2 11.0 10.9 0.1 2.3 8.6Total 70.4 68.6 0.1 25.6 43.0
Qamulative loan Disburseemit
FY74 FY75 FY76 FY7 FY78 FY79 FYM) FY81 FM82 FY83 FM/ FY85 FY86
916-YU
( i) Appraisal Estimate 10.8 39.5 59.4( ii) e-praisal Hat. - - - - - - 39.4 52.2 58.9 59.4 - - -(iii) Actual
916-0 0.3 11.2 34.6 36.8 38.0 38.9 39.5 33.3 33.5 33.8 36.3 36.8 36.9916-1 - - - - - - - 6.3 16.0 17.7 19.1 20.8 21.4Total 0.3 11.3 34.6 36.8 38.0 38.9 39.5 39.6 49.5 51.5 55.4 57.6 58.3
(iv) (iii) as C of (i) 3% 2% 58% 62% 64% 66% - - - - - - -(v) (iii) as % of (ii) - - - - - - 100% 76% 84% 87% 93% 97% 98%
1264-2-lU
FY77 FY78 FY79 FY80 FY81 FY82
( i) Apraisal Estimate 3.5 9.0 11.0( ii) Actual 0 0 4.2 9.9 10.0 10.9(iii) (ii) as of(i) 0 0 38 so 91 100

- iii -
OTHER PROJECT DATA
Actual orOriginal Revisions Re-estimated
Board Approval 916-YU 06/19/73 - 06/19/731264-2-YU 05/26/76 - 05/26/76
Loan Agreement 916-YU 06/25/73 - 06/25/731264-2-YU 06/08/76 - 06/08/76
Effective Date 916-YU 11/30/73 - 63/20/741264-2-YU 12/31/76 03/31/77 05/31/77
Loan Closing 916-YU 06/30/77 06/30/83 06/30/851264-2-YU 06/30/81 12/31/81
Date all Physical Components Completed 06/30/76 06/30/82 12/31/85Total Project Cost (US$ million) 130.4 1/ 216.1 199.1
overrun (X) - 66 53Economic Rate of Return (%) 23 52 29
Borrower/s Naftagas- NGU NGU (Ln 916 andGas Unit (NGU) 1264-2)
Butangas Energogas (Ln 916-:Executing Agency/ies NGU NGt1 NGU (Ln 916-0 and
1264-2)Butangas Energogas (Ln 916-:
Fiscal Year of Borrower Jan 1 - Dec 31 Jan 1 - Dec 1
1/ Due to changes in the project scope, the originally appraised project cost is not full:comparable to the revised and actual costs.

- iv -
MISSION DATA
Month/ No. of No of Staff Date ofYear Weeks Personq Weeks Report
Identification 05/71 - - -
Preparation 03/72 1.2 1 1.2 05/05/72Preappraisal 07/72 5.0 2 10.0 07/28/72Appraisal 11/72 4.0 5 20.0 12/22/72 (Issues Paper)
Appraisal (Follow-up) 01/73 1.0 2 2.0 05/25/73 (SAR)
TOTAL 33.2
Supervision I 07/73 0.8 1 0.8 08/28/73Supervision II 10/73 1.4 2 2.8 12/07/73Supervision III 04/74 1.4 1 1.4 04/26/74Supervision IV 12/74 1.0 2 2.0 01/07/75Supervision V 02/75 0.8 1 0.8 03/13/75Supervision VI 11/75 1.4 2 2.8 12/04/75Supervision VII 05/76 1.6 2 3.2 07/27/76Supervision VIII 10/76 0.8 1 0.8 10/27/76Supervision IX 03/77 1.4 1 1.4 03/23/77Supervision X 07/77 0.6 1 0.6 08/03/77Supervision XI 01/78 1.0 1 1.0 02/06/78Supervision XII 02/79 0.8 1 0.8 02/12/79Supervision XIII 11/79 0.8 2 1.6 12/12/79Supervision XIV 04/80 3.6 3 10.8 05/29/80
(Re-Appraisal)Supervision XV 11/80 2.4 2 4.8 12/12/80Supervision XVI 04/82 1.4 2 2.8 06/04/82Supervision XVII 02/83 1.6 2 3.2 04/15/83Supervision XVIII 12/84 1.4 2 2.8 01/15/85Completion 10/85 2.0 3 6.0 12/31/85TOTAL 50 4
CURRENCY EXCHANGE RATES
Name of Currency Yugoslav Diner
Appraisal Year Average (1973) US$1.0 = 16.2Intervening Years Average US$1.0 = 42.1
15.9 - 152.8Completion Year Average (1985) US$1.0 - 280

YUGOSLAVIA
NAFTAGAS PIPELINE PROJECT - LOANS 916-YU AND 1264-2-YU
PROJECT COPMPTETION REPORT
Highlights
1. Loan 916-YU, US$59.4 million, for the Naftagas Pipeline project wasapproved by the Bank's Board on June 19, 1973. The main objective of the pro-ject was to expand the Borrower's, Naftagas-Cas Unit (NCU), natural gas trans-mission and distSibution capacity from about 700 million NM3 to about2,500 million NM per year to serve the demand of industrial consumers inVojvodina and Serbia. On the institutional side, the project provided fortraining of staff and improvements in NGU's accounting and audit procedures.The project cost was estimated at US$130.4 million, of which US$59.4 inforeign exchange.
2. By 1974/5, the cost of steel had increased to about US$1,000 per tonfrom about US$350 per ton at the time of appraisal and it became clear thatNGU's financial resources would be insufficient to carry out the project asappraised. The Bank, therefore, agreed to amend the Loan Agreement in June1976, substantially reducing the project scope by excluding the southern partof the pipeline. A supplementary Bank Loan (1264-2-YU) of US$11.0 million wasmade available to NGU and additional financing from local sources was obtainedto ensure the fund.ng of the reduced project.
3. Subsequently, the 1974 Yugoslav Constitution and 1976 Law onAssociated Labour led to a regional split up of NGU, with the former NCUaffiliate, Butangas (now &aergogas) being established as a separate legalentity for gas operations in Serbia. After a reevaluation of the project in1980, and a reappraisal of its financial aspects, the Bank agreed to a secondamendment and the Loan was apportioned between NGU and the new borrowerButangas.
4. The above amendments to the project, necessitated by external factorsthat could not have been foreseen et -.ae project appraisal, delayed theproject execution by about four and a 'elf y ars. The project was furtherdelayed mainly by the complicapted local tpproval process for procurement,especially the supervisory control and data acquisition (SCADA) system. Thefinal project cost was US$199.1 million dollars, which is about 52% over theoriginally appraised cost for a substantially larger project but about 8%below the 1980 reappraisal estimates.
5. Despite cost increases, delayed implementation and other problems en-countered during project execution, the main project objectives were met orexcieded. The BorroNer increased gas supplies in Vojvolina and Serbia fromabout 700 million NM is 1974 to about 2,800 million NM in 1985 (in additionto about 525 million NM for Sarajevo) and is expected to supply 4,400 millionNM3 in 1990 (in addition to 850 million NM3 for Sarajevo). The financialperformance of the Borrowers improved under the project and the economicinternal rate of return of the project, as executed, is now estimated at 29%(in 1985 real terms), which compares favourably with the 23% estimated in 1973for the original project.

YUGOSLAVIA
NAFTAGAS PIPELINE PROJilCT - LOANS 916-YU AND 1264-2-YU
COMPLETION REPORT
I. INTRODUCTION
1.01 Due to rapid increase in energy demand before the first oil crisisand high cost of liquid fuels, the Federal Government decided to providenatural gas as a lower cost alternative source of energy for a wide range ofconsumers. The Naftagas pipeline project provided the necessary infra-structure to realize Government's plans for increased use of domestic andimported natural gas. In addition to providing badly needed foreign exchangefor the project, the Bank's involvement was justified by its assistance toGovernment and NGU in formulating an integral energy sector approach to thenatural gas development and by the institution building of NGU provided underthe project.
1.02 Since appraisal in 1972/73, the Naftagas pipeline project was subjectto substantial changes in project scope, borrowing institutions, andfinancing. A summary description of main project events is given below.
1.03 The project was presented to the Bank's Board on June 19, 1973 andthe loan was made effective in March 1974. Due to accelerated worldwide in-flatinn, in the aftermath of the first oil crisis, the cost of steel increasedfrom about US$350 per ton at the time of appraisal to about US$1,000 per tonin 1974/75. The borrower, Naftagas-Cas Unit (NGU), was unable to secure addi-'ional foreign financing to cover the revised higher project cost, and pro-curement was stopped. To enable the project to go ahead, the Bank agreed inJune 1976 to amend the Loan Agreement as follows:
- The Southern part of the pipeline (Paracin to Nis) was excluded fromthe project to be considered under future investment programs;
- A supplementary Bank loan (1264-2-YU) of US$11.0 million, under theSarajevo Air Pollution Control Project approved on May 25, 1976, wasmade available for tinancing part of zhe project (Batajnica toZvornik pipeline); and
- Additional financing was obtained from Beogradska Banka, theprovinces of Serbia, Vojvodina, and Bosnia-Herzegovina and commercialsources for the local costs of the scaled down project.
The above revisions delayed the start of the project by about two and a halfyears and the closing date of the Loan 916-YU was extended from June 1977 toDecember 1979. However, slower than projected procurement and constructiondelays, especially for the Serbian part of the pipeline, made another exten-sion of the closing date (to June 1981) necessary.
1.04 The Yugoslav Constitution of 1974 and new Law on Associated Labour of1976 institutionalized a system of workers' self-management and also started amovement towards decentralization and more regional autonomy. Against thisbackground, a former NGU affiliate, Butangas with operations in Serbia, became

- 2 -
an independent Work Organization qf Associated Labor (WOAL) within theconglomerate Naftagas Kombinat. 1 The Government of Serbia, therefore,proposed that the Serbian part of the project be implemented and operated byButangas. After Bank reappraisal of the financial aspects of the project, thefollowing second amendment to the project was agreed in January 1981 betweenthe Government, Borrowers and the Bank:
- Butangas took over all NGU's gas operations in Serbia, Macedonia,Montenegro and Kosoro and assumed responsibility for that part of theproject (i.e. the Batajnica to Paracin pipeline) together withcorresponding obligations towards the Bank;
- Butangas was made a joint borrower with NGU under the Bank loan 916-YU (similar to the Sarajevo Air Pollution Control Project loan1264-2-YU, under which NGU and the Sarajevo Gas Enterprise (SGE) werejoint borrowers); and
- The total amount of Loan 916-YU, US$59.4 million, was apportionedproviding US$37.0 million for NGU and US$22.4 million for Butangas.
The above changes were primarily organizational and did not alter thetechnical, institutional and economic objectives of the project. However,this reorganization and amendments to the loan documents caused further delaysof about two years in the completion of the Serbian part of the pipeline, andthe closing date of Loan 916-YU was extended, this time to June 1983.
1.05 However, NGU/Butangas had stopped processing project procurementwaiting for the conclusion of the second amendment. The validity of bids forthe SCADA equipment expired and NGU/Butangas hesitaLed to retender as dis-bursement for this part of the project could not be completed by 1983. Aftersome deliberation, the Bank finally extended the closing date of the projectto June 1985, but limited disbursement to the outstanding SCADA systemcontracts only.
1.06 In June 1984 Butangas and its Basic Organization of Associated Labour(BOAL), Butangas-Promet, Titograd, merged and assumed the name 'Energogas', awork organization without BOALs. The Loan Agreement was amended accordinglyin October, 1985. Apart from some simplification in accounting and admini-strative procedures, this change of name did not materially affect theproject.
17 Naftagas Kombinat is the second largest Composite Organization ofAssociated Labor (COAL) in Yugoslavia. A COAL consists of a number ofWOALs and a WOAL consists of a number of Basic Organizations of Labour(BOAL).
-3-
II. PROJECT PREPARATION AND APPRAISAL
Origin
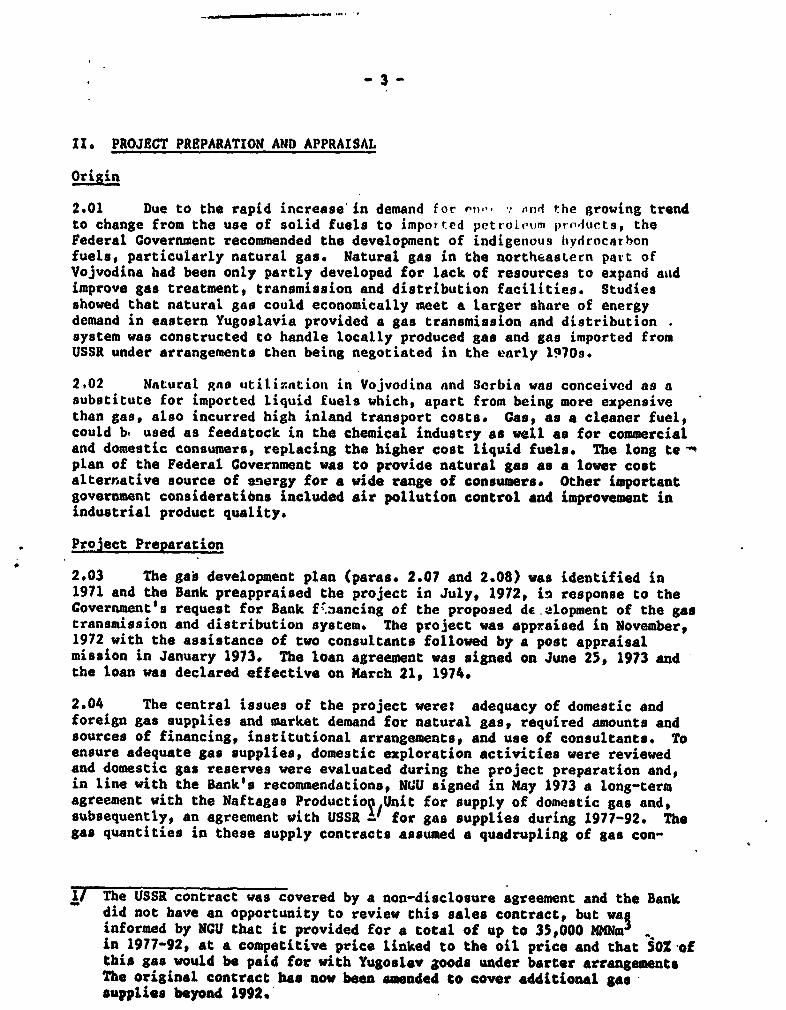
2.01 Due to the rapid increase in demand for tn- .- Arido the growing trendto change from the use of solid fuels to impotted pettroie.'m proAuctst theFederal Government recommended the development of indigenous hydrocarhonfuels, particularly natural gas. Natural gas in the northeastern patt ofVojvodina had been only partly developed for lack of resources to expand atidimprove gas treatment, transmission and distribution facilities. Studiesshowed that natural gas could economically meet a larger share of energydemand in eastern Yugoslavia provided a gas transmission and distributionsystem was constructed to handle locally produced gas and gas imported fromUSSR under arrangements then being negotiated in the early 1970s.
2,02 Natural gns utilization in Vojvodina and Serbia was conceived as asubstitute for imported liquid fuels which, apart from being more expensivethan gas, also incurred high inland transport costs. Gas, as a cleaner fuel,could b. used as feedstock in the chemical industry as well as for commercialand domestic consumers, replacing the higher cost liquid fuels. The long toplan of the Federal Covernment was to provide natural gas as a lower costalternative source of energy for a wide range of consumers. Other importantgovernment considerations included air pollution control and improvement inindustrial product quality.
Project Preparation
2.03 The gas development plan (paras. 2.07 and 2.08) was identified in1971 and the Bank preappraised the project in July, 1972, in response to theGovernment's request for Bank fiancing of the proposed de.alopment of the gastransmission and distribution system. The project was appraised in November,1972 with the assistance of two consultants followed by a post appraisalmission in January 1973. The loan agreement was signed on June 25, 1973 andthe loan was declared effective on March 21, 1974.
2.04 The central issues of the project were: adequacy of domestic andforeign gas supplies and market demand for natural gas, required amounts andsources of financing, institutional arrangements, and use of consultants. Toensure adequate gas supplies, domestic exploration activities were reviewedand domestic gas reserves were evaluated during the project preparation and,in line with the Bank's recommendations, NUU signed in May 1973 a long-termagreement with the Naftagas Productiog Unit for supply of domestic gas and,subsequently, an agreement with USSR _' for gas supplies during 1977-92. Thegas quantities in these supply contracts assumed a quadrupling of gas con-
The USSR contract was covered by a non-disclosure agreement and the Bankdid not have an opportunity to review this sales contract, but waginformed by NCU that it provided for a total of up to 35,000 MMNm'in 1977-92, at a competitive price linked to the oil price and that 501 ofthis gas would be paid for with Yugoslav goods under barter arrangementsThe original contract bas now been amnded to cover additional gas-supplies beyond 1992.

-4-
sumption during the project period. The projected gas consumption was basedon a market survey of the potential gas demand in Vojvodina and Serbia carriedout by the Borrower, assited by consultanta and supported by the Bank. Demandprojections proved to be correct, even if the actual gas supply lagged fore-casts due to delays in project execution.
2.05 The financial package for the project was a major hurdle. Afternegotiations between the concerned parties, financing/grant agreements weresigned in 1972 between NGU dnd the Republic of Serbia, the Province ofVojvodina and the Beogradska Banka. During nr3otiations, the originally pro-posed Bank Loan of US$52 million was increasel to US$59.4 million to ensurefull financing of the project. An administration and financing agreement,setting out the rigi,ts and obligations regarding project financing andexecution, was signed in June, 1973 between the Bank, NGU and BeogradakaBanka.
2.06 To ensure NGU's independant legal status, e.g. for concluding gassupply contracts, the signing of a self management agreement between NCU andNaftagas Kombinat according to Yugoslav law was made a condition of effective-ness. Furthermore, NCU agreed to employ consultants to strengthen itsaccounting, audit, and management systems and US$0.5 million of the Loanamount was set aside for training of the external ̂ uditor's staff. Asengineering consultants were needed before Loan effectiveness, the Bank agreedto finance such consultants retroactively.
Prolect's Role in Long-term Plan
2.07 The Federal Government feared that the rapid increase in Yugoslavia'senergy consumption during the 1960s and early 19709 would lead to excessivereliance on imported crude oil and recommended in its development plan thatgreater attention be given to the development of indigenous hydrocarbon fuels,particularly of natural gas. Studies sponsored by the Governments of Serbiaand Vojvodina and Petrolunion reiterated that while total primary energy de-mand in Serbia and Vojvodina was expected to increase two and one-half timesbetween 1970 and 1985, the demand for hydrocarbons would increase by aboutfive times. The deficit would have to be met primarily by imported crude oiland refined oil products unless new local natural gas resources were developedand/or natural gas was imported.
2.08 Surveys in 1971/72 of the energy market in Serbia and Vojvodinashowed that by 1985, natural gas could economically meet 18% of the primaryenergy demand in eastern Yugoslavia compared to about 6% in 1970, providedthat a gas transmission and distribution system was constrticted by 1976.Based upon these studies, Naftagas, which at that time was the only enterprisedealing with oil and gas production as well as gas transmission and distri-bution in Serbia and Vojvodina, prepared a long-term plan for the developmentof hydrocarbons in eastern Yugoslavia, including the exploitation of theexisting natural gas reserves. The Naftagas pipeline project provided thenecessary infrastructure to realise these plans for increased use of n#turalgas.

Project Description
2.09 The project, as conceived, provided for the procurement and con-struction of:
(i) A main pipeline from Horgos on the Hungarian border and fokrinin Vojvodina through Belgrade and Paracin to Nis, about 200 kmsouth of Belgrade. (The Paracin to Nis pipeline was laterexcluded from the project, see para 3.01);
(ii) Several branch lines, including one from Batajnica, just northof Belgrade, to Loznica on the border between Serbia and Bosnia-Herzegovina;
(iii) Field compressors and supply pipelines from gas fields to themain pipeline;
(iv) Distribution pipelines to consumers;
(v) Two gas treatment plants and LPC recovery;
(vi) Distribution rings;
(vii) Automated central dispatch station with SCADA systems; and
(viii) Technical assistance for the Borrower and the Social AccountingService (SAS/SDK - the Government's auditing branch).
2.10 The project was designed to expand the Borroier's natural gas trans-mission and distribution capacity from 700 million NM per year to about 2,500million NM per year. The system was intended to handle forecast peak loadsand to armit further expansion with t e addition of line compressors to reacha maxin ̂ capacity of 4,750 million NM per year. As a core project in thelong-term plan of Naftagas, the project for which the Bank assistance had beenrequested consisted of the construction of gas treatment, transmission anddistribution facilities. With the eventual addition of line compressors in1980 and 1985, these facilities were expected to serve the demand of 145 majorindustrial consumers in Serbia and Vojvodina in 1992.
Project Covenants and Amendments
2.11 The Loan Agreement dated June 25, 1973 provided for the followingmain covenants:
Section 3.02: a subsidiary Loan Agreement between NGU and SAS;
Section 3.03: NCU to employ engineering and accounting consultants;
Section 3.09S NCU to hire consultants to carry out a tariff study fqrnatural gas;
Section 3.11t NCU to submit by October 31, 1974, evidence of gas supplyag5eements with US.S.Ra. and Hungary for up to 35 billionNM during the period of 1977 through 1992;
-6-
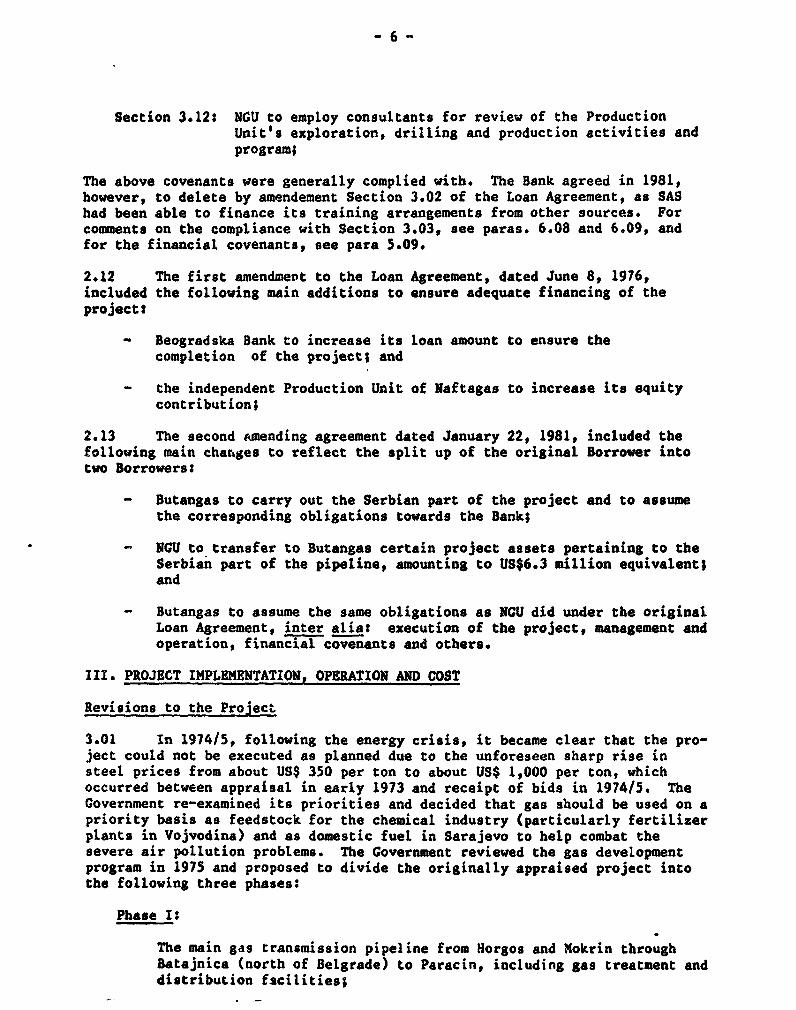
Section 3.12: NGU to employ consultants for review of the ProductionUnit's exploration, drilling and production activities andprogram;
The above covenants were generally complied with. The Bank agreed in 1981,however, to delete by amendement Section 3.02 of the Loan Agreement, as SAShad been able to finance its training arrangements from other sources. Forcomments on the compliance with Section 3.03, see paras. 6.08 and 6.09, andfor the financial covenants, see para 5.09.
2.12 The first amendment to the Loan Agreement, dated June 8, 1976,included the following main additions to ensure adequate financing of theproject:
- Beogradska Bank to increase its loan amount to ensure thecompletion of the project; and
- the independent Production Unit of Naftagas to increase its equitycontribution;
2.13 The second amending agreement dated January 22, 1981, included thefollowing main changes to reflect the split up of the original Borrower intotwo Borrowers:
- Butangas to carry out the Serbian part of the project and to assumethe corresponding obligations towards the Bank;
- NGU to transfer to Butangas certain project assets pertaining to theSerbian part of the pipeline, amounting to US$6.3 million equivalent;and
- Butangas to assume the same obligations as NCU did under the originalLoan Agreement, inter alia: execution of the project, management andoperation, financial covenants and others.
III. PROJECT IMPLEMENTATION, OPERATION AND COST
Revisions to the Project
3.01 In 197415, following the energy crisis, it became clear that the pro-ject could not be executed as planned due to the unforeseen sharp rise insteel prices from about US$ 350 per ton to about US$ 1,000 per ton, whichoccurred between appraisal in early 1973 and receipt of bids in 1974/5. TheGovernment re-examined its priorities and decided that gas should be used on apriority basis as feedstock for the chemical industry (particularly fertilizerplants in Vojvodina) and as domestic fuel in Sarajevo to help combat thesevere air pollution problems. The Government reviewed the gas developmentprogram in 1975 and proposed to divide the originally appraised project intothe following three phases:
Phase I:
The main gas transmission pipeline from Horgos and Mokrin throughBatajnica (north of Belgrade) to Paracin, including gas treatment anddistribution facilities;

-7-
Phase II1
The gas transmission pipeline from Batajnica to Zvornik (on theborder to Bosnia-Herzegovina) and a compressor station to meet theneeds of consumers along the pipeline and in the city of Sarajevol
Phase III:
The gas transmission pipeline from Paracin to Nis, compressorstations and distribution facilities.
3.02 The Governmerst proposed and the Bank agreed (June 8, 1976) to financephase I under the existing loan (Loan 916-YU) and phase II under the SarajevoAir Pollution Control Project (Loan 1264-YU). Phase III would be constructedat a later stage, subject to the availability of funds and additional gassupplies. Construction of this phase has not yet been initiated. A map isattached indicating the final stretch of project pipelines.
Project Implementation
3.03 Procurement and construction took place for Phase I mostly from 1974to 1977 and for Phase It from 1977-1979. By the end of 1979 the first sectionof the gas transmission pipeline from Horgos and Mokrin '-" HtRjnica and thepipeline from Batajnica to Zvornik were completed and in operation.
3.04 During 1979, as a consequence of the 1974 constitutional changes andsubsequent new Law on Associated Labour, economic enterprises were de-centralized and responsibilities were regionalized. The Federal Republic andProvincial authorities decided to entrust the construction of the Batajnica-Paracin pipeline to a Serbian based enterprise, Butangas. In view of theexplanations given by a Yugoslav delegation visiting Washington in February1980, the Bank agreed to amend the loan agreement, after reappraising the newentity (Butangas) to ascertain its ability to carry out the remaining workunder the project. the second amending agreement was concluded on January 22,1981.
3.05 Phase 1 of the project was, therefore, divided into the following twopartes
- Part "A", to be carried out by NGU and designed to expand the naturalgas transmission and distribution facilities to transport anadditional 29Q0 million NMI of gas per year in eastern Yugoslavia, ofwhich 1700 NMJ per year to Serbia and 320 million NMJ per year toBosnia-Herzegovina and the remainder within Vojvodina (this is an in-crease as compared with the original scope, para 2.10); and
- Part "B", to be carried out by Butangas and consisting of gastransmission and distribution facilities to supply 1700 million Nof gas in Serbia to 29 industrial consumers in 13 cities locatedalong the pipeline.
3.06 The reorganization of the Borrower/s, reappraisal and negotiati6nswith the Bank further delayed project execution, especially in Serbia, and theclosing date was again revised (to June 1983). However, the Borrowers had

stopped the processing of project procurement until the negotiations with theBank of the second amendment were concluded. The validity of bids for theSCADA system expired and this equipment had to be retendered, which causedmore delays. The closing date was, therefore, further extended to June 30,1985, but this time to cover remaining payments under the contracts for theSCADA system only.
Project Cost
3.07 Estimated and actual costs for the project are as follows:
Local Fore gn TotalProject Phase Ap,pr 4L-u Actual Pr,[ Appr. Actual
-. (Uis$ millin
Phase Is Part A 66.8 76*3 37.0 37.0 103.8 113.3Part B 65.8 45.8 22.4 22.4 88.1 68.2
Total Phase I 132.6 122.1 59.4 59.4 191.9 181.5
Phase It 13.2 6.7 11.0 10.9 24.2 17.6
TOTAL 145.8 128.8 70. 70.3 216.1 199.1
1/ The 1980 reappraisal of the project in which Phase I was divided intoparts A and B (paras 3.01 and 3.05). The original cost estimate of 1973(local US$71.0 million and foreign US$59.4 million) is not comparable withactual costs, due to the changes in project scope.
3.08 Mainly due to the threefold increase in the price of steel, theactual cost of the project exceeded tha original cost estimate of 1973 by over50%, despite the reduction in project scope. Compared with the revised costestimate of 1980, however, there was a cost underrun of about 8Z. The foreigncosts of the project turned out as estimated in 1980 and the cost underrunsoccurred in the local costs. However, the lower than expected US$ equivalentof local costs was due to the sharp devaluation of the Din - from 17 Din/US$in 1974 to 42 Din/US$ in 1981 and 280 Din/US$ in 1985S. Most of the localcosts were for salaries and wages, which increased at a much lower rate thanthe Din devaluation. Therefore, although local costs expressed in Din arehigher than appraised, the equivalent in US$ is lower.
3.09 The project underwent a series of changes which delayed itscompletion far beyond appraisal estimate. The main reasons are susmarizedbelow:
(a) the sharp cost increases in 1974/5, especially for steel line pipe,made it necessary to reduce the project scope to keep the projectcost within available financial resources. This delayed projectstart up by about two and a half years;
(b) early in the project, local contractors were not adequately equippedin terms of working crew numbers; this problem was solved late, inthe project;

-9
(c) labour laws and regulations were not sufficiently flexible to copewith the need for longer working hours, shift work and labourmovements from one province to another;
td) procurement of foreign goods was delayed by a complicated localapproval process and retendering (para 3.06), which delayed projectcompletion by about two years;
(e) customer conversion to natural gas was in some instances delayed dueto lack of financing; and
(f) the reorganization of Yugoslav enterprises, including NGU, after theintroduction of the 1974 constitution and 1976 laws on associatedlabour delayed the project execution, especially its Serbian part,. byabout two years.
Performance of Consultants
3.10 The project components requiring technical assistance and consultantscovered the following activities s
(i) Main gas transmission and distribution;
(,1) Gas treating and LPG recovery;
(iLL) Telecommunication 8cada system;
(iv) Project management including construction supervision, lnspectlon andcommissioning; carried out by a local firm..
The consultants' performance was on the whole satiofactory apart from pressuredesign and a few unqualified foreign personnel assigned to supervision offield work. A detailed study was made of the pressure rating design and alower pressure rating was opted for. The recommendation made - and theeventual decision - on this matter was less than adequate, since it restrictedthe potential for increasing pipeline capacity (see also para. 7.07).
IV. OPERATING PERFORMANCE
The Natural Gas Market
4.01 Consumption of natural gas in Yugoslavia increased at an averageannual rate of about 18% between 1975-80, mainly because of increaoedavailability of natural gas and encouragement from Government out of concernfor the balance of payments (50% of Soviet gas imports are paid for withYugoslav goods). Low prices for domestic gas in Croatia and Vojvodina also-stimulated demand. Due to supply constraints, the average anwal consumpttonincrease moderated to about 12Z as from 1981.

- 10 -
4.02 Gas consumption in Vojvodina (NGU) increased from about 780 MMm3 in1975 to about 1,150 MMm3 in 1980, an average annual increase of 8.1%, and in1985 to about 2,200 MMm3, an average annual increase in 1980-85 of nearly14%. In Serbia (Butangas;Energogas), gas consumption increased from nothingin 1980 to about 620 MMm3 in 1985 and is expected to go on increasing at ahigh rate during the coming five years. In Bosnia Herzegovina, SGE consumedabout 525 MMm3 in 1985. Gas consumption for main consumer categories inVojvodina and Serbia in 1985 is given below (1982 figures for Yugoslavia as awhole are given for comparison):
Industry Commerce Power Domestic l/ Total_mm % V M`MmlX X hMmp X Mm3-- -%
NGU, Vojvodina 1,557 70 38 2 535 24 95 4 2,225 100Er.ergogas, Serbia 498 80 126 20 - - - - 624 100
Total Vojvodina/ 2,055 72 164 6 5357i 19 95 3 2,849 3/ 100Serbia (1985)
Yugoslavia (1982) 2,610 72 255 7 450 13 300 8 3,615 100
1/ Mainly heating for housing complexes.2/ A large gas-fired power plant was completed in 1981.S/ Excluding about 525 MMm3 for SGE.
4.03 Despite strong demand, sales of natural gas in Serbia and Vojvodinawas constrained by the delays in completion of the pipelines financed underthe project. Gas demand was strong in Serbia, where only higher pricedimported natural gas is distributed, and the lower price of domestic gas soldin Vojvodina appears to have Increased demand only slightly. NGU expects toincrease gas sales to 2,900 MMm3 in 1990, an annual increase of only 5.5% in1985-90, and Energogas to 1,500 MMm3, an annual increase of over 19%. NGU'sconservative projections of gas sales reflect concerns about domestic andforeign gas supplies and the limited capacity of existing pipelines ratherthan lack of demand. SGE consumption is expected to reach about 850 MMOm in1990.
Safety of Supply
4.04 During peak winter consumption, some consumers, especially in Serbia,have occasionally experienced low gas pressures, mainly due to Russian gasbeing delivered at a below normal pressure. For safety reasons theVojvodina/Serbia gas transmission system should provide for connection to thenational gas grid, giving a back-up system for critical gas consumers to meetemnergency situations. However, at the design of the Vojvodina/Servia gassystem, no alternative gas sources (e.g. recently contracted Algerian gas)were available.
Project's Impact
4.05 The major items of the NGU part of the project were completed in1979-80. This is reflected in the jump in the average annual increase innatural gas consumption in Vojvodina (from 8% before 1980 to 14% after 1980)(see para. 4.02.) No natural gas was distributed in Serbia before the pipe-

- 11 -
line system, financed under the project, was completed. The project thus madea substantial contribution to industrial development by supplying natural gasto consumers in Vojvodina and Serbia which equalled or surpassed original ex-pectations (para 2.10). It has also had a beneficial impact on the quality ofcertain manufactured products, air pollution and rail and road congestion (seeparas. 7.02-7.03).
V. FINANCIAL PERFORMANCE
Background
5.01 At the time of appraisal in 1973, the financial projections for NCUwere based on the assumption that the project construction would be completedby mid-1976. As explained in para 3.03, the NGU part of the pipeline wasactually commissioned in 1979 to supply Vojvodina and Sarajevo, and theButangas/Energogas part for Serbia in 1982. The delay in project execution,change in project scope and reorganization of the Borrower/s, makes it diffi-cult to compare the original financial projections with the outcome in ameaningful way. Local inflation and substantial devaluations of the Dinagainst major currencies (para 3.08) during the long project period furtherdistort comparisons. NGU's financial statements for FY75-84 are thereforecompared with the 1973 SAR estimates upto 1979 and Re-Appraisal estimates asfrom 1980 (Annexes 3.1, 3.2 and 3.3.). Butangas/Energogas' financial state-ments for FY80-84. together with the corresponding 1980 Re-Appraisal esti-mates, are given in Annexes 3.4, 3.5 and 3.6.
5.02 The volumes of gas sold as forecast in the 1973 SAR and 1980 Re-Appraisal and actual volumes, are summarized in Table V (1) below:
Table V (1): Natural Gas Sales (million Nm)
1973 SAR 1/ 1980 Re-appraisal Actual/ReestimateYear NCU ENERGOGAS _NU ENERGOGAS NGU ENERGOGAS
1975 1025 412 - - 780 -
1980 2091 1983 1250 114 1136 -1985 2255 2555 2458 1601 2225 624
1990 2255 2555 4200 2900 2/ 1500 2/
I/ Not comparable with actual volumes due to the 1976 reduction in projectscope for the Serbian (Energogas) part of the project.
2/ Current estimates by NGU/Energogaso Excluding about 850 MMm3 (525 MMm3 in1985) consumed by SGE.
5.03 For the 1973 appraisal it was assumed that the average gas sellingprice would be Din. 0.41 per Nm in real terms as from 1974 and that theavgrage cost for imported gas would be 0.29 per NmJ in real terms and 0.27 perNm per for domestically produced gas. The table below indicates the struc-ture of prices of natural gas in 1974, at the 1980 Re-Appraisal, and in 1985.

- 12 -
Table V (2): Structure of Prices of Natural Gas (i/i~
A. Vojvodna QX 1974 1980 19859agit Slzee Domestic }qpxold Dneotic Imported Dowstic Iorted
Purchase Prie 0.27 0.29 1.30 3.10 16.24 47.32Thnsport _ - 0.48 0.55 2.37 2.37
Sols Price 0.41 0.41 1.78 3.65 18.61 49.69
(Sn oostant prim of 1974 1/l OAll 10.411 10.621 11.271 11.031 (2.741
B. Serbia (Energogas) 1980 1985Supply Point Batajnca' Pancevo Batajnica Pancevo
Purchase Price 3.10 3.10 45.93 45.93Transport In Vojvodina 0.27 0.45 0.52 2.83Transport In Serbia 0.48 0.49 4.43 4.43
Sales Price 3.86 4.04 50.88 52.39
[in constant price of 1974]1± [1.341 (1.401 t2.801 [2.891
/ Using "Producers' Prices Index for Industrial Goods" of InternationalFinancial Statistics (IMF, 1985).
Customers are billed for the actual cost of gas sold to them, whether importedor produced domestically, plus a fee for transportation and operation of thedistribution system. As a result, capital and vperating expenditures arerecovered and the transportation fee provides a margin for profits.
Operating Results
5.04 NGU's and Energogas' flnancial statements and corresponding appraisalestimates are given in Annex 3. However, as indicated in previous paragraphs,it is diffiesilt to compare actual financial performance with 1973 SAR and 1980Re-Appraisal projections because of changes In project scope, high inflation,and frequent devaluations of the Dinar during the project period. Some keyfinancial ratios, however, are given in the table below:
Table V (3: Financial Ratios
Operating Ratio (X) RoR on Net Fix Ass. in Op. (%)-NGU Xnegogas Cu E E, egogas
FY }r. 1l Act. _t Apr.1 I Act. M/ Ap Mt. tA Act. 2
75 88 81 - 8 33 - -80 81 88 9 93 22 25 47 2084 79 91 91 97 NA 2 44 39 11
I/ 1973 SAR values up to 1980 and 1980 Reappraisal values thereafter.7E/ Based on revalued (according to Yugoslav laws) fixed assets.j/ The 1973 SAR provided financial projections upto 1982. The 1980 Reappraisal
did not include forecast 1980-85 Balance Sheets/Funds Flow Statements for NGUo.Therefore, financial rate of return estivates for 19R6 ap S^h ---

- 13 -
The above rate of return is calculated on the average value of net fixed assets inoperation (opening value plus closing value divided by two), which is different fromthe covenanted rate of return concept (see para. 5.09). In Annex 3, rates ofreturns have been calculated also on the covenanted basis (gross fixed assets at endof each month plus opening value divided by 13).
5.05 The differences between appraised and actual ratios are mainly due tothe following factors:
- The Dinar equivalent for imported natural gas costs increasedmore than expected because of high domestic inflation and aneven faster rate of devaluation of the Dinar against majorcurrencies;
- the delay in project execution led to lower than projected gassales during the project period; and,
- substantial revaluation adjustments of fixed assets and exchangelosses were booked by NGU/Energogas in accordance with Yugoslavregulations. This was not foreseen at the appraisal.
5.06 NCU consistently produced a better rate of return on average fixedassets in operation than estimated in 1973. This was partly due to transitcharges on gas destined for Serbia and Bosnia Herzegovina. Furthermore, astandard charge equal to two percent of the value of transited gas was chargedto cover transport losses. Actual gas losses did not exceed 0.5 percent.Snergogas has also shown satisfactory financial results, even if not as goodas projected. Financial ratios are expected to improve and reach projectedlevels by 1990, when gas sales would be near the design capacity of the pipe-line. At the end of FY84, the financial position of both companies wasacceptable with a debt/equity ratio of 57/42 for NGU and 56/44 for Knergogas(appraisal 46/54) and a current ratio of 1.2 for NCU and of 1.0 for Knergogas.
Financial Covenants
5.07 The Bank agreed with NCU in 1973 and with Energogas in 1980 onfinancial objectives to ensure adequate cash generation for the project andthe financial viability of the companies. Covenants were designed to enablethe Borrowers to meet their operating costs, maintain an adequate workingcapital, and finance a reasonable part of their expansion program. The mainfinancial covenants in the Loan Agreement were:
(i) audited financial statements would be furnishAed to the Bank notlater than six months after the close of each fiscal year;
(ii) the Borrower would furnish its investment program to the Bank,for review, at intervals of not less than one year;
(iii) the Borrower would not incur any long-term debt if future debtservice coverage was going to be less than 1.5 times; and
(iv) the Borrower would maintain an annual rate of return of at least- lOZ on the Borrower's average gross value of fixed assetsrin

- 14 -
operation - this average calculated by adding the value at theend of each month to the opening value and dividing by 13.
5.08 Apart from difficulties during-the early years of the project inpresenting NCU's accounts and audit reports in a form acceptable to the Bankand the occasional late submission of audited financial statements, both NGUand Energogas largely complied with the financial covenants. Some comments onNGU's accounting and audit are given below:
a) Up to FY79, NGU was unable to provide the Bank with auditedstatements. Unaudited stat2ments according to Yugoslavaccounting laws, and reclassified statements in line withgenerally accepted accounting principles, however, werefurnished to the Bank. The main reason for NGU's inability tosupply the Bank with audited statements for FYs74-79 was lack oftrained staff, both for accounting and audit. This deficiencywas largely rectified under the project (see paras. 6.06 to6.09);
b) Most financial statements were sent to the Bank by NGU andEnergogas within 6 to 12 months after the end of the fiscalyear. Some statements, however, reached the Bank with more thana year's delay; and
c) Up to FY83, SDK, NGU's external auditors, wfre unable to expressan audit opinion on NGU's balance sheet. For FY84, a qualifiedopinion was given by SDK on both income ztRtement and balancesheet.
5.09 In retrospect, it appears that a simpler definition of "average fixedassets in operation" for rate of return calculations than the one specified inthe Loan Agreement (see paras 5.07) would have been better. As revaluation offixed assets in operation and transfer of work in progress to assets inoperation is done only once a year according to Yugoslav accounting regu-lations, an average based on monthly values understates the rate base.
VI. INSTITUTIONAL PERFORMANCE
Organization and Management
6.01 In 1973, the original Borrower, NGU, was a work organization (seepara. 1.04) operating under a self management agreement with NhaftagasKombinat. NCU consisted of three work units (gas treatment, gas pipelines,and LPG distribution in Serbia) nnd a common services tunit. Operationscovered Serbia and Vojvodina and headquarters were located in Nov Sad,Vojvodina. In early lS79, one of NCU's work units, Butangas (originallyresponsible for LPG distribution), was established as a separate legal entityfor transportation and distribution of both natural gas and LPG in Serbia,with headquarters in Belgrade. The legal documents for the Bank loan wereamended in January 1981, apportioning to Butangas part of the loan used forinstallations in Serbia.
6.02 In June 1984, the work organization Butangas, Belgrade, and the basicorganization of Labour (BOAL) Butangas Promet, Titograd, were merged into one

4~ ~ ~ ~ ~ ~ ~ ~ ~ ~ ~~~~~~+ ,. - *** * .. ".* .-
- 15 -
work organization, Energogas, without BOALs. Apart from some simplificationof administrative and accounting procedures, this was rather a change of namethan a reorganizationt as Energogas took over all Assets, liabilities andother rights and obligntions from BustAngas and ltutangns lPromet,
6.03 Thie mn:iisgemttt of MAJ was larp,ely compcetent at tile !tnrt of theproject. Butangas/lsiicrgogas, htowever, had to develop a completely neworganization and management from its start in 1979. This was done by takingover some managers and staff from NCU and by assistance from Naftagas-Kombinat, e.g. with legal advice, contractingt and procurement. The manage-ment of both NGU and Energogas is now ftilly competent to operate theirrespective gas transmission and distribution systems. The operation of gastransmission and distribution facilities will improve further once the SCADAsystems are fully operational. Organograms indicating NCU and Energogas'current structures, are given in Annex 3.5.
Staff Development
6.04 NGU had Adequate expericncc in gas transmission and distributionbefore the start of the project, as domestic gas development started in1963. Ongoing works taken over by Butangas/Energogas were completed with NCUassistance. A number of experienced NGU staff, who were seconded toButangas/Energogas, stayed after the completion of the Serbian part of thepi'oject and in many cases were given supervisory positions. In this way, newstaff in Butangas/Energogas benefited from the experience of stafi already*. knowledgeable in gas distribution systems.
* 6.05 The technical and engineering training for the operation and main-tenance of new materials and equipment provided under the project has mainlybeen provided by equipment suppliers as prescribed in their contracts with NGUand Butangas/Energogas. On-the-job training and visits to equipment manu-facturers abroad took place with the assistance of consultants and foreignsuppliers. Three technical staff were trained for 6 months at the compressorsmanufacturer in the U.S. during the fabrication of the compressors followed bytwo supervisory staff members for two weeks during the acceptance tests.Similar training of NCU staff toc% place at the SCADA system supplier in Rome.,Italy, where 7 qualified staff members were trained for 10 weeks in theoperation and maintenance of the hardware units. For the telecommunicationsystem, three persons were trained in Denmark for two weeks. Energogastraining was mainly limited to the equipment suppliers of metering and controlstations. SCADA system training was mainly performed in Belgrade by the localsupplier, Iscra, and in llolland by Gas Unie.
6.06 Accounting and adminintrntive systemn werc reviewed by EconionicButreau, Bclgrnle, an.l NCU staff were trained by SAS in cooperAtion withaincounting constaltatits (Cooper And L.ybrands). Purthermore, SDK asninted NCUand Butangan/Energogas in preparing their commercial financial statements forreporting to the Bank. These arrangements provided the necessary transfer ofknow-how to the financial and administrative staff of both gas compani, andresulted in a noticeably improved financial reporting towards the end of theproject period. -
6.07 NCU is currently further consolidating its management information andaccounting systema through the introduction of a central computer and

- 16 -
terminals in its eleven BOALs. This computerized system is expected tosimplify and reduce delays in reporting and in consolidation of financialinformation submitted by each BOAL and to provide the necessary basis for anadequate cost accounting. The implementation of the system will start in1986. Energogas will use part of the SCADA system's computer facilities alsofor administrative purposes.
Management Consultants and Covenants
6.08 Under the 1973 Loan Agreement, NGU was required to employ consultantsto help improve its accounting, management information, and internal auditsystems and also provide SAS staff with necessary training. US$500,000, tocover an estimated 200 man-months of consultancy, was included in the ?rojectcost for this purpose and terms of reference were agreed on between the Bankand NGU.
6.09 These consultants were never appointed and, at the request of NGU,Section 3.03 of the Guarantee Agreement, requiring training of SAS staff, wasdeleted in connection %ith the amendments to the project as of January 1981.In 1982, NCU requested the Bank to relieve it from the covenanted obligation(Loan Agreement Section 3.03(b)) to employ consultants, since other arrange-ments (see para. 6.06) had been made to meet the objectives stated in the TORof 1973. The Bank, after a thorough review of the situation in 1983,considered that NGU had substantially complied with the covenant and did notforcefully insist on full compliance.
VII. Economic Performance
Project Achievements
7.01 At the end of 1985, NGU had a total of 195 gas customers, of which113 were connected under the project in 1979-85 - an increase of nearly 150%due to the project. Energogas had a total of 49 gas customers, all connectedsince 1980 under the project, and this exceeds expectations (Para. 3.05). InVojvodina, about 10% of new customers converted to gas from fuel oil, 40% fromcoal and the remaining 50% were new companies which designed their plants forgas at the outset. In Serbia, about 5% of new customers converted to gas fromLPG, 5% from coal and 90% from fuel oil. A substantial number of newcompanies to be set up in Serbia will also design their plants for gas.
7.02 The project has thus contributed substantially to new industrialdevelopment by providing advantages in cost, quality of production (i.e. inthe glass, refractories and ceramic industry), and security and ease of energysupply. This is of special importance under current Yugoslav policies,which, out of balance of payments considerations (501 of Russian gas is paidfor under barter arrangements), aim at limiting the creation of new companiesusing fuel oil and LPG. Furthermore, companies that plan to start using coalare required to assist in the financing of expanded Yugoslav coal production,which, in addition to high costs of transport and investments needed to complywith strict Yugoslav air pollution standards, makes the use of coal expensive.
7.03 The Naftagas Pipeline Project made the Sarajevo Air Pollution ControlProject possible. According to the Completion Report dated April 19; 1984, onthe Sarajevo project, the substitution of natural gas for other fuels in

- 17 -
Sarajevo reduced the emission of S02 by about 501 between 1973 and 1982 with ameasurable decrease in cardio respiratory diseases and mortality rates. Noefforts have been made to quantify beneficial effects of this kind attribut-able to the Naftagas Pipeline Project in Vojvodina and Serbia but, judgingfrom the Sarajevo experience, the impact should have been substantial,especially in the larger cities.
Economic Rate of Return
7.04 The basis for the economic evaluation of the project is given inAnnex 4. Following basically the same methodology as in the 1980 Reappraisal,the calculations result in the following economic internal rates of return(BIRO) for the projects
Total Pro3ect NGU/VOQ9DINA Bneroogaa/(Serbia)1973 SAR 1980 SAR 1985 PCR 1985 PCR 1985 PCR
EIRR (1) 23 52 29 27 42
1/ Based on a larger proJect and, therefore, not strictly comparable with theother EIRs.
7.05 The difference between the EIRRs as estimated in the 1980 SAR and the1985 PCR is mainly due to the following partly conflicting factors:
- Gas replaced less fuel oil and LPG and more coal than estimatedin 1980 with a slight positive impact on the UIRR, due to thesubstantial production and transportation costs of coal;
- The project benefits from increased gas sales were substantiallydelayed as compared with appraisal schedules, with a negativeimpact on the EIRR;
- The costs of gas and of replaced fuels changed since 1980, with anegative impact on the EIRRS and
- The current EIRR calculations were made in 1985 real terms andinclude estimated customer conversion costs. It is unclear howthese matters were dealt with in the 1980 SAR.
However, the current EIRR estimate of 291 in 1985 real terms for the projectas a whole is satisfactory.
7.06 The higher EIRR (42%) for the Energogas part of the project is mainlydue to: the shorter construction period for Energogas (about 5 years) ascompared with NGU (13 years); Energogas' gas sales starting only two yearsafter first project expenditures being made (NGU seven years); and Energogasgas sales are projected to increase at a faster rate than those of NGU up to1990. Furthermore# NGU incurred capital expenditures on the serbian part ofthe pipeline before the creation of Butangas/Bnergoges in 1979, which has beenconsidered in the EIRR calculation but still may have distorted these calcu-lations in favour of Snergogas. Even so, the EIRE for the NGU part of theproject (27Z) is quite satisfactory.
- 18 -
Least Cost Solution
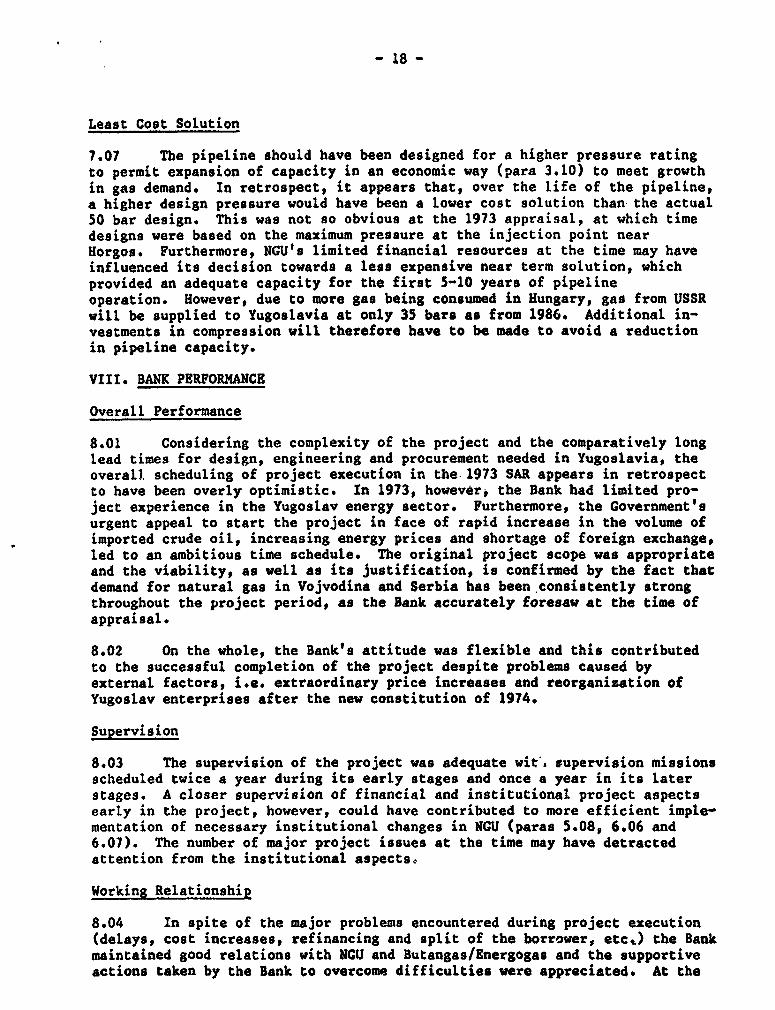
7.07 The pipeline should have been designed for a higher pressure ratingto permit expansion of capacity in an economic way (para 3.10) to meet growthin gas demand. In retrospect, it appears that, over the life of the pipeline,a higher design pressure would have been a lower cost solution than the actual50 bar design. This was not so obvious at the 1973 appraisal, at which timedesigns were based on the maximum pressure at the injection point nearHorgos. Furthermore, NGU's limited financial resources at the time may haveinfluenced its decision towards a less expensive near term solution, whichprovided an adequate capacity for the first 5-10 years of pipelineoperation. However, due to more gas being consumed in Hungary, gas from USSRwill be supplied to Yugoslavia at only 35 bars as from 1986. Additional in-vestments in compression will therefore have to be made to avoid a reductionin pipeline capacity.
VIII. BANK PERFORMANCE
Overall Performance
8.01 Considering the complexity of the project and the comparatively longlead times for design, engineering and procurement needed in Yugoslavia, theoverall scheduling of project execution in the. 1973 SAR appears in retrospectto have been overly optimistic. In 1973, however, the Bank had limited pro-ject experience in the Yugoslav energy sector. Furthermore, the Government'surgent appeal to start the project in face of rapid increase in the volume ofimported crude oil, increasing energy prices and shortage of foreign exchange,led to an ambitious time schedule. The original project scope was appropriateand the viability, as well as its justification, is confirmed by the fact thatdemand for natural gas in Vojvodina and Serbia has been consistently strongthroughout the project period, as the Bank accurately foresaw at the time ofappraisal.
8.02 On the whole, the Bank's attitude was flexible and this contributedto the successful completion of the project despite problems caused byexternal factors, i.e. extraordinary price increases and reorganization ofYugoslav enterprises after the new constitution of 1974.
Supervision
8.03 The supervision of the project was adequate wit. supervision missionsscheduled twice a year during its early stages and once a year in its laterstages. A closer supervision of financial and institutional project aspectsearly in the project, however, could have contributed to more efficient imple-mentation of necessary institutional changes in NGU (paras 5.08, 6.06 and6.07). The number of major project issues at the time may have detractedattention from the institutional aspects,
Working Relationship
8.04 In spite of the major problems encountered during project execution(delays, cost increases, refinancing and split of the borrower, etcc) the Bankmaintained good relations with NCU and Butangas/Energogas and the supportiveactions taken by the Bank to overcome difficulties were appreciated. At the

- 19 -
end of the project period, the Bank's working relationship with NGU/Energogaswas excellent.
Project Outcome
8.05 The Bank's persistent encouragement of the Borrowers and flexibletreatment of major adjustments caused by factors outside the pro-ject and thecommitment of the Borrowers to complete the Project, led to a successful (evenif delayed) completion. Even though the substantial part of conversion tonatural gas was delayed for a few years in Vojvodina and for several years inSerbia, due to difficulties in project execution, the basic infrastructure forutilization of domestic and imported natural gas for the rest of the centuryhas been established. NGU and Energogas are currently looking for new sourcesof gas and plan to increase the capacity of the pipeline system through com-pression and looping to satisfy the strong demAnd for natural gas in Vojvodinaand Serbia.
IX. Conclusions
9.01 The Bank's persistence and flexibility contributed in this case tothe successful completion of a problem affected, but otherwise economicallysound, project. It is unlikely that a different posture would have producedbetter results.
9.02 Some lessons to be learned from this project are summarized below:
- construction programs and disbursement projections for projectsin Yugoslavia should take into account lengthy local approvalprocedures and the preference given to local contractors (out offoreign exchange considerations), which often leads to longerproject execution than indicated by international standards(para. 3.09);
- the pipeline design pressure should be carefully studied underfuture gas projects to ensure long term economic solution. InNCU's case, additional investments in compressor stations willnow have to be made anyhow to avoid a reduction in systemcapacity, as natural gas imported from USSR will be supplied,starting from 1986, at 35 Bars pressure instead of 45 Bars (para.7.07);
- The security of gas supply to critical gas consumers and possiblesafeguards to meet emergency situations should be considered atthe design of gas projects (para. 4.04);
- the definition of "average fixed assets in operation" for rate ofreturn calculations should take into consideration localaccounting procedures (para. 5.09); and
- closer supervision of financial and institutional project aspectsearly in the project may contribute to more efficient implemen-tation of necessary institutional changes (para 8.03).

-20- ANNEX 1
YUGOSLAVIANAFTAGAS PIPELINE PROJECTProject Cost Estimates
PHASE I - Loan 916-YUPart A - NGU
US$ millionAppraisal Estimate Actual -
Local Foreign Total Local Foreign* Total
Materials and Equipment 11.219 34.586 45.805 12.611 34.246 46.857Construction 37.585 - 38.585 41.959 - 41.959Technical Services 2.792 0.606 3.398 12.250 0.914 13.164Other Costs 10.149 0.263 10.412 4.610 0.965 5.575Interest during Construction 5.085 1.555 6.640 4.837 0.885 5.722Subtotal 66.830 37.010 103.840 76.267 37.010 113.277
Part B - Butangas
Material and Equipment 8.447 19.186 27.633 7.121 18.348 25.469Construction 37.401 0.514 37.915 30.023 - 30.023Technical Services 7.707 0.421 8.128 3.561 1.766 5.327Other Costs 7.595 1.973 9.568 2.006 1.980 3.986Interest during Construction 4.603 0.296 4.899 3.127 0.296 3.423Subtotal 65.753 22.390 88.143 45.838 22.390 68.228
Total 132.583 57.400 191.983 122.105 59.400 181.505
* To be revised by late January 1986, as about US$1.0 million may have to be cancelledif not disbursed by then.
Phase II - Loan 1264-YU
Materials 1.960 5.761 7.721 1.113 10.084 11.197Construction 8.249 4.980 13.229 3.711 - 3.711Technical Services 0.738 0.070 0.808 1.086 0.272 1.358Other Costs 1.901 - 1.901 0.412 0.283 0.695Interest during Construction 0.344 0.189 0.533 0.425 0.263 0.688
Total 13.192 11.000 24.19 6o747 10.902 17.649MM=== ==.m mmi .m am i mm m.m

-21-
ANNEX 2Page I of 3
YLUOSLAVIANAFT S PIPLM 7OI (oMn 916-YU)
Schedule of Disbursemwnts (US$'000)
IBRD Fiscal Year Appatsal K-Appralsal Estimate Actuland Qyarter NWt^TIte ?U Energogas Tbtal NGU FAergpgaB Total Actual/Appraisal (%)
1973/74NiN't&r 30, 1973Decenmer 31, 1973 1,320March 31, 1974 6,526June 30,1974 10,755 323 3
1974/75September 30, 1974 18,479 701 4Decenber 31, 1974 26,626 1,135 4March 31, 1975 33,435 6,260 19Jam 30, 1975 39,518 11,219 28
1975/76Septmbr 30, 1975 45,559 30,473 67Deember 31, 1975 51,888 32,393 62March 31, 1976 55,982 34,563 62June 30, 1976 59,4¢0 34,563 58
1976/77Sse r 30, 1976 34,759 59Deemnber 31, 1976 35,036 59March 31, 1977 35,637 60June 30, 1977 36,752 62
1977/78Sptemr 30, 1977 37,058 62Decenber 31, 1977 37,427 63March 31, 1978 37,959 64June 3U, 1978 38,006 64
1978/79September 30, 1978 38,205 64December 31, 1978 38,675 65March 31, 1979 38,736 65June 30, 1979 38,901 65
1979/80September 30, 1979 39,114 66Lecenber 31, 1979 39,330 66March 31, 1980 39,408 66June 30, 1980 39,408 39,531 1Oo
I/ As fran June 30, 1980, Actual/Re-Appraisal

-22- ANNEX 2
Page 2 of 3
SOiME (F DIS3 S (coMiimd)
TIRD Fiscal Year ______a_ _____e Act_l
1980/81SepteMber 30, 1980 40,566 39,539 97December 31, 1930 35,007 11,116 46,123 39,546 86March 31, 1981 35,580 13,804 49,384 33,270 6,283 39,553 8SJune 30, 1981 36,152 16,043 52,195 33,270 6,283 39,553 76
1981/82§Rebr* 30, 1981 36,581 18,282 54,863 33,326 8,163 41,489 76teember 31, 1981 36,867 20,522 57,389 33,326 9,812 43,138 75March 31, 1982 37,010 21,194 58,204 33,346 11,552 44,898 77June 30, 1982 21,865 58,875 33,549 15,977 49,526 84
1982/83Septisber 30. 1982 23,390 59,400 33,580 16,156 49,736 84Lftember 31, 1982 33,5B0 17,742 51,322 86March 31, 1983 33,612 17,744 51,356 86June 30, 1983 33,767 17,748 51,515 87
1983/84Sepbamber 30, 1983 33,871 17,748 51,619 87December 31, 1983 36,306 18,008 54,314 91March 31, 1984 36,306 18,503 54,809 92June 30, 1984 36,306 19,056 55,362 93
1984/85-eSepEeer 30, 1984 36,306 19,421 55,727 94Decamber 31, 1984 36,557 19,872 56,429 95March 31, 1985 36,557 19,981 '5,538 95June 30, 1985 36,822 20,765 57,587 97
1985/86sepeEbr 30, 1985 36,822 20,846 57,668 97December 31, 1985 36,686 20,987 57,673 97March 31, 1986 38,896 21,388 1/ 58,2841/ 98
Closing Date: 06/30/85
DIHDDecember 1985
1/ Ihe Borrowers mere advised on May 7, 1986, that US$103,770 w,ld be canceUed =nterLoan 916-0-YU (NLU) and US$1,012,580 under Loan 916-1-YU (FxArgcgas).

-23- ANNEX 2Page 3 or 3
YUGOSLAVIA
NAFTAGAS PIPELINE PROJECT (LOAN 1264-2-YU)
SCHEDULE OF DISBURSEMENTS (US$ '000)
IBRD FISCAL YEAR-AND_QUARTER APPRAISAL/ESTIMATE ACTUAL ACTUAL/APPRAISAL (%)
1976/77September 30, 1976 - -December 31, 1976 100 -March 31, 1977 400 -June 30, 1977 3,500 -
1977/78September 30, 1977 5,000 -December 31, 1977 7,000 -March 31, 1978 8,000 -June 30, 1978 9,000 -
1978/79September 30, 1978 10,000 -December 31, 1978 10,500 400 4March 31, 1979 10,800 2,730 25June 30, 1979 11,000 4,190 38
1979/80September 30, 1979 5,320 48December 31, 1979 8,370 76March 31, 1980 9,370 85June 30, 1980 9,850 90
1980/81September 30, 1980 10,010 91December 31, 1980 10,010 91March 31, 1981 10,010 91June 30, 1981 10,010 91
1981/82September 30, 1981 10,010 91December 31, 1981 10,010 91March 31, 1982 10,110 92June 30, 1982 10,902 - 92o
1/ US$97,740.13 ha8 been cancelled
Closing Date - 06/30/82IBRD December 1985

* Yowl l04±q kcu6SW 31 2975 1976 2977 1978 1979 2900 198 29218 2984 186~A£u1" Actedl AWsoria ktol AWrasa1 ktual 1Wa,uI Attual Owaisal Octual *6poealn kctva Oaa5W. #paisa1 Acted 8i9. 109t8£31 IdtaI Oao.41 Octia hawO.a/ ktuaI bA9.at ktta
atwral On (loca1 646.0 ML9. 895.2 996. ;.I0. I35.6 1602.0 3552.0 2606.5 3506. 358.4 5540.1 555. 9690.2 556.9lateral o Sat Iwt) 555. 312.0 2M.24 3102.0 2733. 6099.5 1496.5 1744.0 1406.5 Z%29.0 2496.5
Satwal Sut Total 589.6 646.0 861.4 679. £5137.9 09952 1419.0 996.7 £551.8 2565.0 1675.9 4049.0 4594.0 £719.5 6064.9 554.4 £772.4 2049.5 4799.9 £710. 1 42.3 2327.2 50254
LPG £15.0 292.9 279.5 55.6 295.5 504.8 292.1 507.1 111.4 27.2 £94.6 625.0 248.3 206.0 645.0 552.1 2019. 2061.9 579.7 £514.5 452.5 2130.9 552.* 7ito £aeF 515,1 250.0 445.9 W6.0 564.5 458.0 591.9 674.6 652.
010w tmsn, 30.5 47.0 41.0 49.4 45.9 55.0 47.2 47.1 51.6 200.7 53.2 26.0 95.6 54.6 £21.0 94.7 56.0 58.6 95.9 449.7 95.2 6WA. 92.7
TOWa Wran£g bIn., 75.9 684.9 140.7 IM10. 1259.5 123U.0 1658.5 15.9 2765.0 2916.6 9181.6, 483.0 545.01 1980.9 7558.0 6211. 284.S 1229.2 350.0 2623.1 599.9 55050. 6301.5
* at'rl So~ (local) 588.3 443.0 56.5 484.7 621.0 005. 621.0 678.2 621.0 02.5 622.0 956.0 1192,9 621.0 2941.0 120. 621,0 588.0 2459.7 4640.8 230.6 95986 2015.aWard USa ti90Wt' 50 3567 416.4 264.0 514.8 7175.0 24684 54".I 2665. 2575.3 586.7 504.2 1296.2 t4075.4 12462 1567 1296.2
lateral 6a, Ttal SB.3 443.0 567.3 480.7 87,9.1 605.1 957.7 6782 2057.4 2400.0 £.0 0331.0 0 5661,5 2170.3 5606,0 4535.0 1207.7 "59.I 3755.9 £5556.2 5816.8 27995.5 3942.5
LPG.7 56.1 157.9 92.4 275.0 91.9 150.8 91.1 2M6. 75.2 15.2 70.5 49L.0 57,4 95.5 35.0 144.0 91.2 326.0 154.1 £210O.5 170.5 2797.9 215.4
Total pvct.au 444.4 30.9 659.? 645. 971.0 761.9 1O4495 924.5 1212.5 O 1892 2206. 5602.0 57287 2255.6 6,129.0 4459.8 1298.9 0909.1 3090.0 16796,5 2987.1 29952 4154.7
8UA£tinaKO 60.9 .4.7 75.4 57.1 82.9 48.3 84.5 27.7 10.2 46.2 91.6 55.0 30.1 97.1 22.0 39.1 202.0 26.1 39.2 54.4 30.2 91.6 39.2I 2.60w Cost 05.1 82.6 56. 87.6 62.0 £17.8 67.5 144.2 n2.7 162.9 78.7 15O. 221.6 95.6 200.0 122.5 95.5 265.2 125.5 369.0 1220.0 598.4 .256
*loltaga Cair Swoica 4.6 5.t122.2 5.4 6.2 5.7 28.7 5.0 26.8 6.0 55.0 06.6 6.2 65.0 67.1 6.5 70.0 75.6 96.1 77.5 £51.7 831.5Sai Cheep I Camanar 1. 1. 3.9 1.6 6.7 4.5 6.5 5.7 6.3 19.0 6.3 7.0 37.3 6.0 8,0 55.8 5.8 12.2 60.4 24.2 22.0 58. 66.Inwasa 25.4 4.0 52.6 5.2 30.1 5.7 28.7 6.5 27.2 12.7 25.4 12.0 52.2 26.0 15.0 52.6 24.1 22.2 52.6 56.9 52.6 42.0 72.6816w oerat,a9 Cust 9.2 60.9 £1.6 42.1 11.4 £05.5 22.2 101.5 12.5 97,1 15.5 12.0 275.2 14.0 M9.0 207.4 14.7 567.3 217.0 346. 254.5 249.4 257.2OWi9ra£ttas £?,xd Agasta 62.2 55.1 1M? 62.7 151.0 55. 1552 69.5 255.6 23.2 154.7 255.0 272.8 140.0 209.0 102.7 240.5 595. I02.7 492.6 085.7 17768 285.7
*total 46w.t£q Cost 650.2 79.3 97., "22. 2391.5 1103.! 158.8 12681.9 2450.6 2592.6 2562.1 4259.0 4365. £630. 6955. 5245.8 2495. 11653.2 4621.7 2820.2 4740.5 5256.4 49951 I
WMInt2 £538 m5. 018.6 112.6 161.1 230.0 229.9 270.5 202.0 5464 524.0 556. 50.0 751.4 55.4 645.0 1065. 562. 122.0 226.5 202.9 229.6 S24L4 15502
28135 ImI 0.6 2.5 2.8 15.0 2.5 £2.0 1. 16. 2.1 26.4 2.7 1.2 Lo 2.7 0.7 8?.1 5.9 287.3 5.4 413.1 7.
ST 36720 UM 86.3 187.6 114.2 261.2 259.8 244.9 272.0 294.0 30.7 540.0 357.6 625.0 734.2 551.6 692.0 1068.0 365.2 1312.1 1220.2 230.2 1255.0 370.5 2365.
18253s? 9*1015 7.1 12.9 46. LO. 246.2 52.B 142.5 62.4 255.4 70.2 13.7 125. 97.3 220.8 260.0 935. 112.6 132.6 88.9 645. 79.0 922.4 70.5Tan0 I DUo2UwTI 20.0 50.0 28.6 31.8 25.6 59.8 29.5 46. 56.7 11L0 47.8 51.0 202.6 37,4 92.0 147.9 39.1 160.4 166.2 262.3 270.5 412 185.8
i UT 98997T 59.2 145.7 48 t 28.5 499 5.54 140.0 185.3 255.4 215.9 181.2 49.4 554.2 2153.4 359,0 0266 212.5 820.2 9%5. 1252.7 1066. 2569.8 2111.2
Cut±agasc khm, Fasd 0.4 5.2 0.6 4.9 2.4 6i.9 2.8 20.5 0.2 11.6 2.5 25.0 22.9 2.81 3,0 35.2 5.0 50.5 37.5 18O.0 581 £86. 4.1.
Ownso FasdWIso1ct16 7.4 15.8 9.8 9.2 11.. 27.2 22.8 7.9 22.7 18.9 me. 41.0 24.3 11.7 45.0 24.4 12.8 80.5 24.6 92.4 20.7 215.9 25.2
* 8LA6 5om i w 1.4 £20.0 50.3 97.2 57.5 218.3 86.4 146.9 221.5 185.4 264.0 375.0 4817.0 278.9 230L 76.0 2967 695. 905.2 1452.9 942.7 286.6 2065.
IFYsoiEtqn3 52 12.6 17.6 20.7 4.7 0. 22.1 21.1 25.8 04.2 8Fs 5a4t.8as 17.4 42.1 8.0 69.1 27. 65,* 64.4 70.2 10.2 8.7 93.5
w iDc ana 00889 51.4 220.8 W83 97.2 56,9 828.5 31.7 146.9 45. 285.4 75.8 375.0 44.0 90.7 21.0 695.5 205.4 693.5 09.5 145.9 86.8 206.6 935.6
2) a sAwap Bros Raw0 km"4 LO:5 18.12 m 20 2? 9 £2.48 24.22 22.0 25.52 24.3 17.58; 14.2? 24.5t 14.4? 19.32 LL8 25.12 8L8 24.9? 8.82) as Ouwap . 960 l sets La6 60 55.63 22.5? 52.23 24.01 60.4? 17.91 24.8? 22.45 25.3 25.2? 25.0?. 25.4? 30.25 L.6 39.48 LL8 4422 LL8
7 57 as hfOaOtoas of Caassom 7.0? 29.6? to.2 25.3L 11.4? 26.8 12.8?1 22.7 14,31 19.58 24.4 126.40 14.4? 22.91 LL6 2.1? L.0 51.11 8.8
I ~Wat2g Sat2o 88.4 81.00 o9.6" 85It "St.11 0. 2.3 -5771 02.8 a26 85.1 81.421 97.3 0.5 90.3 812.2 90.41 79.21 90.0 9.2?t 91.0? 78.43
1/ h't2oo1a - kfwrd Mitt is aiKuIW
I wcm IN,01160w 198

WM m soo r
I .S bt8aw I t S *976 197 7n 1978 2 1tsw8 t kw *t82 25as 1S98 toot 4enW.t kt Wad kW Wds t kW lie kW WtsI kts 'tt 011 tts ts a t 0 W t s
fIt" Ft,s _ b 9.2 8. 2 St7.5 4.2 29.5 * 3 99t S2. 2. 295. 202.7 5907.0 317.?5 317.1 9.0 9. t.LIM Ikut*t 23.? =.8 3A.4 49.5 OL2 . 617.4 760. 5.0 9. 7 2w60 W0. ML. UW2 2A. 41.0 7n o
I Sr;t _ts 2I3s. 46.2 1S5. 4IL?7 M. 599.3 177.5 5. 1.e 3.0 te 311.0 1492. 5273 150.9 io lI. 0I Wtb hop MU 0.4 32.4 181.2 3A0 24T.7 29. 104.0 227.6 13 270.5 395. t07 38. 4e 3.0 43.0 83.8
L tOW, I".A tt 442 74.6 . 3. 6.u2 44.0 1.6 711.0 4.5 13.0 1 213L0 tsse SW7.0 1 491. 90 t1t174.0h tr 4.2 5 4.a *0. 6.2 M1.e 0. 40 9.2 mo *t.l 28 14.5 1.0 17.5 n0 8.0 t
Mtell t5a1 24L4 420.0 39Lt 43.L 31.S *8. 459. 92.0 514.1 .0 5*.5 a. e.0 4O 23. 740 1476Lo 5
I - - -- --a -- - --- -uw ZO nk se 2W.9 25z 2W7.8 2PL 2WR.0 IL s fte SUU .e 2^52e e22ILev 2ALe
I Lag T. am 14SLt %S tSi.! 2109.5 151S.7 .0 1*471.4 51.0 23t.5 2272.0 .279.1 3.0 ltsl 4140 210.9 s9 6.9 12.i ad.wcoopwtut
I* Ptt? 2r 9* 10. Pt7.8 1".7 15t1 t . 17.6 1310 119 2t.0 1".4 3L. 130.9 530 15. 30e 11730 *261.0
S ft* .ad t299.0 23o. 3.# 1. *2.0 *2*7.0 3l. 31.I Uiltim SI
* t 6 312.8 15. *7.9 30. 397.8 33. 20.0 5tea0§ 0. L. 267. 48. 2 .O 0 2462 11L8 38 231.0
bU4dtv MO&/ 4719 2 *40 M 1 5WV 545U Q 4utsrsrs
'1 w e,b! Im e, &at. 11t _Iuw Me, &09, no 11*rl * of b ti stu t*'u 21 Mat v.66 _ m e Fog , NU*40 1a1d

winP2744t POW,
two 4 *441 Im4 t 1975 I17 4977 491 4919 4904 1184dm tu 118 11 1980 491-18Sm7 44r14a4 4.48. 4094.1i Octa 409461i kWss Oppalie ki-i 40w840 SIsa 'wirll, ko'ta 4041.1Sil 0rll 4. 40galu4 kWta 401 4 Stul Octa
* ItwaId u
* 4W11449 twIts 5. WA7. 144.4 141.1 239.0 204.9 27.0 294.4 30.7 340.0 25. 2. 140.6 601.4 22.2 43135.I 2288. 374. 939 4ma4446 44 3. 35.1 SU.?7 42.7 424.4 315. 413.2 44.5 425. 420. 434.7 23.4404 244445 26443647. 4.
sok4.4a 44.5 in.? 240.8 223.8 VIA. 214.3 445.2 25.5I 4441.2 44. 9. 3 861. 49. 10 1.7 4697.2 2719.4 51111.1 ni:.?
* 74431491 24~~ ~ ~ ~~~.8 25.2 L 14.4 28 & .4 IL 94.4 44.4 4 S. 21. 424. 132.6 3M6. 445. 247. 36.44 C"tutau ms tAjcI . . 0.0 0., 0.0 4.4 4.0 4.0o.
£a44495n And 7. M#. 9.8 49.2 J1.4 V7. 42.8 27.9 42.7 48.9 43.8 44.0 1. 344. 626. 4.- Oan""Comm?pd MO. 28. 154 34.0 23.8 39. 29. 44. I6.7 5. 47.0 52.0 27.4 92.8 3L4 4404 J 443.3 4.214.9kmtamo s 0.4 5.4 0.6 4.9 1.4 64L 4.4 40.4 4.2 41.6 2.2 2.0 2.O 254 LO4 U35 01.4 486. 43324m.. SW.. 84040t 9.4 4. 211.4 LO5 W.0 44.4 249.0 44.9 4484. 24. 57.0 21.0 764.0 25.4 1391.4 2931. 534. S449.4IwO. to whatt C*tul 23 25 2 25. 34 .2 -27218 20. -43.0 24.? 32.4 23.9 .3344 44.4 153. 44.5 48.4 4440.4 644.0 .111LO"it.00 4l6trifthm"Ide ft" 0.8 0.0 0.0 .4. VA. 0.0 57 0.0 76.4 4.0 49.6 0.4 3.2 4.0 942 0.4 0.0 0.0 0.0
ft-t4a4 95A4 42. 44. 244.4 145. 45. 44.9 279.4 299.6 461.6 62.0 6137.0 445.0 314.4 421.9 2715. ll044 7425. 354
* 0..4t. 16.4~~~~~SIL 45.9 418.4 47.2 5.6 28L.5 4. 35.4 44.7 .4135 39.9 1147. 41. 8. 42. 435 266.44.
I TOW4* 6*44 tuoAumt .IA 72.4 ML.8 212.9 244 34.0 7.9 454. 49.9 671.4 94.4 427.4 4. 0424.4 t4.4 231 2614 44.0 42873.44* =0zu1 blow Slt V/ 7 49. 744. 2045.9 283.4 43472 99744
I ta-Ogal 994.6~~~~I" 72. 214. 32I9 20.4.4 4. 7.9 .6.4 19.9 87.0 1 40 2. .4 414. 44.4 311.4 .6.6 2335
I Imq40 W3.51 -.4. 444.4 40.2 -3.2 402.5 -3.4 34.6, -24.4 283. 5.4 # *44f..2 284.4 -4.4 SIMI. 644.1 401.4 Om.,.
I 94=40 Up
4.rmse is LTJ*4 7.6 9595 377 A3. 425.7 3.1 42.3 28. -440. 25. 43.0 M8. 426.4 29. 69. 29.7 467.0 on. 49449.?
* M-444a4 ~~~~~~9.3. 37.7 221. 423. W. 223.3 284 -14L0 28.5 11m4 28.6 446. 29.3 449".4 97 17. 25439449.
bpta 456061. -06 3LO 4282 87.4 5. 79.4 9.4 54. -4IL6 SU -445. -2. 429.0 40.5 .44. 4445 7 -45A. 134284.~~tt41w -144 -3.3 78.9 54,7 410.3 43.4 464.2 32.9~~~~~~W -045. 259.2 .147.4 214.7 .440.4 344.2 400.4 440.7 -210.7 -296. Nu
Mt boIkm4*W.pM4 S/ 5.4 18.I 3i 28.4 2.7 5.7 4.7 Li7 4.4 6.7 2.4 4.92. 1021 242548
42 #/bus F.L(414- Om F.64t-1241 P.9.t14-5.L.94t-41V9 3/la .. bUlaim b 56.4 W to Is 4 f0m4y184W p2m On m is
Src. aid4540. is O. m Ippo. dwmis4 km Idotiut4/ wn ism ro kMU b 4 Im1 5 W/ lwi k4qsULO O LaiPNA~,* 564.b 4a dbd'f9sduI io4 448910 W f$ts ifMU
- al 585 rosta I* ba 9W4, 54Mw M3

g~ ~ ~~~~~~~~~~~~~~~~~~~M 3.4t; WiT PIMI PROJECT -27- £N1EX3.4
;OBAS (8uTMWN)
AFPRISL AND ACTAl. IKNIE STATEIElNT
(1mB NISIlloS I
ers Ending Deceewr 3St 1980 1981 1982 1983 194 1985Appraisal kctual Appraisal ktul Appraisal ctual Appraisal ctual Apaial Actual Appraisal ctual1 OERAMTIAB REVES
,__ Sal___"lost
I atural BSA (Inail 58.8 112.2 98.1 122.0 147.1 129.3 142.7 J36.7 229.7 146.4Natural Ba fieportl 190.9 1078.1 148.1 2942.6 1469.9 4744.2 3946.2 5086.6 12957.6 5954.7Natural Ba Total 249.7 0.0 1190.3 846.2 3064.6 1617.0 4873.5 4088.9 5223.3 13187.3 6101.1LPB 1026.7 1056.5 1109.1 1629.0 1233.5 2048.3 1312.6 4161.9 1471.9 5451.4 1602.7Tollisn FeOttwr Ren 172.6 194.7 205.8 206.0 224.4 380.7 210.7 422.0 328.S 583.2 247.0Total pratinsRevene 1449.0 1251.2 2505.2 2681.2 4522.5 4046.0 6396.8 862.8 6923.1 19221.9 7950.8
I D~UAt1U COSTS
PurchasuIaturl BGa (local! 47.1 89.9 88.3 97.7 131.9 103.6 123.9 109.4 179.7 117.3atual gas (iort) 167.9 946.2 708.6 2577.5 1390.5 4153.7 364.3 4453.3 11930.5 5212.8Natural Sa Total 215.0 0.0 1036.1 796.9 2675.2 1522.4 4257.3 3770.2 4562.7 12110.2 5330.1LPG 888.3 953.0 949.6 1561.7 1049.0 1918.6 1103.9 3948.3 1235.1 5166.3 1339.0other Purchass 10.3 s.5 12.5 14.4 14.8 51.4 17.8 48.1 20.4 63.0 23.9
Totl Pura 1113.6 962.5 M9.2 2373.0 3739.0 3492.4 5379.0 766.6 5818.2 17339.5 6693.0Neintenanci 9.9 11.1 14.2 12.9 26.8 9.6 32.7 50.9 33.3 80.5 33.0la.r coat 77.0 80.8 88.4 81.4 101.4 108.3 105.7 145.3 110.7 224.3 112.4Naftaga Caa Services 0.4 1.4 0.4 4.1 0.4 10.6 0.5 24.4 0.5 54.8 0.5Ant Chag" & Chosladss 3.1 0.9 4.1 1.6 3.6 10.8 5.9 6.6 6.0 9.5 6.4Inurnce 5.5 2.6 8.2 5.1 14.9 7.2 I1.6 9.4 18. 13.7 18.6Other Operating Cost 87.7 82.2 94.9 55.9 105.4 89.9 117.6 343.9 131.9 751.2 138.3Depreclatio (Fixed Assts) 18.0 16.6 45.3 21.6 122.7 59.5 158.8 69.2 159.6 213.9 160.0Total Operating Cot 1315.2 1158.1 2253.7 2555.6 4114.2 3788.3 5818.8 8436.3 6278.8 18689.4 7163.0
ERTIII NtO 133.8 93.1 251.5 125.6 408.3 257.7 578.0 236.5 644.9 532.5 787.8
INTEREST iNtN 0.2 2.5 0.5 23.7 1.1 90.3 1.9 357.8 2.7 729.9 3.7
N TERA MTIAB smuB 134.0 95.6 252.0 149.2 409.4 348.0 579.9 594.3 647.6 1262.4 791.5
REST PATNENTS 11.5 2.3 50.9 17.0 103.4 65.5 139.4 245.7 123.0 693.1 105.4
111 a CO6ITUTI1S 17.3 37.5 45.7 40.7 62.4 55.1 78.6 93.6 92.5 1365 118.8
'NEt PFIT 105.2 45.9 155.4 91.5 243.6 227.4 361.9 255.0 432.1 432.8 567.3
; AWIATION Of MET PIFITCmtiangny Resev Fund 5.6 5.8 9.0 6.5 13.4 12.7 18.0 31.1 19.7 61.5 23.5At ning fund/Collective 15.4 6.8 18.0 6.6 20. 39.2 22.0 59.4 22.1 86.3 22.SCeoutian Fund
'UMAE TO 6EEAl. RESEM 84.2 33.3 128.4 78.4 209.9 I75.5 321.9 164.5 390.3 285.0 521.3
fiuntial Rats of Saturn (8.T.)1) no Averep Bross fixed Asts 34.42 15.41 23.02 16.0t 21.81 21.92 26.9? 13.21 29.81 9.61 36.2221 an Avere bt Fixed Assts 47.11 20.4t 26.32 22.02 24.n 30.01 32.32 19.31 39.22 11.82 s2.n3) Oen 0nitinn of Coveants 56.92 16.12 38.61 19.01 24.fn 26.72 27.02 15.92 29.82 20.0S 36.32
o* rativ Ratio 9.82 92.6S 90.01 95.32 91.02 93.6U 91.02 97.3S 90.7 97.22 90.1t
'Souruce EERBM4A, Octoer 1985

VU60SLAVIA
WAfTPAS PIPEINE PRECT
I EIIER686AS IBAUTASi
APPRAISAL MMID ACTUAL ALMCE SHEEtS
t t D"IRS NILLIONS J
as at Deceeber 31 1990 1981 1982 1983 1984 19B51979 Appraisal Actual Appraisal Actual AWpraisal Actual Appraisal Actul Arisa Atual AWaisal kctual
IASSETS
Fixed ssets 207.1 571.8 637.9 1612.9 927.2 2135.0 1429.0 2163.6 2146.2 2271.1 9938.9 2177.6Less: Depreciation 91.1 114.1 193.1 159.4 241.4 282.1 394.3 440.9 724.1 600.5 1320.2 760.5
Net Assets 11J.0 457.7 454.8 1453.5 65.8 I82.9 1034.7 1722.7 1422.1 1570.6 7615.7 1417.1P tork In Progress 38.1 423.0 307.1 160.2 830.2 19.1 2106.0 3025.9 862.5Loans, Inv. & Deposit 66.4 41.8 83.5 51.2 486.0 61.9 425.9 76.9 521.5 93.0 1091.0 111.2Funds 1/ 40.5 62.7 76.8 89.7 79.1 123.4 137.8 163.4 229.1 205.2 369.6 102.3 1Others 2/ 201.5 926.6 1800.3 1".9
OnIoDrking Capital 55.2 340.3 -62.6 458.6 -167.0 664.7 -65.1 940.6 -312.1 1265.1 -743.B 1719.5 1
I Total 311.2 1325.5 959.6 2213.2 1913.2 2721.9 3840.8 2903.6 5812.9 3133.9 10998.4 349.0
EQUITY MID LIABILITIES
Long Tere Debt 129.8 856.1 404.2 150.5 1062.0 1830.6 2489.1 1650.4 3B86.2 1448.6 5967.0 1246.4exl. carreot ortion
Equity 3/ 181.4 469.4 378.3 641.7 711.2 991.3 1167.4 1253.2 1648.2 1685.3 4612.0 2252.6
J Other Funds and 77.1 139.9 164.3 278.5 419.4Liabilities 4i )~~~~~~~~~~~~~~~~~~~~~~~~
' Total 311.2 1325.5 859.6 2213.2 1913.2 2721.9 3840.6 2903.6 5812.9 3133.9 10998.4 3499.0
Debt/Equity Ratio 42/58 65/35 52/48 71129 60/40 67/33 68/32 57/43 70/30 46/54 56W44 36/64
11 Resere Solidarity, and Collective Consuption FundsI 21 Unrealized Echange Losses3/ Contingency Resrve tousing Fund, Seneral Rewve, and Srbia Srant4/ Reserve Fund, Solidality fund, Collective Consuaption Fund, OtWer Fnds, and Liabilities fw Asociated Assets to Other 01Rs
Soruce: ENtEROSA Data revised by Bank Staff, October 1985

l81 1080.491 - 29 - AN .6i182183 WATA04 PIPEL184 POIGT!
184
189 03184 3313.3.183390191 18 9418192 Vears Ending Decemerv 31 1980 1981 3982 18 9438393 Appalul ktvul Appaloel deteal Ipprlsal ateal Appaisal Actual #ppaisal kctual Appraisal kctul
395 Internal Source"
197 Operating frolus 134.0 95.4 25.0 349.2 409.4 348.0 579.9 594.3 647.6 1262.4 791.51" Oeprec:atleo 1/ 38.0 14.4 45.3 23.6 122.7 19.5 130.8 89.2 159.6 235.9 140.01"9- ---- *--- *- *- - - *-- -
200 Sob-total 312.0 112.2 291.3 310.8 532.1 407.5 738.7 463.1 807.2 1478.3 951.5
202 Less:203 Deot Service204 Principal 22.9 22.9 47.0 219.6 121.7 109.0 185.9 173.5 204.4 304.2 204.205 Interest Paymnts 11.5 12.3 10.9 17.0 103.4 45.5 139.4 245.7 123.0 693.1 105.4206 Houing fund 15.4 4.8 I8.0 i.4 20.3 39.2 22.0 PA. 22.3 86.3 22.5207 Continency Rneseve 5.6 5.8 9.0 8.5 13.4 32.7 18.0 33.1 19.7 6i.5 23.5208 Loans, Inv. & Depoit 10.0 37.1 9. 402.5 30.4 40.1 35.1 91. 16.1 549.4 10.2209 Taxes and C'stributioes 17.3 37.5 45.7 40.7 42. 1.1 78.6 93.4 92.5 136.5 318.8230 --- - - -- - -
211 Sot-Intal 82.1 102.4 200.0 492.9 333.8 221.4 459. 698.8 477.8 1953.2 492.5212 -- -- -- - - -- - -
233 Internal Cash Available for214 Inveteete 69.3 94? 97.3 -52.0 200. 386.I 219.7 -15.3 329. 472. 459.0215----- . - - -- . .
234217 Construction Progam
219 Total Capital Investlmnt 747.4 499. 802.3 812.3 394.1 377.6 9.5 1617.0 7.5 4629.4 4.5220 acc tn kalance Sheet 2/221 Less Ilvalutinn Adjusteet 3/ 250.0. tentative 356.3 34. 47.3 3051.2222 --- -- - - --- -
223 Mo-total 747.4 449.8 80. 57.0 394.5 3430.9 9.5 1089.9 7.5 13578.2 6.5224225 Financing Boe 678.1 440.0 705.0 1179.1 194.2 3224.7 -270.2 1105.2 -323.9 1951.1 -452.226227228 Finance Sys229----230 Increas tn L.T.051t 720.3 297.3 799.3 677.4 384.8 353. 5.7 1570. 2.6 23850 1.9231 fcc to Salanes bnee232 Lens: Unreeluged fxchang 0.0 0.0 201.5 721.6 873.233 Lou"10 4/
235 sub-total 720.3 297.3 799.3 877. 384.8 3334.6 5. 849.0 2.6 3511.9 1.9234237 Surplus (Deficit) 42.2 -142.7 94.3 4303.7 192.6 109.9 2759 -256.2 324.5 439.2 em454.4238 Cuisutive - - 134.5 444. 32.1 -334. 605.0 -590.7 92.5 -1029.9 1383.9239240 Mbt Service Coveape Ratio 51 .3. .2 2.5 0.7 2.4 2.3 2.3 3.6 2.5 1.5 3.1241 14.4 7)242 -243 I/ Froe lac Statements e244 2/ gross FA (t1 - Gross FA4 ft-1) * I.1.. it) - L I.P. t-11245 3/ Incfeas in evaluation Reseve AMde to Egeity daring Yea, plIs Iacas in 4cc. Sept. is246 Balanc Shees sines DWp. charged in lncm Statessits247 4/ Increas in lunelized Eacbsag Losse248 St Accordino to Section 5.05 of loa 1W7. 104.4 -101.9 247.0 81c. in L.C. 431.7249 Wgeemee, Ratio a (net romwee 3.2 2.9 7.3 9.7 Sundry Inoem 7.5250 before depr.ociation II inerest) --- -
251 divided by (det wvice reurement) J21.0 TOM. -44.4 256.7 Tota 439.2252253 Soruce: EMMOS kata revised by Oank Dtaf, Octobe 3985254255

ANNEX 4-30- Page 1 of 3
YUGOSLAVIA
NAFTAGAS PIPELINE PROJECT (LOAN 1264-2YU)
ECONOMIC ANALYSIS
The economic analysis is based on the following assumptions:
(a) Natural gas replaces:
NGU EnermogasFuel Oil 30X 75ZCoal 55Z 101LPG 151 15%
The energy consumption patterns are different in Voividina andSerbia, which is reflected in above table.
(b) Calorific values and value er-ivalents are:
Net. Cal Value Cal. Value Eq.
Natural Gas Nm3 7,727 1.00Fuel Oil kg 8,075 0.95Coal kg 2,760 2.80LPG kg 9,900 0.82
(c) The economic cost of natural gas is equivalent to the currentprice paid for imporied Russian gas during the third quarter of1985: US$145 per Mm . The economic cost (border prices as of AugustFY85) of other fuels are: fuel oil US$135 per ton; coal US$40 perton; and LPG US$250 per ton. Domestic transport costs have beenadded at rates indicated by NGU/Energogas: LPG and fuel oil 8.5c/tonkm and coal lOc/ton km. For LPG, handling, storage and bottlingexpenses have also been added. Resulting costs per ton for fuelsdelivered to consumers are: fuel oil US$180; coal US$92; andLPG US$375. For simplicity, the same average transport distance(520 km) has been used both for NGU and Energogas and the sameeconomic costs have been applied to all years during the expectedlife (up to 1997) of project assets.
(d) Incremental project investment and operating expenditures havebeen estimated based on available accounting and other records. Noncash costs and transfer payments, i.e. depreciation, interest, taxesand duties, have been eliminated. Past expenditures were convertedto US$ according to the average exchange rate for the year theexpenditure was incurred and projections were made in US$. Expendi-tures for customer conversion have been estimated based on a sampleof 22 larger consumers that converted to gas up to 1984. The averageconversion cost for those large consumers was US$850,000, which forthe IRR calculations has been reduced to US$400,000 by eliminatingtaxes and duties etc and by taking into account remaining economiclife of replaced assets.

-31- ~~~~~ANNEX 4-31- Page 2 of 3
(e) The US$ value of annual incremental project costs and benefitsup to 1985 have been adjusted to reflect 1985 years values, accordingto the price deflators used in World Bank work. As from 1986, incre-mental costs and benefits are assumed to be maintained constant in1985 real terms. The volume of incremental gas sold, however, isexpected to continue growing until 1990, according to NGU/Energogasprojections.
(f) NGU's charge4 to SGE for gas transited through Zvornic areassumed to reflect the economic value of this service. (Thesecharges add only about O.5% to the IRR).
2. The economic savings per Mm3 in fuels due to conversion to gas, wereestimated based on the assumptions in l(s), (b) and (c) above:
NGUS ((.30 x .95 x 180k + (.55 x 2.8 x .92) + (.15 x .82 x 375) - 145]- US$ 94.1 per Mm
ENERGOGAS: [(.75 x .95 X 1801 + (.10 x 2.8 x .92) + (.15 x .82 x 315) - 145]US$ 55.2 per Mm

- 32 -
61 Y 0 0SLAvIA ANNEI 46263 N AFtIA6A PIPELINE PR0JECT PtSE 3 OF 364_ ._ . _.... . . . . .. . ...... . . ............. .
65 EC0N10IC ANLV sI 66s ...... ... __..
t7 *-------- *-------------(o.etary Hniti ----- ------------------- . .(onetary Units6 currmnt U$ sillon) 19S5 US oillion 3/169 IhW of Natural aS I/ Savings an Fuels Op.,lnv.& Conv. fip. 21 llt hvings on Futls bt Savings on Fuels70 ................. ......... . ............. _.... . _ ..... . . .....-...---.-...-.. -- _- --
71 Year IJU Energogas Total NUIl Enrgooga Total 11U Energogas Total NIU Eneroggs Total NBU Energoqas Total72 ..- _. - -. ..-.... .. -- - - ---- _. -..... 73 1973 1.9 1.9 -1.9 -1.9 -3.9 -3.974 1914 3.3 3.3 -3.3 -3.3 -5.5 -5.575 1975 5.5 5.5 -5.5 -5.5 -7.9 -7.976 1976 11.9 19.9 -19.9 -16.9 -26.6 -26.677 1977 22.3 3.0 25.3 -22.3 -3.0 -25.3 -29.0 -3.9 -32.9l8 1978 28.5 2.0 30.5 -26.5 -2.0 -30.5 -31.4 -2.2 -33.679 1979 Sl 51 4.8 4.8 33.7 2.0 35.7 -28.9 -2.0 -30.9 -28.6 -2.0 -30.580 1980 136 136 12.8 12.8 10.4 4.1 14.5 2.4 -4.1 -1.7 2.2 -3.7 -1.681 1981 325 III 436 30.6 6.1 36.7 6.8 11.6 20.4 21.8 -5.5 16.3 2X.9 -4.3 15.682 1982 504 194 688 47.4 10.1 97.6 9.0 25.0 34.0 38.4 -14.9 23.5 37.5 -14.5 23.0e3 1983 603 272 875 56.7 15.0 71.7 9.3 12.9 22.2 47.4 2.1 49.5 48.4 2.2 50.584 1984 643 496 1139 60.5 21.3 87.9 5.7 10.7 16.4 54.8 16.7 71.5 57.6 17-5 75.185 1985 1226 024 1850 115.4 34.4 149.8 0.8 11.0 19.9 106.6 23.4 129.9 106.6 23.4 129.986 1986 1320 879 2199 124.2 48.5 112.7 6.3 0.1 I.1 117.9 39.7 157.6 117.9 39.7 157.687 1907 1534 1169 2703 144.4 64.5 200.0 6.0 5.4 12.2 137.6 59.1 196.6 137.6 59.1 196.688 19f8 1743 1358 3106 164.5 74.9 239.4 6.0 5.0 11.0 158.5 69.9 226.4 159.5 69.9 228.489 1989 1812 1452 3264 170.5 00.1 250.6 6.0 5.0 11.0 164.5 75.1 239.6 164.5 75.1 239.690 1990-97 1900 1500 3400 178.8 92.7 261.5 6.0 5.0 11.0 172.8 77.7 250.5 172.8 77.7 250.591 172.8 77.7 250.592 1a,* e eea, e aaaaeaha 172.8 77.7 250.593 N N8U Enorgogas Total * 172.8 77.7 250.594 a -. ___. .-.- _ 1 7 2.8 77.7 250.595 * EIR based on 1985 USS U 26.81 42.42 2..n * 172.0 77.7 250.5.6 * 172.n8 77.7 250.597 .ea.,eeeu,eaa...enauaa.aea...seea.eea 172.0 77.7 250.59899 ----------------- …---- ----
100 Il Increwntal gas ules for the projectlo 21 Operating, investent (in case of NiU both the 916-VI and 1264-YU finaned Pts) and custor conversion expnditures102 3/ Based on the inverted value of gDisbursat Deflators fwr 138l/1U and IFC of 117/85, 1985.1.00.103 As frto 1986, all pritc are expted to be mintained in real terms.1041051061071o0109110111i12113114

-33- ANNEX 5Page 1 of 2
34fi0tt X

YUGOSLAVANAFrAGAS PIPELINE PROJECT
EneWgogas Organzaon Chart
Nakad~~~ Gas 1ddDbtChl
Tram & DW.. _ Da*Xw*
L3,GopwoJom .h I_
-' 1~~~~~~~~~~~~~~~~~~~~~~~UUwvxB:i Lowa 0 aO
VoWad ~ ~ ~ a
00
.a. *~~~~

Attachment A-35- Page 1 of 1
Comments from Energogas
TLX 21848 30.4.86
THE WORLD BANKATN. MR. YUKINORI WATANABEDIRECTOR OF OPERATIONS EVALUATION DEPT.WASHINGTON, D.C. 20433USA
PLEASE BE INFORMED THAT WE HAVE NO OBJECTIONS TO YOUR REPORT. WR THINK THATYOUR REPORT IS MADE CORRECTLY AND SHOWS REAL REALIZATION AND RESULTS OFPROJECT.
REGARDS
Ro 'ENERGOGAS" BEOGRADGENERAL DIRECTORKADISA SAVOVIC
R-YUG-ATCH:MSergo:bwm 05/12/86

-36- Attachment BPage I of 3
Comments from NGU
1 04 1986 TLX NO. 17 15.45H
IBRD - WASHINGTON
ATTN: MR. YUKINORI NATANABE, DIRECTOROPERATIONS EVALUATION DEPARTMENT
RE: PROJECT COMPLETION REPORT ON YUGOSLAVIA-NAPTAGAS PIPELINE PROJECT(LOAN 916-YU)
FURTHER TO ABOVE PCR, WE SUGGEST MAKING THE FOLLOWING AMENDMENTS:
SECTION 3.09: EGY DEPT. NOTE
(B) WE PROPOSE THE FOLLOWING TEXT: PARA. 3.09 (B) OF PCR REVISED."LOCAL CONTRACTORS WERE NOTSUFFICIENTLY EQUIPPED EARLY IN THEPROJECT IN TERMS OF WORKING CREWNUMBER; LATER, HOWEVER, THIS NUMBERPROVED TO BE SUFFICIENT."
(E) SUGGEST DELETING THIS COMMENT ALL PARA. 3.09 (E) OF PCR DELETED.TOGETHeR SINCE WE FEEL IT DOES NOTCORRESPOND TO FACTS.
SECTION 3.10:
SUGGEST ADDING THE FOLLOWING COMMENT: PARA. 3.10 OF PCR REVISED."IN COOPERATION WITH CONSULTANT INCHARGE (MR. RISTORCELLI), A DETAILEDSTUDY WAS MADE OF THE PRESSURE RATINGDESIGN INCLUSIVE OF DISCOUNT CAL-CULATIONS, WHEREUPON A LOWER PRESSURERATING WAS OPTED FOR. OBVIOUSLY, CON-SULTANT'S INSTRUCTIONS WERE INADEQUATE,SINCE THE POSSIBILITIES FOR ENHANCING THEPIPELINE CAPACITY ARE REMARKABLYRESTRICTED.
SECTION 5.06
SUGGEST DELETING THE SECOND SENTENCE PARA 5.06 OF PCR REVISED ANDBEGINNING WITH: "THIS WAS PARTLY DUE ALL REFERENCE TO TRANSIT LOSSESETC" ALL TOGETHER. CHARGES AND LEVEL DELETED.OF ACTUAL TRANSPORT LOSSES DELETED.OUR SUGGESTION IS BASED ON THE FACTTHAT GAS SALES IN SERBIA WERE PROJECTEDIN THE 1973 ESTIMATE SO THAT IT IS NOTNECESSARY TO POINT OUT SEPARATELY THATA BETTER RATE OF RETURN WAS DUE TOTRANSIT CHARGES ON GAS FOR SERBIA AND

-37- Attachment Xratxe z 0? 3
BOSNIA AND HERCEGOVINA, AS ALSO OTHERFACTORS PLACED A ROLE IN THISCONNECTION.
THE TEXT INCLUDES A WRONG STATEMENT THATGAS LOSSES DO NOT EXCEED 0.5 PERCENT.HAVING REVIEWED RELEVANT DOCUMENTATIONWE HAVE FOUND OUT THESE RANGE UP TO1*7 PERCENT WHICH PERCENTAGE SHOULD BEINCORPORATED IN YOUR COMPLETION REPORT.BELOW STATED IS MORE DETAILEDEXPLANATION FOR THIS CORRECTION: DATAGIVEN FOR TRANSPORT LOSSES WASERRONEOUSLY CALCULATED BECAUSE NNB WASNOT REDUCED TO THE SAME UNITS OF MEASURE-MENT AND BECAUSE THE QUANTITY WAS TAKENFOR THE FIRST SIX MONTHS ONLY:
1. IMPORTED GAS WAS MEASURED AT 20 DEG. CAT THE SOVIET/HUNGARIAN AND HUNGARIAN/YUGOSLAV BORDER, WHILE (ACCORDING TOTHEN PREVAILING REGULATIONS INYUGOSLAVIA) IT WAS DELIVERED TOCUSTOMERS AT 0 DEG. C IN 1984 AND15 DEC. C IN 1985.
2. LOCAL NATURAL GAS WAS TAKEN OVER FROMGAS FIELDS MEASURED IN SM3 ANDDELIVERED IN NM3.
3. TRANSPORT LOSSES IN TRANSIT (THROUGHVOJVODINA) WERE NOT STATED.
4. DISTRIBUTION SERVICE TOOK THESEDIFFERENCES INTO ACCOUNT WHENRECEIVING AND DELIVERING GAS, WHILETRANSPORTATICN SERVICE MAINTAINEDRECORDS ONLY VOLUMETRICALLY. BECAUSEOF THIS DIFFERENT APPROACH OF TWOORGANIZATIONS, DATA GIVEN ARE NOTACCURATE.
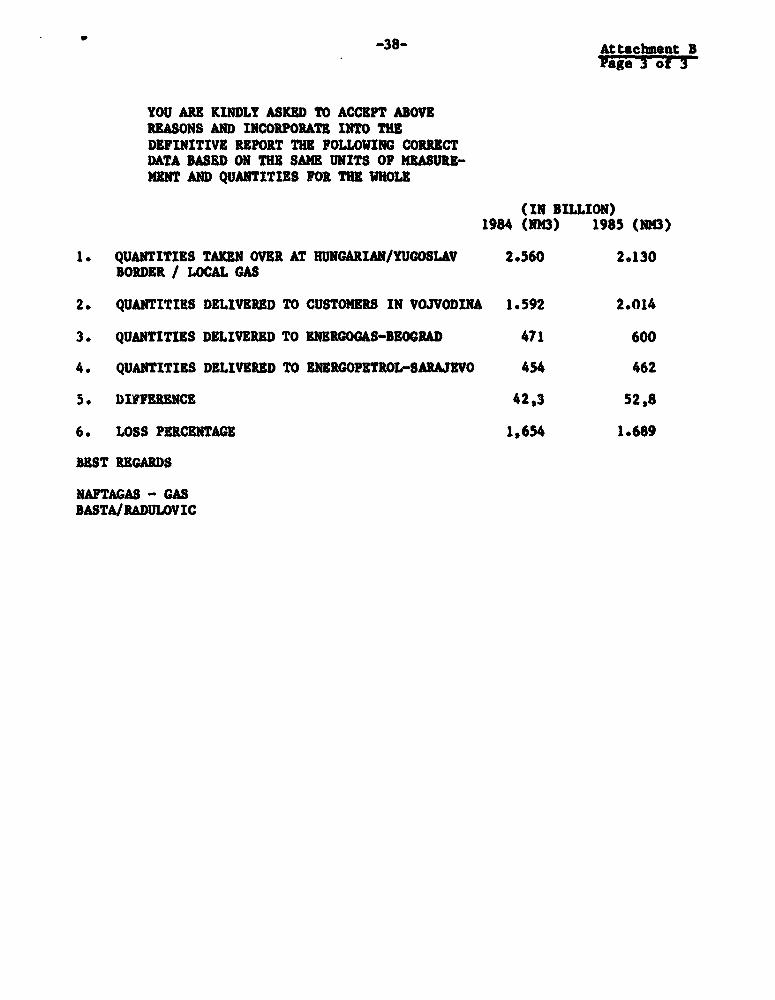
-38- Attachment Brage 3 of 3
YOU ARE KINDLY ASKED TO ACCEPT ABOVEREASONS AND INCORPORATE INTO THEDEFINITIVE REPORT THE FOLLOWING CORRECTDATA BASED ON TUE SAME UNITS OF MEASURE-MENT AND QUANTITIES FOR THE WHOLE
(IN BILLION)1984 (NM3) 1985 (NNB)
1. QUANTITIES TAXEN OVER AT HUNGARIAN/YUGOSLAV 2.560 2.130BORDER / LOCAL GAS
2. QUANTITIES DELIVERED TO CUSTOMERS IN VOJVODINA 1.592 2.014
3. QUANTITIES DELIVERED TO ENERGOGAS-BEOGRAD 471 600
4. QUANTITIES DELIVERED TO ENERGOPETROL-SARAJEVO 454 462
5. DIFFERENCE 42,3 52,8
6. LOSS PERCENTAGE 1,654 1.689
BEST REGARDS
NAPTAGAS - GASBASTA/RADULOVIC

IBRD 10308 (PCR)GAS VMORS F
S- HUNGARY= SEtmD 21 22-
\ H N G A R Y YUGOSLAVIA-460 ._+ tt. i i iGAS TRANSMISSION AND DISTRIBUTION 46
*- i/_s-o Stnk 3> ;> +) SYSTEM OF NAFTAGASGom PROJECT-
-~9 B.," ^ # d , - M Mo ain Pipeline* \; / > Crt to Bon tio A *7Sr Cmi.. Supply Pipeline from Gos Fields to Main Pipeline
d a t A p o t .. \ ( < \ S r b o it r o n M tl o s t l r -t; *E l 7 t z g < 9 G a s T r e a tin g P la n t
EXISTING:
0 z ~~~~~~~~~~~~~~~~~~~~~~Pipelines®. Gas Treating PlantA Gas Fields
NOVI SAD ___ Main Roads
--- Boundaries of Republics & Autonomous Provinces\) -- \-. A t / -* lntemational Boundaries
-45- > ~ tfOtlO% \ > _> /j<; Ot,;,telto1thc ,J - THIS PCR MAP IS BASED ON ISRO 10308,FEBRUARY 1973. PORTIONS OF THE GAS
W _k=5t'c ODISTRIBUTION PIPELINES HAVE BEENp M m ( /Mtok PDATED.
Tul / 07_jI,
S ~~~~~~~~~~~~~~..C .. _
Toile~~~~~~~~~~~~~~~~~~~~~ol
-44.C.
It-
No't1A ~~~~~~No" PCw . .
Lo'Kvo
4U4-

5tL2 t5- 18 21- 24' 2'7-51*~~~~~~~~~~~~~~~~~~~~~~~1
YUGOSLAVIA EXISTING GAS TRANSMISSION LINES___ PROJECTEO GAS TRANSMISSION LINES
GAS TRANSMISSION AND DISTRIBUTION SYSTEM OF NAFTAGAS NAFTAGAS PROJECT GASTRANSMISSION IINES
PROJECTED CONNECTIONS WITH EAST EUROPEAN GAS TRANSMISSION SYSTEMS RIVERS
A z t GASFIELDS
t PRAGUEF * P tNTERNATIONAL SOUNDARIES
) a P 0 L A N DTIS PCR MA-IS BASED ON lORD 10309, FEBRUARY 1973.-s C z > /PORTIONS OF THE GAS DISTRISUTIONt L INES HAVE BEEN
'. H / UPDTEo 100 200 300G E R M A N Y ' C H 0 KILOMETERS
~48. pJ ) j*s. S
',^_. ~~A U S T R I A UDA PET ^*
.'SUEOTiC 'SOKRlN R 0 M A # I A-45 '!
a QSMEID~ERE*Oj* -. BUCHAREST
-v ~ ~ ~ ~ ~ ~~~~zNEGOTIN.
<1 g ARANJELOVAC VAC -pt . ARAJEVO
* KRAlJEVO \ / SEA
s / I~~~~~~~~~~~~~~~~~~~~~~~~~~NIS 8 U L G A R I A /
_~~~~~~~~~~~~ I | J SOFIA o
-42+ ttst 9\t -t )ROMF. .e +;! O/,t .t8X,,9 j o X ; \~~~~~~~~8. . .rW2-
_ 12. is, ledoteee-*r;vsA;.XtS. TIRANE * 231 24- 27- 31 , I I i , __ - I L