Embed Size (px)
Citation preview

Document of
The World Bank
FOR OFFICIAL USE ONLY
Report No. 6405-MAG
STAFF APPRAISAL REPORT
MADAGASCAR
ENERGY I PROJECT
March 31, 1987
Eastern and Southern Africa Projects DepartmentEnergy Division
This dument has a restricted distribution and may be used by recipients only in the performance oftheir official duties. Its contents may not otherwise be disclosed without World Bank authorization.
Pub
lic D
iscl
osur
e A
utho
rized
Pub
lic D
iscl
osur
e A
utho
rized
Pub
lic D
iscl
osur
e A
utho
rized
Pub
lic D
iscl
osur
e A
utho
rized
Pub
lic D
iscl
osur
e A
utho
rized
Pub
lic D
iscl
osur
e A
utho
rized
Pub
lic D
iscl
osur
e A
utho
rized
Pub
lic D
iscl
osur
e A
utho
rized
CURRENCY EQUIVALENTS
Currency Unit - Malagasy Franc (FMG)US$1.0 = FKG 750
(as of July 1, 1986)
WEIGHTS AND MEASURES
1 kilometer (km) 3 0.621 miles1 square kilometer (km2) - 0.386 square miles1 kilovolt (kV) 1,000 volts1 megawatt (MW) - 1,000 kilowatts1 megavolt ampere (MVA) - 1,000 kilovolt amperes1 gigawatt hour (GWh) 1 million kilowatt hours1 ton of oil equivalent (toe) - 10)500,000 kilocalories
bbl = barrel MJ - megajoulecm = centimeter Hm 3 million cubic metersGW - gigawatt m3 - cubic meterhs = hectare MWh - megawatt hour-ie = kilotonnes of oil equiv. od - oven dry:, kWh - kilowatt, kilowatt hour sv = solid volume
LPG 3 liquified petroleum gas t - tonneN = million TCF - trillion cubic feetmcwb = moisture content tpa, tpy - tonnes per annum, per year
wet basis twe = tonnes of wood equivalent
GLOSSARY OF ABBREVIATIONS
BADEA Banque Arabe de Dgveloppement Economique en AfriqueBNI Banque Nationale pour l'IndustrieCCCE Caisse Centrale de Cooperation EconomiqueCIDA Canadian International Development AgencyCIMA Kalagasy Cement ManufacturerDEE Department of Electricity and WaterDEF Department of Fishery and ForestryDGP Planning DirectorateEEK Electricitg et Eau de MadagascarESMAP Energy Sector Management Assistance ProgramFAC Fonds d'Assistance a la CooperationFANALAMANGA Malagasy Industrial Wood Plantation AuthorityFAO Food and Agriculture OrganizationFED Fonds Europeen de DdveloppementGOM Government of MadagascarICS Interconnected System serving Antananarivo RegionJIRAMA Malagasy Electricity and Water CorporationMIEM Ministry of Industry, Energy and MinesMPAEF Ministry of Animal Production, Fisheries and ForestsMPARA Ministry of Agricultural Production and Agrarian ReformOMNIS Military Office for National and Strategic IndustriesPIU, PMU Project Implementation Unit, Project Management UnitPSIP Public Sector Investment ProgramRIP Reference Power Sectot Investment ProgramSEM Soci6tf d'Energie de MadagascarSOLIMA Malagasy Petroleum Refinery CompanySOMAGI Government-owned Data Processing CompanyUNDP United Nations Development ProgramUSAID United States Agency for International DevelopmentZE Major Power Production Zones Outside of ICSZI Small Isolated Power Systems
GOVERNMENT OF MADAGASCAR FISCAL YEAR = CALENDAR YEAR

IVOR OML6 S NYMADAGASCAR
ENERGY I PROJECT
Credit and Project Summary
Borrower: Government of Madagascar
Amount: SDR 19.8 million (US$25 million equivalent)
Beneficiaries: The Malagasy Electricity and Water Corporation (JIRAMA);the Ministries of Industry, Energy and Mines, ofAgricultural Production and Agrarian Reform, and of AnimalProduction, Fisheries and Forests; public enterprisesinvolved in the boiler program; local private charcoalers;and the Industrial Wood Plantation Authority(FANALAMANGA).
Terms: Standard. 1/
Project The project would help the Government strengthen energyObjectives: policy formulation, planning and investment programming,
and institutional development. It would assist theGovernment and JIRAMA in improving the efficiency ofresource utilization in the power subsector bystrengthening financial management, planning and manpowerdevelopment. and by rehabilitating existing deterioratedsubsector infrastructure, improving financial andoperational performance of JIRAMA, and stimulatingcommercial utilization of low cost hydropower resources.It would help the Government develop least-cost plans toexpand the supply of electric power and household energyproducts and by correcting distortions in their prices.Finally, it aims to encourage increased and moreeffectively coordinated flow of resources from donors tothe power and household energy subsectors.
Project The project comprises the implementation of the highestDescription: priority projects, comprised mostly of rehabilitation
works, included in JIRAMA's investment program for theperit,d 1987-1992, technical assistance for power systemplanning and investment programming, and assistance in theestablishment of modern methods and tools for utilityfinancial management and administration. The projectcomprises technical assistance for strengthening energyplanning and management in MIEM, and for major policy andplanning studies on biomass fuels supply and marketing andresource assessment, and household energy demand. Theproject would support initiatives to improve householdcooking efficiency, to develop production of charcoal frompine plantation thinnings and residues; and to test pilot
1/ Onlending terms are 8% Interest rate, repayment periods of 10 to 20years after grace period of 2 to 5 years.
Thi documnt b a estited distdbution and may be used by reipints only in the perfonmceof te officil dutbs Its contonts may not otherwi be diclosed without Wodd Bank authodutlon.

- il -
production of rice husk briquettes. Finally, the projectincludes installation of electrical boilers which woulduse surplus power in the Interconnected System (ICS).
Project Risks: Risks are minimal as the project concentrates onrehabilitating existing generation, transmission anddistribution systems. Also, JIRAMA has a sound record forsafe engineering practice. Benefits arising from theproposed electric boiler program may be reduced due todelays in implementation or reduced demand. The risk thatJIRAMA may be overwhelmed administratively by the volumeof required rehabilitation works is to be minimized by theappointment of consultants to assist with the design,prioritization and implementation of the rehabilitatinprogram. Foreseen improvements In the financial viabilityof JIRAMA may be jeopardized by delay In tariff adjustmentalthought this risk is to be minimized by linking theachievement of financial performance criteria to therelease of the first and second phases of investment.
Madagascar Public Power Stations and Transmission Lines,October 1986, IBRD 18816R

MADAGASCAR
ENERGY I PROJECT
STAFF APPRAISAL REPORT
Table of Contents
Page No.
I. THE ENERGY SECTOR IoOOOoOOOOOooooOOOooOeOOOOOOOOeOOooOOOOOooOoo 1Introcjction 00I00000006009000000000090000000090000000000000000 1Bank Particepation in the Sector .............................. 2Reasons for IDA's Involvement in the Energy Sector ............. 4Energy Resources 4.....0.0.00...........*ooooooooooooooooooo 4Hydropower .. ooooo.ooooooo.ooo.oooooooooooo.oooo 000000000 4Petroleum ............................... 4Coal, Lignite and Peat ................... 5........... 5
Biomass 5FoergDests .d.o...000000*000000*00000000000000000000000000000000 5
Energy Balances and Trends .............0.00.0o.0...0.0..o. 5Energy Supply oooo. .o .ooo.000 **.**0.000..0*.00** 6Electric Power ee6oooooo*oooooo*oooooooooo.oo*00000o000o 6Petroleum and Petroleum Products *7**ooo*#o*** ooooooooo 7Biomass Fuels B000000000****o*****o**oooooo.eo*oooo 8
II. THE POWER SUBSECTOR *000000000 ooooo00ooo0o0oo0oooOooooo000o*o 8Organization 0000000000000*00 eee**.e**0*0**00..*4.0oo0o00 8Sector Fatilities *000000000000-00000000000000000--00000 9Access to Service 10Pattern cf Electricity Consumption 10Power Subsector Planning 11Power Subsector Objectives 12Power Subsector Strategy *oo.ooooooo*o......................... 12Aid Inflow and Coordination in the Sector 12
ITI. THE BORROWER AND THE IMYLEMENTING AGENCIES ...... 13JIRAMA 0 00 13Organization and Management 13Planning 14Engineering and Design ..... 14Operations and Maintenance 14Data Processing 15Billing and Collection 15Accounting and Audit 15
This report is a result of a mission which visited Madagascar betweenJune 2 and June 19, 1986. The mission leader was Ken Newcombe (SeniorEnergy Specialist) and included Juergen Franz (Senior Financial Analyst),C. H. A. Killoran (Power Engineer, Consultant), W. Pacheco (Power Engineer,Consultant), and J. R. Mercier (Energy Planner, Consultant).

Insurance and Taxes ...................................... 15Personnel and Personnel Management 16Training 16Management Information System (MIS) 16Performance Indicators 17
IV. THE MARKET 17Electricity Market 17Historical Market ...... ..oe ........................ 17Demand Forecast for Electricity in the Main ICS 17Generation and Capacity Balances in the Interconnected Systeu 18Demand Forecast for Electricity in the External Zone 19Demand Forecast for Electricity in the Isolated Zone 19
Household Fuels Market , 19Cooking Fuel Supply and Demand: Antananarivo #.............. 20Household Fuels Marketing ....... .20
V. INVESTMENT PROGRAM AND PROJECT 21Power Subsector Investment Program (PSIP) s.................... 21The Program ...................u. 22Works in Progress 22Future Projects 23.......... * 00 23
The Project 23Project Objectives 23Project Preparation 24Project Description 25Power Components 25Energy Components 25Electric Boilers ................... o. 26
Project Costs ... o........ ** 26Project Implementation 27Implementation of Power Components 27Implementation of Energy Components 28Implementation of Boiler Program ............................ 29
Consulting Services .ee*. * . 000.0.......... 30Procurement ................ 30Advance Contracting and Retroactive Financing ...... 32Financing Plan 32Disbursement 33Special Account,; 33Environmental Aspects ....................... 00 34Project Risks 34
VI. FINANCIAL ANALYSIS .... 3 5 ........... 35Introduction 35Financial Position and Past Operating xesults of JIRAMA 35Tariff Structure and Policy ...... 36Financial Restructuring of JIRAMA 38Future Financial Position and Operations of JIRAMA 40Project Phasing and Financial Covenants 41
VII. ECONOMIC JUSTIFICATION 42A. Power Subsector Economic Analysis 42
Average Incremental Cost Analysis 42

Return on Power Subsector Investment .......................... 42Economic Analysis of Volobg Hydropower Plant Rehabilitation ... 43Electric Boller Prograu ....................................... 43Economic Analysto of Antananarivo-Anstirabe Transmission Line . 44Economic Viability of New Household Power Supply Connections .. 44Economic Viability of Rehabilitation Programs ................. 44
B. Housebold and Industrial Energy Production Pilot Projects ..... 45Charcoal ....................... 45Rice Husk Briquettes .... ...................................... 46
VIII. AGREEMENTS TO BE REACHED AND RECONMENDATIONS .................. 46Agreements ....................... 46Conditions for Effectiveness .................................. 48Conditions of Disbursement ............ *00e***O**.............. 48Recommendation .... O.......OO@C OCOCOC.. 49

LIST OF ANNEXES
1.1 National Energy Balance, 19831.2 Energy Sector Information Flow sad Decision Making Process and
Administration of Household Energy Planning Program
2.1 Installed Generation Capacity
3.1 Organization and Functions of the PMU, Project ManagementOrganization, and JIRAMA Organization Chart
3.2 Selected Performance Indicators
4.1 Methodology and Assumptions for Load Forecasts4.2 JIRAMA ICS Sales and Generation, Actual and Projected FYSO-954.3 JIRAMA ICS Peak Demand, Actual and Projected FY80-954.4 JIRAMA ICS Energy and Capacity Balances FY86-954.5 Isolated External Zone Centers Sales Forecast4.6 Projected Supply-Demand Balance for Household Energy, Antananarivo
Faritany4.7 Description of the Charcoal "Filiare"; Present and Possible Fhiture
Situation
5.1 Reference Power Subsector Investment Plan Sumary, 1987-19915.2 Project Description5.3 Project Cost Summary5.4 Summary of Implementation Schedule5.5 Electric Boiler Project - General Contract Terms & Conditions5.6 Financing Plan5.7 Estimated Scbedule of Disbursements
6.1 JIRAMA Reform Measures6.2 JIRAMA Income Statements 1983-19926.3 JIRAMA Balance Sheets 1983-19926.4 JIRAMA Sources and Uses of Funds 1984-19926.5 Assumptions Used for Financial Analvsis6.6 Phase II Investments
7.1 Economic Cost of Electricity and Economic Rate of Return on PowerSubsector Investment Program
7.2 %conomic Analysis of VolobG Hydropower Generating Plant7.3 Economic Analysis of the Antananarivo Region Electric Boiler Program7.4 Economic Analysis of Antananarivo-Antsirabe Transmission Line7.5 Comparative Economic and Financial Cost of Rice Rusk Briquettes,
Madagascar, 1986
8.1 Documents entered Into the Project File
MAP: Madagascar Public Power Stations and Transmission Lines, October1986, IBRD 18816R

MADAGASCAR
ENERGY I PROJECT
STAFF APPRAISAL REPORT
I. THE ENERGY SECTOR
Irtroduction
1.01 Madagascar is the fourth largest island in the world with a landarea of 597,000 km2. Its estimated 1986 population Is 10.1 million.Despite a favorable resource endowment, Madagascar's economic performancehas been disappointing and its present estimated GDP per capita is onlyabout US$240/capita, 1/ whiech is 252 below that of the early 19708 andstill declining. The lialagasy economy remains predominantly agriculturalwith 81% of the population being rural and agriculture contributing aboutone third of GDP. Economic recovery is predicated on more efficient use )fresources in the face of severe foreign exchange constraints, rehabilite-tion of infrastructure and productive capacity and resumption and growth inagricultural exports.
1.02 Total gross energy consumption was about 2 million toe, or 214kgoe per capita in 1983 of which 82X was fuelwood used very largely forhousehold cooking (Annex 1.1), whereas final energy use was 1.65 milliontoe. Energy demand is forecaet to reach 2.44 million toe by 1995, a growthof 3.3% per annum, though woodfuels used in the household sector will stillexceed three-quarters of final energy consumption. 2/
1.03 Madagascar's main commercial energy resources are hydropower,petroleum and coal. Hydropower is estimated at 7 GW, coal at one billiontonnes and heavy oil at 5-20 billion barrels; however, the economicallyrecoverable quantities are not known as physical and technical accessi-bility is generally difficult. Other forms of petroleum, lignite, and-despite regional shortages-forests and woody biomass are all available insignificant quantities though commercial access is presently limited.Uranium and geothermal steam are also known to occur.
1.04 The Ministry of Industry, Energy and Mines (MIEM) has the mandateto formulate energy policy and to undertake energy planning and investmentprogramming, although the (ffice Militaire pour les Industries Nationaleset trategiques (OMNIS) has played an important role in this sphere untilrecently. The other major energy agencies are JIRAMA and SOLIMA, thenational power and petroleum supply and refining companies, respectively.Both of these companies report through the Direction de l'Energie et del'Eau (DEE) of MIEN, to the Minister of Industry, Energy and Mines.Increasingly, other Government agencies are being drawn into energy supplyactivities, especially for woody biomass fuels. These include the
1/ Preliminary revised Atlas figure.2/ Madauascar: Issues and Options in the Energy Sector, World Bank (July
1986), Report No. 5700-MAG.

- 2 -
Departement des Eaux et ForOts (DEF) of the Ministere de Production desAnimaux, Eaux et Forgts (MPAEF), the parastatal timber producer,FANALAMANGA, linked to MPAEF, in respect to woodfuels, especially charcoal,and the MinistAre de Production Agricole et Revolutioin Agraire (MPARA) withrespect to agricultural residue fuels. A schamatic representation of thenew arrangements for energy administration of the Government and for theenergy planning administration itself, is pre3ented in Annex 1.2. Thesearrangements were agreed with IDA during project preparation and are beingimplemented.
1.05 Interaction for the purposes of energy policy formulatlon,planning, and investment programming between government agencies, even forthose under the umbrella of MIEM, has not been strong. There is nocoherent national energy policy, though in certain contexts, such asGovernment sponsored conferences on the nation's energy resources, nationalgoals and objectives have been enunciated. In the course of IDA's ongoingdialogue with the GOM ill the energy sector, and with the benefit of therecent joint UNDP/World Bank Energy Sector Assessment and preparation forthe proposed Credit, the GOM has confirmed the central role andresponsibility of MIEM for energy policy and planning. Thus IDA wouldprovide technical assistance and other means of support to MIEM to elevatethe status and effectiveness of energy planning and to broaden the horizonsof energy strategy formulation to include the household energy subsector:specifically, supply and demand management aspects of energy used forhousehold cooking, lighting and other household end-uses. The size ofIDA's proposed support for the energy administration and household energyplanning has been adapted to the absorptive capacity of the Government.
1.06 Public sector investment programming is the responsibility of theDirection G6n6rale du Plan (DGP), which has limited skilled staff andresources, and no staff assigned to, or well informed with respect to$ theenergy sector. Currently, DGP compiles the energy sector components of thePublic Sector Investment Plan (PSIP) directly from the plans and programsof the various agencies active in energy production and supply. However,there is no explicit energy sector investment program prepared as part ofthe PSIP. Instead, woodfuel production, power supply, petroleumexploration, and petroleum refining and distribution are treated indisaggregated fashion with no attempt to prioritiz% within the sectorconsistent with least-cost among competing solutions to serve particularenergy demands. Thus sound technical, economic and financial analysis andjudgment of sector priorities is lacking and there is an ongoing risk ofinefficient resource utilization in the sector. Under the proposed credit,IDA would seek to alleviate this problem by strengthening energy planningand investment programming both within MIEM and JIRAMA, as well asencouraging coordination between all other energy-related agencies towardseffective energy planning and project implementation.
Bank Participation in the Sector
1.07 The Bank Group has provided funds for three energy sectoroperations and two forestry projects which have subsequently createdimportant energy supply options. The first energy sector project was forthe power subsector through assistance with financing the AndekalekaHydropower Project with a credit of US$43 million (Credit 817-MAG, May

1978). This credit closed on September 15, 1986. The project included theconstruction of a dam and power plant with two 29 MW generating units,engineering services, technical assistance, and training. The projectachieved its objective of exploiting an Important hydropower resource toeconomically displace thermal power in the main interconnected power supplyzone (ICS). In the process JITAMA staff increased their competence inmajor project design and implementation. The project achieved theestablishment of a planning unit, the provision of computer facilities andimproved management practices and organization. However, plarningmethodologies, investment programming, and the successful adaptation ofcomputer technology for consumer billing and accounts and for planning andengineering design are still needed. Lessons learned from the projectinclude the need for improved demand forecasting techniques and marketanalysis to reduce the risk of premature investment. Failure to predictmore accurately future power demand at the time of designing the Andekalekaproject has led to large surpluses of hydroelectricity in the ICS (para.4.03). Similarly, a stronger and ongoing dialogue is required duringproject supervision between JIRAMA, the Government and IDA in order tostrengthen planning and management capability. Under the seeend energysector project, the Petroleum Exploration Promotion Credit of 1980 (Credit1016-MAG), the GOM established the legal and fiscal framework for explora-tion and promotion and assembled the required data. Since 1981 fourcontracts have been signed with major oil companies and more than US$90million has been spent on drilling activity. The third energy sectorproject, the Tsimorora Heavy Oil Exploration Project of 1982 (Credit1298-MAG) has further defined the Tvimorora resource, and though notproving up recoverable resources, showed possible extension of thereservoir, thereby justifying further seismic analyses lu 1985, and shallowdrilling in 1986. In the forestry sector, two operations have contributedto energy sector development by generating large quantities of charcoalfeedstock in the form of thinnings and smallwood. These are the first andsecond Mangoro Forestry projects (Loan 1065-MAG and Credit 525-MAG, 1974-1981 and Credit 1661-MAG, 1982) which helped the Government to complete theestablishment of about 80,00U ha of pine plantations at Haut Mangoro.
1.08 Under the Joint UNDP/World Bank Energy Assessment Program and atthe request of the Government of Madagascar, the Bank conducted in 1984 anenergy sector assessment of Madagascar. The final report (No. 5700-MAG) ofthe mission was published in January 1987 after detailed review by theGovernment, and concludes that the sector issues which roquire the mosturgent action are: (i) the increasing shortage and rapidly growing r.: 1prices of woodfuels for household cooking and the deforestation andenvironmental deterioration related partly to woodfuel scavenging; (ii)the urgent need for rehabilitation of distribution, transmission andgeneration systems in the power sector; (iii) the gross under-utilizationof hydropower available from the Andekaleka hydroelectric generatingstation in the Interconnected Zone; (iv) the general weakness of energypolicy, planning and investment programming in Government, exacerbated bythe lack of a single effective focus for energy planning and poor coordina-tion between agencies active in the ener,v sector; (v) the future form ofpetroleum products supply and the viability of and options for refineryrehabilitation and operations; (vi) the inadequate definition in physicaland economic terms of the major resources with energy potential, includingin particular hydropower and woody biomass.

-4-
Reasons for IDA's Involvement in the Energy Sectort
1.09 IDA's goals in Madagascar are to assist the Government with theformulation and implementation of policies and programs which will improvethe efficiency of the public sector and stimulate private sector productionof goods and services. leading to increased resource mobilization, andincreased production and exports of agricultural produce and manufacturedgoods where Madagascar has a comparative advantage. In supporting theenergy sector, IDA is seeking the formulation of comprehensive energypolicies leading to rational energy prices, import substitution, economicuse of indigenous energy resources, energy efficiency improvements andenhancement of the role of the private sector in energy management anddevelopment. Consistent with these objectives, IDA sought and reachedagreement with the Government on the strengthening of energ sectorinstitutions through the development of a single effective energy planningagency, and the preparation of least cost production and supply plans formajor subsectors of the energy economy. Another important objective is theimprovement of reliability of supply and efficiency in the power sectorthrough rehabilitation of deteriorated generation, transmission, anddistribution facilities, and the financial rehabilitation of sectorparastatals (especially JIRAMA), leading to uniformly high technicalstandards of service and financial autonomy.
Energy Resources
1.10 Hydropower. The hydropower resources of Madagascar aresubstantial but poorly defined and frequently economically inaccessible topotential demand centers. Stream gauging and hydrological analysis hasbeen only intermittent in the major catchment zones. JIRAMA estimates thatthere are 339 known sites with a firm power potential of 7,055 MW capableof an annual production of about 60,000 GWh. Thirty-three sites withestimated power outputs tabove 50 MW account Eor 6,330 MW, or 90% of theknown total. There are 72 sites identified in the 1-5 MW range, and atleast 200 sites below 1 MW. Only 105 MW, corresponding to 1.6% of knownpotential, has been developed. The greatest barrier to efficientdevelopment of the hydropower resource is the lack of precise informationon the potential to economically displace existing diesel generation withmini or micro-hydropower installations, the lack of a comprehensive leastcost development plan, and the poor coordination between potential donoragencies. The proposed project will strengthen hydropower resourceassessment and development planning (see para. 5.07(e)).
1.11 Petroleum. Two sedimentary basins, Morondava in the west andMahajunga in the north, are potential sources of oil and gas. Their totalland-area is 170,000 ki2, with a further 80,000 km2 offshore at depths upto 200 m. The deep water area between 200-2,000 m covers a further 50,000km2, offering prospects for oil and gas in the 'onger term. Most explora-tion has been in in the Morondava basin where evidence of tar sand andheavy oil have been found. Following the 1979 increase in oil prices, theGovernment, with IDA assistance, was able to attract major oil companies toinvest heavily in oil exploration. The four major oil companies nowactive-Mobil, AGIP, Amoco and Occidental-will have spent more than US$100million by mid-1988. There are also tar sand and heavy oil deposits inwestern Madagascar. The Bemolanga tar sands are estimated to contain 5-20

billion barrels of oil equivalent. However, studies financed by IDAindicate that their exploitation is not presently economic. The heavy oildeposits at Tsimorora are also being reviewed with IDA assistance in orderto establish their potential foe commercial exploitation, though onceagain, market conditions do not suggest early production from thisresource.
1.12 Coal, Lignite and Peat. The area of greatest interest for coal isthe Sakao basin with estimated reserves of 1,000 million tonnes andmineable reserves wltt. moderate ash, medium volatile steam coal estimatedat 173 million tonnes, of which 82 million tonnes are recoverable byunderground methods, and 23 million tonnes by open pit methods. Theprincipal lignite resources occur in the Anteirabe region of the centralhighlands. Recent estimates indicate proven reserves of 11 million tonnesand possible reserves of 32 million tonnes. Lignite is not of sufficientquality to justify mining hence there appears to be no foreseeable economicfuture for the resource. On the other hand, peat occurrences are commonand it is used widely for brick making. Peat resources have not beeninvestigated though there is potential for significant discoveries.
1.13 Forests. The contiguous natural forest cover is estimated at12.3 million ha. Plantations add a further 265,000 ha. On the assumptionthat only 20X of the natural forest is economically accessible underenvironmentally sound management practices, the estimated sustained annualyield is about 2 million toe, compared with a gross annual consumption ofabout 1.7 million toe. Unfortunately, there are regional imbalances whichrender meaningless the apparent surplus of 0.3 million toe. In fact,demand for woodfuels is concentrated in the central highlands, in thehinterland of Antananarivo, Antsirabe and Fianarantsoa, where there is asbortfall between accessible sustainable production and regional demand ofabout 0.6 million toe (1.9 million tonnes of wood) per annum. Productionsurplus to demand in other regions cannot be economically transported tothe central highlands demand centers.
1.14 Other Biomass Resources. Madagascar's main agricultural crop isrice which generates annually cellulosic residues of about 4.6 milliontonnes. Some 500,000 tonnes of these residues are rice husks which arelargely disposed of as wastes, except in the Lac Aloatra region where abouthalf are used for fueling boilers to provide shaft power for rice milling.The remainder there and in the immediate hinterland of major cities couldbe briquetted for household fuel production, and used as a substitute forfirewood and the low quality charcoal presently marketed. Sugar cropresidues are another potentially economic source of industrial andhousehold fuel, or for the production of electricity surplus to sugar millneeds for regional sale in public distribution systems. Bagasse and canefield residues offer long term potential for power and energy production ofabout 90,000 toe annually. Other crop residues are judged not to beeconomically accessible in the foreseeable future.
Energy Demand
1.15 Energy Balances and Trends. A national energy balance forMadagascar for 1983 is provided in Annex l.1. Table 1.1 provides a summaryof this Annex with projections of demand for all fuels through 1995. Total
- 6 -
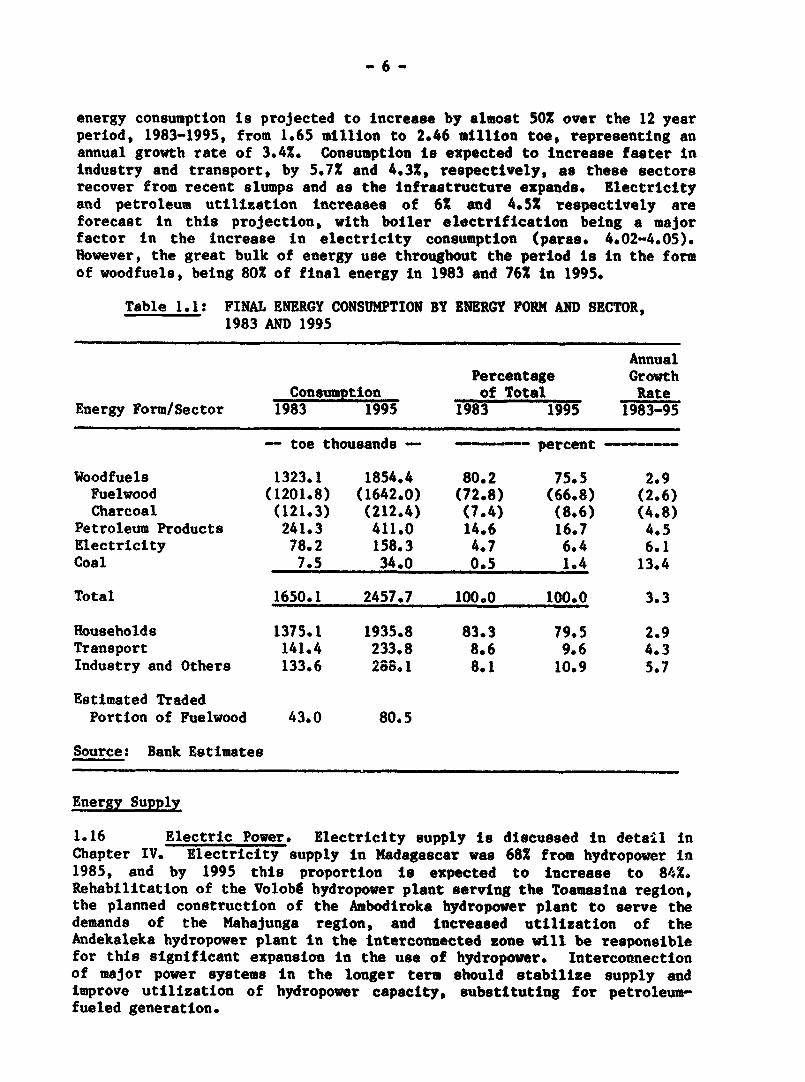
energy consumption is projected to increase by almost 50% over the 12 yearperiod, 1983-1995, from 1.65 million to 2.46 milllon toe, representing anannual growth rate of 3.4%. Consumptlon is expected to Increase faster inindustry and transport, by 5.7% and 4.3%, respectively, as these sectorsrecover from recent slumps and as the infrastructure expands. Electricityand petroleum utilization increases of 6X and 4.52 respectively areforecast in this projection, with boiler electrification being a majorfactor in the increase in electricity consumption (paras. 4.02-4.05).However, the great bulk of energy use throughout the period is In the formof woodfuels, being 80% of final energy in 1983 and 76% in 1995.
Table 1.1: FINAL ENERGY CONSUMPTION BY ENERGY FORM AND SECTOR,1983 AND 1995
AnnualPercentage Growth
Consumption of Total RateEnergy Form/Sector 1983 1995 1983 1995 1983-95
- toe thousands - - percent
Woodfuels 1323.1 1854.4 80.2 75.5 2.9Fuelwood (1201.8) (1642.0) (72.8) (66.8) (2.6)Charcoal (121.3) (212.4) (7.4) (8.6) (4.8)
Petroleum Products 241.3 411.0 14.6 16.7 4.5Electricity 78.2 158.3 4.7 6.4 6.1Coal 7.5 34.0 0.5 1.4 13.4
Total 1650.1 2457.7 100.0 100.0 3.3
Households 1375.1 1935.8 83.3 79.5 2.9Transport 141.4 233.8 8.6 9.6 4.3Industry and Others 133.6 2 8.1 8.1 10.9 5.7
Estimated TradedPortion of Fuelwood 43.0 80.5
Source: Bank Estimates
Energy Supply
1.16 Electric Power. Electricity supply is discussed in detail inChapter IV. Electricity supply in Madagascar was 68% from hydropower in1985, and by 1995 this proportion is expected to increase to 84%.Rehabilitation of the Volob6 hydropower plant serving the Toamasina region,the planned construction of the Ambodiroka hydropower plant to serve thedemands of the Mahajunga region, and increased utilization of theAndekaleka hydropower plant in the interconnected zone will be responsiblefor this significant expansion in the use of hydropower. Interconnectionof major power systems in the longer term should stabilize supply andImprove utilization of hydropower capacity, substituting for petroleum-fueled generation.

- 7 -.
1.17 Petroleum and Petroleum Products. Madagascar is entirelydependent on imports for Its petroleum supply, both crude and refinedproducts. Net petroleum Imports were 31% of total merchandise imports in1983 and absorbed 52% of non-energy export revenues, 3/ up from 13% and15% respectively in 1978, in spite of a decline in petroleum ilport volumesduring this period. In 1983 crude oil cost US$82.7 million and refinedproducts cost US$63 million. Preliminary indications for 1985 imports areUS$15 million for crude and US$41 million for refined products: asubstantial reduction due both to reductions in the price of refined andcrude products and to reductions in absolute volumes imported and stockreductions. Madagascar obtains its crude oil through a Government-to-Government arrangement with the Soviet Union and precise details of thisarrangement remain confidential. It is believed that the indicative pricewas about US$22/bbl in mid 1986, considerably above world market prices,but credit and foreign exchange requirements are softened by virtue ofspecial payment terms and conditions. Refined product needed to supplementrefinery production in meeting Madagascar's demand is procured on the openmarket at CIF prices more than 25% above those available if foreignexchange were not a constraint. At present, SOLIMA, the State-ownedpetroleum parastatal, is forced to buy late and short, because it does nothave a sufficient credit rating to permit it to engage major suppliers incompetitive bidding, based on optimal procurement and transport packages.The proposed project includes a study to review the options to minimize thecost of petroleum products, including procurement of crude and products.
1.18 Imported crude is refined at the port of Toamasina, at theGovernment owned refinery operated by SOLIMA, the company formed by theGovernment in 1976 to take over petroleum supply, refining, distributionand marketing from local affiliates of a number of major foreign oilcompanies. The refinery has a capacity of 16,800 bpd (750,000 tpy) and isequipped with a new 350,000 tpy visbreaking unit, a 165,000 tpy gas oilhydro-sulfurization unit and a 20,000 tpy bitumen unit. The refinery is ina deteriorated condition as a result of a long period of operation withoutadequate spare parts and a subsequent fire in the topping furnace in 1983,after which it was temporarily shut down, and more recently, operated belowfull capacity. The GOM plans a major program of refinery rehabilitationpending the availability of required foreign exchange financing, in whichCCCE has expressed an interest to participate, though no firm arrangementshave been made. Although petroleum products are still widely available,port handling, storage, coastal transport and inland distribution systemsare in a badly deteriorated condition due to lack of spare parts andsuboptimal storage and handling arrangements, leading to large productlosses through multiple handling and evaporation. The study of petroleumimport options included in the project would also review the future role ofthe refinery and include preparation of a master plan for petroleumdistribution, expansion, and rehabilitation, and the organization andincentive system to effectively distribute petroleum products throughoutthe country.
3/ Fuel oil surplus to country requirements is re-exported from theToamasina refinery.

-8-
1.19 Petroleum prices remain above border prices; e-en with recentdevaluation, though the relationship between prices and economic costs ischanging rapidly due to exchange rate and global petroleum price varia-tions. Government policy is to discriminate in pricing against high-incomeusers in favor of low-income and productive end-uses. However, it isunlikely either that families using kerosene for cooking are low-income, orwhat heavy discrimination against gasoline is economically productive atthe margin. Diesel-engined vehicles are more expensive, and the policycurrently leads to the use of kerosene in blends with gasoil and gasoline,resulting potentially in higher engine wear and serious loss of fueleconomy. A review would be made by the Direction of Energy and Water,MIEM, as part of proposed petroleum planning studies, of possiblealternative pricing policies which might avoid the worst aspects of thepresent distortion while maintaining tax revenues and achieving economi-cally sound policy objectives.
1.20 Biomass Fuels. Declining physical accessibility of woodfuels ofacceptable quality over the past decade is strongly reflected in pricetrends in the open market. Prices of firewood and charcoal in Antananarivoappear to have increased by 50X and 30%, respectively, in real terms overthe 1973-1984 period. Since 1984, the Bank has monitored firewood andcharcoal prices at selected retail outlets in Antananarivo and had foundthat firewood prices have risen 13-15%, and charcoal about 5% per annum, inreal terms, during the past two years. However, recent IDA time seriesanalyses, which applied more accurate inflation data, cast doubt thatpricet have actually been increasing significantly in real terms. Detailedwoodfuels supply-demand projections were made by the Joint UNDP/World BankMadagascar Energy Assessment. Without a series of possible interventionsidentified by IDA, sbme of which are supported through this project, thedeficit between sustainable supply and demand in the hinterland ofAntananarivo will grow from 1.3 million to 2.2 million tonnes of woodequivalent over the next decade. The supply demand imbalance projectedwill lead to loss of oome 1.5 million ha of natural forest cover by 1995,some 12% of present contiguous forest cover. It is neither a conceivablenor a feasible option to reforest at a rate to avoid potentially seriousnegative effects of anticipated deforestation, although a combination ofimproved forest management, community or agroforestry, recovery of fuelquality residues surplus from wood processing, logging and existingindustrial wood plantations, as well as growing use of modern fuels andhigher cooking efficiency, could greatly ameliorate impending problems. Asa component of this project, IDA would support the utilization of thinningsand other residues from the Haut Mangoro pine plantation, commercial trialsof rice husk briquetting, improvements to traditional carbonizationefficiency, improved household energy planning, and interventions toimprove cooking efficiency through the use of improved stoves and theintroduction of electric rice cookers, all as private sector initiatives.
II* THE POWER SUBSECTOR
Organization
2.01 JIRAMA is the sole agency in Madagascar responsible for elec-tricity production and supply, and is also responsible for potable watersupply. Until 1973, responsibility for power supply was vested with two

-9-
major companies, privately owned Electricit6 et Eau de Madagascar (EEM) anda company in which the Government had a majority share-holding: Soci4t6d'Energie de Madagascar (SEM), which operated supply mainly in therespective municipalities. These two major companies also operated publicwater supplies in their service areas. In 1973 the Government took overSEM and EEM, managing the combined entity temporarily under the Soci6t6d'Interft National pour l'Eau et l'Electricite, and then in 1975,established the autonomous Malagasy Electricity and Water Corporation(JIRAMA), to own and operate all electricity and water supply. Finally, onJanuary 1, 1977, JIRAMA took over the assets and liabilities of the formerentities, in addition to the long term debt to Government in respect to thecompensation of related foreign interests. JiRAMA was at first responsibleto the Ministry of Economy and Commerce, but in the early 1980s became theresponsibility of the Ministry of Industry, Energy and Mines. Chapter IIIcontains further details on the management and origin of JIRAMA and itslinks with Government.
Sector Facilities
2.02 The major electric power facilities have been constructed tointernational standards. However, serious lack of foreign exchange for theprocurement of spare parts has led to severe deterioration of physicalplar- and increasingly frequent and economically disruptive outages.Sustained power supply in several major towns and cities is now seriouslyjeopardized. This problem has been further exacerbated by recentcyclones. Cyclone Kamisy caused severe damage to central highlands andwest coast facilities, especially in the Mahajunga supply zone, in 1984,and in March 1986 cyclone Honorina caused damage to distribution, transmis-sion and generation facilities. The majority of funding proposed for thepower subsector in the proposed project is for rehabilitation of diesel andhydropower generation, and for transmission ane distribution facilitieswith the objective to improve reliability of supply and to create a soundbasis for later power system expansion (para. 5.07).
2.03 Although the public power supply system is managed by JIRAMA,private sector captive supply is significant with 23% of total installedcapacity, a sizeable proportion of which is within the sugar industry.Table 2.1 indicates the ownership of power plants. In the region of thecapital of Antananarivo, supply is through a large interconnected systempresently responsible for over 63% of public electricity sales. The totalinstalled capacity in Madagascar is 267 .AW, if which 105.5 MW ishydropower, about 139 MW is diesel and 22.4 MW is steam turbine drivengenerators. Supply is divided into three groups as per Table 2.2 (IBRD Map18816).
Table 2.1: GENERATING CAPACITY BY OWNERSHIP IN 1985
Hydro, Thermal and Diesel TotalMW % MW % MW %
Public Supply 105.5 51.5 99.4 48.5 204.9 76.8Private Supply 62.1 62.1 23.2
Total Country 105.5 51.5 161.6 60.5 267.0 100.0

- 10 -
2.04 The main electric power generating facilities are listed in Annex2.1 and summarized in Table 2.2.
Table 2.2: GENERATING CAPACITY IN MADAGASCAR, 1985
Hydro Diesel Thermal TotalUnits MW Units MW Units MW Units MW
Interconnected Zone 16 92.4 13 34.5 - - 29 126.9External Zone 12 13.0 135 63.1 - - 147 76.1Isolated Zone 2 0.1 21 1.8 - - 23 1.9Public Sector 30 105.5 169 99.4 199 204.9
Private Sector - - 64 39.5 6 22.4 70 62.1
Total Country 30 105.5 233 138.9 6 22.4 269 267.0
Access to Service
2.05 All urban centers are served by electricity from public supply.The urban population is estimated to be 19% of the total of 10 million(1986). However, less than one-third of the urban population is actuallyconnected to electricity, wbich represents about 6% of the totalpopulation. Extension of supply within the ICS and other low cost supplyzones is a high priority component under the proposed IDA project. Percapita consumption of electricity from the public supply system was about33 kWh/year which, given substantial private sector production, is anunderestimate of the true national average. Madagascar's consumption is ofthe same order as that of Tanzania, and above that of the poorer countriesof the region, such as Ethiopia and Uganda. However, it is about one-halfand one-third of that for Malawi and Kenya, respectively, lndicating thatthe relative level of electrification is very low by regional standards,despite the availability of low-cost indigenous power resources.
Pattern of Electricity Consumption
2.06 Public electricity consumption by major system and consumercategory is shown in Table 2.3. In the ICS consumption was about 204 GWh,or about 64% of the total in 1985.
Table 2.3: MADAGASCAR: PUBLIC ELECTRICITY CONSUMPTION BYCONSUMER CATEGORY, 1985
ICS External Z. Isolated Z. TotalCategory GWh % GWh Z GWh Z GWh X
Residential 61.1 30.0 20.3 18.0 0.8 41.5 82.2 25.8Commercial 44.2 21.7 18.1 16.0 0.8 41.5 63.1 19.8Industrial 98.3 48.3 74.6 66.0 0.3 17.1 173.2 54.4
Total 203.6 100.0 113.0 100.0 1.9 100.0 318.5 100.0

- 11 ~-
Power Subsector Planning
2.07 Power system development planning has been carried out by JIRAMAwithout the assistance of consultants. Any development plans prepared byJIRAMA are presented to the Department of Energy and Water, MIEM, reviewedthere and then discussed with the DGP before being incorporated in thePublic Sector Investment Program (PSIP). However, the company has notroutinely undertaken comprehensive power system planning as it lackssuitably trained and experienced personnel and until recently was notstructured to facilitate systematic planning for power supply developmentand management. As a result there has never been a comprehensive leastcost expansion plan as the basis for review annually, or more frequently,as a regular part of management review and budgeting. Similarly, loadforecasts have been, for the most part, simple linear projections based onhistorical performance. The proposed project would include technicalassistance and training to strengthen the new Direction of Economic Studiesand Planning and the Direction of Electrical Equipment, which is thedivision responsible for the final feasibility study and implementationmanagement for major power system development. The proposed project wouldalso fund the first national power sector master plan and relatedinvestment programming and tariff studies, projecting the needs for systemdevelopment beyond the year 2000, and laying the foundation for rollingannual review and revision of plans and investment programs by JIRAMA.
2.08 In part as a result of planning weaknesses, and in part throughdirect Government intervention, there has been both overinvestment incapacity and overestimation of demand, leading to a dramatic oversupply ofgeneration capability in certain regional centers and little otilization ofavailalle hydropower in the main ICS. This has led, in turn, to lower thanexpected revenue, resulting in poor financial performance for the utility.Perhaps the most serious problem arises from the large surplus in hydro-power capacity contributed by the Andekaleka Hydropower plant (2x29 MW) inthe ICS feeding the Antananarivo region. Load growth in the ICS did notgrow as anticipated during the economic evaluation of the Andekalekaproject in the late 1970s, largely because the economy has been stagnant todeclining in comparison with the moderate growth foreseen at the time. Inparticular, a large number of planned industries did not materialize. In1985 only 180 GWh of the 500 GWh average annual availability of this hydro-power plant was utilized. The GOE and JIRAMA are revising commercialpolicies for electricity connections to promote the use of electricitywherever financially and economically attractive. Such measures would besupported by the proposed project. Furthermore, there is a need forcomprehensive power system rehabilitation. However, apart from the absenceof a planning framework for system expansion, there is no economicallysound methodology being practiced by JIRAMA to establish priorities forrehabilitation in the face of ongoing scarcity of equipment and materials.Modern maintenance scheduling and planning for decision-making onpriorities for implementation of the proposed major rehabilitation programare addressed in detail in the proposed project. The initial review phaseleading to rationalization of diesel generation facilities would alsoassist with a revaluation and computerization of the asset base and theestablishment of computerized spare parts inventory.

- 12 -
2.09 During appraisal, agreement was reached on reasonable loadforecasts, and an indicative or "Reference Power Sector Investment Prograu"(RIP) for the 1986-1992 period, was established in advance of more detailedload forecasting and system expansion planning which would be undertaken aspart of the proposed project. Agreements were obtained during negotiationsthat: (i) JIRAMA would not, until the completion of the project, undertakeany major change in the Government's RIP agreed with IDA unless JIRAMAshall have furnished evidence satisfactory to IDA that such major projector program is economically and technically justified and, (li) the RIP,which would cover at least five years, would be reviewed annually by March31, or as needed, and revised as required. Major changes would be thoserequiring capital expenditure which would exceed 1X of JIRAMA's grossrevalued assets in operation in any fiscal year, or two million dollars,whichever is the lower.
Power Subsector Objectives
2.10 The main objectives of the power subsector arising from discus-sions between JIRAMA, the Government and IDA are: (i) to improve thereliability of production and supply of electricity throughout the countryin accordance with agreed national economic and social objectives; (ii) toensure that electricity supply is provided at least cost; (ili) to increasethe use of indigenous sources of electricity wherever economicallyjustified; (iv) maximize the utilization of existing low cost sources cisupply from existing production capacity.
Power Subsector Strategy
2.11 The following strategy represents the position of the GOM andJIRAMA in attempting to fulfill the main power sector obJectives: (i) todevelop indigenous energy resources, such as hydropower and biomassresidues, for electricity generation in place of more expensive importedfuels; (ii) to interconnect supply zones to make more efficient use ofexisting and prospective major hydropower plants and to stabilize andminimize the cost of power supply; (iii) to increase system reliability andreduce power losses through improving operation and maintenance andrehabilitating existing facilities; (iv) to regulate tariffs and take otherfinancial measures necessary to meet financial objectives; (v) to promotethe utilization of electricity where economically and financiallydesirable, through increasing the number of consumers and designingprograms of interfuel substitution in industry for electrifying heat andsteam production; (vi) to undertake least-cost power system expansionplanning and to carry out detailed feasibility studies for economicallyattractive major power developments.
Aid Inflow and Coordination in the Sector
2.12 Bank participation in the sector has been substantial, thoughlimited to one major hydropower project: Andekaleka. To finance thisproject a substantial cofinancing effort was made leading to a financingpackage which included the Abu Dhabi Fund, Banque Arabe de D6veloppementEconomique en Afriq-¶e (BADEA), Caisse Centrale de Cooperation Economique(CCCE), Canadian International Development Agency (CIDA), Kuwait Fund, andthe Saudi Development Fund. However, despite the number of donors involved

- 13 -
in financing Andekaleka, CCCE is the only donor which has continued tosupport power subsector development consistently with several small loans,the most recent of which being considered is for US$2 million equivalentfor the proposed Tana Sud 63 kV transmission ring. Aid flow has otherwisebeen modest and JIRAMA has had to resort to short term suppliers' creditsto finance recent diesel power plant expansion, which was itself, in retro-spect, a low priority use of foreign exchange. Hence, foreign assistancehas been inadequate to meet subsector requirement; a limitation whicb hasbeen further exacerbated by natural disasters, including floods andcyclones. Finally, weaknesses in planning and overt Government interven-tion in investment decision making has led to an imbalanice in investmentbetween generation expansion and rehabilitation of existing facilities,which continue to deteriorate rapidly.
III. THE IMPLEMENTING AGENCIES
3.01 The implementing agencies would be JIRAMA for the power components,FANALAMANGA for the pine carbonization project, and the five ProjectImplementation Units (PIUs) under the coordination of the PMU in the MIEMfor the energy components of the project. Implementing agencies and theinstitutional arrangements are presented in Annex 3.1.
JIRAMA
3.02 JIRAMA is an entirely state-owned corporation, created in 1975 toown and operate all public electricity and water supply facilities. Inthat context JIRAMA may undertake all relevant activities, including theacquisition of other water and power companies in the country, and thecreation of subsidiaries. This flexibility has enabled JIRAMA to absorb,consolidate, and merge into one company the numerous independent utilitiesin existence prior to its own creation.
3.03 Organization and Management. JIRAMA has an eighL-member Board ofDirectors, which is appointed by the Government and includes four membersfrom the Ministries of Energy, Interior, Labor, and Agriculture and non-government appointees. A Director General, also appointed by the Govern-ment, is responsible for day-to-day management. Although it is under theformal supervision of MIEM, JIRAMA has reasonable autonomy to conduct itsday-to-day affairs without undue interference by Government. However,Government has directed JIRAMA to make investments in power supply formajor projects which have not materialized or which will not use power atthe planned level, leading to serious overinvestment in generationcapacity. The company is also subject to tight controls regarding foreignexchange allocations which require the approval of MIEM, the Ministry ofFinance, and the Central Bank. The Government further exercises strictcontrol over electricity tariffs, and tariff changes require cabinetapproval. JIRAMA has recently undergone a reorganization, wherebyresponsibilities have been more suitably regrouped by function rather thanon the previous basis of geographical areas. Also, a greater decentraliza-tion of day-to-day management within reinforced regional administrativeentities is envisaged with respect to personnel, customer management andinventory control. Furthermore, all planning activities and economicstudies, previously dispersed in seve:al departments, have been consoli-dated within a single Department of Economic Studies and Planning, for

- 14 -
which a technical assistance program is proposed under the project (para.5.07(e)). Managerial efficiency of the company continues to be constrainedby infrastructural and logistical shortcomings. For example, management inAntananarivo is dispersed in 17 buildings, telecommunications equipment atthe local level is limited and obsolete, communications between the regionsand the center are difficult, and the situation of the vehicle fleet iscritical. Programs for the modernization of the vehicle fleet and of thetelecommunications system are part of the proposed project (para.5.07(d)). In order to overcome present deficiencies ii the relationshipbetween the Government and its wholly-owned parastatal, JIRAMA, which untilrecently have implied ongoing financial dependency, limited tariffmanagement autonomy and increasingly costly and poor quality service, it isappropriate for the Government and tIRAMA to consider a complete review andreform of their commercial and administrative relationship. The GOM hastaken important steps towards such a reform package through the measures tobe adopted for financial restructuring of JIRAMA in parallel with theprocessing of the proposed Credit. Building on these financial reforms, itis appropriate for the GOM to develop and adopt a more all-embracingcompact defining specific objectives, mutual responsibilities andobligations that would lead JIRAMA not only to financial autonomy, but alsoto a greater degree of management autonomy based on a commitment toGovernment to achieve certain minimum performance criteria consistent withincreasingly reliable and high quality service at least cost. Atnegotiations, Government and JIRAMA would agree to prepare and present forIDA review by December 31, 1987 such a compact or "contract plan".
3.04 Planning. Due to a shortage of suitably experienced and qualifiedstaff and a lack of data processing equipment and computer software, JIRAMAhas been unable to prepare appropriately detailed load forecasts and asystem expansion plan and investment program. These deficiencies will bealleviated under the proposed project (see paras. 2.07, 5.07 andAnnex 5.2).
3.05 Engineering and Design. Although JIRAMA has a number of qualifiedengineers on its staff, to date its design activities have been limited tothe distribution and sub-transmission level, with assistance fromconsultants on major projects. During construction of the Andekalekaproject, JIRAMA construction crews satisfactorily completed the erection ofthe 175 km, 138 kV transmission line to Antananarivo, with guidance fromconsultants. Installation of all distribution facilities was completedwithout outside technical help. However, because of the large volume ofengineering work required, JIRAMA should employ consultants to assist inprocurement and supervision in order to ensure successful projectcompletion, and funds have been included in the proposed project for thispurpose,
3.06 Operations and Maintenance. The electric power facilities are notwell maintained primarily because of the lack of funds for spare parts butalso due to the lack of training in modern preventive maintenance programs.In consequence, supply outages in the ICS and External Zone (ZE) areincreasingly frequent and disruptive of industrial and commercial activity,and a large proportion of diesel electric generating plant is unservice-able. This is a particular problem with diesel engines which, withoutroutine maintenance, become unreliable long before their expected service

- 15 -
life. Thus, a component of this proposed project includes not only theprovision of spare parts, but also the training of maintenance personneland the establishment of equipment monitoring and repair techniques.
3.07 Data Processing. At present JIRAMA does not have any internaldata processing equipment such as micro-computers for basic statisticalanalysis and management information reporting. Data processing is carriedout by SOMAGI, a public enterprise for computer services. However, therole of SOMAGI in the evolution of computerization of data processing inJIRAMA is to be reviewed as part of the proposed project and incoordination with CCCE technical assistance to JIRAMA. SOMAGI performscustomer billing, financial accounting and analytical accounting. With thedecentralization of management on a regional basis, additional equipment ofsufficient capacity to handle (i) inventory control; (ii) maintenancemanagement; and (iii) regionalized computerized customer billing, isproposed under the project (para. 5.07(d)). The proposed equipment wouldbe micro-computers and communication with the center would be viadiskettes.
3.08 Billing and Collection. Meters are read once a month. Thereadings are sent to SOMAGI, where batch programs issue the bills on the20th of each month. Ten to fifteen percent of the customers pay directlyto the collector distributing the bill, 6.5% by automatic withdrawal from abank account, 13% by check, and the rest in cash at JIRAMA's registers.Enforcement of payment for private consumers is quite strict. Customersthat do not pay within 8 days of receipt of a special delivery reminder,which in turn is sent 8 days after the original bill has been issued, aredisconnected. As a result, accounts receivable from private and industrialcustomers are satisfactorily low. JIRAMA on the other hand has not beensuccessful in collecting from Government agencies and municipalities.Accounts receivable represent betweer 12-14 months of sales to theseconsumer groups. The proposed project requires that the totality ofarrears be settled half by June 31, 1987, and half by September 31, 1987,(Table 6.3).
3.09 Accounting and Audit. JIRAMA !aintains its books in accordancewith Malagasy accounting codes and regulatiou. Many accounting functionsare computerized through SOMAGI; notable exceptions include asset andinventory control, which will be addressed under the proposed project(para. 3.09). The auditor's report for the 1984 accounts contained severalqualifications relating to and recommending (i) improvement of theinventory of assets and their valuation; (ii) reducing accounts receivablein the Isolated Systems; and (iii) upgrading inventory valuation. JIRAMAhas been taking corrective actions in these areas and the audit report forthe 1985 accounts contained only a qualification regarding the upgrading ofinventory valuation. Agreement was reached during negotiations that JIRAMAwill continue to evploy qualified auditors and will send audited accountsto IDA within six months after the end of the fiscal year.
3.10 Insurance and Taxes. JIRAMA has satisfactory insurance coverageof its plant and equipment against the risks of fire, theft, liability, andaccident. Breakdown of machinery Is insured in some instances. JIRAMA issubject to a 36% tax on its net income as well as custom tariffs, importduties, vehicle taxes, and a business tax. Prom its customers the company

- 16 -
collects for the Government an added value tax of 15% and a consumptioncharge of FMG 5 per kWh (0.6 US¢/kWh). JIRAMA is thus a rather highlytaxed utility. While it generates significant revenues for Goverrment, thetax regime results in tariffs which are considerably higher than elsewherein the Eastern and Southern Africa Region. Different consumer categoriespay different taxes and base tariffs for the same conFlumer groups varyarbitrarily due co the historic tariff structure (para. 5.01(f)). Reduc-tion in the number of tariffs, and simplification of the application oftaxes through the billing structure, offer the potential for considerableimprovement in administrative efficiency and cost reductions. Agreementwas reached during negotiations with JIRAMA and the Government that theresults of the tariff reform study will be jointly reviewed with IDA beforeSeptember 1988 and that the new tariff structure would be implemented notlater than January 1, 1989.
3.11 Personnel and Personnel Management. As of mid-1986, JIRAMA hadabout 4,100 employees of which about 325 or 8% were top and middle levelmanagers and professional staff, about 900 or 22% were lower level managersand middle level staff, and the remaining 2,875 or 70% were lower levelemployees. These numbers represent overall employment including the watersupply staff. Considering that about half the staff are concerned withelectricity affairs, the staffing levels represent one employee per 58customers which is a satisfactory ratio by regional standards, thoughreduction to 65-70:1 should be sought and will be monitored by JIRAMA overthe next decade. JIRAMA's salaries are reasonably competitive and thecompany is generally able to attract suitable staff as necessary, althoughJIRAMA is currently recruiting in a captive market. Most of the company'sprofessionals are graduates from the local university system and only veryfew have been trained abroad. A new evaluation system was introdaced inAugust 1986 for all higher and medium level staff. Based on performanceplans and subsequent evaluation reviews merit increases are allocated.Individual training schedules are being established as precondition for thenext promotion step, and in the future managerial positions will be filledfrom a company-wide pool of candidates. Personnel administration will bedecentralized as standardized recruitment, probation, promotion, andrelated procedures are implemented.
3.12 Training. JIRAMA's training activities are well organized. Anorientation group chaired by the Director General deternines the annualtraining objectives. A training committee and specialized subcommitteessubsequently design specific training curricula. Most of the training isprovided through the in-house training facility; external trainingrepresents 5%. In 1985, 518 staff received 592 staffweeks of training,equivalent to an average of about 0.5 staffweeks per eligible employee(managers, professional and middle level staff). Training a- oad has beenseverely restricted due to lack of foreign exchange, and while JIRAMA'sstaff is technically competent, it has to some extent been isolated fromthe latest techniques. Therefore the project supports additional overseastraining based on an agreed training program.
3.13 Management Information System. JIRAMA needs an appropriateManagement Information System which will help managers to identify problemareas early and to take corrective action. Such a system would bedeveloped and implemented under the proposed assistance to JIRAMA's

- 17 -
planning department (para. 5.07(e)). It would establish a number oftechnical and financial performance indicators to be reviewed and agreedwith IDA in the course of the project.
3.14 Performance Indicators. An indicative set of performanceindicators is provided in Annex 3.2. It will be used while the MIS isdefinied and implemented. These indicators are necessarily tentative asthey have been defined on the basis of preliminary estimates.
IV. THE MARKETElectricity Market
4.01 Historical Market. Electricity sales have grown sporadicallyduring the 1970s and 1980s. Nationwide sales grew on average by 4.4% peryear between 1973-83, from 203 GWh to 313 GWh, though year to year growthrates varied from 14% in 1979 to -1% in 1982 (Table 4.1). The largeincrease in 1979 was due to a 17% growth in industrial electricity consump-tion as a result of a 13% increase in industrial output. Similarly, theperiod of virtually zero growth in 1980-82 was caused largely by a sharpdecline in industrial output. Growth in ICS sales was only about half thatof the other systems after 1983: 3.4% compared with 6.4%. Capacity demandgrew more rapidly than energy demand for the 1973-83 period, from about 30MW to 45 MW, or 4.1% per annum.
Table 4.1: ELECirrY aIpexq, 1973-83
1973 1976 1979 1980 1981 1982 1983 1973-76 1976-79 1979-83 1973-83- Growth Rate (M)
ics a/Sales, G)h 138.2 146.6 172.6 180.0 182.0 180.2 192.3 2.0 5.6 2.7 3.41mdmn Dend, MW 30.2 32.5 38.0 40.0 41.5 44.6 45.3 2.5 5.4 3.6 4.1Other AreasSales, GWh 65.1 82.4 106.4 115.6 120.8 119.8 120.6 8.2 8.9 3.2 6.4Total Sales, GWh 203.3 229.0 279.0 295.6 302.8 300.0 312.9 4.0 6.8 2.9 4.4
So: JER
4.02 Demand Forecast for Electricity in the Main ICS. During prepara-tion and appraisal of the proposed project, IDA missions undertook adetailed review of power and energy demand for the main ICS and severalregional supply centers. Subsequently, IDA and the Government have agreedon a load forecast for the the ICS, between 1985-1995, wherein demand isexpected to grow by 5.1% p.a. excluding the foreseen electric boiler load,and by 7.5% per annum including boiler electriflcation (see para. 5.07).It is acknowledged by JIRAMA that electric boiler loads made possible bysubstantial surpluses of hydropower from the Andekaleka Hydropower Projectare not to form part of the justification for expansion of generationcapacity in the ICS in the longer term. Demand growth is expected to occuras a result of the project through the provision of additional distributionequipment and materials, and more flexible financing arrangements forconnections, to begin to meet the large backlog of consumer demand for

- 18 -
electricity supply service, as well as through a modest pilot program toexamine the market for electric rice cookers. There is a cumulativeregister of 10,000 applications for electricity supply, including 200commercial undertakings, for whom connection has not been possible due toshortages of distribution materials. Assumptions on which the ICS demandforecast was based are provided in Annexes 4.1, and the detailed forecastitself is in Annex 4.2. The pattern of demand growth in 1980, 1985 andprojected for 1995 is presented in Table 4.2. The composition of demanddid not change greatly between 1980 and 1985, though major changes areexpected over the next decade. As a result of boiler electrification theindustrial share of electricity demand will grow disproportionately to 62%of the total; household demand will also continue to grow strongly,maintaining its share of the market, while the share of commercial demandis expected to decline.
Table 4.2: JD0MA ICS: PATIERN OF MDMD, AC1ULAN) AM ECRED BY aOMii CAM1'RY, 1980-9
Goth Rate Growh RateFM8 mF5 FYBD-F85 FY95 FY85-FY95
Category GWh h X GWh h h h GJh b h
Residential 46 26 61 30 5.7 115 26 6.5ormercil 40 22 44 22 2.2 55 12 2.2IndustralBoilers (0) 0 (0) (0) 0 (0) (97) 35 (22)Other Industry (94) 100 (52) (98) 100 (48) 0.9 (177) 65 (40) 6.0Total industry 94 100 52 98 100 48 0.9 274 100 62 10.8Overall Tbtal Sales 180 100 204 100 w4 100
Total No. Qstomers 75,499 86,882 129,000 (est.)(in the ICS)btal JInMa 119,888 138,416 2D5,000 (est.)
4.03 Generation and Capacity Balances in the Interconnected System.Actual and forecast peak demands in the period 1980-1995 are provided inAnnex 4.3. Peak demand is expected to grow at the rate of about 7% peraanum during the 1985-95 period due largely to the electric boiler program,but also due to renewed growth. Apart from the backlog of domesticconnections, there are important opportunities to substitute electricityfor imported LPG in commercial cooking and for storage water heating. Theproject itself, and new JIRAMA connection financing policies, willstimulate growth in the domestic sector demand for electricity. Capacityand energy balances for the ICS are provided in Annex 4.4. Present firmavailable capacity has been confirmed from operational records for theplant concerned. The hydropower dominated system has experienced highgenerating reliability to date, and the proposed project would provide forspare parts and other works to maintain this record. Hence, a reservemargin established with the biggest unit out of service (22 MW firm) shouldprove acceptable. With this reserve margin, corresponding to about 19% ofcapacity reserve, capacity is sufficient up until 1995, although newcapacity would be required at the latest during 1995. Apart from slightcapacity expansions through efficiency improvements in existing hydropower,this will require investment in new generating plant, interconnection with

- 19 -
other systems then in surplus, or both. A least cost expansion plan studyto be financed under the proposed project would form the basis of decision-making regarding expansion of supply to the ICS. In the interim period, atleast until 1993, there is surplus capacity, and there are very substantialenergy surpluses-always in excess of 40% of demand--through 1995. Theproject seeks to promote means of utilizing these surpluses, as describedabove, without catalyzing untimely and expensive new investments incapacity.
4.04 Demand Forecast for Electricity in the External Zone. TheExternal Zone (ZE) includes other major highlands centers as well as thecoastal towns. The largest are Mahajunga and Tollary on the west coast andToamasina on the east coast, the main port. Between them, these centerscomprise almost 80% of demand in the ZE which, in turn, comprises about 36%of total demand in the public supply system. Demand is expected to growmodestly, averaging about 4% per year, in these major towns, due to thedepressed state of the small regional economies which have only moderateprospects for industrial production and exports (Annex 4.5).
4.05 Demand Forecast for Electricity in the Isolated Zone. TheIsolated Zone (ZI) is comprised of numerous very small do'wand centresserved by diesel plant and lies within the general supply area of the ICS.In the longer term, as demand in these centres expands they will beconnected to the main grid, thus the ZI will always remain comparativelysmall, and is presently about 0.5% of total public sector demand, growingat about 10% per annum (Annex 4.5).
Household Fuels Market
4.06 Household energy comprised 83% of final energy consumption in 1983and is projected to remain close to 80% of end-use through 1995 (see Table1.1). The estimate' composition of household energy consumption in 1979and 1983, and that projected for 1995 is presented in Table 4.3.
Table 4.3: HOUSEHOLD ENERGY CONSUMPTION, ACTUAL AND PROJECTED, 1979-95
1979 1983 1995Energy Source ktoe % ktoe % ktoe %
Firewood 1074.8 87.4 1201.8 87.4 1688.8 84.6Charcoal 99.8 8.1 121.3 8.8 212.8 10.7Electricity 17.0 1.4 21.7 1.6 37.6 1.9LPG 4.2 0.3 1.7 0.1 4.0 0.2Kerosene 34.5 2.8 28.6 2.1 51.4 2.6
Total 1230.3 100.0 1375.1 100 1994.6 100
Firewood for household cooking dominates the household portion of nationalenergy demand and, including charcoal, woodfuels serve 96% of nationalhousehold demand in final energy terms. This situation is unlikely tochange over the next decade except that, with the rapid urbanization beingexperienced, charcoal is projected to supply a greater proportion of finalcooking energy demand, reflecting the preference of a growing lower-middleto middle income urban population. Similarly, while remaining a small

- 20 -
proportion of total household energy demand, domestic use of electricity isexpected to expand as a result of recently revised commercial policiesdesigned to stimulate connection of consumers presently within the ICSregion, and through expanded use of electricity for cooking, both of whichare encouraged by the proposed project. Except where hydropower surplusesexist, the use of petroleum fuels for household cooking is expected torecover and exceed historical levels assuming more stable and efficientoperation of the refinery, or reduced petroleum product costs CIF, makingkerosene and LPG available at lower real prices during this period.
4.07 Cooking Fuel Supply and Demand: Antananarivo. Antananarivo is byfar the largest marketplace for traded household cooking fuels and that forwhich future supply portends the greatest economic burden on the country.As noted in paragraph 1.20, sustainable supply of woodfuels to the Faritanyof Antananarivo is far less than demand, implying continued harvesting ofaccessible prime forest with unknown but possibly serious environmental andeconomic consequences for the sustained productivity of agriculturalecosystems in its hinterland. Annex 4.6 provides estimates of actual andprojected supply and demand to the Faritany of Antananarivo, dominated bythe city i self, for the period 1980-1995. Woody fuels from aging fuelwoodplantations, natural forest and residues meet 96% of present demand in thisregion, though with well planned utilization of other untapped andpotentially sustainable sources--such as residues from industrial pinewoodplantations, wood processing and logging operations, improved forestmanagement and woodfuel tonversion and end-use and expanded use of surplushydroelectricity-the rate of deforestation can be stabilized. Theproposed project is supporting this objective through assistance forproduction of charcoal from pine plantation thinnings and for expandedelectrification of cooking, and through a cooking efficiency program aimedat designing and disseminating efficient wood and charcoal stoves.
4.08 Household Fuels Marketing. Marketing of woodftsels is essentiallycontrolled by the private sector. Similarly, despite publication andpurported regulation of official charcoal prices by the Government,firewood and charcoal prices respond dynamically to the forces of supplyand demand in the open market. The only active interface betweenGovernment and private sector traders is through licensing by themunicipality concerned of urban retail outlets for charcoal and firewood.Even so, substantial numbers of retailers appear to escape regulation,licensing and the associated fees, which are charged per unit floor areaof the retail outlet. The market price reflects the full cost of supply(excluding the full economic cost of primary woodfuel production), plus anyprofit taken at each stage in the supply chain. Generally, fees charged bywoodlot owners to firewood gatherers or charcoalers are well below thereplacement cost of the resource. A graphical representation of thetypical supply chains feeding charcoal and firewood to the urban householdmarket of Antananarivo is provided in Annex 4.7. The woodfuels business isundertaken by a variety of entrepreneurs, from individuals engaged inoccasional production and marketing in the off-crop, season to medium-sizedorganized charcoal production and trading compsaies. The business ishighly competitive and evidence that the number of retail outlets forcharcoal has more than doubled in the 19809 in Antananarivo suggests thatit is expanding rapidly. IDA missions have been monitoring prices in aselection of retail outlets in Antananarivo over the past two years; the

- 21 '-
results show that there is marked seasonality in prices, and nominal priceshave increased sharply, though the underlying trend in real price increasesis observed by relatively poor data on inflation experienced by thecharcoal consuming group.
4.09 The project would provide for the production and marketing of atleast 5,000 tpy of charcoal from pine thinnings in the Haut Mangoro Pineplantation and 1,500 tpy of experimental rice husk briquettes from ricehusks wastes of local milling plants. The marketing of these fuels wouldeither be under contracts negotiated between private sector producers ormanagers of the production process and industrial consumers, such as thecement manufacturer, CIMA, in Antsirabe, or through the regular wholesaleand retail trade described above. There are almost certainly opportunitiesto reduce costs for present private sector traders and to improve theefficiency of supply and marketing arrangements, such as through improvedaccess to credit for transportation and woodfuels production and conversionequipment and materials, and through final effective deregulation of retailmarketing. Thus, the project includes a detailed and comprehensive reviewof the woodfuels business in the Antananarivo region, and for Toliar andMahajunga, three important though quite different supply and tradingenvironments. This component, which is part of a wider household energyplanning program IDA would finance (para. 5.07 (i)), modelled on a similar,successful IDA-supported planning program in Ethiopia, would also establisha regular network of market price monitoring for selected major centers.Recommendations are expected to arise from this review on means to assistthe private sqctor to improve the efficiency of the business and to reducewoodfuel costs.
V. INVESTMENT PROGRAM AND PROJECT
Reference Power Subsector Investment Program (RIP)
5.01 IDA, JIRAMA and the Government held extensive discussions duringthe project appraisal process to define a set of load forecasts for the ICSand major regions and a Reference Power Sector Investment Program (RIP).In the ICS, energy supply will exceed demand until about the year 2000.However, capacity demand will exceed installed capacity in peak hours bythe mid-1990s. No major investment in generation expansion is envisagedfor the ICS in the next 7 years. Hence, understanding and monitoring thecomposition of peak demand, as well as peak load management techniques,assume particular importance, and would be a critical element in planningassistance envisaged under the proposed project. In the ZE, the RIPassumes that a start would be made on the Ambodiroka Hydropower Project by1991, based on the ample economic justification for this project providedby the prefeasibility study completed as part of preparation for theproposed Energy I Project. The only other major new plant envisaged inthe 1986-1992 period is a new diesel power station for the Nosy-BE region,required in 1990-1991. Finally, the major rehabilitation and moderateexpansion of firm capacity and energy of the Volob4 hydropower plant in theToamasina region might be regarded equally as a significant new developmentof the long term power supply capacity of the ZE. The main issue betweenIDA, the Government and JIRAMA in defining the RIP was the absolute leveland relative priority of rehabilitation works for both generation and

-22-
transmission. JIRAA preseated IDA with proposals for procurement of spareparts far in excess of those recommended in the ESMAP Power SectorEfficiency Audit report (para. 5.06) for the 1986-90 period. Afterdiscussion, the Government and JIRAMA agreed with IDA that limitations onimplementation capability, likely subsector donor financing anduncertainties remaining over relative priorities of certain rehabilitationworks imposed a ceiling on the RIP. Accordingly, the agreed RIP was to beregarded as a desirable minimum, and agreement would be sought duringnegotiations that it would be reviewed annually by and with IDA throughoutthe period of the proposed project, especially following the results of theleast cost expansion planning study (para. 5.07(f)). However, ifadditional subsector donor financing became available, the RIP could bemodified to include higher distribution and transmission investments.
The Program
5.02 The RIP for the period 1987-1991 is described in detail in Annex5.1 and suumarized in Table 5.1.
Table 5.1: SUMMARY OF REFERENCE POWER SECTOR INVESTMENT PROGRAM,1987-1991 (FMG billions)
TotalCategory Local Foreign Total US$ mn
GenerationVolobG hydropower 2.95 4.18 7.13 6.87Aimbodiroka hydropower 1.00 5.00 6.00 5.78Hydropower rehabilitation 0.81 6.08 6.89 5.98New diesel power plant 0.36 2.20 2.56 2.22Diesel rehabilitation 1.90 11.96 13.86 12.05Transmission and substations 0.72 2.96 3.68 3.12Distribution rehab./expansion 1.50 14.92 16.41 14.57General plant and services 0.03 5.75 5.78 5.84Institutional strengthening 0.26 1.03 1.29 1.27Studies 0.05 0.98 1.03 1.10
Total 9.58 55.06 64.63 58.80Energy I ProjectComponents portion 4.99 42.71 47.38 42.27
5.03 Works in Progress. Works in progress are as follows:
(a) Generation: Approximately US$1.7 million remained undisbursedfrom Credit 817-MAG, 1978, for the Andekaleka hydroelectric powerproject as of June 30, 1986, and funds from this Credit will beused for additional radio communication facilities between thestation, Antsirabe and Antananarivo to improve operatingefficiency. Some of thesc funds will be used to purchase othermiscellaneous material and spare parts. In addition, JIRAMA hasengaged local contractors to repair the road and power line fromthe powerhouse to the dam, and to remove a small landslide nearthe sub-station, all with local funds. JIRAMA has also commencedpreliminary civil works on the Bezaha mini-hydro project, with a
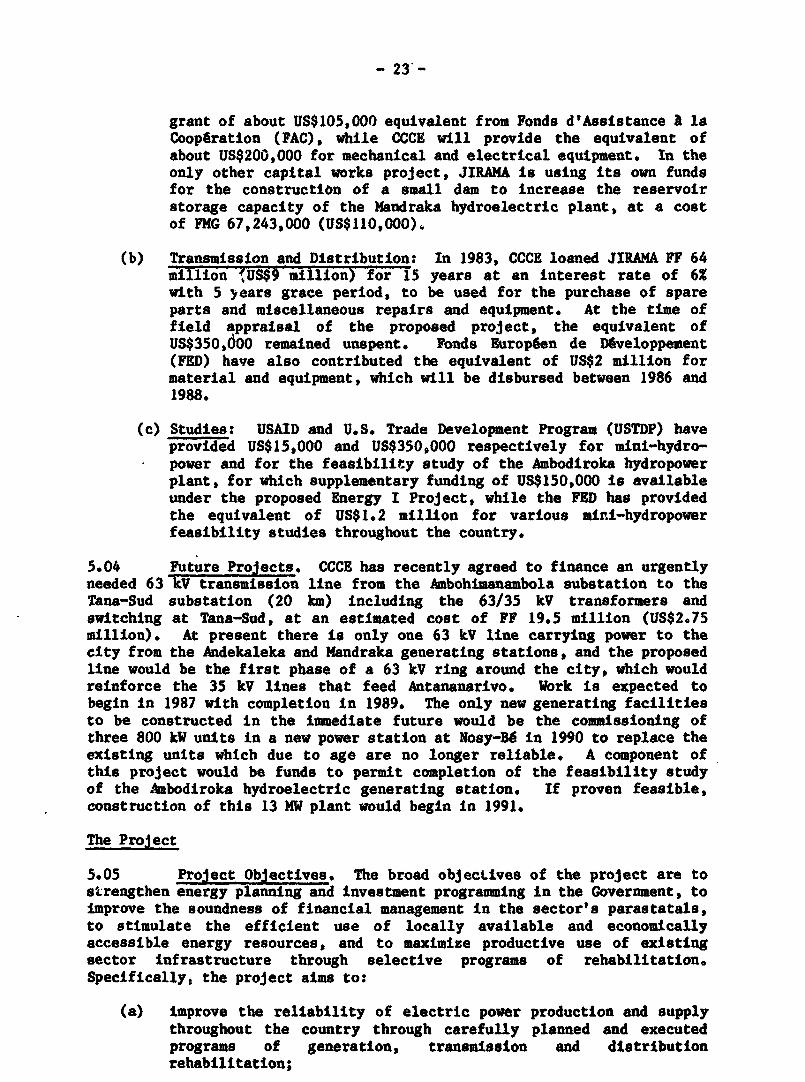
- 23 -
grant of about US$105,000 equivalent from Fonds d'Assistance a IsCooperation (PAC), while CCCE will provide the equivalent ofabout US$200,000 for mechanical and electrical equipment. In theonly other capital works project, JIRAMA is using its own fundsfor the construct10n of a small dam to increase the reservoirstorage capacity of the Mandraka hydroelectric plant, at a costof FMG 67,243,000 (US$110,000).
(b) Transmission and Distribution: In 1983, CCCE loaned JIRAMA FF 64million (US$9 million) for 15 years at an interest rate of 6Xwith 5 years grace period, to be used for the purchase of spareparts and miscellaneous repairs and equipment. At the time offield appraisal of the proposed project, the equivalent ofUS$350,doo remained unspent. Fonds Europeen de DEveloppement(FED) have also contributed the equivalent of US$2 million formaterial and equipment, which will be disbursed between 1986 and1988.
(c) Studies: USAID and U.S. Trade Development Program (USTDP) haveprovided US$15,000 and US$350,000 respectively for mini-hydro-power and for the feasibility study of the Ambodiroka hydropowerplant, for which supplementary funding of US$150,000 is availableunder the proposed Energy I Project, while the FED has providedthe equivalent of US$1.2 million for various mir.i-hydropowerfeasibility studies throughout the country.
5.04 Future Projects. CCCE has recently agreed to finance an urgentlyneeded 63 kV transmission line from the Ambohimanambola substation to theTana-Sud substation (20 km) including the 63/35 kV transformers andswitching at Tana-Sud, at an estimated cost of FF 19.5 million (US$2.75million). At present there is only one 63 kV line carrying power to thecity from the Andekaleka and Mandraka generating stations, and the proposedline would be the first phase of a 63 kV ring around the city, which wouldreinforce the 35 kV lines that feed Antananarivo. Work is expected tobegin in 1987 with completion in 1989. The only new generating facilitiesto be constructed in the immediate future would be the commissioning ofthree 800 kW units in a new power station at Nosy-Be in 1990 to replace theexisting units which due to age are no longer reliable. A component ofthis project would be funds to permit completion of the feasibility studyof the Ambodiroka hydroelectric generating station. If proven feasible,construction of this 13 MW plant would begin in 1991.
The Project
5.05 Project Objectives. The broad objectives of the project are tostrengthen energy planning and investment programming in the Government, toimprove the soundness of financial management in the sector's parastatals,to stimulate the efficient use of locally available and economicallyaccessible energy resources, and to maximize productive use of existingsector infrastructure through selective programs of rehabilitation.Specifically, the project aims to:
(a) improve the reliability of electric power production and supplythroughout the country through carefully planned and executedprograms of generation, transmission and distributionrehabilitation;

- 24 -
(b) increase the utilization of existing surplus capacity and energyby expanding electricity distribution and by encouraging largescale industrial end-uses of electricity wherever economicallyjustified;
(c) strengthen JIRAMA's financial autonomy and stability, andmanagement systems efficiency;
(d) develop within MIEM the capability to prepare and evaluate energysector policies, plans and investment programs for the sector asa whole, and to initiate household energy subsector planning; and
(e) strengthen the capability of JIRAMA to evaluate and comparecompeting options for power supply, to design and revieweconomically efficient maintenance programs, and to prepare leastcost power system expansion plans.
5.06 Project Preparation. The present project scope and objectiveswere largely formulated and agreed with the GOM during the course of theJoint UNDP/World Bank Energy Sector Assessment for Madagascar in late 1984and 1985. The first phase of project preparation was undertaken under IDAcoordination by consultants financed by USAID, FAC, Swedish Agency forInternational Cooperation (BITS), Swiss Government, UNDP and FAO.Analyses establishing the viability and conceptual design of the electricboiler program were completed by Electricite de France in April. The JointUNDP/World Bank Energy Sector Management Assistance Program undertook apower sector efficiency audit in Madagascar, which defined all diesel andhydropower rehabilitation except for the Volobe hydropower plant, alldistribution expansion, and most transmission and distributionrehabilitation needs. Terms of Reference and work scope for thesecomponents will be presented to JIRAMA in December 1986, enablingpreparation for program implementation to proceed with the assistance ofconsultants to JIRAMA to be financed under PPF. Subsequent to the damagecaused by Cyclone Honorinina to the Volob6 hydropower and Tamatave dieselpower stations, the design and specification of rehabilitation andexpansion of the Volobg plant was financed under the first of two PPFs, andundertaken by Coyne et Bellier. During appraisal, IDA agreed to a secondPPF of up to US$500,000 for the provision of consultant services toundertake Phase I of the generation rehabilitation program (see Annex 5.2,page 1), which includes the detailed review, specification and preparationof procurement documents for the supply of spare parts, equipment andmaterials. These will be prepared by June 1987. The Haut Mangoro pinecharcoal feasibility study financed by USAID and UNDP was completed in July1986, and has adequately prepared the project for implementation. Detailedspecification of the energy administration and household energy planningtechnical assistance has been prepared by IDA with assistance from USAIDand FAC consultants. The Government has formally reviewed and agreed theseproposals and helped finalize project documentation, including projectperformance criteria, ready for implementation. A feasibility study hasbeen completed for the rice husk briquetting project which is ready forimplementation. Terms of reference have been agreed with the GOM forindustrial energy audits, the LAC Aloatra regional planning study, and forhydropower feasibility studies, enabling implementation to proceed as soonas funding is available.

- 25 -
5.07 Project Description. The project components are described indetail in Annex 5.2. The project consists of:
Power Components
(a) Generation Rehabilitation and Expansion: New generation plantand power station for the Nosy-Be power supply zone. Repairs todiesel plant in Mahajunga, the existing Nosy-Bg plant, and othersmaller stations, and spare parts for routine maintenance duringthe period of the project in addition to critically neededspares. Manandona, Mandraka and Antelomita hydropower generatingstations will be restored to full operational capacity andeconomically justified repairs will be made to other smallhydropo,'er plant.
(b) Transmission and ?tbstations: Provision of lightning arrestors,switchgear and spare parts, and expanded transformer capacity.Completioia of the rehabilitation of the the 63 kV line betweenAntsirabe and Antananarivo.
(c) Distribution: Distribution reinforcement and expansion in allmajor centers through the provision of materials and spareparts (see Annex 5.2, pages 3 and 6). A pilot project isdesigned to establish new design criteria to lower the cost ofdistribution systems serving household and small commercialconsumers.
(d) General Plant and Services: About 100 vehicles, communicationssystems, maintenance monitoring equipment for diesel plant, newfacilities for the meter laboratory, and computers and softwarefor maintenance management and asset inventory control and forregionalization of computerization for consumer billing and anasset revaluation analysis.
(e) Power Sector Institution Building: About 51 man-months oftechnical assistance for planning and manpower training anddevelopment and up to 36 man-months of consultant services forhydropower resource assessment and development management.
(f) Power Sector Studies: Least cost expansion planning studies andtariff studies for the entire public power supply system, as wellas a hydropower project feasibility study.
Energy Components
(g) Household and Industrial Fuels: Commercial production ofcharcoal from pine plantation smallwood and residues and pilotproduction of rice husk briquettes.
(h) Energy Planning Support: About 63 man-months of technical assis-tance and consulting services, and equipment and materials wouldbe provided to strengthen energy planning and administration inMIEM, and 118 man-months of technical assistance and consultingservices to support the development of household energy supply

- 26 -
and demand management strategies and interventions, and petroleumsupply and inland distribution studies and subsector investmentanalyses.
(i) Energy Sector Studies: Industrial energy audits and energyefficiency investment program preparation and a regional energyplanning study for the Lac Aloatra region would be funded.
Electric Boilers
(j) Electric Boilers: Installation of about 18 MW of electricboilers in four enterprises: PAPMAD, SOMACOU, SavonnerieTropicale, and the Hilton Hotel made possible by hydropowersurpluses in the ICS. Boilers will be owned and operated by theenterprises concerned (see para. 5.13 for implementationarrangements).
Project Cost
5.08 Project costs are detailed in Annex 5.3 and summarized inTable 5.2. This table differs from Table 5.1 in that it represents thatpart of the RIP for which IDA funds and cofinancing has been raised as partof the project, as well as presenting funding for energy sector components.
Table 5.2: PROJECT COST SUMKARY
1NG billions US$ millionsL F T L F T
Base CostCivil Works, Equipment, Materialsand Installation
A. Power Project Components 3.78 37.01 40.79 3.40 33.26 36.65B. Energy Project Components 0.10 0.63 0.73 0.10 0.66 0.76C. Energy Institution Building 1.94 3.40 5.34 1.82 3.40 5.23
Subtotal 5.82 41.04 46.86 5.33 37.32 42.64Engineering and Administration .0.77 1.80 2.57 0.77 1.71 2.48Total Base Cost 6.60 42.84 49.44 6.10 39.03 45.13
ContingenciesPhysical 0.40 2.67 3.07 0.37 2.60 2.97Price 0.43 2.75 3.18 0.35 2.33 2.69Total Contingencies 0.83 5.42 6.25 0.73 4.93 5.66
Duties and Taxes 9.10 0.00 9.10 8.15 0.00 8*15
Subtotal 16.52 48.26 64.78 14.98 43.96 58.94Project Preparation Facility 0.00 0.71 0.71 0.00 0.87 0.87
TOTAL PROJECT COST 16.52 48.96 65.48 14.98 44.83 59.81
Nbte: Inconsistency in totals is due to computer rounding method.

- 27 -
The total cost of the proposed project, includilg physical and pricecontingencies and duties and taxes, and excluding interest during construc-tion, is estimated to be about US$58.0 million, of which US$43.6 million(75%) would be the foreign exchange cost. Base costs are as at January 1,1987 price levels. Price contingencies assume local inflation of 17% for1986-1988, and 15% for 1989-91. Inte-.dtional inflation of 12% for 1986,3%, 1987, 1.0%, 1988-90, and 3.5%, 1991, have been adopted. Adjustments inproject costs have been made to reflect recent devaluation and allowancehas been made for a further 20% devaluation during 1987. The inflationrates applied are considered appropriate for the kinds of goods andservices and works included in the project, and reflect recent experienceof JIRAMA and other Malagasy authorities for similar components.
ProJect Implementation
5.09 Procurement activities would take place under the second PPFcommencing with the employment of the consultants in March 1987. Theirpreliminary assessment of the urgent needs for spare and replacement partswould be followed by ths preparation of procurement documents. Work on allcomponents of the project would follow generally in accordance wvith thedetailed schedule attached as Annex 5.4. The physical execution of theproject, including both energy and power subsector components, would startin July 1987 and would be completed in December 1991. There will beproject management units (PMUs) established within JIRAMA and the MIEM forthe project, although there will be close coordination between the MIEMPMU, PIUs, and the JIRAMA PMU (para. 5.12). The phasing of the projectdescribed in para. 6.08 will have no disruptive effect on projectimplementation. It is only the IDA credit of the Energy I Project whichwould be phased, and the goods designated for release in phase II (seeAnnex 6.6) are not essential to the early rehabilitation programs.
5.10 Implementation of Power Components During project appraisal, theGOM requested and subsequently received in August 1986 approval for a PPFin the amount of US$500,000 to finance expenditures for the study anddesign of the rehabilitation of the Volobe hydropower plant damaged duringcyclone Honorinina in March 1986. Consultants Coyne et Bellier (France)were subsequently retained to carry out this work, Following project fieldappraisal the GOM requested in October 1986 a PPF additional to thatalready approved for the engineering design of the Volobe plant in order toensure timely implementation of required power system rehabilitation bypreparing a list of replacement parts and spares, consumable items, toolsand vehicles, drafting related procurement documents, developing apreventive maintenance program, assisting JIRAHA and the private sectorwith the implementation of the electric boiler program, and assisting MIEMwith the establishment of the PMU.
5.11 The repair and rehabilitation of power facilities would be carriedout primarily by JIRAMA staff, aided in respect to major generating plantrehabilitation by contractors. Consultants would be retained for theoverall management and coordination of the generation rehabilitationproject, and they would be responsible to a Project Manager appointed fromwithin the JIRAMA organization (see para. 5.13). The Project Manager, withsecretarial and clerical support, would constitute the PMU for JIRAMA. Itwas agreed at negotiations that the formal establishment of the PMU in

- 28 -
JIRAMA and the appointment of the Project Manager would be a condition ofeffectiveness of the proposed credit. Work such as the rewinding of theVolobe hydropower plant generators, and repair of some of the dieselengines, would require experts from the original supplier of the equipmentto visit the project sites on an intermittent basis. JIRAMA has sufficientskilled staff to carry out most repairs, although some structural workwould be let to small local civil contractors. For the institutionalstrengthening components of the power subsector portion of the proposedproject, a consulting company would be retained to provide a residentadvisor to the Planning and Economic Studies Division of JIRAMA, and toassist with the coordination of back-up consulting services, and withon-the-job training of JIRAMA staff in power systems planning. Greatemphasis would be placed on direct participation by JIRAMA staff so thatthey may receive'appropriate training during the project.
5.1,2 Implementation of Energy Components The energy components wouldbe executed by various agencies under three ministries and the parastatalagencies concerned. Final responsibility for coordination and supervisionduring implementation would rest with the PMU of MIEM, the institutionalframework for which is described in detail in Annex 3.1. Agreement wasreached during negotiations that, as a condition of effectiveness, the PMUwill have a Malagasy manager satisfactory to IDA and sufficient staff tocarry out its functions. MIEM's PMU Manager will report to the Director ofEnergy and Water, and in turn to the Director General of MIEM. The PMUwill be assisted by a steering committee of five members representing theother divisions, ministries, and agencies involved, including JIRAMA.Following established practice in relations between JIRAMA and MIEM, theMIEM PHU will review, record, and forward to IDA project implementationdocumentation and disbursement requests for the power subsectorcomponents. Each implementing agency would establish a focal point forproject implementation within their existing administrative framework,hereafter referred to as project implementing units (PIUs). In all cases,the PIU would consist merely of the officer responsible for the projectcomponent in the executing agency. The PIUs to be established include:
(a) Ministry of Livestock Production, Water and Forests (MPAEF):carbonization efficiency improvement, sawmill and logging residueassessments, woodfuel business review;
(b) Ministry of Agriculture (MPARA): rice husk briquetting, agricul-tural residue resource assessment;
(c) FANALAMANGA: Haut Mangoro Pine Carbonization Project;
(d) Division of Industry, MIEM: industrial energy audits;
(e) Division of Energy and Water (DEE),, MIEM: energy planning supportand household energy planning program components (includingcooking efficiency).
The PMU would be the local counterpart for IDA and cofinancing agencies,consultants, and contractors involved in the implementation of the energycomponents and would handle all correspondence, progress reports, requestsfor disbursement and procurement activities (Annex 3.1). During the execu-tion of the energy components, the various ministries would be assisted by

- 29 -
experienced consultants and contractors who would work under terms ofreference or technical specifications satisfactory to IDA. Finally,accounting for the energy components will be carried out by the PMU andshould be fully satisfactory to IDA. Anaual auditing would be performed byexternal auditors satisfactory to IDA. During negotiations agreement wasreached that IDA should receive accounts audited by independent auditorswithin six months after the end of each fiscal year.
5.13 Implementation of Electric Boiler Program. The electric boilerprogram would be implemented by the four enterprises concerned-PAPMAD(paper manufacturer), SOMACOU (textile manufacturer), Savonnerie Tropicale,and the Hilton Hotel-with assistance from JIRAMA directed through theJIRAMA PMU. Finance for the boilers will be directed through the NationalIndustry Bank (BNI). The foreign exchange portion will be provided by IDA,and will be channelled through BNI, whereas BNI will provide local currencyfinancing from its own resources. The BNI is a major shareholder in PAPMADand SOMACOU. The enterprises will bear the foreign exchange risk. Eachenterprise has been visited by the EDF feasibility study team and by IDAstaff, and confirmation has been obtained that each is willing to installelectric boilers subject only to satisfactory electricity supplycontracts. JIRAMA staff presented t1r-- enterprises with full documentationof the technical and financial background to individual boiler proposalssix weeks after project appraisal to facilitate the negotiation o'felectricity supply contracts. General terms and conditions of these supplycontracts are outlined in Annex 5.5 and were discussed with JIRAMA and theenterprises. Arrangements and agreements being sought for theimplementation of the boiler program and related conditionality are asfollows:
(i) JIRAMA and the enterprises will define and enter intoelectricity supply agreements in stages linked to projectprocessing as follows:
- a draft or model contract of supply was presented to IDA atnegotiations as a condition of negotiations and,
- signed contracts of supply are to be presented to IDA as acondition of effectiveness.
(ii) Government and BNI are to enter into an intermediary agreement topermit foreign exchange to be channelled to the enterpriseswishing to install electric boilers on which BNI will be alloweda 0.5% margin. Such agreements would also provide that BNIshall, if necessary, make a loan on its regular terms to theenterprise, in which case the enterprise would have to carry theforeign exchange risk. The terms and conditions of loanschannelled through the BNI from the Central Bank to theenterprises in respect of the foreign exchange component atnegotiations are as follows: either (a) IBRD lending rates plus10% of this rate, plus O.5% p*a. representing BNI's commission,with the enterprises bearing full and direct foreign exchangerisk; or (b) the prevailing long term interest rate in Madagascarplus a 3% p.a. margin to cover the foreign exchange risk.
- execution of this intermediary agreement between Government__ &UT fITT? .tJ11 T_ .. P A -

- 30 -
(iii) BNI and the enterprises will enter into lending agreements forany local funds that cannot be provided from their own resourcesboth for the local cost components and for the foreign costcomponents. In respect to local cost components, lending will beon terms agreed with BNI and will not need to be reviewed with orcovered by any agreements with IDA. Where loans are requested,as opposed to the option of cash payment in local currencyequivalent for foreign exchange, the BNI will be bound under theintermediary loan agreement (see (ii) above) to ensure that theenterprises bear the foreign exchange costs. Loans covering theforeign exchange component would be on terms satisfactory to IDAas specified in the intermediary agreement.
JIRAMA has retained the service of Electricitg de Prance (EdF), thedesigners of the boiler program, to help it and the enterprises formulaterational and fair contracts. JIRAMA and its consultants would also assistthe enterprises with the preparation of technical specifications andprocurement documents for boilers and ancillary equipment, spare parts andconsumables which would preferably be procured in one package.
Consultin$ Services
5.14 The execution of the project would require consulting services,over and above those provided in the PPFs advanced after appraisal (para.5.10), for review of final design and preparation of bidding documents,evaluation of offers and selected supervision during construction of thepower physical components, for the execution of the power system planning,asset revaluation and computerization, and regionalization of computerizedbilling components, for preparation and supervision of the physical andplanning components of the energy production and institutional strengthen-ing components, and for energy and power subsector studies using proceduressatisfactory to IDA. The GOM and JIRAMA have agreed to retain consultantsin accordance with IDA guidelines; during negotiations agreement would bereached that consultants satisfactory to IDA would continue to be employedon the project.
Procurement
5.15 Many of the items to be purchased with funds from the IDA Creditare proprietary in nature, and can only be supplied by the original manu-facturer (eg. diesel engine parts). Thus, it would be necessary for JIRAMAto purchase these parts directly from the suppliers for these items. Thetotal cost of items to be purchased in this manner is not expected toexceed US$2.6 million (about 10% of the proposed credit). For other items,specifications for materials and equipment would be assembled into groupsof similar items, and purchased either under IDA's procurement guidelinesfor international competitive bidding for contracts expected to exceedUS$100,000, or for international shopping procedures for items underUS$100,000 where several suppliers would be invited to submit proposals.Thus all contracts larger than US$100,000 would be subjected to IDA's priorreview. There would be several small civil works let to local contractorsthrough competitive bidding advertised locally using proceduressatisfactory to IDA. A summary of procurement methods is presented inTable 5.3. Procurement for items of the project financed by other lending

- 31 -
Table 5.3: P B RKSW MEKOD V/ (US$ millions)
NA. Consul- Cofitan-Item ICB LCB Other b/ C/ tants d/ ciers Ttal
Power Sector Com tsNosi-Be NwDiesel - - - 0.3 - 1.9 2.2
Hydropowr Rohab. 2.9 0.5 0.6 0.2 0.2 - 4.4(2.9) (0.5) (0.6) (0.2) (4.2)
Diesel Behab. 3.2 - 2.0 1.6 0.3 3.5 10.6(3.2) - (2.0) (0.3) (5.5)
Transission - - - 0.6 - 2.5 3.1Electric Boilers 1.5 - - 0.2 0.1 - 1.8
(1.5) (0.1) (1.6)Distribution 3.0 - - 1.3 - 9.9 14.2
(3.0) (3.0)Support Services el 0.6 - - - 0.5 2.0 3.1
(0.6) (0.5) (1.1)Vehicles 1.7 - - - - - 1.7
(1.7) (1.7)T.A. Plamning e/ 0.4 - - 0.3 0.4 - 1.1
(0.4) (0.4) (0.8)Training 0.2 - - - - - 0.2
(0.2) (0.2)Studies - - - 0.1 1.1 - 1.2
_ + ' ~~~~~~~(.1) (1.1)
Subtotal 13.5 0.5 2.6 4.6 2.6 19.8 43.6(13.5) (0.5) (2.6) (2.6) (19.2)
Energy Sector Components1. Energy Planning
ainistration 0.7 - - 0.5 0.7 - 1.9(0.7) - - (0.7) - (1.4)
Housebold Energy 0.6 - - 1.6 1.0 - 3.2(0.6) (1.0) (1.6)
2. Energy ProductionCharcoal e/ 0.7 - 0.1 0.3 - 1.1
(0.7) (0.3) (1.0)Rice Hbsks e/ 0.2 - _ - 0.1 - 0.3
(0.2) (0.1) (0.3)3. Energy Studies
Industrial Energy - - - - 0.6 - 0.6- - - - (0.6) - (0.6)
subtotal 2.2 - - 2.2 2.7 - 7.1(2.2) (2.7) (4.9)
PPF 0.9 0.9(0.9) (0.9)
Overall Tbtal f/ 15.7 0.5 2.6 6.8 6.2 19.8 51.6(15.7) (0.5) (2.6) (6.2) (25.0)
a/ Aomts in parenthesis are IDA-financed.b/ Proprietary spare parts that cmn only be purchased from manufacturers of original
equipment.c/ Dopg and labor to be prvided by local implamnting agency.d/ Consulting servyus tetained in icordance with IMA guidelines.e/ Includes tralning aids d equipment.11 Does not Include duties and taxe

- 32 -
agencies would be purchased in accordance with those agenJies' normalpractices.
Advance Contracting and Retroactive Financing
5.16 Advance contracting would be required for urgently needed spareparts for the two 8 MW diesel-driven generating units in the Tamatave IIIdiesel power station. Until the cyclone of March 1986, these units wererarely operated as the fertilizer plant to which they were to supply powerhad not begun operation. Now that the Volob6 generating station isinoperative, the Tamatave III station is needed to supply power to the portcity of Toamasina. Without additional spare parts and consumable items,estimated to cost US$330,000, there would be restrictions in regional powersupply until VolobG can be returned to full service. An amount notexceeding US$500,000 would be used for retroactive financing.
Financing Plan
5.17 The total foreign exchange cost of the project is US$44.8 million,of which IDA would finance US$25 million equivalent, and cofinanciers wouldfinance US$19.8 million. Cofinanciers are the European Investment Bank(EIB), US$14.4 million, and BADEA, US$5.4 million. However, financing hasbeen obtained for the entire power subsector RIP which, in addition to theabove-mentioned cofinancing, includes parallel financing by CCCE, US$13.5million, and from the Swiss Government, US$1.5 million. 4/ Local projectcosts total US$15.0 million equivalent of which JIRAMA would financeUS$10.5 million equivalent and GOM US$4.3 million equivalent. Localcurrency requirements for the power subsector components would be providedby JIRAMA from its operations, for the Energy Planning Support and theHousehold Energy Planning Program charcoal and rice husk briquettingcomponents by USAID through the application of PL480 funds, and by theGovernment for the remainder of the energy components. Local funds for theelectric boiler component would be obtained by the firms concerned throughlocal commercial borrowing. Table 5.4 summarizes the financing plan forwhich further detail is provided in Annex 5.6.
5.18 During negotiations, agreement was reached (i) that Governmentwould onlend to JIRAIA part of the proceeds of the proposed credit at 1.1times the IBRD interest rate at the time of board presentation and 20 yearsrepayment after a 5 year grace period, and (ii) that BNI would act as anintermediary agent for the Government for private entrepreneurs enteringinto commercial arrangements satisfactory to IDA with FANALAMANGA for car-bonizing pine smallwood. BNI will negotiate terms with the entrepreneurssatisfactory to IDA and similar to those applying to the electric boilercomponent as described in 5.13 above. The local and foreign currencyr3quirements for any FANALAMANGA pilot project undertaken without privatesector participation and approved by IDA, and for the other energy sectorcomponents of the project, would be provided by the Government and passedon to the various implementing agencies as a grant.
4/ The foreign exchange financing arrangements agreed between donors, the GOM andJI4KA for the RIP and the IDA-appraised energy sector components are providedfor reference in Annex 5.6, p. 2. In addition to a small parallel financinggrant from the FED for the energy sector components, the donor financing,including IDA funding, in place for the RIP and the IDA-appraised energy sector
_nnnnantn In TTqAlnA mill4n_n

- 33 -
Table 5.4: SUMMARY OF FINANCING PLAN
IDA OtherItem F JIRAMA GOM A Total
Phase Phase L F L F L F L F TotalI II
Power SectorComponents 9.2 10.0 4.4 - 0.2 19.8 4.6 39.0 43.7
Energy SectorComponents 4.9 2.2 2.2 4.9 7.1
Duties & Taxes 6.1 2.1 8.1 8.1PPF 0.9 0.9 0.9
Total 15.0 10.0 10.5 4.3 0.2 19.8 15.0 44.8 59.8
Disbursement 1
5.19 The proceeds of the IDA Credit would be disbursed over five yearsagainst 100% of foreign expenditure for civil, machanical and electricialworks contracts denominated in all or part foreign currency, and 80% forcontracts denominated exclusively in local currency. Spare parts,materials and vehicles would be disbursed against 100% of foreign expendi-ture and 80% for local expenditure of imported items procured locally.Consulting services, technical assistance and training would be disbursedagainst 100% of expenditure. Each category would be identified separatelybetween JIRAMA and the other agencies to allow easy replenishment of thetwo special accounts (para. 5.19). All disbursement will be fullydocumented except that statement of expenditure (SOB) will be used for allproprietary parts and for local civil works. Documentation of the SOE'swill be kept at the PMUs for verification by TDA supervision missions andby the auditors. The closing date for the Credit would be December 31,1992 and any savings which may accrue due to lower contract prices, or ifall contingency funds are not utilized, would be cancelled. Thedisbursement schedule presented in Annex 5.7 conforms with the standardprofile for Bank loans and IDA Credits for power projects in the Easternand Southern Africa Region. Funds for spare parts, materials, equipmentand vehicles would be disbursed in the second half of 1988, 1989, and in1990, although some high priority items would be received in the first halfof 1988. The funds for the consultants would be required in 1987 through1991. As indicated in para 6.08 the credit would be phased based on twowell-defined investment segments, which would become eligible for financingas JIRAMA ach'eves specific financial performance indicators.
Spcial Accounts
5.20 In order to expedite project execution and give the implementingagencies rapid access to funds under the credit, the Government will opentwo Special Accounts at the Central Bank. Account A for the MIEM PMU willhave an initial deposit of US$300,000 and Account B for JIRAMA will have aninitial amount of US$1,000,000 corresponding to about 10% of creditproceeds. Payments from the Special Accounts shall be made exclusively for

- 34 -
eligible expenditures. The Special Accounts will be replenished by IDA asneeded, in accordance with establishad procedures.
Environmental Aspects
5.21 The power subsector components do not involve any significantenvironmental impact as, for the most part, rehabilitation of existingplant io provided for rather than the construction of new plant. On theother hand, the electric boiler program which would be financed under theproject would have the positive impact of reducing the exploitation offorests in the hinterland of Antananarivo by more than 20,000 tonnes ofwood annually over the next decade. Similarly, the energy production andplanning components place heavy emphasis on defining resources, policies,plans and investments which would lead to more environmentally sound uee ofnatural forest resources for woodfuel production. The charcoal componentenvisaged would displace charcoal produced from untramelled harvesting ofthe natural forest with charcoal made from thinnings and clear-fell small-wood from the Haut Mangoro pine plantation. The pilot project that wouldbe funded could lead in a later phase, if fully successful, to the supplyof about one-quarter of the charcoal needs of the capital city ofAntananarivo, on a sustained basis. The rice-husk briquette pilot projectwould examine the commercial prospect of producing good quality cookingfuels from otherwise discarded cellulosic residues in substitution offirewood and charcoal.
Project Risks
5.22 There is little physical risk associated with this project becausethere would be a minimum of civil works which frequently are the cause ofdelays or significant project cost increases sucb as with unforeseen sub-surface conditions. The main risk to the power subsector components isreally institutional in natfre, in that JIRAMA may have difficulty inadministering the project, alid Government may not promptly allow requiredtariff increases. This risk would be minimized by the employment ofcompetent consultants to assist in supervision of the project, and byundertaking a regular review of JIRAMA's financial position. The onlyother risk is the financial risk of costs exceeding those estimated.However, the nature of the project with its many components is such that ifexperience indicates that costs may exceed the budget, the work andmaterials to be purchased may be reduced in scope during the project, withno detrimental effect on the completed portion. There are also risks withthe electric boiler program typical of such programs, including delays inimplementation leading to reductions in the period during which cheapsurplus hydropower energy and capacity is continuously available, and ofdemands foreseen not fully materializing due to continued poor performanceof the industrial sector. The economic rate of return on the boilerprogram is so high, however, that major reductions in effective boiler lifeand lower demand for steam can be tolerated.

- 35 -
VI. FINANCIAL ANALYSIS
Introduction
6.01 JIRAMA is responsible for all public electricity operations inMadagascar as well as the public water supply. In addition, JIRAMAoperates a light bulb assembly plant and owns a subsidiary whichmanufactures electrical appliances and water meters. JIRAMA' s auditedfinancial statements consolidate all of these activities, but separateaccounts are kept for electricity, water supply, and appliances and meters;for the light bulb assembly separate pro-forma statements were preparedduring project preparation. The financial analysis of JIRANA focusses onits electricity activity plus light bulb and appliance manufacturing.
Financial Position and Past Operating Results of JIRAMA
6.02 JIRAMA's audited operating results for 1983-1986 are summarizedin Table 6.1.
Table 6.1: JIRAMA - SUMMARY OF INCOME STATEMENTS (ELECTRICITY ACTIVITY)
1983 1984 1985 1986 a/
Units sold (GWh) 312.9 315.7 330.0 331.4Average Revenue (FMG/kWh) 44.4 48.1 59.7 61.8
FMG billionOperating Revenue 13.9 15.2 19.7 20.5Operating Expenses
Fuel 3.8 4.6 5.3 6.1Labor 2.2 2.5 2.5 2.9Other , 1.9 2.5 2.7 3.2Depreciation 3.9 3.7 4.3 4.8
Subtotal 11.8 13.3 14.8 17.0Operating Income 2.1 1.9 4.9 3.5Less: Non-Operating Expenses (Income) 0.3 0.0 0.0 2.8 b/
Interest 5.3 5.4 5.8 5.4Net Income (Loss) (3.5) (3.5) (0.9) (4.8)
Return on Revalued Assets (%) 1.9 1.5 3.7 3.5Debt Service Coverage (times) 0.8 0.7 0.5 0.7Contribution to Investment (X) (50) (67) (472) (105)
a/ Preliminaryb/ Divestiture of light bulb, appliance and meter operations.
Rates of return on revalued assets during 1983-86 were 1.9%, 1.51, 3.7%,and 3.5% respectively as against the 81 return stipulated under theAndekaleka Project (CR 817-MAG) which were relaxed to 5% for 1985. Thesomewhat higher returns in 1985 and 1986 reflect the tariff increases inFebruary 1985 of between 101 and 152. However, return on assets ispresently not a meaningful performance indicator because the asset base issignificantly overvalued due to overinvestment in generating plant. Adetailed study on asset revaluation proposed under the project (para.

- 36 -
5.07(d)) will address this issue, and it would be agreed with the GOM andJIRAMA during negotiations that the revaluation and computerization of theasset base would be completed for IDA review by June 30, 1989. While thecompany is generating cash from operations, the amount is insufficient tocover financial charges~ and thus the annual net income is negative anddebt service cannot be covered from internal sources. Accordingly, thereis also no internal contribution to investment, all of which is financedfrom sources external to the company. Notwithstanding the weak financialperformance, JIRAMA's financial management has improved greatly in recentyears and the company has implemented the tariff adjustments that werepermitted by Government. Also, some problems are not of JIRAMA's making,e.g. payment arrears by Government and municipalities (para. 6.05 (c)).
Tariff Structure and Policy
6.03 Operating costs are dominated by fuel which represent about 50%of all cash operating expenditures. Non-technical losses are negligible.In 1985 JIRAMA paid an average of US$227/t and US$340/t equivalent for fueloil and diesel respectively, including an estimated tax content of 10% and22% respectively. In addition, fuel costs increased in local currencyterms as the FMG depreciated against the US$ by about 50% between 1983 and1985. Fuel prices in 1986 have remained at the 1985 level as the effectsof the 17.8% devaluation of the FMG have not been passed on to JIRAMA bySOLIMA. Electricity supply in Madagascar is further taxed in the form ofduties between 23% and 41% on imported equipment, and an added value tax aswell as consumption charges. The latter two increase the average consumerbill by about 17% over and above the levels indicated in the summarizedincome statements of Table 6.1. As a result of high fuel, taxation andother costs, Malagasy consuiars paid on average about 9.1 US*/kWh in 1986,although this was still not sufficient to produce a reasonable financialsituation for JIRAMA. Principal objectives of tariff reform are to fixtariffs close to economic costs; to stimulate demand in regions of surplussupply; and to greatly simplify tariff structure and administration. Shortrun marginal costs in the ICS are estimated at close to zero because of theAndekaleka related hydropower surplus. Good estimates of long run marginalcosts here and marginal costs elsewhere are presently not available,although it is not expected that they would be significantly above presenttariff levels. Thus the tariff policy pursued later in this chapter aspart of JIRAMA's financial rehabilitation attempts to steer a middle coursebetween consumers and JIRAMA's shareholder in distributing the burdenrather than one which is driven by a specific long run marginal costrationale. However, economic costs of supply will be established duringthe least cost expansion planning studies under the proposed projectproviding a basis for the proposed tariff reform (para. 6.04). The fiscalpolicy implications of required modifications in the distribution and levelof direct taxation of electricity will be examined in consultation with theIMF. Following revision and computerization of the asset base, it isanticipated that from 1989 onward a return on assets criterion will beresumed as a basis for determining overall revenue requirements.
6.04 JIRAMA's tariff structure is complex; several hundred tariffsexist, which were retained from the independent utilities in existenceprior to JIRAMA's creation in 1975. Large differences exist betweentariffs; tariff levels are historically based and bear virtually no

- 37 -
relationship to the cost of supply. Tariff increases in recent years wereapplied uniformly across the board. Present tariffs are cumbersome andcostly to administer. Consumer complaints also result from the presentstructure, since in the extreme, electricity tariffs on one side of thestreet may be significantly higher than on the other side of the street.Most importantly, the tariffs cannot be used by JIRAMA as a demandmanagement tool. A first round of tariff simplification has beenimplemented as a condition of negotiations (Table 6.3), and a tariff reformstudy under the project (para. 5.07 (f)) will propose a strategy forimplementing a rational tariff structure.
6.05 JIRAMA's financial position for 1983-86 is summarized in Table6.2.
Table 6.2: JIRAMA - SUMMARY OF BALANCE SHEET (ELECTRICITY ACTIVITY)(FMG billions)
1983 1984 1985 1986 a/
AssetsCurrent AssetsCash 0.5 0.6 0.6 1.5Accounts Receivable
- Administrative (est.) 6.6 5.4 8.1 11.0(Govt. & Municipalities)
- Other 1.2 0.9 1.5 0.8Inventory 4.6 6.6 7.8 8.2Other 0.7 2.8 3.2 1.2
Subtotal 13.6 16.3 21.2 22.7Net Fixed Assets 112.8 126.7 142.3 167.4Work in Progress 5.9 6.1 3.2 2.6Investments in Subsidiaries 2.1 2.3 2.8 -Other 0.1 0.1 0.1 0.1
Total Assets 134.5 151.5 169.6 192.8=== 8..
Liabilities and EquityCurrent LiabilitiesOverdraft 2.7 2.7 1.7 -Payables 6.7 7.1 5.9 6.4Other 2.7 3.1 5.2 6.3Accrued Interest 8.6 11.6 3.2 0.8Current Portion of Long Term Debt 6.0 11.3 6.3 4.2
Subtotal 26.7 35.8 22.3 17.7Long Term Debt (net) 65.9 82.3 78.4 90.6Other 0.4 0.4 0.5 0.5Equity and Retained Earnings 41.5 33.0 68.4 84.0
Total Liabilities and Equity 134.5 151.5 169.6 192.8m
Current Ratio 0.5 0.5 1.0 1.4Debt:Debt and Equity (X) 63 74 55 53Accounts Receivable (days) 224 161 197 230
a/ Preliminary

- 38 -
JIRAMA, which has been chronically short of liquidity, has a number ofstructural financial weaknesses:
(a) Accounts receivable are very high, as Government and municipalityarrears represent 12-14 months of sales to these customerswhereas other arrears are around 1.5 months; the most recentrelief occurred in 1984 when public arrears of FMG 3.2 billionwere settled.
(b) Payables, most of which represent obligations towards SOLIMA forfuel deliveries, are also very high; as of end-1986 JIRAMAarrears vis-a-vis SOLIMA represented about 12.6 months of fuelconsumption equivalent.
(c) A significant portion of other current assets and liabilitiesrelates to various tax, duty, surcharge payables/receivablesbetween JIRAMA and the Government as well as JIRAMA and themunicipalities, and these items are being held back or cannot becollected until a trilateral clearance of accounts takes place.
(d) The investments in subsidiaries which include light bulb,electrical appliances and water meter manufacturing are highlyunprofitable; investment increases between 1983 and 1985 arelargely due to operating subsidies provided by JIRAMA.
(e) To compensate for operating cash shortfalls the company has hadto rely significantly on an overdraft facility with BNI thatcarries an interest rate of 21X.
(f) Due to the lack of funds, JIRAMA has failed to comply witb itsdebt service obligations on virtually all its loans onlent by theGovernment. This situation was partially corrected in 1985 and1986, when the Government made compensating equity contributionsof about FMG 22.3 billion and 9.1 billion respectively. Theunderlying structural deficiency is that the Andekalekabydropower asset for which most of the debt was incurred(including the IDA Credit 817-MAG), is currently performing atonly 35-40% of capacity due to lack of demand in the ICS(para. 4.02). The onlending of the IDA credit and other sourcesof funds with JIRAMA carrying the foreign exchange risk andsubstantial FMG devaluation have exacerbated this situation.
Financial Restructuring of JIRAMA
6.06 To restore JIRAMA's short and medium-term financial viability, aset of reform measures is proposed under the project. Since theirimplementation is a prerequisite for achieving project objectives,conditionality has been attached to them as indicated in more detail foreach measure below. The specific objectives of the reform package are:(i) a positive contribution to investments by 1988, and of about 30% after1989; (ii) a return on revalued net fixed assets of not less than 82 by1990 following the detailed study on asset revaluation proposed under theproject, (iii) a minimum current ratio of 1.1 and a minimum debt servicecoverage ratio of 1.2 by 1988 and 1.4 by 1990; and (iv) the reduction of

- 39,-
accounts receivable and payable to 90 days of electricity sales and non-payroll cash operating e*penditures respectively by 1988. The program'scomponents and the conditionalities on which agreement has been reachedwith JIRAMA and the Government are given in Table 6.3 and are furtherdescribed in Annex 6.1.
Table 6.3: FDtNNIAL RZS1VRl1EOF JDAMA
Massue Statw of Iupl ictatin
1. capital inese of FMG 7.42 bIUkn in In apetd1986
2. -odolideinn of dsht term debt emented
3. RBPc A8&z1itg of princpl "8y3t ImiateMd(JIRM to Gmenwt) on AxIdm andNrnm=a lowns in lite wth capityutilzatim of ases
4. PedutIi of 1986 estt pro by p dPMG I bilUixn
5. Pbdwtiw of imhor of tarffs by 5(1 plieiated
6. 17 tarff incnese for 1987 l4leumted
7. Divetiture of light bilb, electic GQwermnt will bear finai losmes nouWedappliane and watr eter peratios after March 3, 1987. Icnmmic viability and cam-
eswdal fute of thme eterpries will bestu d and disonse with IDA In the cmtsxt oftie lukstriAl Sect Adjustmnt Credit (1541 M19)by Mach 31, 1988.
8. Capital incwrse of DM 4 billkn in 1987 Qmditkn of effectivais
9. Tariff inrease for 1988 of not les than Ravish ev "mc of decison by effecti sZ and a abnation of caital increase ilqmant decison by Jamay 1, 1988
and imort duty enqion of r1ehbilta-ton spares and 1te1al to esure that(i) dur'ng FM JIR ill gumae frmintral soures not less thu 1% of itsInvestmut pra for FM8B; and (ii)JIW will bae at its dispositioadequiate fumKI to ewver tde localeiqieoiflzre requiremusis Sof ascihInvwest pn
10. Settleunt of arreas betwam JRD4, OCM 51 o& aflggfte anr"s setled by credit efect-and umc ies. ivwess, rmindaer 'etled by Se"temir 30, 1987
11. imtotimi of ne pant uodaitias CcAition of effectivemuessfor eletriity bLUs
12. evaluati of asset By J 3D, 1989
Ii u _. _ _ _ _ . - --- - - -

- 40 -
Future Financial Position and Operations of JIRAMA
6.07 The projected financial statements of JIRAMA for 1987 through1992 together with notes and assumptions used in these stetements arepresented in Annexes 6.2 through 6.5. Selected indicators are shown inTable 6.4. The cash contribution to investment, which in the past has beennegative, will become positive by 1988 and increase to between 30% and 40%by 1990. The projected rate of return based on an estimated adjusted assetbase would be around 10% in 1987, but generally around 5% pending theresults of the asset revaluation study. The debt/debt plus equity ratiowill be between 57% and 69%, which is acceptable. The projected currentratio at not less than 1.3 and debt service coverages increasing from 0.7in 1986 to 1.5 by 1990 are satisfactory. To achieve financial viability inthe face of devaluations and significant local inflation (Annex 6.5),JIRAMA will require regular annual tariff increases after 1987 of between9% and 24% plus a series of capital increases expected to total FMG 18billion during 1987-1990, including FMG 4 billion in 1987 (Table 6.3). Thelarge capital increases to be made by Government for JIRAMA are an integralpart of the debt relief component of the JIRAMA financial reform package.They do not imply cash transfers from Government to JIRAMA but ratheroffsetting arrangements against JIRAMA's debt service owed to Government inrespective years. Since the Government's own debt service obligation inrespect of this debt is minimal during this period and JIRAMA was in anycase unable to service its debt to Government, there is no issue ofGovernment affordability in the face of its present situation of tightmonetary constraint. As a result of measures proposed under the projectJIRAMA will in the future be able to service its debt oblig4tions vis-a-visthe Government and would continue to make substantial contributions tofiscal revenues through taxes levied on electricity sales (para. 3.10).
Table 6.4: JIRAMA FINANCIAL PROJECTIONS - SELECTED INDICATORS(FMG billions)
1986 1987 1988 1989 1990 1991 1992
Electricity Sales 18.7 23.4 27.6 36.5 44.1 52.2 66.3Internal Contributionto Investment (6.1) (0.4) 0.6 2.7 5.2 6.5 9.4
Investment ProgramContribution to Investment (%)-annual (M) (89) 5 3 15 33 60 343-year weighted average (%) (79) 3 4 15 35 36 40
Debt Service Coverage (times) 0.7 1.6 1.2 1.3 1.4 1.4 1.5Current Ratio 1.4 1.7 1.5 1.5 1.5 1.5 1.3Debt/Debt & Equity (%) 53 57 61 65 67 68 69Projected Average Tariff Increases (X)- Nominal - 17 9 24 12 12 22- Real (17) 0 (8) 9 (3) (3) 7
Rate of Return (%) 3.5 10.8 4.6 4.8 4.9 5.1 8.4Capital Increases 9.1 4.0 7.6 4.6 2.3 2.0 2.0Domestic Inflation 17.0 17.0 17.0 15.0 15.0 15.0 15.0
Note: Proposed nominal tariff increases during 1986-1992 imply a 14%reduction in real termbs.

- 41 -
Project Phasing and Financial Covenants
6.08 JIRAMA's actual financial performance will be monitored duringproject implementation and an annual review process will be undertakenjointly by JIRAMA, GOM, and IDA to ensure that the company maintains asound financial position. Agreement on the review process and associatedcriteria has been reached with JIRAMA and GOM during negotiations and isreflected in six formal measures being either financial covenants or condi-tions of effectiveness and disbursement. The first measure establishesthat the investments to be financed by the credit will be phased in twowell-defined phases) with the first phase, comprising US$15 million ofinvestments, to be undertaken upon credit effectiveness, and the secondphase of US$10 million to become eligible for financing subject to meetingother specified financial performance criteria. The financial performancecriteria targeted for effectiveness are: (i) that internal funds genera-tion is sufficient to make a positive contribution to the investmentprogram of 1988 and that capital increases in 1988 cover the local cost ofthat year's investment program, and that (ii) JIRAMA's debt servicecoverage ratio for that year is not less than 1.2. This is expected torequire a capital increase of 4 billion in 1987, and for 1988 a combinationof import duty exemption on rehabilitation spares and capital increasesyielding about 7.6 billion FMG, plus a tariff increase of not less than 9%as of January 1st of that year. The second phase of investment will becomaeligible for financing if revenue increases and other measures are adoptedwhich will lead to (i) a generation of funds from internal sources suffi-cient to contribute not less than 15% to the 1989 investment program; and(i) a debt service coverage ratio for that year of not less than 1.2; and(iii) as agreed during negotiations, the outstanding issue between theMunicipality of Antananarivo and JIRAMA of disputed ownership of all waterAnd electricity networks and installations should have been resolved in adefinite matter. The goods to be included in the proposed second phase arelisted in Annex 6.6. These include distribution materials, vehicles,diesel plant spare parts and computers and related services which can beeasily prepared as discrete packages for procurement and implementation.Urgently required spare parts and distribution materials are provided bycofinanciers, or through parallel donor financing, during the period of thefirst phase of the proposed credit. The magnitude and required timelinessof the financial measures to be adopted to ensure the short to medium termfinancial viability of JIRAMA is deemed to warrant phasing of the project.The proposed phasing is In synchrony with the annual in-depth IDA reviewsof JIRAMA's financial performance, which will lead to a determination ofthe precise measures to be adopted to meet the performance criteriarequired for undertaking the second phase of investment.
6.09 The second measure, a financial covenant, stipulates that JIRAMAduring each year after 1989 (i) maintain a rate of return of not less than8% on net fixed revalued assets as indicated by the asset revaluation studywhose results would be available by June 30, 1989, (it) generate funds frominternal sources of not less than 30% of the average of that year's invest-ment program; and (iii) maintain a debt service coverage of not less than1.4. The third measure is a covenant, stipulating that prior to September30 of each year, GOM will review with IDA whether JIRAMA would meet thecovenant requirement set out as the second measure above for the ongoing aswell as upcoming phase of investment. If the review were to show that therequirement would not be met, JIRAMA and CON would need to promptly takeall necessary measures, including tariff adjustment, in order to meet such

- 42 -
requirements. The foveth measure is a covenant confirming that JIRAMA villseek IDA approval foe changes in the agreed investment program of any givenyear if such changes represent more than the lesser of either 1% ofJIRAMA's net fixed assets or US$2 million. The fifth measure is afinancial covenant, whereby JIRAMA agrees that it will not incur any debtwithout IDA's agreement unless reasonable financial projections indicatethat the debt service coverage, including the new debt, will not be lessthan 1.4 times in any given year of the projection period. The sixthmeasure is a financial covenant, whereby JIRAMA agrees that it will reduceits accounts receivable by 1988 and maintain it thereafter to no more than90 days of sales and its account payable to no more than 90 days of non-payroll cash operating expenditures.
VII. ECONOMIC JUSTIFICATION
A. Power Subsector Economic Analysis
Average Incremental Cost Analysis
7.01 As there is no current least cost expansion plan it is notpossible to determine a long run marginal cost (LRMC) of supply. Moreover,with large surpluses of power and energy in the largest supply zones, anaverage incremental cost (AIC) calculation is not a particularly usefultool for financial management and planning. For reference, however, an AICcalculation has been performed for the entire JIRAMA system and for the ICSalone, and the results are presented in Annex 7.1.
Average Incremental Cost$12X discount rate)
US cents/kWh PMG/kWhOverall Power System 5.7 36.0Interconnected System 3.8 23.8
Return on Power Subsector Investment
7.02 The calculation of an economic rate of return (ERR) for theproject was based on the overall power subsector investment approved andappraised by IDA, known as the reference investment program (RIP), for theperiod from 1987 through 1992. Two ERRs were calculated: one for the powersystem as a whole and one for the ICS.
7.03 The measure of benefits applied was projected revenues inconstant terms, based on projected tariffs. This measure underestimatesthe economic benefits of electricity supply as it does not include anyconsumer surplus. RIP investment costs are in constant January 1987costs, with a conservative estimate of the shadow rate of exchange of 1.3applied to foreign costs. Operating and maintenance, customer-related andadministration costs, and fuel and oil costs are applied in constant pricesat their estimated economic value.
7.04 The ERR for the entire JIRAMA system is 33Z and for the ICSalone, 461. These ERRs are high because of the distortion in financialprices for key Inputs, such as fuel and oil, and the sunk cost effect of

- 43 -
substantial hydroelectric and diesel electric generating plant which willbe used to meet much of the incremental demand for energy and capacityforeseen during the 1987-1992 period. A detailed analysis and discussionof assumptions applied is provided in Annex 7.1.
Economic AnalZsis of Volobi Hydropower Plant Rehabilitation
7.05 The Volobd hydropower plant sustained severe damage during acyclone-caused flood in March 1986. After an initial screening, it wasagreed with JIRANA that the only options that reasonably apply in the shortterm to meet demand in the Toamasina region are either completerehabilitation of the Volob6 plant, with additional civil works to avoidfuture flood damage, or diesel generation using the existing 16 MW of heavyduty diesel electric generating plant presently installed in the TamataveIII power station. A discussion of the options and details of the economicanalysis are provided in Annex 7.2. The results summarized below indicatethat rehabilitation of the Volobe hydropower is the least cost solution forsupply of power to the Toamasina region.
Present Value of Total Costs(121 discount rate, US$ millions)
Economic Analysis Financial AnalysisVolob6 Rehabilitation 3.45 4.29All Diesel Generation 6.32 10.46Equalizing Discount Rate 22.9% 35.1%
Ele"tric Boiler Program
7.06 The electric boiler program will utilize a substantialproportion of the surplus hydropower capacity and energy in the ICS. Theinstallation of five boilers with a combined capacity of 21 MW willIncrease ICS sales by 50% (96 GWh), generate US$1 million per yearadditional net revenue for JIRAMA, and reduce foreign exchange requirementsfor imported oil by about US$750,000/year at low 1986 prices. Electricboiler installations would also be profitable ventures for their privatesector owners and operators, replacing imported fuel oil or diesel fuel,fuelwood, and providing savings through avoided costs for new oil-firedboilers and ancillary equipment. In addition, boiler electrification willsignificantly reduce regional deforestation by displacing fuelwood demandof about 20,000 tpy. The economic analyses made to determine the viabilityof an electric boiler program are discussed, and the results are presentedin detail in Annex 7.3. The results of these analyses are summarizedbelow.
Overall Electric Boiler Program - Rate of Return
Economic Financial (Return to Enterprises)
Case A: No Industrial Recovery 49% 61%Case B: Forecast Recovery 63% 107%
These analyses, plus switching value analyses performed on key costvariables for each sub-project, Indicate clearly the economic viability ofthis program.

- 44 -
Economic Analysis of Antananarivo-Antsirabe Transmission Line
7.07 Antsirabe is connected with the ICS at Antananarivo by a63 kV line now 13 years old, and capable of carrying about 12 MW firmpower. Peak demand in Antsirabe is about to exceed this amount, thoughdemand is growing slowly. In addition to making minor repairs to thepresent transmission line, upgrading its capacity slightly, and extendingits life a further 20 years, future demand can be met either by theaddition of a 138 kV line or by incremental diesel generation. Theeconomic analysis made to determine which of these is presently the leastcost solution for incremental power and energy supply is discussed indetail in Annex 7.4. The results are as follows:
Present Value of Costs(12% discount rate, US$ millions)
Economic Analysis Financial AnalysisAdditional 138 kV line 12.5 6.51Supplemental diesel power 9.8 6.46
The results indicate that at present a 138 kV line is not economicallyjustified to secure power supply to Antsirabe and that diesel generationduring peak hours plus expansion of the diesel power station at Antsirabeis the least cost solution.
Economic Viability of New Household Power Supply Connections
7.08 As part of a program to utilize substantial hydropower surplus inthe ICS, JIRAMA proposes to mount an aggressive program to connecthousehold consumets. Due to,past shortages of materials and equipment, thedemand for household electricity connections has exceeded the annual levelof supply of about 2,500 by more than 5,000. An ERR has been made for newconnections using JIRAMA's experience of the average and present short runmarginal capital cost of distribution connections-US$650 and US$400,respectively-including all cost from the distribution transformer tointernal wiring, and allowing for the recovery of about 13,000 meters fromnow redundant double metered installations. In these analyses the averageconsumption rate of new connections is taken as 40 kWh/month, compared tothe average for Antananarivo of 89 kWh/month, and the SRMC of surplushydropower is taken as zero. The average household tariff in Antananarivowill be 18 US¢/kWh before taxes and after IDA proposed tariff increases.The *ERRs range from 15-30% given these assumptions, and with consumercontributions to connection charges, the FR*s are higher still, indicatingthat a program to meet the backlog of registered consumer demand forelectricity supply is financially and economically robust.
Economic Viability of Rehabilitation Programs
7.09 Due to long term shortages of foreign exchange for spare partsand routine expansion for' generation, transmission and distributionfacilities, diesel plant failure and system outages have reached criticalproportions. Regular power supply to several major diesel power-suppliedzones can no longer be guaranteed. Important losses of export productiondue to sustained outages have been reported in 1986. The economic
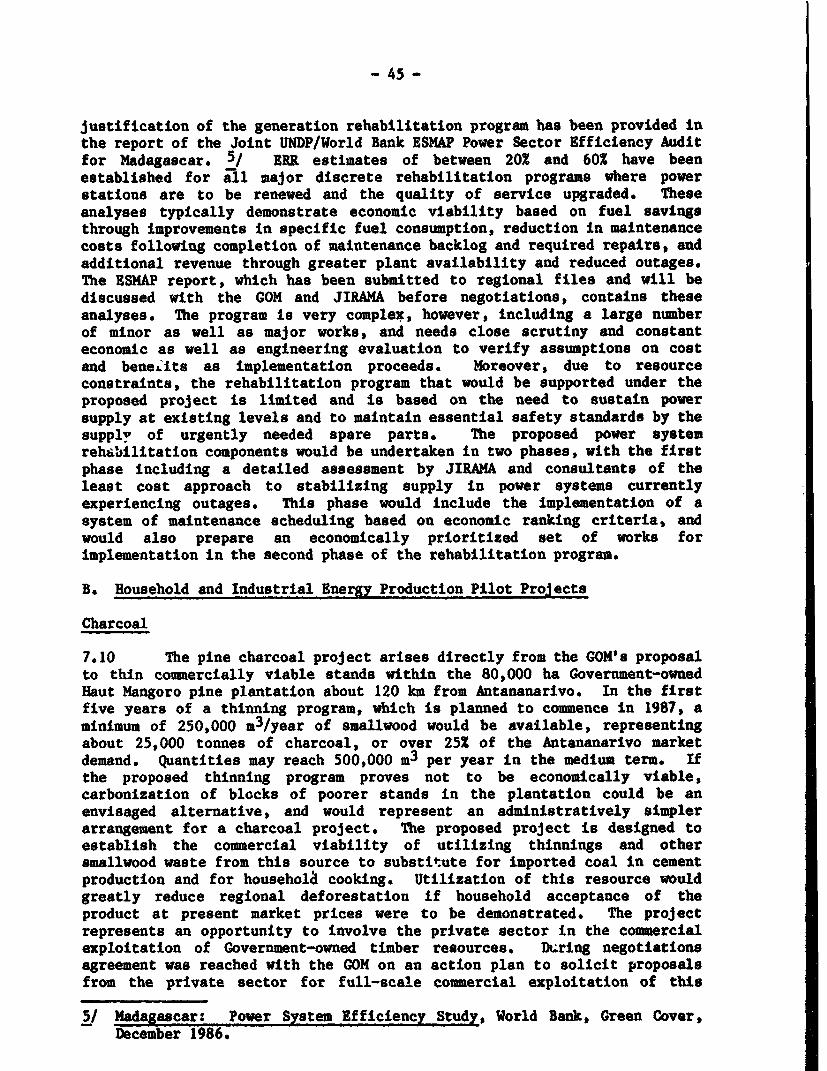
- 45 -
justification of the generation rehabilitation program has been provided inthe report of the Joint UNDP/World Bank ESMAP Power Sector Efficiency Auditfor Madagascar. 5/ ERR estimates of between 20% and 602 have beenestablished for al major discrete rehabilitation programs where powerstations are to be renewed and the quality of service upgraded. Theseanalyses typically demonstrate economic viability based on fuel savingsthrough improvements in specific fuel consumption, reduction in maintenancecosts following completion of maintenance backlog and required repairs, andadditional revenue through greater plant availability and reduced outages.The ESMAP report, which has been submitted to regional files and will bediscussed with the GOM and JIRAMA before negotiations, contains theseanalyses. The program is very complex, however, including a large numberof minor as well as major works, and needs close scrutiny and constanteconomic as well as engineering evaluation to verify assumptions on costand bene,lts as implementation proceeds. Moreover, due to resourceconstraints, the rehabilitation program that would be supported under theproposed project is limited and is based on the need to sustain powersupply at existing levels and to maintain essential safety standards by thesupplv of urgently needed spare parts. The proposed power systemreh4bilitation components would be undertaken in two phases, with the firstphase including a detailed assessment by JIRAMA and consultants of theleast cost approach to stabilizing supply in power systems currentlyexperiencing outages. This phase would include the implementation of asystem of maintenance scheduling based on economic ranking criteria, andwould also prepare an economically prioritized set of works forimplementation in the second phase of the rehabilitation program.
B. Household and Industrial Energy Production Pilot Pro ects
Charcoal
7.10 The pine charcoal project arises directly from the GOM's proposalto thin commercially viable stands within the 80,000 ha Government-ownedHaut Mangoro pine plantation about 120 km from Antananarivo. In the firstfive years of a thinning program, which is planned to commence in 1987, aminimum of 250,000 m3/year of smallwood would be available, representingabout 25,000 tonnes of charcoal, or over 25% of the Antananarivo marketdemand. Quantities may reach 500,000 m3 per year in the medium term. Ifthe proposed thinning program proves not to be economically viable,carbonization of blocks of poorer stands in the plantation could be anenvisaged alternative, and would represent an administratively simplerarrangement for a charcoal project. The proposed project is designed toestablish the commercial viability of utilizing thinnings and othersmallwood waste from this source to substitute for imported coal in cementproduction and for househola cooking. Utilization of this resource wouldgreatly reduce regional deforestation if household acceptance of theproduct at present market prices were to be demonstrated. The projectrepresents an opportunity to involve the private sector in the commercialexploitation of Government-owned timber resources. During negotiationsagreement was reached with the GON on an action plan to solicit proposalsfrom the private sector for full-scale comercial exploitation of this
5/ Madagascar: Power System Efficiency Study, World Bank, Green Cover,December 1986.

- 46 -
resource. If however, after the implementation of this action plan, and bythe end of 1987, full-scale private sector involvement is not achieved, forreasons acceptable to the Association, a commercial scale pilot projectinvolving both FANALAMANGA and private sector smallholders is envisaged.The pilot project would achieve a minimum production of 5,000 tpy by theend of four years. Feasibility study economic analyses indicate that theproject would achieve ERRs exceeding 50% under a wide range of sensitivityanalyses for major parameters, including varying scale of production, andwould yield FRRs of 20-30% if market acceptance is achieved in accordancewith the results of thorough consumer trials. Full details of the economicanalysis are provided in the feasibility study which has been discussedwith the GOM.
Rice Husk Briquettes
7.11 A small pilot project of 1,500 tpy is proposed to examine theeconomic viability of producing firewood, charcoal and fuelwood substitutesfrom rice husks presently discarded in the region of Antananarivo.Comparative economic analyses provided in Annex 7.5 show that the economiccost of production is about 85% that of firewood and charcoal although thefinancial cost is 22-36% higher depending on the range of size andoperating hours of the plant concerned. With prices of firewood andcharcoal escalating at greater than 5% per year in real terms, a smallcommercial scale pilot project is justified in order to fully evaluate theestimated high economic value of this option economically justified.
VIII. AGREEMENTS REACHED AND RECOMMENDATIONS
Agreements
8.01 During negotiations agreements were reached by IDA, the Governmentand JIRAMA that:
SAR LegalAgreement para. Document
(a) GOM will onlend to JIRA*A US$17.9 million 5.18 CA 3.01 (C)equivalent under terms and conditions which havebeen agreed by the Association, including afinal maturity of 25 years, five years of grace,an interest rate of 10% above the IBRD rate oflending at the date of the Board presentationand with the foreign exchange risk to be borneby JIRAMA.
(b) GOM shall send to IDA not later than six 5.19, CA 4.01months after the end of each year audited 5.20, (b) i, ii,accounts of the execution of the project and of 5.12 (c) ii, ivthe special accounts.
(c) JIRAMA will continue to employ qualified 3.09 PA 4.01 (b)auditors and will send audited accounts to IDA i, itwithin six months after the end of the fiscalyear.

- 47 -
(d) JIRAMA will not incur any debt without 6.09 PA 4.06IDA's agreement unless reasonable financialprojections indicate that the debt servicecoverage including the new debt to be incurredwill not be less than 1.4 in any given year ofthe projection period.
(e) JIRAMA will reduce by 1988 and maintain 6.09 PA 4.06thereafter its accounts receivable and payableto 90 days of electricity sales and non-payrollcash operating expenses respectively.
(f) JIRAMA will undertake and present to IDA Table 6.3 PA 4.04for review a complete revaluation and computeri-zation of its asset base by June 30, 1989.
(g) The remaining 50X of arrears between Table 6.3 CA 6.01 (f)JIRAMA, Government, and municipalities will besettled by September 30, 1987.
(h) Power subsector expansion should be in 6.09 PA 4.05accordance with the Reference InvestmentProgram (RIP); the RIP should be reviewedannually by September 30, or as needed, andrevised if required; and that JIRAMA shall seekIDA's approval for any changes in the RIPgreater than US$2 million equivalent, or 12 ofthe assets, whichever is the smaller.
(i) By September 30th, 1988, JIRAMA shall 3.10 PA 2.06 (a),complete, and furnish for review and comment by (b)the Association, a tariff study, and by January1, 1989, shall commence the implementation of atariff structure reform wbich is judged to besatisfactory by the Borrower and theAssociation.
(j) From 1990 onwards, JIRAMA sbould (i) earn a 6.09 PA 4.03 (a),return on net fixed revalued assets of not less CA 3.01 (f)than 8x; (ii) generate funds from internalsources of not less than 30% of the average ofthat year's investment program, and (iii)maintain a debt service coverage of not lessthan 1.4. Prior to September 30 of each year,JIRAMA and Government will review with IDAwhether JIRAMA will meet the requirements forthat year and the next year and take appropriatemeasures, including adjustment of tariffs.
(k) GOM will furnish IDA for comment a draft 3.03 CA 3.04 (a),contract plan to be entered into between the (b)borrower and JIRUAM, establishing performancecriteria for JIRAMA for the next five years, inthe context of the Government's overall objec-tives regarding electricity and specifying the

- 48 -
mutual obligations to achieve JIRAMA's financialautonomy and a high standard of JIRAMA'sservices at least cost.
Conditions of Effectiveness9
8.02 The following conditions of effective-ness were agreed:
(a) The Subsidiary loan agreement on behalf of 5.18 CA 6.01 (a)the Government and JIRAMA has been executed.
(b) The MIEM and JIRAMA Project Management 5.11, Ca 6.01 (a),Units shall has been established and staffed and 5.12 (c)respective PMU managers have been appointed.
(c) 50% of the aggregate arrears between Table 6.3 CA 6.01 (f)JIRAMA, GOM and municipalities will have beensettled.
(d) JIRAMA's capital will have been increased Table 6.3 CA 6.01 (f)by FMG 4 billion.
(e) Government has taken and communicated to Table 6.3 CA 3.05JIRAMA a decision to make, effective January 1, Supplemental1988, a tariff increase of not less than 9% and Lettera combination of capital increase and importduty exemption on rehabilitation spares andmaterials to ensure that during 1988 JIRAMA will(i) generate from internal sources not less than1% of its investment program for FY88; and (ii)have at its disposal adequate funds to cover thelocal expenditure requirements of this invest-ment program.
(f) Contracts between JIRAMA and boiler users 5.13, CA 6.01 (b)have been signed. 5.18 PA 2.01 (b)
(g) New payment modalities for electricity Table 6.3 CA 6.01 (f)bills for Government and Municipalities willhave been implemented.
Conditions of Disbursement
8.03 The following cotditions of disburse-ment were agreed:
(a) In order to have Phase II of the investment 6.08, PA 4.02 (b)program become eligible for financing, JIRAMA 6.08 CA 3.01 (f)and the Government will have taken the necessary CA Scheduletariff, capital increase and other measures so 1, 3(b) i, tithat for 1989, based on reasonable financialprojections acceptable to IDA, internal sourcescontribute not less than 15% to its 1989 invest-

- 49 -
ment program; and (ii) maintain a debt servicecoverage of not less than 1.2. In addition, theissue of ownership of all water and electricitynetworks and installations operated :by JIRAMALshall have been resolved in a definitivemanner.
(b) Intermediary agreements satisfactory to IDA 5.13, CA Scheduleare required to have been executed by the 5.18 1, 3(c)Government and BNI in order that the electric Supplementalboiler component becomes eligible for Letterfinancing.
(c) Government is to agree to commercial 7.10 CA Schedulearrangements, for the exploitation for charcoal 1, 3(d)production of FANALAMANGA's pine smallwoodsatisfactory to IDA, including where applicablethe execution of intermediary agreements betweenthe Government and BNI, in order for charcoalproduction activities in the FANALAMANGA pineplantation to become eligible for financing.
Recommendation
8.04 With the above agreements, the project is suitable for an IDAcredit of SDR 19.8 million, equivalent to US$25 million, to be lent toMadagascar for a term of 50 years including a period of 10 years grace.

EN119 I PDWNATIAO lT BAUM, 1983 4
-R El .no Futrola fotuetsJuelood qpmase So t.g %dro crde - t Gcs Fue Lins
VI Wtiad cm,oa OLI Oaromal Elnetricty LPG Aias Caomi. Kerosee Fuel 011 Oil Total Totals
Grin1675.8 2.9 0.1 62.0 1740.8
l8Iqiots 7.5 210.2 0.6 1*5 6.2 5.0 18.4 12.5 44.2 261.9
8toea @0m 0.7 9.1 2.9 68.0 80.7 80.7TotalA bailable 1675.8 2*9 0.1 62.0 7.5 210.2 1.3 1.5 15.3 7.9 18.4 805 124.9 2083.4
eis bafia. (201.1) 1.3 44.6 22.7 55.5 77.0 201.1 0.0Cb rcasi Ytoductloo j/ (121.3) 121.3 0.0u*tit looar Ginration
O--ubLie (62.0) 90.1 (15.7) (12.4) 0.0(2.9) 11.9 (9.0) 0.0
l4noso ose" (352.7) (9.1) (11.9) (373.7)
losse @1 (6.2) (8.2) ouag Sector Ub (3.7) (3.7)
Ret SITply aniable 1201.8 0.1 7.5 121.3 78.2 2.6 1.5 59.9 30.6 18.4 111.3 64.6 288.9 1697.8
secssdary Eports (18.4) (18.4) (18.4)bdicr Sales (29.2) (29.2) (29.2)
met oetse Osus.tics 120K.8 0.1 7.5 121.3 78.2 2.6 1.S S9.9 30.6 111.3 35.4 241.3 1650.2
* Otber 0.1 7.5 56.5 0.6 47.9 17.2 65.7 129.8lTurwaut 1.5 58.3 63.4 18.2 141.4 141.4Ebssadmds 1201.8 121.3 21.7 1.7 28.6 30.3 137S.1
uaalog Btsors 0.3 1.6 2.0 3.9 3.98
e( 1bluood to cooverted at 3,200 hcal at 25S *cliture cooteat.y 10 dota.
w svertdo than Oarmi r aoint bas* (1 Gb - 250 to.).rcsal to comened at 7,082 eal/kg.
3/ frN.eein wd law" m pt.bsbly id tha these reported.

MADAGASCARENERGY SECTOR INFORMATON FLOW AND DEC0SN-MAING PROCESS
IPRESDENTPUIMATURE
kduoft Ener Dwmd Dcat aid E Resoumce date pfes CotS. etc.
DG PLAN 7E.WAIW&WM OMAN6
,l onI |I crop Daa
I I| ddk m ourczandwoodhe
DIECTIONL .| *EI O F-t _ . .1 DIRECION OF ____ __U_al RIAL 0
'I~~~~Dt Do h*xndsk (FUURE ENERGYiRAVMA I _______ PLANNG)
L - - - _ - - r09
Dft a nd kdfnaflo
0.
--- -To be uieniheed
Nob: 3 mdn Drofln concned In WARA. Inarotrt RUs (DIRNWdU~M oak~lcimA)
Wodd SoWk*-423

- 52 -
ANE 1.2Page 2 of 2
MADAGASCARENRY I PRWOECr
ADIMISTRATION OF HOUSEHOLD ENERGY PLAING PROGM
ForeigM Staff: L1o Staff:- Resident program - Head of Unit (F)
Advisor (F) - Secretarial/Clerical- Data Managnt Assistants (2-F)
Consultamt (P) - Data Management Officer (F)- Drivers (3-F)
urm" BudRenes sd aOoe- am-t mrzat lSurey OWtAM
Local Staff Local Staff Local Staff Local Staff- Project Field - Professional - Senior Forester - Survey Field
Director (F) Assistants (P) Director (F)- Professional (2-P) - Senior Agronomist - Stove tecleiOian
Assistant (F) - Forester (P) Consultant (P) (F).- Computer - Agroeconomist - Energy Planner - Computer
Programmers (3-P) (P) (P) (from MmIE programmars (3-P)- Statisticians - Computer staff) - Statisticians
(2-P) programmr (P) - Professional (2-P)- Enumerators (30-P) - Enumerator (P) assistant (P) - Enumerators (30-P)
- Computer - ProfessionalprogranmPr (P) Assistant (F)
Foreign Staff Foreign Staff Forei8 Staff Foreign Staff- Social Survey - Household - Energ/Forest - Stove Design
Specialist (P) Energy Economist Consultant (P)Specialist Consultant (P) - MarketingConsultant (P) - Agro-Industrial Consultant (P)
- Forester (P) Wastes - Production- Social survey Consultant (P) Engineer
Kay: specialist (P) - Social survey Consultant (P)(F) = Full time Specialist (P) - Social Survey(P) - Part time Specialist (P)(Number) - number of
staffrequired

MADAGASCARENERGY I PIROJECT
INSTALLED GENERATION CAPACITY
No. of Unit Commissioning Installed Firm Average FirmPlant Type Units Capacity Date Capacity Capacity Generation Generation
kW kW Gwh p.a. CGo p.a.
I. Hydropower plants
A. Interconnected SystemAntolnmtta Francis 6 6xl,360 4930-58 8,160 8,160 50 28
I Ix640 640 640
Nandraka Pelton 4 4x6,000 I - 04/56 24,000 24,000 el 452 - 04/563- 11/664 - os0li
Manandona Francis 2 2x480 1- 1932 960 960 12 9.52 - 1932
I Ix640 3- 06/60 640 640---------------
Andeklaeke Francis 2 2x29,000 I - 06/82 58,000 58,000 So0 500I- 06/82
B. Isolated CentersAnkazobe Francis I Ix50 1959 50 - 0.05 -
Awbohimidana Francis I 56 - 56 - 0.07 -
C. External ZonesToamasina Francis 4 3xl,520 1931 6,760 4.560 7.5 4.0
1x2,200 1971
Vatomandry Francis 3 Ix90 1953 170 40 0.3 0.32x40 1953
Namorona Francis 2 2x2,600 1980 5,600 2,800 8.5 2.5
Fianarantsoa Francis 3 2xl40 1932 450 170 1.5 1.5Manandray Ixl70 1963

- 54 -ANNEX 2.1Page 2 of 2
,,,,!s _"^ _,s, 0 4% -p.s _,4w v
-, a - a ° U 'X 5 X ° RSR 2a§
3 888 88 8 88 8888 l
8 -e4U' -N U'| -C4Uq *c
; i.|3i 0Ei1.
(7 A ~~~~~~~~~~~4 * '0~~~~~~~~4

- 55 -
ANNEK 3.1Page 1 of 3
NADAGASCAR
ENERGY I PRJECT
2rganixation and Functions of the PMU
The main functions of the PMU would Include the following:
(i) to be the counterpart for IDA, cofinancing agencies, consultantsand contractors;
(iL) to coordinate and supervise draw down of the IDA funds and otherfunds allocated for the execution of the energy components, andto keep the accounts for the handling of such funds;
(Wi) to supervise the execution by the PIUs of the energy componentsand to manage the monitoring and execution of pilot-projectcontract;
(iv) to submit the requests for disbursements to IDA and the variouscofinancing *gencles;
(v) to be a party, jointly with the representative of each Ministryand Agency Involved, to contracts to be entered into with respectto the execution of the respective energy components;
(vi) to keep appropriate files for all energy components;
(vii) to coordinate the preparation by the PI1 of their respectiveprogress reports for the energy components for IDA and thevarious cofinancing agencies;
(viii) to carry out the same activities as in (vii) but with respect tothe preparation of a project Completion report once disbursementsfor the enorgy components have been completed; and
(ix) to handle official correspondence in respect of the energycomponents with IDA, cofianciang agencies, consultants,contractors and government agencies.

INEGY I PRWOC?PROECr MWAGEKW
(Non-Power Components)
IJSMRY I, lRY ARD MINE
SECRETARY-60NEtAL
- ~DIREC1TO-GEOW.AL
IR
DIRECO OF MEM=G (AND WATER)
PRDJECr MANAGEMENT UNIT
DIPECrON OF DIRElOIN OF IMPAA .DFULSTRY, mIm EN;Y AND WATER MPAI;F.
pmi PnJ PI Y n
P C Industrial - Eerg Planning Briquetting -Yorestry Carbonization PowerR 0 Energy Support Lac Aloatra Besoirce of Pinewood Components0 M onservation Household EgY Study -Assessmect (Haut !kngoro)J P Program Planning Prog. Agricultural (HEPP)
0 (through its HEPU Residues -Woodfu elsC N to be established) Resource Market Final approval T E - Energy Studies Assessent Prices and submission to IDA of 0 A
N (HEPP) Surveys disburse"ent requests only.T PIU1 - Project Imlmnaion Unit (MEP) *JIRAMA wil bave its own PMU.S PHU - Project Management Unit
HEPP - Housebold Energy Planning ProgramHKFU - Hbusehold Energy Planning Unit (see Annex 1.2, p. 2)

- 57 -
ANNEX 3.1Page 3 of 3
MADAGASCARENERGY I PROJECT
JIRAMA ORGANIZATIONAL CHART
DE TECTOR GE A INTANRNAL AUDIT
ASST* 'DIR. GKN* ST I.GN AEADKIN. FIN.INVISTNENTS
EQUIPMENT__
ELECTRICITY 1 ANTSERANANAGENERATION__
WATEt EQUTPMENT" _AUTBIRABEIAD WORWS
LTAIM~~~~~~~~WATER PRODUCTION FIAYARANTSOAHUMa RESOURCES
ADM(INISTRATIONTOMSNSFINTCE
q ~~STlS & PLANNING MEI|-SCA
CENTER
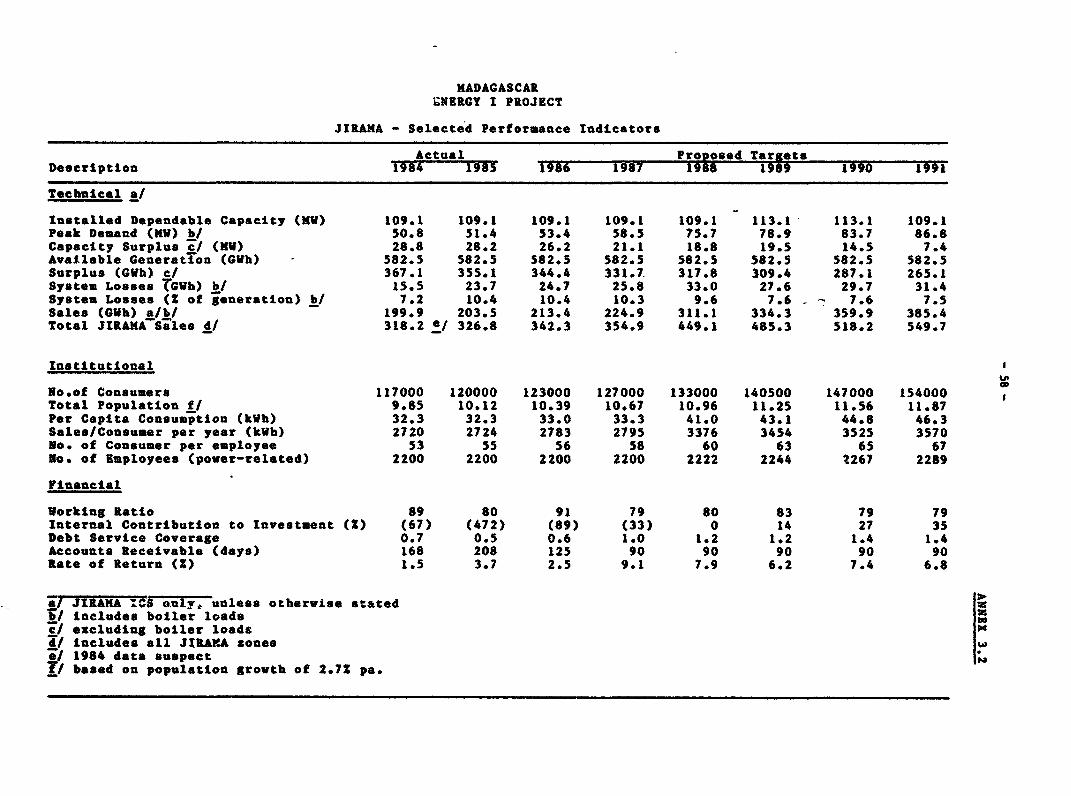
MADAGASCARINERGY I PROJECT
JIRANA - Selected Performance Indicators
Actual Proposed Tar;etsDescription 1984 MY 1986 1987 1988 1989 1990 1991
Technical a/
Installed Dependable Capacity (KW) 109.1 109.1 109.1 109.1 109.1 113.1 113.1 109.1Peak Deaand (KW) b/ 50.8 51.4 53.4 58.5 75.7 78.9 83.7 86.8Capacity Surplus ci (NW) 28.8 28.2 26.2 21.1 18.8 19.5 14.5 7.4Available Generatioan (GWh) - 582.5 582.5 582.5 582.5 582.5 582.5 582.5 582.5Surplus (GVh) c/ 367.1 355.1 344.4 331.7. 317.8 309.4 287.1 265.1System Losses (GVb) b/ 15.5 23.7 24.7 25.8 33.0 27.6 29.7 31.4System Losses (Z of generation) bJ 7.2 10.4 10.4 10.3 9.6 7.6 7.6 7.5Sales (GWh) a/b/ 199.9 203.5 213.4 224.9 311.1 334.3 359.9 385.4Total JIRAMA Ssles d/ 318.2 e/ 326.8 342.3 354.9 449.1 485.3 518.2 549.7
Institutional
No.of Consumers 117000 120000 123000 127000 133000 140500 147000 154000Total Population f/ 9.85 10.12 10.39 10.67 10.96 11.25 11.56 11.87Per Capita Consumption (kWh) 32.3 32.3 33.0 33.3 41.0 43.1 44.8 46.3Sales/Consumer per year (kWh) 2720 2724 2783 2795 3376 3454 3525 3570No. of Consumer per employee 53 55 56 S8 60 63 65 67No. of Employees (power-related) 2200 2200 2200 2200 2222 2244 2267 2289
Financial
Vorking Ratio 89 80 91 79 80 83 79 79Internal Contribution to Investment (Z) (67) (472) (89) (33) 0 14 27 35Debt Service Coverage 0.7 0.5 0.6 1.0 1.2 1.2 1.4 1.4Accounts Receivable (days) 168 208 125 90 90 90 90 90Rate of Return (Z) 1.5 3.7 2.5 9.1 7.9 6.2 7.4 6.8
a/ JIRJAA :^ ouly, unless otherwise statedi includes boiler loads
c/ excluding boiler loadsd/ includes all JIRAXA zones
1984 data suspectf/ based on population growth of 2.7Z pa.

ANNEX 4.1
Page 1 of 2
MADAGASCAR
ENERGY I PROJECT
Methodology'and Assumptions for Load Forecasts
Load forecasting was performed on a microsectoral basis buildingup demand on the basis of known or anticipated demands from presentconsumption patterns for the major power supply zones. Demand forecastingmodels were built on Lotus 123 and checked through with JIRAMA staff in thefield to verify present and foreseen major demands and trends. Thisapproach is outlined below for the ICS.
Assumptions: ICS Demand Forecast
(i) Industry: The disaggregated demand models utilized separatemajor new industrial demands for each new demand center,codmissioning them in accordance with acceptable timetables forimplementation of industrial plant. Industries not thoughtviable by IDA were excluded. In summary:
- energy and capacity demand of existing major industry wasreviewed and registered in the model on a case by case basis;and
- small-scale industrial demand is projected to grow at about3% p.a. in line with recent trends.
(ii) Commercial (including hotels, hospitals, retail and wholesaletrade, restaurants)
- recent demand trends were reviewed as well as the backlog ofdemand from commercial undertakings for electricity supply,leading to an estimate of 3.5% p.a for future demand growth.
(iii) Domestic: Three factors were considered in estimating futuredemand for electricity:
- demand backlog; which exceeds 10,000 consumers. Thus assump-tion was made to resume previously achieved connection rate of6,500 per year at an average consumption of 500 k W/yr/consumerstimulated by JIRAMA financing of connection fees;
- electric rice-cooking; intiated by the project on a pilot basisand extending by 1995 to 10,000 consumers;
- price elasticity of demand;
- is not expected to be significant as tariffs will decline inreal terms, and only about half the domestic consumers wouldexperience tariff increases in 1987/1988 due to existinginequalities in domestic tariffs; and

- 60- ANNEX 4.1Page 2 of 2
- as result of these considerations, background demand wasprojected at 3.3% through 1988, and at 5.5% thereafter, withadditional cooking demand growing with stove units in use,leading to an average projected demand growth of 5.9% p.a. overthe period.
(iv) Electric Boilers: Consumption data were included in the model inaccordance with the proposed installation schedule and low growthdemand build-up assumptions for each boiler installation.
(v) Government, Public Lighting and water Pmpi: Demand byGovernment, including public lighting, is anticipated to slowdown due to payment enforcement and overall budgetaryrestrictions. Water pumping demand is extrapolated at presentlevels. Thus annual demand projections adopted are publiclighting, 0.5X.; administration, 1.51 declining to 1.0% in 1989;water pumping, 3.01.

END= I PJk(rTJIRhKA ICS SALES AND G0M3A l, ACTUAL AiD PIIEC!ED, P!-95
(GWhb)
Growth*1980 1981 1982 1983 1984 1985 1986 1987 1988 1989 1990 1991 1992 1993 1994 1995 1965-95
Bae Cae - Jrama ICS K
Dtoestic Use 46.3 50.7 52.8 54*8 61.4 61.1 63.2 65.4 67.7 71.4 75*4 79.5 83.9 88.5 93.4 98.5 4.9
Electtic CabidOLg 0.0 0.0 0.0 0.0 0,0 0.0 0.0 0.2 0.8 3.2 12*8 13.4 14.1 14.8 15.6 16*3ubtotyal - *46.3 50.7 52.8 54.8 61.4 61.1 63.2 65.6 68.5 74.6 88.2 92.9 98.0 103.3 108.9 114.8 6.5
CWMEOMMA t 11.2 13.1 11.6 13.6 14.2 15.4 15.6 15.8 16.0 16.2 16.3 16*5 16.6 16*8 17.0 17.1 1.1Internal Conensu tioo 14.5- 15.3 15.5 16.7 16.5 16.4 16.9 17.0 17.6 18.1 18.6 19.2 19.8 20.4 21.0 21.6
Public IghtinLg 5.2 4.9 3.3 3.1 2.9 3.2 3.2 3.2 3.3 3.3 3.3 3.3 3.3 3.3 3*4 3.4 0.5Hative, ItNr, Ion voltage 8.9 9.2 8. 3 8.7 8.9 9.2 9.5 9.9 10.2 10.6 11.0 11.3 11.7 12.1 12.6 13.0 M.Subtotal 39.8 42.5 38.8 42,1 42.5 44.2 45.3 46.0 47.0 48.1 49.2 3 51.4 52.6 5.9 55.6 1 2.2
IndustriaJlsmlI Indshtry 93.9 88.9 88.6 95.4 96.0 98.3 103.2 108.4 113.8 119.5 125.4 131.7 138.3 145.2 152.5 160.1 5.0
Now targe Industry 0.0 0.0 0.0 0.0 0.0 0.0 1.7 5*0 8.3 8.3 8.3 16.6 16.6 16.6 16.6 16.6Boilers 0.0 0.0 0.0 0.0 0.0 0.0 0.0 0.0 73.8 83.8 88.8 93.8 97.0 97.0 97.0 97.0
Subtt. New Ind/Boilers 0*0 0.0 0*0 0.0 0.0 0.0 1.7 5.0 82.1 92.1 97.1 110.4 113.6 113*6 113*6 113*6
Subtotail '93.9 88.9 88.6 95.4 96.0 98.3 104.9 113.3 l195.9 211.6 222.6 242.1 251.8 258.8 266.0 273.6 10.8
hItercoumecter-bternal Zone 0.0 0.0 0.0 0.0 0.0 0.0 0.0 0.0 0.0 0.0 0.0 0.0 0.0 0.0 0.0 0.0
Tot. ICS v/oat BoilersSales 180.0 182.0 180.2 192.3 199.' 203*b' 213.4 224.9 237.6 250.5 271.1 291.5 304*3 317.8 3J4i 346.6 5.5
louses: Substations 1.7 1*7 1*7 4.5 4.5 4.5 4.6 4.7 4.8 4.9 5.0 5.1 5.2 5.3 -5.4 5.5 2*0TS Ines 8.9 9.2 11.3 10.6 11*0 19.2 20.1 21.1 22.; 17.7 19*3 20*7 21.7 22*6 23*7 24.7 2.6
Subtotal 10.6 11*0 13.0 15.2 15.5 23.8 24.7 25.9 27.1 22.6 24.4 25*8 26.9 28.0 29.1 30.3 2*4
Tot. taqiUnre Gmratiou 190.6 193.0 193.2 207.5 215.4 227.4 238.1 250.8 264.7 273.1 295.4 317.4 331.2 345.7 360.9 376.9 5.2
peak Ebnmd 43.9 45.3 45.3 47.9 50.8 51.4 53.4 58.5 60.8 64.1 69.1 72.2 75.6 79.1 82.8 86*6 5.4
Total ICS idth BolersSales 180*0 182.0 180.2 192.3 199.9 203.6 213.4 224*9 311*4 334.3 359.9 385.4 401.3 414.7 428.8 443.6 8.1
losses: Substations 1.7 1.7 1.7 4.5 4.5 4*5 4.6 4.7 4.8 4.9 5.0 5.1 5.2 5.3 5.4 5.5 2.0
S tlnes 8.9 9.2 11.3 10.6 11*0 19.2 20.1 21.1 28.2 22.7 24.7 26.3 27.5 28.4 29.5 30.6 4.7
Subtotal 10.6 11.0 13.0 15.2 15.5 23.8 24.7 25.9 33.0 27.6 29.7 31.5 32.7 33.8 34.9 36.1 4.3 2
bto. qirptded rswtion 190.6 193.0 193.2 207.5 215.4 227.4 238.1 250.8 344.4 361.9 389.6 416.8 434.0 448.5 463.7 479.7 7.8
Peak DDmed 43.9 45.3 45.3 47*9 50.8 51*4 53.4 58.5 75.7 78.9 83.7 86.8 90.1 93.6 97.3 101.2 7.0 *>
loses* a & Proportio 10.53 10.4K 10.3Z 9.6K 7.6K 7.62 7.5K 7.5K 7.5K 7.5K 7.5K N
Of GeMeratine

END9BT I PFf1iWY
JlRAWA ICS, PEM DiWD, ACTUAL AND FROECIEDs, 118O-95 (MW)
Grwh,1980 1981 1982 1983 1984 1985 1986 l987 1988 L189 1990 "991 1992 1993 1994 1995 1985-95
Jfrm slO IC
ResidentialGeneral °stic Use 18.7 20.4 21.3 22.1 24.7 24.6 25.5 26.4 27.3 28.8 30.4 32.0 33.8 35.7 37.6 39.7 4.9Electric COdking 0.0 0.0- 0.0 0.0 0.0 0.0 0.0 .0 0.2 0.7 2.9 3.1 3.2 3.4 3.6 3.7Subtotal 18.7 20.4 21.3 22.1 24.7 24.6 25.5 26.4 27.5 29.5 33.3 35.1 37.0 39.0 41.2 43.4 5.8
Govermzsent 2.1 2.5 2.2 2.6 2.7 2.9 3.0 3.0 3.1 3.1 3.1 3.1 3.2 3.2 3.2 3.3 1.1Internal Comost4tie 2.9 3.1 3.1 3.3 3.3 3.3 3.4 3.4 3.5 3.6 3.7 3.8 3.9 4.1 4.2 4.3 2.8PubliIc Lighting 1.3 1.3 0.9 0.8 0.8 0.8 0.8 0.8 0.8 0.8 0.8 0.8 0.9 0.9 0.9 0.9 0.5ottive Power, low voltage 2.3 2.3 2.1 2.2 2.3 2.4 2.4 2.5 2.6 2.7 2.8 2.9 3.0 3.1 3.2 3.3 3.5Subtotal 8.6 9.2 8.3 9.0 9.0 9.4 9.6 9.8 10.0 10.2 10.5 10.7 11.0 11.2 11. 11.8 2.3
IndustrialSiaU Industry 16.6 15.8 15.7 16.9 17.0 17.4 18.3 19.2 20.2 21.2 22.2 23.3 24.5 25.7 27.0 28.4 5.0
M Large Industry 0.0 0.0 0.0 0.0 0.0 0.0 0.0 3.1 3.1 3.1 3.1 3.1 3.1 3.1 3.1 3.1Boilers 0.0 0*0 0.0 0.0 0.0 0.0 0*0 0.0 13.4 13.4 13.1 13.1 13.1 13.1 13.1 13.1S-T: laqge TInustry 16.6 15.8 15.7 16.9 17.0 17.4 18.3 22.3 23.3 24.3 25.4 26.4 27.6 28.8 30.1 31.4 6.1S-V: Boilers/UNs Ind's 16.6 15.8 15.7 16.9 17.0 17.4 18.3 22.3 36.7 37.7 38.5 39.5 40.7 41.9 43.2 44.5 9.8Subtotarl 16.6 15.8 15.7 16.9 17.0 17.4 18.3 22.3 36.7 37.7 38.5 39.5 40.7 41.9 43.2 44.5 9.8
Intercmmect-zter_nl zne 0.0 0.0 0.0 0.0 0.0 0.0 0.0 0.0 0.0 0.0 0.0 0.0 0.0 0.0 0.0 0.0
Total ICS W/out Biles 43.9 45.3 45.3 47.9 50.8 51.4 53.4 58.5 60.8 64.1 69.1 72.2 75.6 79.1 82.8 86.6 5.4
Total ICS ith bilers 43.9 45.3 45.3 47.9 50.8 51.4 53.4 58.5 74.2 77.4 82.2 15.3 88.7 92.2 95.9 99.7 6.8

- 63 -ANNEY 4.4
ENERGY I PROJECTJIRANA ICS ENERGY AND CAPACITY BALANCES, FY86-5
(NW)
1986 1987 1938 1989 1990 1991 1992 1993 1994 1995
Firm Energy SupplyPlant
Andoekleka Stage I 500.0 50. 500.0 500.0 500.0 300.0 500.0 50 500500.0 S00.0Andekaleka Stage ItAndekaloka Stage III (Ankohotre)Antelomita 28.0 28.0 28.0 28.0 28.0 28.0 28.0 28.0 28.0 28.0eanendona 9.5 9.5 9.5 9.5 9.5 9.5 9.5 9.5 9.5 9.5Mandrake 45.0 45.0 45.0 45.0 4S.0 45.0 45.0 45.0 45.0 45.0AmbohioanambolaPlelotick 1972Pieletick 1913Pielatick 1981
Antsiraeb (1)NO .VFMOO 1) NOT 8ST1HTED AS NM RELEVANTMOO 1960 FOR PBRIOD CONCERNED.AN 1964mAN 1967MAN 1968Piolatick 1982
NandrosesaSulzer 1949Worthington 1951SCXM 1955
Anual Tot. Firm Energy S82.5 582.5 582.5 582.5 582.5 582.5 582.5 582.5 562.5 582.5Energy req. with Boilers 238.1 250.8 344.4 361.9 389.6 416.8 434.0 448.5 463.7 479.7
Surplus/Deflcit 344.4 331.7 238.1 220.6 192.9 165.7 148.5 134.0 118.6 102*8Energy req. w/out Boilers 238.1 250.8 264.7 273.1 295.4 317.4 331.2 345.7 360.9 376.9
Surplus/Deficit 344.4 331.7 317.8 309.4 287.1 265.1 251.3 236.8 221.6 205.6
uependable CapacityPlant
Andeksleka Stage I 44.0 44.0 44.0 44.0 44.0 44.0 44.0 44.0 44.0 44.0Andeksleka Stage II 0.0 0.0 0.0 0.0 0.0 0.0 0.0 0.0 0.0 0.0Andekaleka Stage III 0.0 0.0 0.0 0.0 0*0 0.0 0.0 0.0 0.0 0.0Antelonita 8.0 8.0 8.0 6.0 8.0 8.0 8.0 6.0 8.0 8.0Manandona 1.6 1.6 1.6 1.6 1.6 1.6 1.6 1.6 1.6 1.6Mandraka 20.0 20.0 20.0 24.0 24.0 24.0 24.0 24.0 24.0 24.0AmbohimanambolaPielstick 1972 6.0 6.0 6.0 6.0 6.0 6.0 6.0 6.0 6.0 6.0Pieletick 1973 6.0 6.0 6.0 6.0 6.0 6.0 6.0 6.0 6.0 6.0Pieletick 1981 6.0 6.0 6.0 6.0 6.0 6.0 6.0 6.0 6.0 6.0
AntairabeKOO 1958 retireMGO 1960 retireIIAN 1964 101 l.l l.l 1.1 l.l III 1.1 1.1 1.1 1.1MMN 1967 (2) 1.1 1.1 1.l 1.1 lot lot 1.1 1.1 III .1*MAN 1968 (2) 1.8 1.8 1.8 1.8 1.8 1.6 1.8 1.8 1.8 1.8Pielstick 1982 7.5 7.5 7.5 7.5 7.5 7.5 7.5 7.5 7.5 7.5Sulzer 1984 (moved freo Toaasina) 8 8 8 8 8 a 8
MandroseseSulner 1949 retireWorthington 1951 retireS9CC 1955 retire
An. Dependable Capacity 103.1 103.1 111.1 115.1 115.9 115.9 11S.9 11S.9 115.9 115.9Required Syst. Ree. (3) 22.0 22.0 22.0 22.0 22.0 22.0 22.0 22.0 22.0 22.0Syst.Peak v. Bollers 53.4 58.5 74.2 77.4 82.2 85.3 88.7 92.2 95.9 99.7Cap.Surplus/Def0tt MK 27.7 22.6 14.9 1S.7 11.7 8.6 5.2 1.7 -2.0 -5.8
x 26.9 21.9 13.5 13.6 10.1 7.4 4.5 1.5 -1.7 -5.0Syst.Peak w/out Rollers 53.4 58.5 60.8 64.1 69.1 72.2 75.6 79.1 82.8 86.6Required System Resrve 29.5 29.5 29.5 29.5 29.5 29.5 29.5 29.5 29.5 29.5Csp.Surplus/Def'ts IS 27*. 22.6 28.3 29.0 24.8 21.7 18.3 14.8 11.1 7.3
2 26.9 21.9 25.5 25.2 21.4 18.7 15.8 12.8 9.6 6.3
Notess (1) PFrm dlesel energy supply in not competed Wer as hydroelectric *nergy *vallability is Inexcess of demand wall beyond 1995, and dlesl plant o mainstained for peeking purpowe only.
(2) Diesel pleat not atilised due to ltydropowar U thu lfe extended as ueb as to 1995.(3) serve capacity blggest hydropower and dle*el unit out of service.

ENERGY I PROJECTISOLATED AND XTZERRAL ZONE CENTERS SALES FORECAST
(Glh)Isolated Zon Centers Sales 'drecast
1985 1986 1987 1988 1989 1990 1991 1992 1993 1994 1995 Growth Rate85-95 (Z)
Low Voltage 1.59 1.76 1.96 2.16 2.37 2.61 2.87 3.16 3.47 3.82 4.20 10.222Nedium Voltage 0.33 0.36 0.39 0.42 0.45 0.49 0.53 0.57 0.62 0.67 0.72 8.11ZInternal Coosumptlon 0.01 0.01 0.01 0.01 0.01 0.01 0.01 0.01 0.01 0.01 0.01
2.00OTOTAL SALES 1.92 2.13 2.36 2.58 2.83 3.11 3.41 3.74 4.10 4.50 4.94 9.882
Losses- Line 7.50Z 0.16 0.17 0.19 0.21 0.23 0.25 0.28 0.30 0.33 0.36 0.40
Powr Station 3.502 0.08 0.08 0.09 0.10 0.11 0.12 0.13 0.15 0.16 0.18 0.19REQUIRED GENERATION 2.16 2.39 2.64 2.90 3.18 3.48 3.82 4.19 4.60 5.04 5.53 9.882P1hZ DEKAND Load factor 55.002 0.4S 0.50 0.55 0.60 0.66 0.72 0.79 0.87 0.95 1.05 1.15
xternal Zone Ceoters Ssles Forecast
1985 1986 1987 1988 1989 1990 1991 1"2 1993 1994 1995 Growth Iate85-95 (Z)
Low Voltage 41.6 43.4 45.3 47.3 49.4 52.0 54.6 57.5 60.5 63.8 67.2 4.91SMediu Voltage 73.8 77.3 76.2 81.5 92.5 96.8 99.8 102.8 105.1 107.6 110.3 4.102Icternal Consumption 6.0 6.0 6.1 6.2 6.2 6.4 6.5 6.7 6.8 7.0 7.2
2.002OTAL SALES 121.4 126.8 127.6 135.0 148.2 155*2 160.9 167*0 172*5 178*3 164.7 4.28Z
LossesLIne 7*502 9.84 10.28 10.35 10.95 12.01 12.58 13.05 13.54 13.98 14.46 14.97Power Station 3.502 4.76 4.97 5*00 5*29 5.81 6.08 6.31 6.55 6.76 6.99 7.24
REQUIRED GENERATION 136.02 142.03 142.97 151.28 165.98 173.82 180.30 187.05 193.20 199.7q 206.86 4.282PEAK DuIAND Load factor 55.OOZ 28.23 29.48 29.67 31.40 34.45 36*08 37.42 38.82 40.10 41.47 42.94

- 65 -
4M 4.6
EN= InoPIVD StIX-DWI ULMW FR IUID m0E, AIrN FM?MW
(th l IUus of u qd e#vat)
1983 1984 1985 1986 187 1988 1989 1990 199 1992 1993 1994 1 "
Urbsn populAtsn ('000) 691.5 726.0 762.3 .4 60.5 885 926.6 972.9 1021.6 1072.7 1126.3 1182.6 1241.7Rural patpaim ('000) 2184.5 2243.5 234.1 2366.3 2430.2 2495.8 2563.2 2634 203.4 2776.4 2851.4 29284 3007.4
lbtal populatdon ('000) 2876.0 2969.5 3066.4 3166.7 3270.6 3378.3 3489.8 3605.3 3725.0 3849.1 3977.7 4111.0 4249.2
t*lA iv diaid ('OOOt) 2111.4 2189.4 2270.4 244.3 2420.6 249.5 2581.1 2665.4 2752.6 2842.8 2936.0 32.3 3132.00.01 elasLitdy frsa 1985 omrdsSustainable awly&tesaulwo farttaW
Fras( O planai (000 two) 329.92 323.59 317.38 311.29 305.33 299.48 293.76 28B.14 282.6A 277.25 271.97 266.79 261.72Fhr forests ('00O two) 45.82 45.82 45.82 45.82 45.82 45.82 45.82 45.82 45.82 45.82 45.82 45.82 45.82
Tounim faritamtyFra plastai (OCOtw) 129.60 129.60 129.60 129.60 129.60 129.60 129.60 129.60 129.60 129.60 129.60 129.60 129.6ftm forests ('OOOtwe) 281.51 281.51 281.51 281.51 281.51 281.51 281.31 281.51 281.51 281.51 281.51 281.51 281.51
TOW Sstainble 786.9 780.5 774.3 768.2 762.3 756.4 750.7 745.1 739.6 734.2 728.9 723.7 718.7SWly ('000tm)
EXti modem RF1sElectricity ('OOtm) 9.1 9.6 10.0 10.5 11.1 11.6 12.2 12*8 13.4 14.1 14.8 1S.6 16.3LE ('000t.) 62.4 65.5 68 72.3 75.9 79.7 83.7 87.8 92.2 96.8 101.7 106.8 112.1
?er ( 00IlOt) 9.7 10.2 10.7 11.3 11.8 12.4 13.0 U.97 14.4 l. 15*1 IM 166 17.5
-ToaW (COOOtwe) 81.2 S5.3 89.6 94.1 98.8 103.7 108.9 114.3 1.0 126.0 132.3 139.0 14S.9
Urban Tr aid 63.3 65.7 68.1 70.3 72.6 75.0 77.4 80.0 82.6 85.3 88.1 91.0 94.00 1#Reid ('OtlOm)
Deftcit Wthol 1180.0 1257.9 1338.4 1411.7 148)i.0 1564.4 1644.1 1726.1 1810.4 1897.3 1986.6 2078.7 2173.5Intenvntimn ('0000>)
Deficit In iHctaequivalest ('eOM plA&AM) 98.3 104.8 111.5 117.6 123.9 130.4 137.0 143.8 150.9 1S8.1 165.6 173.2 181.1
A) NM So
"ut Rro Pis 0.0 0.0 0.0 18.7 18.7 18.7 18.7 18.7 18.1 18.7 187 18.7 18.7LoStil zims 0.0 0.0 0.0 0.0 32.3 43.0 57.3 76.5 102.0 136.0 181.3 241A 32SSamuill at 0.0 0.0 0.0 0.0 2.1 2.7 3.7 4.9 6.5 8.7 11.5 15.4 2D,Stac AloM aIicol Briquettes 0.0 0.0 0.0 0.0 0.0 0.0 0.0 2.3 3.9 66 11.2 19.0 22.8
Ibtal dcoel 0.0 0.0 0.0 18.7 53.0 64.5 79.7 102.4 131.1 170.0 222.8 2950 384.6
Agrdiotu l tiAausRim bsk 1mcttes 0.0 0.0 0.0 0.0 3.5 4.7 6.3 8.3 IL1 14.8 19.8 26.4 35.2
9 btal 0.0 0.0 0.0 18.7 56.6 69.2 86.0 110.7 142.2 184.8 242.6 321.4 419.7
B)>Uphldd PrAtcti
Tra1ltmal O1 I 0.0 0.0 0.0 10.8 21.7 32.5 43.3 54.2 6S.0 73.8 86.6 97.5 M3.3o3p _ta 0.0 0.0 0.0 0.0 3.2 4.3 5.8 7.7 10.2 13.7 18.2 24.3 32.4
Su94bta1 0.0 0.0 0.0 10.8 24.9 36.8 49.1 61.8 75.2 89.5 10.9 121.8 140,7
C) Hiqle m bi FRol pply
Ibrosn 0.0 ).0 0.0 0.0 8.9 11.9 1S.8 21.1 28.1 37.5 500 66.7 89.0Slsetrk:ity 0.0 0.0 0.0 0.0 11.0 15.5 21.7 30.3 42.4 59.4 83.2 110.5
&APbAIala 0.0 0.0 0.0 0.0 8.9 22.9 31.3 42.8 58. 80.0 109.5 149.9 199.5
WA 817 931.4 931.5 932.0 962. 1024.0 1064.0 1 103.4 1154.7 1 .1 1299.8 14O62 1546.7 17184
Dit 1180.0 1257.9 13384 1382.1 1396.6 1433.5 1 477.7 1510.8 1534.5 1543.0 129.7 14856 1413.5

>'~~~~' '' llj'
,~~~~~~~~~~~~~~~ I. , I G
..... ~ 99

SNERG! I PROJECTReference Power Subsector Investment Plea (tIP) - Su ary. 1987-1992
(Final version sgreed at negotietions, Wabslngton, February 1987)
1987 1988 1989 199O 1991 TotalL F S T F S F T L F T L F T I I T I T
A. Investest Cowuonent1. Portloe Depreclated over 40 yearsNosy-se eiesel 0 0 0 116 140 255 260 732 992 196 729 925 0 0 0 571 1601 2172Volobs ydropower 821 135' 2178 2650 4985 7636 465 2117 2582 0 0 0 0 0 0 3936 8460 12396Diesel RebabdlUtation 27 20 47 146 378 524 177 531 708 153 451 604 86 177 226 589 1557 21469ydropewer Rexebilitation 207 407 614 267 822 1089 86 284 370 400 1194 1593 208 691 899 1167 3398 4565Trae-eision sad Substations 191 205 396 176 406 S81 108 74 181 212 579 791 213 583 798 900 1648 2748Distrlbutlon elanforeeenst 546 1528 2076 663 2067 2730 755 2289 3044 666 2304 2970 598 1981 2579 3230 10168 13398LoV Cost Pilot Poject 8 33 41 25 181 206 0 0 0 0 0 0 0 0 0 33 214 247Rlectrlc Boler Prigta 26 40 67 50 260 310 0 0 0 0 0 0 0 0 0 76 300 376il. Portion Depreciated over 5 yearsVebicleA for Jirau 34 0 34 150 680 830 234 1070 1304 0 0 0 0 0 0 418 1750 2167Technical Services 146 72 918 456 2136 2592 263 1147 1409 0 0 0 0 0 0 865 4055 4920
Sub-Total 2008 4362 6369 4698 12054 16752 2346 8244 10590 1627 5257 6884 1105 3434 4539 11784 33351 45134
S. Deaum RcBtln baitoence-and 8tWidea Cavse
(not treated s assts the eare ay as Investenwt Component)1. Portion depreciated over 2 years as capital sparesIosy-Be Desel 0 0 0 20 25 45 46 129 175 35 129 163 0 0 0 101 283 383Diesel Rebabilitation 150 113 264 826 2142 2968 1005 3008 4013 867 2556 3423 487 1005 1280 3335 8824 121601lydropower Relbl itation 112 219 331 144 443 587 46 153 199 215 643 858 112 372 484 628 1830 2458Trenenlisoa and Substations 64 68 132 59 135 194 36 25 60 71 193 264 71 195 266 300 616 916Distribution Reinforcement 137 382 519 166 517 682 189 572 761 167 576 743 150 495 645 808 2542 3349il. Portion depreciated over S yearsPlarnigA Aistanee 61 247 308 66 330 395 58 299 357 80 149 229 0 0 0 265 1025 1289Small Hydropoer Plaming 0 0 0 0 0 0 0 0 0 0 0 0 0 0 0 0 0 0Espnasioa Plannn Studies 0 0 0 54 897 951 0 0 0 0 0 0 0 0 0 54 897 951Feasibiiity 8tudies 0 150 IS0 0 0 0 0 0 0 0 0 0 0 0 0 0 1S0 150
Sub-total 524 1180 1703 1334 4488 5821 1380 4186 5566 1434 4245 5679 819 206 2887 5490 16166 21656
Total 2531 5541 8072 6032 16542 22574 3726 12430 16156 3061 9502 12563 1924 5502 7426 17274 49517 66791
C. Other Components to be flnaced subject to feasibility studles
hmbodtroka Hydropower 0 0 0 0 0 0 0 0 0 0 100 500 600 100 500 600(early construction costs)
Total JIhAr( nvestment 2531 S541 8072 6032 16542 22574 3726 12430 16156 3061 9502 12563 2024 6002 8026 17374 50017 67391(including Duties nd t zes)In B}h by Year at prevalling rate 6567 21485 17831 15945 11714 73542
Addltional Investments Agreed Outslde of RIP which do not add to JIRAKA debt service obligations 2
Over INe 19-0 verlodx
Operatitg Spare Parts and 3280Consonables 1275-Ulectric Poilers(by eanterprise concerned)
TOTAL 4555

- 68 - ANNEX 5.2
Page 1 of 5
MADAGASCAR
ENERGY I PROJECT
Project Description
The proposed project would aim at (a) rehabilitating the powersector's generation, transmission and distribution system; (b) improvingthe financial viability of the energy sector parastatals, most importantlythat of Jirama through increasing the use of existing hydroelectricitysurplus by domestic, small commercial and industrial consumers; (c)strengthening the capability of Jirama to develop least-cost expansionplans and investment programs; (d) strengthening the Government's energyplanning capacity; (e) initiating an integrated household energy planningprogram; and (f) developing new biomass fuel sources for household andindustrial fuel supply. The proposed project includes the development of aleast-cost power subsector expansion program for the period 1988-2007, withparticular emphasis on needs for power subsector Investment for the1988-1997 period.
Components
Most of the proposed power subsector rehabilitation items areenvisaged in two phases. In all cases, the first phase would coverprovision of the most urgently required spare parts and consultant servicesthat would define precisely the rehabilitation needs in the diesel andhydrogeneration areas, ranking them according to economic priority, andpreparing specifications for procurement, bidding documents, implementationschedules and a system for ongoing evaluation, monitoring and economicprioritization of required future works. This phase will last 6-12months. The second phase generally includes procurement and installationof spare parts, new plant, and management systems required to restore thepower system to stable and efficient levels of operation and ensure systemreliability over the medium term (2-5 years).
I. Power Components
(a) Generation:
(i) Nosi-B6 Diesel: A new diesel power etation would becommissionned by 1990 with three 800 kW units, which would complement the800 kW unit added as part of the first phase of emergency upgrading andrepairs to the existing old power station (see Diesel rehabilitationbelow).
(b) Diesel Generatlig Stations Rehabilitation
(i) Mahajunga: One new oil storage tank, one settling tank,including all fuel handling and treatment facilities, as well as augmentingthe supply of spare parts and engine repair as part of the first phase ofrehabilitation. The second phase would include a second storage andsettling tank and related oil handling facilities, Including an incineratorfor spent oil, and workshop.

-69-ANNEX 5.2Page 2 of 5
(ii) Nosi-B6: An urgent repair and capacity augmentation programis envisaged in order to stablize supply before the commissionning of a newdiesel power plant in 1990. This, first phase would include theinstallation of a new 800 kW unit in the old power station, furthertransfer of additional capacity from Toliary powerhouse, and the supply ofspare parts and consumables.
(iil) Other Stations: A detailed review of other diesel powergenerating stations would be completed so as to determine which unitsshould be abandoned and the preclse nature of the required repair andrehabilitation program in accordance with economic and strategicpriorities.
(iv) Spare Parts: The project would provide economicallyjustified spare parts and consumable items as determined by an assessmentof each of the generating stations made as Phase I of the project.
(v) Mobile Maintenance: Four wheel drive trucks and trailersequipped with one 200 kW generating unit, complete sets of hand and powertools (lathe, drill, grinder, etc) and commonly used spare parts andconsumables.
(c) Hydroelectric CGerating Stations Behabilitation
(i) Vatomandry: Repair of electrical system to allow units tooperate in synchronism, and repairs to the turbine governors. Otherrepairs would be made only if economically justified and could includereplacement of the penstock and miscellaneous repairs to dam, spillway, andtransmission line, as well as the supply of spare parts.
(iL) Manandray: General overhaul of the plant would be carriedout initially with emphasis on the electrical equipment and the controlsystem so as to ensure continued stable operation. This would be followed,if economic and strategically sound, by the replacement of one turbinerunner, which would also augment plant energy and capacity, minor repairsto the dam, and the supply of a stock of spare parts.
(iii) Manandona: General overhaul of the plant would be under-taken with emphasis on electrical controls, switchgear, and transformers.The turbines and generators would be overhauled and repairs to the damcompleted, in order to restore operational reliability and augment the firmplant energy and capacity output.
(iv) Mandraka: Enlargement of the supply canal to the intake soas to improve the hydraulic capacity and permit the generation of anadditional 4 MW during peak demand periods. Other options for reconfigura-tion of its peaking capacity would be examined before finalizing invest-ment.
(d) Transmission and Substatioos: As for the generation expendi-tures, an urgent first phase would be included to prevent prolonguedoutages, followed by a second phase of orderly repair to enable longer termstable operation at anticipated demand levels.

- 70 -ANNEX 5.2
(i) Transmission: Provision of new poles and lightning protectionand by the addition of a ground wire for the completion of the ongoingrehabilitation of the 63 kV line between Antananarivo and Antsirabe plusvarious maintenance and repair tasks on other transmission lines.
(ii) Substations: Spare parts for switchgear would be provided asa matter of urgency, new transformers and related switchgear would beprovided to cover system expansion and to fully rehabilitate Toamasinasubstations in Phase II.
(e) Distribution: This component would comprise, firstly, rehabili-tation of existing netowrks, followed by major expansion, and new designtrials.
(i) Pilot Project: To establish revised design criteria to reducecasts of providing electric service to domestic and small commercialconsumers and in and around existing urban supply centers.
(ii) Distribution Reinforcement:
(a) Rehabilitation Material: Provision of the necessaryconductor, pole hardware and distribution transformers for alreadyprogrammed works, as well as additional similar material to establish arequired stock of spare parts and materials.
(b) New Connections: Distribution material needed toprovide service progressively up to the level of about 6,500 consumers peryear, Including poles, conductors, transformers, service drops, meters andassociated equipment would be provided towards meeting a backlog presentlyestimated in 1986 at more than 10,000 customers.
(f) General Plant:
(M) Vehicles for Jirama: About $250,000 worth of spare parts andabout 100 new vehicles (utility trucks, cable carriers, pole carriers, 4WDtransport vehicles, and personel carriers) would be provided.
(ii) Technical Services:
(a) Communications: The provision of spare parts forexisting radio facilities and the provision of new fixed and mobile radiosfor the ICS and radio and telecommunications equipment for communicationbetween JIRAMA headquarters and other major supply zones.
(b) Meter Laboratory: The provision of a new test bench,rotating standards, and miscellaneous testing equipment.
(c) Monitoring Equipment: The provision of specializedInstruments and tools and techniques, and the training of personnel inmodern diesel power plant operation and maintenance.
(d) Computers and Software: Equipment compatible withexisting computer facilities would be procured for both computerization ofconsumer billing and accounts in the Zone Exteriore supply centres, and for

- 71 -ANNEX 5.2Page 4 of 5
computerization of the asset base, including a complete asset revaluation.Computer maintenance training and a complete review of JIRAMA computeriza-tion policy and planning are also included.
(g) Power Sector Institution Buildiug:
(i) Planning Assistance: Provision of 24 man-months for aresident power system planner, plus 27 man-months of back-up consultingservices for specialized advice and training in Madagascar within theDirection of Economic Studies and Planning (DEEP), Jirama, and $210,000 foroverseas training for long and short duration courses, and study tours,shared by DEEP and the Direction of Electrical Equipment. The componentwould include computer software, hardware, specialized office equipment andlibrary support.
(5) P?smr Sector Studies:
(1) Least Cost Expansion Planning and Tariffs: Funds would beprovided to cover the cost of consultants for the preparation of a powersector master plan for Madagascar with emphasis on transfer of models andskills so as to enable dynamic updating of plans and investment programs aspart of regular utility planning, budgeting and management. It wouldinclude the development of strategy to achieve a rational tariff structurewithin an acceptable period.
(ii) Hydropower Feasibility Studies: Supplemental funding toensure the completion of a full feasibility study for the scaled-downversion of the Ambodiroka hydropower plant.
(1) Electric UJiler Prograu: Foreign exchange financing of about18 MW of electric boller capacity, serving an annual energy demand of about96 GWh, to be installed at PAPMAD (paper-mill), Savonnerie Tropicale(soap), SOMACO (textiles), and the Rilton Hotel.
II. Energy Components
(a) Dousebold and Idustrlal Fuels:
(i) Charcoal Production and Training: Provision for commercialproduction with private sector participation, or commercial-scale pilotproduction under FANALAMANGA's management, of charcoal from pine thinningsand othar fuel quality residues at the Haut Mangoro pine plantation. Theproject would Include technical assietance for the training of thetraditional private sector charcoal makers in more efficlent methods ofcharcoal production, plus consultant services for commercial-scale charcoalproduction in the FANALAMANGA pine plantation and for the development ofthe charcoal market in the industrial sector.
(ii) Rice Husk Briguettes: Provision of screw-press briquettingequipment and consultants services to commission and monitor the productionof a pilot project for the production of 1500 tonnes per year of rice huskbriquettes, in Antananarivo.

- 72 -ANNEX 5.2Page 5 of 5
(b) Umergy Planulg Support:
(1) Energy Planning Administration: This component wouldstrengthen energy planning administration in the GOM. it would include theprovision of 2.5 man-years of a resident consultant advisor to the Directorof Energy and Water in MIEM, and of 33 man-months of back-up consultingservices for specific training and specialist inputs for energy policy,planning and investment program review. In addition, provision is made fora study to review the options to minimize the cost of petroleum productssupply, including procurement of crude and products and the development ofa least cost expansion plan and investment program for the sectorencompassing storage and distribution facilities and crude refining. Theenergy planning component would also include computer facilities, vehicles,office equipment and about five man-years of overseas training.
(ii) Household Energy Planning Program: This component wouldenable the establishment of least cost supply and dewand management plans,investment programs and policies for the reduction of the economic cost andenvironmental impact of household cooking fuel supply to major urbancentres, including Antananarivo, Mahajunga and, logistics and fundingpermitting, Toliary. The program would include household energy surveys,reviews of woodfuels supply and marketing business, biomass resourceassessment and cooking efficiency components. The project would include 3man-years for a resident program manager, 82 man-months of specialistservices, vehicles, computer facilitles, and office and scientificequipment and services.
(c) Roergy Sector Studles:
(i) Industrial Energy Audits: Detailed ranklng of industrialenergy conservation needs and preparation of investment programs anddetailed specification and costing of the economically most importantmeasures, following a preliminary review by others.
(ii) Lac Aloatra Region Study: Detailed review of energy supplyand demand and development of a least cost master plan for regional energydevelopment in the Lac Aloatra rice growing region.

- 73 -ANNEX 5.03Page I of 3
MADAGASCARENERGY I PROJECT
SUMMARY OF COSTS WITH CONTINGENCIES INCLUDED IN EACK ITEM
FMG btllions US$ millionsL F T L F T
A. Power Subsector Components1.Generation
Nosy-Be Diesel 0.36 2.20 2.56 0.33 1.88 2.22Diesel Rehabllitation 1.82 10.74 12.56 1.56 9.08 10.64Hydropower 1ehablltatlon 0.20 4.82 5.02 0.21 4.23 4.44
Subtotal 2.38 17.75 20.13 2.10 15.19 17.302.Transdisslon & Sub-Stations 0.72 2.96 3.68 0.66 2.46 3.123.Distribution
Distrlbution Relnforcement 1.47 14.44 15.91 1.32 12.71 14.03Low Cost Pilot Project 0.00 0.20 0.20 0.00 0.21 0.22
Subtotal 1.48 14.64 16.12 1.32 12.92 14.254.General Plant
Vehicles for Jirama 0.03 1.83 1.86 0.03 1.75 1.78Technical Services 0.00 2.94 2.94 0.00 3.05 3.05
Subtotal 0.03 4.77 4.80 0.03 4.80 4.845.Power Sector Institution Building
Planning Assistance 0.26 1.03 1.29 0.25 1.02 1.276.Power Sector Studies
Expansion Planalng 6 Tariffs 0.05 0.85 0.90 0.05 0.90 0.95Hydropower Feasibility Studies 0.06 0.12 0.18 0.07 0.15 0.22
Subtotal 0.11 0.98 1.08 0.12 1.05 1.177.Electrtc Boiler Program 0.18 1.49 1.67 0.19 1.58 1.77
Subtotal Power Components 5.15 43.62 48.77 4.68 39.03 43.71
B. Energy Production Components8.Household and Industrial Fuels
Charcoal 0.09 1.03 1.11 0.09 1.00 1.09Rice Husk Briquettes 0.04 0.25 0.29 0.04 0.25 0.29
Subtotal 0.13 1.28 1.40 0.13 1.25 1.38C. Energy Sector Institution Building9.Energy Planning Support
Energy Planning Administration 0.50 1.43 1.93 0.48 1.41 1.89Household Energy Planning 1.66 1.69 3.34 1.54 1.67 3.21
Subtotal 2.16 3.11 5.27 2.02 3.07 5.0910lJergy Sector Studies
Industrial Energy Audits 0.00 0.29 0.29 0.00 0.30 0.30Lac Aloatra Region Study 0.00 0.29 0.29 0.00 0.30 0.30
Subtotal 0.00 0.57 0.57 0.00 0.60 0.60
Subtotal Energy Sector Components 2.29 4.96 7.25 2.15 4.93 7.07
Project Preparation a/ 0.00 0.71 0.71 0.00 0.87 0.87
Total Project Cost gxcl. D&T 7.44 49.29 56.73 6.83 44.83 51.66Duties and Taxes 9.10 0.00 9.10 8.15 0.00 8.15Total (mdcl. Duties/Tax) 16.54 49.29 65.83 14.98 44.83 59.81
a Fuinanced wlth funds advanced under PPFs in October and Dscember, 1986.

- 74 -ANNEX 5.3Pra o 2 Ef 3
EADA4ASCARmNmRGY K PROJECT
SUIHARY OF COSTS WITV CONTINGENCIES SHOWN SEPARATELY
FHG billions US$ millionsL F T L F T
A. Power Subs ctor Comonentsl.Gnerstion
Now Diesel Plant 0.31 1.86 2.17 0.29 1.60 1.89Diesel Rehabilitation 1.61 $.49 11.10 1.39 8.06 9.45Hydropower Rehabilitation 0.19 4.33 4.52 O.d9 3.82 4.01
,Subtotal 2.11 15.68 17.78 1.87 13.48 15.352.Transiession 0.64 2.59 3.23 0.59 2.17 2.763. Distribution
Distribution Relnforcemsnt 1.26 12.24 13.50 1.14 10.87 12.00Low Cost Pilot Project .00 0.18 0.18 .00 0.19 0.19
Subtotal 1.26 12.42 13.68 1.14 11.06 12.194.Gsneral Plant
Vehieles for Jirave 0.02 1.60 1.63 0.03 1.54 1.57Technical Services 0*00 2.73 2.73 0.00 2.84 2.84
Subtotal 0.02 4.33 4.3S 0.03 4.37 4.40S.Power Sector Institution Building
Plananig Assistance 0.23 0.95 1.18 0.22 0.94 1.166.Power sector Studies
Expanston Planning & Tariffs 0.05 0.79 0.84 0.05 0.83 0.88Hydropower Feaslblity Studies 0.06 0.12 0.18 0.07 0.15 0.22
Subtotal 0.10 0.91 1,02 0.12 0.98 1.107.Electric Boller Program 0.17 1.38 1.55 0.18 1.46 1.64
Subtotal Power Components 4.54 38.25 42.79 4.16 34.45 38.61
B. Energy Production ComponentsB,ousehold and Industrial Fuels
Charcoal 0.08 0.98 1.06 0.09 0.96 1.04Rice Husk Briquettes 0.03 0.21 0.24 0.03 0.21 0.25
Subtotal 0.12 1.19 1.31 0.12 1.17 1.29
c. Energy Sector Institution BuildingL9.Energy Planning Support
Energy Planning Administtration 0.46 1.30 1.76 0.44 1.29 1.73Household Energy Planning 1.49 1.54 3.03 1.39 1.53 2.92
Subtotal 1.94 2.85 4.79 1.82 2.82 4.6510.Energy Sector Studies
Industrlal Energy Audits 0.00 0.28 0.28 0.00 0.29 0.29Lae Aloatra Region Study 0.00 0.28 0.28 0.00 0.29 0.29
Subtotal 0.00 0.55 0.55 0.00 0.58 0.58Subtotal Energy Sector 2.06 4.59 6.65 1.94 4.57 6.52
Project Preparation a/ 0.00 0.71 0.71 0.00 0.87 0.87
Total Bas. Cost 6.60 43.55 50.14 6*.10 39.90 46.00ContingenciesPhystel 0*40 2.67 3.07 0*37 2.60 2.97Price 0*43 2.75 3.18 0.35 2.33 2.69
Total (excl. Duties/Taxes) 7.43 48.96 56.39 6.83 44.83 51.66Duties and Taxes 9.10 0.00 9.10 8.1S 0.00 8.1S
Total (tact. Duties/Taxes) 16.52 4R.96 65.49 14.98 44.83 59.81
( tinanced with funds advanced undra me in October and Decomber, 1986.

- 75 ~ ANNEX 5.3Page 3 of 3
MADAGASCARENERGY I PROJECT
PROJECT COST SUMMARY SHOWING INDIVIDUAL COST CATEGORIES(Contingencles not included tn each sub-project)
IWG billions US$ millionsL F T L F T
Base CostCivil Worge, Equipment, Materials & Installation
A. Power Subsector Components1.Generation
Nosy-Be D0esel Plant 0.1) 1.62 1.79 0.16 1.37 1.53Diesel Rehabilitation 1.40 9.38 10.78 1.19 7.95 9.14Hydropower Rehabilitation 0.12 3.99 4.11 0.12 3.52 3.64
S Subtotal 1.69 14*99 16.67 1.47 12.85 14.312.Transmission & Substations 0.58 2.59 3.17 0.54 2.17 2.713.Distribution
Distributlon Reinforcement 1.03 12.24 13.27 0.90 10.87 11*77Low Cost Pilot Project 0.00 0.12 0.12 0.00 0.13 0.13
Subtotal 1.03 12.36 13.39 0.90 11.00 11.904.General Plant
Vehicles for Jirsam 0.00 1.60 1.60 0.00 1.54 1.54Technical Services 0.00 2.30 2.30 0.00 2.41 2.41
Subtotal 0.00 3.90 3.90 0.00 3.95 3.955.Power Sector Institutlon Building
Planning Assistance 0.23 0.95 1.18 0.22 0.94 1.166.Power Sector Studies
Expaosion Planning & Tariffs 0.05 0.79 0.84 0.05 0.83 0.88Hydropower Feasibility Studies 0.06 0.12 0.18 0.07 0.15 0.22
Subtotal 0.10 0.91 1.02 0.12 0.98 1.107.Electric Boller Program 0.14 1.31 1.46 0.15 1.38 1.53
Subtotal Power Components 3.78 37.01 40.79 3.40 33.26 36.65
S. Energy Production Coomonents8.Rousehold and Industrial Fuels
Charcoal 0.07 0.48 0.55 0.08 0.51 0.58Rice Husk Briquettes 0.03 0.15 0.18 0.03 0.15 0.18
Subtotal 0.10 0.63 0.73 0.10 0.66 0.76
C. Energy Institution Building9.3nergy Planning Support
Energy Planning Administration 0.46 1.30 1.76 0,44 1.29 1.73Household Energy Planning 1.49 1.54 3.03 1.39 1.53 2.92
Subtotal 1.94 2.85 4.79 1.82 2.82 4.6510.Energy Sector Studles
Industrial Energy Audits 0.00 0.28 0.28 0.00 0.29 0.29Lat Alostra Region Study 0.00 0.28 0.28 0.00 0.29 0.29
Subtotal 0.00 0.55 0.55 0.00 0.58 0.58New Diesel Plant 0.31 1.86 2.17 0.29 1.60 1.89
Subtotal Egy Sector Institutions 1.94 3.40 5.34 1.82 3.40 5.23
Engineering and Administratlon 0.77 1.80 2.57 0.77 1.71 2.48
Total Base Cost 6.60 42.84 49.44 6.10 39.03 45.13ContingenciesPhysical 0.40 2.67 3.07 0.37 2.60 2.97Price 0.43 2.75 3.18 0.35 2.33 2.69Total Contingencies 0.83 5.42 6.25 0.73 4.93 5.66
Duties and Taxes 9.10 0.00 9.10 8.15 0.00 8.15
Subtotal 16.52 48.26 64.78 14.98 43.96 58.94Project Preparation al 0.00 0.71 0.71 0.00 0.87 0.87
Total Project Cost 16.52 48.96 65.48 14.98 44.83 59.81
Y Financed with funds advanced under PPFs io October ad December, 1986.

- 76-
AMNEX 5.4
HADAGSARENERGY I PRDJECT
SUMMARY OF PROJECT IMPURENTION SCI DUIZ
BidDocuments Bid Contract Implemntatlon
Compoent or TOR Opening Award Begining Completion
Nosi-b6 New Diesel 11/88 2/89 4/89 6/89 12/90
Hydropowar RehabilitationConsultants 2/87 5/87 7/87 8/87 12/89Repairs Phase I 8/87 11/87 1/88 3/88 12/89Repairs Phase II 6/89 10/89 12/89 1/90 12/91
Diesel RehabilitationConsultants 2/87 5/87 7(87 8/87 12/90Repairs Phase I 1/88 3/88 5/88 7/88 12/89Repairs Phase II 6/89 10/89 12/89 1/90 12/91
Transmission 12/87 4/88 6/88 7/88 12/89
Electric Boilers 6/87 10/87 12/87 1/88 12/88
Distribution 8/87 12/87 2/88 4/88 12/88
SUPDort S ervicesCominications and
Meter Laboratory 12/87 2/88 4/88 6/88 12/88Computer Services Phase I 2/88 5/88 7/88 9/88 6/90
Phase II 2/89 5/89 7/89 9/89 6/91
Vehicles Phase I 8/87 12/87 2/88 4/88 6/88Phase II 12/88 3/89 5/89 7/89 12/90
Institution BuildingJIgRm Technical Assistance 6/87 10/87 12/87 3/88 6/91Eoergy Planning Administration 3/87 6/87 9/87 12/87 12/90Household Energy Planning 9/87 12/87 3/88 6/88 6/91
Power StudiesAmbodiroka 10/86 12/86 2/87 3/87 12/87Expansion Plan/Tariffs 6/87 10/87 12/87 1/88 12/89Energy Production
Charcoal T.A. 9/87 11/87 1/88 3/88 3/91Charcoal Production 6/87 9/87 12/87 2/88 2/91Rice Bask Briquettes 9/87-3/88 12/87-6/88 9/88 10/88 12/91
Energy StudiesIndustrial Energy 12/87 3/88 6/88 7/88 12/89Lae Aloatra 6/87 9/87 11/87 1/88 6/89

- 77 -
AMNEN 5,5
NADAGASCAR
ENERGY I PROJECT
Electric Boiler Project - General Contract Terms and Conditions
1. General conditions Ef the proposed contracts were discussed withthe enterprises and with JIRAMA during appraisal. They are that:
a) The enterprises would own and operate electric boilers they wouldprocure for their needs;
b) JIRAMA would reinforce the network sufficient to supplyinstallations at the maximum possible boilkr demand;
c) JIRAMA would supply non-interruptable power at negotiatedconcessional rates for a guaranteed period (possibly through1992/93); thereafter with interruption clauses applying,. whenpower at weekday, daytime peaks nay be limited but energy wouldnot be a constraint (possibly through 1996/97), and then formajor interruptions, daily or seasonally when hydro-energy may belimited, though boiler operation could be guaranteed onconcessional rates during weekends and at night and non-peakperiods in daytime (possibly through year 2000).
d) Prices would be formula-based, taking into account inflation,price variation for substitute fuel and other factors which mayprove relevant. Reviews of pricing formulae and other terms andconditions would take place after the first period ofunrestricted supply.
e) Enterprises would be required to maintain in satisfactory workingcondition their present fuel oil or woodfuel boilers.

- 78 - AME 5.6!Wige1 f 4
MADGASCARENRGY I PROJECT
FINANCING PLAN(Us$ millions)
OtherItem DA JIRAM GOM Ancles Total
F L F L F L F L F Total
Power Sector Camponents1. Nsy Be 0.3 1.9 0.3 1*9 2.22. Hydropower Rehab 4.2 0.2 0.2 4*2 4.43. Diesel Rebab 5.5 1.6 3.5 1.6 9.0 10.64. Tran 8mission - 0.6 2.5 0.6 2.5 3.15. Elc. Boilers 1.6 0.2 0.2 1.6 1.86. Distribution 3.0 1.3 9.9 1.3 12.9 14.27. Supprt Services 1.1 2.0 3.1 3.18. Vehicles 1.7 1.7 1.79. Institutional
Strengthening 1.0 0.3 0.3 1.0 1.310. Studies 1.1 0.1 0.1 1.1 1.2
Subtotal 19.2 4.4 0.2 19.6 4.6 39.0 43,6
nergy Sector Comoats1. Energy Planning
Administration 1.4 0.5 0.5 1.4 1.9Hbusehold Energy 1.6 1.6 1.6 1.6 3.2
2. Energy ProductionCharcoal 1.0 0.1 0.1 1.0 1.1Rice RHsks 0.3 0.3 0.3
3. Sector Studies 0.6 0.6 0.6
Subkotal 4.9 2.2 0.2 2.2 4.9 7.1
PPP 0.9 0.9 0.9Duties and Taxes 6.1 2.1 8.2 8.2
Overall Ibtal 25.0 10.5 4.3 0.2 19.8 15.0 44.8 59.8

- 79 -14~
IN= I PrJC?
FilwactDg Pla for P r Ssector bferwees rnvst Pt agrn (RIP) and Imrp SEt or(US$ tmEsl: forei adug reidmts cely)
RIP-- DI -- z NB BAfA SMFoe I tsw IL
A. Pam sasm8aR omaW1S
1. Volobe 8460 0 8060 0
2. New )esel Plat (Nosyi) 1884 0 1884 0
3. 1fdropcmr Sehabitatimi8L -Yuxtrka bsbmlltatLon 2806 2BD6 0 0Mtekmuita l0itat1n 835 0 8s 0Nau.um Rd11AtatJ( 440 440 0 0Spre Pats - General. 347 18 16 0
3i)totl 1.4428 3428 0 0 I= 0If ficlaIy Taproeuts 800 0 800 0 0
TO s228 34 80 0 0 0100 0
4. Diesel RbtatioPebabilitatiii & Spam 818 30D 300D 1300 3M 0MM M t o 2200 0 2200 0 0
Toa 10382 300 5200 1300 358 0 0 0
5. Tasdocw=lICUtation 327 0 327 0
213 0 2137 0IbTal 2464 0 0 2464 0
6. Mctric Boilers 300 300 0 0
& coaultants)
7. Dl18triaitionPilot Project 214 214 0~bsbllltst4a ter1al 3137 109 L3OD 1728 0NW C cti 9572 0 1400 4500 3672 0
Ttal I292 323 270 0 4500 54 0 0
Garal Plat & & t ervicesA. Spp= Serdvi
c aumd 2m 00 0 200 0Nie Lowa IsD I° ?~1nts_su t 1000 0 1000 0
C8& Sen11 s 9Q5 Ws605 300 0Subtotal 4055 755 300 100 2000 0 0 0
B. Veidw 1750 750 1000 0Ts 5805 1505 1300 1OO0 200 0

- 80 - AM 5.6Big 3 1 4
Pinancing Plan for Pr w ecta Referamom Testment Prog (RUP) an!d bur Sectr kzwbW(US$ thmmbxs: foreiP ex amap re#Lruets my)
MP - m InkB M1Ig SSS Wm ax!edPho I Phase r
9. Pow Sector In.tstaic MidiTecical bat. Plamir4 1025 1025 0
10. SuiesWdropum Feaibility Sud 150 150 0 0 0least Cost EMnsim Plm w 897 0
ibtal 1047 1047 0 0 0. 0 0 0
P SIDSDM SUBM1TL 49518 7928 10000 10760 14430 S400 140 0
hAbodivoka 5O(uhdic cma be regardedas incl4in uallocated)Pam S DSE WML 50018 7928 10000 10760 14430 5400 100D 0
FEMTnG SPARES 3280 2780 500a/
Mectric Boilers 1275 1275(eawprpda iuvesums powimi
- IAilielUS Do ,ll_1io FPnaz Proposed for RUP: Eclwqe Firm Pinuzing Actual A11o.atiu
Cai Centrale 84 mi Frmh PFrs 6.20 13.55 13.54Eropeam 1wst. Bank 13.5 m mi 0.91 14.85 14.43mdms tvelopot Coop. 2.2 m Wmdss FrancS 1.47 1.50 1.5BAJA 5.4 m US Dolz 1.00 5.40 5.4
Toa 34.87
a/ -Sds mlkopnt Cberaon fulirg cm be apsplid to the prcs of Wias te saepat for Volobe pWroided this to ooitemt idth the rebb iptatien oim firlly selected.Volobe spare par would be financed by reallocatig Sds fuufDng for geral spae p pas ad
-wtb spare.

- 81 - AM 5.6
Peg 4 of 4
Tincirg Plm for Pow sector 1eferos Investnt Ptpngm (tIP) and Eb y Sector euwsft(US$ thu bs: forelip exibup reqursa only)
B: ENRG S 8CeU , M Tal.Rdre&urw -rps nuc PlmSetor (Us$ )muos)
Irwestunmts DIM 1ED FAC Other Othe Unfrm
1. Duvpab 94wr%erg Pig. r a 1406 1406 0Ixb held E&w Plamng 1969 1669 300 0Thtal 3375 3075 300 0 0 0
2. B-IM Probuction C'q9mitsChrcoal 1000 1000 0Rkce Hlsk Briquettes 252 252 0
tal 1252 1252 0 0 0 0 0 0
3. FRg Sector St%JissTnUtial Meg l Adit II 600 300 300 0Lac Aloatra Regioa Stp* 300 300 0
btal 900 600 300 0 0 0 0 0
FAL ENM o afawas 5527 4927 600 0 0 0
C: Mk Project Prej. FacUlty 870 870 0
FDMAU of IT ESDW PLAS Investmnt ID 0 EB E3 BAWA S WMS FA: UfuiadCmdAbed Energ & POW PrgraTLIBetZRmt Pfgpus
(areot US$) 56415 23725 10760 14430 5400 1000 600 0 500
OERAL FIIDG(nxlixtg aperating sper 60 25000 13540 14430 5400 LW0 600 0 SODand electric boilers)

- 82 -
ANNEX 5.7
MDAGACARRGY I PROJECT
ESTIMATED sCHEDULE or DISSURSEHENTS a/(US$ Minions)
TrA Fiscal Semester Semester Cumulative X offear Semester Ending Disbursements Disbursements Total
88-1 12/31/87 0.25 0.25 188-2 6/30/88 0.75 1.00 489-1 12/31/88 1.25 2.25 889-2 6/30/89 2.75 5.00 2090-1 12131/89 3.50 8.50 3490-2 6/30,'90 4.00 12.50 5091-1 12/31/90 3.75 16.25 6591-2 6/30/91 3.25 19.50 7892-1 12/31/91 2.50 22.00 8892-2 6/30/92 3.00 25.00 100
a/ The disbursement sebedule confirms with the standard profile for Bankloans and IDA credits for power projects in the Eastern and SoutbernAfrica Region.

-83 - ANNEX 6.1page I of 3
MADAGASCAR
ENERGY I PROJECT
JIRAMA Reform Measures
Financial Measures
1. Capital Increase. The 1986 increase has been calculated at aboutFMG 7.42 billion and to designed to balance JIRAMA's 1986 cash flow. Toeffect the equity contribution the GOM may make payment to JIRAMA; anoffsetting arrangement against JIRAMA's 1986 debt service owed to GOM isanother possibility. Further capital increases in 1987-1990 totallingabout FMG 18 billion are necessary to strengthen JIRAMA's weak equitybase. Annual amounts are estimated FMG 4, 7.6, 4.6 and 2.3 billion for1987 to 1990 respectively.
2. Consolidation of Short-term Debt. FMG 1.73 billion of overdraftwith BNI will be converted into a medium-term loan of 5 years, at 15.5Sinterest, in line with current domestic interest rates for this type offinancial instrument.
3. Rescheduling of Andekaleka and Namorona Loans. Both powergeneration assets are performing at only a fraction of capacity as demandgrowth has not kept pace with the rates projected at the time theinvestment decisions for these projects were made. Sales revenues aretherefore insufficient to cover the debt service and in recent years JIRAMAhas had trouble meeting its debt service obligations vis-a-vis the COM,which had onlent to JIRAMA funds from IDA, Opec Fund, BADEA, CIDA, CCCE,OECI, Kuwait Fund, and Saudi Fund. Under the rescheduling, the level ofprincipal repayment to GOM will be tied to the rate of utilization of thepower plant that the loans financed. Similarly, only interest equivalentto the rate of utilization will be payable; for the rest Government willmake matching capital contributions. The implied change In onlending termsmay require the approval by some of the donors; however, such approval isnot expected to be withheld. IDA has offered to explain if necessary therationale for rescheduling to other donors. Based on present demandforecast, full principal repayment would commence by about 1996. Theportion of principal payable in 1987-1992 would be 36X, 55%, 602, 701, 761and 791 respectively.
4. Divestiture of Subsidiary and Associated Operations. JIRAMA'slight bulb, water meter, and electrical appliances activities are incurringcontinuous losses requiring cash injections that JIRAMA cannot afford.These operations will either be sold, transferred to the portfolio of thePNI, or liquidated, and preceded if necessary by a period of mothballing.For the financial rehabilitation program it is assumed that the divestiturewould not yield any positive cashflow. The benefit would be to avoidfuture losses and cash drains and to enable JIRAMA to concentrate itsefforts on its mainstream business of electricity and water supply.
5. Reduction of 1986 Investment Program. During appraisal it wasagreed with JIRAMA to adjust the program downward by FMG 1 billionreflecting actual 1986 investments to date and realistic implementationexoectations during the rest of the year.

- 84 - ANNEX 6.1page Z or 3
6. Settlement of Arrears. Based on end 1985 figures the arrears tobe settled in line with the schedule of Table 6.3 would be as follows:
(PMG billion)1986 1987
(a) Arrears to be settled byJIRAMA vis-a-vis(i) General Budget 2.5 1.3(11) Autonomous and
Annexed Budgets - -(iii) INI - -(iv) Municipalities 0.0 1.5
Subtotal 2.5 2.8
(b) Arrears to be settledvis-a-vis JIRAMA bygi) General Budget 2.4 1.2(ii) Autonomous and
Annexed Budgets 0.7 0.4(iii) FNI 0.0 a/ 0.0 b/(iv) Others 0.1 0.0(v) Municipalities - 1.9
Subtotal 3.2 3.5
(c) Surplus for JIRAMA 0.7 0.7
a/ 1MG 15 millionb/ FMG 7 millionci rMG 37 million
The figures above are indicative as additional arrears incurred during 1986would be part of the settlement package.
(d) To help avoid recurrence of arrears, JIRAMA will introduce new rulesregarding the delivery and payment of its services by the administrativesector. These rules are expected to be similar to those governinghouseholds and commercial customers where the disconnection penalty isquickly applied and outstanding receivables are accordingly quite low.
Cost Reduction
7. Simplification of Tariffs. Whereas the necessary general reformof JIRAMA's tariffs can only be designed and implevented once the resultsof the tariff study (para. 5.07(f)) are available, the number of tariffscan be reduced now without much study as many tariffs differ only slightlyfrom each other. JIRAMA's 100 or so tariffs can easily be consolidatedinto 50 or less, making tariff administration and billing simpler and lesscostly. As part of the simplification effort, JIRAMA will reduce thenumber of power meters per consumer from two to one, which will not onlyhave an Impact on billing and meter reading but also reduce connectioncosts for new customers.

-85- ~~~~~ANNEX 6.1- 85 -page 3 of 3
Revenue Increases
8. Tariff Increases. Tariff increases are expected to be necessaryin each of the years covered by the forecastitig period. Together withcapital increases and other measures these are necessary to compensate forlocal inflation (about 15-17X p.a.) as well as to rebuild some measure offinancial strength within JIRAMA. Annual percentage increases will be 17%and 91 for 1987 and 1988, and are projected at 24X, 12%, 12% and 221 for1989-1992 respectively. However, apart from the 1987 increase which hasbeen implemented and the 1988 increase which has been agreed upon, actualannual tariff increases will be based on the results of the proposed annualreviews (para. 6.09).
l
9. Boiler Program. Incremental revenues for JIRAMA are projected atFMG 0.4 billion in 1988 and FMG 0.8 billion p.a. thereafter until about1997.

- 86 -
A Ior a os c A IANNEX 6.2
JON IKIE 11935 Oit ) .
1 llllawrmnt tow
* I~~~ctual Pra Tor,cast
1913 1911 1i6 1916 1 1 IN is 19 1991 1992
£iectv Sles 12,68 14,265 17,70 1B,711 23,102 27,s611 ,1 ",122 2,23 66,3bter lmls 527? t7 762 1,00 1,170 1,36 1,57 1,610 2,02 236
lotw 13,212 14,192 16,5,2 19,711 24,52 2,D 3,634 %,92 54,3114 6,732
6mmtl
Law M 17 247 269 336 36 455 23 60 other 2 169 20 234 2 30 36so 4 4 V
S*btotal 406 375 "4 5 612 716 623 917 1,09 1,22
!flwLake 43 36 343 401 470 s 632 m 61 %1r-el 3,765 4,627 5,251 6,092 6,819 9,31 1,532 11,0 13,2 16,06?Ote 911 919 1,1431 ,3 3 1,,61 2,15 2,42 2, 3J2
ubta 5,102 6,0 6,710 7,630 6,53 11,M 13,269 14,10 16,912 20,219
rulosdw ad Mt*hIkU .Lawr 732 690 19 1,16 1,2" 1,156 1,674 1,92 2,211 2,56Othe 191 733 659 m 962 1,5 1,214 1,396 1,65 1,0
Subto 23 1,623 1,s6 1,35 2,146 2,511 2,3 3,1 3,81 1 ,392
haubffceLAr 616 I,OI 97S 1,141 1,335 1,562 1,716 2,66 2,37 2,731Otew 61? 634 74 870 1,016 1,192 1,370 1,S76 ,1612 2,064
Sutotal 1,133 1,633 1,719 2,011 2,355 2,753 3,166 3,641 4,107 4,615
0 maqtim 3,671 3,714 4,261 4,619 4,72 8,073 12,832 1?,016 19,606 19,661
otald Euu 11,7? 13,346 11,755 17,018 18,756 25,625 32,179 39,116 45,613 56,346
I0t Ipwati1o Ik_ 679 173 1,131 m 93 1,05 1,21? 1,10 1,610 1,651
O natiq in. 2,145 1,119 4,916 3,466 6,721 4,181 6,M 6,225 10,311 20,25
Im-o tqzwpena 267 34 0 2,773 0 0 0 0 0 0
intrst 5,318 5,356 5,m77 ,45 6,030 7,139 9,341 11,178 12,966 15,16?
IktI T (3,40) (3,571) (657) (4,752) 691 (3,2) (3,066) 2,952) (2,65) S,0mm _ _ _ _ _ _ _ __m m m m

xmg osm mm in41MMIsw mmine goo"". osm 1"n0mm
swNt Awmf oWN lS'sz Win itAl mal 0lWU sWul 5WN W PM l4^ 1i
viZtI avul am snei s a rm are wein 6U f 't& Iw
seI wi' t'tl gwti wit 111 Wi US'S 668 3asw' A
(65!'&l) (W6'61) (ZS9I) (OWII') ( O (WSV 't(61'S (6'f) (WI) 6 aWLS Sm'SS bi'IS Iwo w'% tW W Ir t!w 'f 61! pionIT RN^IO MSI w' siv Si'S ise tU' h' w m%'! own "s on
Si9 59 019 £55 5 i Of a6 6 ESf A35
S'SEZ t6 US'U 31 l S5 S'If WWl WS'S WSu OW L8 I
Oz'S1 st' SU'le WI'S SW'L WS ur* 9rs 'tit r's ua PM onitW'i 31'1 SU'AI W6'III 5't rli WS'i6 Sff'S IfI Ni M
tw'u mu6' U6w9i swi' sai uv'S6 LL urn,sw iw'! new I'IWs
0W61 iOI'I SL'OI 21'$ SIU'S e's i g'I rnt 'S U 1 PAOI'Z 9't 9'1 aWI Di'l 0 b6 VA i'! 69' I1 NIS "IPR"° 0 5 0 0 0 'SI Ue Il'l L't A%5
951S Ui 5 L'i tN'£ Uwt 't I'9 WS WI ' "TSO 5 0 w1l S !' I W Art 1P"
4tlt" P 01TW= _ ==
_m mm_ _s saw" OWN" asatt*
WVS WsIE i'ESh E'US U'IE W in ' sl As1 swis Wuui S 1PI
! 111 25'1 W;1 Ii'I ML 56 8 52l 51
61'S tIt'I WIso St St o' g go Siz S'e a 1'2 l Sl'l r
6I'W til £1£'i Ut' W9 SWr SW'u o't S WS I h
69`99 65 6 W1 S'i 5 I '5 'litl 90 1 51Il il
' L16'MS U ZS' 2I 516 1 W' N515' N SI t 'W S 3 450Ms'19 0'61 LU'tS 6WM W09 `61 S5'0I 619 651 0w6
%6WDI WOI 96'6 OW6 90`6 SlS'l IWO IL gw Wz f t . tMr'9l 61611 64'01 06'1 W9111S UL'llW '11 WI R"1801 I tt
Sl3)SSU
5161 1661 0661 161 St1 561 9861 61 bI1 561
}|@@|jeJ (ull IUS Jlf5IUgi(tM 4411P SU)
MUM6 01611Ws Qt'9 XatSNV I AI
5132 $101014

- 88 -
1A0a6ASCaR ANNEX 6.4
ENERN I PIWEtI
JIW - SOMICES 0 USES O RMS 19841992 (BMW 31)
(flU6 mllIoncuret trn)
A ctual frog forecast
1983 1981 1985 1986 1987 1988 1989 199 1 1992
Opertng In 1,819 1,918 3,466 6,721 1,189 6,M 8,226 10,311 20,235precIation 3,714 1,281 4,019 1,792 8,073 12,832 17,l08 15,666 19,669
C frg OprtIons 5,533 9,199 8,286 11,513 12,257 19,105 25,274 29,917 39,SW
DeductionInt 5,356 5,775 5,445 6,030 7,439 9,341 11,178 12,906 15,167t/qAity Cowrion 0 0 0 (3,150) (2,578) (2,550) (2,24) (2,021) (1,953)mPncipl 2,481 11,183 7,079 4,226 5,711 7,115 9,106 10,725 14,1031mev in orhing CapItdl (992) 12,41? 1,281 4,O 1,097 2,203 2,109 1,761 3,193Otw Dectio (8) (79) (26) (25) (26) (28) (29) (31) (32)
6,837 29,297 13,77 11,161 11,633 16,381 20,071 23,420 30,478
oribution to Imn tn (1,301) (20,098) (5,493) S3 624 2,723 S,204 6,49? S,426
Inutnet Pramy 1,950 4,2 5,209 6,569 21,4% 17,133 15,948 10,89 27,6%
innts in Sridues 216 156 0 0 0 0 0 a 0
riming 6"p 3,470 24,0 10,702 6,218 20,872 15,110 10,744 4,342 18,270
Fimoce yLong Ta wrovrwrp 2,755 2,349 2,934 3,866 14,990 12,966 11,3M0 7,278 18,635werdraft 41 (967) (1,?30) 0 174 (170 0 0 0Equity Contribution 22,259 9,090 850 5,000 2,0 0 0 0Ce_r Contv.Cdclmne Si dy 769 1,206 1,346 70Q 700 700 700 0?0 700
Total 3,564 24,94? 11,6t0 5,416 20,864 15,492 12,008 7,978 19,335
Cah Incream 94 40 936 (802) (8) 382 1,264 3,636 1,065Ye ed Cauh 480 574 613 1,551 748 741 1,123 2,386 6,023 7,007

-89- ANNEX 6.5
Page 1 of 2
MADAGASCAR
ENERGY I PROJECT
Assumptions Used for Financial Analysis
1. Inflation and Exchange Rates. The following rates were used:
1986 1987 1988 1989 1990 1991 1992
Domestic Inflation(%) 17 17 17 1S 15 1S 15
Intern. Inflation(M), 12 3.0 1.0 1.0 1.0 3,5 3.5
Devaluation of FMG(1) 17.8 17 17 15 15 15 15
2. Sales and Revenues. Sales for the 'eriod 1986-1992 arecalculated on the basis of the demand forecast agreed -.ith JIRAMA (Annexes4.1 through 4.3). Revenues are based on the following average tariffincreases, to become effecetive on January 1 of each year.
1987 1988 1989 1990 1991 1992
Average Tariff Increase(%) 17 9 24 12 12 22
The tariff for the electric boilers has been assumed at FMG 8/kWhand has been kept constant during the projection period. Thisassumption will be reviewed at the time JIRAMA presents the draftcontracts with the potential boiler users (Table 6.3).
3. Operating Costs. Constant operating costs have been estimatedbased on generating and maintenance requirements. Personnel has been keptat existing levels. Domestic inflation as indicated above have been appliedto personnel and other expenditures except fuel. Unit fuel costs have beeninflated in line with the devaluation of the FMG.
4. Assets and Depreciation. Pending the results of the assetrevaluation study (para. 5.07 (d)), the projections assume two adjustmentsof the asset base, both taking effect from 1987. The first one is a 20%across the board reduction, reflecting current estimates of obsolete,non-productive assets. The second adjustment concerns JIRAMA's investmentsin the Andekaleka and Namorona hydro projects both of which are currentlyonly partially performing assets with low capacity utilixation. Theseassets are temporarily adjusted downward in line with their ratio ofcapacity utilixation, and then increased annually in line with projectedutilization. The two asset adjustments are accounted for as"Non-Performing Assets' in' JIRAMA's balance sheet. Fixed assets are

- 9o --~ 90Annex 6.5
Page 2 of 2
revalued in line with domestic inflation and depreciated over 40 years(2.5%) except for vehicles and capital spares which are depreciated ever 5years (20%) and 2 years (50%) respectively. The average gestation periodfor fixed assets has been assumed at 1.25 years; accordingly, 75X of newinvestments go directly into the fixeu asset base and 25% into work inprogress from where they exit into the asset base one year later. Studiesare entered under deferred assets. They are not revalued and aredepreciated over 5 years (20%).
5. Cash, Accounts Receivable and Payable. Operating cash require-ments have been estimated at 15 days of cash operating expenses. Annualcash positions above that level are deemed to be surplus cash and countedagainst necessary tariff increases. Accounts receivable, after the restruc-turing, are assumed to represent 90 days of electricity sales. Accountspayable are similarly reduced to 105 days in 1987 and thereafter to 90 daysequivalent of non-payroll cash operating expenditures.
6. Debt Service. Service on existing debt is calculated on a loanby loan basis, with JIRAMA carrying the foreign exchange risk , and certainAndekaleka and Namorona loans being repaid in line with the utilizationrate of those assets. Capital contributions matching the interest on thenon-utilized portion of Andekaleka and Namorona are shown in the funds flowstatement, further reducing JIRAMA's effective debt service. New loans tofinance the portion of projected investments not funded by JIRAMA'sinternal cash generation are assumed to be' available as needed at 8%interest and 20 years maturity including 5 years grace. The consolidationof the bank overdraft is assumed at 15.5% interest over a five yearperiod.
7. Investment Program. Projected investment levels are identicalwith the agreed reference program (RIP) presented in Annex 5.1. It isassumed that the required funds will be made available from donors duringthe period even if IDA and other cofinancing falls short of this targetthrough the Energy I Project.
8. Divestiture of Subsidiaries and Associated Operations. JIRAMAvalues these activities at FMG 2.773 billion in its balance sheet. Whatsales price they might fetch is unclear, also what remuneration JIRAMAmight receive if an asset transfer to FNI took place. For the projectionsit has been assumed that the sales price would be zero and that thetransaction would be recorded as an non-operational loss.

- 91- ANNEX 6.6Page 1 of 3
MADAGASCAR
ENERGY I PROJECT
Phasing of IDA Credit
In order to assure timely determination and implementation ofcrucial financial measures required to maintain JIRAMA's financialviability, it is proposed to have the project implemented in two phases.The first phase is, by definition, all those goods and services notincluded in Phase, II. Phase II components include only goods; allconsultant services are included in the first phase. Disbursement in thefirst phase can take place at any time after credit effectiveness. Theprocurement of goods included in Phase II of the project will be subject tomeeting the specified conditions of disbursement (para. 8.07). Phase IIInvestments will have a total val.ue of US$10 million. The phasing of theproject is defined in the following tables. All costs are the foreignexchange requirements for the components concerned, including contingenciesbut excluding duties and taxes.

- 92 -
ANNEX 6.6Page 2 of 3
MADAGASCARENERGY I PROJECT
Phasing of IDA Madagascar Energy I Project(US$ tbousands: foreign exchange requirements only)
RIP IDAAllocation Phase I Phase II
A: POWER SUBSECTOR COMPONENTS
1. Hydropower RehabilitationEssential RepairsMandraka Rehabilitation 2806 2806 0Ma-.',Iana Rehabilitation 440 440Sp:-- Parts - General 347 182Efficiency Improvemeats 800 0 800
Total 4393 3428 800
2. Diesel RehabilitationRehabilitation & Spares 8182 300 3000Mobile Maintenance 2200 0 2200
Total 10382 300 5200
3. Electric Boilers 30G 300 0(transmission/distribution& consultants)
4. DistributionPilot Project 214 214 0Rehabilitation Material 3137 109 1300New Connections 9572 0 1400
Total 12923 323 2700
5. Support ServicesComuunications 2000 0 0Meter Laboratory 150 150 0Computers & Services 905 605 300
Total 3055 755 300
6. Vehicles 1750 750 1000
7. Power Sector Institution BuildingTechnical Asst. Planning 1025 1025
8. StudiesHydropower Feasibility Study 150 150Least Cost Expansion Plan 897 897
Total 1047 1047 0
POWER SUBSECTOR SUBTOTAL 7928 10000
IDA Financing of RIP 17928

93 ~ ANNEX 6.6Page 3 of 3
Total IDARequired Energy SectorEnergy FinancingSector (Funding to onlyInvestments in Phase I)
B: ENERGY SECTOR COMPONENTS
1. Energy Planning SupportEnergy Planning Administration 1406 1406Household Energy Planning 1969 1669Total 3375 3075
2. Energy Production ComponentsCharcoal 1000 1000Rice Husk Briquettes 252 252
Total 1252 1252
3. Energy Sector StudiesIndustrial Energy Audit It 600 300Lac Aloatra Region Study 300 300
Total 900 600
TOTAL ENERGY COMPONENTS 5527 4927
C: IDA Project Prepn. Facility 870 870
Additional Phase I FundingElecteic Boilers(by private enterprises) 1275
Summary Phase I Phase II
Power Subsector 7928 10000Energy Sector 4927Electric Boilers 1275Project Preparation Facility 870Total Financing by Phase 15000 10000
OVERALL IDA FINANCING 25000
- 94 - ANNEX 7.1
Page 1 of 3
MADAGASCAR
ENERGY I PROJECT
Economic Cost of Electricity and Economic Rate of Returnon Power Sector Investment Program
A. ECONOMIC COST OF ELECTRICITY
1. Electricity tariffs should be set at levels which adequatelyreflect the long run marginal cost (LRMC) of supply to consumers. In or'.rto calculate the LRMC for the JIRAMA power system, a least cost expansionplan (LCEP) would have to have been completed. As a LCEP is not available,the average incremental cost (AIC) of supply has been computed as anapproximation of the LRMC. The AIC calculation is based on the agreedreference expansion plan (RIP) and the respective incremental operatingcosts and projected sales enabled by these investments over a period of 25years. A separate AIC has been estimated for the ICS as well as for theoverall power system. However, in this case even the AIC is not a valuableindication of marginal costs for tariff construction and system planning,due to huge surpluses of energy and capacity. More valuable LRMC estimateswill result from the least cost expansion planning studies supported by theproject.
Definitions and Methodology
2. The AIC for the entire JIRAMA system represents an average valueof the AICs for all the sub-systems comprising public power supply. TheJIRAMA power system is dominated by the ICS which has almost entirelyhydropower generation, while the smaller external zones are eupplied forthe most part by diesel generation utilizing heavy fuel oil, and the smallisolated supply zones utilize diesel-fueled diesel generators. Costs varyconsiderably between these systems, hence the estimated overall AIC doesnot approximate the AIC of any particular sub-system.
3. The AIC is essentially the levelized annual cost of supplycomputed as the ratio of.the present value incremental costs to the presentvalue of incremental sales. The cost stream includes capital, operating,fuel and lubricating oil, and customer charges and administration costs,all in economic terms.
Data and Assumptions
4. The main data and detailed assumptions on economic prices andother parameters are provided in Table 7.1.1. Key underlying assumptionsare as follows:
i) The shadow value of foreign exchange which is used as amultiplier for all foreign components or estimated foreigncontent is 1.3.
ii) Prices are those as of January 1987.

- 95 - ANNEX 7.1Page 2 of 3
iii) The base case discount rate is 12%.
iv) Demand forecasts used are those provided in Annexes 4.2 and 4.3.
v) Rate of exchange applied is 630 FMG/US$.
Results
5. The AICs estimated by the above methodology are as follows:
US cents/kWh FMG/kWh(122 discount rate)
Overall Power System 5.7 36.0Interconnected System 3.8 23.8
6. The lower cost of supply in the ICS compared with the overallsystem is due largely to the availability of hydropower cocsiderably inexcess of demand. Furthermore, sales in the ICS are anticipated to increaseby about 40X as of the year 1988 with the commissioning of five electricboilers to use this surplus hydroelectric energy and capacity which will beavailable perha.s through 2000 (with some suppleuental diesel generation atpeak hours after 1996).
B. ECONOMIC RATE OF RETURN OF POWER SECTOR EXPANSION PLAN
Definition and Methodolo£
7. The calculation of the Economic Rate of Return (ERR) is basedon the IDA-appraised reference investment program (RIP) for the period1987-1992, inclusive. The proposed IDA project would finance the RIP withthe exception oa the 138 kV ring for Antananarivo already committed andfinanced, and the proposed 13-15 MW Aibodiroka hydropower plant. It is notuseful therefore to calculate a separate ERR for the proposed project andthe RIP. Instead the ERR calculated is for the RIP without Ambodiroka forwhich only the first year of construction is envisaged in 1992. A secondERR calculation has been made for the ICS only separating out, in the samemanner as for the AIC calculations, ICS-related costs and benefits.
8. 'The tariff revenues projected are taken as a proxy foreconomic benefits, although this is conservative assumption given that i)this provides no estimation of the upper limit of the consumer's willing-ness to pay and, ii) the economic benefits to flow from the electric boilerprogram will almost certainly exceed those implied by tariff revenue (seeAnnex 7.3).
9. Details of the parameters chosen for the analysis are provided inTable 7.1.2, and some of the key assumptions are listed in para. 4. above.In addition, tariff revenue was based on projected tariffs deflated by 10X,the estimated average annual rate of inflation.

-96 - ANNE 7.1Page 3 of 3
Results
10. The ERRs estimated in accordance with this methodology are asfollows:
Overall Power System: 33%Interconnected System: 46%
The results show that with tariff increases projected there is an unwsuallyhigh economlc rate of return on investment in all or parts of the JIRANApower system. This difference from the financial rate of return for thepower company as a whole is largely the result of the very high taxes,duties and SOLIMA's own margins for tuel, lubricating oil and consumables,as well as the duties and taxes on imported equipment and materials. Theeconomic opportunity cost for fuel oil is also very low compared to thetinancial price without duties and taxes as the FOB price for re-export isonly about US$50/tonne. Fuel oil is a major component of JIRAMA's cost ofproduction.

MADAGASCARENFRGY I PROJECT
Table 7.1.1: OVERALL JIRAMA POWER SYSTEM AVERAGE INCREMENTAL COST AND PROJECT RATE OF RETURN ANALYSIS
PROJECTED REVENUE ('000 USD) TotalOverall Operating 6 Customer & Fuel Total Incremental General Electric Tot. Rev. Revenue
Year Investment Maintenance Administration & Costs sales Revenue Boller Colstant NET CASE CurrentNo. Year Program ! Expenditure Costs 011 '000 dollars MWh Revenue Terms FLOW Terms
1 1987 15448.0 3613.8 149.3 -451.9 18759.2 23522 8400.0 -10359.2 8400.02 1988 7361.7 6694.8 277.8 -27.3 14307.0 117632 13500.0 938.1 11932.3 -2374.7 14438.13 1989 8581.7 5284.1 444.4 546.6 14836.8 153862 15900.0 1065.1 12746.1 -2110.6 16965.14 1990 7160.0 7883.4 621.4 951.9 16616.7 186742 24230.0 1128.6 17320.2 703.6 25358.65 1991 4125.7 8291.4 790.0 1290.3 14497.4 221422 30475.0 1231.7 19687.4 5190.0 31706.76 1992 1995.8 911.6 1644.4 4551.7 240572 37103.0 1231.7 21639.0 17087.2 38334.77 193 1235.0 1995.8 91146 1644.4 5786.7 240572 37103.0 1231.7 19671.8 13885.1 38334.78 1994 0.0 1"5.8 - 911.6 1644.4 4551.7 240572 37103.0 1231.7 17883.4 13331.7 38334.79 1995 1868.5 1995.8 911.6 1644.4 6420.2 240572 37103.0 1231.7 16257.7 9837.4 38,34.7
10 1996 1969.9 1995.8 911.6 1644.4 6521.6 240572 37103.0 1231.7 14779.7 8258.1 38334.711 1997 1995.8 911.6 1644.4 4551.7 240572 37103.0 1231.7 13436.1 8884.4 38334.712 1998 1995.8 911.6 1644.4 4551.7 240572 37103.0 1231.7 12214.6 7662.9 38334.713 199 1995.8 911.6 1644.4 4551.7 240572 37103.0 1231.7 11104.2 6552.5 38334.714 2000 1235.0 " 1995.8 911.6 1644.4 5786.7 240572 37103.0 1231.7 10094.7 4308.0 38334.715 2001 0.0 1995.8 911.9 1644.4 4552.1 143622 37316.0 8933.1 4381.1 37316.016 2002 1868.5 1995.8 944.3 1644.4 6452.9 148721 37530.2 8167.7 1714.7 37530.217 2003 1969.9 1995.8 977.8 1644.4 6587.8 154000 37745.6 7467.8 679.9 37745.618 2004 1"5.8 1012.5 1644.4 4652.7 159467 37962.2 6827.8 2175.2 37962.219 2005 1995.8 1048.4 1644.4 4688.6 165128 38180.2 6242.8 1554.2 38180.220 2006 1995.8 1085.7 1644.4 4725.8 170"0 38399.3 5707.8 982.0 38399.321 2007 1235.0 1995.8 1124.2 1644.4 5999.4 177060 38619.7 5218.7 -780.7 38619.722 2008 0.0 1995.8 1164.1 1644.4 4804.3 183346 38841.4 4171.5 -32.8 38841.423 2009 1868.5 1995.8 1205.4 1644.4 6714.1 189855 39064.3 4362.6 -2351.5 39064.324 2010 1969.9 m1.8 1248.2 1644.4 6858.3 196595 39288.6 3988.8 -2869.5 39288.625 2011 -4875.6 1995.8 1292.5 1644.4 - 57.1 203574 39514.1 3647.0 3589.9 39514.1
Present Value of Costs 79783.0 1396995.3 Economic Rate of Return 32.962
Average Incremental Cost of Electricity $0.057/kwhor 36.0 P111'kWh
a/ Progtas is the Reference Investment Program (RIP) (see parse. 5.01-5.02).bl As vehicle Investment life is shorter than analysis time frame, equivalent investment is every 7 years.
Residual values are calculated for plant still In operation at the end of period of analysis.
ASSUMPTIONSDiscount Rate 12.0X a2Marginal Customer & Administration Cost is two-thirds of 1985 3.5 FMG/kWb average xxchange .Rate 630.0 FIIG/USO
NOTES: _1. In the ICS. It is assumed that at end of electric boiler life, sales drop accordingly and then recover gradually to utilize the energy
previously applied to the boilers. Revenue from these ales Is low, reflecting the off-peak nature of the energy consumptton lplied.2. Operatioa and Maintenance charges in the first five years include the special catch-up program of part replacement and equipment repair
that would be funded by the proposed project.3. The customer administration charges of the boiler program are assumed to be negligible as they represent only five customers.

MADAGASCARENeRGY I PROJECT
Table 7.1.2: JXRAM INTERCONNECTED POWER SYSTEM AVERAGE INCREMENTAL COST ANALYSIS
PROJECTED REVENUE ('OuO USD) TotalInvestment Operat 1g R Customer R Fuel Total Incremental Geaeral Electrfc Tot. Rev. Revenue
Year in Maintenance Administration & Costs sales Sales Boiler Constant NEI CASH CurrentNo. Year JIRAMA ICS !/ Expenditures Costs Oil '000 dollars MWh Revenue Revenue Terms FLOW Terms
1 1987 589,.6 1709.8 111.7 222.6 7937.6 17590 5320.0 4836.4 -3101.2 5320.02 1988 6712.9 3369.1 191.7 222.6 10496.2 104070 7279.4 938.1 6791.3 -3705.0 8217.53 1989 5663.5 2738.9 273.4 55.6 6731.5 126940 9733.3 1065.1 8113.0 -618.5 10798.44 1990 4404.6 4138.7 404.2 74.1 9021.6 152540 14703.0 1128.6 10813.2 1791.6 15831.65 1991 2600.9 4388.8 534.2 74.1 7596.0 181140 18850.0 1231.7 12469.2 4671.2 20081.76 1992 1241.0 615.4 74.1 1930.5 193930 23041.3 1231.7 13701.5 11771.0 24273.07 1993 814.4 1241.0 615.4 74.1 2744.9 193930 23041.3 1231.7 12455.9 9711.0 24273.08 1994 0.0 1241.0 615.4 74.1 1930.5 193930 23041.3 1231.7 11323.6 9393.1 24273.09 199S 1232.3 1241.0 615.4 74.1 3162.8 193930 23041.3 1231.7 10294.1 7131.4 24273.010 1996 1853.7 1241.0 615.4 74.1 3784.2 193930 23041.3 1231.7 9358.3 5574.1 24273.011 1997 1241.0 615.4 74.1 1930.5 193930 23041.3 1231.7 8507.6 6577.1 24273.*412 1998 1241.0 615.4 74.1 1930.5 193930 23041.3 1231.7 7734.1 5803.7 24273.013 1999 1241.0 615.4 74.1 1930.5 193930 23041.3 1231.7 7031.0 5100.6 24273.014 2000 814.4 / 1241.0 615.4 74.1 2744.9 193930 23041.3 1231.7 6391.9 3647.0 24273.015 2001 0.0 1241.0 615.7 74.1 1930.8 96980 23041.3 5515.9 3585.1 23041.316 2002 1232.3 1241.0 646.5 74.1 3193.9 101829 23271.7 5014.5 1870.7 23271.717 2003 1853.7 1241.0 678.9 74.1 3847.6 106920 23504.4 4558.6 802.6 23504.418 2004 1241.0 712.8 74.1 2027.9 112266 23739.5 4144.2 2241.9 23739.519 2005 1241.0 748.4 74.1 2063.5 117880 23976.9 3767.4 18S6.9 23976.920 2006 1241.0 785.9 74.1 2100.9 123774 24216.6 3424.9 1498.7 24216.621 2007 814.4 1241.0 825.2 74.1 2954.6 129962 24458.8 3113.6 350.5 24458.822 2008 0.0 1241.0 866.4 74.1 2181.5 136461 24703.4 2830.5 853.2 24703.423 2009 1232.3 1241.0 919.7 74.1 3457.1 143284 24950.4 2573.2 -670.7 24950.424 2010 1853.7 1241.0 955.2 74.1 4124.0 150448 2519".9 2339.3 -1565.5 25199.925 2011 -2431.0 1241.0 1003.0 74.1 -113.0 157970 25451.9 2126.6 2462.1 25451.9
Present Value of Costa 42256.2 1119175.9 Economlc RAte of Return 46.21SAvorage lncresotatl Cost of Ulectricity $0.038/k1h
or 23.8 MIWkhIPcogram to the Referene Investment Program (RIP) (see parse. 5.01-5.02).Because vehicle life 1s atorter tban tlme frme of analysis eequivalent rdeivestmentis ade every 7 years. Resldual valoes are calculated for plant still In operation.
Dscount ate 12.0SMarginal Custoer 4 Admnlistration Cost Is two-thirds of 1985 4.0 PM/kVh average
_achwe lkate assumed is 630.0 116/116
mom1. ln the ICS, It Is assued that at end of electric boiler life, sales drop accordingly and then recover gradually -o utilize the energy
pteviously applled to the boilers. Revenue from these sales Is low, reflecting the off-peak nature :f the energy conswption implied.2. Opratilon and Maintenance charges in the first five years include the special catch-up program of part replacement w'd equlpment repair
that would be funded by the proposed project.3. The customer adainistration charges of the boiler program ere assumed to be negligible as they represent only five customers.

ANNEX 7.2
Page 1 of 2
MADAGASCAR
ENERGY I PROJECT
Economic Analysis of Volob6 Hydropower Generating Plant
Methodology
1. The economic viability of rehabilitation of the cyclone- andflood-damaged Volobe bydropower plant and related infrastructure rests onthe comparative economy of meeting the Toamasina regional demand from,essentially, one of two options: Volobe rehabilitated, or diesel genera-tion using plant already available in the Tamatave II and III powerstations, both supplemented with new diesel plant as required in the longerterm. Another technically feasible option of interconnection by 138 kVtransmission line with the ICS can be ruled out readily by its cost ( US$12million), time of construction (about 3 years), and the need forsubstantial diesel generation during peak hours from early to mid-1990s .omeet peak demand in the ICS if Toamasina wee interconnected. Finally, theneed for about US$10 million in foreign exchange financing, compared withUS$4 million for Volobe rehabilitation, represents a major constraint inits own right. The precise details of the least cost approach to therehabilitation of the Volob6 hydropower plant are still being studied sothis analysis assumes that the plant will operate in the future at themaximum of its previous installed capacity and electricity productionpotential. Estimates of the cost of rehabilitation have been made byconsultants and JIRAMA during project appraisal. The analysis compares thepresent value of costs of these two options and computes the crossoverdiscount rate, i.e. the rate at which the present value of costs of bothoptions would be equal.
Data and Assumptions
2. The detailed assumptions for the analysis are listed asfootnotes to Table 7.2.1. The load forecast for Toamasina is based on IDAprojections made during project appraisal which result in estimated growthin energy and capacity demand of 2.6% and 2.5% average per annum, respec-tively, during the period 1987-2015 - the period adopted for the economicand financial analysis. The detailed load forecast is available fromproject files. The base case presented in Table 7.2.1 is the economicanalysis made with the follhwing key underlying assumptions:
the shadow value of foreign exchange is 1.3 and is applied to allimported equipment, materials and services, as well as to theforeign content of locally procured goods and services.
ii) the residual value of the Sulzer 8 MW diesel that would bereleased frow service with the rehabilitation of Volobehydropower station is US$3 million.
iii) the value of fuel oil used in the Tamatave III power station isthe FOB value of fuel oil exported from Toamasina under thepresent refinery operation mode, plus the internal transportation

- 100 - ANNEX 7.2
Page 2 of 2
and handling charges to deliver the product to the dieselgenerating station.
iv) the exchange rate applied is 630 FMG/US$.
Results
3. The results of the comparative economic analysis are as follows:
NPV of Costs(millon US$)
Economic Analysis Financial Analysis
Volob6 Rehabilitation 3.45 4.29All diesel generation 6.32 10.46Crossover Discount Rate 22.9% 35.1%
Rehabilitation of the Volobe hydropower plant is clearly warranted despitethe low economic opportunity cost of fuel oil locally produced and the sunkcost of major diesel generating plant already in place and operational.

QER I PAW
M1. 7.2.1: 9D8 11N _mAU MrI RA8l!TQI iO41. *88SI
R)*o Not Diinel <1ty uscty Cvty Pmt Dima .1 V.1d. b'lo V*oIo i weed o1*1 SWld 21a A1 0a Dif Yew _ WAnd &wly d Ptet.arR hIlVen M4 CAF*tY ea cita10ts t- 0(bts D ). (36 Obt atd 011 com Vahm Mac* masi in nto of
G NW Gab Gb uf w Nm Wm * O U * M MG MG mc A1tteAt
1917 24.91 5.35 O.OD 24.91 20.80 0.00 0.00 20D. O.0O 0.00 3.60 2.72 o.0O 0.00 0.15 0 2 0.52 0.43 3.26 0.54 -2.7218 21.83 5.74 15.OD 11.83 2D.80 8.0 0.00 1L2.O 0.00 0O.O 2.40 1.81 o.00 0.0o 0.16 0.13 0.56 0.46 2.40 0.59 -1.8L19S9 29.36 6.27 26.43 2.94 19.56 0.OD 0.00 19.56 0.00 0.00 0.15 0.12 0.18 0.14 0.61 0.0 0.19 0.o4 0.45199 3L64 6.73 2B.48 3.16 19.56 1.40 O.OD U1.16 O.OD 0.00 0.15 0.12 0.19 0.15 0.66 0.54 3.0D -3.71 0.69 4.401991 32.90 7.01 29.61 3.3 18.16 0.00 .OOD 186 0.00 .ooD 0.15 0.12 0.20 0.15 0.69 0.56 0.19 0.72 0.521992 33.91 7.21 30.52 3.39 18.6 0.00 0.00 18.16 0.00 0.00 0.15 0.12 0.20 0.16 0.71 0.58 0.2D 0.74 0.5413 35.2 7.48 31.69 3.52 116 0.00 O.OD 18.16 o.0 0.0o 0.15 0.12 0.21 '.17 0.74 0.60 0.2 0.77 0.571994 35.71 7.58 32.14 3.57 1816 .W0 0.00 18.16 .0OD 0.OD 0.15 0.12 0.21 0.17 0.75 0.61 0.20 0.78 0.581995 36.22 7.68 32.60 3.62 18.16 o.00 0.00 18.16 O.OD 0.00 0.15 0.12 0.22 0.17 0.76 0.62 o.20 0.79 0.591996 36.75 7.78 33.0B 3.66 18.6 0.00 0.00 o 186 0.00 0.0o 0.15 0.12 0.22 0.17 0.77 0.63 0.20 0.80 0.601997 37.30 7.89 33.57 3.73 1816 1.40 0.00 16.76 1.2D 0.95 0.15 0.12 0.22- 0.17 0.78 0.64 0.2D 1.76 1.561998 37.87 8.01 34.08 3.79 16.76 1.40 2.O0 1.36 0.OD .0OD 0.15 0.12 0.23 0.18 0.79 0.65 0.21 0.83 0.621999 3.45 8.12 34.61 3.85 1746 o.00 o.0o 17.36 o.00 o.0D 0.15 0.12 0.23 0.1L o0.8 0.66 0.21 0.84 0.632000 39.05 8.24 35.15 3.91 17.36 O.OD 0.00 17.36 0.90 O.OD 0.15 0.12 0.23 0.18 0.82 0.67 0.21 0.85 0.642001 39.68 8.37 35.71 3.97 17.36 O. O.OD 17.36 O.0 0.0o 0.15 0.12 0.24 0.19 0.83 0.68 0.21 0.87 0.662002 40.32 8.49 38.70 162 17.36 0.00 0.OD 17.36 o0sD 0.00 0.15 012 0.24 0.19 0.84 0.69 0.16 08 0.722003 40.99 8.63 3B.70 2.29 17.36 O.0 0.00 17.36 o.00 0.0 0.L5 0.12 0.25 O0.9 0.86 0.70 0.17 0D9 OM722004 41.67 8.76 3.70 2.97 17.36 O.OD o0.0 17.36 .0OD O.00 0.15 0.12 0.25 0.20 087 0.71 0.19 0.91 0.722W5 42.38 8.91 38.70 3.68 17.36 o.0o 0.00 17.36 0.0o O.OD 0. L5 0.2 0.25 0.20 0.9 0.73 0.20 0.92 0.72m6 43.12 9.05 3B.70 4.2 17.36 o0.0 0.00 17.36 0.00 O.00 0.15 0.12 0.26 0.20 0.90 0.74 aOz 0.94 o.n
20D7 43.8 9.20 38.70 5.18 17.36 0.00 0.0o V.36 1.20 0.95 0.15 0.12 0.26 0.21 0.92 0.75 0.24 1.91 L672008 44.66 9.36 38.70 5.96 17.36 0.00 2.00D p.36 O.0 O.0o 0.15 0.12 0.27 0.21 0.93 0.76 o.25 0.97 o0n209 45.47 9.32 38.70 6.77 19.36 0.00 O.OD 119.36 o.0o 0.00 0.15 0.12 0.27 0.21 0.95 0.78 0.27 0.99 0.722010 4.31 9.69 3.70 7.61 19.36 o.0D o.0o 1W.36 0.00 O.O0 0.15 0.12 0.28 0.22 0.97 0.79 0.29 1.01 0.722011 47.18 9.86 38.70 848 19.36 o.0o O.OD 19.36 O.OD O.OD 0.1S 0.12 0.2 0.22 0.99 0.81 0.31 1.03 0.722D02 48.07 10.0o 38.70 9.37 19.36 O.OD o.00 19.36 O.OD 0.0D 0.15 0.12 0.29 0.23 1.01 0.82 0.33 1.08 0.722013 49.00 10.22 38.7D 130 19.36 0.o0 o.W0 19.36 o.O0 0.00 0.15 0.12 0.29 0.23 1.02 0.8 0.35 L07 0.722014 49.96 10.41 38.70 11.2 19.36 o.00 OD 19.36 0.00 O.OD 0.15 0.12 0.30 0.23 1.04 0.86 0.37 1.09 o0n2DIS 50.95 10.61 3B.70 125 19.36 0.00 0.00 19.36 0.00 .OOD 0.15 0.12 0.31 0.24 1.07 0.87 -0.57 -4.81 1.11 5.92
NW= Diesl Semwm Is uk ftm .p8uth 7 lB 4w 2 99W wgdts. tAitt.malaild &m1Gy to mmS*.en co= cqmadty .Lq to _aat wit. PR. V&1m ci o ts 3.45 6.32
- ~~~~cam~~~~O 06. aUt P 22.92Xw mt nte 630.00 WGlWD maw PAte 12.005
=ufl of forip ambm 1.3D hA - gw 4ly '..OD Ohvcac Q hintI fram Val" o tAubWUteI
-cm4ta C fi mawmai 6.00Q.111llian US&Uam Win PO &*ply 6 rouolvc ftjm ci a.Amtt in '87 .OwO afte aftelltstiin 25.80 Gb
apcIaa fceladuif 0.66miI 'alm ci Val" (5r life) 4.OD3 MI1m US) Di.) bup M_ll to twoo to the catt oif 10 cf th systm m d
-*Nal 09t das Val" 150.00 tbao d USD up to th rer in Adkh dm rce=ds 9DX of Vo6icaro em t(43 Ob after r lietim) au m dkmal gwAstwl wwovi& an *, in
11a Gsm mm af thbsl,1-aqmItel <s1c |Im |1 1km.). 6XwO00 US)/W
-0 WA for =dim *Pd d-n 6.00 UNW4 b " POW 9 jr lt hT 1Al In Tass.& 96 lbdt Plat _itaJId In 1tm tn -Fc fee amu,tic (9m.) 210.00D pl-huuICMq aol CM*Icm 450.00 iWb/lIta Plat lB Tr.m Yr.bt'd Plat NB Yr.m Yr.td x-Ik mt of - _1. ls8t& St. 80w. m tVame
-BM=c CWt - ROL Oase aX, ....t.....6.. Q=G UDtwt *_mPia 1at i PlIt 85.0C 118 1.40 1971 1990 l m 1.52 1931 am-F_dp (at fts wan 0 MDO 1.40 1973 1992 1.52 1931 am -
-c ost oC Tue 011 L .OD t3V1tre D8.0 1984 2MOB 1.52 1931 am-FntIcm at Fel 011 i O.90 8.0D 1984 2D 2.20 1971 cm-fatpwtim of Oman at 0.10
_uId.l Vm of Thm ia M Die). 3.0D 1M m 1D at A 1988 Pus ap 6.76

- 102 -ANNEX 7.3Page 1 of 2
MADAGASCAR
ENERGY I PROJECT
Economic Analysis of the Antananarivo RegionElectric Boiler Program
Basis of the Atlalysis
1. Energy and power from hydropower plant in the ICS will exceednormal demand through the year 2000 if no special additional demandeventuates. Consultants to JIRAMA, EDP International, identified anelectric boiler program which could use this energy and not make dem ,adssignificantly exceeding the peak capacity of existing hydropower during theanticipated life of the electric boilers: 10 years. The enterprisesconcerned are financially sound with long term prospects for stability andgrowth. They include PAPMAD, a paper products company, SavonnerieTropicale, a soap manufacturer, SOMACOU, a textile plant, and the HiltonHotel. In most cases the enterprises would have to replace their heat andsteam raising facilities during the life of the proposed boilerelectrification program. The electric boiler program economic viabilitydepends on the relative economic costs of continued use of the present fuelor fuel mix ( fuel oil, diesel oil or fuelwood), plus the need for renewalof existing facilities, versus the cost of electric boiler plant andelectrical energy. Two scenarios of demand for electricity for heat andsteam production are compared: business as usual - which is the base case -and planned recovery of demand representing previously experienced or trulyexpanded levels of industrial or commercial activity. The economy ofMadagascar is depressed at present with industrial plant utilization atrecord low levels, hence the base case, which assuwmes no recovery over thelife of the electric boiler pr'gram is quite pessimistic.
2. An economic and a financial rate of return has been calculatedfor each boiler project based on the net cash flow between the initial costof the electric boiler installation and the ongoing costs of oil orfuelwood and possible thermal boiler replacement. Then, the levelizedannual cost of electricity per kWh utilized has been derived by dividingthe present value of costs for the electric boiler program by the presentvalue of electrical energy consumed. Finally, to test the resilience ofthe program, an estimate is made of the increase in the capital cost ofelectric boilers, or the decrease in the cost of energy presently utilized,that can be tolerated before the project ERR falls below the discount rate,or the opportunity cost of capital locally. This latter is precented as aswitching value analysis.
Data and Assumptions
2. An example of the economic analysis performed on the boilerprogram is provided in Table 7.3.1. With it are footnotes which quantifyassumptions made in the analysis. The key assumptions in the economicanalysis are:

- 103 -ANNEX 7.3Page 2 of 2
i) the short run marginal cost of electrical energy is zero duringthe period 1988-1997.
il) fuel oil and diesel oil costs are constant during this period andare based on present border prices (see Table 7.3.1).
tit) the economic cost of fuelvood is the cost of replacement infuelvood plantations plus the present handling, transport andmarketing margins.
iv) a shadow value of foreign exchange of 1.3 is applied to allforeign qontent in the project.
v) operation and maintenance charges are the same in both thermaland electric boiler options; an assumption which favors thethermal option.
Results
3. Results of the analysis are as follows (including the MilitaryHospital as a fifth candidate enterprise):
i) as the economlc and financial rate of return to the program as awhole:
Rate of ReturnEconomic Financial
Case A: No Recovery in Industrial Production 49% 612Case B: Forecast Recovery 63% 107S
ii) In terms of the robustness of individual sub-projects through aswitching value analysis for key cost factors:
Case A: Capital Cost of Equipment Price of Energy(Wood &/or Oil)
required 2 increase required % decreasePAPMAD 200 -68Savonnerie Tropicale 59 -45SOMACOU 455 -75Hilton Hotel 35 -25
All sub-projects are able to tolerate significant unfavorable change In keycost variables before becoming economically unattractive.

KADAGASCARENEaCY I PROJECT
Table 7.3.1: ELECTRIC BOILER F-ROGRAM: ECONOMIC ANALYSISXAIPLE OF INDIVIDUAL BOILER ANALYSES (Million FPM)
1987 1988 1989 1990 1991 1992 1993 1994 1"9S 1996 I997
PAPMAD (paper manufacturing company)Costs
Electric Boiler Installation 585.0JIRANA NetWork ReinforceMent 41.0UEectricity (SRMC of Rydro-energy) 0.0 0.0 0.0 0.0 0.0 0.0 0.0 0.0 0.0 0.0 0.0Total Costs 626.0 0.0 0.0 0.0 0.0 0.0 0.0 0.0 0.0 0.0 0.0
Benefits: Case A - No Recovery or GrowthForecast Electricity Uset CNh 40.4 40.4 40.4 40.4 40.4 40.4 40.4 40.4 40.4 40.4Savings oa Fuel
Wood 240.1 240.1 240.1 240.1 240.1 240.1 240.1 240.1 240.1 240.1Fuel 01i 67.3 67.3 67.3 67.3 67.3 67.3 67.3 67.3 67.3 67.3Avoided Capital CostsBoiler Repairs 76.1Boiler Replacement
Total Benefits 76.1 307.4 307.4 307.4 307.4 307.4 307.4 307.4 307.4 307.4 307.4
Benfits: Case B - Anticipated Recovery and Planned GrowthForecast Electricity Use: CGh 45.0 55.0 60.0 65.0 68.1 68.1 68.1 68.1 68.1 68.1Savings on FuelWood 240.1 240.1 240.1 240.1 240.1 240.1 240.1 240.1 240.1 240.1Fuel Oil 155.0 186.0 232.5 310.0 310.0 310.0 310.0 310.0 310.0 310.0 _Avoided Capital CostsRepairs 76.1Boiler Replacement
Total Benefits 76.1 395.1 426.1 472.6 550.1 550.1 550.1 550.1 550.1 550.1 550.1
Net Benefits Stream Case A -549.9 307.4 307.4 307.4 307.4 307.4 307.4 307.4 307.4 307.4 307.4Net Benfits Streass Case" -549.9 395.1 426.1 472.6 550.1 550.1 550.1 550.1 550.1 550.1 550.1
Economic Rate of Return: Case A 55.22Economic Rate of Return: Case B 79.7X
Ecoaomic Cost of Electricity Utilized
(1) Present Value of Coats: Case A 558.9(2) Present Value of Costa: Case 3 558.9(3) Present Value of Consumption: Case A 228.2(4) Present Value of Consumption: Case B 346.0(5) Levelized Annual Cost of Electricity Utilized: Case A 1(1)/(3)] 2.4 FH(/kWh(6) Levelized Annual Cost of Electricity Utilized: Case B ((2)J(4)1 1.6 FMG/kWh
Assumptions Puelvood Economic Coat 19830.0 FPM/te Fuelwood Use: 1986 level 12107.0 te/yrFuel O0l Economic Coat 80010.0 FMC/te Fuelwood Use: With Recovery 12107.0 te/yrEachange Rate at June 1986 630.0 FMS/US$ Fuel OIl Use: 1986 level 841.0 te/yrShadow Rate for FE 1.3 Fuel Oil Use: Witb Recovery 3875.0 te/yr
Discounat Rate Used 12.002103 Value of Fuel Oil Exports ex Toaszsina 50.0 /te xInland Oil Transport and Usodling Charges 50.0 S/te Foreign Exchange Content of transport Is 802;Replacement Cost for Yucalypt Mood Fuel 6.0 $/13 hence ahadow value of fe Is applied toBssic Deneity of Eucalypt Fuelwood 500.0 kg/m3 transport component of enewrgy cost throughoutMoisture Content of Fuelwood Delivered 25.0 Zmcwb these analyses.Tranaport sad Randling Charges (average) 9000.0 1M/cteHarvesting ad Stacktng Fees to Roadside 3000.0 FmrE/teNantesane Costs are assumed to be equivalent for both boiler options

- 105ANNEX 7.4
MADAGASCAR
ENERGY I PROJECT
Economic Analysis of Antanarivo-Antsirabe Transmission Line
Basis of Analysis
1. The analysis compares the addition of a 138 kV transmission linebetween Antananarivo and Antsirabe with supplemental diesel generationI inAntsirabe as a means of augmenting supply from an existing 63 kVtransmission line between these cities. A study by EDF Internationaldemostrated that the 63 kV line must be rehabilitated in either case,rather than replaced, as it serves important customers along the route, andis in need of only minor repairs to ensure an additional 20 years ofservice. In fact, the analysis is more to determine whether theconstruction of the 138 kV line is timely, rather than rule on itsconstruction per se for, as the proportion of diesel generation inAntsirabe grows, and the supply of hydropower in the ICS expands withfurther development, full rather than partial interconnection will beincreasingly justified.
Methodology and Assumptions
2. The present value of costs of each option has been estimatedusing both economic and financial prices. Table 7.4.1 provides a detailedcash flow analysis with footnotes which quantify the assumptions made. Thekey underlying assumptions in the economic analysis are as follows:
i) the shadow value of foreign exchange is 1.3;
ii) the value of supplemental diesel plant required in the firstinstance is $3 million representing the economic value of theSulzer 8 MW plant to be transferred to Antsirabe from Toamasina;
iii) hydropower surpluses in the ICS are assumed to be exhausted bythe year 2000 and from that year onwards an LRMC of hydropowergeneration of about 5 UScents/kWh is adopted, representing theestimated cost of production from the Ankahotra dam expansion tothe Andekaleka hydropower plant.
iv) increasing diesel generation is required during peak hours tocover the growing gap between firm 63 kV line capacity andAntsirabe regional peak demand. Estimates of the diesel genrationduring peak hours are provided in Table 7.4.1.
Results
3. Supplemental diesel generation is the least cost solution ineconomic and financial terms compared with an additional 138 kV line withan NPV of $6.5 million and $12.1 million, and $6.5 million and $9.8million, respectively.

Ta 7.4.1: E0ttC AmUII CF _ _INS53 LIIEaig 0.u* WW= PM ELMDS 63 W L?t Q WA= iPM 63 IS wg I/
MC se_x a l_*8 estalDtict 6.u1g cap.Izu Cgity 4*Podty . 1ms m al tal Mmi 138 kV Lim P4m 13OW LS= 2 63 kV Lim &*db. 63 kV Lim 08eal Steali Fel RMI6el mom,
y- UM OAmm 63kV 3M li W& iE.btiM Mimi Oqacity ont lWfls Guts , lbit Gotso Om Gut & ml = .a. 1W63kV 63 W
19 MM 1S.10 60.66 14.a 6.00 2.10 ILSO Q0. 0.00 11.50 0.0 S.00 o .95 0.77 0.14 0.11 0.50 0.53 0.14 0.11 0.01 0.03 0.16 0.13 1.58 0.80MB 71.63 115 65.63 14.00 6.0 2.15 tl.50 0.00 o. 19.50 3.00 2.37 4.25 3.48 0.4 0.11 0.50 0.53 0.14 0.11 0.04 0.3 0.16 0.43 6.66 3.1719 72.0 1.0 70.59 14.0 1.50 2.20 19.50 1.10 OA 140 0.00 0.00 4.25 3.48 0.14 0.11 0.14 0 .1 0.01 0.01 0.04 0.03 3.64 0.161950 7L49 16.7 70. 14.0 2.0 2.27 1. oM 0a. U.40 O.OD L0.0 0.15 0.12 0.14 0.11 0.01 0.01 0.05 O. o.0o 0.24 0.1711 L76 16.33 79.76 14.00 2. 2.33 140 00 0.00 18.40 OA 0.00 0.15 0.12 0.14 0.11 0.01 0.01 0.05 0.04 * 0.24 0.171s2 8S2 16.3 sD.Q 14.O0 2.00 39 18.0 O. O0 18.40 0. O.OD 0.15 0.12 0.14 0.11 0.01 0.01 0.05 0.04 0.24 0.171N9 8a54 16.47 N9.54 14.00 3.00 2.47 1.0 o.o0 o.o 1840 0.00 0.00 0.15 0.12 0.14 0.11 0.02 0.01 0.08 0.07 0.24 0.2D1984 83.6 16.3 644 10 3.0 2.S3 is8. o00 o0o 1u40 o0 .OD 0.15 0.12 0.14 0.11 0.02 0.01 0.08 0.07 O.4 O.IM5 3.o806.60 6D.e 14.0 3.00 2.60 1 0.00 0.00 1840 0.00 o.0 01s 0.12 0.14 0.11 0.02 0.010010. o7 0.24 0.D1996 s 16.67 82.25 14.0 3.00 2a7 140 0.00 0.00 18.4 0.00 0.00 0.15 0.12 0.14 0.11 0.02 0.01O0.08 0.07 0.24 0.201987 85.64 16.74 816 14 4.00 2.74 1 0.0 0.0 18.4 0.00 0.OD 0.15 0.12 0.14 o0.1 0.02 0.2 0.11 0.A O.4 0.2219 6613 1832L13 14.O 4.0 2.83 8 O.0 o.0o 0840 0.00 0.00 0.15 0.12 0.14 0.11 0.02 0.02 01 o.0 0.24 0.221998 86.55 1.91 55 14.00 4.0 2.91 U O1 . 0O. 18.40 O.O0 0.00 0.15 0.12 0.14 0.l 0.02 0.02 0.11 O. 0.24 0.222 8D s7.0 0 .99 Be0 14.0 4.00 2.9 18.40 0.00 0.00 1840 00 0.00 0.12 0.15 0.2 0.14 0.t1 0.02 0.02 0.11 0.0 0.36 OmM1 A46 17.07 6 14.0 4.0 3.07 I18O O0 OO. 1 O. O. 0.12 0.15 0.12 0.14 0.l 0.02 OA2 0.11 0.09 0.36 0.222M2 87.94 17.16 83.94 14.00 4. 3.16 1. 0.0 00 140 0.00 0.00 2 0.15 0.12 0.14 0.11 0.02 0.02 0.11 O. 0.36 0.2220D 6.5 17.27 85.55 14. 5.0a 3.Z7 1 o8 W OA 0 .60 o o00 O.0D 0.16 0.15 0.12 0.14 0.11 o.3 0.02 0.14 O.Al 0.3 O2204 .07 17.37 8.07 1400 5.00 3.57 18.40 0.00 O. 1.40 0.00 0.00 0.16 0.15 0.12 0.14 0.11 0.03 0.02 0.14 o.11 0.39 0.25200.5 a 17.47 8.62 14.005D 5. 3.47 40 0.00 OA 140 0.00 0.00 0.16 0.15 0.12 0.14 0.11 0.03 0.02 0.14 0.11 0.9 0.25208 90.19 17.57 8519 14A. S0 3.57 0.00 0.00 8.40 9.80 7.75 0.16 0.15 0.12 0.14 0.11 0.03 0.02 0.14 o.1l 0.39 8.0o2WV 90.79 n AS 8 .79 14.00 s.0 3.68 18.40 7.) 14.0 24.90 O0OD O.Ou 0.16 0.15 0.12 0.14 0.l 0.03 0.02 0.14 0.11 0.39 0.252008 91.42 17.79 91.42 17.79 21.90 0.00 0.00 24.90 I. 1.11 2.83 0.15 0.12 0.55 OA3 2.50 2.05 2.96 3.562s s92o 17.91 9207 17.91 24.90 o0.0 2.00 26.90 O.O 0.00 2.85 0.15 0.12 0.55 0.43 2.52 2.L 2.98 2.492100 92.75 1.04 92.75 1804 2.90 O.O0 O.0O 26.90 0.00 0.00 2.88 0.15 0.12 0.56 0.43 2.54 2.08 3.0o 2.512D01 93.7 1L7 9.47 117 26.90 o.0o O. 26.90 0.00 OO. 2.90 0.15 0.12 0.56 0.44 2.55 2.00 3.02 2.532D2 94.1 B 94.21 1.30 1690 OA 0.00 26.90 1.40 1.11 2.92 0.15 02 0.57 0.44 2.58 2.11 3.04 3.66am3 94.99 .45 94.98 18.45 26.90 200 2.0 26.90 OO. O. 2.94 0.15 0.12 0.57 0.45 2.60 2.13 3.07 2.572014 95.8 1.59 9ff80 18.59 26.90 00 0.00 26.90 O0 OO. 2.97 0.15 0.12 o0.7 0.45 2.62 2.14 3.00 2.59215 96.0 87S 96.5 1.5 26s.9 0.0 0.00 26.90 O.0 O00 3A. 0.15 0.12 0.8 OAS 2.64 2.16 -5.1 3.12 2.62
/ . :b*m Pmam Vabat ol L2.08 6.51-63 V liS Uh Uamiug pmtame ?am* Plet hutAU In htsai 1985- om ad a -t- tae to m e aitiam1 lfe of 0D ys a 14 W Ln aw1t- g81W Sil DImi M foe minim to semim In 1989 walm of 53 milli Plat PO Yr.cam T let'd- Mown d tbapm - X 66 20a &td I t o dI uoI at Jt-w ort IDD atetm* MD 0.50 198 1996
0.50 1960 186191 1.10 1964 1999
1. Need Is kl 1p mith 6 M a 2 SO quit MimIt 1.10 1967 1992Mt eaid cosy to mdimn m asdmoty aqal to IC ,aui plelat 1.80 1968 1993
2. IS cazd by 63W lif Is totAd Ie o 1m d t dof al q at pk beus 7.50 1f2 20D7
_ 1O dvpm 630n0FW IRG OWNI- wald tf_ 1 J m0 U cpft wl: wafk ts d eal 700.00 OMAW
Tidsm UAn -MM coot f mia qp diea 66.0 ID b ,>-_ sap d b63yW 16 60I00 Gb -Wedfic (Im msqaim W.) 210.0D S/la . U
. a of 63 W UllO 14.6 131 -k a1 oila dqti 450.00 WIlua__ * =a at 1S W lIe 53.00 t c co ct Go1ol Aaits 190.O =Vtor
at o d smim lie 140.W0 = -eic an - Oul OLI htabA 10.0 1X/ta a.d N*mie fty _ 0.0 aD -h i Gt PepiDiel Pha t 85.
.dy of -m 6 aotim 40.0 WA -oca1p Gut Prom Ueal G SD.=_a|pft pqa .joim 70a -t c t at kin onl 2.0D lUSWUtra
_a s1 pDt l.Um 70.0 .ftcpaue at Ili Oil haot 0.90-_i m do 138 W Ufe 150.00 _ .aCtD ztiai Cof i bmlt 0.10
_ CM s 63 W li 14.0 tvi M C t $ro 10T 31.00 ME_OROMmeft ca a0.7 at ilhttt 00t51 =et 08s4 we 12.A-gle Odl 1iq m e 0.0 Ot *dd-3 Ahtal Mt

- 107 - ANNEX 7.5
MADAGASCAR
ENERGY I PROJECT
Comparative Economic and Financial Cost ofRice Husk Briquettes * Madagascar, 1986 !f
Product Ex-factory Retail Price Cooking Cost V-r unitcost (FMG/kg) Antananarivo Efficiency energy utilized
FMG/kg FMG/MJ (%) FMG/MJ(June 86 prices)
FirewoodFinancial Cost 25 1.87 13 14.4Economic Cost 31 2.31 13 17.8
CharcoalFinancial Cost 80 2.58 20 12.9Economic Cost 108 3.48 20 17.4
Rice H-,k BriguettesFinancial Cost 27.8 46.3 3.51 20 17.6Economic Cost 23.3 38.8 2.94 20 14.7
a/ Base case is screw press of 0.55 t/h, 1,500 t/yr production.
E Economic cost of firewood and charcoal is market price plus US$6/m3resource replacement cost.
o Efficiency data for rice husk briquettes based on analyses by TNO,Holland.
Assumptions: NCV of firewood, 13.4 NJ/kg, 25% mcwb.NCV of charcoal, 31.0 NJ/kg, 5% mewb.NCV of rice husk briquettes, 13.2 MJ/kg, 8% mcwb.
Source: Econqmic and financial costs of production of rice husk briquettesfrom consultant reports by Hans Buess and Jean-Roger Mercier.Project files, World Bank.

- 108 - ANNEX 8.1Page 1 of 3
MADAGASCARENERGYI ---PROJECT
Documents entered into Project File
1. AF-Elteknik. Messrs. S. Dagberg, and L. Svensson. Madagascar EnergyI Project Preparation Mission. December 1985.
2.a Buess, H. P. Draft Report on Madagascar Rice Husk BriguettingMission. March 29, 1986.
2.b Buess, H. P. Projet de Rapport sur la mission concernantles possibilites de fabrication de briquettes de balle deriz a Madagascar (translated by World Bank). March 29,1986.
3. Compagnie G6n6rale des Eaux. Rapport d'Etude d'Avant projet d6taillfd'un syst8me de gestion lnformatise du patrimoine physique(immobilisations) de JIRAMA* Paris, April 1986.
4. CORE, International, Inc. Marc L. Heitner. Madagascar Energy IProject Preparation Mission - Financial Aspects. January 2,1986,
5. Coyne et Bellier. Etude de la rehabilitation de l'amfnagementhydro6lectrigue de Volob6, exploitation de Toamasina.Rapport provisoire, Vol. 1, Etude technique, Vol. 2, Etudeeconomique et financiare, rapport, Vol. 2, Etude economiqueet fi anciare, annexes, 14 plans (4 items in 1). October1986.l
6. Electricit6 de France International. R6publique D6mocratique deMadagascar - JIRAMA - Etude d'implantation de chaudiaresglectriques et Etude de la ligne de transportAntananarivo-Antsirabe. Rapport provisoire, Annexes (threevols. total). May 1986.
7. Etude d'implantation de chaudi8res electriques et 6tude dela ligne de transport Antananarivo-Antsirabe. Rapportdefinitif. November 1986.
8. Compl6ments a lt6tude des chaudiAres electrigues - Projet detarification. Rapport int6rimaire. January 1987.
9. FAO. Lejeune, J. M. Rapport de consultation en carbonisation 'Lesperspectives des carbonimation de bois de pin dans lesplantations de FANALAMANGA (HAut-Mangoro, Madagascar)"(preliminary report). August 1986
10. Messrs. J. M. Lejeune, and C. Ramilison. Etude defaisabilit6 d'un complexe sylvo-industriel du Haut Mangoro(Phase II) - Rhpublique Democratique de Madagascar -Utilisation de cing types de four pour la carbonisation debois de pin A Madagascar. August 1986.

-109- ANNEX 8.1Page 2 of 3
11.a JIRAMA. Contrat pour ls fourniture d'4nergie 6lectrigue A lachaudjire. Draft, ca. 1986.
11.b Direction Etudes Economiques et Planification. Note sur lasimplification des tarif. et sur la hausse des recettes de17% Pour lMa=nOe 1987. Presented during negotiations inWashington, February 27, 1987.
12. ORGACONSEIL. Messrs. S. Croquette and R. Giblet. Proositioen desolutions de remplacement du systiue do prtefeuile acartes perfor4es et des caisses enregiteuse, D6partementGestion Clients TANA -GRAN) TAMA e March 1985.
13. Croquette, S. and Giblet, H. Solution do remplacemeet du'systame de portefeuille a cartes du D6partement GestionClients "TANA - GRAND TAW," et Am6nagements de la GestionClients de la Zone Interconnectde hbors 'TANAL et GRANDTAN") et des Zones Ext6rieures April 1985.
14. Croquette, So Ra!port de synthbse - structures et methodesorganisation et informatigue - JIRAMA. June 1985.
15.a USAID. Messrs. Mercier (Breche S.A.R.L.), Petrich (Oak RidgeNational Laboratories), Calnan (U.S. Forest Service), Cantor(ORNL), Lejeune (FAO). Etude de Faisabiliti de laCarbonisation de petits bols plantation du Raut Mongoro -Soclit6 FANXLAXANGA. July 31, 1986.
15.b FANALAMANGA Smallwood Carbonization Feasibility Study.December 15, 1986.
15.c Etude do faisabilite do la carbonisation do produitsd'4clarcie plantation du Haut-Mangoro - Societe FANALAMANGA
Rapport de fin de mission. July 20, 1986.
16.a USAID/Fonds d'Assistance a la Cooperation. K. Newcombe (IBRD), C.H. Petrich (ORNL), J. R. Mercier (Breche S.A.R.L.).Madagascar ProJet Energie 1, Projet do Proposition doProgpaime do planification de 1'6nergie domestigue. May1986.
16.b Madagascar Energy I Project - Draft Household EnergyPlanning Program Proposal. May 1986.
17.a USAID/National Rural Electric Cooperative Association. Messrs.Granville Smith, Paul Clark, and Eugene Palmer. Madagascar:Aibodiroka Hydroelectric Project. April 1986
17.b Madagascar: Projet hydro-4lectrlgue d$Ambodiroka(translated by the World Bank). April Igo
18.a Mbadgascar: Ambodiroka Project Summary. April 1986.
18.b Madagascar: Brave description du projet d'Ambodiroka(trauslated by the World Bank). April 1986

- 110 - ANNEX 8.1Page 3 of 3
19. Madagascar: Tolognaro hydroelectric project. April 1986.
20.a Madagascar: Training in small hydroelectric power. April19-86.
20.b Madagascar: Programme de formation sur les petitesinstallations hydro-jlectriques (translated by the WorldBank). April 1986.
21. Wind, Robert C. Madagascar Mission de prgparation Energie I -Gestion de l'energie et combustion du bois dansl'industrie. Switzerland, March 1986.
World Bank Documents
22.a Newcombe, K. Madagascar Energy I Project Preparation - Energy SectorAdministration and Planning Needs Assessment. November 10,1986.
22.b Newcombe, K. Madagascar Preparation du Premier Proet Energetiue -Administration et Planification du secteur de l'energie:Evaluation des besoins (translated by World Bank). December1, 1986.
23. Fiche du projet a cofinancer (translated by World Bank). ca. 1986.
Government of Madagascar
24. Ministry of Industry, Energy and Mines. Direction de l'Energie et de1'Eau. Planification Energftique a Madagascar . December10, 1985, with rough english translation, ca. February 1986.

I~~~~~~~~
I~~~~~~~~~~~~~~~
MA SECTION
I

A Ant r.o4
MADAGASCAR
PUBUC POWER STATIONS AND TRANSMISSION UNESAA.mbiobO
Power Stations: Transmission Unes: ANsy-B. A Voh-s,
* Hydro ------ -- 20kV A Ambnj.
A Diesel 36kV ANTSERANANA63kVtS18kV A
Installed Caodty r* A c500kW An..v A \A *AndAp.
* A 500-1000kW iL AAnt
1000-5000kW AA-dn. AOhtw
5000kW
A M. ntw A£ c;AMinoh j (g i un
AMntnta*M y AMaroy s.nMAHAJANGA A | M_
AAny B-"
A-Im- IL -E; A S* * tftMade
M AAk-b TOAMASINA
\ K 1 , ANTANANARIVO
\ Mimin v- Momn
Mrnnrro AMoA-ib.gA. l_) t A 7e;;0 / - 1 ~~~~~~~nti;rrn'rrs w Ar4b44inar
AMlandnlvzo 1 jlAblb J Ar5
gt neVtmnr
e.knTnlnbih.n.A A n h Anr
a- ! -ant~ni...A d0h_.
Anbsitthnrdrrdh.naA *Amb-oth Canal
| Rivers
:A..Mr..O. - Faritany Boundaries
i/ MfA tnt a. moroma
MonO,nbeA t inb., r!5
FIANARANTSOA * Mani...
TOLIARA V.hipnnoA
A Fn.fg-tn
ToMir A ) Vgindnno- A C OMOZii-
Sr -.A -i
BOTSWANAM -
A ~~~~~~SOUTH AFFICA
0W
O
aM