Embed Size (px)
Citation preview

©2021 Teal Group Corporation
World Aircraft OverviewRichard Aboulafia
Vice President, AnalysisTeal Group Corporation
www.tealgroup.comwww.richardaboulafia.com
August 2021
World Aero Markets: Looking Up, From The Bottom of a Pit

©2021 Teal Group Corporation
Aircraft Markets, In Good And Bad Years(last year was not good)
World New Deliveries CAGR CAGR CAGR Change In 2020 (2021 $) ’03-‘08 ’08-‘14 ’14-'19 ’19-‘20
Jetliners-SA ($27 b) 9.7% 6.9% -2.0% -54.8%Jetliners-TA ($27.8 b) 5.0% 13.5% 2.1% -49.1%Regionals ($3.4 b) 3.9% -3.1% -6.3% -47.8%Business Aircraft ($18.2 b) 16.7% -2.2% -1.2% -15.7%Civil Rotorcraft ($3.1 b) 18.5% -2.5% -7.2% -11.4%Military Rotorcraft ($10.7 b) 10.6% 9.7% -7.0% -16.3%Military Transports ($4.1 b) 3.2% -0.9% 0.0% -27.0%Fighters ($18.3 b) 1.6% 0.8% 6.1% -22.6%All Civil ($79.9 b) 9.7% 5.6% -0.5% -40.0%All Military ($36.9 b) 3.9% 4.1% 0.0% -18.4%Total ($116.7 b) 8.0% 5.2% -0.4% -34.5%

©2021 Teal Group Corporation
Aviation Segments By Damage
Most to LeastAnnotated, 18 Months In
International traffic hit hardest and longest.Already an overcapacity situation.Secular shift towards single aisles already underway.It’s just that bad.
Twin aisle jetliners
Fuel prices a big problem.
China comeback uncertain.
Some relief due to deferred Airbus ramp, and MAX stop.
Same.
Single aisle jetliners
Large cabin strongly correlated with oil prices.
Small/medium strongly correlated with corporate profits, equities indices.
Recovering quickly; just a 2020/21 downturn
Business Jets
Oil and gas segment (large) hit again, before recovery even began.
About right…wait and see.
Civil Rotorcraft
Emphasis on “shovel-ready.”
Advance development programs at greater risk.
Pure-play contractors in best shape; suppliers with most defense in best shape.
All good. In fact, better.
Military Programs

©2021 Teal Group Corporation
-100
-80
-60
-40
-20
0
20
40
Y/T
Traf
fic C
hnag
e (%
)Traffic: Nothing We've Ever Seen Before
-65.9% RPKs in 2020 (-56.5% ASKs; -10.6 FTKs)2019 Totals: RPKs 4.2%, ASKs 3.4%, FTKs -3.3%
2018 Totals: RPKs 6.5%, FTKs 5.4%; 2017: RPKs 7.6%, FTKs 9%
RPKs ASKs FTKsSource: IATA
Y/Y; Starting March 2021, comps are with same month, 2019

©2021 Teal Group Corporation
More Unprecedented Numbers• Traffic decline, parked fleet like no previous shock.
• Per Paul Krugman, reflect a world economy recovering from a “medically-induced coma.” • Backlogs holding up (MAX stabilizing), but meaningless for production
rates in a downturn.• Many early retirements coming, particularly twin aisles.
• Primarily twin aisles; Quadjet bloodbath, especially A380.• Aftermarket catastrophe – ASK decline, plus de-stocking, deferred
maintenance, early retirements, USM, engine swapping, etc.• But promise of an equally swift recovery.
0
1000
2000
3000
4000
5000
6000
World Air Traffic (RPM Bns)

©2021 Teal Group Corporation
Traffic Peak Recovery By Late 2022. Why?•Better-than-expected vaccine efficacy.•Better-than-expected economic outlook.•The China and US domestic comebacks.•Business travel resurgence.•Vacation travel resurgence, fueled by record savings rates.
• Concern about Delta and other variants…it’s the big variable.
https://www.nytimes.com/2021/01/01/upshot/why-markets-boomed-2020.html

©2021 Teal Group Corporation
0
20
40
60
80
100
120
Valu
e In
202
1 $
Bns
Here It Is, The Chart I Was Dreading
'68-'77-11 CAGR; 65% peak-to-trough
'80-'84 -13.9% CAGR;-45% peak-to-trough
'91-'95-12.5% CAGR; 41% peak-to-trough
'01-'03-10.7% CAGR; 28.8% peak-to-troughOr'99-'03-11 CAGR; 65% peak-to-trough
'84-'9116.1% CAGR
'04-188% CAGRA 14-YearSuper Cycle
'95-'9920.8% CAGR
T
Welcome back to 2006

©2021 Teal Group Corporation
0
20
40
60
80
100
120
0
2
4
6
8
10
12
14
16
18
'80 '82 '84 '86 '88 '90 '92 '94 '96 '98 '00 '02 '04 '06 '08 '10 '12 '14 '16 '18 '20 '21f
WTI
Oil
Pric
e in
201
6 $/
BB
l
Inte
rest
Rat
es (F
eder
al F
und
Effe
ctiv
e, %
)Interest Rates And Oil Prices: Less Than 4%, And $50-
85/bbl, Ideally; But The Ratio Matters Most
Interest Rates Oil Prices
COVID-19 Pressuring Both Downward; recovery pressuring fuel upward (with risk to interest rates); Goldilocks outcome?

©2021 Teal Group Corporation
0
100
200
300
400
500
2000 2001 2002 2003 2004 2005 2006 2007 2008 2009 2010 2011 2012 2013 2014 2015 2016 2017 2018 2019 2020
BRIC Deliveries: All About China
China Russia India Brazil
2000: China is 2% of world market
2018: China is 23% of world market

©2021 Teal Group Corporation
-1000
-500
0
500
1000
1500
2000
2500
3000
3500
Large Jetliner Orders And DeliveriesBook-To-Bill No Longer A Thing
Deliveries Net Orders

©2021 Teal Group Corporation
-
10
20
30
40
50
60
70
80
90
Del
iver
ies
In 2
021
$ B
illio
nsThe Air Transport Market By Segment
A Tale of Two Markets
Regionals Single Aisles Twin Aisles
Return to peak: 2023
Now With Greater Misery
Too much, too sudden (A330s, 777s, 787s, Gulf carriers, etc.)
Hit Hardest and Longest; Capacity hangover, international traffic problems, and shift towards single aisles
737MAXProblem, and flood; includes delivery of ~450 already-built jets
Return to peak: after2030... probably

©2021 Teal Group Corporation
0
10
20
30
40
50
60
70
80
Del
iver
ies
in 2
021
$ B
illio
nsSingle Aisle Deliveries: Protected By MAX Return,
and By Shift Away From Twin Aisles
A320ceo A320neo A321neo B737NG B737MAX CSeries/A220 C919/MS21

©2021 Teal Group Corporation
$0
$10
$20
$30
$40
$50
$60
Del
iver
ies
in 2
021
$ B
nsTwin Aisles: Formerly Hot; Now Crowded
And Depressed
A350 A330 A330neo A340 A380 B767 B777 B777X B787 B747

©2021 Teal Group Corporation
Twin Aisles Have Been Here Before• We’re forecasting a lasting shift towards single aisles, with profound
consequences for primes, suppliers, and jetliner financing. But twins have been in dire straits several times before.
• Twins may bounce back:• Belly cargo (Asia/Mideast connectors).• Range (Asia/Mideast connectors).• Post-fragmentation route thickening (legacies gaining, International LCCs losing).

©2021 Teal Group Corporation
1h1997
1h2001
End2004
End2006
End2008
End2009
End2010
End2011
End2012
End2013
End2014
End2015
End2016
End2017
End2018
End2019
End2020
May 12021
Boeing 130.0 107.8 79.5 199.1 300.4 271.1 270.0 300.1 317.0 365.3 421.2 412.9 398.9 402.1 408.0 378.8 297.1 275.9Without ASC 606 390.0 391.0Airbus 48.6 112.9 115.5 173.0 281.8 268.2 277.6 309.5 321.6 399.9 439.9 461.2 468.1 441.8 481.6 463.6 438.9 426.4Bombardier — — — — — 1.9 3.3 4.9 5.5 6.7 9.0 9.0 8.7 8.5 — — — —
0
50
100
150
200
250
300
350
400
450
50020
21 $
Bill
ions
Firm Order Backlog Values: Boeing Taking A Hit

©2021 Teal Group Corporation
0
500
1000
1500
2000
2500
3000
<150 Single aisle 150 Single aisle 200 Single Aisle 250-300 Twin aisle >300 Twin aisle
Airbus, Boeing Jetliner Backlogs(August, w/ ASC 606)
Boeing Airbus

©2021 Teal Group Corporation
Disconnect Between Single and Twin Aisle Economics; Explains 757/767
$-
$50,000
$100,000
$150,000
$200,000
$250,000
$300,000
$350,000
$400,000
$450,000
$500,000
Realized Price/Seat
$-
$5
$10
$15
$20
$25
$30
Block Hour Cost Per Seat

©2021 Teal Group Corporation
0
1
2
3
4
5
6
0
2
4
6
8
10
12
14
16
IR&
D in
The
n-Ye
ar $
Bns
% O
f Sal
esBoeing Commercial IR&D: Under Pressure Again
BCA IR&D As % of BCA Sales

©2021 Teal Group Corporation
0
2
4
6
8
10
12
0
0.5
1
1.5
2
2.5
3
% o
f Sal
es
IR&
D in
The
n-Ye
ar €
Bns
Airbus Commercial IR&D: More Spend, Less Discipline…Until 2015
And Where Is It Going Now?
Airbus IR&D As % of Airbus Commercial Sales

©2021 Teal Group Corporation
0
20
40
60
80
100
120
140
Del
iver
ies
in 2
021
$Bill
ions
Jetliner Market Shares By DeliveriesAirbus Seizes The Middle Market and First Place; Covid-19 Accelerates shift to Middle
Market
Boeing Airbus ex 321neo A321neo COMAC/Irkut

©2021 Teal Group Corporation
0
500
1000
1500
2000
0
20
40
60
80
100
120
Del
iver
ies
Valu
e in
202
1 $
Bill
ions
We'll Get Back To The Road We Were On(as long as we're talking single aisles)
Value Units

©2021 Teal Group Corporation
70
90
110
130
150
170
Realized Prices Versus Production CostsPPI For Aircraft Manufacturing per FRED (Value Source: Airline Monitor); 2002 baseline =
100 (baseline 2014 Neo and 2016 MAX)High Defense Spending Greatly Complicates This Picture…
PPI 737-800 737MAX8 A320 A320neo

©2021 Teal Group Corporation
0
1
2
3
4
5
6
7
8
'10 '11 '12 '13 '14 '15 '16 '17 '18 '19 '20 '21 '22 '23 '24 '25 '26 '27 '28 '29 '30
Valu
e of
Del
iver
ies
'21
$ B
illio
nsRegional Deliveries By OEM (Value)
Bombardier CRJ Dash 8Q Embraer (pre-E-2) E-2 ATR SuperJet ARJ21

©2021 Teal Group Corporation
0
5
10
15
20
25
30
35
0
200
400
600
800
1000
1200
1400
1600
1800
Valu
e of
Del
iver
ies
in 2
021
$ B
ns
Uni
tsBusiness Aircraft Market History
(w/jetliners, RJs, turboprops)
Value Units
The Great Expansion; strong economic growth, new models, fractionals, etc.
The 2003-08 Boom. The Great
Bifurcation, followed by unwelcome convergence
The great stagnation
Post-tech/commsand 9/11 bust
Market creation; initialdemand sated
Smaller plane boom; some military Learjet distortion

©2021 Teal Group Corporation
$0
$2
$4
$6
$8
$10
$12
$14
$16
$18
Mar
ket V
alue
in ‘2
1 $B
illio
nsBottom Half Bizjet Segment vs. Top Half
Bottom Half (<$26M) Jan 2020
'03-'08 CAGR:19'7% Bottom,15.3% Top
'10-'19:4.3% Bottom,0.3% Top
'08-'10:-56.8% Bottom,3.5% Top

©2021 Teal Group Corporation
Eight Contradictory Bizav Indicators
•Three Leading Market Indicators:•Corporate profits (sharply down, but back up again).•Equities markets (good/excellent).•Oil prices (from very bad to rather
good).•Five Immediate Market Health
Indicators:•Deliveries (bad, but looking up)•Aircraft available for sale (just
modestly up…very good news…and now tightening again).
•Aircraft prices (down somewhat, but nicely up in May).•Company layoffs (GD, BBD, TXT…seem to have ended).•Utilization (down, but recovering much faster than airline
travel, with charter and fractionals looking great).

©2021 Teal Group Corporation
$0
$2
$4
$6
$8
$10
$12
$14
$16
$18
$20
Mar
ket V
alue
in '2
1 $B
illio
nsBottom Half Bizjet Segment vs. Top Half
Bottom Half (<$26M) Jan 2020 Top Half (>$26M) Jan 2020 Bottom Now Top Now

©2021 Teal Group Corporation
31.9%
0.8%
14.0%
10.0%
36.9%
5.3%
0.7%
28.6%
0.0%
14.0%11.6%
36.3%
6.1%
3.4%
0%
5%
10%
15%
20%
25%
30%
35%
40%
Bombardier Hawker Dassault Cessna Gulfstream Embraer Other
Business Jet Manufacturer Market SharesBy Deliveries Value, 2011-2020 vs. 2021-2030
'11-'20 '21-'30Excludes jetliners, RJs and turboprops

©2021 Teal Group Corporation
0
1
2
3
4
5
6
Valu
e of
Del
iver
ies
in 2
020
$ B
nsEmbraer: Searching For Growth After The E-Jet Revolution
E-Jets E-2 ERJ Series EMB120 Tucano AMX KC-390 Gripen Phenom 100/300 Legacy 450/500

©2021 Teal Group Corporation
0
50
100
150
200
250
300
Then
-Yea
r $ B
nsDoD Investment: Much Better Than In The Last
Jetliner Downturn
Procurement RDT&E O&M
©2021 Teal Group Corporation
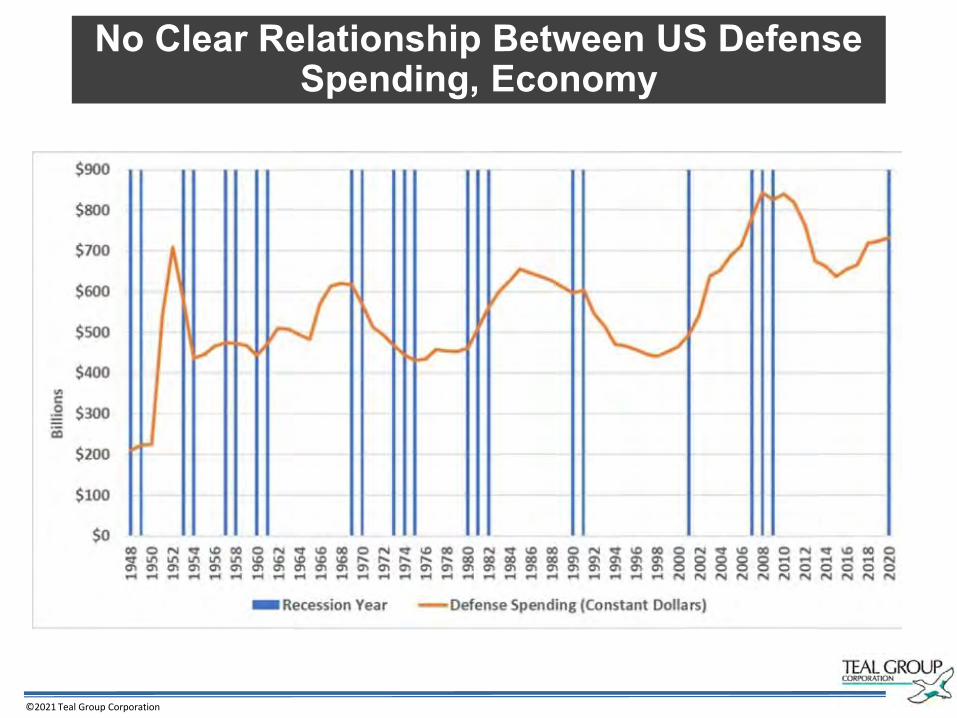
No Clear Relationship Between US Defense Spending, Economy

©2021 Teal Group Corporation
0
20
40
60
80
100
120
0
2
4
6
8
10
12
14
16
WTI
Oil
Pric
e in
201
6 $/
BB
l
Valu
e of
Del
iver
ies
in 2
020
$ B
nsAlso No Clear Relationship Between Export
Markets, Resource Prices(Or any other economic indicator)
Export Fighter Market Oil Prices

©2021 Teal Group Corporation
0
50
100
150
200
250
300
350
400
0
2
4
6
8
10
12
14
Uni
ts P
rocu
red
Fund
ing
in F
Y20
$ B
illio
ns
DoD Tactical Aircraft Procurement
Funding Units

©2021 Teal Group Corporation
0
5
10
15
20
25
30
35
40
45
50
'10 '11 '12 '13 '14 '15 '16 '17 '18 '19 '20 '21 '22 '23 '24 '25 '26 '27 '28 '29 '30
(Value of Deliveries in '21 $ Billions)
World Fighter Production Shares
F-35 US F-35 International Undetermined Europe Russia RoW Non-F-35 US
©2021 Teal Group Corporation
0
5
10
15
20
25
30
'94 '95 '96 '97 '98 '99 '00 '01 '02 '03 '04 '05 '06 '07 '08 '09 '10 '11 '12 '13 '14 '15 '16 '17 '18 '19 '20 '21 '22 '23 '24 '25 '26 '27 '28 '29 '30
Del
iver
ies
in 2
021
$ B
illio
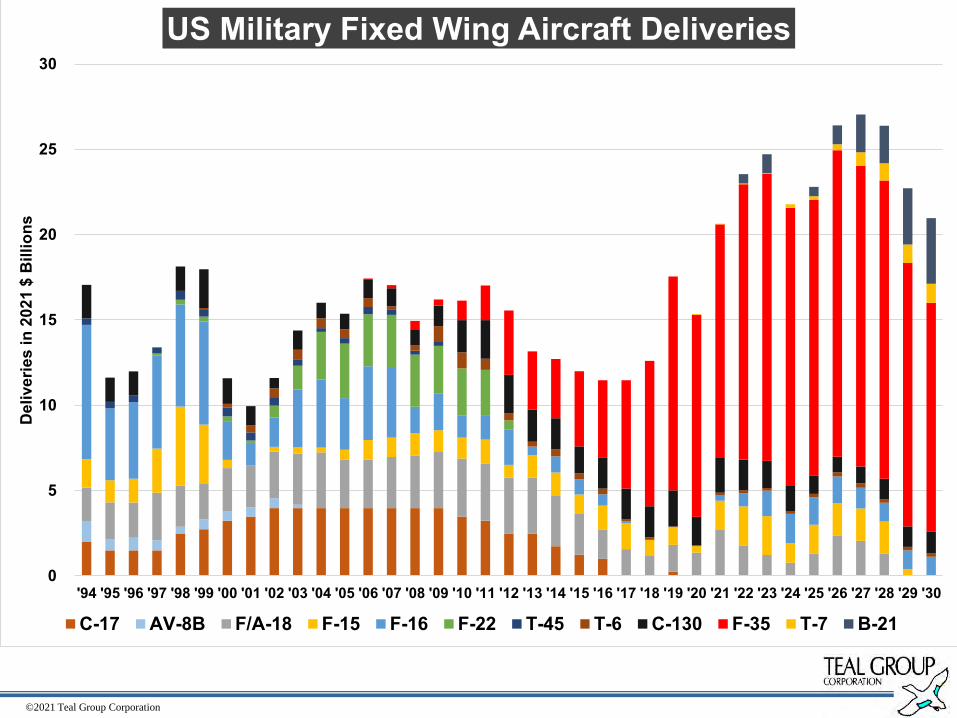
nsUS Military Fixed Wing Aircraft Deliveries
C-17 AV-8B F/A-18 F-15 F-16 F-22 T-45 T-6 C-130 F-35 T-7 B-21

©2021 Teal Group Corporation
0
1
2
3
4
5
6
7
8
Del
iver
ies
in 2
021
$ B
illio
nsEuropean Military Aircraft Deliveries
Coping Without F-35...To A Point;Germany, France, UK Fighter Decisions Loom
Eurofighter Rafale Gripen Tornado Mirage 2000 A400M Trainers Other Transports

©2021 Teal Group Corporation
0
5
10
15
20
25
-
200
400
600
800
1,000
1,200
1,400
1,600
1,800
Valu
e (2
021
$ B
illio
ns)
Uni
tsThe World Rotorcraft Market
The Age of Diminished Expectations
Value Units Delivered

©2021 Teal Group Corporation
0
2
4
6
8
10
12
Mar
ket V
alue
in 2
021
$Bill
ions
US Military Rotorcraft Market Falling; International Military and Civil Stable
Civil Military (US) Military (International)

©2021 Teal Group Corporation
21.0%
13.9%
25.3%
13.2%
22.7%
3.3%
18.6%
8.0%
22.6%
16.7%
22.1%
6.4% 6.0%
0%
5%
10%
15%
20%
25%
30%
Airbus Bell Boeing Leonardo Sikorsky Other Undetermined
Rotorcraft Manufacturer Market Shares2021-2030 vs 2011-2020
2011-2020 2021-2030

©2021 Teal Group Corporation
Global Aircraft Market Outlook In One Page(Deliveries, not Production)
Segment 2021 ’21-‘22 Risk Elevator CommentJetliners-SA 56.4% 31.5% Includes some already-built MAXs. Watch
China, fuel, traffic.
Jetliners-TA -1.8% 11.5% Overcapacity, slow international recovery, secular shift to SAs; 787 inventory issue
Regionals -0.3% 10.9% No Boeing supply chain effect on E-2; Scope clause de-risked, but little growth.
Business Aircraft -6.7% 8.0% Another hit after many false starts over a disappointing decade.
Civil Rotorcraft 0.1% 12.9% Large civil hit again. Too many new models aimed at a weak segment (oil/gas).
Military Rotorcraft 1.5% 3.0% Programs end/slow; no risk of accelerated downturn; FVL beyond forecast, exc FARA.
Military Transports -2.8% -1.4% A seriously underperforming market.
Fighters 29.2% 12.6% I like this market. F-35 (after COVID disruption), plus strong Gen 4.5
All Civil 16.4% 19.7% SAJetliner snapback due to MAX, weakness in other segments; more overcapacity risk.
All Military 14.9% 8.4% Global insecurity, Tension, Malice. Special mission (ISR, B-21) also boosts topline.
Total Industry 15.9% 16.2% Back to peak in 2024

©2021 Teal Group Corporation
$0 $50 $100 $150 $200 $250 $300 $350 $400
Airbus A320/NeoBoeing 737NG/MAX
Lockheed Martin F-35Boeing 787
Airbus A350XWBBoeing 777/XAirbus A220
Boeing 767/KC-46Gulfstream 650/700Gulfstream 500/600
Embraer E-JetsBBD Global 7500
Boeing AH-64Airbus A330/Neo
Sikorsky H-60Su-30/57
BBD Glob. 5/6500Boeing F-15
Northrop B-21ATR42/72
Top 20 Aviation Programs; Volume MattersCumulative Deliveries Value in '21 $ Bns
2021-2030 2011-2020
Top 5 are 56% of total; next 15 are 21%; remaining 100+ are 23%. And...the A320 (321) throws shade on everyone.

©2021 Teal Group Corporation
0%
10%
20%
30%
40%
50%
60%
70%
80%
0
10
20
30
40
50
60
70
80
90
100
% o
f Wor
ld
Valu
e in
202
1 $
Bill
ions
US Aircraft Industry Output
Total US Deliveries By Value US Output % of World
©2021 Teal Group Corporation
Covid-19 Impact: Not Much New; Just An Acceleration of Pre-existing Trends
• Societal: growing inequality, growth of e-commerce over stores, movie theaters decline, normalization of formerly fringe beliefs, rising illiberal democracies.
• Macroeconomic: lower interest rates, excess savings, few investment opportunities, cheaper fuel, China de-coupling.
• Industry:• More point-to-point international routes (fragmentation); related demand for
smaller, mid-range jets.• End of quadjets, marginalization of all larger jets.• Growing reliance on third party jetliner finance.• Jetliner price deflation.• Supplier rationalization, particularly 3/4th tier.• New product funding drought.• China indigenous substitute product development• Boeing single aisle breadth concerns; Airbus mid-market dominance.• Rolls-Royce under pressure.• OEMs and airlines: strong get stronger, weak get weaker.• Uncertain search for various alternative propulsion/fuel concepts.
• K-patterns everywhere: Domestic/int’l traffic, single aisles/twins, developed/emerging, bizav/scheduled, etc.

©2021 Teal Group Corporation
Concluding Observations, and A Few Consolations
•Civil aviation might get worse, depending on the Delta variant.• But, if not…a very steep decline will lead to record growth numbers
in the recovery, with attendant exuberance.•Boeing faces a very serious mid market challenge.•For companies, all about the work portfolio.•Defense companies can grow their civil side. Will they?•High defense spending may complicate the civil recovery.•There is some good news:
• An airline paradise, except for the traffic (and, perhaps, fuel).• Jet costs, Crew costs, interest rates, government support (for most, and
for now); Stimulate traffic, or restore profit?• Defense: budgets, export demand, industrial support.• Less business jet frothiness.• Financial sector stronger this time (“2008 was worse; you couldn’t
print money.”). Good for jetliners and for suppliers.•A relatively isolated (severe) jetliner-only downturn is our
baseline.

©2021 Teal Group Corporation
0
20
40
60
80
100
120
140
160
2021
$ B
illio
nsWorld Aircraft Deliveries By Value, 1989-2030
Military Civil (January 2020) Civil (August 2021)
MAXShutdown

©2021 Teal Group Corporation
0
20
40
60
80
100
120
140
160
2018 2019 2020 2021 2022 2023 2024 2025
Del
iver
ies
by V
alue
(% o
f 201
9; 2
018
for S
A+re
gion
als)
Divergent Delivery Recovery PathsTwin Aisles Are A Long-Term Concern
Military Bizav Rotorcraft Regionals (2018 peak)SA Jets (2018 peak) TA Jets World GDP (IMF)


![Telecommunication Products - Trendtek jointing pits.pdf · [01] UG2006 - P6 Pit UG2007 - P7 Pit UG2008 - P8 Pit UG2900 - P9 Pit UG2001 - P1 Pit UG2002 - P2 Pit UG2003 - P3 Pit UG2004](https://img.dokumen.tips/doc/110x75/5a7969077f8b9ab9308d3433/telecommunication-products-jointing-pitspdf01-ug2006-p6-pit-ug2007-p7-pit.jpg)