Embed Size (px)
Citation preview

ClimDB/HydroDB ObjectivesDon Henshaw
• Improve access to long-term collections of climatic and hydrological data– Long-Term Ecological Research (LTER)
• 26 NSF-funded sites
– U.S. Forest Service Research• Experimental Forests / Experimental Watersheds
• Use web technologies to facilitate synthetic research – Maintain a current data warehouse of multi-site, multi-
network, long-term climate and streamflow data– Provide single portal accessibility and a query interface to
download and graphically display data

ClimDB/HydroDB Harvester / Database/ Query Interface
Data Providers Central Site Public User
Triggerson-demand
auto-harvestHTTP Post
USFS Data
Exchange Format
Web Pagedisplay, graph, download
Web ServicesSOAP, WSDL
Access Toolssite-specific data mining
Data Warehouse
Centralized ClimDB/HydroDB
DatabaseH
arv
est
er
NWSData
USGS Data
LTER Data
Queryinterface

ClimDB Harvest File Naming ConventionExample of measurement parameter and associated quality flag names
LTER_Site LTER/Research Area site code (3-letter acronym)
Station Local site name for the weather station or gauging station
Date 8 character field (yyyymmdd)
Daily_AirTemp_Mean_C Mean daily air temperature
Flag_Daily_AirTemp_Mean_C Data quality flag for mean daily air temperature.
Daily_AirTemp_AbsMax_C Daily absolute maximum air temperature.
Flag_Daily_AirTemp_AbsMax_C Data quality flag for daily absolute maximum air temperature
Daily_AirTemp_AbsMin_C Daily absolute minimum air temperature
Flag_Daily_AirTemp_AbsMin_C Data quality flag for daily absolute minimum air temperature
Daily_Precip_Total_mm Daily total precipitation
Flag_Daily_Precip_Total_mm Data quality flag for daily total precipitation
Daily_Discharge_Mean_Lps Mean daily discharge
Flag_Daily_Discharge_Mean_Lps Data quality flag for mean daily discharge
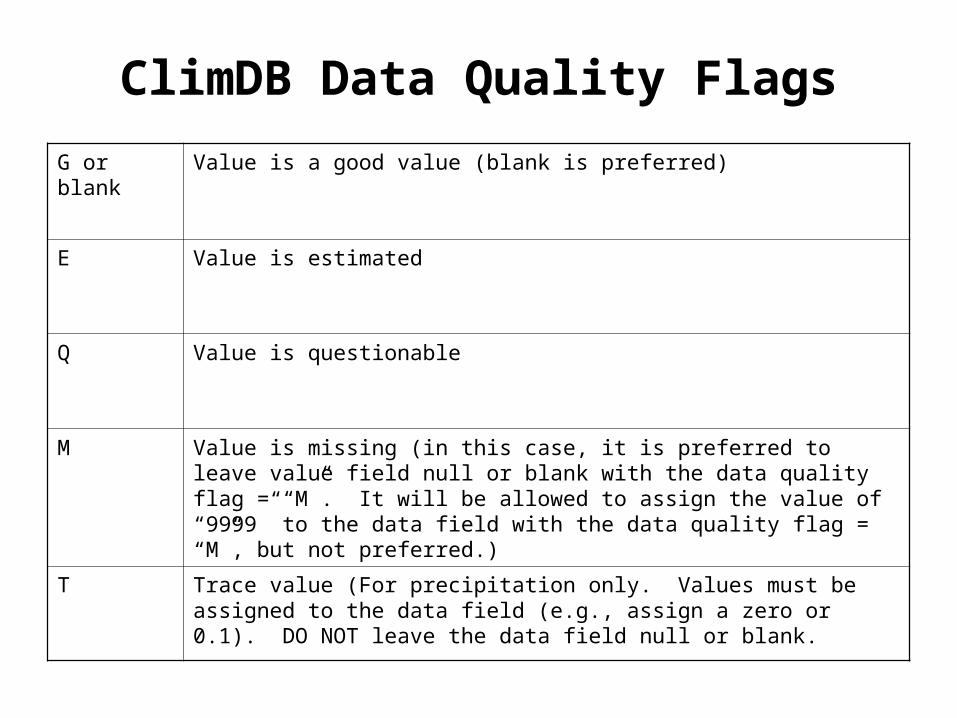
ClimDB Data Quality Flags
G or blank Value is a good value (blank is preferred)
E Value is estimated
Q Value is questionable
M Value is missing (in this case, it is preferred to leave value field null or blank with the data quality flag = “M”. It will be allowed to assign the value of “9999” to the data field with the data quality flag = “M”, but not preferred.)
T Trace value (For precipitation only. Values must be assigned to the data field (e.g., assign a zero or 0.1). DO NOT leave the data field null or blank.
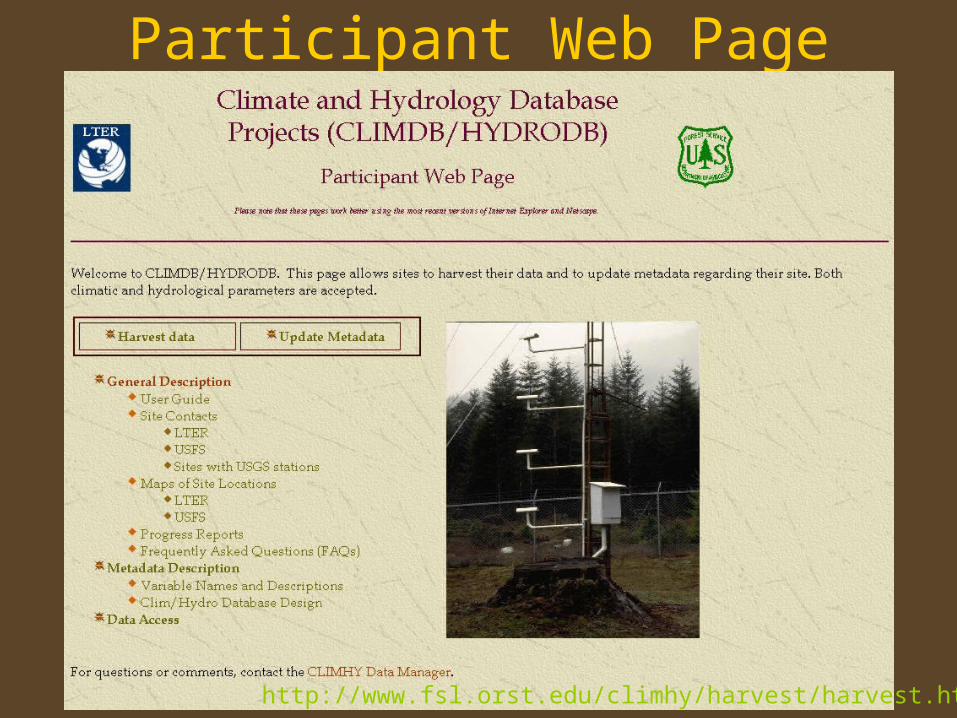
Participant Web Page
http://www.fsl.orst.edu/climhy/harvest/harvest.htm

Duplicate records found

ClimDB General Harvest QA/QC• FATAL ERROR(901): Missing quality assurance flag
– Description: All variables require that a flag_variable directly follow –
• FATAL ERROR(906): Duplicate found– Description: Duplicate record by site, station, parameter, and date–
• ERROR(002): Illegal flag character - [flag] not recognized– Description: Illegal flag. Data point is ignored.–
• WARNING(100): Unknown Variable– Description: Variable name is not listed as valid in the central variable
database. All values listed for that variable are ignored.–
• WARNING(101): [variable] = [value] Failed QC test (data limits check)– Description: Data value fails general data limits check. Data is still
accepted. –
• WARNING(106): Failed (min < mean < max) relationship – Description: Quality assurance failure. Data record is still accepted. –
• WARNING(104): Trace value error: Flag = T; data = null. Flag set to 'M'– Description: Flag indicates trace value. Data point is considered missing.

Data Warehouse
Content
Parameter
(Daily values)
% by Measured Parameter
Stream Discharge 29
Precipitation 26
Air Temperature 22
Relative Humidity 4
Global Radiation 4
Soil Temperature 3
Resultant Wind Speed 3
Resultant Wind Direction 2
Other 7
Observations:•Coverage of precipitation, discharge, and air temperature data is strong across sites.•We encourage sites to contribute relative humidity, soil temperature, wind speed & direction, and global radiation in datasets.
Primary emphasis
Secondary emphasis

ClimDB Temporal Coverage – LTER SitesAir temperature and precipitation
18691914192019271931
19551937
1960 1965 1970 1975 1980 1985 1990 1995 2000 20051869
28 August 2006
Air temperature and precipitation
1994-2003
22 sites
(85%)
1989-
2003
21
sites (81%)
19571957
1983-2003
14 sites
(54%)
20 years
15 years
10 years

HydroDB Temporal Coverage – 28 Sites19271930193119361940
19491940
1960 1965 1970 1975 1980 1985 1990 1995 2000 20051869
28 August 2006
USGS
19511952
1956
1957
1958
1958
Small watersheds
Streamflow

Characterization of quality flags in ClimDB LTER only: No USFS only and no USGS
Flag # Values % of Total# Absent Values
% All Missing
Null or
“G”ood
1,199,4404,141,646
88.02%
“E”stimated 145,365 2.40%
“M”issing 553,237 9.12% 507,227 16.13%
“Q”uestionable 17,981 0.30%
“T”race 10,341 0.17%
Total 6,068,010 100.00%

Characterization of quality flags in ClimDB All Data: LTER, USFS, and USGS
Flag # Values % of Total# Absent Values
% All Missing
Null or
“G”ood
1,781,3914,655,391
87.94%
“E”stimated 178,027 2.43%
“M”issing 671,135 9.17% 604,539 16.10%
“Q”uestionable 19,425 0.27%
“T”race 13,739 0.19% # Precip Values
1,344,951% Trace flag
1.02%
Total 7,318,966 100.00%
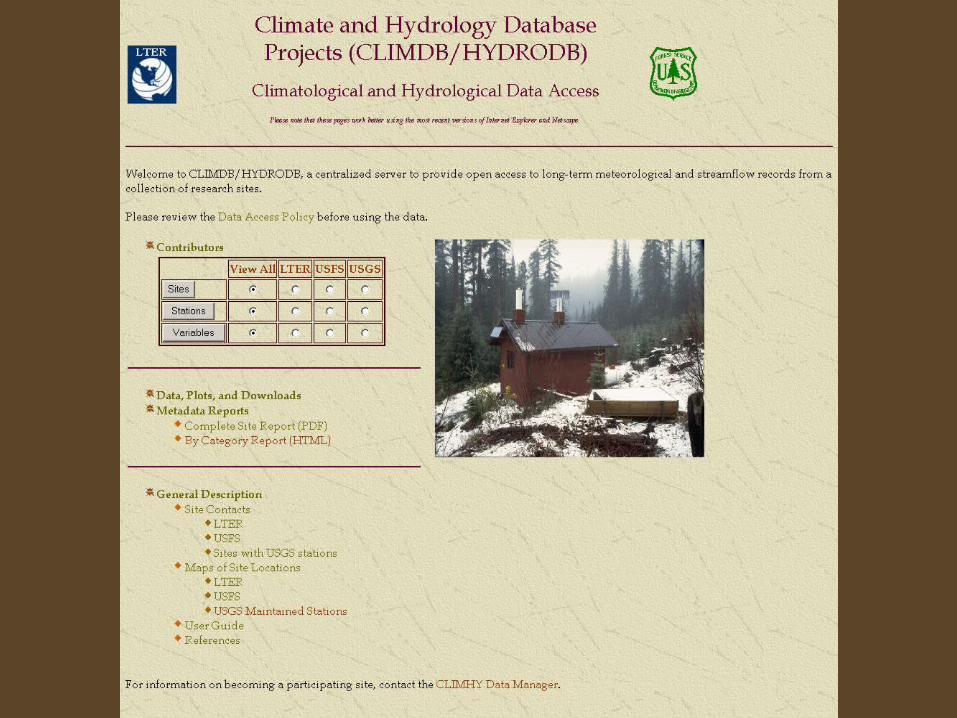

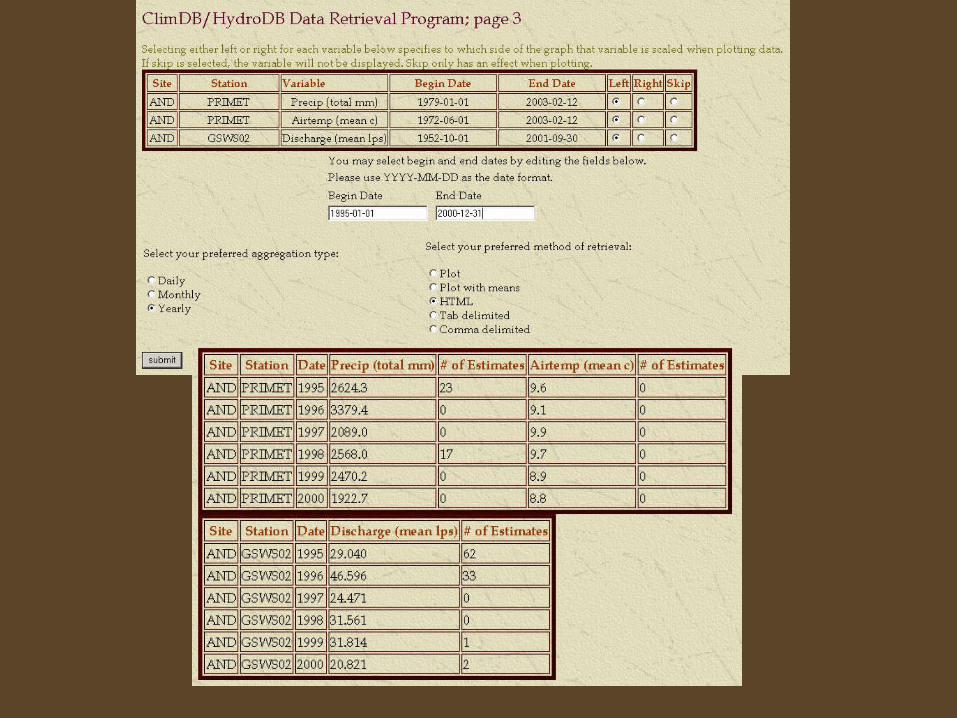
Data Acquisition
Download or Graphical Display

Data Acquisition

Metadata Reports
Detail information for the general site, all stations, and all parameters.
Metadata descriptions can also be downloaded
as a PDF
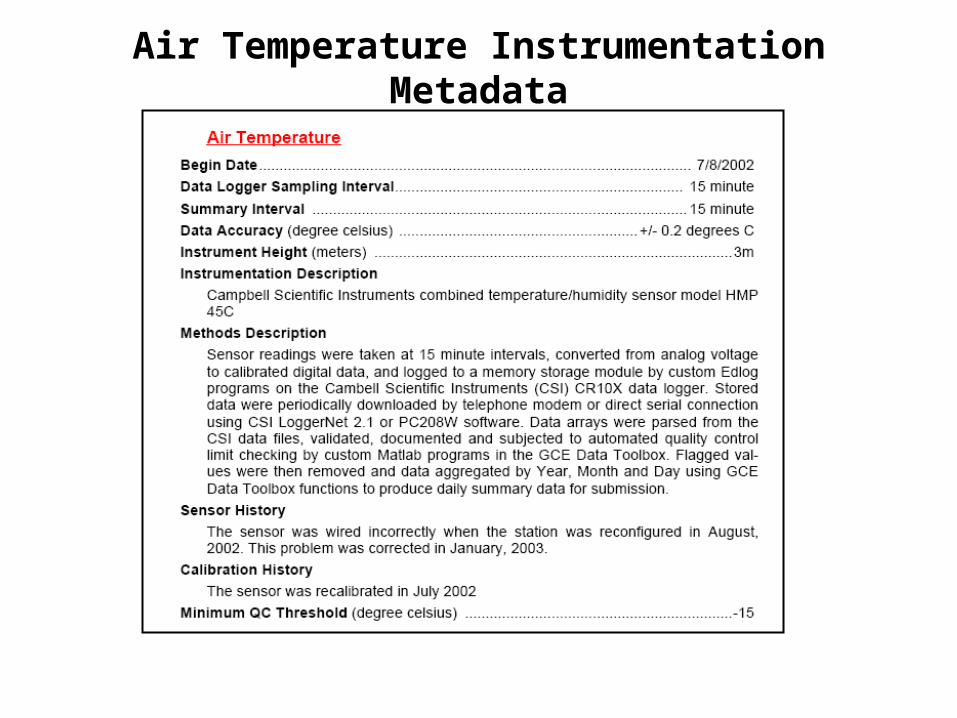
Air Temperature Instrumentation Metadata

ClimDB Improvements/Issues• Designate metadata attributes for describing
QA procedures, or for describing missing or questionable data problems
• Tally and list the number of records in monthly and annual aggregations. Optionally include questionable data?
• Output EML specific to each data download of a derived data product
• Develop web services to accommodate CUAHSI or other standard interfaces


![The San Francisco call (San Francisco [Calif.]) 1913 …...Henshaw and Tyler Henshaw and is a? ousin of Mrs. Harry Chickering and Miss Florence Henshaw. In college Mr. Henshaw prepared](https://img.dokumen.tips/doc/110x75/5f330aea5bd653373e409c34/the-san-francisco-call-san-francisco-calif-1913-henshaw-and-tyler-henshaw.jpg)