Embed Size (px)
Citation preview

Action Programme Environment and Health
Workshop on Exposure ofChildren to Substances usedas Ingredients in Pesticides
Berlin, 27 – 29 September 2001
Supported by the German Federal Ministry for the Environment, NatureConservation and Nuclear Safety in the framework of the Action Programme
“Environment and Health”
Federal Institute for Health Protection of Consumersand Veterinary Medicine

2
The participants of the workshop in front of the location Dahlem of the Fe-deral Environmental Agency in Berlin, where the first part of the workshoptook place.
The workshop has been supported by the German Federal Ministry for the Environment,Nature Conservation and Nuclear Safety, Grant No. 201 61 218/01. The administrativeand scientific support given by the Federal Environmental Agency is gratefully acknowl-edged.

3
I. Introductory remarks:Children are commonly exposed to lots of chemicals occurring from private use in the re-sidential areas. They are also representing a specific sub-population among the consu-mer-population. It is said that children are more sensitive towards chemicals, but this hasnot been considered particularly in risk assessment. The workshop, to which experts fromsix European states and from the US were invited, was held to prepare a compilation ofknowledge and approaches of exposure assessment for children. In this context, the resi-dential exposure to pesticides was taken as an example. One essential outcome of theworkshop was to elaborate minimal requirements which are needed to perform an ade-quate assessment. This includes the characterisation of the use of substances and pro-ducts, how they are released and transferred to the site of exposure, e.g. by residentialcontact after use by professionals or consumers, via contamination of indoor air, dust,soil, and food.To address the question of children as a vulnerable population, toxicogenetics and toxi-cokinetics were discussed, as well as children's special behaviour, e.g. mouthing, andhealth effects that can be observed.Because measurements are seldomly available to perform residential exposure assess-ments, models need to be developed. Data to be fed into those models need validationand approaches to gather data have to be developed..The consideration of variability and uncertainty of the data, models, and the respectiveresults has obtained an increased importance. The impact of statistical methodology andthe advantages and limits of probabilistic assessments will be addressed.The workshop was performed divided into three parts on three days:At the first day, introducing lectures giving overviews of the main items were held.At the second day, recommendations were worked out on four working groups, which we-re than discussed at day three in the plenum of the invited experts.This report comprises the lectures and is giving a structured and overview on the contri-butions as abstracts or papers, with a link to the presentations, the working group resultsand conclusions.
4
Contents:
I. INTRODUCTORY REMARKS: ......................................................................................................... 3
II. SECTION I (LECTURES AND POSTERS)....................................................................................... 6
II.1. ARE CHILDREN MORE VULNERABLE THAN ADULTS?........................................................................ 6II.1.1. Children versus adults: differences and similarities in response to environmental pollutants
and chemical/drug poisons ........................................................................................................ 6II.1.2. Impact of pharmacogenetics for toxicity of xenobiotics in children........................................... 7II.1.3. Behaviour patterns influencing exposure of children................................................................. 9
II.2. CHARACTERISATION OF PESTICIDE EXPOSURE TO CHILDREN ......................................................... 14II.2.1. Heavy metals, pentachlorphenol, pyrethroids, and allergens in house dust from children’s
dwellings .................................................................................................................................. 14II.2.2. Pathways of pesticide exposures for children........................................................................... 20II.2.3. An overview and characterization of the use of pesticides in German households .................. 21
II.3. HEALTH EFFECTS IN CHILDREN FROM PESTICIDE EXPOSURES ........................................................ 23II.3.1. Epidemiology of pesticide poisoning - Identification of health hazards to pesticide
exposures ................................................................................................................................. 23II.3.2. Current internal exposure to pesticides in children in Germany: data on organophosphate
and pyrethroid pesticides......................................................................................................... 26II.3.3. Health effects from exposure to pesticides in Germany............................................................ 30II.3.4. Toxic exposures to pesticides in children under 15 years: a one year experience of the
north of france poison centre................................................................................................... 35II.3.5. A review of the effects of low-level exposure to OP pesticides in children.............................. 38
II.4. ESTIMATION OF EXPOSURE BY MODELING AND/OR MEASURING..................................................... 40II.4.1. Modeling exposures to pesticides: Approaches and modeling needs ...................................... 40II.4.2. Requirements for models used for exposure assessment to pesticides..................................... 41II.4.3. Deterministic versus probabilistic estimation of exposure?..................................................... 43II.4.4. Uncertainty and variability of exposure data ........................................................................... 46
II.5. POSTERS ADDRESSING DIFFERENT ITEMS ....................................................................................... 51II.5.1. Exposure of children to creosote from wood impregnation on playgrounds............................ 51II.5.2. Homes with wool carpets, treated with permethrin - Exposure of adults and children............ 52II.5.3. German environmental survey 1990/92 (GerES II) and 1998 GerES III): PCP in urine
of the German population - spatial and temporal difference................................................... 54II.5.4. German environmental survey 1998 (GerES III): Pesticides in house dust ............................. 56II.5.5. Biocide emissions from indoor wall paints............................................................................... 57II.5.6. Areas of high agricultural pesticide use in California: How many children live there?.......... 59II.5.7. Documentation of pesticide use in the European Union .......................................................... 63II.5.8. The German Food Monitoring: Models for exposure assessment of undesirable
substances in food.................................................................................................................... 64II.5.9. Evaluation of symptoms from acute and chronic exposures of organophosphates and
pyrethroids............................................................................................................................... 68II.5.10. Pesticides in mother's milk ....................................................................................................... 71II.5.11. Exposure of children to contaminants: In vitro determination of oral bioavailability of
toxic substances in soil ........................................................................................................... 75II.5.12. Estimating non-dietary ingestion of toxic substances in children ............................................ 76II.5.13. Empirical evaluation in regard to differences in toxicokinetics between children and adults . 78II.5.14. Protecting Children’s Health: Science and Regulation........................................................... 80
III. CONCLUSIONS DRAWN FROM THE LECTURES AND POSTERS........................................ 83
IV. RESULTS FROM WORKSHOP WORKING GROUPS............................................................ 89
IV.1. WORKING GROUP 1: CHILDREN AS A VULNERABLE GROUP............................................................ 89IV.1.1. Why may children be more or less susceptible to chemical toxicity than adults? .................... 89IV.1.2. What is known about age related differences in pesticide toxicity? ......................................... 91

5
IV.1.3. How should age-related differences in susceptibility be accounted for in pesticide safetyassessment?.............................................................................................................................. 94
IV.1.4. Data Available / Data Needed.................................................................................................. 96IV.1.5. References ................................................................................................................................ 96
IV.2. WORKING GROUP 2: MODELING EXPOSURE OF CHILDREN TO PESTICIDES...................................... 99IV.2.1. Scenarios and models of exposure estimation, needs for data, uncertainty and variability. .... 99IV.2.2. Exposure scenarios and models ............................................................................................... 99IV.2.3. Modeling at different degree of abstraction, modularization................................................. 102IV.2.4. Evaluation and validation of exposure models....................................................................... 104IV.2.5. Overview on country-specific approaches.............................................................................. 105IV.2.6. Conclusions ............................................................................................................................ 105IV.2.7. References .............................................................................................................................. 105
IV.3. WORKING GROUP 3: "RESIDENTIAL USES OF PESTICIDES" ........................................................... 107IV.3.1. Goal........................................................................................................................................ 107IV.3.2. Introduction ............................................................................................................................ 107IV.3.3. Availability of residential pesticide use and exposure data.................................................... 108IV.3.4. Conclusion.............................................................................................................................. 110
IV.4. WORKING GROUP 4: BEHAVIOR OF CHILDREN AS A FACTOR DETERMINING EXPOSURE............... 111IV.4.1. Introduction ............................................................................................................................ 111IV.4.2. Children as a population ........................................................................................................ 111IV.4.3. Conclusions ............................................................................................................................ 114IV.4.4. References .............................................................................................................................. 114
V. CONCLUSION: WHAT ARE THE MOST IMPORTANT FACTORS THAT LIMITEXPOSURE OF CHILDREN (TO BE DISCUSSED IN THE PLENUM. EACH WORKING GROUPSHOULD PROVIDE A SHORT STATEMENT).................................................................................... 121
V.1. AGE GROUPS THAT SHOULD BE CONSIDERED FOR EXPOSURE ESTIMATION IN CHILDHOOD. .......... 121V.2. THE MOST IMPORTANT SOURCE OF EXPOSURE TO CHILDREN (SHOWN WITH THE EXAMPLE
“PESTICIDES”............................................................................................................................. 121V.3. IMPORTANT PATHS OF EXPOSURE TO CHILDREN?......................................................................... 122
V.3.1. Oral ........................................................................................................................................ 122V.3.2. Dermal.................................................................................................................................... 123V.3.3. Inhalation ............................................................................................................................... 123
V.4. HOW DO CHILDREN DIFFER FROM ADULTS? ................................................................................. 123V.4.1. Toxicokinetics ......................................................................................................................... 123V.4.2. Toxicodynamics ...................................................................................................................... 123V.4.3. Anthropometrics ..................................................................................................................... 123V.4.4. Behaviour ............................................................................................................................... 124
V.5. NEEDS FOR IMPROVEMENT KNOWLEDGE ON EXPOSURE IN CHILDHOOD....................................... 125V.6. CONCLUSION ............................................................................................................................... 126
VI. AUTOR'S INDEX ......................................................................................................................... 127
VII. SUBJECTS INDEX....................................................................................................................... 128
VIII. PARTICIPANTS OF THE WORKSHOP:................................................................................. 133
IX. WORKSHOP PROGRAMME .................................................................................................... 136

6
II. Section I (Lectures and posters)
II.1. Are children more vulnerable than adults?
II.1.1. Children versus adults: differences and similarities in responseto environmental pollutants and chemical/drug poisons
Open Presentation
Wayne R. Snodgrass
Objective:Minimal published data are available to evaluate quantitatively risk of exposure and re-sponse of infants and children to environmental pollutants and some chemical/drug poi-sons. Biologic differences in infants and children compared to adults allow possible pre-diction in some cases of potentially increased or potentially decreased toxicity risks tosome environmental chemicals.
Results:These biologic/physiologic differences include:as much as a 2.7 fold greater skin surface area: body mass ratio, proportionally largerbrain size, rapid brain growth, greater cerebral blood flow per unit mass of brain weight,developmental changes in brain neurotransmitters, a 40-fold to 60-fold greater lung respi-ratory minute ventilation rate per square meter of lung surface area, decreased but laterincreased (compared to adults) liver hydroxylation, glucuronidation and other metabolism,developmental ontogeny of cytochrome P450 isozymes, decreased renal glomerular fil-tration and tubular secretion, protein binding to albumin/alpha-1-acid glycoprotein andchemical tissue binding, and increased intracellular glutathione. Known examples fromthe available limited database will be discussed including hexachlorophene and benzylalcohol brain stem cell necrosis, lead (Pb) poisoning, acrodynia, acetaminophen hepato-toxicity, chloramphenicol gray-bab syndrome, gentamicin nephrotoxicity and ototoxicity,dystonic adverse drug reactions, nitrate-induced methemoglobinemia, fetal alcohol syn-drome, retinoid embryopathy, neural tube birth defects, breast milk environmental pol-lutant exposure, ozone air pollution, passive cigarette smoke exposure, and environ-mental endocrine disruptors.
Conclusion:All of these differences have potential implications for toxicological risk for infants andchildren, in some cases greater risk and in some cases lesser risk than adults.
Open Presentation

7
II.1.2. Impact of pharmacogenetics for toxicity of xenobiotics in child-ren
Matthias SchwabInterindividual variability in xenobiotic metabolism and in part in drug transport is extensi-ve and is one of the major determinants for the toxicity of xenobiotics. The causes for thisvariation are of genetic, physiological, pathophysiological and environmental origin. Theinfluence of the genetic background on toxicity of xenobiotics is particularly interestingconsidering that the reasons and mechanisms frequently are still unclear. Pharmacoge-netics seek to identify genetic factors that contribute to interpatient and interdrug variationin toxicity to xenobiotics. With the completion of the Human Genome project and identifi-cation of new genes, the next tasks are to unterstand the influence of genetic factors onsusceptibility of xenobiotics and to apply genetic profiling.Pharmacogenetics‘ is the study of variability in drug response due to heredity. This inclu-des inherited differences in metabolism, disposition and transport of xenobiotics as wellas in drug sensitivity (drug targets such as receptors) [figure 1]. The term pharmacoge-nomics emphasizes the development of novel agents based on newly discovered genes.Variations from a predominant allele are often referred to as genetic polymorphisms, aterm which is used to describe variants occurring with a frequency of 1% or greater in ahuman population. The significance of a polymorphism depends on the phenotype toestablish its functionality. The majority of pharmacogenetic differences that have so farbeen characterized on a molecular basis represents variability in xenobiotic-metabolizingenzymes. Most of the remaining appear to represent alterations in receptor affinity, trans-porters, or protein binding. For example, pharmacogenetic differences can be striking (upto 10000-fold) whereas differences in binding are generally less than 20-fold.Genetically determined variability in the level of expression or function of these enzymeshas a profound effect on toxicity and efficacy. Individuals can be classified by phenoty-ping as either poor-, extensive- or sometimes as ultra-rapid metaboliser. By means ofmolecular genetics allelic variants (e.g., mutation, deletion, amplification) can be detectedwhich can affect protein function in comparison to wild-type. Poor metabolisers are carri-ers of inactivating mutations, which result in a complete lack of active enzyme and for ex-ample a severely compromised ability to metabolise xenobiotics. On the other side poly-morphisms not only affect metabolic elimination but can also be important in the conver-sion of prodrugs to their active form. There is good evidence for some drug classes thatpolymorphic expression of metabolizing enzymes (e.g., NAT 2, CYP450 2A6, 2C9, 2C19,2D6, TPMT, UGT1A1) is responsible for either therapy failure, exaggerated drug respon-se or serious toxicity after taking the „standard and safe“ dose of drugs. The CYP450sare a multigene family of enzymes found predominately in the liver that are responsiblefor metabolic elimination of most of the xenobiotics currently used in medicine. For ex-ample, CYP2D6 is possibly the most popular CYP450 polymorphism and numerous stu-dies on molecular mechanisms and genotype-phenotype relationship have been perfor-med. Figure 2 summarize exemplary the functional consequences of the CYP2D6 poly-morphism.Whereas ethnic and racial diversity in the frequency of polymorphisms of xenobiotic-metabolizing enzymes are studied extensively, limited data are available concerning theexpression of xenobiotic-metabolizing enzymes during human development and ontogen-cy. Additionally, information about the biochemical or physiological factors that modulateup-regulation and down-regulation of enzyme activity during development is also incom-plete. Interindividual variability in drug metabolism in preterms, infants, toddlers and olderchildern is the result of a complex interaction between pharmacogenetics, development,

8
and additionally exogenous factors (e.g. disease, nutrition). Both pharmacogenetical anddevelopmental factors affecting the activity of xenobiotic-metabolizing enzymes should betaken into account for better understanding of toxicity of xenobiotics in children.Current research areas in Pharmacogenetics. Pharmacogenetics currently comprisesthe study of polymorphic xenobiotic-metabolizing enzymes and drug transporters anddrug targets such as drug receptors.
Figure 1.
The genetic polymorphism of CYP2D6 (debrisoquine/sparteine-polymorphism) andits consequences for drug therapy. Patients who receive the same standard dosage ofa CYP2D6 substrate show marked differences in drug plasma concentrations accordingto their constitutive CYP2D6 genotype and consequently may be at increased risk for ei-ther drug toxicity (poor metabolizer) or therapeutic failure (ultrarapid metabolizer).
Figure 2

9
II.1.3. Behaviour patterns influencing exposure of childrenOpen Presentation
Bea Steenbekkers
IntroductionThis mouthing study was set up as a preliminary research to determine the health risksfor children caused by phthalates in PVC-toys. It was part of a larger Dutch project inwhich risks of phthalates for young children were assessed. The project carried out underthe responsibility of the Dutch Consensus Group, consisted of four parts (Könemann,1998): a human volunteers study to determine release rates of di-isononylphthalate(DINP) from PVC samples into saliva (carried out by TNO Nutrition and Food ResearchInstitute) a child observation study to determine the oral contact time of small childrenwith baby toys (carried out by Wageningen University) a new assessment of the exposureof babies to DINP from soft PVC specimens (carried out by RIVM, Bilthoven)development of a routine laboratory method to determine the release rate of DINP fromPVC baby toys (carried out mainly by TNO Nutrition and Food research Institute, withassistance from other laboratories).In this paper information and results of the Wageningen mouthing study are presented(for more information see also Groot et al. (1998)).
Aim of the researchThe aim of the research is to quantify duration of mouthing in infants 3 to 36 months ofage and to study child-to-child variation.The term mouthing means: all activities in which objects are touched by the mouth or putinto the mouth except for eating and drinking. This term includes licking as well as suck-ing, chewing and biting.Children show different kinds of mouthing behaviour. The development in mouthing be-haviour starts with sucking as a reflex. After some time children start to explore by puttingthings into their mouth. This is not necessarily sucking, but also licking, chewing and bit-ing.When children get older, they suck when they are tired or need comfort. It is not possibleto pinpoint a part of the day in which it can be expected that children mouth more thanother parts of the day. This because of the fact that each child’s daily routine differs be-tween children and some children start exploring by mouth when they are lively, otherswhen they get tired.Differences between children regarding the mouthing behaviour are very large. Even bigdifferences are found in one family.
DesignIn order to obtain data that are suitable to be used to reach the aim of the study, observa-tions were done and a questionnaire was used (Steenbekkers, 2001).The observations had to be done by a person who is familiar to the child and in a normalsetting because this would least influence the behaviour of the child.Parents were asked to observe their children ten times 15 minutes per day on two days.This means a total observation time of 2.5 hours a day. The mouthing time was measuredby means of a stopwatch to get exact data. The observations took place when the childwas awake during the day. No observations were done while the child was sleeping or

10
eating. In addition to the observations, the parents filled in a questionnaire covering de-mographic aspects, characteristics of the child and policy regarding the use of a dummy.Five categories of objects are discerned: dummy/pacifier, theether, fingers, toys, nontoys. The parents specified the toys involved. On the basis of this specification the toysare divided into two groups: toys meant for mouthing and toys not meant for mouthing.This division is made according to the definition producers of toys give. It should be notedthat parents make this division in another way.The children are divided into four groups according to their age (3-6 months, 6-12months, 12-18 months and 18-36 months). Generally speaking each group is in a differ-ent phase of development.
AnalysisIn order to get daily mouthing times, the sum of the observed mouthing times during oneday was extrapolated to the total time awake. For this extrapolation the rhythm of the day,filled in in the questionnaire by the parents, is used to determine the time the child isawake and has the opportunity to put something into the mouth. The same procedurewas followed to obtain the total frequency of hand/object to mouth contact.Because the dummy is not made of PVC, this category is not important for this research.For this reason all presented mouthing times are the extrapolated total mouthing timeswithout a dummy for the time awake.
ResultsData of 42 children are obtained.The children are divided into 4 age groups, according to developmental period:
- 3 to 6 months (n=5);- 6 to 12 months (n=14);- 12 to 18 months (n=12);- 18 to 36 months (n=11).
The total time of mouthing behaviour in the observational period is extrapolated to thetime the child is awake and not involved in eating. This will be referred to as the ‘awaketime per day’. This is the total time of a day that the child has the opportunity to putobjects into the mouth.The total mouthing time per day differs much between children, both within and betweenage groups. The variation is large. The results for the different age groups are given intable 1.
Table 1. Descriptive statistics of total mouthing time [minutes] excluding dummy
standarddeviation
minimum mean maximum
3-6 months 19.0 14.5 36.9 67.0
6-12 months 44.7 2.4 44.0 171.5
12-18 months 18.2 0 16.4 53.2
18-36 months 9.8 0 9.3 30.9

11
The total mouthing time, without dummy, varies in this sample between 0 minutes andapproximately 3 hours. Mean total time is 26 minutes (standard deviation: 32 minutes) forall age groups taken together. Children in the youngest age group (3 to 6 months) usemostly their fingers to mouth on, whereas children in the age between 6 and 12 months ofage spend most of this total time mouthing on toys (not meant for mouthing). In this latterage group largest values for total mouthing time are found. This is graphically shown infigure 1.
age group [months]
18-3612-186-123-6
mea
n to
tal m
outh
ing
time
[min
utes
]
50
40
30
20
10
0
fingers
toys for mouthing
other toys
non toys
Figure 1. Mean totalmouthing time [minu-tes] during the awaketime per day, per cate-gory of objects and perage group, excludingdummy
Hand/object-to-mouth contactThe frequency of hand/object to mouth contact is assessed by counting the frequency ofcontact per observation period. These are added per day and extrapolated to the totaltime awake during the day. The correlation of the frequncy of contact between the firstand the second observation day is 0.817 and statistically significant (p<0.05).In table 2 the mean extrapolated frequency of contact for the two observation days isgiven per age group.
Table 2: Mean extrapolated frequency of hand/object to mouth contact per day.
age group[months]
mean standarddeviation
3-6 117 80
6-12 208 134
12-18 84 95
18-36 51 32
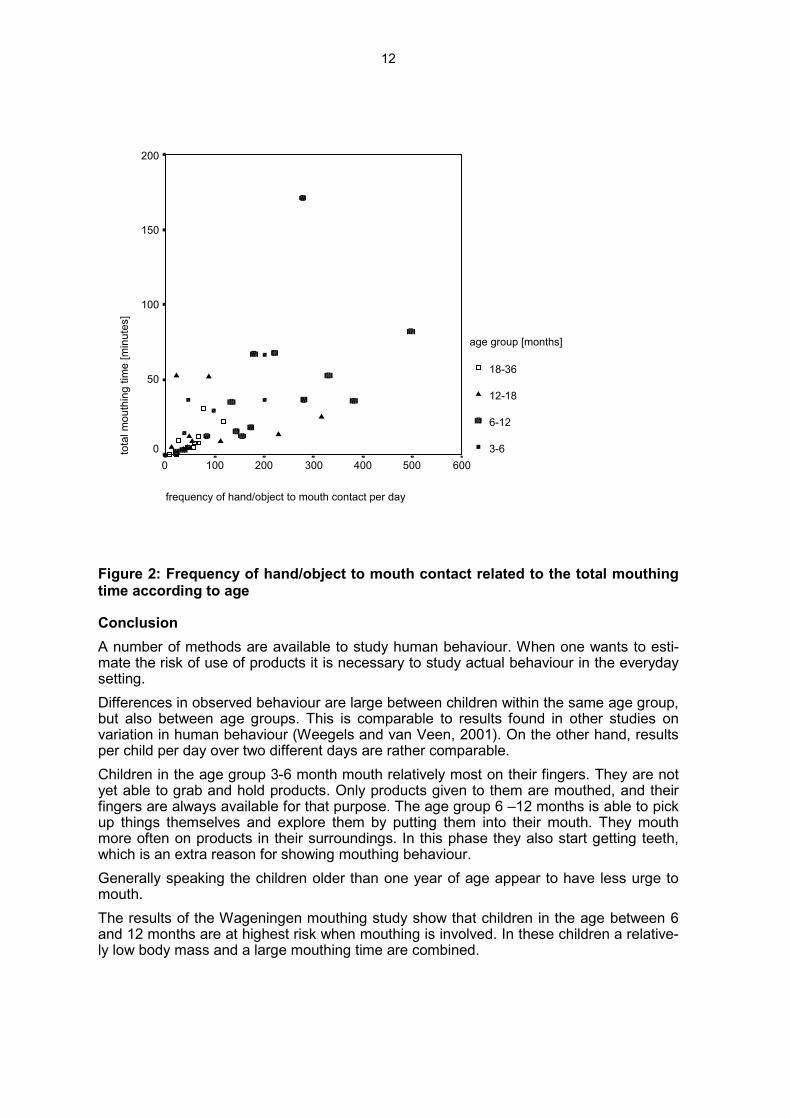
In figure 2 the frequency of contact is presented relative to the total mouthing time duringthe observed days. The correlation between these two variables is 0.611 and statisticallysignificant (p<0.05).
12
frequency of hand/object to mouth contact per day
6005004003002001000
tota
l mou
thin
g tim
e [m
inut
es]
200
150
100
50
0
age group [months]
18-36
12-18
6-12
3-6
Figure 2: Frequency of hand/object to mouth contact related to the total mouthingtime according to age
ConclusionA number of methods are available to study human behaviour. When one wants to esti-mate the risk of use of products it is necessary to study actual behaviour in the everydaysetting.Differences in observed behaviour are large between children within the same age group,but also between age groups. This is comparable to results found in other studies onvariation in human behaviour (Weegels and van Veen, 2001). On the other hand, resultsper child per day over two different days are rather comparable.Children in the age group 3-6 month mouth relatively most on their fingers. They are notyet able to grab and hold products. Only products given to them are mouthed, and theirfingers are always available for that purpose. The age group 6 –12 months is able to pickup things themselves and explore them by putting them into their mouth. They mouthmore often on products in their surroundings. In this phase they also start getting teeth,which is an extra reason for showing mouthing behaviour.Generally speaking the children older than one year of age appear to have less urge tomouth.The results of the Wageningen mouthing study show that children in the age between 6and 12 months are at highest risk when mouthing is involved. In these children a relative-ly low body mass and a large mouthing time are combined.

13
References:1. Groot, M.E., Lekkerkerk, M.C. and Steenbekkers, L.P.A. (1998). Mouthing behaviour
of young children, an observational study. Wageningen Agricultural University,Subdepartment of Household and Consumer Studies, Wageningen, The Netherlands.ISBN 90 6754 548 1
2. Könemann, W.H. (ed.) (1998). Phthalate release from soft PVC baby toys; report fromthe Dutch Consensus Group. National Institute of Public Health and the Environment,Bilthoven, The Netherlands.
3. Steenbekkers, L.P.A. (2001). Methods to study every day use of products inhouseholds: the Wageningen mouthing study as an example. Annals of OccupationalHygiene, Vol. 45, No. 1001, pp. S125-S129.
4. Weegels, M.F. and M.P. Van Veen (2001). Variation of consumer contact with house-hold products: a preliminary investigation. Risk Analysis, Vol. 21, No. 3, pp. 499-511.
Open Presentation
14
II.2. Characterisation of pesticide exposure to children
II.2.1. Heavy metals, pentachlorphenol, pyrethroids, and allergens inhouse dust from children’s dwellings
Open Presentation
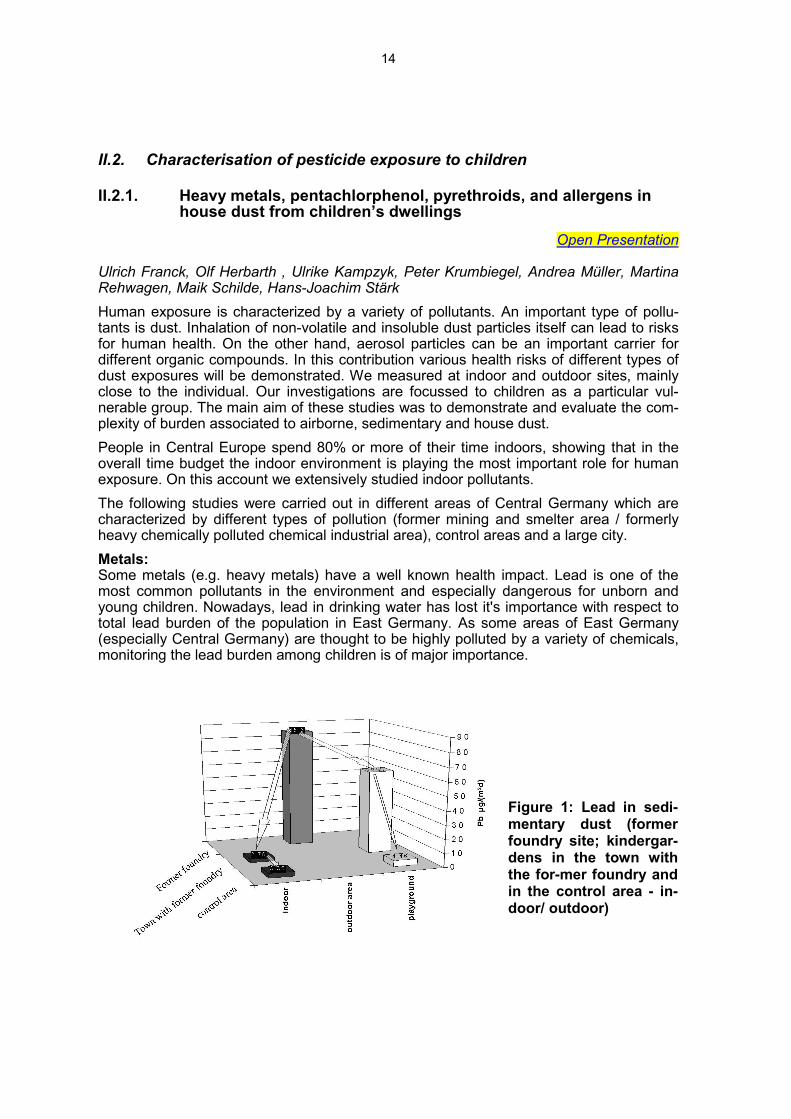
Ulrich Franck, Olf Herbarth , Ulrike Kampzyk, Peter Krumbiegel, Andrea Müller, MartinaRehwagen, Maik Schilde, Hans-Joachim StärkHuman exposure is characterized by a variety of pollutants. An important type of pollu-tants is dust. Inhalation of non-volatile and insoluble dust particles itself can lead to risksfor human health. On the other hand, aerosol particles can be an important carrier fordifferent organic compounds. In this contribution various health risks of different types ofdust exposures will be demonstrated. We measured at indoor and outdoor sites, mainlyclose to the individual. Our investigations are focussed to children as a particular vul-nerable group. The main aim of these studies was to demonstrate and evaluate the com-plexity of burden associated to airborne, sedimentary and house dust.People in Central Europe spend 80% or more of their time indoors, showing that in theoverall time budget the indoor environment is playing the most important role for humanexposure. On this account we extensively studied indoor pollutants.The following studies were carried out in different areas of Central Germany which arecharacterized by different types of pollution (former mining and smelter area / formerlyheavy chemically polluted chemical industrial area), control areas and a large city.Metals:Some metals (e.g. heavy metals) have a well known health impact. Lead is one of themost common pollutants in the environment and especially dangerous for unborn andyoung children. Nowadays, lead in drinking water has lost it's importance with respect tototal lead burden of the population in East Germany. As some areas of East Germany(especially Central Germany) are thought to be highly polluted by a variety of chemicals,monitoring the lead burden among children is of major importance.
Figure 1: Lead in sedi-mentary dust (formerfoundry site; kindergar-dens in the town withthe for-mer foundry andin the control area - in-door/ outdoor)

15
We compared sampling sites in a former mining and foundry town, in sites which are pol-luted rather by organic compounds than metals, and in control areas. The mass of air-borne and sedimentary dust does not differ significantly between the sampling sites (in-dustrial/control areas). On the other hand, a much higher exposure by metals could bedetected in the former mining area. A significantly higher burden was found in the formermining and smelter area.The concentration of lead in sedimentary dust decreases with increased distance fromthe former foundry (Fig. 1) The concentration of metals in house dust from children’sdwellings are higher in the neighborhood of the former foundry. The higher concentrationsof metals in airborne, sedimentary outdoor and indoor dust are related to higher concen-trations of metals in house dust.The (external) exposure of children to metals causes higher internal burden by metals.This is demonstrated by increased lead concentrations in the deciduous teeth of children(Fig. 2). The concentration in the teeth is a measure of past exposure and especially ofchronic and low level exposure. Moreover, the decay of the lead concentration within thishard tissue can be neglected. Consequently, the deciduous teeth represent a dosimeter,sampling from the beginning of the mineralization of the teeth up to the loss.
Figure 2: Lead concentra-tions in different parts of de-ciduous teeth of childrenfrom the town with the formerfoundry and from the controlarea
Mould:Mould, especially mould spores and microbial volatile organic compounds (MVOC) pro-duced by mould can be involved in the development of allergic diseases. The frequencyof mould increased within the last years and enforced energy saving.Type and frequency of mould species in the rooms where the children live were studied.According to air sampling Penicillium and Aspergillus were assumed as typical ”indoorfungi”. Penicillium and Aspergillus occurred in smaller numbers in summer than in theother seasons. In contrast, highest concentrations of total spores in house dust (predomi-nantly Cladosporium) and yeast were found in summer.
16
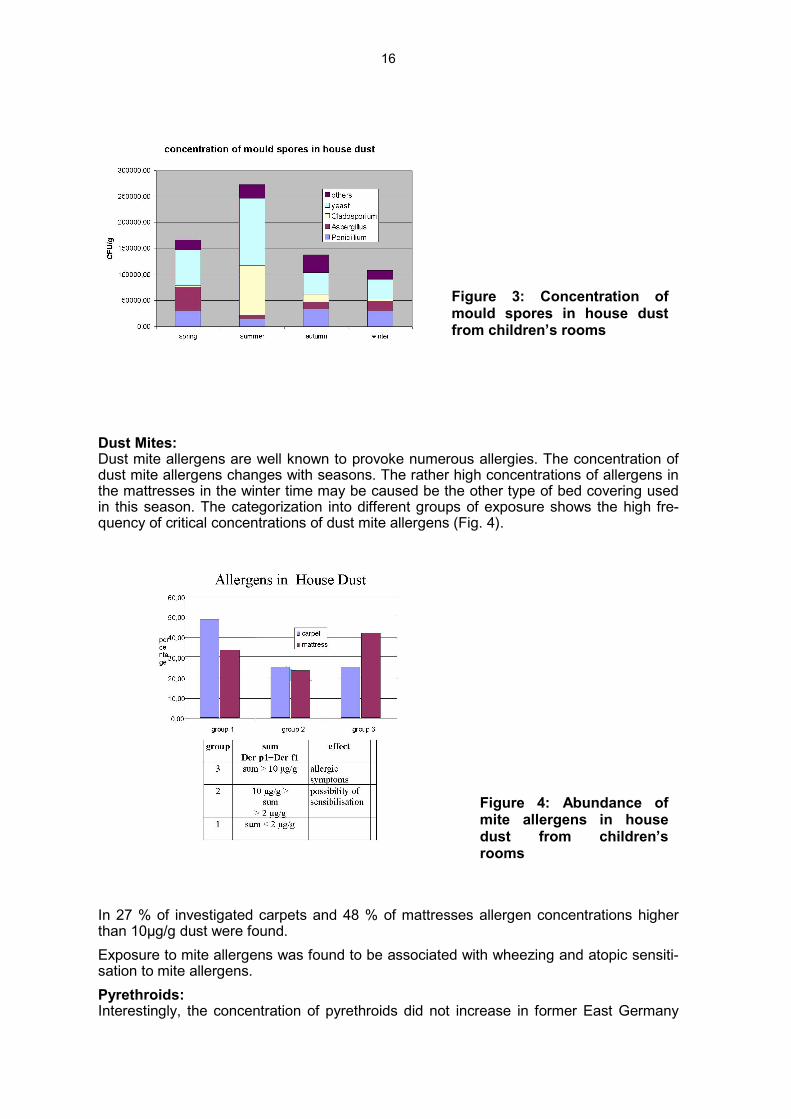
Figure 3: Concentration ofmould spores in house dustfrom children’s rooms
Dust Mites:Dust mite allergens are well known to provoke numerous allergies. The concentration ofdust mite allergens changes with seasons. The rather high concentrations of allergens inthe mattresses in the winter time may be caused be the other type of bed covering usedin this season. The categorization into different groups of exposure shows the high fre-quency of critical concentrations of dust mite allergens (Fig. 4).
Figure 4: Abundance ofmite allergens in housedust from children’srooms
In 27 % of investigated carpets and 48 % of mattresses allergen concentrations higherthan 10µg/g dust were found.Exposure to mite allergens was found to be associated with wheezing and atopic sensiti-sation to mite allergens.Pyrethroids:Interestingly, the concentration of pyrethroids did not increase in former East Germany

17
after reunification. Permethrin is the mostly used pyrethroid in household. It was most fre-quently found in the dwellings.Most of house dust and urine had concentrations in the range of reference area legally forthe general population. There was no correlation between the use of pyrethroids (que-stionnaires) and the concentrations in the house dust. The differences between the housedust and urine samples of “East“ and “West“ Germany were not significant.
West 90/91 East 91/92 Leipzig 99
3,710 1,020 0,905 arithmetric mean
0,23 0,16 0,3 geometric mean
39,4 7,4 7,945 98th percentile
287 48 21 max
Table 1: Statistical values of pyrethroid concentrations in west Germany vs. eastGermany, Leipzig
Permethrin 98,8 % of samplesBioallethrin 84,5 % of samplesDeltamethrin 88,2 % of samplesTetramethrin 97,5 % of samples
Table 2: Occurrence of pyrethroids in chil-dren’s rooms. Concentration above the detec-tion limit for pyrethroids
PCP:A correlation of the content of PCP in house dust and urine also could not be established.Because of the lack of between urine and dust concentrations of the PCBs for an indivi-dual risk assessment of PCB burden, dust measurements are not sufficient. The determi-nation of the internal load by PCB‘s is the preferable method for individual risk assess-ment. Lower concentrations in house dust samples and urine samples of children in Leip-zig were found, compared with small-towns.
Figure 5: High PCP concentra-tions are correlated with thepercentage of detachedhouses.

18
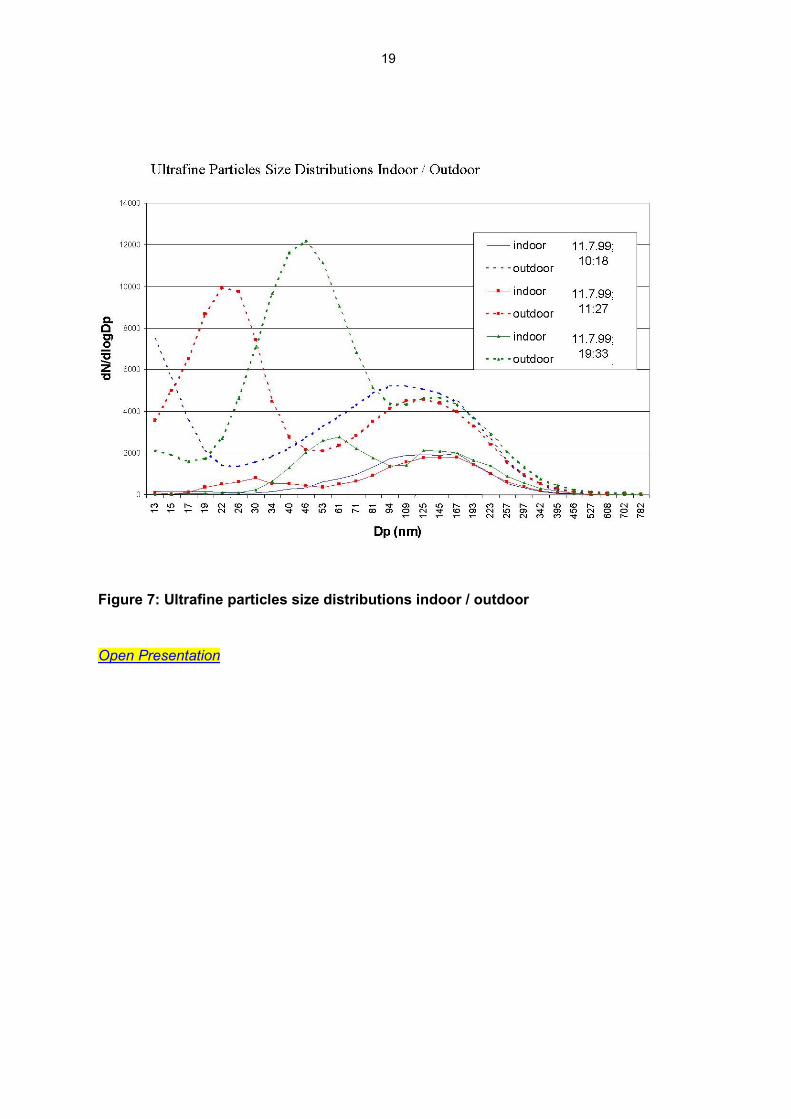
The differences between the house dust and urine samples of “East“ and “West“ Germa-ny were not significant.The chain from exposure to internal burden to (metabolic) effect can be revealed: Increa-sed perchloroethylene concentrations produce increased concentration of trichloroacidicacid in the urine. The burden leads to a decreased detoxification capacity which can beseen by the slower elimination of methacetine.At given mass concentrations the number concentrations increase dramatically with de-creasing particle diameter. The total particle surface (responsible for absorption of orga-nic compounds) also increases rapidly. Because of the time budget the knowledge of in-door particle concentration is essential for the risk assessment of this type of pollutant,too.The particle size distribution of indoor particles is different from outdoor ones. The indooratmosphere is generally shielded against outdoor particles, leading to lower number con-centrations indoors than outdoors, if no important indoor sources are present: Unlike thedecrease in mass concentrations of larger particle fractions, the decrease in the numberconcentrations of submicron and even more ultrafine particles is not linear. In the ab-sence of significant indoor sources exist sophisticated correlations between outdoor andindoor concentrations. Therefore, to differentiate the health effects of particles of differentdiameters, the different decrease in the particle number concentrations in dependence onthe particle sizes must be taken into account if indoor concentrations cannot be measuredand outdoor concentrations are used as surrogate of indoor measurements.
Figure 6: Pathway of perchloroethylene from house dust to humans
19
Figure 7: Ultrafine particles size distributions indoor / outdoor
Open Presentation

20
II.2.2. Pathways of pesticide exposures for children
Katinka van der Jagt
Open Presentation

21
II.2.3. An overview and characterization of the use of pesticides inGerman households
Jutta HerrmannProgress in sampling and analysis and the standardisation of these procedures enableimprovements in exposure analysis. For the identification of the sources of substancesfound in the indoor environment it is important to know the route by which the toxic pollut-ants get into the houses. Most of them are carried in by impregnated industrial materialssuch as residues of plant protection products in food, impregnated clothes, carpets andother fabrics and treated furniture, wall paper and many other commodities. This presen-tation focusses on those pesticide products which are bought and used by the residentsthemselves and those applied by professional pest control operators (PCO’s) in privatehomes.The pesticides used in households belong to different groups of products with very differ-ent regulative standards. Three main groups can be distinguished:
1. non-agricultural biocides (regulated by Biocides Directive(98/8/EC))2. Human and veterinary medicines (ectoparasitic) (regulated by Medicines Act)3. plant protection products (regulated by the Plant Protection Act)
There is a lack of data about the amount of substances used in German households.One source of data is the German Agricultural Chemical Industry Association (IVA). Thisorganisation represents around 70 % of the companies producing or selling non-agricultu-ral pesticides on the German market.Table 1 is taken from the annual report for 2000 from the IVA. It gives data on the totalamount and sales of active substances in pest control products for the use in households,with separate mention of professional uses. The private household uses play the majorrole, only around 15 % of the sales are due to PCO’s. A second interesting point in thereport is the decline of active substances from 1999 to 2000 but the increase in sales.This is due to the development of new, very efficiently acting substances, or new combi-nations of substances or different application measures.To achieve the desired effect of a pesticide product it is important that not only the activeingredients are effective against the target organisms, but also the formulation type. Thelatter is important for the efficacy and it determines the degree of contamination of an in-door environment. Formulations and application forms with a broad contamination riskare: aerosols, fogs, dusts (if used in large areas/surfaces). Formulations/applications witha lower risk because of a limited contamination of small areas in an apartment /buildingare baits, foams, crack-and-crevice-treatments or sticks.Concerning the patterns of use of pesticides in households there are 3 main problems:- the widespread use of easily accessable and applicable high risk products ,- the unqualified use of products not according to the label precautions and directions
and- the fact that many of the pesticide-applications in private homes are not necessary.

22
Table 1: Sales of pest control products for the use in private homes in 1999 and2000
sold amounts of active substances in tons
changes in portion for profes-sional use
changes in
group of active sub-stance
1999 2000 % 1999 2000 %
organophosphates 25,3 22,2 –12,3 6,8 3,9 – 42,6
alpha-Cyano-pyrethroides 0,1 0,4 300,0 0,1 0,3 200,0
other pyrethroids 2,0 2,7 35,0
pyrethrines 2,7 2,6 – 3,7
pheromones 0,2 0,4 100,0
other natural products 20,9 18,7 –10,5 {1,0 {0,7 {–- 30
rodentizides 1,4 1,3 –7,1 0,2 0,5 150,0
synergists 8,9 10,0 12,4 0,7 1,4 100,0
others 13,0 12,0 –7,7 1,1 1,1 0,0
all groups in tons (t) 75,1 70,3 – 6,4 9,9 7,9 – 20,2
sales in Mio. D-Mark 98,8 109,0 10,3 16,4 18,1 10,4
(source: IVA, „Jahresbericht 2000“)

23
II.3. Health effects in children from pesticide exposures
II.3.1. Epidemiology of pesticide poisoning - Identification of health ha-zards to pesticide exposures
Open Presentation
Nida Besbelli
BackgroundGrowing concern about poisoning by pesticides has lead to actions aimed at promotingtheir safe use and reducing adverse effects on health. In view of the interest expressedon pesticide poisonings by medical and other professionals, regulatory authorities incountries, chemical industry, international organizations and aid programmes to develo-ping countries, the IPCS decided to undertake formal studies, to develop statistics thatmay reflect the world situation. In this regard, activities of the IPCS developed with poi-sons centres and other partners have become highly relevant for the harmonized andcomparable collection of data on pesticide poisonings .In 1992, a consultation was convened by the IPCS with experts in the area of pesticidepoisoning. The purpose was to develop a specific project for collecting data on pesticidepoisoning on an international basis, with a view to establishing a sounder information ba-se to assess the global incidence of pesticide poisoning. The initial steps were to designstandard formats for collecting pertinent information on cases of poisoning. Followingfurther consultations in 1996 and 1997, a pilot study was undertaken in three countries totest both a simple and a more elaborate data collection format. Countries with an agri-culture-based economy, with a reasonably developed product registration system and in-frastructure for data collection and analysis were selected for this phase of the study (In-dia, Sri Lanka and Uruguay).
ObjectiveOverall objective of the project is to estimate the extent of human exposure and poisoningin selected regions/countries, with a view to implementing preventive and education stra-tegies to reduce morbidity and mortality from pesticide poisoning. This will be achievedthrough:
- study of toxic exposures- setting up surveillance mechanisms and databases on pesticides;- training within the health sector; and- awareness raising through public education and prevention campaigns.
Guidance documentsOn the basis of the experience gained during pilot data collection studies, a form wasprepared in 1997 to record patient data: “Pesticide Exposure Record” (PER). For severitygrading, the classification system Poisoning Severity Score (PSS) developed by IPCS incooperation with the European Commission and the European Association of PoisonCenters and Clinical Toxicologists is used. PSS is a classification scheme for cases ofacute poisonings which takes into account the observed clinical symptoms and signs. Itis a standardized scale for grading the severity of poisoning which allows qualitativeevaluation of morbidity caused by poisoning, better identification of real risks and compa-rability of data. Severity grades are as follows:

24
Severity grading of poisonings(0) NONE No symptoms or signs. Vague symptoms judged not to be related to poisoning
(1) MINOR Mild, transient and spontaneously resolving symptoms or signs
(2) MODERATE Pronounced or prolonged symptoms or signs
(3) SEVERE Severe or life-threatening symptoms or signs
(4) FATAL Death
Current studiesOn the basis of the experience gained and the data collected through this exercise, thetools developed (formats, strategy and methodology used) were assessed, discussed andimproved. The material prepared was presented to representatives of countries of theWHO South East Asia Regional Office (SEARO) ,Western Pacific Regional Office(WPRO) and Americas Regional Office (AMRO/Mercosur) at regional workshops held inNew Delhi, India , Singapore and Montevideo, Uruguay in from 1999 to 2001. Harmoni-sed Case Data collection using the proposed methodology is being implemented in se-lected areas from countries in SEARO, WPRO and AMRO.
Regional activities - SEAROFour countries in SEA Region, namely India, Indonesia, Nepal and Thailand have com-pleted the Trial Implementation Phase of the project. Although the coverage and durationof this trial phase differed between the countries, data were collected using a harmonisedpesticide exposure record (PER) format, medical staff was instructed on the collection ofinformation, on the diagnosis and treatment of cases of pesticide exposure and on theuse of the poisoning severity score (PSS). Guidance was given on developing a pesticideproduct register.Some results and conclusions of stage 1 (trial) studies, period covered, number of casesand circumstances of exposure, PSS and outcome are given in Tables I, II, III and IV.
Expected outputsThe expected outputs of the project include:
• Database on Pesticide Product Composition
• Report on “Health Effects of Pesticides”• Annual reports on human pesticide exposures and their characteristics• Establishment of an international mechanism for toxicovigilance and surveillance systems
for pesticide poisonings• Identification of hazardous pesticide formulations within countries• Prevention of pesticide poisonings through public awareness and prevention campaigns• Recommendations for action at the health care level (and other, if relevant)

25
Table 1: Results and Conclusions of Stage 1 Studies
Country Duration Participation Number of cases
India 1 year 10 hospital 1531
Indonesia 6 months 7 hospitals,1h.office 126
Nepal 6 months 4 hospitals, 1 h. inst. 258
Thailand 3 months 10 hospitals 130
Table 2: First Stage Studies-Circumstances of Exposure
Country Intentional
exposure
Accidental
exposure
Occupational expo-sure
India 1304 (85.0%) 72 (4.7%) 83 (5.2%)
Indonesia 54 (44.4%) 20 (15.9%) 47 (31.7%)
Nepal 236 (91.5%) 3 (1.2%) 16 (6.2%)
Thailand 80 (61.5%) 10 (7.7%) 37 (28.5%)
Table 3: Poisoning severity score
Country None Minor Moderate Severe Fatal
India 81 401 504 459 347
Indonesia 4 73 42 5 3
Nepal 14 66 107 61 41
Thailand 8 74 11 19 14
Table 4: Outcome
Country Recovery % Death related % Unknown %
India 953 (62.3) 347 (22.7) 213 (13.9)
Indonesia 122 (97.6) 3 ( 2.4) 1 ( 0.8)
Nepal 197 (76.4) 42 (16.3) 19 ( 7.4)
Thailand 90 (69.2) 14 (10.7) 19 (14.6)
Open Presentation

26
II.3.2. Current internal exposure to pesticides in children in Germany:data on organophosphate and pyrethroid pesticides.
Ursel Heudorf, Jürgen Angerer
Introduction:Human biomonitoring is an excellent tool for assessment of exposure to different sub-stances, if suitable methods are available to detect those substances or their metabolitesin biological material such as blood or urine specimen in a specific and sensitive way (1,2). With regard to organophosphate and pyrethroid insecticides, such methods have beenestablished in recent years (3, 4), and data on background exposure in adults in Germany(5-7) as well as elsewhere (8-11) have been published. Dietary intake of pesticides isthought to be the predominant source of pesticide exposure in the population. Children,however, are considered to be at risk from additional exposure to pesticides via contami-nations in the house due to their hand to mouth behaviour and thus ingestion of house-hold dust.
Methods:Here, the data of current background exposure to organophosphate and pyrethroid pesti-cides in more than 300 children under 6 years of age are presented. The data are part ofa large voluntary study of environmental medicine, which was conducted in Frankfurt amMain, Germany, 1998 (12-14). In the children´s homes recent indoor pesticide applicationhad been excluded by questionnaire. In household dust specimen tested for organophos-phate and pyrethroid pesticides chlorpyrifos and permethrin were the main contaminantsfound. Analyses for urinary metabolites of pesticides were done using well establishedand sensitive methods, using GC/MS (3, 4). The children´s spot urine samples were te-sted for six metabolites of organophosphates (dimethylphosphate (DMP), diethyl-phos-phate (DEP), dimethylthiophosphate (DMTP), diethylthiophosphate (DETP), dimethyldit-hio-phosphate (DMDTP) and diethyldithiophosphate (DEDTP) and for four pyrethroidmetabolites (cis-3-(2,2-dibromovinyl)-2,2-dimethylcyclo-propanecarboxylic acid (Br2CA),cis- and trans-3-(2,2-dichlorovinyl)-2,2-dimethylcyclo-propane-carboxylic acid (cis-Cl2CAand trans-Cl2-CA) and 4-fluoro-3-phenoxy-benzoic acid (F-PBA).
Results:In 92 % of the children´s urine samples metabolites of organophosphates were found,and in 66 % of these samples pyrethroid metabolites were above the limit of detection.Levels of urinary metabolites of organophosphate insecticides were more than hundred-fold higher than levels of pyrethroid metabolites (Tab. 1) Levels of urinary methylpho-phosphate metabolites were about tenfold higher than those of ethylphosphate metaboli-tes. With respect to pyrethroid metabolites, levels of trans-Cl2CA were about twice thelevels of cis-Cl2CA. Internal background exposure (P95) to dialkylphosphates was 621µg/g creatinine and background exposure (P95) to pyrethroids was about 2,9 µg/g creati-nine. No statistically significant seasonal variations in the urinary levels of metabolites oforganophosphates and pyrethroids were to be seen (Figure 1 a, b).

27
Table 1: Organophosphate and pyrethroid metabolites (µg/g creatinine) in urinesamples of children < 6 years of age
% >LOD
Mean±S.D. Range P25 P50 P75 P 95
Organophosphates*
DMP 77 63.4±117,6 <LOD-1096 8.8 27.4 65.7 242.0
DMTP 86 77.4±167.2 <LOD-1800 9.2 28.9 69.7 334.4
DMDTP 33 4.9±26.9 <LOD-424.7 <LOD <LOD 2.0 24.1
Sum methylmetabolites 88 145.8±273.5 <LOD-2620 23.4 57.6 148.2 594.0
DEP 77 8.4±12.1 <LOD-79.1 1.3 4.8 9.3 31.4
DETP 45 4.0±12.7 <LOD-115.5 <LOD <LOD 2.8 15.7
DEDTP 3 0.02±0.14 <LOD-1.5 <LOD <LOD <LOD <LOD
Sum of ethylmetabolites 78 12.4±22.2 <LOD-192.8 1.8 6.0 13.3 51.2
Sum of organophosphatemetabolites (µg/g crea)
92 158.1 ± 284.2 <LOD-2636 23.8 66.6 158.8 621.6
Pyrethroids**
Cis-Cl2-CA 26 0.11±0.32 <-4.0 <LOD <LOD 0.09 0.60
Trans-Cl2-CA 64 0.47±0.98 <-14.7 <LOD 0.30 0.55 1.82
Br2-CA 21 0.10±0.45 <-6.56 <LOD <LOD <LOD 0.51
F-PBA 20 0.09±0.24 <-1.96 <LOD <LOD <LOD 0.61
Sum of CA-pyrethroid-metabolites (µg/g crea)
66 0.69±1.38 < - 18.2 <LOD 0.39 0.71 2.92
* n= 309; ** n= 331
Figure 1 a, b: Organophosphate and pyrethroid metabolites found in urine speci-mens of children under 6 years of age (µg/g creatinine) in different months of theyear
13143338231N =
season (months)
oct/decaug/septjune/julyapr/mayfeb/mar
sum
of c
yclo
prop
anec
arbo
xylic
aci
ds (µ
g/g
crea
)
3,0
2,5
2,0
1,5
1,0
,5
0,011153236214N =
season (months)
oct/decaug/septjune/julyapr/mayfeb/mar
sum
of o
rgan
opho
spha
te m
etab
olite
s (µ
g/g
crea
)
500
450
400
350
300
250
200
150
100
50
0

28
Levels of chlorpyrifos and permethrin in household dust were in the same range (chlorpy-rifos 0.49±1.72 mg/kg, maximum value 14.9 mg/kg; permethrin 0.66 ± 2.95 mg/kg, maxi-mum value 36.9 mg/kg). No hints were found for an association of levels of chlorpyrifos orpermethrin in household dust with the levels of their specific urinary metabolites of thechildren living in these homes (Tab. 2).
Table 2: Assessment of associations of internal exposure of children under 6 yearsof age with specific pesticide levels in housedust of their homes
Number Correlations Chi-Quadrat-testPesticides inhousedust
Specific urinary meta-bolites
N r p Chi-Q p
DEP 230 -0.050 0.446 2.6 0.462
DETP 230 -0.010 0.883 4.3 0.224
Chlorpyrifos
Sum ethyl 230 -0.051 0.439 3.0 0.383
CisCl2CA 247 0.022 0.735 2.7 0.439
TransCl2CA 247 -0.089 0.161 4.1 0.248
Permethrin
Cis and trans Cl2CA 247 -0.076 0.233 3.8 0.291
Conclusion:Methods for human biomonitoring for organophosphate and pyrethroid insecticides areavailable with detection limits low enough to detect organophosphate metabolites inabout 92 % and pyrethroid metabolites in about 66 % of the children. Internal back-ground exposure of children (P 95) to dialkylphosphates was 621 µg/g creatinine andbackground exposure to pyrethroids was about 2.9 µg/g creatinine. Dietary intake of pe-sticides is thought to be the predominant source of exposure of the population to pestici-des. A significant seasonal variation in the excretion of pyrethroid and organophosphatemetabolites was not found in our study; this is obviously caused by the perennial availabi-lity of all food stuffs (vegetables and fruit). Though children under 6 years of age are con-sidered to be at risk for additional exposure to pesticides via household dust by hand tomouth activity while playing on the floor, no hints were found for an association of internalexposure of children to the levels of contamination in their homes (household dust).According to the exposure assessment of the Food and Drug Administration FAO, about5-10 µg organophosphorous insecticides are consumed per day (15, 16). Comparativedata for Germany are lacking, as well as data for pyrethroid exposure via nutrition. Con-firming other environmental studies (5, 8, 9), however, excretion of organophosphorousmetabolites in urine was exceeding the estimated dietary intake several fold. This discre-pancy demands further investigation. It was hypothesized that due to i.e. light energy orbacterial activity degradation to the metabolites might occur on the food stuff already.Therefore, instead of „parent“ organophosphorous insecticides, which hence would be nolonger detectable, consumers might ingest metabolites, which are not tested by the foodcontrollers. Ingestion of high amounts of – up to now not detected and not analysed - me-tabolites may then be the cause of the high urinary organophosphate metabolite excre-tion of the population (5). Further investigations are necessary to test this hypothesis .

29
References:1. Institute for Environment and Health: Report No R5: The use of biomarkers in envi-
ronmental exposure assessment. Leicester, 19962. World Health Organisation: Guiding principles for the use of biological markers in the
assessment of human exposure to environmental factors – an integrative approach ofepidemiology and toxicology. Report on a WHO consultation, Cracow, 1993.
3. Hardt J, Angerer J: Determination of dialkylphosphates in human urine using gas-chromatography-mass spectrometry. J Anal Toxicol (2000) 24: 678-684.
4. Angerer J, Ritter A. Determination of pyrethroid metabolites of pyrethroids in humanurine using solid-phase extraction and gas chromatography-mass-spectrometry. JChromatography (1997) 695: 217-226.
5. Angerer J, Hardt J. Excretion of organophosphate metabolites in the general popula-tion (in German). Arbeitsmed Sozialmed Umweltmed (1997) 32: 470-47
6. Butte W, Walker G, Heinzow B (1998) Reference values for urinary concentrations ofthe metabolites of permethrin Cl2-CA (3-(2,2-Dichlorvinyl)-2,2-dimethylcyclopropane-carboxylic acid) and 3-PBA (3-phenoxybenzoicacid) (German) Umweltmed ForschPrax 3: 21-26 (1998).
7. Hardt J, Heudorf U, Angerer J. Exposure of the general population to pyrethroids(German) Umweltmed Forsch Prax (1999) 4: 54-55
8. Aprea C, Sciarra G, Orsi D, Boccalon P, Sartorelli P, Sartorelli E: Urinary excretion ofalkylphosphates in the general population (Italy). Sci Tot Environ (1996) 177: 37-41(1996)
9. Aprea C, Strambi M, Novelli MT, Lunghini L, Bozzi N. Biologic monitoring of exposureto organophosphorous pesticides in 195 Italian children. Environ Health Perspect(2000) 108: 521-525.
10. Lu C, Knutson DE, Fisker-Andersen J, Fenske RA: Biological monitoring survey oforganophosphorous pesticide exposure among preschool children in the Seattle met-ropolitan area. Environ Health Perspect (2001) 109: 299-303.
11. Oglobline AN, Elimelakh H, Tattam B, Geyer R, o´Donnell GE, Hold: Negative ion ex-change ionization GC/MS-MS analysis of dialkylphosphate metabolites of organo-phosphate pesticides in non-occupationally exposed subjects. Analyst (2001) 126:1037-1041.
12. Heudorf U, Angerer J: Internal exposure to PAHs of children and adults living in ho-mes with parquet flooring containing high levels of PAHs in parquet glue. Int Archivesof Occupational and Environmental Health (2001) 74: 91-101
13. Heudorf U, Angerer J: Metabolites of pyrethroid insecticides in urine specimens: cur-rent exposure in an urban population in Germany. Environmental Health Perspectives(2001) 109: 213-217.
14. Heudorf U, Angerer J: Metabolites of organophosphorous insecticides in urine speci-mens from inhabitants of a residential area. Data from the former American Forceshousing estates in Frankfurt am Main, Germany. Environmental Research (2001)86:80-87.
15. Gunderson EL: FDA Total Diet study, july 1986-april 1991, Dietary intakes of pestici-des, selected elements and other chemicals. J AOAC Int (1995) 78: 1353-1363
16. Yess NJ: Residue monitoring 1991 – Food and Drug Administration Pesticide Pro-gram. J AOAC Int (1991) 75: 135A-157A.
30
II.3.3. Health effects from exposure to pesticides in GermanyOpen Presentation
Herbert Desel
Objective:Poison centres (PCs) give advice in most acute exposures to all kinds of products andnatural organisms. PCs keep record of all cases in which they are involved in electronicdatabases which can be searched for epidemiological studies. A basic set of informationis recorded for all cases, a selection of cases (with well defined patient's history) is fol-lowed up carefully with respect to symptoms and outcome. The frequency of pesticideexposures and the character of pesticide-related intoxications in childhood is investigatedin North Western Germany.
Method:The GIZ-Nord poison centre's database is searched for cases with exposure during theyears 1996-2000, especially for cases with exposures to pesticides in children. The num-ber of exposed human beings was calculated by eliminating calls without human expo-sure from the data set and correcting cases with more than one patient. Age groups fordetailed analysis were children (below 10 years) and juveniles (10 to 18 years old) ac-cording to the harmonised EU – recommendations for poison centre reports (1). Productnames recorded in the database were classified according to a category system devel-oped in the German research project EVA (2). Severity of clinical symptoms was scoredusing the IPCS poisoning severity score (PSS) (3).
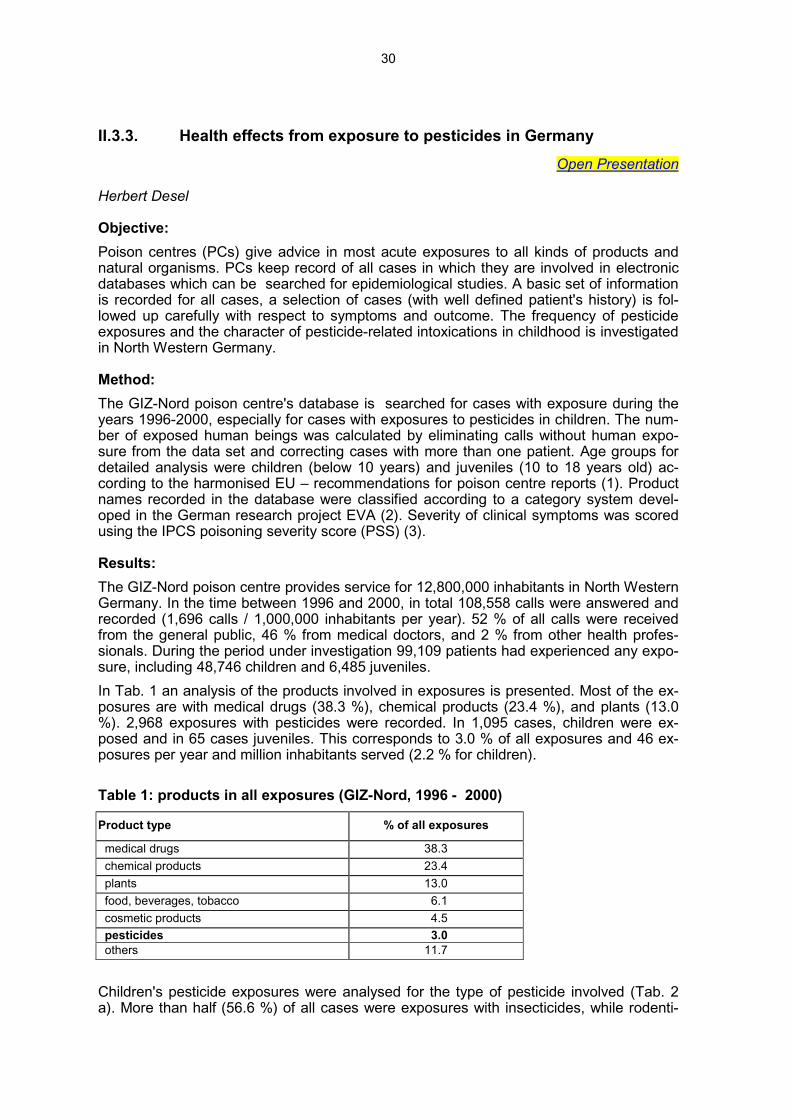
Results:The GIZ-Nord poison centre provides service for 12,800,000 inhabitants in North WesternGermany. In the time between 1996 and 2000, in total 108,558 calls were answered andrecorded (1,696 calls / 1,000,000 inhabitants per year). 52 % of all calls were receivedfrom the general public, 46 % from medical doctors, and 2 % from other health profes-sionals. During the period under investigation 99,109 patients had experienced any expo-sure, including 48,746 children and 6,485 juveniles.In Tab. 1 an analysis of the products involved in exposures is presented. Most of the ex-posures are with medical drugs (38.3 %), chemical products (23.4 %), and plants (13.0%). 2,968 exposures with pesticides were recorded. In 1,095 cases, children were ex-posed and in 65 cases juveniles. This corresponds to 3.0 % of all exposures and 46 ex-posures per year and million inhabitants served (2.2 % for children).
Table 1: products in all exposures (GIZ-Nord, 1996 - 2000)
Product type % of all exposures
medical drugs 38.3 chemical products 23.4 plants 13.0 food, beverages, tobacco 6.1 cosmetic products 4.5 pesticides 3.0 others 11.7
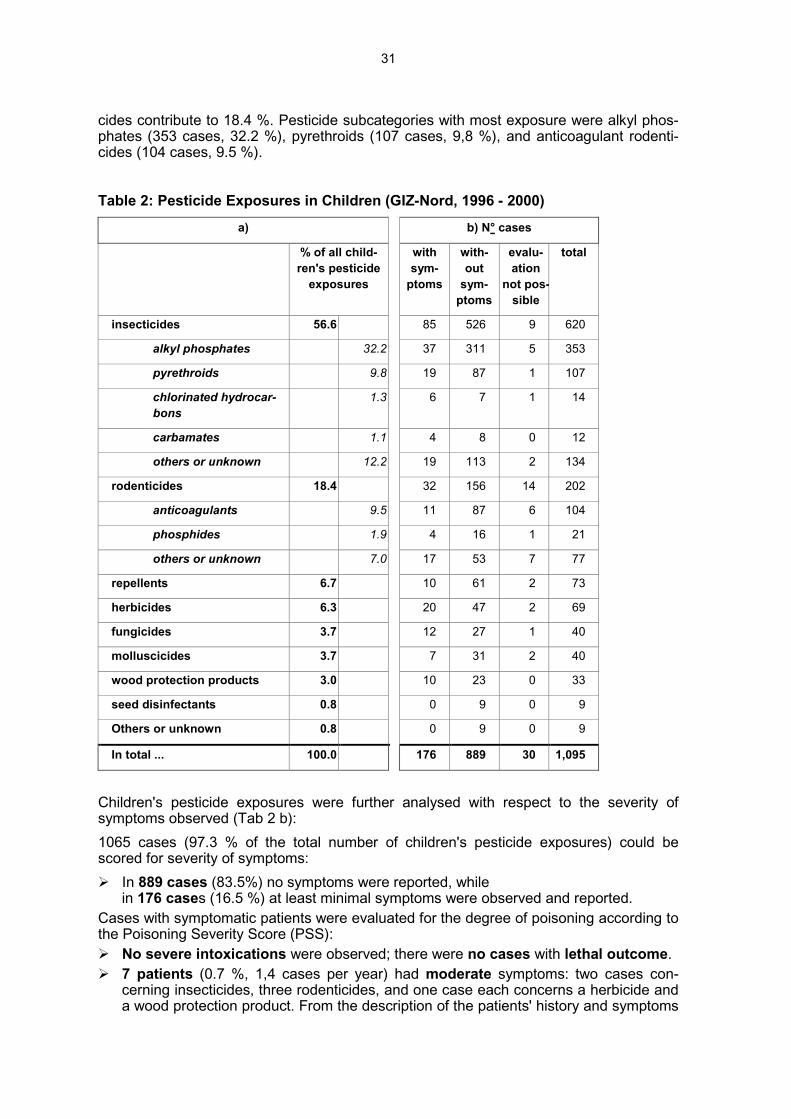
Children's pesticide exposures were analysed for the type of pesticide involved (Tab. 2a). More than half (56.6 %) of all cases were exposures with insecticides, while rodenti-
31
cides contribute to 18.4 %. Pesticide subcategories with most exposure were alkyl phos-phates (353 cases, 32.2 %), pyrethroids (107 cases, 9,8 %), and anticoagulant rodenti-cides (104 cases, 9.5 %).
Table 2: Pesticide Exposures in Children (GIZ-Nord, 1996 - 2000)a) b) N° cases
% of all child-ren's pesticide
exposures
withsym-
ptoms
with-out
sym-ptoms
evalu-ation
not pos-sible
total
insecticides 56.6 85 526 9 620
alkyl phosphates 32.2 37 311 5 353
pyrethroids 9.8 19 87 1 107
chlorinated hydrocar-bons
1.3 6 7 1 14
carbamates 1.1 4 8 0 12
others or unknown 12.2 19 113 2 134
rodenticides 18.4 32 156 14 202
anticoagulants 9.5 11 87 6 104
phosphides 1.9 4 16 1 21
others or unknown 7.0 17 53 7 77
repellents 6.7 10 61 2 73
herbicides 6.3 20 47 2 69
fungicides 3.7 12 27 1 40
molluscicides 3.7 7 31 2 40
wood protection products 3.0 10 23 0 33
seed disinfectants 0.8 0 9 0 9
Others or unknown 0.8 0 9 0 9
In total ... 100.0 176 889 30 1,095
Children's pesticide exposures were further analysed with respect to the severity ofsymptoms observed (Tab 2 b):1065 cases (97.3 % of the total number of children's pesticide exposures) could bescored for severity of symptoms:� In 889 cases (83.5%) no symptoms were reported, while
in 176 cases (16.5 %) at least minimal symptoms were observed and reported.Cases with symptomatic patients were evaluated for the degree of poisoning according tothe Poisoning Severity Score (PSS):� No severe intoxications were observed; there were no cases with lethal outcome.� 7 patients (0.7 %, 1,4 cases per year) had moderate symptoms: two cases con-
cerning insecticides, three rodenticides, and one case each concerns a herbicide anda wood protection product. From the description of the patients' history and symptoms

32
observed (Tab. 3) the routes of exposure and absorbed doses can roughly be esti-mated: The exact exposures were low or unknown in all these cases.
� 169 (15.9 %) pesticide exposed children suffered from minor symptoms.
Table 3: Cases with Moderate Symptoms After Pesticide Exposures in Children(GIZ-Nord, 1996 - 2000)� Parents reported that their 6 month old boy became apnoic for 30 sec after an episode of crying. Two
weeks before the family's apartment had been (professionally) treated with 7 l of a insecticidal solutioncontaining fenitrothion, pyrethrum, and piperonyl butoxide.
� A 1½yo girl developed hemorrhagic diarrhea for two days after licking an ant-trap with unknown insectici-dal incredients.
� At night, a 2½yo boy developed a series of three seizures. The ground around the family's house wastreated with an anticoagulant-type rodenticide product.
� A 6yo boy suffered from seizures, was afterwards disoriented and developed cyanosis after oral uptake ofan unknown dose of unknown rodenticide.
� A 3yo girl was found stuporous with open eyes, not reactive to verbal stimuli. A relation with an oral uptakeof an unknown dose of an unknown rodenticide was questioned.
� Parents reported that their 8y boy inhaled an unknown dose of a fungicide containing azoxystrobin anddeveloped a strong allergic reaction (unknown type).
� A 2½yo girl developed a seizure while playing in wooden sand-box which was treated with a wood protec-tion product containing furmecyclox, dichlofluanid, and permethrin. Later she suffered from diarrhea.
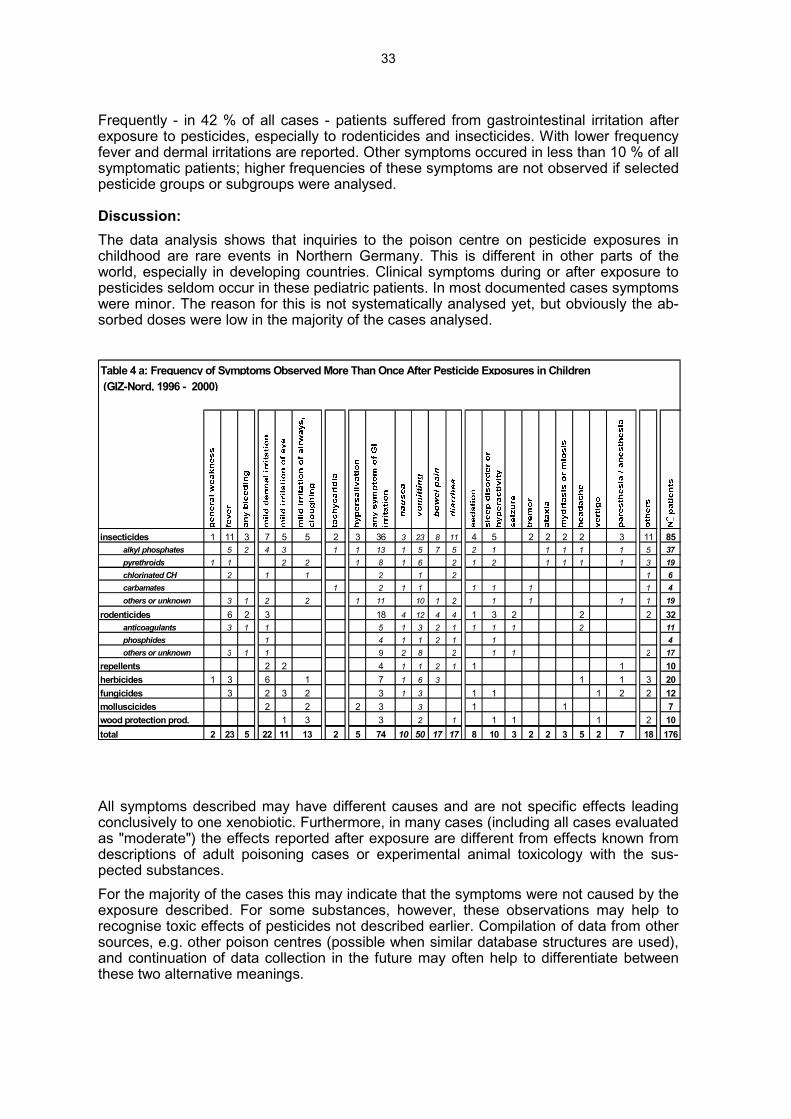
In Tab. 4, all symptoms reported to the poison centre are compiled. Tab 4 a shows all minorand moderate symptoms that were observed at least two times, Tab 4 b lists minor symp-toms occuring only once.
Table 4 b: Minor Symptoms Observed Only Once After Pesticide Exposure in Children(GIZ-Nord, 1996 - 2000, cases described in Tab. 3 are excluded)
Insecticides
Carbamates frequent belching
chlorinated hydrocar-bons atopic dermatitis
alkyl phosphates sore throat, thirst, irregular taste perceptions, slightly elevated liver enzymes,change of hair consistency
pyrethroids (slight) dyspnoe, discoloration of feces, paleness
others or unknown refusal of drinking
Herbicides detachment of skin (1 finger), respiratory sound, urticaria
Fungicides disturbed perception, cardiac sound
Wood protection products asthmatic attack (minor), edema (small area of arm)
33
Frequently - in 42 % of all cases - patients suffered from gastrointestinal irritation afterexposure to pesticides, especially to rodenticides and insecticides. With lower frequencyfever and dermal irritations are reported. Other symptoms occured in less than 10 % of allsymptomatic patients; higher frequencies of these symptoms are not observed if selectedpesticide groups or subgroups were analysed.
Discussion:The data analysis shows that inquiries to the poison centre on pesticide exposures inchildhood are rare events in Northern Germany. This is different in other parts of theworld, especially in developing countries. Clinical symptoms during or after exposure topesticides seldom occur in these pediatric patients. In most documented cases symptomswere minor. The reason for this is not systematically analysed yet, but obviously the ab-sorbed doses were low in the majority of the cases analysed.
insecticides 1 11 3 7 5 5 2 3 36 3 23 8 11 4 5 2 2 2 2 3 11 85alkyl phosphates 5 2 4 3 1 1 13 1 5 7 5 2 1 1 1 1 1 5 37pyrethroids 1 1 2 2 1 8 1 6 2 1 2 1 1 1 1 3 19chlorinated CH 2 1 1 2 1 2 1 6carbamates 1 2 1 1 1 1 1 1 4others or unknown 3 1 2 2 1 11 10 1 2 1 1 1 1 19
rodenticides 6 2 3 18 4 12 4 4 1 3 2 2 2 32anticoagulants 3 1 1 5 1 3 2 1 1 1 1 2 11phosphides 1 4 1 1 2 1 1 4others or unknown 3 1 1 9 2 8 2 1 1 2 17
repellents 2 2 4 1 1 2 1 1 1 10herbicides 1 3 6 1 7 1 6 3 1 1 3 20fungicides 3 2 3 2 3 1 3 1 1 1 2 2 12molluscicides 2 2 2 3 3 1 1 7wood protection prod. 1 3 3 2 1 1 1 1 2 10total 2 23 5 22 11 13 2 5 74 10 50 17 17 8 10 3 2 2 3 5 2 7 18 176
Table 4 a: Frequency of Symptoms Observed More Than Once After Pesticide Exposures in Children (GIZ-Nord, 1996 - 2000)
All symptoms described may have different causes and are not specific effects leadingconclusively to one xenobiotic. Furthermore, in many cases (including all cases evaluatedas "moderate") the effects reported after exposure are different from effects known fromdescriptions of adult poisoning cases or experimental animal toxicology with the sus-pected substances.For the majority of the cases this may indicate that the symptoms were not caused by theexposure described. For some substances, however, these observations may help torecognise toxic effects of pesticides not described earlier. Compilation of data from othersources, e.g. other poison centres (possible when similar database structures are used),and continuation of data collection in the future may often help to differentiate betweenthese two alternative meanings.

34
References:
1. Annex II to EU council resolution 90/C329/03 (24-11-1995)
2. Hahn A, Wolski M, Noack K, Heinemeyer G, Kayser D (1994) Erfassung der Ver-giftungsfälle und Auswertungen in den Informations- und Behandlungszentren fürVergiftungen in der Bundesrepublik Deutschland. Berlin: Max von Pettenkofer-Institutdes Bundesgesundheitsamtes (MvP-Hefte 5/1994)
3. Persson HE, Sjöberg GK, Haines JA, Pronczuk de Garbino.J (1998) Poisoning Seve-rity Score. Grading of Acute Poisoning. Clin. Toxicol. 36, 205-213
Open Presentation

35
II.3.4. Toxic exposures to pesticides in children under 15 years: a oneyear experience of the north of france poison centre
Open Presentation
Monique Mathieu-Nolf, V. Dherbecourt, O. Aron, D. Peucelle, P. NisseThere is a growing number and availability of pesticides used for agriculture, gardening,household, therapeutics and food. Therefore children may be exposed frequently but fewdata are available to support concerns about pesticides exposures among children in de-veloped countries.
ObjectivesIn order to investigate if pesticides exposures are resulting in health effects in children. Allpesticides toxic exposure cases of children younger than 15 years reported during 2000to both the Toxicovigilance Unit and the Poison Information Unit of the Lille Regional Poi-son Centre were reviewed. All records were evaluated for the following data elements:age, gender, circumstances, type of pesticides described by the IPCS classification ofuse chemical class and medical outcome. The medical outcome severity was scoredusing the Poison Severity Score (P.S.S.) (1) evaluated at the end of follow up.
ResultsIn 2000, out of 14188 cases of toxic exposures of children younger than 15 years repor-ted, 423 (3%) were related to pesticides. Age ranged from 3 months to 13 years with amean age of 2.70 years ± 2.04 years. The distribution by group of age shows (table I) thatthe large majority (89%) were younger than 5 years
Age (years) Number of cases %
< 1 28 7
1 - 4 347 82
5 - 9 40 9
10 - 14 8 2 Table 1: Distribution by group of age
The circumstances were accidental in all cases including home accident (97%), outdoorair pollution (1%), food (1%), accidental misuse (1%). No case related to occupational ac-tivity was reported. The route of exposure was oral (85%), dermal (6%), inhalation (4%),ocular (4%) and nasal (1%).The pesticides involved were classified according to IPCS pesticides classification as :
- pesticides for use against plants in 8%, including herbicides (86%) and algici-des (14%),
- pesticides for use against animals in 89%, including insecticides (58%), roden-ticides (34%), molluscicides (6%) and others (2%),
- pesticides for use against micro-organisms in 3% including, fungicides (99%)and others (1%).
The main chemical classes of substances involved were anti-vitamine K (26%), hydrocar-bons (16%), pyrethroids (17%), glucochloral (15%), organophosphates (12%), carbamate(8%), glyphosate (3%), organochlorined compounds (1%).

36
The severity of health effects resulting of pesticides toxic exposures was : no effect (PSS= 0) in 78%, mild severity (PSS = 1) in 21%, moderate severity (PSS = 2) in 1%. No casewith high severity (PSS = 3) nor death (PSS = 4) was observed and all cases recoveredwithout sequelae. The table II shows the distribution of cases by use class of pesticideand severity and that the most severe cases were related with pesticides against animals(1 insecticide, 2 rodenticides, 1 molluscicide, 1 nematicide).
Table 2: Number of children by use class of pesticides and severity
Pesticides Severity TOTAL
use class PSS = 0
No
PSS = 1
Mild
PSS = 2
Moderate
Pesticides against plants
herbicides
algicides
22
20
2
13
10
3
-
-
-
35
30
5
Pesticides against animals
insecticides
rodenticides
molluscicides
others
300
164
116
19
1
72
55
11
5
1
4
1
2
-
1(nematicide)
376
220
129
24
3
Pesticides against micro-organisms
fungicides
others
9
7
2
3
3
-
-
-
-
12
10
2
Total 331 88 4 423
% 78% 21% 1% 100%
This one year study in a Regional Poison Centre shows that :- young children living in their house are exposed to numerous pesticides use against
plants, animals or micro-organisms by several routes including oral, dermal, inhalati-on,
- the health effects resulting from acute exposure to pesticides among children werenot very frequent (3%),
- the majority of cases were not severe with 21% of mild and 1% of moderate severity,- the frequency of severe case after pesticides toxic exposure is comparable in children
(1%) and adults (0,6%),- the most severe cases in children were related to exposure to pesticide against ani-
mals,- only acute and subacute exposure were reported to the Poison Information Unit or to
the Toxicovigilance Unit and this raises the question of the identification and report of

37
illness among children resulting of chronic exposure to pesticides by health professio-nals.
There is a need of surveillance in order to evaluate the health effects resulting from acute,subacute and chronic exposures to pesticides in children and health care professionalsshould be reminded to consider environmental exposures of children to pesticides.
References:1. Persson HE, Sjöberg GK, Haines JA, Pronczuk de Garbino.J (1998) Poisoning Seve-
rity Score. Grading of Acute Poisoning. Clin. Toxicol. 36, 205-213
Open Presentation
38
II.3.5. A review of the effects of low-level exposure to OP pesticides inchildren
Open Presentation
Joanne Hughes, Alex Capleton, Carol Courage, Simon Short, Len Levy
IntroductionIn 1999 the UK Government made an announcement confirming that the Ministry of Agri-culture, Fisheries and Food, the Health and Safety Executive, and the Department ofHealth (DH) would develop a targeted research programme on organophosphates to takeforward research recommendations from the DH’s Committee on Toxicity and other UKregulatory committees. The main focus of these recommendations was that research toaddress the possibility of long-term adverse neurological or neuropsychiatric health ef-fects following exposure to low doses (doses that do not cause signs or symptoms ofacute toxicity) of organophosphate (OP) pesticides was required. In response, a work-shop was convened to assist in determining the scientific input and approaches requiredto meet identified research needs*. One of the issues arising from the workshop discussi-ons was that possible susceptible groups, including children exposed directly or in thewomb, should be included in future research.Consequently, the MRC Institute for Environment and Health is currently undertaking adetailed critical review of the scientific literature relating to the possible adverse effects offoetal and childhood exposure to low-levels of OPs. The review aims to cover both theeffects of OPs in general and also the specific effects of particular OPs to which the foe-tus and children may be exposed in the UK, and is due to be completed in April 2002.
Health effects in children (and adults) following low-level exposure to OPs in thewomb, or during childhoodThe available evidence for adverse health outcomes (with particular reference to neuroto-xic, developmental, immunotoxic, behavioural and cancer effects) from low-level expo-sure to OPs is being evaluated, with particular attention being given to investigatingwhether there is a class effect. Human findings, because of their paucity, are being sup-plemented by findings from studies on animals and will be interpreted in the light of a re-view of the potential biological mechanisms of OP induced toxicity. Particular attention isbeing given to the specific developmental nature of the foetus and child, and whether thiscould influence the toxicity and/or health end-points. The review will also seek to identifypotential critical windows of susceptibility during which a child or foetus could be particu-larly vulnerable to exposure to OPs.Although it was anticipated that the available data would be limited, it has not been pos-sible to locate any studies that directly address the issue at hand. The latency of healtheffects that develop as a result of long-term, low-level exposures makes them difficult tostudy. Many studies do not have a sufficient follow-up period to allow detection of healtheffects that become apparent only after many years of exposure, or develop many yearsafter a critical period of exposure. In addition, they are often not powerful enough to de-tect subtle changes, such as behavioural effects. The numerous epidemiological studiesthat attempt to addess whether pesticides cause ill-health in humans, including children,have problems, usually confounding or poor exposure assessment and characterisation.Thus they cannot be confidently used in relation to OPs and children for the effects oflow-level exposure.
*Copies of workshop proceedings available at: www.doh.gov.uk/opwkshop.htm

39
It is plausible that the foetus and child might be more susceptible to the effects of OPs, inparticular effects relating to behaviour are most commonly hypothesised. There are expe-rimental animal studies which have found that OPs interact with certain brain proteins in-volved in key stages of brain development, thus there is a potential for development to beaffected. Unfortunately, these studies use doses that cannot be extrapolated to low dosesin humans. It is well established that, following low doses of OPs, the levels of acetylcho-linesterase in young animals recover quicker than adults, and the reverse is true for highdoses. Therefore it is not possible to extrapolate the effects of OPs on brain developmentfrom high doses to lower doses.It is clear from the published literature that OPs have the potential to affect developmentin experimental animals, but that this has not been investigated in humans.
Exposure of the foetus and infants to OPs in the UKAlthough the remit of the project does not include a detailed exposure assessment, expo-sure to OPs, for example via the mother, and through the diet, will be included, in order toput the potential health effects into context. The primary sources of foetal and infant ex-posure to OPs in the UK are potentially pre-natal exposure, dietary exposure, exposurefrom use of products containing OPs in the residential environment, para-occupationalexposure and occasional other environmental exposures (e.g. hospitals, aircraft, etc.).Only one study in the US has looked at pre-natal exposure, and suggests potential foetalexposure to OP metabolites, however, interpretation of the results is difficult. Availableevidence on dietary exposure indicates that drinking water, human milk, infant milk for-mulae and infant foods contain no or very low levels of OPs. Adult foods do contain hig-her levels of OPs, but still at low levels. There are currently no UK data on other sourcesof exposure to OPs. In particular, there is an absence of data on the usage of OP pro-ducts in the residential environment. However, studies in the US and other Europeancountries indicate that younger children, children living in urban or agricultural areas, orthose whose parents are professional pesticide applicators may receive higher exposureto OPs than control groups.AcknowledgementWe gratefully acknowledge the funding of the Department of Health.
The views expressed here are those of the authors.
Open Presentation

40
II.4. Estimation of exposure by modeling and/or measuring
II.4.1. Modeling exposures to pesticides: Approaches and modelingneeds
Open Presentation
Halûk Özkaynak, Valerie Zartarian, Jianping Xue, Ed Furtaw and Marc Rigas
Estimation of exposures of children to pesticides requires careful consideration of sourcesand concentrations of pesticides that may be present in different environmental mediaand in foods and beverages consumed by children, as well as the different routes andpathways of exposures specific to daily activities of children of different ages. In recentyears a number of (aggregate) exposure models has been developed by various resear-chers to account for exposures to a single chemical from different routes and pathways.Cumulative exposure models, dealing with aggregate exposures to more than one chemi-cal are, however, still mostly in the developmental stage. The EPA’s Office of Researchand Development (ORD), National Exposure Research Laboratory (NERL) has develo-ped a probabilistic model (Stochastic Human Exposure and Dose Simulation Model, orSHEDS) that predicts the range and distribution of aggregate personal exposures anddoses within a population as well as the uncertainty in the model estimates. The modelframework is being developed with an initial case study for the pesticide chlorpyrifos andthe population of young children. At the present, the SHEDS model includes the inhala-tion and dietary ingestion routes in addition to dermal contact and non-dietary ingestion.The model can simulate an individual’s exposure up to a year time frame, accounting formultiple pesticide applications in the residential environment, in addition to single dayestimates for different post-application time periods. In addition, a user-friendly interfacehas been developed for the aggregate SHEDS-Pesticides model with both exposure re-searchers and regulators in mind as potential users. Future versions of the SHEDS modelwill include more complete characterization of pesticide dose and metabolite concentra-tions in the body by coupling SHEDS to NERL’s Exposure Related Dose Estimating Mo-del (ERDEM). SHEDS and other aggregate or cumulative pesticide exposure modelsneed rigorous evaluation and independent verification against carefully designed fieldstudies. All of the models suffer from limitations of available input information on criticalexposure factors for infants and young children, especially dermal and non-dietary trans-fer efficiencies or coefficients by activity type, location, surface and contact characteri-stics. In general, models need to demonstrate, by sensitivity analysis, which inputs or pa-rameters are of special concern for future revisions. This information will in turn assist thedesign of future field exposure and biomonitoring studies that will then generate the criti-cal data necessary for refining the existing pesticide exposure models. In order to developmore robust models with more complete input data, repeated or longitudinal pesticideconcentration measurements, time-activity data, and frequency of pesticide usage infor-mation in homes, day care centers and schools are also needed. Finally, the form of mo-del outputs that are most useful to regulatory and scientific agencies and the public alsoneeds to be identified.
Disclaimer: This work has been funded wholly by the United States EnvironmentalProtection Agency. It has been subjected to Agency review and approved for pu-blication.
Open Presentation

41
II.4.2. Requirements for models used for exposure assessment topesticides
Open Presentation
Leah Rosenheck, presented by Curt LunchickThe passage of the Food Quality Protection Act (FQPA) in 1996 focused pesticide riskassessments toward understanding the potential exposure of children to dietary, drinkingwater, and non-dietary residues of pesticides.Initial efforts by the North American agrochemical industry to address these risk assess-ments included the formation of task forces dedicated to developing exposure data tochildren and adults resulting from the use of pesticides in residential settings. The Out-door Residential Exposure Task Force (ORETF), while not formed to specifically addressFQPA, has conducted numerous exposure, user survey, and children's activity studiesspecific to the outdoor uses of pesticides on lawns, gardens, ornamentals, and trees.The Non-dietary Exposure Task Force (NDETF) is conducting exposure studies for theindoor applicator and post-application use of pesticides. The REJV (Residential Expo-sure Joint Venture) is a smaller consortium of industry members whose goal is to gather astatistically representative temporal survey data on consumer pesticide use, both insideand outside the home. These data will identify and provide information regarding all pe-sticide chemicals used in and around the home, including demographic information forthe households involved in the survey, and concurrent use patterns (use of two or moreproducts during toxicologically relevant time periods), which are critical for conductingboth aggregate and cumulative risk assessments. The Farm Family Exposure Study(FFES) is a joint effort by a number of agrochemical companies to determine the expo-sure received by farmers, their spouses, and children through biological monitoring of uri-ne. The FFES effort is complimenting the Agricultural Health Study (AHS) being con-ducted by the U.S. EPA and other federal agencies.Concurrent with the development of exposure and usage data necessary for the as-sessment of children's exposure to pesticides is a joint effort by the US EnvironmentalProtection Agency and Industry to assess potential modeling tools to estimate the aggre-gate and cumulative exposure of adults and children to pesticides. Models that are cur-rently under evaluation in Nortlh Amercia are the SHEDS model developed by EPA's Of-fice of Research and Development, Calendex developed by Novigen Sciences, Inc., CA-RES/RExY developed by Infoscientific.com under contract to the industry, and Lifelinedeveloped by Linea under a cooperative agreement with the US EPA's Office of PesticidePrograms. The effort involves a cooperative exercise by EPA, Industry, and the modeldevelopers aimed at determining how each model handles the relatively robust data col-lected so far by the task forces in each model and understanding the output from eachmodel.Biological monitoring of children's exposures to pesticides is essential to providing a fra-me of reference of actual absorbed dose potential in which to compare the model outputs.Efforts to this end are also underway. The US EPA is conducting research in the area ofchildren’s exposure to environmental contaminants. NERL has initiated a 3-year pilot pro-gram of monitoring preschool children in North Carolina and Ohio. Samples of indoor andoutdoor air, dust, soil, urine, and hand wipes will be collected as will samples of food andbeverage consumed by the children and their care-givers. The Minnesota Children's Pe-sticide Exposure Study has recently released the analysis of urinary metabolite levelsfrom a 102 children sample. In addition, individual agrochemical companies are conduc-ting biological monitoring studies to determine the absorbed dose to specific pesticidesfollowing their use in residences.Based on the efforts to date in North America the following conclusions regarding modelrequirements can be reached:

42
The models require extensive exposure databases to permit probabilistic assessment ofdermal and inhalation exposure.Use information is critical to the models. Such information must include detailed know-ledge of activity patterns and pesticide use patterns including use of the same pesticide atmultiple sites and the use of different pesticides and their temporal relationship.As the major contributions to exposure such as direct contact with treated surfaces orapplication are quantified with robust data that replaced initial exposure assumption theexposure assumptions regarding less significant potential sources of exposure that canalso be difficult to uniquely quantify such as dust, object to mouth contact, or by indirectemissions begin to drive the model's output.The aggregate and cumulative models have become very complex and will require vali-dation against population exposure and absorbed dose monitoring.Emphasis should be given to biological monitoring of children's exposure to develop anunderstanding of the range of exposures children receive.The models developed as reliable predictive tools must be based on a firm understandingof children's actual exposure potential.
Open Presentation

43
II.4.3. Deterministic versus probabilistic estimation of exposure?
Olaf Mosbach-Schulz
Both deterministic and probabilistic exposure modeling start with the identification ofmodel structure and exposure pathways. The model assumptions should be appropriatewith regard to the objectives of the analysis. This means that all input and output vari-ables are compatible among one another, have the appropriate level of aggregation (withrespect to the spatial and temporal scales), a corresponding resolution limit and are con-venient to those models, which are linked to the analysis. Also the theoretical backgroundof the model should be accepted by the community of users. The data should be repre-sentative for the population of interest and of appropriate sample size to estimate a cen-tral tendency and upper quantiles of the distribution. Here is no difference between thesetwo kinds of modeling.Guidelines for probabilistic modeling often include a deterministic approach as first step ofthe analysis. The reason is the simplicity of calculation. It requires less time and effort tostart with a deterministic model. Taking estimates of the central tendency as input valuesgives a vague estimate of the expected exposure, which can be easily understood andcommunicated. “Worst case”-assumptions will turn out an upper value of exposure, whichprotects the human health, when it is below the limits of intervention.
Summing up, it may be said that deterministic modeling is an consistent approach, basedon standard equations and exposure assumptions, which carries on the historical prac-tice.
What are the disadvantages of the deterministic analysis? Also in simple cases the de-terministic approach computes incorrect predictions of the mean and upper quantiles.
Model: N →→→→ exp(N)
Deterministic: Central tendency: 0 →→→→ 1
Probabilistic: Standard-normal distribution N(0,1)with mean: 0
→→→→ Log-normal distributionwith mean: 1.64
Model: U1, U2 →→→→ U1 + U2
Deterministic: Upper 95%-quantiles: 0.95, 0.95 →→→→ 1.90
Probabilistic: Independent uniform distribution on (0,1);with upper 95%-quantiles: 0.95, 0.95
→→→→ Triangular distributionwith 95%-quantile: 1.68
The single point estimator of exposure has no interpretation in terms of the underlyingdistribution of the population. It provides only a little insight into the range of risks anddoesn’t control the part of the population, which is protected by the estimate.
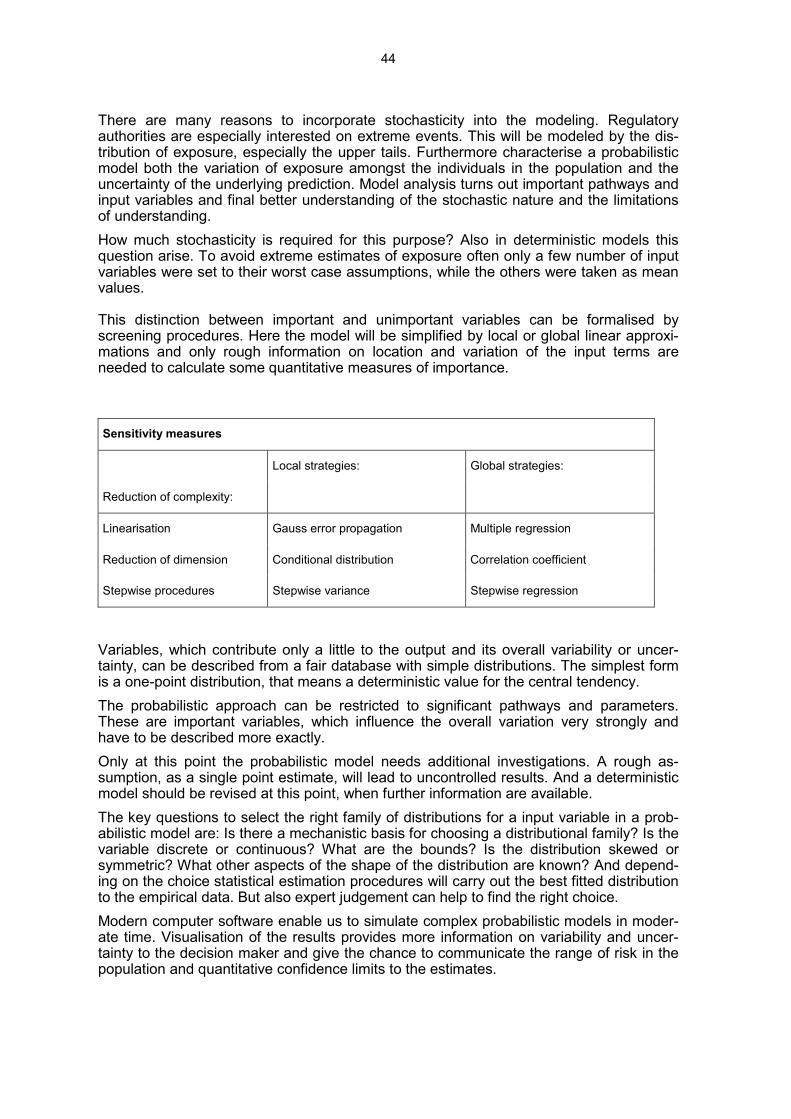
44
There are many reasons to incorporate stochasticity into the modeling. Regulatoryauthorities are especially interested on extreme events. This will be modeled by the dis-tribution of exposure, especially the upper tails. Furthermore characterise a probabilisticmodel both the variation of exposure amongst the individuals in the population and theuncertainty of the underlying prediction. Model analysis turns out important pathways andinput variables and final better understanding of the stochastic nature and the limitationsof understanding.How much stochasticity is required for this purpose? Also in deterministic models thisquestion arise. To avoid extreme estimates of exposure often only a few number of inputvariables were set to their worst case assumptions, while the others were taken as meanvalues.
This distinction between important and unimportant variables can be formalised byscreening procedures. Here the model will be simplified by local or global linear approxi-mations and only rough information on location and variation of the input terms areneeded to calculate some quantitative measures of importance.
Sensitivity measures
Local strategies: Global strategies:
Reduction of complexity:
Linearisation Gauss error propagation Multiple regression
Reduction of dimension Conditional distribution Correlation coefficient
Stepwise procedures Stepwise variance Stepwise regression
Variables, which contribute only a little to the output and its overall variability or uncer-tainty, can be described from a fair database with simple distributions. The simplest formis a one-point distribution, that means a deterministic value for the central tendency.The probabilistic approach can be restricted to significant pathways and parameters.These are important variables, which influence the overall variation very strongly andhave to be described more exactly.Only at this point the probabilistic model needs additional investigations. A rough as-sumption, as a single point estimate, will lead to uncontrolled results. And a deterministicmodel should be revised at this point, when further information are available.The key questions to select the right family of distributions for a input variable in a prob-abilistic model are: Is there a mechanistic basis for choosing a distributional family? Is thevariable discrete or continuous? What are the bounds? Is the distribution skewed orsymmetric? What other aspects of the shape of the distribution are known? And depend-ing on the choice statistical estimation procedures will carry out the best fitted distributionto the empirical data. But also expert judgement can help to find the right choice.Modern computer software enable us to simulate complex probabilistic models in moder-ate time. Visualisation of the results provides more information on variability and uncer-tainty to the decision maker and give the chance to communicate the range of risk in thepopulation and quantitative confidence limits to the estimates.

45
A final sensitivity analysis identifies the drivers of risk and exposure in a quantitative form,like the screening procedure from the start. That leads to subpopulations with high riskand extreme individual exposure scenarios.So the probabilistic risk assessment is an expansion to the deterministic modeling and isnot in contradiction with it. Probabilistic modeling requires further investment of time andresources, especially the extensive use of statistics, but it turns out more information anda better understanding of the exposure scenario. This is the right way to take up thechallenges of complex risk management decisions.
References:1. Burmaster, D.E. & Anderson, P.D. (1994): Principles of Good Practice for the Use of
Monte Carlo Techniques in Human Health and Ecological Risk Assessments. RiskAnalysis 14 (1994) 477-481.
2. Morgan, M.G. & Henrion, M. (1990): Uncertainty: a Guide to Dealing with Uncertaintyin Quantitative Risk and Policy Analysis. University Press, Cambridge.
3. Mosbach-Schulz, O. (1999): Methodische Aspekte probabilistischer Modellierung.UWSF – Z. Umweltchem. Ökotox 11 (1999)
4. Mosbach-Schulz, O. (2000): Darstellung von Sensitivitätsmaßen in ProbabilistischenModellen an Hand der Expositionsmodellierung des QRA-Berichtes VII. UniversitätBremen: Gutachten, 2000.
5. U.S. Environmental Protection Agency (EPA) (1997): Risk Assessment Forum: Gui-ding Principles for Monte Carlo Analysis. Washington: EPA/630/R-97/001, March1997.
6. U.S. Environmental Protection Agency (EPA) (1999): Risk Assessment Guidance forSuperfund: Vol.3 Part A, Process for Conducting Probabilistic Risk Assessment. Wa-shington: Draft, December 1999.

46
II.4.4. Uncertainty and variability of exposure dataOpen Presentation
Odile MekelExposure assessment can involve a broad array of information sources and analysistechniques. Even if actual exposure-related measurements exist, assumptions or deduc-tions will still be required because data are not likely to be available for all aspects of theexposure assessment. Moreover, the available data may be of questionable or unknownquality.In common use, the term "uncertainty" in a exposure estimate can be viewed as com-posed of variability as well as true uncertainty.Variability arises from true heterogeneity across people, places or time. Variability in ex-posure is related to an individual's location, activity, and behavior or preferences at a par-ticular point in time, as well as pollutant emission rates and physical/chemical processesthat affect concentrations in various media (e.g., air, soil, food and water). For example,different children in a population ingest different amounts of tap water each day. Thiswater may contain different concentrations of chemical substances. Thus, variability is afundamental property of the exposed population.Uncertainty represents a lack of knowledge about factors affecting exposure. For exam-ple, although we may not know much about the issue now, we may learn more aboutcertain people's ingestion of home-grown vegetables through suitable measurements orquestionnaires. In contrast, through measurements today, we cannot now eliminate ouruncertainty about the number of children who will play on a playground in a new residen-tial area scheduled for construction in 2015. Thus, uncertainty is a property of the analystperforming the exposure assessment.Uncertainty may be reduced by further measurement or study whereas variability cannotbe reduced by further study.Another reason for differentiating between uncertainty and variability relates to the impli-cation for decision-making. Uncertainty may force decision-makers to judge how probableit is that exposures have been overestimated or underestimated for every member of theexposed population, whereas variability forces them to cope with the certainty that differ-ent individuals are subject to exposures both above and below any of the exposure levelschosen as a reference point (EPA, 1997).At a more fundamental level, three types of variability can be distinguished (Table 1):• Variability over time (Temporal Variability);• Variability across locations (Spatial Variability);• Variability among individuals (Inter-individual Variability).
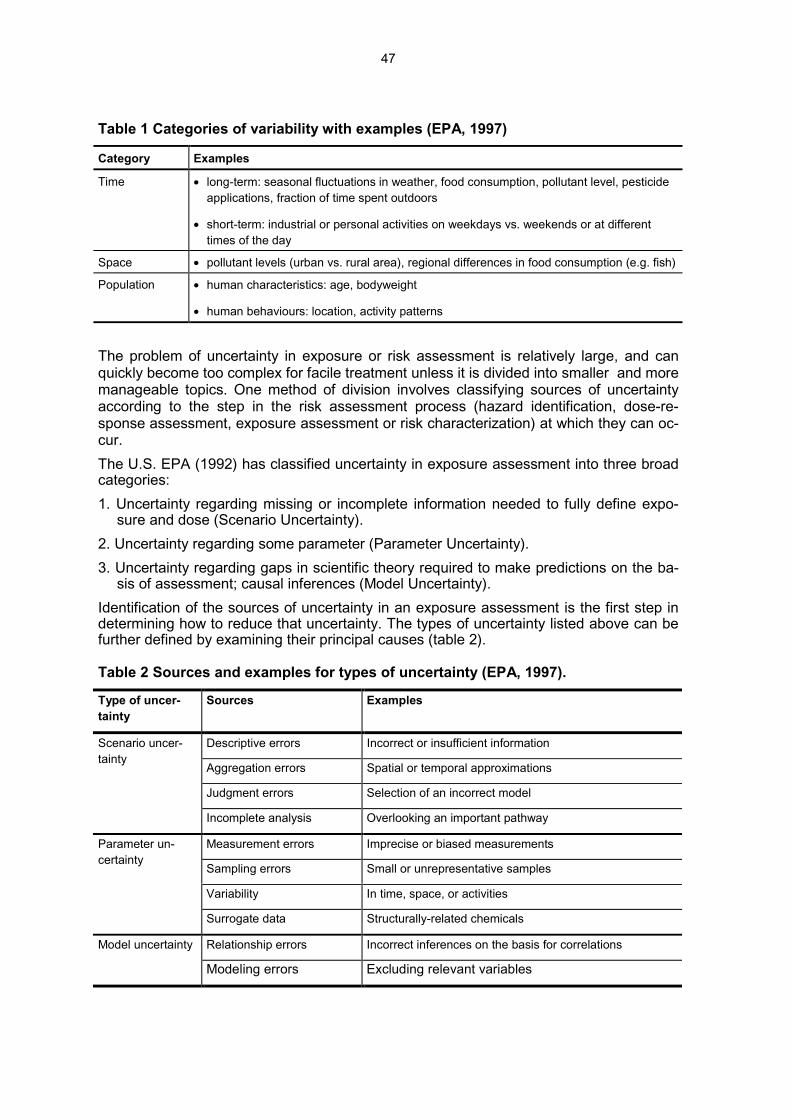
47
Table 1 Categories of variability with examples (EPA, 1997)
Category Examples
Time • long-term: seasonal fluctuations in weather, food consumption, pollutant level, pesticideapplications, fraction of time spent outdoors
• short-term: industrial or personal activities on weekdays vs. weekends or at differenttimes of the day
Space • pollutant levels (urban vs. rural area), regional differences in food consumption (e.g. fish)
Population • human characteristics: age, bodyweight
• human behaviours: location, activity patterns
The problem of uncertainty in exposure or risk assessment is relatively large, and canquickly become too complex for facile treatment unless it is divided into smaller and moremanageable topics. One method of division involves classifying sources of uncertaintyaccording to the step in the risk assessment process (hazard identification, dose-re-sponse assessment, exposure assessment or risk characterization) at which they can oc-cur.The U.S. EPA (1992) has classified uncertainty in exposure assessment into three broadcategories:1. Uncertainty regarding missing or incomplete information needed to fully define expo-
sure and dose (Scenario Uncertainty).2. Uncertainty regarding some parameter (Parameter Uncertainty).3. Uncertainty regarding gaps in scientific theory required to make predictions on the ba-
sis of assessment; causal inferences (Model Uncertainty).Identification of the sources of uncertainty in an exposure assessment is the first step indetermining how to reduce that uncertainty. The types of uncertainty listed above can befurther defined by examining their principal causes (table 2).
Table 2 Sources and examples for types of uncertainty (EPA, 1997).
Type of uncer-tainty
Sources Examples
Descriptive errors Incorrect or insufficient information
Aggregation errors Spatial or temporal approximations
Judgment errors Selection of an incorrect model
Scenario uncer-tainty
Incomplete analysis Overlooking an important pathway
Measurement errors Imprecise or biased measurements
Sampling errors Small or unrepresentative samples
Variability In time, space, or activities
Parameter un-certainty
Surrogate data Structurally-related chemicals
Relationship errors Incorrect inferences on the basis for correlationsModel uncertainty
Modeling errors Excluding relevant variables

48
Traditionally, exposure and risk assessments have been conducted using a point esti-mate approach in the exposure and risk model. In the point estimate approach, a singlevalue is assigned to each variate in the model (e.g., drinking water intake is assumed tobe 2 L/day). The point estimates chosen often represent upper-end values for the variate(worst case approach). The outcomes of a point estimate model are single estimates ofexposure. They are generally near the high-end of the range of estimated exposures andare therefore protective of public health. However, the single point estimate approachprovides only limited information on the variability and uncertainty in the dose or risk es-timates. In probabilistic analysis variability and uncertainty in exposure modeling can betreated quantitative or semi-quantitative and may lead to an increase in information onwhich to base decisions.
Using the example of residential living on a contaminated site, a probabilistic exposureassessment is performed, with variability and uncertainty being modeled separately.Equation 1 is used to model the average daily dose for children due to ingestion of con-taminated soil.
Equation 1
( )( )( )
( )( )kgBW
mg/kgCmg/dIR
dkgng/ADD
BWCIRADD
s
s
s
sss
Weight Body ionConcentrat Soil
Rate Intake Soil Dose Daily Average
===
•=
×=
In the conventional deterministic approach of exposure modeling, we use point estimatesfor each input parameter (IRs, Cs, BW; see Table 3). In the worst-case-approach, we usehighly conservative assumptions e.g. high rate of soil ingestion, upper value for the con-centration in soil and a low bodyweight. Worst-case scenarios are used in order to bevirtually certain that potential exposures and health risks will not be underestimated. Thecalculation leads to a single value estimate of the average daily dose (ADD).
Table 3 Quantification of the input parameters
Pointest im ate
worst- case
Probability DensityFunct ion
Concent rat ionin soil (Cs)(mg/ kg)
6.2Lognorm :
µµµµ= 3 .1σσσσ= 1 .5
Soil I ntakeRate ( IRs)(mg/ d)
100
Cum ul:≤≤≤≤ 1 0 % = 0
5 0 % = 1 69 0 % = 6 79 5 % = 1 1 0
Max.= 1 3 9 1
Body Weight(BW) (kg) 7.9
Tnorm :µµµµ= 1 2 .3 3σσσσ= 1 .9 3
0.00 347.75 695.50 1,043.25 1,391.00
6.54 9.44 12.33 15.23 18.12
0.70 3.29 5.88 8.46 11.05

49
In the probabilistic approach, each input parameter is characterized by a probability den-sity distribution, which characterizes the variability of the input parameter. Using computersimulation, the ADD can be estimated as a distribution, too. In the example, for each mo-del parameter such distributions were taken, making use of the recommendations in lite-rature (Table 3). Using the computer programm @RISK, we calculated the following dis-tribution for the theoretical daily dose for children (Figure 1A).
As soil intake rate by children is an exposure variate which is associated with various un-certainties about the variability, we modeled this uncertainty, making use of distributionsrecommended by different working groups for this exposure variate (Table 4).
Table 4 Modeling uncertainty concerning soil ingestion
Author Dist r ibut ion Dist r ibut ion parameters
Finley et al.1994
Empir ic(cumulat ive)
≤ 10% = 050% = 16
90% = 6795% = 110
Max.= 1391
Lin, 1994 Lognormal µ= 250σ= 130
Stanek &Calabrese,1995a
Empir ic(cumulat ive)
25% = 1050% = 4575% = 88
90% = 18695% = 208
Max.= 7703Stanek &Calabrese,1995b
Lognormal µ= 104σ= 758
If we model these in the same way as before, we obtain the curves for the ADD in Figure1B. From this distributions we can derive specific moments of interest like median or spe-cific percentiles and tabulate them.
Figure 1 Dose estimation accounting for variation (A) and uncertainty (B)
0.0
0.1
0.2
0.3
Pro
babi
lity
0
0.2
0.4
0.6
0.8
1
0 50 100 150
ADD (ng/(kg*d))
Cum
ulat
ive
Pro
babi
lity
point est im ateworst - case= 63
0.0
0.1
0.2
0.3
Pro
babi
lity
0
0.2
0.4
0.6
0.8
1
0 50 100 150
ADD (ng/(kg*d))
Cum
ulat
ive
Pro
babi
lity
point est im ateworst - case = 63
A B

50
Conclusions• In the example, the estimates for the exposure covered a range from 8.9 - 9800
ng/(kg*d)• Uncertainty: For the 4 distributions, the medians of the exposure estimates were si-
milar, but higher percentiles differed strongly, e.g.:97.5 percentile: 77 - 331 ng/(kg*d)99.5 percentile: 120 - 750 ng/(kg*d)
Conventional point estimates do not reveal this important pattern.
• Since the probabilistic approach makes much better use of the information at hand,we hold it to be strongly preferred to traditional "point" estimates.
• Due to the unfamiliar format of result, however, risk communication may (initially) be aharder task.
References:1. AUH (Ausschuß für Umwelthygiene) (1995): Standards zur Expositionsabschätzung.
Behörde für Arbeit, Gesundheit und Soziales (ed.), Hamburg.2. EPA (Environmental Protection Agency) (1992): Guidelines for exposure assessment.
Office of Research and Development, Office of Health and Environmental Assess-ment. EPA/600/2-92/001, Washington, D.C.
3. EPA (Environmental Protection Agency) (1997): Exposure factors handbook. Office ofResearch and Development, National Center for Environmental Assessment.EPA/600/P-95/002Fa, August 1997, Washington, D.C.
4. Finley, B., Proctor, D., Scott, P. et al. (1994): Recommended distributions for exposurefactors frequently used in health risk assessment. Risk Analysis 14: 533-553.
5. Lin, Y. (1994): Simulationsmodell zur Cadmium-Exposition durch Altlasten vor undnach der Sanierung. VDI-Fortschrittberichte Reihe 15: Umwelttechnik Nr. 130. VDIVerlag, Düsseldorf.
6. Mekel, O.C.L., Fehr, R. (2000): Berücksichtigung von Variabilität und Unsicherheit inquantitativen Risikoabschätzungen (QRA). Umweltwissenschaften und Schadstoff-Forschung 12 (1): 42 - 50.
7. Palisade Corporation (1996): @RISK. Risk Analysis and Simulation Add-In for Micro-soft Excel or Lotus 1-2-3. Windows Version. Release March 1996. Newfield, USA.
8. Stanek, E.J., Calabrese, E.J. (1995a): Daily estimates of soil ingestion in children. En-viron. Health Persp. 103 (3): 276 – 285.
9. Stanek, E.J., Calabrese, E.J. (1995b): Soil ingestion rates for use in site evaluationsbased on the best tracer method. Human Ecol. Risk Assess. 1(2): 133 – 156.
Open Presentation

51
II.5. Posters addressing different items
II.5.1. Exposure of children to creosote from wood impregnation onplaygrounds
Andrea Boehncke, Inge MangelsdorfCreosote (coal tar) is a complex mixture of high-boiling compounds which arise during thedistillation of coal. Main constituents of creosote are polycylic aromatic hydrocarbons.Some of these, e.g. benzo[a]pyrene, dibenz[a,h]anthracene are supposed to be carcino-genic. In general, benzo[a]pyrene (BaP) is used as a marker substance for PAH mixtures.According to EU Directive 94/60/EC creosote with a content of 50 – 500 mg BaP/kg maynot be sold to the private consumer but can be used in industrial processes, some natio-nal Directives within the EU are even more restrictive. Creosote is widely used as an im-pregnation agent for wood applied outdoors such as garden fences, tadpoles, railwaysleepers etc. As wooden outdoor playing devices (e.g. sandbox edgings) are also im-pregnated with creosote children may come in contact with it. The following routes of ex-posure are possible: contact with freshly impregnated wood (dermal), exudation of creo-sote components from the wood surface of pressure impregnated wood such as railwaysleepers which were in the past often used as edgings on playgrounds (dermal), leachinginto the surrounding soil (dermal and oral), or contact with contaminated dust or evapora-tion into air (inhalation). Oral uptake of contaminated soil is especially relevant for smallchildren having extensive hand-to-mouth transfer.The dermal, oral and inhalation exposure of playing children to the BaP content of im-pregnated wood was estimated with the following assumptions: regular stay on play-grounds of 3- to 8-year old children, frequency about 100 times/year, exposure time 4 heach, maximum BaP content of creosote 50 mg/kg. From these calculations it can beconcluded that three routes of exposure are most relevant: the dermal exposure to con-taminated sand or soil in the vicinity of the impregnated wood, the dermal exposure fromfreshly impregnated wood and the oral exposure via contaminated soil. For these routesdoses in the order of magnitude of 0.1 to 0.5 ng/kg bw x d were estimated. The inhalationexposure via contaminated dust appears to be lower by a factor of about 10. Inhalation ofevaporated BaP can be neglected as due to the low vapour pressure gaseous BaP is notto be expected in the ambient air. Exudation of manually impregnated wood can be alsoneglected as surface applied creosote weathers completely within one or two years. Thepossible dose from exudation processes is hardly calculable at all as it depends onweather conditions.These estimations contain a number of plausibility considerations concerning personalhabits of playing children. This leads to a highly uncertain risk assessment concerningcarcinogenic effects. The compilation of reliable data on playing habits and anthropomet-ric parameters (e.g. bodyweight, skin surface of children) combined with probabilisticmethods is therefore of special interest also with regard to cumulative risk assessment.

52
II.5.2. Homes with wool carpets, treated with permethrin - Exposure ofadults and children
Edith Berger-Preiß, K. Levsen, Gabriele Leng, H. Idel, U. RanftWool carpets and textile floor coverings with wool yarn are usually treated by pyrethroidinsecticides (mainly permethrin) to protect against damage by moths and creatine-dige-sting beetles.It is known, that permethrin has a low mammalian toxicity. Nevertheless, an increasingnumber of health complaints after indoor use of pyrethoids and in connection with per-methrin-protected wool carpets have been reported by the Federal Institute for ConsumerHealth and Veterinary Medicine (BgVV). Up to the end of 1998 about 348 of such sus-pected cases (39 cases in connection with wool carpets) were recorded.The controversial discussion after indoor exposure to permethrin prompted the BMBF andthe IVA to initiate and sponsor this present study.In order to identify a possible impact of permethrin in wool carpets in homes on their in-habitants, indoor monitoring in 80 homes and biological monitoring of their 145 inhabi-tants (including 31 children < 14 years) were carried out.During a 2-year period, the house dust was collected once and the suspended particlestwice. These samples and carpet fibers were analyzed for permethrin. Where possible,two urine samples (collected over 24 hours, or spontaneous urine from crawling children)were collected during the course of the study from the inhabitants of these homes andanalyzed for three characteristic permethrin metabolites (cis-DCCA, trans-DCCA, 3-PBA).Permethrin was detected in house dust if the wool fibers contained permethrin. Depen-ding on the permethrin level in wool fibers, the permethrin concentrations in house dust(fraction < 2mm) ranged from < 1 to 659 mg/kg.The permethrin concentrations on suspended particles varied in most cases between < 1and 6 ng/m³. No correlation between the permethrin concentration on suspended par-ticles and in house dust was observed.The metabolite concentrations in most urine samples of the studied occupants were be-low the limit of detection, e.g. 0.2 µg/L (percent below limit of detection (mean value firstand second sampling event) cis-DCCA – 93 %, trans-DCCA – 89 %, 3-PBA – 82 %).Themetabolite concentrations of the urine samples varied depending on the metabolite andsampling event. Maximal values were 2.8 µg/L for cis-DCCA, 5.1 µg/L for trans-DCCAand 5.0 µg/L for 3-PBA. In the present study, the 95. percentiles for all metabolites andsampling events were below 1.0 µg/L. Although the level of permethrin metabolites in theurine of the study population was low, the observed metabolite concentrations were sub-stantially higher than expected from inhalational uptake as shown by model calculations.In order to check whether children (especially crawling children) have a higher uptake ofpermethrin ( via oral or dermal uptake of permethrin bound to house dust) the data ofmetabolite concentrations were analyzed with respect to age. Most people were adults,12.8 % (13.2 %) were children 6-14 years old and 9.2 % (5.9 %) <6 years (second sam-pling event in parentheses). The analysis of the data demonstrates that in 23.6 % (10 %)of the adult samples at least one permethrin metabolite was found. In 33.3 % (16.7 %) ofthe samples in children ranging from 6 –14 years and in 30.8 % (12.5 %) of those <6years, a permethrin metabolite was found. However, this difference in positive urine sam-ples between the three groups was not statistically significant (�² test - first event: 0.615;second event: 0.698).This also holds true for the metabolite concentrations in urine, whenthe difference between the arithmetic mean values of the concentrations of cis-DCCA,

53
trans-DCCA and 3-PBA of the three groups was proved by the Kruskal-Wallis test (firstevent: cis-DCCA: p=0.848, trans-DCCA: p=0.652, 3-PBA=0.308; second event: cis-DCCA: p=0.351, trans-DCCA: p=0.382, 3-PBA=0.152).Note, however, that the number ofchildren <6 years was low.The results of the study show that the metabolite concentrations cannot be explained bythe inhalation of suspended particles. As with small children an additional oral and der-mal uptake of permethrin from wool carpets is conceivable, higher concentrations of per-methrin metabolites in the urine of children than in adults may be expected. This couldnot be confirmed by the results of the study.Furthermore, the observed metabolite concentrations were at a similar level to that re-ported on the background concentration of the pyrethroid metabolites of the generalpopulation. Food is discussed as a major source for the background level. Thus, if woolcarpets contribute in any way to the internal burden by pyrethroids, the contribution mustbe lower than the general internal burden originating from other sources.
AcknowledgementsThe study (07INR30 B) was sponsored by the Bundesministerium für Bildung und For-schung (BMBF) and the Industrieverband Agrar (IVA).*Corresponding author: Dr. E. Berger-Preiß, Fraunhofer Institute of Toxicology and Aero-sol Research,Drug Research and Clinical Inhalation, Nikolai-Fuchs-Str.1, D-30625 Han-nover, e-mail:[email protected], phone: +49(0)511-5350-218, fax: +49(0)511-5350-155

54
II.5.3. German environmental survey 1990/92 (GerES II) and 1998 Ge-rES III): PCP in urine of the German population - spatial and tem-poral difference.
Christiane Schulz, Kerstin Becker, Susanne Kaus, Christian Krause, Margarethe Seiwert,Bernd SeifertThe German Environmental Surveys (GerES) are an integral part of an Environment andHealth Surveillance System which includes measuring, analysing and documentingchanges in the environment and in environmental health. The German EnvironmentalSurvey (GerES), which is conducted in cooperation with the German Health Survey, is alarge-scale representative population study which has repeatedly been carried out inGermany. GerES I was conducted in 1985/86 followed by GerES IIa in 1990/91 (West-Germany) and GerES IIb in 1991/92 (East-Germany). In 1998, GerES III was conducted.GerES IV is the first survey for children and teenagers, for which in 2000 a pilot study hasbeen started.The general objectives of the German Environmental Survey (GerES) are: a) to generaterepresentative data on the distribution of environmental pollutant concentrations in bio-logical samples from the German population; b) to establish a database to derive refer-ence values; c) to document spatial and temporal differences in population exposure; d)to get insight into the contribution of different compartments (air, water, food) to the bodyburden; e) to model the relative importance of exposure related determinants; and f) togenerate information to develop strategies for exposure prevention and reduction.In each GerES a cross sectional sample was selected using a two stage random proce-dure (Seifert et al. 2000). The approximate number of participating adults was 2700 in1985/86 (GerES I), 2500 in 1990/91 (GerES IIa), 1700 in 1991/92 (GerES IIb) and 4800in 1998 (GerES III). The study populations were representative for the West- and East-German population with regard to community size, age (25 to 69 years in GerES I – II and18 to 69 years in GerES III) and gender. In GerES IIa and GerES IIb children aged6 to 14 years who lived in the households of the adult subjects, were included.Biomonitoring was carried out using samples of urine, blood, and scalp hair. In addition,samples of house dust, tap water and outdoor dustfall were analysed. Questionnaireswere used to collect information about the characteristics of the household, the subjects’habits etc.In GerES I - III some 3000 samples of morning urine selected randomly were analysed fortheir concentration of PCP and creatinine (1985/86: N = 404 adults, 1990/91:N = 1026 adults and N = 498 children; 1991/92: N = 268 adults and 197 children; 1998:N = 642 adults). PCP was analysed by gas chromatography (GC) after hydrolysis (Hein-rich-Ramm et al. 1995) and creatinine according the Jaffé method.Statistical tests (t-test or variance analysis) were carried out to detect significant differ-ences (p < 0.001) of the geometric means of the subgroups.The mean level of PCP in urine of the adult population aged 25 to 69 years had de-creased from 1.9 µg/g creatinine in 1990/92 (GerES II) to 0.9 µg/g creatinine in 1998(GerES III). In West-Germany, where PCP had already been determined in 1985/86(GerES I) the level of PCP in urine of adults decreased from 3.0 µg/g creatinine in1985/86 to 2.0 µg/g creatinine in 1990/91 and to 0.9 µg/g creatinine in 1998. This is dueto the fact that in 1989 the production, the application as well as the trade and commerceof PCP and products and formulations containing PCP was forbidden (PCP-V 1989). Forchildren studied in GerES II (1990/92) a mean level of 2.9 µg/g creatinine was found. Thecomparison of the PCP content in urine of adults and children showed higher levels for

55
children. This is due to the childrens’ specific exposure-relevant behaviour patterns andtheir specific physiological characteristics. In contrast to the situation for adults in 1990/92and 1998, the mean values for children obtained in GerES II were different in West- andEast-Germany. West-German children had a mean PCP level of 3.2 µg/g creatininewhereas East-German children had one of 2.3 µg/g creatinine. This result is in accor-dance with the fact that in the former GDR wood preservatives containing PCP wererarely used in private homes compared with West-Germany.The results can be interpreted using the Human Biomonitoring (HBM) values set by theHuman Biomonitoring Commission (HBC) of the Federal Environmental Agency (Ewers etal., 1999). HBM values are derived on the basic of toxicological and epidemiologicalstudies and thus are health-related. HBM-I is a value below which a risk of adverse healtheffects in the general population is not to be expected according to current knowledge. Ifa result exceeds the HBM-II value, there is a possibility of an increased risk of adversehealth effects with the need for immediate action to reduce exposure. For concentrationsin the range between HBM-I and HBM-II adverse health effects cannot be excluded withsufficient certainty. If a result falls into that range, it is recommended to verify the analyti-cal results and to check if the high level is due to specific sources which have then to beeliminated. The HBC has defined a HBM-I value of 20 µg/g creatinine and HBM-II valueof 30 µg/g creatinine for PCP in urine of the general population. Comparing the concen-trations of PCP in urine as obtained in GerES II with the HBM values, it appears that0.3 % of both children and adults had a PCP level in urine in the range between HBM-Iand HBM-II and 0.2 % of both children and adults had a PCP level in urine higher thanHBM-II. In 1998 (GerES III) the HBM-I value was not exceeded by any participant.
References:1. Heinrich-Ramm R, Wieken C, Laudehr H, and Szadkowski D. (1995): Pentachlorphe-
nol in Körperflüssigkeiten - Entwicklung eines nachweisstarken Analyseverfahrens zurErstellung von Normwerten. In: Schiele R, Beyer B, and Petrovitch A: Arbeitsmedizi-nisches Kolloquium der gewerblichen Berufsgenossenschaften Wiesbaden, Germany,159-161.
2. Ewers U, Krause C, and Wilhelm M (1999): Reference values and human biologicalmonitoring values for environmental toxins. Int. Arch. Occup. Environ. Health 72:255-260.
3. PCP-V - Pentachlorphenolverbotsverordung (1989) BGBl. I (Bundesgesetzblatt):2235-2236.
4. Seifert B, Becker K, Krause C, and Schulz C. (2000): The German EnvironmentalSurvey 1990/92 (GerES II): A representative population study. J. Expos. Anal. Envi-ron. Epidemiol. 10(2):103-114.
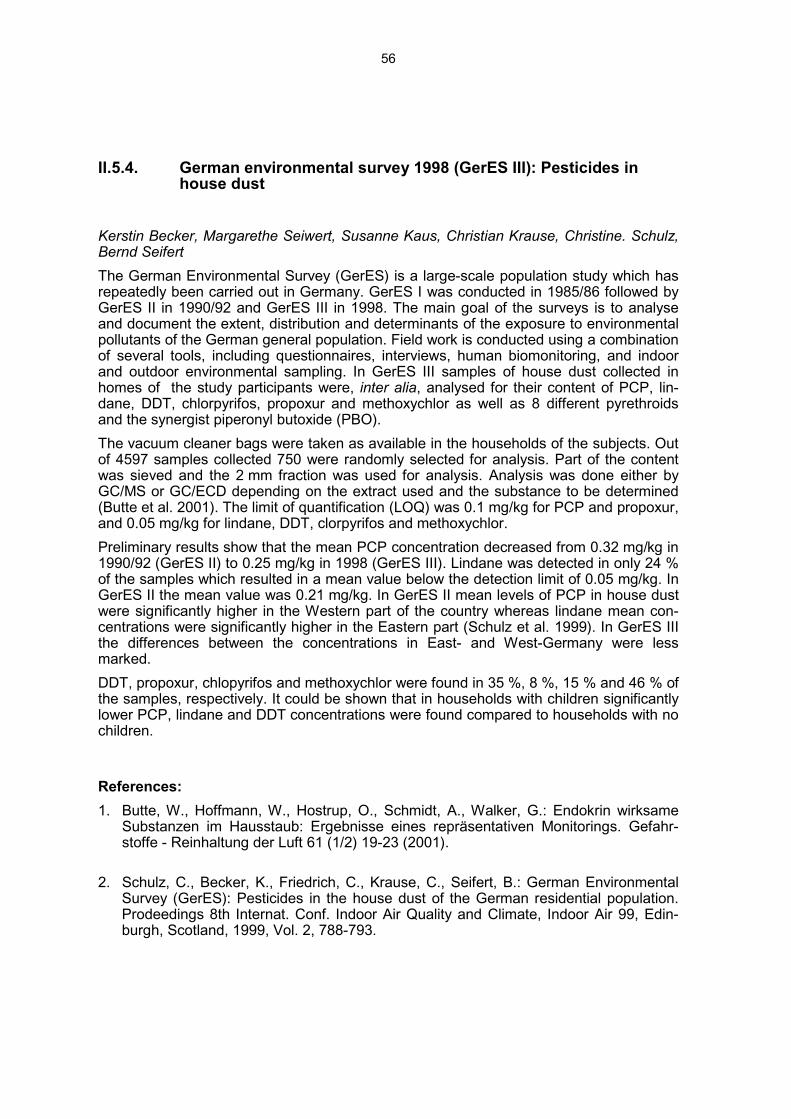
56
II.5.4. German environmental survey 1998 (GerES III): Pesticides inhouse dust
Kerstin Becker, Margarethe Seiwert, Susanne Kaus, Christian Krause, Christine. Schulz,Bernd SeifertThe German Environmental Survey (GerES) is a large-scale population study which hasrepeatedly been carried out in Germany. GerES I was conducted in 1985/86 followed byGerES II in 1990/92 and GerES III in 1998. The main goal of the surveys is to analyseand document the extent, distribution and determinants of the exposure to environmentalpollutants of the German general population. Field work is conducted using a combinationof several tools, including questionnaires, interviews, human biomonitoring, and indoorand outdoor environmental sampling. In GerES III samples of house dust collected inhomes of the study participants were, inter alia, analysed for their content of PCP, lin-dane, DDT, chlorpyrifos, propoxur and methoxychlor as well as 8 different pyrethroidsand the synergist piperonyl butoxide (PBO).The vacuum cleaner bags were taken as available in the households of the subjects. Outof 4597 samples collected 750 were randomly selected for analysis. Part of the contentwas sieved and the 2 mm fraction was used for analysis. Analysis was done either byGC/MS or GC/ECD depending on the extract used and the substance to be determined(Butte et al. 2001). The limit of quantification (LOQ) was 0.1 mg/kg for PCP and propoxur,and 0.05 mg/kg for lindane, DDT, clorpyrifos and methoxychlor.Preliminary results show that the mean PCP concentration decreased from 0.32 mg/kg in1990/92 (GerES II) to 0.25 mg/kg in 1998 (GerES III). Lindane was detected in only 24 %of the samples which resulted in a mean value below the detection limit of 0.05 mg/kg. InGerES II the mean value was 0.21 mg/kg. In GerES II mean levels of PCP in house dustwere significantly higher in the Western part of the country whereas lindane mean con-centrations were significantly higher in the Eastern part (Schulz et al. 1999). In GerES IIIthe differences between the concentrations in East- and West-Germany were lessmarked.DDT, propoxur, chlopyrifos and methoxychlor were found in 35 %, 8 %, 15 % and 46 % ofthe samples, respectively. It could be shown that in households with children significantlylower PCP, lindane and DDT concentrations were found compared to households with nochildren.
References:1. Butte, W., Hoffmann, W., Hostrup, O., Schmidt, A., Walker, G.: Endokrin wirksame
Substanzen im Hausstaub: Ergebnisse eines repräsentativen Monitorings. Gefahr-stoffe - Reinhaltung der Luft 61 (1/2) 19-23 (2001).
2. Schulz, C., Becker, K., Friedrich, C., Krause, C., Seifert, B.: German EnvironmentalSurvey (GerES): Pesticides in the house dust of the German residential population.Prodeedings 8th Internat. Conf. Indoor Air Quality and Climate, Indoor Air 99, Edin-burgh, Scotland, 1999, Vol. 2, 788-793.

57
II.5.5. Biocide emissions from indoor wall paints
Wolfgang Horn, Elke Roßkamp, Dieter Ullrich, Bernd SeifertMany investigations have dealt with the emission of VOC from wall paints. While the VOCcontent of water-based paints has decreased over the years biocides have been added toprevent fungal growth during storage and transportation. Today, formaldehyde and amixture of 5-chloro-2-methyl-4-isothiazolin-3-one (CIT) and 2-methyl-4-isothiazolin-3-one(MIT) are typical preserving agents. The isothiazolinone compounds have high allergenicpotential.The MIT/CIT emission behaviour of 24 wall paints was studied under laboratory condi-tions. Sampling on TENAX TA followed by thermal desorption, gas chromatographicseparation, and mass spectrometric detection (SIM mode) was used to determine theCIT/MIT concentrations. Area specific emission rates of MIT and CIT obtained in thechamber experiments were between 100 and 600 µg/m²h after 24 hours, and between 6and 4 µg/m²h after 28 days, respectively. Additionally air concentrations in some roomswere determined after application. Two paints were applied to the walls of two test rooms.Concentrations of 25 and 85 µg/m³ after 1 day, and of < 0.12 (ld = limit of detection) and15 µg/m³ after 1 week, and of < 0.12 (ld) and 2.5 µg/m³ after 4 weeks were obtained forMIT and CIT, respectively. Figure 1 gives an example of the influence of RH on theconcentration of CIT in one test room. When, after four months, RH was increased toabout 65% for 7 days the concentration of CIT increased from 1 µg/m³ to 7 µg/m³. Theresults show that biocides added to water-based paints for prevention of fungal growthduring storage and transportation emit into indoor air and generate concentrations about50 µg/m³ after 1 day and about 3 µg/m³ 4 weeks after application. These 3 µg/m³ con-centration were used for the calculation of uptake per day for children and adults.With ages of 1, 5,10 and 30 years values of 1, 0.8, 0.7 and 0.5 µg/d kg BW resulted (Ta-ble 1).
Table 1: Estimated exposure to CIT up to 3 months after painting, calculated with aconcentration of 3 µg/m³, in different age groups.
Age 1 5 10 30
Body weight * [kg] 9.1 18.7 33 75
Ventilation rate** [m³/d] 3.1 4.9 7.2 12.3
Biocide exposure [µg/d)] 9.2 14.8 14.9 36.8
[µg/kg d]*** 1.0 0.8 0.7 0.5

58
Figure 1: Concentration of CIT in a test room over 350 days (paint No. 9). Influenceof change in relative humidity.
* Arbeitsgemeinschaft der Leitenden Medizinalbeamtinnen und –beamten der Länder:„Standards zur Expositonsabschätzung“ Behörde für Arbeit Gesundheit und Soziales(BAGS) Hamburg 1995
** Ventilation rate according to US EPA (1988) [Formel: ln MV = -0,70048 + 0,65865 lnBW (MV = ventilation in l/min, BW = Body weight in kg)]
*** Based on a resorption rate of 100%
References:1. Horn, W.; Roßkamp, E.; Ullrich, D. und Seifert, B. 2000: Biocide emissions from
indoor wall paints. Proceedings of Healthy Buildings 2000, Espoo, Finnland, Aug 6-10, Vol. 4, S. 397-402.
2. Roßkamp, E.; Horn, W.; Ullrich, D. und Seifert, B. 2001: Biozidemissionen aus Dis-persionsfarben. Teil 1: Emission von Isothiazolinonen. Gefahrstoffe – Reinhaltung derLuft, 61, S. 41-47.

59
II.5.6. Areas of high agricultural pesticide use in California: How manychildren live there?
Martha Harnly, R. Gunier, P. Reynolds, J. Von Behren and A. Hertz
ABSTRACTNationwide, 22% of pesticide use is applied in California. A public use database main-tained by the California Dept of Pesticide Regulation allows pesticide use applied to fieldsin California to be mapped to a resolution of one square mile and allows potentially expo-sed populations to be identified. We overlaid this use information for several classes ofpesticides, including potential carcinogens, potential reproductive agents, and organo-phosphates for the years 1991-1994 with 1990 U.S. census block information.Many (61%) of census blocks had no agricultural pesticide use. “High” pesticide usecensus blocks groups were defined as block groups where pesticide use was greaterthan 1,000 pounds of pesticides per square mile of census block. For potential carcino-gens, 2.6% of census blocks with a population of 92,829 children had high pesticide use.For organophosphates, 0.4% of California census blocks with a population of 33,710children had high pesticide use. Environmental and biological monitoring data is limitedand is needed in these areas to determine exposures.
METHODS & RESULTSAgricultural Pesticide Use Reporting: Since 1990, all agricultural applications of pesti-cides in California are reported to the County Agricultural Commissioner which then re-ports the data to the CDPR who maintains the California Pesticide Use (PUR) database.The PUR database provides the active ingredient, quantity applied, acres treated, croptreated, date and location of application. There are over 850 pesticide active ingredients,referred to here as pesticides, applied agriculturally in California each year. Inert ingre-dients, which may also be toxic, are not reported. Table 1 displays the PUR pesticidesclassified into toxicological and chemical groups.PUR Mapping by PLSS Section: The locations of pesticide applications are reportedusing an identifier that represents a section within the Public Land Survey System(PLSS), a nationwide grid of approximately one square mile units termed sections. Weused the 1991 – 1994 PUR data to coincide with the time period of the census. We dele-ted from further analysis applications with reported invalid PLSS section identifiers. Thesmall percentage of errors (less than 1% of applications) in the quantity of pesticideapplied were corrected. Map 1 illustrates the distribution of OP use in California by PLSSsection.Mapping by census block group We used a GIS to overlay the PLSS sections of thePUR with the 1990 US census block groups. For each block group, pesticide use density(pounds per square mile of the census block group) was calculated by averaging the pe-sticide use in all of the block group’s PLSS sections. Map 2 is an example of this map-ping in Fresno, California, an urban area with surrounding agricultural. In such areas, ru-ral block groups tend to have the highest pesticide use density and smaller urban blockgroups the lowest.Map 3 illustrates the use of probable carcinogens by census block group. In agriculturalrural areas, where census block groups are geographically large, census block groupmapping (Map 3) is less geographically specific than mapping by PLSS section (Map 1).The distribution of higher use areas for both California maps corresponds with the hea-viest agricultural counties in the state based on farm revenues.(6)

60
Table 1. Pesticides with reported use in California from 1991 to 1994 in toxi-cological and chemical groups
Toxicological Groups
Probable carcinogens (Class B2)a: alachlor, cacodylic acid, captan, chlordane, chlorothalonil, daminozi-de, 1,3-dichloropropene, iprodione, lindane, mancozeb, maneb, metam sodium, orthophenylphenol,oxythioquinox, propargite, propoxur, pentachlorophenol, propyzamide and vinclozolin.
Possible carcinogens (Class C)b: acephate, acrolein, amitraz, atrazine, benomyl, bifenthrin, bromacil,bromoxynil, carbaryl, chlorthal-dimethyl, cyanazine, cypermethrin, dichlobenil, dichlorvos, dicloflop-methyl,dicofol, dimethoate, ethalfluralin, fosetyl-al, hydrogen cyanamide, imazalil, linuron, methidathion, meto-lachlor, molinate, norflurazon, oryzalin, oxadiazon, oxyfluorfen, pendimethalin, permethrin, phosmet, phos-phamidon, piperonyl butoxide, simazine, triadimefon and trifluralin.
Genotoxic compoundsc: 2,4-diethylamine, acephate, alachlor, aldicarb, atrazine, benomyl, captan, carba-ryl, carbofuran, chlordane, chloropicrin, chlorothalonil, chlorpyrifos, diazinon, 1,3-dichloropropene, diquatdibromide, malathion, metam sodium, methyl bromide, methyl parathion, mevinphos, orthophenylphenol,oxydemeton methyl, paraquat dichloride, pentachlorophenol, trifluralin and ziram.
Developmental or reproductive toxicantsd: 2,4-diethylamine, benomyl, bromoxynil, carbofuran, cyanazi-ne, diazinon, diquat dibromide, s-ethyl dipropylthiocarbamate (EPTC), mancozeb, maneb, metam sodium,methyl bromide, methyl parathion, oxyfluorfen, propargite, s,s,s-tributyl, triadimefon and vinclozolin.
Chemical Groups
Organochloridese: dicofol, endosulfan and lindane.
Organophosphatese: acephate, azinphos-methyl, chlorpyrifos, diazinon, dimethoate, disulfoton, ethoprop,fonofos, malathion, methamidophos, methidathion, methyl parathion, mevinphos, naled, oxydemeton-methyl, parathion, phorate, phosmet and profenofos.
Carbamatese: aldicarb, benomyl, carbaryl, carbofuran, frometanate, methomyl, pebulate and propoxur.
Dithiocarbamatese: mancozeb, maneb, metam sodium, thiram, zineb and ziram.
a. Probable human carcinogens with sufficient evidence in laboratory animals and inadequate or noevidence in humans from US EPA.(1)
b. Possible human carcinogens with limited evidence in laboratory animals from US EPA (1)
c. Positive in two or more laboratory assays from Gold and Zeiger (2) and US EPA.(3)
d. Positive in one or more developmental or reproductive studies in laboratory animals from CDPR.(4)
e. Chemical groups were identified from Meister.(5)
Population estimates: We used 1990 census data to obtain the number of children un-der 15 years of age in block groups with “high” pesticide use densities. We defined “highuse” as above 1000 pounds/square mile of census block group. By toxicological class,developmental and reproductive toxicants had the greatest number of children living inhigh use areas, with 417,000 children. For Class B (probable) and Class C (possible)carcinogens combined, this number was more than 3 fold less, around 135,000 children.By chemical class, dithiocarbamates had the greatest number of children living in highuse census blocks. The variation in the number of children living in these block groupsdemonstrates that there were different populations potentially exposed for each pesticidegroup.

61
Table 2. 1991 - 1994 Annual average pesticide use density and 1990 populationof children under 15 in California census block groupsa
PesticideGroup
Median(lbs/mi2)
Maximum(lbs/mi2)
Block Groups(>1,000lbs/mi2)
Children (<15)(>1,000lbs/mi2)
Class B Carcinogens 31 14,395 258 92,829
Class C Carcinogens 23 5,043 122 42,389
Developmental/Reproductive Toxicants 45 48,784 1,099 381,773
Genotoxic Compounds 48 70,670 1,214 417,470
Organochlorines 9 589 0 0
Organophosphates 18 7,129 91 33,710
Carbamates 14 1,706 9 2,912
Dithiocarbamates 30 14,931 241 85,015
a. Total number of block groups used in this analysis was 21,443.
DISCUSSIONIn California, there was a wide range of pesticide use density by area (Maps 1 and 3) andby pesticide class (Table 2). The relationship between agricultural pesticide use, perso-nal exposure and health effects has not been well defined. The limited environmentaldata available suggest that residents may be exposed to pesticides applied agriculturallythrough air, household dust and ground water.(7-15) Children living in agricultural commu-nities could also be exposed to pesticides from playing in treated fields and eating produ-ce directly from fields. We consider pesticide use density an indicator for all of these po-tential exposures.The PUR system has limitations. Although pesticide reporting is legally mandated, underreporting has not been evaluated. The type and amount of inert ingredients applied, andresidential use are not included. Structural fumigations and landscaping uses on golfcourses and along highways are only included at the county level. Nevertheless, thePUR system is probably the most comprehensive pesticide use database in the world.Our findings suggest that the hundreds of thousands of children living in high agriculturalpesticide use areas have a higher potential for exposure than their more urban counter-parts. Biological monitoring of pesticide levels in children indicates an inverse relations-hip with distance from treated orchards.(13, 17) Further environmental and biological mo-nitoring is needed to determine the relationship between agricultural pesticide use andindividual exposure. Our findings suggest geographical (Maps 1 and 3) and pesticidegroup (Table 2) priorities.This evaluation suggests that the prevalence and geographic extent of agricultural pesti-cide use for the compounds of interest are appropriate to assign neighborhood exposureattributes for an epidemiologic study of childhood cancer. These exposure methods canbe used, with some minor modifications, in other cancer studies conducted at the blockgroup level in California or other states if pesticide use reporting systems are developed.

62
References:1. United States Environmental Protection Agency. Office of Pesticide Programs, Refe-
rence Dose Tracking Report. 1997.2. Gold, Lois S.; Zeiger, Errol. Handbook of Carcinogenic Potency and Genotoxicity
Databases. New York, NY: CRC Press; 1997.3. United States Environmental Protection Agency. Genetic Activity Profile, 1997.4. California Department of Pesticide Regulation. Summaries of Toxicology Da-
ta,Medical, Toxicology Branch, Sacramento, CA, 1997.5. Meister, Richard T. Farm Chemicals Handbook. Willoughby, Ohio: Meister Publishing
Company; 1992.6. //www.nass.usda.gov/census/census92.7. Majewski, Michael S.; Capel, Paul D. Pesticides in the Atmosphere. U.S. Geological
Survey; Sacramento, CA, 1995. Report No.: 94-506.8. Baker LW, Fitzell DL, Seiber JN, Parker TR, Shibamoto T, Poore MW, Longley KE,
Tomlin RP, Propper R, Duncan DW. Ambient Concentrations of Pesticides in Califor-nia. Environmental Science and Technology 1996;30:1365-8.
9. Hawthorne SB, Miller DJ, Louie PK, Butler RD, Mayer GG. Atmospheric Pollutantsand Trace Gases. Journal of Environmental Quality 1996;25:594-600.
10. Cohen Hubal EA, Sheldon LS, Burke JM, McCurdy TR, Berry MR. Children's Exposu-re Assessment: A review of Factors Influencing Children's Exposure, and the DataAvailable to Characterize That Exposure. Environmental Health Perspectives2000;108(6):475-86.
11. Zartarian VG, Ozkaynak H, Burke JM, Zufall MJ, Rigas ML, Furtaw EJ. A ModelingFramework for Estimating Children's Residential Exposure and Dose to ChlorpyrifosVia Dermal Residue Contact and Nondietary Ingestion. Environmental Health Per-spectives 2000;108(6):505-14.
12. Quakenboss JJ, Pellizzari ED, Shubat P, Whitmore RW, Adgate JL, Thomas KW. De-sign strategy for assessing multi-pathway exposure for children: the Minnesota Child-ren's Pesticide Exposure Study. Journal of Exposure Analysis and EnvironmentalEpidemiology 2000;10:145-58.
13. Simcox NJ, Fenske RA, Wolz SA, Lee I-C, Kalman DA. Pesticides in Household Dustand Soil: Exposure Pathways for Children of Agricultural Families. EnvironmentalHealth Perspectives 1995;103(12):1126-34.
14. Bradman MA, Harnly ME, Draper W, Seidel S, Teran S, Wakeham D, Neutra R. Pe-sticide Exposures to Children from California's Central Valley: Results of a Pilot Stu-dy. Journal of Exposure Analysis and Environmental Epidemiology 1997;7(2):217-34.
15. Spurlock F, Burrow K, Dubrovsky N. Chlorofluorocarbon Dating of Herbicide-Containing Well Waters in Fresno and Tulare Counties, California. Journal of Envi-ronmental Quality 2000;29:474-83.
16. Loewenherz C, Fenske RA, Simcox NJ, Bellamy G, Kalman D. Biological Monitoringof Organophosphorus Pesticide Exposure among Children of Agricultural Workers inCentral Washington State. Environmental Health Perspectives 1997;105(12):1344-53.
17. Fenske RA, Kissel JC, Lu C, Kalman DA, Simcox NJ. Biologically Based PesticideDose Estimates for Children in an Agricultural Community. Environmental Health Per-spectives 2000;108(6):515-20.

63
II.5.7. Documentation of pesticide use in the European Union
Lars NeumeisterWithin the European Union a uniform pesticide use reporting system, which delivers in-formation on type and amount of pesticides used by commodity/crop, data and locationdoes not exist. Most Member States collect sales data of agricultural pesticides, somemaintain pesticide use surveys and in some Member States agricultural pesticide userhave to keep records of their applications. The United Kingdom is the only country with alimited pesticide use reporting system, any aerial application has to be reported in detail.Information on non-agricultural use of pesticides is not available in the EU.In the future a uniform pesticide use reporting system should be established. Any user ofa pesticide for commercial purposes should report his/her use. Minimum reporting re-quirements should be: date of application, amount product used, product information, lo-cation by street address and/or postal code, treated area, treated commodity/crop.In order to establish and implement pesticide use reporting systems in the EU several ac-tions are necessary. Firstly, legal frameworks are needed, secondly a central product la-bel database for pesticide and biocide products needs to be built. Data harmonisationamong the Member States is essential to make an efficient pesticide use reporting sys-tem work.

64
II.5.8. The German Food Monitoring: Models for exposure assessmentof undesirable substances in food
Bettina Schmidt-FaberThe German Food Monitoring is an independent activity within the framework of the of-ficial food control since 1995. It provides informative data for a representative descriptionof the occurence of undesirable substances in food and is based on a system of repeatedmeasurements and evaluations of levels of pesticides, heavy metals and other contami-nants in and on food.Yearly about 20 different foodstuffs (of animal and plant origin) of a defined food basketare analysed for about 140 different contaminants in plant food and for about 40 differentcontaminants in food of animal origin (with approx. 230 samples per foodstuff). The foodbasket comprises about 100 different food items and reflects German food intake
• for mainly consumed foods,• for foods consumed in great amounts and• for foods with potentially high amounts of undesirable substances (1).
Aims of Food Monitoring:• collection of representative data on the presence of undesirable substances in
food early recognition of potential health risks from these substances• investigation of temporal trends and regional factors• estimation of consumer exposure as part of risk characterization and risk ma-
nagement
The chronic dietary intake was estimated by using monitoring data from 1995-99. Theconsumption figures and bodyweights are based on the German National ConsumptionSurvey from 1988-90.Exposure assessment was done for different population subgroups: children, adults,eaters (average daily/weekly intake) and high consumers (95. percentile of intake). Thechronic intake of a contaminant was calculated by multiplying the contaminants meanconcentration (2) in the specific foodstuff with its consumption (point estimation). To as-sess the health risk to the consumer, the actual dietary intake was compared with the to-xicologically acceptable or tolerable level (ADI, the acceptable daily intake or PTWI, theprovisional tolerable weekly intake).Exemplary the results of three contaminants are presented: of the ubiquitous occurringenvironmental contaminant cadmium (n=15239, 64,6% quantified values), nitrate, ubi-quitous in plants (n=5488, 87,2% quantified values) and of the fungicide procymidon(n=11135, 6,7% quantified values).Since for pesticides often only in a few number of samples quantified values (often in lessthan 10% of all samples analyzed) are available, exemplary for procymidon, the modelsfor exposure assessment were calculated in three different ways: A) with all values (in-cluding > 90% of zeros); B) with quantified (7%) plus non-quantifiable values (2,8%), as-signed the value of 0,5 x the limit of determination and C) for quantified values only (7%of all samples).

65
Table1 shows the calculated percentages of ADI/ PTWI for average consumptional ha-bits, table 2 shows some selected results for high consumers and „eaters“, in this caseyounger male children.
Table 1: Percentages of ADI / PTWI (average consumptional habits)nitrate cadmium procymidon
ADI PTWI ADI
bodyweight 3,65 mg 7 mg/kg 0,1 mg/kg
n (kg) NO3-/kg bw bw bw
girl (4-10 yrs) 972 25,6 27,2 % 19,3% 0,04% (model A)
0,303% (model B)
0,201 % (Model C)
boy (4-10 yrs) 1011 26,7 25,6% 20,2% 0,04% (model A)
0,299% (model B)
0,291% (model C)
Women 10314 63,9 18,7% 10,4% 0,03% (model A)
0,172% (model B)
0,184% (model C)
Men 8934 77,8 16,3% 10,8% 0,02% (model A)
0,128% (model B)
0,131% (model C)
Table 2: Percentage of ADI / PTWI (high consumers and eaters: boys, 4-10 yrs)nitrate cadmium Procymidon
Potatoes high (159g/d) 21,1% 10,2% -
Lettuce high (18,5 g/d) 32,1% 1,6% 0,6%
Wheat high (130 g/d) - 19,4% 1,0%
spinach frozen high (8,3 g/d) 7,1% 2,3% 0,05%
eater (20,3 g/d) 17,4% 5,5% 0,12%
paprika high (18,6 g/d) 1,2% 0,5% 1,1%
Strawberries high (22,9 g/d) - 0,5% 5%
grapes white high (14,3 g/d) - - 15,7%
Pear high (29,2 g/d) - 0,6% 3,8%
liver (turkey) eater (10,5 g/d) - 3,4% -

66
Figure 1: Contribution of food-stuffs to nitrate intake, boys
Results:
• Generally the results of monitoring show a low contaminantion of foodstuffs with un-desirable substances, more than half of all analyzed samples were free of residues,only a small number of samples (<5%) exceeded guide values
• Exposure assessments show the highest utilization of ADI/PTWI for nitrate with about30% for young girls (table 1), the comparison of the three scenarios for procymidonshow differences on an 10 times scale, altogether utilization of ADI lies far below 1%
• Regarding single foodstuffs, even high consumers and eaters do not reach 50% ofthe ADI/PTWI (table 2)
• The number of foodstuffs with significant contribution to the intake of undesirable sub-stances varies considerably (figures 1 to 3)

67
Figure 2: Contribution of food-stuffs to procymidon intake, boys
Figure 3: Contribution of food-stuffs to cadmium intake, boys
General conclusion:
Although a limited number of foodstuffs were included into the models a reasonableconclusion would be that no chronic health risks could be associated with the contami-nants considered.
References1. Schroeter et al: Warenkorb für das Lebensmittel-Monitoring in der Bundesrepublik
Deutschland, Bundesgesundheitsbl 1999. 42:77-842. WHO/FSF/FOS/97.7 Guidelines for predicting dietary intake of pesticide residues,
WHO 1997

68
II.5.9. Evaluation of symptoms from acute and chronic exposures oforganophosphates and pyrethroids
Helga Michalak, Katrin Begemann, Gerhard Heinemeyer, Axel Hahn, Ursula Gundert-Remy
Introduction:Pyrethroids (PY) and organophosphates (OP) are frequently used in pesticide-products.Their toxic risks are discussed widely, in particular under the aspect of low and chronicexposure.Symptomatology of 474 cases of exposures to OP and PY containing pesticides reportedto the BgVV according to chemical law have been evaluated in order to differentiate bet-ween possible acute and chronic effects.
Methods:The analysis included 132 cases of exposure to OP and 206 cases of exposure to PYcontaining pesticides as well as 136 cases with combinations of OP, PY and other com-pounds (COMB). Symptoms and signs were examined and attributed to acute and chro-nic exposure. The reported symptoms were encoded according to a modified WHO-Thesaurus and a comparison of pattern of health impairment was analysed in acute ex-posure to OP and PY, in acute and chronic exposure to PY and in chronic exposure to PYand combinations.
Results:Most of the 132 cases of exposure to OP were suicides (33 %), and accidents (47 %). InPY and in COMB exposures, common use was most frequent (85 and 81 %, resp.).The suicide rate was low in PY and COMB exposures (1,5 and 4 %, resp.). On the otherhand, rate of „common use“ was low in OP exposures (8 %).In cases with exposures to OP, 16 deaths (= 3,3 % of cases) were reported, and 2 deaths(= 0,4 % of cases) after PY exposure. One case of lethal outcome was reported after ex-posure with a combination product.In 15 cases no symptoms were observed, 277 showed symptoms of minor severity; 103patients had moderate symptoms. The most severe symtomes have been observed in theOP group.
Symptomatology:
1. Comparison of symptoms after acute exposure to OP and PY (Fig. 1)In cases of acute OP exposure, the analysis revealed that most of the symptoms that we-re observed could be attributed with typical patterns of OP-poisoning (χ2 − Test, p<0,05):gastrointestinal disturbance; miosis; respiratory insufficiency; coma, convulsion, depres-sion of consciousness; reduced Cholinesterase; cardiac shock, circulatory disturbance;fasciculations, myoclonia, tremor; bronchialsecretion excessive, hypersalivation; psychicdisturbance.In cases with acute exposure to PY headache, weakness, tiredness, disturbances ofsmelling, allergy have been observed. The most important symptoms, hovewer, were ir-ritation like concerning eyes, skin, and the respiratory tract. Because these symptoms

69
cannot be explained by chemical irritation they can be explained as paraesthesia occu-ring after local absorption, which is a well documented affect of this group of substances.
respiratory irritation, hoarseness respiratory trouble, cough
respiratory insufficiency, dyspneabronchialsecretion excessive, hypersalivation
eye irritationmiosis
visual disturbance disturbance of smell, taste
disturbance gastrointestinal disturbance hepatic/pancreas
irritation, rubeosis, inflammation, pruritusallergy, urticaria
sweatingcirculatory disturbance, hypertension, hypotension
arrythmia, tachycardia, bradycardiacardiac shock, asystolia, heart failure
headachetiredness, apathia, sleep disturbance
vertigo, ataxia, dysarthria depression of consciousness, somnolence, sopor
fasciculation, myoclonia, tremor coma, cramp
psyche disturbance impaired sensibility
weakness, loss of weight CHE reduce
0102030405060 0 10 20 30 40 50 60
Organophosphates Pyrethroids
Figure 1: Comparison of symptoms after acute exposure to Organophosphates(n=118) and to Pyrethroids (n=110)
2. Comparison of symptoms after acute and chronic exposure to PY (Fig. 2)respiratory irritation, hoarseness
respiratory trouble, cough respiratory insufficiency, dyspnea
bronchitis, rhinitis eye irritation
visual disturbance disturbance of smell, taste
hearing disorder, tinnitus, vestibular disorder disturbance gastrointestinal
disturbance hepatic/pancreas irritation, rubeosis, inflammation, pruritus
swelling, vesiculation, necrosis allergy, urticaria
alopecia circulatory disturbance, hypertension, hypotension
arrythmia, tachycardia, bradycardia headache
disturbance concentration, memory tiredness, apathia, sleep disturbance
fear, restless, aggressiveness, nervosity vertigo, ataxia, dysarthria
fasciculation, myoclonia, tremor psyche disturbance impaired sensibility
neuropathy joint pain, myalgia, muscle weakness
weakness, loss of weight MCS, SBS, IEI, environmental syndrome
inflammation, infection, immunosuppression blood picture variable
0102030405060 0 10 20 30 40 50 60
acute chronic
Figure 2: Comparison of symptoms after acute (n=110) and chronic (n=96) expo-sure to Pyrethroids

70
3. Comparison of symptoms after chronic exposure to PY and Combinations (Fig. 3)respiratory irritation, hoarseness
respiratory trouble, cough respiratory insufficiency, dyspnea
bronchitis, rhinitis eye irritation
visual disturbancedisturbance of smell, taste
hearing disorder, tinnitus, vestibular disorderdisturbance gastrointestinal
disturbance hepatic/pancreas disorder renal
irritation, rubeosis, inflammation, pruritusswelling, vesiculation, necrosis
allergy, urticaria alopeciasweating
circulatory disturbance, hypertension, hypotensionarrythmia, tachycardia, bradycardia
stenocardia, palpitation headache
disturbance concentration, memorytiredness, apathia, sleep disturbance
fear, restless, aggressiveness, nervosity vertigo, ataxia, dysarthria
fasciculation, myoclonia, tremor psyche disturbance impaired sensibility
neuropathy joint pain, myalgia, muscle weakness
weakness, lost of weight MCS, SBS, IEI, environmental syndrome
inflammation, infection, immunosuppressionneoplasia
lymphadenopathy blood picture variable
01020304050 0 10 20 30 40 50
Pyrethroids Combinations
* level of significance p<0,05
% %
*
*
**
*
*
*
Figure 3: Comparison of symptoms after chronic exposure to Pyrethroids (n=96)and Combinations (n=68)Interestingly, the pattern of symptoms occuring after chronic exposure to PY and combi-nations did not differ. This is in particular true for symptoms mentioned in the sectionabove (figure 2).Only few symptoms were different (χ2 − Test, p<0,05) for chronic exposure to PY: arryth-mia, disturbance of smell and taste, swelling, and for chronic exposure to COMB: fear,respiratory insufficience, renal disorder, lymphadenopathy.
Conclusion:The differences between acute and chronic exposures to OP and PY containing pestici-des as found in this evaluation points out the different modes of action:After acute exposure, the known observed symptoms can be explained by toxic mecha-nism of high dose of OP. These cases can also be attributed to suicides. Acute PY-exposure may also lead to typical, but less severe effetcs. After chronic exposures, whichmay be associated more frequent with low amounts, the pattern of symptoms is differentto that after acute exposure and may be explained by different processes.The high number of cases with „common use“ shows, that protective measures for con-sumers are needed.

71
II.5.10. Pesticides in mother's milk
Bärbel Vieth
IntroductionHighly lipophilic pesticides with long lasting environmental and biological persistency aredetectable in human milk. This is especially true for organochlorine pesticides, like DDT,hexachlorobenzene (HCB) or hexachlorocyclohexane isomers (HCH). Although their usehas been banned for several decades they are detectable in the environment and in foodof animal origin even today.Food, especially animal fat, is the major source of human background exposure to or-ganochlorine pesticides, which accumulate in human fat tissue. During the breast feedingperiod they pass into human milk.Infants are exposed to organochlorine pesticides postnatally via breast feeding. Addition-ally prenatal exposure occurs because most of these compounds can pass the placenta.Levels in human milk are an useful measure for the body burden of the mother as well asfor the prenatal and the postnatal exposure of breast-fed infants.Concentrations on residues of persistent organochlorine pesticides in human milk sam-ples from Germany have been analyzed for more than 20 years. The trends of these resi-dues in human milk and the exposure of breast-fed babies are discussed.
Origin and calculation of dataMost of the human milk samples have been analyzed on request of interested mothers bythe food control laboratories of the federal Länder. The data have been collected in thedatabank for residues in human milk and for dioxins in other human tissues established atthe BgVV.The concentrations of p,p’-DDT and its persistent metabolite p,p’-DDE are summarizedas the sum of both (sum-DDT).The calculation of the daily dietary intake by breast-fed infants has been based on themean concentrations and the 95 percentiles, respectively, of the organochlorine pesti-cides in human milk samples as determined from 1997 (Table 1, 2), the mean bodyweightand the average milk intake (fat content = 3.5 %) of a 4-month-old baby.
Trends in organochlorine pesticide levels in human milkSince 1980 about 40000 human milk samples have been analyzed for the following per-sistent organochlorine pesticides: dieldrin, cis-heptachlorepoxid (cis-HEPO), α-HCH, ß-HCH, γ-HCH (Lindan), HCB, p,p’-DDT and its main metabolite p,p’-DDE. These data al-low reliable statements on time trends of these residues.As a consequence of the ban of these pesticides the concentrations in human milk aredeclining continuously.Levels of α- and γ-HCH, dieldrin, cis-HEPOThe levels of α- and γ-HCH, dieldrin and cis-HEPO observed in the last 10 years are inthe range of or lower than the analytical detection limit. The number of samples with de-tectable amounts of these pesticides is between 10 and 50 %, so that the mean valuescalculated are strongly influenced by the detection limit.

72
Table 1: Levels of αααα and γγγγ- HCH, dieldrin and cis-HEPO in human milk from Ger-manyLevels of ß-HCH, HCB, sum-DDTIn almost all breast milk samples ß-HCH, HCB and DDT/DDE are detectable. The con-centrations of these pesticides are higher by a factor of 10-100 than those of the pesti-cides described before.During the last 20 years, the mean concentrations as well as the 95 percentiles have de-creased by about 80-95%.
Table 2: Levels of ß−−−−HCH, HCB and sum-DDT in human milk from GermanyRegional differencesSince 1990 data on samples from the new federal Länder (former GDR) have also beencollected. To compare the background levels of ß-HCH, HCB and DDT in human milksamples from the old and the new federal Länder the mean values are summarized inTable 3. Additionally data on samples originating from Bitterfeld, an industrial area areincluded.
Table 3: Comparison of mean values of ß-HCH, HCB and sum-DDT in human milksamples from the old and the new federal Länder
Year
Mean 95 Perc Mean 95 Perc Mean 95 Perc Mean 95 Perc
1979-81 0.021 0.047 0.055 0.115 0.026 0.033 0.0371984 0.018 0.060 0.045 0.140 0.014 0.0501990 0.004 0.011 0.016 0.027 0.007 0.029 0.007 0.0481995 0.004 0.012 0.016 0.050 0.008 0.024 0.007 0.0201997 0.003 0.006 0.010 0.040 0.006 0.020 0.006 0.020
αααα-HCH γγγγ-HCH Dieldrin cis-HEPO[mg/kg fat] [mg/kg fat] [mg/kg fat] [mg/kg fat]
Year N
Mean 95 Perc Mean 95 Perc Mean 95 Perc
1979-81 3390 0.327 0.903 1.075 2.098 1.831 4.0331984 1662 0.128 0.320 0.424 1.050 1.002 2.5401990 5316 0.077 0.164 0.218 0.523 0.551 1.3231995 1914 0.049 0.125 0.107 0.268 0.448 1.4471997 776 0.039 0.108 0.069 0.174 0.298 0.855
Decrease 1980-97 88% 88% 94% 92% 84% 79%
1) since 1991 only data of the old federal Länder included
ß-HCH[mg/kg fat]
Sum-DDT 1)
[mg/kg fat]HCB
[mg/kg fat]
Year Origin ß-HCH HCB Sum-DDT[mg/kg fat] [mg/kg fat] [mg/kg fat]
1990 Old federal Länder 0.077 0.218 0.551New federal Länder 0.080 0.170 1.250Bitterfeld 1) 0.520 0.400 2.390
1997 Old federal Länder 0.040 0.070 0.314New federal Länder 0.068 0.083 0.872
1996 Bitterfeld 1) 0.054 0.091 0.7931) Contaminated area

73
The background concentrations of ß-HCH and HCB are almost similar in the old and thenew federal Länder, whereas significant regional differences of the DDT levels can beobserved for 1990 as well as for 1997, resulting from the wide use of DDT in the formerGDR during the eighties.In former times technical HCH and DDT were produced or processed in Bitterfeld, a cen-tre of chlorine chemistry. This resulted in high environmental contamination and thereforeelevated residue concentrations in food produced in that region. Because of high con-sumption of self-produced or regional produced food in the former GDR distinctly ele-vated concentrations of the organochlorine pesticides in breast milk sampled in that areain 1990 are observed. However, intensive efforts for environmental reconstruction in thenineties resulted in a clear decline of the organochlorine pesticide mean levels in humanmilk from that region in 1997.
Current intake of organochlorine pesticides by breast-fed infantsThe daily intake of organochlorine pesticides by a 4 month old fully breast-fed infant hasbeen calculated. The mean daily intake as well as the 95 percentile are in the range of orlower than the acceptable or tolerable daily intake (ADI/TDI) derived by the JointFAO/WHO Expert Committee on Food Additives (JECFA). Only the dietary intake of HCBexceeds the TDI value.
Table 4: Daily dietary intake by fully breast-fed infants and the acceptable ortolerable daily intake
The ADI/TDI covers lifetime exposure of which the nursing period only constitutes a smallfraction. A short- term exceedence of the ADI/TDI is not viewed as posing a health risk.
In conclusion there is no health risk for breast-fed infants recognizable. Breast-feeding isrecommended by the German National Breast-feeding Committee and other expertgroups.
Summary1. Infants are exposed to organochlorine pesticides postnatally via breast-feeding and
prenatally by transplacental transfer.2. In Germany the background levels of the organochlorine pesticides (mean and 95
percentile) in human milk, i.e. the exposure of infants decreased by about 80-95 %during the last 20 years.
ADI / TDIPesticide µg/kg BW *d Mean 95 Percentile
µg/kg BW *d µg/kg BW *d
α-HCH 3 0.01 0.026ß-HCH 3 0.18 0.49γ-HCH 3 0.05 0.18Dieldrin 0.1 0.026 0.09cis-HEPO 0.5 0.02 0.09HCB 0.16-0.17 0.31 0.75Sum-DDT1) 20 1.33 3.801) only data from the old federal Länder included
Calculated daily dietary intake

74
3. From the organochlorine pesticides analyzed in human milk from Germany, nowa-days residues of ß-HCH, HCB and DDT are still detectable in relevant amounts inmost of the samples.
4. The current daily intake by breast-fed babies is clearly lower than the lifetime ac-ceptable/tolerable daily intake for most of the organochlorine pesticides.
5. The German National Breast-feeding Committee and further experts recommendbreast-feeding.
6. For reasons of precautionary health protection the experts demand further efforts toreduce the levels of contaminants in human milk.
Acknowledgements:The authors wish to thank the colleagues from the food control laboratories of the federalLänder for making available their results of organochlorine pesticide analysis in humanmilk samples.

75
II.5.11. Exposure of children to contaminants: In vitro determinationof oral bioavailability of toxic substances in soil
Agnes G. Oomen, Jacqueline G.M. van EngelenChildren ingest daily on average 50-200 mg of soil via hand-to-mouth behaviour.
Hence, ingestion of soil is considered a major route of exposure to many soil-borne con-taminants. Oral bioavailability of ingested soil contaminants is defined as the contaminantfraction that reaches the systemic circulation. Oral bioavailability can be divided in fourmajor processes. After soil ingestion, contaminants can be partially or totally releasedfrom soil into chyme, i.e. digestive juice, during digestion. The fraction that is mobilisedfrom soil is defined as the bioaccessible fraction, and is considered to represent the con-taminant fraction that is available for intestinal absorption. Bioaccessible contaminantscan subsequently be absorbed, i.e. transported across the intestinal wall, and transferredinto the blood (or lymph) stream. The contaminants may be biotransformed and excretedin the intestinal epithelium or liver. This is referred to as first-pass effect. After thesesteps, the contaminants reach the systemic circulation and thereby the rest of the body,and may exert toxicity.Consequently, oral bioavailability of soil contaminants is the result of soil ingestion, bioac-cessibility, absorption, and first-pass effect.In present risk assessment of soil, oral bioavailability from soil is assumed to be equal tobioavailability of the contaminants from the matrix used in toxicity studies upon whichhuman risk assessment is based. In toxicity studies typically food and liquid matrices areused. In literature it is suggested that oral bioavailability of contaminants from soil can besignificantly lower. For that reason it was aimed to develop a tool for estimation and pre-diction of (a process of) oral bioavailability. This can be used to include the matrix of in-gestion in risk assessment using a relative bioavailability factor, i.e. oral bioavailability orthe contaminant in the matrix used in toxicity studies relative to the oral bioavailability orthe contaminant in the soil matrix. The research of various institutes focuses on a tool thatcan simulate bioaccessibility as this process is assumed to be matrix dependent. For thatreason, several in vitro digestion models have been developed.The more complex models can simulate more aspects of human physiology whereas thesimple models are easy to perform and allow simultaneous determination of large num-bers of samples. At the present it is clear that many models exist with various experi-mental designs. The consequences of the different designs with regard to bioaccessibilityvalues have recently been investigated (Oomen et al., submitted).Bioaccessibility of soil contaminants is in many cases < 50%, indicating that reduction ofbioavailability can have implications for health risk assessment.

76
II.5.12. Estimating non-dietary ingestion of toxic substances in children
Jacqueline G.M. van Engelen, G. Wolterink and M.T.M. van RaaijMore than adults, children may be exposed to toxic substances, because children mayspend more time in the same room or area, are in closer contact with a contaminatedsurface (e.g. by crawling), display more hand-to-mouth behaviour, and display lesshygienic behaviour (e.g. mouthing of objects/surfaces, pica behaviour). In order tosafeguard the use of toxic substances, risk assessments have to be performed. For thispurpose, consumer exposure models such as CONSEXPO 3.0 (van Veen et al. 2001)have been developed to estimate exposure levels. CONSEXPO calculates (systemic)exposure levels through the inhalatory, dermal and oral routes. Furthermore,CONSEXPO allows calculation of exposure levels using different types of products (e.g.paints, insecticide spray cans), and different application scenarios (e.g. using a spray canfor general surface treatment or spot application). When specific data for exposure tosubstances are lacking, which is often the case, default values for a specific exposurescenario are used in CONSEXPO.Because hand-to-mouth contact is an important route for children exposure it is needed togain insight in the processes involved in oral exposure through hand-to-mouth or object-to-mouth contact and to determine the most reliable and relevant method for assessmentof exposure through hand-to-mouth contact. For this purpose, data from exposure expe-riments are collected, primarily by literature search. Based on these data defaultparametes for use in CONSEXPO can be determined.Exposure to toxic substances can be estimated using both the macro-approach and themicro-approach. In both approaches experimentally determined transfer coefficients areused. However, the approaches differ in the level of refinement.In the macro approach, exposure is the summation of all processes that contribute totransfer from surface to mouth. For instance, levels of the elements Al, Si, Ti in faecescan be used as a measure of daily soil intake. This approach has the advantage thatestimation of the exposure is relatively simple. It should be noticed, however, that thismethod gives no insight in the contribution of each of the steps in the process of transfer,that the data are valid for a specific exposure scenario only, that extrapolation of data toother situations is difficult, and that exposure estimates may be based on roughassumptions.The micro-approach uses detailed modeling of exposure as a series of separate trans-fers. For instance, the transfer of a toxic substance from a surface to the hand is deter-mined by the concentration of the substance on the surface, the area of surface that co-mes in contact with the hand, the percentage dislodgeable substance, the frequency, du-ration and intensity of contact, and the surface area of the hand. Each of these transferparameters may be subdivided into more refined transfer steps. For instance, the dislod-geable fraction of a substance depends on the structure of surface, chemical or elec-trostatic binding of the substance to surface, the time between application and handcontact, and whether the skin is wet, sticky or dry. The micro-approach has theadvantage that it provides insight in the process of transfer of a substance from surface tomouth, and that extrapolations to other scenarios are possible. However, at present manyparameters are unknown. Using worst-case estimates of every separate transferparameter in the micro-approach may lead to very conservative exposure estimates.In conclusion, data from the macro- as well as the micro-approach may be used as de-faults in consumer exposure models such as CONSEXPO. However, the relevance ofpresently used defaults in exposure models is not very clear. Especially for the micro-approach, a large number of default parameters are unknown. Furthermore, refinement of

77
the defaults for the macro- as well as the micro-approach is necessary. Since data formost of the parameters of the micro-approach are lacking, at present exposure data frommacro-approach are preferred.
References:1. Van Veen M.P. CONSEXPO 3.0. Consumer exposure and uptake models. RIVM re-
port 612810 011. RIVM, Bilthoven, The Netherlands, May 2001
78
II.5.13. Empirical evaluation in regard to differences in toxicokineticsbetween children and adults
Klaus SchneiderHuman data for pesticides allowing for an in-depth analysis of possible differences intoxicokinetics between children and adults are lacking. But there are investigations car-ried out by various authors using data from pharmacokinetic studies with pharmaceuti-cals.Hattis (2001) established a database and analyzed human pharmacokinetic data for 35substances. He used the following age group definitions:Premature neonates: ≤ 1 week, full term neonates: ≤ 1 week, newborns: 1 week - 2months, early infants: 2-6 months, crawlers & toddlers: 6 months - 2 years, pre-adolescents: 2 -12 years, adolescents: 12 - 18 years.Differences between age groups were analyzed with regard to following parameters: AUC(area under curve), Cmax (maximum plasma concentration), (total) Clearance, T1/2 (elimi-nation half life) and Vd (volume of distribution). For the first two parameters only a smallamount of data was available. The following figure depicts the results of the evaluation ofcomparisons between adult values (set to 1) and the various age groups (mean andstandard errors, derived from regression analysis of age group-specific data) for Clear-ance, T1/2 and Vd.Neonates and newborns show higher values for elimination half times and lower clear-ance rates than adults, which is in accordance with the immaturity of the renal system ofelimination. The opposite is true for older children from 6 months to 12 years showing asomewhat higher clearance. There is a tendency for a higher volume of distribution forthe age groups up to 2 years compared to adults. This evaluation of Hattis (compareChapter IV.1) hints on a higher internal body burden of children up to 6 months comparedto adults.The observation by Hattis (2001) of clearance rates for older children is in accordancewith experiences from the paediatric chemotherapy. Several evaluations covering the lastthree decades and experience with about 50 anticancer drugs state higher maximum tol-erated doses (MTD) for children compared to adults (Glaubiger et al., 1981; Marsoni etal., 1985; Carlson et al., 1996). Ratios of MTDs for children divided by MTDs for adultsusing MTDs expressed per m2 body surface are consistently > 1, indicating differences of> factor 2 if doses are transferred to a bodyweight base. Whereas toxicodynamic reasons(e.g. increased bone marrow reserve in children) may partly explain this observation, ac-cordance with the evaluation of toxicokinetic data by Hattis (2001) point to a role for toxi-cokinetic reasons. The allometric principle of caloric demand scaling lead to the conclu-sion of a reduced body burden at the same magnitude (about factor 2 for elder children)as found in the evaluation of Hattis (2001) and the MTD comparisons mentioned above, ifdose is expressed per kg bodyweight.Renwick (1998) reached conclusions similar to Hattis (2001) by reviewing toxicokineticdata for a fast amount of pharmaceuticals. His analysis indicates that many drugs showreduced clearance and/or longer half lives in neonates, but greater elimination and higherclearance by infants and children compared to adults.
References:
1. Carlson, L., Ho, P., Smith, M., Reisch, J., Weitman, S., 1996 Pediatric phase I drugtolerance: a review and comparison of recent adult and pediatric phase I trials. Jour-nal of Pediatric Hematology - Oncology, Vol. 18, 1996, S. 250-256

79
2. Glaubiger, D. L., von Hoff, D. D., Holcenberg, J. S., Kamen, B., Pratt, C., Ungerleider,R. S., 1981. The relative tolerance of children and adults to anticancer drugsFrontiers of Radiation Therapy and Oncology, Vol. 16, 1981, S. 42-49
3. Hattis, D., Russ, A., Ginsberg, G., Banati, P., Kozlak, M., Goble, R., 2001 Newborns,older children, and adults – comparisons of pharmacokinetics and pharmacokineticvariability Human Interindividual variability in parameters related to susceptibility fortoxic effects. Http://www.clarku.edu/faculty/dhattis/, 2001
4. Marsoni, S., Ungerleider, R. S., Hurson, S. B., Simon, R. M., Hammershaimb, L. D.,1985Tolerance to antineoplastic agents in children and adults. Cancer Treatment Reports,Vol. 69, 1985, S. 1263-1269
5. Renwick, A. G., 1998 Toxicokinetics in infants and children in relation to the ADI andTDI. Food Additives and Contaminants, Vol. 15, 1998, S. 17-35

80
II.5.14. Protecting Children’s Health: Science and Regulation
Gail Charnley
Q: Are children more sensitive : than adults to chemical toxicity?A: It depends on:
• the chemical• the child’s age• the exposure situation
No differences, 13%
Young animalsless susceptible, 47%
Young animalsmore susceptible, 40%
Effects of Age on Rodent Carcinogenesis(Charnley and Putzrath, 2001)
CARES : software (Cumulative and Aggregate Risk Evaluation System) produces expo-sure estimates for multiple pesticides and multiple routes of exposure. The model mat-ches pesticide exposure characteristics across data bases to generate individual year-long exposure profiles for 100,000 individuals, including children.
Children often have more rapid rates of drug metabolism and clearance than adults, butthe differences are less than 5-fold. Chlorpyrifos : is an example of a substance that isless toxic to young animals than to adult animals at low doses, which reflect actual envi-ronmental exposures, although it is more toxic to young animals than adult animals athigh doses.
0
5
10
15
20
25
30
<1 1-3 4-6 7-12 13-19M
13-19F
20-54M
20-54F
55+
Perc
ent o
f Tot
al W
eigh
t
0
10
20
30
40
50
60
70
80
White Black Hispanic Asian NativeAmerican
Perc
ent o
f Tot
al W
eigh
t
0
2
4
6
8
10
12
14
16
18
20
NewEng
MidAtlantic
ENCentral
WNCentral
SAtlantic
ESCentral
WSCentral
Mnt Pacific
Perc
ent o
f Tot
al W
eigh
t
Age/ Gen-der
Race/Ethnicity
Region/Division
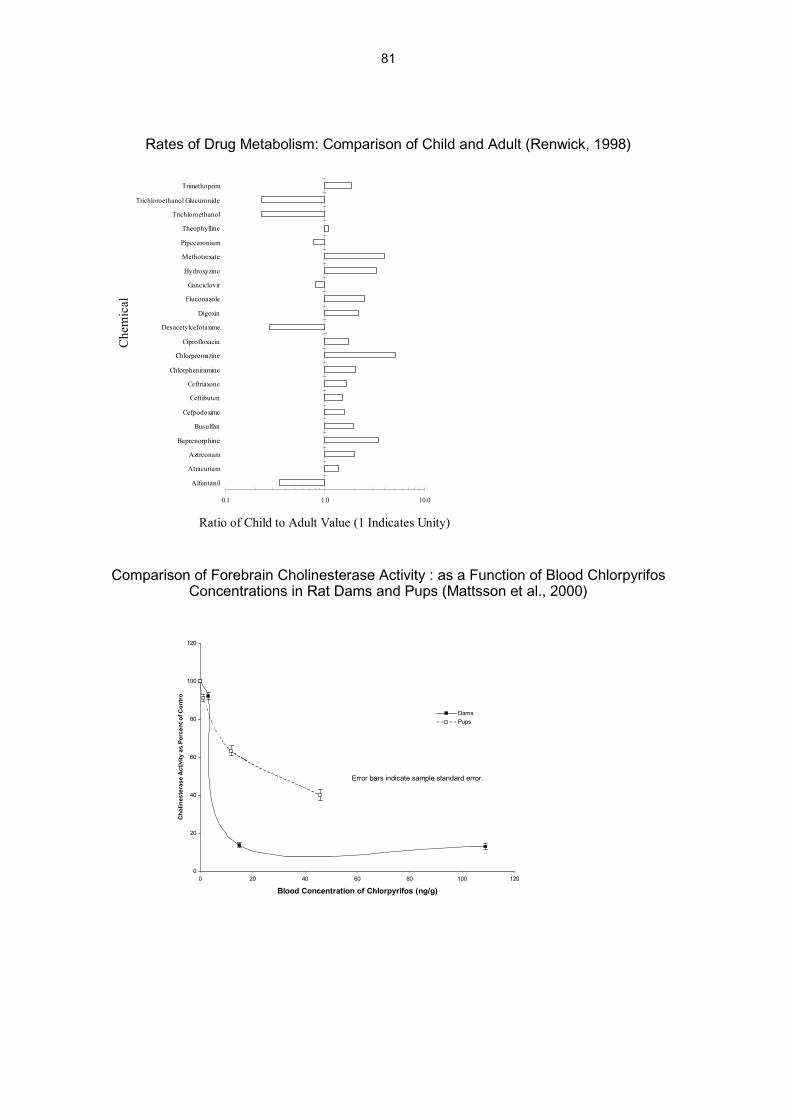
81
Rates of Drug Metabolism: Comparison of Child and Adult (Renwick, 1998)
Comparison of Forebrain Cholinesterase Activity : as a Function of Blood ChlorpyrifosConcentrations in Rat Dams and Pups (Mattsson et al., 2000)
0.1 1.0 10.0
Alfentanil
Atracurium
Aztreonam
Buprenorphine
Busulfan
Cefpodoxime
Ceftibuten
Ceftriaxone
Chlorpheniramine
Chlorpromazine
Ciprofloxacin
Desacetylcefotaxime
Digoxin
Fluconazole
Ganciclovir
Hydroxyzine
Methotrexate
Pipecuronium
Theophylline
Trichloroethanol
Trichloroethanol Glucuronide
Trimethoprim
Che
mic
al
Ratio of Child to Adult Value (1 Indicates Unity)
0
20
40
60
80
100
120
0 20 40 60 80 100 120
Blood Concentration of Chlorpyrifos (ng/g)
Cho
lines
tera
se A
ctiv
ity a
s Pe
rcen
t of C
ontr
o
DamsPups
Error bars indicate sample standard error.

82
Q: Are children at greater risk of chemical toxicity than adults?A: Only if their exposures exceed those required to produce toxicity.Q: Are current regulatory approaches to limiting children’s exposures to chemicals suffi-cient?A: Most of the time (Dourson et al. 2002).
References
Charnley G, Putzrath RM. (2001) Children's health, susceptibility, and regulatory ap-proaches to reducing risks from chemical carcinogens. Environ. Health Perspect.109:187-192.
Dourson ML, Charnley G, Scheuplein R. (2002) Differential sensitivity of children andadults to chemical toxicity: II. Risk and regulation. Reg. Toxicol. Pharmacol., in press.Mattsson JL, Maurissen JP, Nolan RJ, Brzak KA. (2000) Lack of differential sensitivity tocholinesterase inhibition in fetuses and neonates compared to dams treated perinatallywith chlorpyrifos. Toxicol. Sci. 53:438-446
Renwick AG. (1998) Toxicokinetics in infants and children in relation to the ADI and TDI.Food Addit.Contam. 15:17-35
0
5
10
15
20
25
30
35
40
45
0.00001 0.0001 0.001 0.01 0.1 1 10 100
Dose
Sensitive HumanAverage HumanResistant Human
Safe exposure limit

83
III. Conclusions drawn from the lecturers and postersOpen Presentation
Gerhard Heinemeyer
Introduction:Children are no little adults. This general conclusion can be drawn very generally from thepresentations and working group discussions of the workshop. The exposure to children,shown by the example of pesticides shows, that there are considerable differences bet-ween children and adults and that there are also a number of items that should be consi-dered to describe this difference, as given in the table below:
1. The concentrations of the substances in the medium contacting the children, this includes.
� substances in air ref. to chapter III.2.2
� substances in dust and soil ref. to chapter III.2.1, III.5.2, III.5.4, III.5.111
� substances in food ref. to chapter III.5.8, III.5.10
� substances as article contaminations ref. to chapter III.5.1, III.5.2
� substances released from toys ref. to chapter III.4.1
2. Behavíour of children, which is
� Moothing, sucking and biting ref. to chapter III.1.3
� Dietary and non-dietary ingestion ref. to chapter III.5.10, III.5.12
� Contact duration and frequency maydiffer to adult exposure
ref. to chapter III.1.3, III.4.1, III.4.2
3. Physiological developments
� Anthropometrics ref. to chapter III.1.1
� Toxicokinetics ref. to chapter III.1.1, III.1.2, III.5.13
� Toxicodynamics ref. to chapter III.1.1
4. Variability of data in childhood
� Age dependent changes ref. to chapter III.1.1, III.4.4
5. Biomonitoring ref. to chapter III.3.2, III.5.3
6. Health effects ref. to chapter III.3.3, III.3.4 III.5.9
The main question that arises from the discussion is, if children differ from adults, arethey more sensitive? The answer is, they are not generally more sensitive, because sen-sitivity depends on age, developmental status and is ruled by the toxic characteristics ofthe substances.In this context, the following questions have to be answered:1. How to act substances on children?
This question includes the discussion about toxic effects, in relation to organ deve-lopment.
2. How do children process substances?
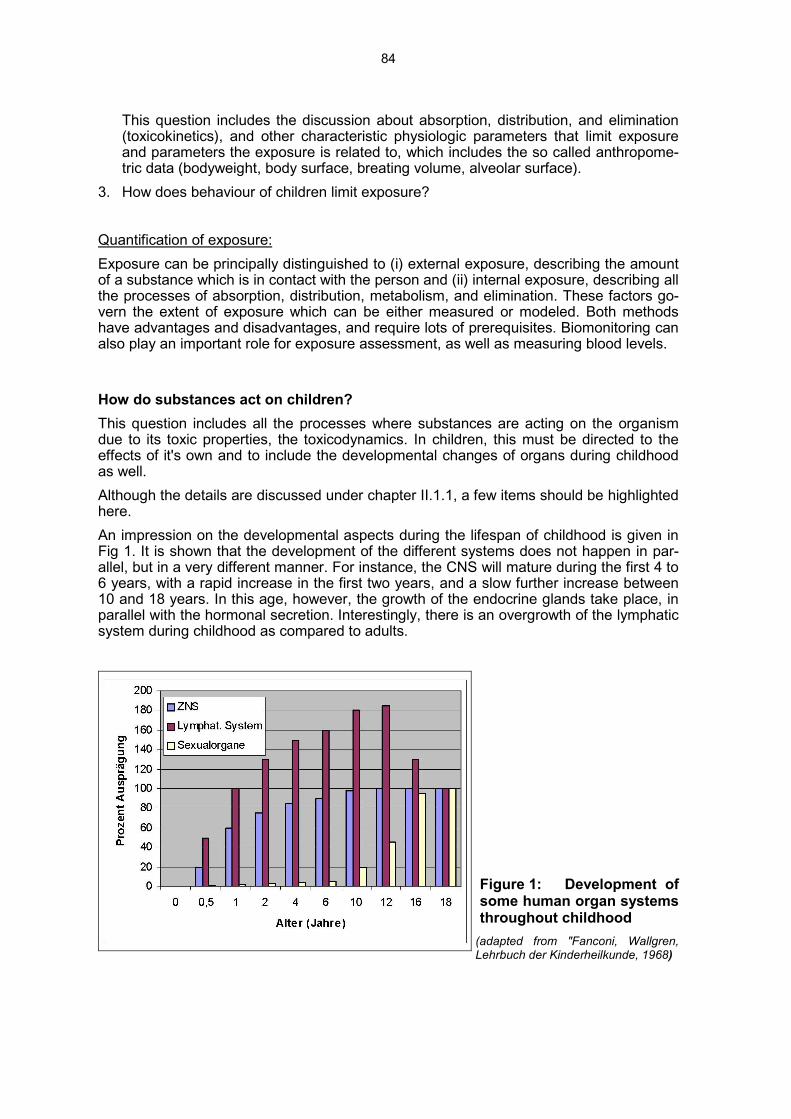
84
This question includes the discussion about absorption, distribution, and elimination(toxicokinetics), and other characteristic physiologic parameters that limit exposureand parameters the exposure is related to, which includes the so called anthropome-tric data (bodyweight, body surface, breating volume, alveolar surface).
3. How does behaviour of children limit exposure?
Quantification of exposure:Exposure can be principally distinguished to (i) external exposure, describing the amountof a substance which is in contact with the person and (ii) internal exposure, describing allthe processes of absorption, distribution, metabolism, and elimination. These factors go-vern the extent of exposure which can be either measured or modeled. Both methodshave advantages and disadvantages, and require lots of prerequisites. Biomonitoring canalso play an important role for exposure assessment, as well as measuring blood levels.
How do substances act on children?This question includes all the processes where substances are acting on the organismdue to its toxic properties, the toxicodynamics. In children, this must be directed to theeffects of it's own and to include the developmental changes of organs during childhoodas well.Although the details are discussed under chapter II.1.1, a few items should be highlightedhere.An impression on the developmental aspects during the lifespan of childhood is given inFig 1. It is shown that the development of the different systems does not happen in par-allel, but in a very different manner. For instance, the CNS will mature during the first 4 to6 years, with a rapid increase in the first two years, and a slow further increase between10 and 18 years. In this age, however, the growth of the endocrine glands take place, inparallel with the hormonal secretion. Interestingly, there is an overgrowth of the lymphaticsystem during childhood as compared to adults.
Figure 1: Development ofsome human organ systemsthroughout childhood
(adapted from "Fanconi, Wallgren,Lehrbuch der Kinderheilkunde, 1968)
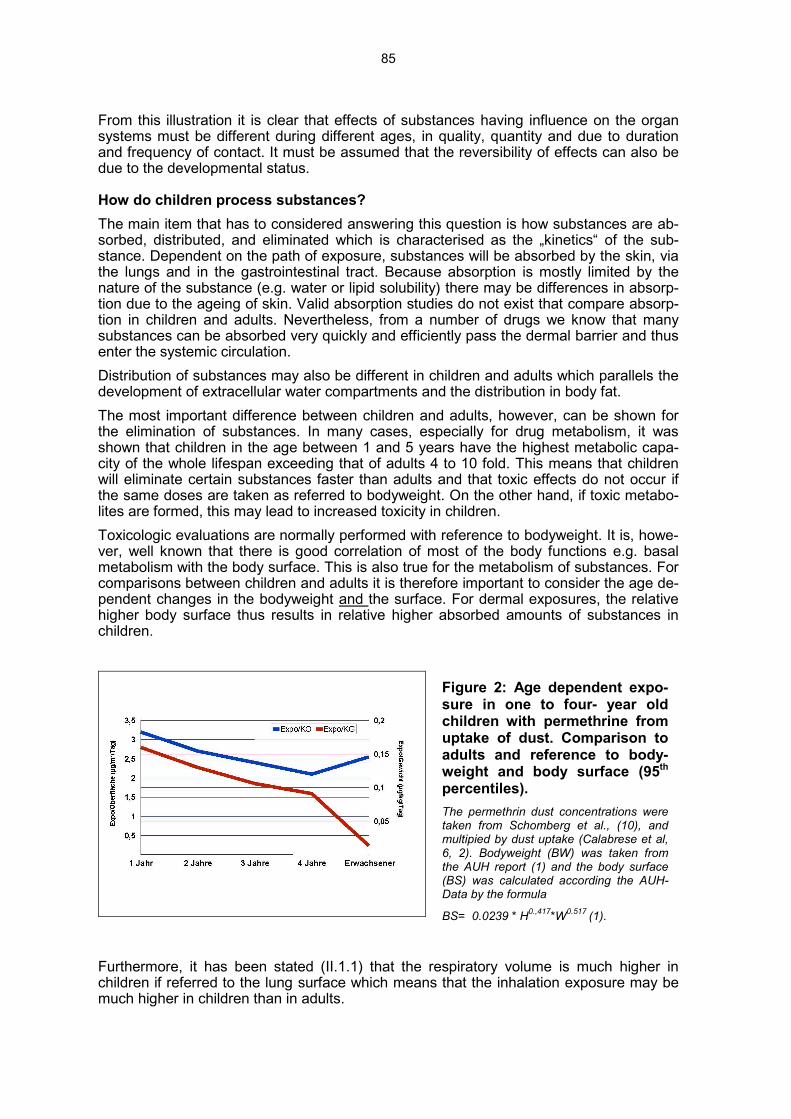
85
From this illustration it is clear that effects of substances having influence on the organsystems must be different during different ages, in quality, quantity and due to durationand frequency of contact. It must be assumed that the reversibility of effects can also bedue to the developmental status.
How do children process substances?The main item that has to considered answering this question is how substances are ab-sorbed, distributed, and eliminated which is characterised as the „kinetics“ of the sub-stance. Dependent on the path of exposure, substances will be absorbed by the skin, viathe lungs and in the gastrointestinal tract. Because absorption is mostly limited by thenature of the substance (e.g. water or lipid solubility) there may be differences in absorp-tion due to the ageing of skin. Valid absorption studies do not exist that compare absorp-tion in children and adults. Nevertheless, from a number of drugs we know that manysubstances can be absorbed very quickly and efficiently pass the dermal barrier and thusenter the systemic circulation.Distribution of substances may also be different in children and adults which parallels thedevelopment of extracellular water compartments and the distribution in body fat.The most important difference between children and adults, however, can be shown forthe elimination of substances. In many cases, especially for drug metabolism, it wasshown that children in the age between 1 and 5 years have the highest metabolic capa-city of the whole lifespan exceeding that of adults 4 to 10 fold. This means that childrenwill eliminate certain substances faster than adults and that toxic effects do not occur ifthe same doses are taken as referred to bodyweight. On the other hand, if toxic metabo-lites are formed, this may lead to increased toxicity in children.Toxicologic evaluations are normally performed with reference to bodyweight. It is, howe-ver, well known that there is good correlation of most of the body functions e.g. basalmetabolism with the body surface. This is also true for the metabolism of substances. Forcomparisons between children and adults it is therefore important to consider the age de-pendent changes in the bodyweight and the surface. For dermal exposures, the relativehigher body surface thus results in relative higher absorbed amounts of substances inchildren.
Figure 2: Age dependent expo-sure in one to four- year oldchildren with permethrine fromuptake of dust. Comparison toadults and reference to body-weight and body surface (95th
percentiles).The permethrin dust concentrations weretaken from Schomberg et al., (10), andmultipied by dust uptake (Calabrese et al,6, 2). Bodyweight (BW) was taken fromthe AUH report (1) and the body surface(BS) was calculated according the AUH-Data by the formula
BS= 0.0239 * H0.,417*W0.517 (1).
Furthermore, it has been stated (II.1.1) that the respiratory volume is much higher inchildren if referred to the lung surface which means that the inhalation exposure may bemuch higher in children than in adults.

86
Routes of exposures to children in householdsThere are several routes of exposures with pesticides in households important for child-ren, the most important sources for children given below:
• Carpets household dust (Carpets have been suggested to be a sink for pesticides)• Soil track in• Pets (treated with pesticides)• Clothing of pesticide users in a family• contamination of food
Childrens behaviourChildren’s behaviour may be one of the most important factors modulating exposure.Only a few studies have been performed. Close to children’s behaviour, the problem ofcontamination of dust and soil must be mentioned. Substances that do not volatilise bindto carriers which are in the surroundings. For indoor situations, dust represents an im-portant carrier. It occurs in two forms, as floating dust which can be inhaled or as housedust which is on the ground e.g. carpets or behind furniture. If substances are bound todust, they can be uptaken together with the dust. Behaviour of children may lead to anincrease of exposure by contact with dust, either by crawling, playing on the ground andby subsequent „hand-to-mouth-contact“. In addition, hand-to-mouth behaviour leads toexposure from other sources particularly pets.This type of behaviour should be taken into consideration for the assessment of exposureto children and can be taken to characterise to following scenarios due to age.
Variability of exposureVariability of exposure is greater in children than in adults. This is due to the develop-mental changes in physiological parameters (bodyweight, body surface, breathing volu-me, toxicokinetics, -dynamics, as well as behaviour).From this reason, it should be appropriate not to say children, but to differentiate severalages, an approach which has been proposed by working group one.Another possibility to consider the variability of exposure in childhood is the use of theprobabilistic approach. This means that the distribution of the exposure factors used forestimations should be characterised well and taken for calculations. It must be conside-red, however, that for taking this approach, the fundamentals of statistics and epidemio-logy must be kept in mind. Data must be characterised well and represent the populationof interest. Considering this rules, probabilistic approaches offer a powerful tool for expo-sure estimations by modeling.Other model approaches monitor exposures over long times and can thus differentiatebetween seasonal, but also daily activities. The models differentiate also between so cal-led (i) macroactivities which describe roughly the time dependent stay of persons in theirhomes, otherwise called time budgets, and (ii) microactivities differentiating the abovementioned specific behaviour patterns e.g. the hand to mouth exposure. The long termmodels are developed and studied primarily in the US.

87
Health effects due to pesticide exposuresMost of the reported health effects related to exposure from pesticides are acute effects.The poison information centres have data mostly on short term single exposures, withspecific symptomatology. Calls concerning exposures with pesticides account for about3% of the calls in the centres of Lille (France) and Göttingen (Germany). As shown by thedata from the Göttingen centre, 1/3 of that calls referred to exposures to children. In child-ren, 87 % of calls are without symptoms, 12 % showed minor and 1% moderate sym-ptoms. These data indicate that diseases due to pesticides exposure are already occu-ring, but real severe cases are seldom and related to acute overdosage.Interestingly, no participant in the workshop was able to demonstrate a clear incidence forhealth effects from chronic exposures, although lots of measurements are available thatshow a substantial external exposure. Biomonitoring data do not correlate with dust con-centrations measurements This may lead to the conclusion that dust may represent animportant sink for some pesticides, but this source does probably not significantly contri-bute to overall exposure. Data from the BgVV showed evaluations of chronic exposuresto pesticides. The data were taken from a spontaneous reporting system, with differentia-tion of the pesticide groups organophosphates and pyrethroids in an adult cohort withchronic low dose exposure. Interestingly, there was no difference between the two groupsof exposures, and the symptoms were very similar to that reported in the literature occu-ring due to chemical sensitivity syndroms. Taken from these evaluations, there are nodata available clearly showing an convincing evidence for the existence of health effectsdue to chronic low dose exposures.
Future of exposure assessments
The most important work that should be done in the future can be discussed according tothe following three items:1. Measuring or modeling exposure?
For consumer exposures, only very few data on measured exposures are available. Itis not clear whether models represent reality and adequately describe the circum-stances of exposure. Due to high costs and operating expenses, consumer exposuremust be modeled, however, the model approaches have to be validated. This meansthat for representative examples, modeled exposures should be verified by experi-mental measurements of exposure by comparing measured and modeled results.This has been performed for some scenarios of exposures with volatile substancesbut not with non-volatile substances.An easier way to improve the knowledge are measurements of single exposure fac-tors e.g. migration rates, room ventilation, concentrations of substances in dust. Ifthese measurements are representative for a scenario they should be preferred formodel evaluations.
2. Data compilationOne of the most important problems for exposure estimations is that data for mode-ling are incomplete and therefore uncertain and not representative, neither for a givenscenario nor for a population or region.For some data, sufficient data bases exist e.g. some anthropometrics (bodyweight,body surface). Data are sufficiently available for product use and composition, beha-viour of people, micro- or macroactivities, or room sizes including ventilation. For US,EPA has published the EPA-Exposure factors handbook, for Europe some documentsexist such as the AUH-report (1), as well as reports from the dutch RIVM (3, 4), thedanish EPA (9) and from industry (7).
3. Uncertainties and variabilities

88
It is assumed that some problems of exposure assessment can be solved when ta-king uncertainty and variability of data into account. This applies in particular for thediscussion of worst case evaluations. The worst case approach does only work if theworst case assumption, that is the deterministic value which is put into the model, isclearly described as an extreme of the distribution. This clearly means that withoutcharacterisation of a distribution of the exposure factor a worst case assumption isuncertain and unvalid. From the scientific view, the first step in the characterisation ofan exposure factor is the description of the distribution and of it’s statistical funda-mentals. Probabilistic approaches should therefore be given priority for data characte-risation.
References:
1. American Industrial Health Council (1994) Exposure Factors Sourcebook. Suite 760,2001 Pennsylvania Ave., NW, Washington DC 20006-1807
2. Ausschuss für Umwelthygiene (AUH) (1994) Standards zur Expositionsabschätzung.Arbeitsgemeinschaft der leitenden Medizinalbeamtinnen und -beamten der Länder,Behörde für Arbeit, Gesundheit und Soziales, Hamburg
3. Bremmer H.J. and Van Veen M.P. (2000a) Factsheet algemeen, randvoorwaarden enbetrouwbaarheid, ventilatie, kamergrootte, lichaamsoppervlak [General Factsheet,conditions and reliability, ventilaiton, room size, body surface]. RIVM report 612810009, RIVM, Bilthoven, The Netherlands.
4. Bremmer HJ, van Veen MP (2000b) Factsheet Verf. Ten behoeve van de schattingvan de risico's voor de consument. RIVM rapport 612 810 010
5. Calabrese EJ, Pastides H, Barnes R, Edwards C, Kostecki PT, Stanek III EJ, Vene-man P, Gilbert CE (1989) "How much soil do young children ingest: an epidemiologi-cal study". Reg Toxicol Pharmacol 10, 123-137
6. Calabrese EJ, Barnes R, Stanek III EJ, Pastides H, Gilbert CE, Veneman P, Wang X,Lasztity A, Kostecki PT (1989) "How much soil do young children ingest: an epide-miological study". in: E.J. Calabrese and P.T. Kostecki (eds) Petroleum Contaminatedsoils: Volume 2, Chapter 30, 363-397
7. ECETOC (2001) Exposure factors sourcebook for european populations (with focuson UK data). Technical report No. 79.
8. Environmental Protection Agency (1997) Exposure Factors Handbook. Update to Ex-posure Factors Handbook EPA/600/8-89/043 – May 1989. Office of Research andDevelopment, National Center for Environmental Assessment. Vol. I-III. EPA/600/P-95/002Fa, August 1997, Washington, DC
9. Larsen PB, Nielsen E, Thorup I, Schnipper A, Hass U, Meyer O, Ladefoged O, LarsenJC, Østergaard G (2001) Children and the unborn child. Environmental Project 5892001. Danish Environmental Protection Agency.
10. Schomberg K, Winkens A (2000) Zur Belastung rheinländischer Haushalte mit Per-methrin. Umweltmed Forsch Prax 5, 331-335
Open Presentation

89
IV. Results from workshop working groups
IV.1. Working group 1: Children as a vulnerable groupChairperson: Wayne R. SnodgrassRapporteur: Frederic BoisCo-rapporteur: Gail CharnleyFurther working group members: Nida Besbelli, Axel Hahn, Monique Matthieu-Nolf, Martin Wilks, Herbert Desel, Joanne Hughes, Rainer Konietzka, Klaus Schneider
Open PresentationNote: it was decided to not discuss the prenatal period and to not differentiate biocides andpesticides.There are definite reasons for differences in sensitivity to toxicants between adults andchildren. Those differences can lead to increased or decreased sensitivity. This sectiondocuments differences that appear most relevant to pesticides, and stresses the lack ofrelevant data. The interpretation of the few data available can be controversial, as we ex-perienced it within our working group. We are however unanimous at emphasising theneed for additional specific data on children or young animals.A first task of the group was to define age groups (source of this classification: BgVV).Table 1 is given for reference. It was also decided to not discuss the prenatal period andto not differentiate biocides from pesticides.
Table 1: Definition of human age groups (source: BgVV)Premature infant ≤ 36 weeks (of gestation)
Newborn 1 - >28 days (after birth)
Infant 29 days - 1 year
Small child 1 - < 6 years
School child 6 - < 14 years
Adolescent 14 - < 18 years
Adult 18 - < 65 years
Senior > 65 years
IV.1.1. Why may children be more or less susceptible to chemical toxici-ty than adults?
Human data for pesticides allowing for an in-depth analysis of possible differences intoxicokinetics between children and adults are lacking. But there are investigations car-ried out by various authors using data from pharmacokinetic studies with pharmaceuti-cals.Hattis et al. (2001) established a database and analysed human pharmacokinetic data for35 substances. He used the following age group definitions:Premature neonates: ≤ 1 week, full term neonates: ≤ 1 week, newborns: 1 week - 2months, early infants: 2-6 months, crawlers & toddlers: 6 months - 2 years, pre-adolescents: 2 -12 years, adolescents: 12 - 18 years.

90
Differences between age groups were analysed with regard to following parameters: AUC(area under curve), Cmax (maximum plasma concentration), (total) Clearance, T1/2 (elimi-nation half-life) and Vd (volume of distribution). For the first two parameters only a smallamount of data was available. Figure 1 depicts the results of the evaluation of compari-sons between adult values (set to 1) and the various age-groups (mean and standard er-rors, derived from regression analysis of age group-specific data) for clearance, T1/2 andVd.
10
100
1000
Prematureneonates
Full termneonates
Newborns Early infants Crawlers &toddlers
Pre-adolescents
Adolescents Adults
%ofadults
ClearanceT1/2Vd
Figure 1: Mean values (and standard errors) for Clearance, T1/2, and Vd for dif-ferent age groups compared to adults (data from Hattis et al., 2001)Neonates and newborns show higher values for elimination half times and lower clear-ance rates than adults, which is in accordance with the immaturity of the renal system ofelimination. The opposite is true for older children from 6 months to 12 years showing asomewhat higher clearance. There is a tendency for a higher volume of distribution forthe age groups up to 2 years compared to adults. This evaluation of Hattis and co-workers suggests a higher internal body burden of children up to 6 months compared toadults. More recent work by the same authors confirm, for the drugs they studied, thesefindings (Ginsberg et al. 2002).The observation by Hattis et al. (2001) of clearance rates for older children is in accor-dance with experiences from the paediatric chemotherapy. Several evaluations coveringthe last three decades and experience with about 50 anticancer drugs state higher maxi-mum tolerated doses (MTD) for children compared to adults (Glaubiger et al., 1981; Mar-soni et al., 1985; Carlson et al., 1996). Ratios of MTDs for children divided by MTDs foradults using MTDs expressed per m2 body surface are consistently higher than 1, indi-cating differences of more than factor 2 if doses are transformed to a bodyweight base.Whereas toxicodynamic factors (e.g., increased bone marrow reserve in children) maypartly explain the observed age-related differences in sensitivity, the evaluation of toxico-kinetic data by Hattis et al. (2001) points to a role for toxicokinetic factors. The allometricprinciple of caloric-demand scaling suggests for many substances a similar reduction inbody burden (about a factor of two for children older than 6 months), as was found byHattis et al. (2001) and in the MTD comparisons mentioned above, if dose is expressedper kg bodyweight.

91
Renwick (1998) reached conclusions similar to Hattis et al. (2001) by reviewing toxicoki-netic data for many pharmaceuticals. His analysis indicates that many drugs show re-duced clearance and/or longer half lives in neonates, but greater elimination and higherclearance by infants and children compared to adults.
IV.1.2. What is known about age related differences in pesticidetoxicity?
Young children may be more highly exposed than adults to pesticides found in the homeenvironment, such as organophosphates (OPs), carbamates, organochlorines, and pyre-throids, because of their natural tendency to explore their environment orally. They arealso in close proximity to potentially contaminated floors, surfaces, and air. Exposuremight be further increased by children's higher intakes of food, water, and air per unitbodyweight when compared to adults.As described in the NRC report “Pesticides in the diets of infants and children”(NationalResearch Council, 1993), there are important biological reasons for differences in vulner-ability of children, rendering children more susceptible to pesticide toxicity in some occa-sions:- Children’s metabolic pathways, especially in the first few months after birth, are im-
mature compared to those of adults. In some instances this means that they are un-able to metabolise compounds to their active forms, but more commonly means thatthey are less able to detoxify chemicals. On the other hand, for infants and children,many metabolic processes are actually increased compared to adults.
- Children are growing and developing and their developmental processes can be dis-rupted. For different organs there may be time periods during development that in-crease children’s vulnerability. The length of the period and the children´s age at itsstart varies, depending on the organs. For example, neurotoxicity may be more likelyduring glial cell proliferation at age 1, while reprotoxicity may be more likely duringpuberty. If brain cells are destroyed, reproductive development diverted, or immunesystem development altered, the resulting dysfunction can be irreversible.
This section is concerned with the risk of health effects from exposure to pesticides thatchildren face due to their developmental immaturity (Eskenazi et al., 1999). Where avail-able, examples of toxicities to which children are more or less susceptible than adults aregiven (i.e., situations where, for a given plasma concentration of a pesticide, greater orlower toxicity is observed in children than in adults). Human and laboratory animal dataon health effects following short-term high dose pesticide exposures and longer-termlower dose pesticide exposures are considered.
IV.1.2.1. Literature searchDatastar Medline and Embase were searched for human data with a year limit of 1991+.The search terms were tailored to the indexing used in each database as summarised inthe table below. Only postnatal exposures were considered.Datastar Medline: Pesticides# AND Child.de. Infant# School child$3.ti,ab. AND Vul-nerab$5.ti,ab. Susceptib$5.ti,ab.Embase: Pesticides# AND Child.de. # AND Vulnerab$5.ti,ab. Susceptib$5.ti,ab.

92
IV.1.2.2. Health effects following single, high-dose exposures to pesticides
HumansInformation with regard to pesticide poisoning for all ages is available from regional poi-son control centres. These data are generally restricted to acute clinical effects, andtherefore do not include information on the potential chronic health effects that might beexperienced by individuals once the initial acute symptoms have subsided. The data indi-cate that death following ingestion of high doses of pesticides is rare; in fact a large pro-portion of pesticide incidents involving children reported to poison control centres do noteven result in minor effects. This is because the parents may only suspect that their childhas ingested some pesticide, or the dose is so small that it does not cause adversehealth effects. In many cases the dose received is never determined (Hayes & Laws,1991).Poison control centre data collected by the US Centers for Disease Control show that the-re is a higer potential for harmful exposures in young children than in older age groups,but they do not necessarily demonstrate an increase in the sensitivity of young children(US EPA, 1999). There is a possibility that young children may be exposed to higher do-ses on a bodyweight basis compared to adults (from spills, ingestion, inhalation) becausethey are ignorant of the hazard, and not because of differences in sensitivity based onage to the effects of these pesticides. Data from poisoning incidents are also likely to oc-cur at doses much higher than those that would be expected from environmental exposu-res. For those reasons, it is difficult to draw conclusions from human incident data on thesensitivity of children compared to adults (US EPA, 2002).There are numbers of examples of pesticides for which children appear to be more sus-ceptible to poisoning than adults (NRC, 1993). On the other hand, OP-induced delayedonset peripheral neuropathy, reported in adults, has not been reported in children (Es-kenazi et al., 1999).
Laboratory animalsExperiments using laboratory animals demonstrate that young animals are more sensitivethan adults to the acute toxic effects of some pesticides. The published literature provideslots of information that pertains to the relative sensitivity of young animals to OP andpyrethroid pesticides. The scope of these studies is generally limited to estimates of acutelethal doses. From LD50 values it can be concluded that neonatal rats are around ninetimes more sensitive than adults to certain OPs, and 20 times more sensitive than adultsto certain pyrethroids (Sheets, 2000). For both of these groups of pesticides the highersusceptibility appears to be due to immature development of enzymes involved in detoxi-fication.Other acute toxicity studies in rats using lower acute doses have also shown age-relateddifferences in sensitivity. For example, at one-half the LD10, young animals are more sen-sitive to cholinesterase inhibition by chlorpyrifos, with newborn animals about threefoldmore sensitive than juveniles and nine times more sensitive than adults (Pope, 2001). Ratpups are also more sensitive than adults to cholinesterase inhibition by acute doses ofdiazinon, which has been correlated with their lower activities of detoxifying carboxyles-terases and A-esterases (Padilla, et al. 2002). In contrast, neonatal rats are not moresensitive than adults to cholinesterase inhibition by acute doses of dimethoate or meth-amidophos (Meyers, 2001, Moser, 1999).Whitney et al. (1995) found that administration of chlorpyrifos to neonatal rats at 1 day ofage (approximately 7 months of gestation in humans) produced significant inhibition ofDNA and protein synthesis throughout the brain. The authors interpreted this as a target-ing of the developing brain during the critical period in which cell division occurs. Most
93
studies on the developmental effects of OP pesticides use chlorpyrifos; therefore, it is notclear whether developmental neurotoxicity is a class effect. The US Environmental Pro-tection Agency has concluded on the basis of currently available data that, as a class,OPs are not developmental neurotoxicants at doses below those that produce cholines-terase inhibition (US EPA, 2002).
IV.1.2.3. Health effects following repeated, lower exposures to pesticides
HumansThe potential for pesticides to cause low-level toxicity is a controversial area of toxicologyand is an area that is extremely difficult to study. It is hampered by a number of factorssuch as difficulty in measuring actual exposure levels, confounding due to simultaneousexposure to a range of different pesticides and other chemicals, length of time betweenexposure and appearance of symptoms, and the diverse nature of the symptoms ob-served (POST, 1998). To compound the difficulties in studying this area, there is a pau-city of research in children, mainly because of the ethical issues involved.There are no data in children to support or refute the hypothesised health effects ofchronic, low-level (doses that do not produce clinical signs of toxicity) pesticide exposure.Most human studies are epidemiological studies of individuals exposed occupationally.Where children have been studied, there are problems with exposure characterisationand confounding factors. However, on the basis of various sources of information notpertaining to pesticides, it seems possible that children are, in some circumstances andfor some chemicals, more vulnerable than adults (e.g., as mentioned above, because ofwindows of vulnerability in developing organ systems etc.).Evidence that neonates are more sensitive than adults to OP and pyrethroid pesticides islargely based on studies that compare toxicity at acute lethal doses. This greater suscep-tibility is likely to be due to limited metabolic capacity rather than an inherent difference inthe sensitivity of the target tissues.
Laboratory animalsMost information on chronic effects of any chemical tend to come from studies on labo-ratory animals. These generally use comparatively high doses and do not start admini-stration of the test compound until the animals are several weeks old. Studies using new-born rats are of questionable relevance to human newborns because the developmentalperiods and milestones are not correlated. As a result, extrapolation of the results of labo-ratory animal studies of pesticides to human infants and children is difficult.In contrast to the studies of pesticides’ acute toxicity, higher sensitivity of adult animals tothe effects of repeat doses of chlorpyrifos (by a factor 2 to 5 compared to young animals)have been reported,,at least for some endpoints (acetylcholinesterase inhibition but notbodyweight changes). Zheng et al. (2000) reported that chlorpyrifos produced a minimaldifference in cholinesterase inhibition in newborn rats compared to adults following re-peated dosing, with a 1.5-fold increase in brain cholinesterase inhibition seen innewborns based on ED50 levels. Smaller increases were seen in newborn rats comparedto adults administered chlorpyrifos by subcutaneous injection for 7 days, and no age-related differences were seen after 14 days’ treatment (Liu et al., 1999). In contrast,newborn rats were more sensitive to methyl parathion than adults using the same proto-col (Liu et al., 1999). Rats exposed to dimethoate in utero, through lactation, and then bygavage until postnatal day 21 showed no differences in brain and plasma cholinesteraseinhibition when young and adult animals were compared (Meyers, 2001), although ratsexposed similarly to methyl parathion showed that young rats were more sensitive thanadults (Beyrouty, 2002).

94
In a review of neonatal sensitivity to OPs and pyrethroids, Sheets (2000) concluded that,for OPs, adults were affected to a greater extent at a given dietary level than was theneonate or weanling. For pyrethroids, neonates were more sensitive to an acute lethaldose, but not to the much lower levels that would be relevant to human dietary risk as-sessment.In the case of OPs, the smaller age-related differences in pesticide toxicity observed fol-lowing lower, repeated doses as compared to higher, acute doses is likely to be due tothe ability of developing animals to recover more quickly from cholinesterase inhibitionbecause they can synthesize cholinesterases faster than adults (Ashry et al., 2002, Abu-Qare et al,. 2001). This conclusion is supported by the observations of Liu et al. (1999),who found that repeated chlorpyrifos exposures were associated with relatively similardegrees of cholinesterase inhibition among age groups during dosing but found moreextensive inhibition in adults after termination of exposures.Discrepancies among studies might be explained by different exposure schedules anddoses, with higher acute doses producing more toxicity in younger animals than lower,repeated doses. Studies in which young animals were found to be more sensitive to thecholinesterase-inhibiting effects of OPs were conducted using doses that are as much as100,000 times greater than environmental exposure levels (US EPA, 2002). It is plausiblethat high doses of OPs overwhelm the developing rat’s immature detoxification mecha-nisms. Studies conducted at more environmentally relevant doses, which would be lesslikely to overwhelm the young rat’s ability to detoxify OPs, show that young animals are ofsimilar sensitivity to adults (Mattsson et al., 2000).
IV.1.2.4. Other factors for considerationMost commercial products that are used as pesticides are marketed as formulations andtherefore contain vehicles and other chemicals added to give the pesticide optimumproperties for the desired use. These added compounds cannot be assumed to be inert.Indeed, the toxicological properties of the added ingredients may in some instances bemore important than those of the pesticide active ingredient. The toxicity of the active in-gredient may be modified by differences in formulation. Solvents are particularly impor-tant; they may increase or decrease the potential toxicity of a pesticide by altering its ab-sorption. Hence the toxicity of each compound should be tested (or at least a risk as-sessment conducted) for every formulation in which it will be used (Hayes & Laws, 1991).
IV.1.3. How should age-related differences in susceptibility be accoun-ted for in pesticide safety assessment?
IV.1.3.1. Dose considerations - ToxicokineticsChildren can activate or detoxify substances at different rates than adults. This affectseffective dose. More precisely, newborns have immature metabolic capacities and theirrenal excretion capacity is no fully developed. The consequence of these differences maybe a higher pesticide body-burden. The situation seems to be opposite for older children.On a bodyweight basis body-burden seems to be somewhat lower compared to adultsdue to a higher rate of renal excretion. But these generalizations give only central ten-dency estimates. The actual behaviour of single substances may deviate from this.Development of the various metabolic systems is relatively well characterised and on thatbasis one can infer whether children's effective doses of a particular substance will belarger or smaller than that for adults' for the same exposure. In the absence of toxicoki-netic data the hypothesis that children are more susceptible than adults should be givencareful consideration.

95
IV.1.3.2. End-point considerationsToxicity end-points can be childhood-specific, or can occur later in adult life as a conse-quence of childhood exposure. Relevant end-points can be neurologic, immunologic,cancer, or other target-organ toxicity.Due to phases of rapid organ development children may be more susceptible than adultsto a substance’s toxic effects. These differences in susceptibility may be quantitative innature (effects may occur at lower doses than in adults) or qualitative (effects will not oc-cur at all in adults). Typical example from the drug area include the effects of tetracyclineon children's teeth and bones, and of fluoroquinolones on bones.There are basic toxicity data available for most pesticides and many have an extensivedatabase. Such data provide indications on the potential mode of action and target or-gans of toxicity and should be used to infer likely developmental toxicity. They can alsobe used to guide a tiered approach to further data generation. Available data should bescreened for organ toxicities especially critical for children. New tests, like the develop-mental neurotoxicity test (DNT), may be helpful in this respect, although whether DNTtests provide more information for pesticide safety assessment than can be obtained fromcarefully conducted standard developmental toxicity tests is controversial.
IV.1.3.3. Acute vs. chronic effectsPesticide exposures can produce both acute and chronic effects and it may not be possi-ble to generalise from one type to the other. This conclusion is corroborated by the chlor-pyrifos example discussed earlier. If both types of exposure (acute vs. repeated) are im-portant experimentally or environmentally, both should be evaluated for risk assessment.
IV.1.3.4. Risk management contextWhen data on age-related susceptibility differences are available, their use should beconsistent with risk management goals.
- Are separate ADIs sought? Some members of the panel were of the opinion thatseparate ADIs for children are not helpful, because ADIs should generally be ap-plicable for the whole population and children are a part of it. (In most cases dataare lacking for a meaningful differentiation anyway).
- Are larger margins of exposure needed for children? The risk management goalsought and the biological data in support of the assessment strategy should beclearly stated when choosing the margin of safety or the size of uncertainty orsafety factors.
- Should dose-response assessments be adapted to account for age-related differ-ences? Where meaningful age-related dose-response data are available, theyshould be used.
- Should such information on age-related differences be included in stochasticanalyses? In the opinion of some panel members, available biological data (ontoxicokinetics, on observed differences between age groups seen with drugs)should be used to describe distribution functions for children. These distributionfunctions may be an important input for probabilistic risk assessment methods(Vermeire et al., 1999). These methods can provide information useful to defineappropriate levels of protection.
96
IV.1.4. Data Available / Data NeededStandard regulatory toxicity protocols start with "teenage" animals instead of infants, donot characterise age-related differences in susceptibility, and use high doses instead ofenvironmentally relevant doses (although susceptibility differences are often dose-dependent).The following information sources are available and should be fully used when assessinga substance’s potential risks to children:
- Literature searches- Mining of human data for information on:- Therapeutic use of pesticides,- Chemical class effects, by analogy to pharmaceuticals,- Better use of poison-centre data.
The following lines of action could be explored:- Extend existing study protocols to evaluate specifically very young animals,- Obtain more information about low-dose chronic (sub-clinical) effects in humans,- Set-up dedicated surveillance systems for children poisoning accidents,- Evaluate in greater details he differences due to age on bone marrow toxicity, can-
cer, endocrine effects, and allergenicity from pesticide exposures,- Improve the exposure data used in epidemiological studies (and their age specific-
ity).
IV.1.5. ReferencesAbu-Qare AW, Abou-Donia MB, 2001, Inhibition and recovery of maternal and fetal choli-
nesterase enzyme activity following a single cutaneous dose of methyl parathion anddiazinon, alone and in combination, in pregnant rats. J Appl Toxicol 21:307-316.
Ashry KM, Abu-Qare AW, Saleem FR, Hussein YA, Hamza SM, Kishk AM, Abou-DoniaMB, 2002, Inhibition and recovery of maternal and fetal cholinesterase enzymes follo-wing a single oral dose of chlorpyrifos in rats. Arch Toxicol 76:30-39.
Beyrouty P, 2002, A study on the effects of orally administered methyl parathion on choli-nesterase levels in adult, juvenile, and neonatal rats. ClinTrials BioResearch Ltd.,Senneville, Quebec. Lab Project Number: 97558, February 26, 2002, MRID 45656501.
Carlson L, Ho P, Smith M, Reisch J, Weitman S, 1996, Pediatric phase I drug tolerance: areview and comparison of recent adult and pediatric phase I trials, Journal of PediatricHematology - Oncology, 18:250-256.
Eskenazi B, Bradman A & Castorina R, 1999, Exposures of children to organophophatepesticides and their potential adverse health effects, Environ Health Perspect,107(suppl 3):409-419.
Ginsberg G, Hattis D, Sonawane B, Russ A, Banati P, Kozlak M, Smolenski S, Goble R,2002, Evaluation of child/adult pharmacokinetic differences from a database derivedfrom the therapeutic drug literature, Toxicol Sci 66:185-200.
Glaubiger D.L., von Hoff D.D., Holcenberg J.S., Kamen B., Pratt, C., Ungerleider, R.S.,1981, The relative tolerance of children and adults to anticancer drugs, Frontiers ofRadiation Therapy and Oncology, 16:42-49.
Hattis D., Russ A., Ginsberg G., Banati P., Kozlak M., Goble R., 2001, Newborns, olderchildren, and adults – comparisons of pharmacokinetics and pharmacokinetic variabi-

97
lity Human Interindividual variability in parameters related to susceptibility for toxic ef-fects. http://www.clarku.edu/faculty/dhattis/.
Hayes WJ.Jr. & Laws ER.Jr., eds, 1991, Handbook of Pesticide Toxicology, Volume 1,General Principles, London, UK, Academic Press.
Liu J, Olivier K, Pope CN, 1999, Comparative neurochemical effects of repeated methylparathion or chlorpyrifos exposures in neonatal and adult rats, Toxicol Appl Pharma-col, 158(2):186-96.
Marsoni S., Ungerleider R.S., Hurson S.B., Simon R.M., Hammershaimb L.D., 1985, To-lerance to antineoplastic agents in children and adults, Cancer Treatment Reports,69:1263-1269.
Mattsson JL, Maurissen JP, Nolan RJ, Brzak KA, 2000, Lack of differential sensitivity tocholinesterase inhibition in fetuses and neonates compared to dams treated perinatallywith chlorpyrifos, Toxicol Sci 53:438-446.
Meyers D, 2001, Dimethoate effects on cholinesterase in the CD rat (adult and juvenile)by oral gavage administration, Huntingdon Life Sciences, Ltd., Suffolk, England, LabProject Number: CHV/070: 012226, MRID 45529702.
Moser VC, 1999, Comparison of aldicarb and methamidophos neurotoxicity at differentages in the rat: behavioral and biochemical parameters, Toxicol Appl Pharmacol.157(2):94-106.
National Research Council, 1993, Pesticides in the Diets of Infants and Children, Wa-shington DC, USA, National Academy Press.
Padilla S, Sung H-J, Jackson L, Moser V, 2002, Development of an in vitro assay whichmay identify which organophosphorus pesticides are more toxic to the young, Pre-sented at the Society of Toxicology meeting, March 2002.
Pope C, 2001, The influence of age on pesticide toxicity, In Handbook of Pesticide Toxi-cology (ed. R. I. Krieger) Volume 1, Principles Chapter 41, Academic Press, pages873-885.
POST, 1998, Organophosphates (POSTnote 122), London, UK, Parliamentary Office ofScience and Technology.
Renwick A.G., 1998, Toxicokinetics in infants and children in relation to the ADI and TDI-Food Additives and Contaminants, 15:17-35.
Sheets L.P, 2000, A consideration of age-dependent differences in susceptibility to orga-nophosphorus and pyrethroid insecticides, Neurotoxicology, 21:57-64.
Smialowicz R.J., Riddle M.M., Rogers R.R., Luebke R.W., Copeland C.B., 1990, Immu-notoxicity of tributyltin oxide in rats exposed as adults or pre-weanlings, Toxicology,57:97-111.
Smialowicz R.J., Riddle M.M., Rogers R.R., Rowe,D.G., Luebke R.W., Fogelson L.D.,Copeland C.B., 1988, Immunologic effects of perinatal exposure of rats to dioctyltindichloride, Journal of Toxicology and Environmental Health, 25:403-422.
US Environmental Protection Agency (EPA), 1999, Memorandum from Jerome Blondell,Office of Pesticide Programs, Health Effects Division to Dennis Utterback, of the Officeof Pesticide Programs, Special Review and Reregistration Division, “Review of PoisonControl Center Data for Residential Exposures to Organophosphate Pesticides, 1993-1996.” February 11,1999. Office of Pesticide Programs, Office of Prevention, Pestici-des, and Toxic Substances, Washington, DC.
US Environmental Protection Agency (EPA), 2002, Revised OP Cumulative Risk As-sessment – 6/11/02. Office of Pesticide Programs. Office of Prevention, Pesticides,and Toxic Substances, Washington, DC.

98
Vermeire T, Stevenson H, Peiters MN, Rennen M, Slob W, Hakkert BC, 1999, Assess-ment factors for human health risk assessment: a discussion paper, Critical Reviews inToxicology, 29:439-490.
Whitney KD, Seidler FJ, Slotkin TA, 1995, Developmental neurotoxicity of chlorpyrifos:cellular mechanisms, Toxicol Appl Pharmacol, 134:53-62.
Zheng Q., Olivier K., Won Y.K., Pope C.N., 2000, Comparative cholinergic neurotoxicityof oral chlorpyrifos exposures in preweanling and adult rats, Toxicological Sciences,55:124-132
Open Presentation

99
IV.2. Working group 2: Modeling exposure of children to pesticidesChairperson: Michael SchümannRapporteur: Jacqueline van EngelenCo-Rapporteur: Odile MekelFurther working group members: Ulrich Franck, Agneta Olsson, Haluk Özkaynak,Dirk Wintermeyer
Open Presentation
IV.2.1. Scenarios and models of exposure estimation, needs for data,uncertainty and variability.
A lot of information about modeling procedures for pesticide exposure in general and forchildren in particular is scattered among different (international) institutions (e.g. US EPA,European Union, biocide regulation etc.). There is a strong need to get an overview onwhich institutions, governments etc. have information about pesticide exposure modelingand bring them together and share there knowledge. The BgVV-workshop is a good start,a follow-up is urgently required.
IV.2.2. Exposure scenarios and modelsThe working-group agreed on using the risk assessment paradigm of the National Re-search Council (1983). The paradigm includes the components: hazard identification, ex-posure assessment, dose-response assessment and risk characterization. The discus-sion in the working-group focused on the identification of hazardous exposure scenariosand exposure assessment/modeling.Children can be exposed to pesticides, especially in the residential environment. Thereare a number of children’s characteristics, which influence exposure.- physiological characteristics (see WG 1)
larger surface area relative to bodyweight;higher basal metabolic (larger surface area and growth);permeability of the skin, highest at birth, similar to adults after 1 year;development of subcutaneous layer of fat (2-3 months until early toddler period);lung alveoli continue to develop until adolescence;absorption and permeability in the gut are regulated by the body to provide nutri-tional needs that vary with age (e.g. Ca absorption)
- behavioural development (see WG 4)mouthing behaviour;soil ingestion;contact with floor/carpet
- physical activitieslocations where a child spends time determine the exposure media that may becontacted and affect the activity level that determines contact rate with those me-dia; additional variability among children of similar developmental stages is asso-

100
ciated with seasonal and geographic differences in activity patterns and the use ofindoor and outdoor space
- diet and eating habitsnewborns breast milk or infant formula;infants and young children: more fruit and milk, phases of preferred food;eating with hands, eat foods fallen on the floor.
All these characteristics should be taken into account. For modeling exposure to pesti-cides, many exposure scenarios and sub-scenarios can be set up. The question arises,which scenario will be the most relevant one? This depends on the product characteris-tics (contamination, concentration and formulation), product use (application type andform, frequencies, duration), exposure pathways (breast-feeding, inhalation, food intake,dermal contact etc.), and exposure routes (oral, dermal, inhalation).In every assessment all three possible exposure routes (oral, dermal and inhalatory)should be examined. Not in every case all three routes are relevant, e.g. in the case ofexposure to pesticides via food, the oral route will be the main route of exposure. In caseof exposure to a flea-spray that has been used to treat a carpet, children that crawl onthat carpet can be exposed dermally, via the oral route (hand-to-mouth contact), and in-halatory (evaporation of the active ingredient). In contrast to the oral and inhalation route,the dermal exposure assessment methodology is not yet well developed. Apart from theabove rather straightforward sources of exposure, there might also be more ‘hidden’sources, e.g. house dust, which can form a sink for numerous chemicals.Models for estimation of the exposure to pesticides should be build in general way withthe opportunity to incorporate different exposure scenarios and sub-scenarios. In thisway, scenario-driven exposure assessment may be possible for the heterogeneous groupof pesticides. In this context, the complexity of models is ruled by the amount of input pa-rameters, but not by the equations used, or their software-programming. Typical outputsof these models include both aggregate exposures as well as dose of chemicals and itsmetabolites in blood and or urine.

101
Table 1: Potential exposure pathways in exposure modeling for pesticides
Inhalation Non-dietary
• Indoor residential air • Hand to mouth
• Outdoor residential air • Object to mouth
• Indoor at school/day care • Hand to object to mouth
• Indoor other • (Pet contact – (in)direct)
Dietary ingestion(commercial & homegrown) Dermal
• Solid goods • Hand to hard surfaces
• Liquid goods • Hand to texture surfaces
• Water • Clothing
• Beverages • Pet contact
• Milk • Other
• Other (Good contacting cont. surfaces)

102
Exposure models for pesticides already exist, e.g. CARES1, Lifeline2, SHEDS3. Thesecomputer models are developed for the North American situation and currently subject toevaluation (Rosenheck, 2002 this Report: § III.4.2). In the Netherlands, CONSEXPO4 isdeveloped at the RIVM (National Institute of Public Health and the Environment) to pro-vide estimation routines for exposure to consumer products, including biocides (VanVeen, 2001)The model must incorporate potentially relevant exposure pathways for pesticides. Ex-amples of these pathways, grouped by exposure routes are shown in Table 1.
IV.2.3. Modeling at different degree of abstraction, modularizationExposure assessment can be done at different stages of abstraction, depending on thegoal of the assessment. As suggested by different agencies (EPA, 1997; 1998a,b) andothers (van Drooge & van Haelst, 2001), a tiered approach is recommended and ap-proved by the working-group as an appropriate approach. General consensus wasreached on the necessity of age-dependent modeling. Starting with simple models, youend with sophisticated models and/or human-biomonitoring surveys to get an exposureestimate (Fig. 1).The exposure scenarios and models must at least be able to address the reasonablemost exposed population (RME) and the average exposure, which includes a cohort ap-proach. It may be necessary to distinguish subgroups with regard to age, sex, social eco-nomic status (SES), with regard to regional differences (e.g. in Europe) or to housingtypes (carpet vs. bare floors, hygiene standard, urban vs. suburban, rented vs. privateflats).
IV.2.3.1. Tiered approachFor modeling residential exposure a tiered approach is suggested. In tier 1 a screeninglevel analysis is performed, including all routes and all pathways. If there is reason forconcern, a more sophisticated model is needed. The question is, however, how muchdetail should be included. As a tier 2, a macro approach can be followed, in which e.g.more information on time distribution is included. If there is still reason for concern, furtherrefinement is needed, resulting in a micro approach. In case it is relevant, e.g. when a pa-rameter is dominant, a probabilistic approach is preferred. However, if information on dis-tribution is not available, use of a point estimate is recommended.
IV.2.3.2. Probabilistic modelingAt the screening level (tier I) the use of deterministic modeling techniques is commonpractice: For each of the model variates single point estimates are used. At higher tiers,probabilistic techniques may be appropriate in order to model the exposure on distributionbasis. In contrast to the deterministic approach, full statistical distributions of the modelvariates are used. Probabilistic modeling offers the opportunity to characterize the vari-ability in exposure estimates. The use of probabilistic techniques in higher tiers of model-ing is encouraged by the working group. These techniques offer the opportunity to modelthe variability of the exposure estimates and provide information about the distribution of
1 developed by Infoscientific.com
2 developed by Lifeline Group
3 Stochastic Human Exposure and Dose Simulation Model (SHEDS), developed by EPA's Office of Research and Development National Exposure Research Laboratory (see Özkaynak et al., 2002)
4 CONSumer EXPOsure models

103
the exposure in the population (Mosbach-Schulz, 2002). Further more, these techniquesmay also applied for modeling true uncertainty apart from variability (Mekel, 2002). Thetwo dimensional modeling of variability and uncertainty however is not an easy task, moreexperience is needed.
IV.2.3.3. Age-dependent modelingWith regard to children at least the following age groups should be distinguished: 0-0.5,0.5- 1, 1-3 and 3-5 years. This differentiation is based on the differences in developmen-tal status, behavioral aspects as well as changes in time- and activity-patterns of childrenat different ages. Currently, most of the exposure models focus on children at age of 1year and beyond.
Figure 2: Degree of abstraction, modularisation of exposure models
• RMEa
• average exposure• distribution based• time/season depended• micro and macro exposure model
Screening level approaches bypathways - Tier 1
Quality of data: N, representativeness, availability, measurement quality
Pharmacokinetic parameters• Distribution• Metabolism• Excretion
Human-Biomonitoring surveys & surveillance
}
a Reasonable Most Exposed
IV.2.3.4. Data quality
The quality of the data with respect to substances and products, exposure factors andbehavior related data, depends on a number of factors, e.g. sample size, representative-ness, availability, measurement quality.Best professional judgement is needed for a lot of exposure variates (input parameters),because data are lacking. E.g. how often a child will enter rooms where pesticides whereapplicated. Some data may be collected by conducting appropriate studies. Other datamay be if at all, obtained by large research programs. However, the data quality will al-ways be subject to professional judgement.

104
IV.2.3.5. Data availabilityRegarding the availability of data for exposure modeling of pesticides, following situationscan occur:• critical data on a product, chemical or exposure scenario non existent• some data exits, but limited in quality or certain pathways• some data exits, but proprietory (i.e. not available to most researchers or analysts)• comprehensive database with variable type and quality.It is recommended to identify critical data needs from Tier I, literature and other assess-ments, and collect and share the data needed with collaborative/consultative researchinvolving private and public sector in timely manner.
IV.2.4. Evaluation and validation of exposure modelsThere is a strong need for evaluation or validation of existing exposure models. Withoutgoing into detailed discussion about the differences between validation, calibration andevaluation, the working group feels that efforts need to be made to answer the question'How can we be more comfortable about the model?'. By doing model comparison, com-parison for groups (subpopulations, population) and parameter calibration, a stepwise re-finement of the exposure models may be possible. Human biomonitoring may be used forevaluation purposes, but the expectations must not be too high. Human-biomonitoringstudies give information about the total absorbed dose. Validation of total absorbed-dosemodels is complicated resp. difficult, because the models look only at a part of the totalexposure. For example, air exposure models may perhaps be ‘validated’ by personalmonitoring devices.Figure 3 illustrates the relation between the different levels of model evaluation and com-parison.
Figure 3: Different levels of model evaluation
• Comparison for groups, pred. cdfsubpopulation x, population empirical cdf
• central tendency• variation• tails of distr.
...?
• Comparison individual level
envir. personal exposure dose assessm. humansampler - total biomon.
- absorbed
multi- - input pharmaco-media - model struct. kinetics ?approaches - algorithms
- predictions
• Model comparison

105
IV.2.5. Overview on country-specific approaches
IV.2.5.1. The NetherlandsThe risk assessment for product registration of pesticides and new chemicals is based ona reasonable worst case scenario (point estimate). For the exposure modeling, fact-sheets on default scenarios and default exposure factors are developed, e.g. for paintuse. The exposure model starts from the product or substance.
IV.2.5.2. US EPAInput of the exposure models for pesticides are field measurements and not necessarilyproducts or substances. US EPA has developed sophisticated models for compoundswith a short half-life-time addressing acute exposure situations. EPA follows a tiered ap-proach: tier 1: screening level analysis by exposure pathway. If there is a concern-> tier2: by pathway.
IV.2.5.3. SwedenFor product registration, no (sophisticated) exposure modeling is done. The evaluation isbased on hazard identification. As a part of the evaluation, the new product is comparedto existing products on the Swedish market with similar effect (treatment), but with knownminimal health effects. The new product/substance must have an extra benefit, otherwiseit will not be registered in Sweden.
IV.2.5.4. GermanyExposure assessment in the context with risk assessment of new and existing chemicalsis performed to the rules of the Technical Guidance Documents (TGD, 1996). They arebased on a worst case concept very close to the NL-concept. For pesticides, intake rates(accepted daily dose) are deduced from hazard data using safety factors to control expo-sures from contaminated food. Germany enforces the research for new methodologies ofrisk assessment, particularly studies of usefulness of approaches that consider variabilityand uncertainty on the basis of distribution dependent analyses (probabilistic approach).Although pesticide products and, from 2002 biocidal products have to be registered, anationwide product register is missing.
IV.2.6. ConclusionsThere is a strong need to get an overview on which institutions, governments etc. haveinformation about pesticide exposure modeling and bring them together and share thereknowledge. The BgVV-workshop is a good start, a follow-up is urgently required.
IV.2.7. References1 Drooge, van, H.L., van Haelst A.G. (2001): Probabilistic exposure assessment is es-
sential for assessing risks - summary of discussions. Ann Occup Hyg 45, Suppl 1:S159-62.
2 EPA (1997a): Policy for use of probabilistic analysis in risk assessment. Science Po-licy Council. Washington, D.C.
3 EPA (Environmental Protection Agency) (1998a): Supplemental guidance to RAGS:The use of probabilistic analysis in risk assessment. Part E. Working Draft. February1998. Office of Solid Waste and Emergency Response.

106
4 EPA (Environmental Protection Agency) (1998b): Guidance for Submission of Pro-babilistic Exposure Assessments to the Office of Pesticide Programs. Office of Pesti-cide Programs, U.S. EPA Washington, D.C.
5 Mekel, O. (2002): Uncertainty and variability of exposure data. This report.6 Mosbach-Schulz, O. (2002): Deterministic versus probabilistic estimation of expo-
sure? This report7 National Research Council (1983): Risk Assessment in the Federal Government,
Managing the Process. National Academy Press, Washington DC.8 Özkaynak, H., Zartarian, V., Xue, J., Furtaw, E., Rigas, M. (2002): Modeling expo-
sures to pesticides: Approaches and modeling needs. This report.9 Rosenheck, L. (2002): Requirements for models used for exposure assessment to
pesticides. This report.10 TGD: Technical guidance document in support of commission directive 93/67/EEC
on risk assessment for new notified substances and commission regulation (EC) No1488/94 on risk assessment for existing substances. Part I, (1996). Office for OfficialPublications of the European Communities, Luxembourg
11 Van Veen, M.P. (2001): CONSEXPO 3.0, Consumer exposure and uptake models.Report 612810 011, RIVM Bilthoven, The Netherlands (with CD-ROM).
Open Presentation

107
IV.3. Working group 3: "Residential uses of pesticides"Topics to be addressed: Identification and characterisation of main pesticide uses in hou-seholds, direct and indirect uses.Chairperson: Curt LunchickRapporteur: Lars NeumeisterCo-Rapporteur: Katinka van der Jagtfurther working group members: Wolfgang Brehmer, Alex Capleton, Jutta Herrmann,Gabriele Leng, Franz Stauber
Open PresentationA report of group discussion and preliminary conclusions.Note: Not included in the group discussions were following exposure sources:• ambient air and contaminated soil• food and beverages
IV.3.1. GoalPreparation of a paper addressing "Residential uses of pesticides" - Identification andcharacterisation of main pesticide uses in households including professional and home-owner applications as well as indirect uses e.g. treated carpets
IV.3.2. IntroductionExposure potential of homeowners and professionals are different during and after anapplication. There is a clear distinction between an application done by a professionalpest control operator (PCO) and an application done by a homeowners.• Professionals (ideally) wear protective clothing, are trained, apply the appropriate pe-
sticides and amounts and use the correct application equipment.• Homeowners are mostly not at home while professional applicators treat a home.• Post application exposure of the homeowner is the major concern in this case!Application conducted by homeowners are of potential exposure concern since:• Homeowners typically wear no protective clothing, are not trained, do not handle the
application equipment correctly, have difficulty accurately interpreting application ra-tes correctly, and do not minimize drift. Homeowners are directly exposed duringtreatment but post application exposure of the homeowner and his/her family is ofgreat concern too.
Another distinction must be made regarding indoor and outdoor uses. Pesticide used in-door do not degrade under the influence of UV light and do not leach into the soil or runoff after precipitation. They often remain within the house, even if they may circulate withdust and air.Examples of post-application exposure:- Dog as exposure source: secondary contact, tertiary contact (etc.) possible by petting
the dog, the dog sitting on the couch, house hold dust contaminated by dog- Lawn as exposure source, also 'track in' (from outdoor to indoor) identified as an im-
portant route

108
- Dermal, inhalation, and oral (children's hand to mouth behaviour) contact followingcarpet application
- Dermal, inhalation, and oral (children's hand to mouth behaviour) contact followingprofessional or homeowner application via house dust, air
- Inhalation exposure from emenators
IV.3.3. Availability of residential pesticide use and exposure dataThe first question addressed by the group was if there are any use data for pesticide usein households available. Industry states that it is hard to obtain these data and that onlymarginal data are available, as it costs a lot of money and a lot of time to develop. As firststeps in accumulating this information the following is suggested:1. Identify any existing data from EU Member State surveys or from marketing surveys
of purchasing patterns, or from sales records of pesticide products.Thereby recognize differences between consumer products and professional products.Different residue limits and different methods for obtaining the data are necessary toaddress this issue.2. Define uses and variables indoor and outdoor that are important with regards to ex-
posure.3. In addition, focus on efficient data development, as there are limitations on money
and manpower.4. Get use patterns established, as collection of pesticide use information is essential to
assessing exposure and risk.The suggested approach is to begin with the most heavily used scenario to focus the datadevelopment. A survey launched in the US indicates that industry's initial focus ‘Lawn andGarden use’ was not the most frequent use category (insect repellents were).A few questions are:• Who uses what?• How is it used?• When is it used?• Where is it used?
For setting priorities the following is suggested:
a. Search for and obtain existing dataThe use of sales/retail reports is suggested to define and narrow regions of heavy use toguide biomonitoring. User surveys are suggested to define individual habits and patterns.The use of pest control company reporting/data is also encouraged. In addition, existingsources (government required application records, commercial sales data) should beidentified and evaluated (e.g. records of professional applicators).b. Evaluate the dataFrom the user survey data the use patterns of highest concern could be defined, basedon incidence of for example fogging versus bait and frequency data. A pilot and possiblya statistically representative survey of consumer use patterns is needed for use with ex-posure data for modeling (e.g. REJV survey in U.S. statisticians say for the population
109
280 million you need 1000 surveys/respondents at a National level, for Europe this shouldbe discussed with statisticians, what population needs to be monitored).From the retail reports the regions of highest concern could be identified from informationon the use of certain pesticides. This permits categorising use scenarios, patterns andsources of exposure for development of exposure data collection and product types (alsofor future scenarios).c. Identify data gapsBiomonitoring could potentially be very important to fill in data gaps on exposure.Recommendation: Set up a pesticide biomonitoring database that can be used to identifythe biomonitoring dose range applicable for individual pesticides.
Advantages of biomonitoring:• Measure the internal dose, gives information on body burden (of also children)• Provides information on duration of measurable absorbed dose to delineate duration
of potential environmental monitoring indoors• Identifies the magnitude of problemDisadvantages of biomonitoring:• No distinction between the different exposure sources• Potential appearance sensitivities involving the monitoring of people in general and
children in particular
First steps to create a pesticide specific biomonitoring database:1. Priority pesticides and inerts should be identified (not always the pesticide is the pro-
blem, sometimes solvents are more of a problem) from feasibility standpoint and whatis being used by the consumers and what poses a threat human health. In addition,components which are considered representative (environmental fate, exposure pat-terns) for classes of components or other components should be chosen.
2. The problem of proprietary versus public data needs to be resolved, it has to be ajoined effort of industry, EU and research institutes as central EU reporting should bethe goal. Reporting should be on the “chosen few” defined to be representative forfuture components.
3. Biological monitoring (Urine) provides an important first step in defining the range ofabsorbed doses of pesticide active ingredients or their metabolites and inerts or theirmetabolites in the EU population. Data need to be collected and entered in a databa-se.
Specifics regarding approaches, study designs, reference rates, data sharing should beaddressed in the near future by an additional working group.
d. Use the above points to set (new) priorities and/or develop additional data.e. Use conclusions to guide development of additional data

110
IV.3.4. ConclusionThe following road map is recommended for addressing consumer exposure.
In order to focus research, existing biomonitoring data and pesticide use data (retailand/or survey data) are utilised to define use patterns and regions of high concern. Tar-geted monitoring then delivers dermal, inhalation, oral and environmental residue data.All data go after validation into models to predict exposure.Application of the data in probabilistic models could be another procedure to estimate ex-posure.
Open Presentation
111
IV.4. Working group 4: Behavior of children as a factor determiningexposure
Chairperson: Steve OlinRapporteur: Bea SteenbekkersCo-Rapporteur: Natalie FreemanWorking group members: Martha Harnly, Olaf Mosbach-Schulz, Emanuele Pydde,Thomas Rüdiger, Bettina Schmidt-Faber, Bärbel Vieth
The charge to the Working Group was to consider the behaviors of children that lead totypical exposures to pesticides. This includes those behaviors that differentiate childrenfrom adults (e.g., breast feeding, crawling, mouthing) and also children’s time budgets(i.e., frequency and duration of behaviors that may lead to exposures).A partial bibliography of pertinent references is included as Section II.4.5.
IV.4.1. IntroductionThe statement that “children are not little adults” has become the mantra for research intochildren’s exposure to environmental contaminants. Children differ from adults in their ac-tivity patterns, where they spend time, how long they spend time in various environments,and in the types of microactivities in which they engage. One can go further and state thatinfants are not toddlers who, in turn, are not the same as school-aged children or ado-lescents. It is necessary to characterize the behaviors of each subcategory of childrenand how these behaviors may uniquely expose them to pesticides.
IV.4.2. Children as a populationIn evaluating behaviors contributing to children’s exposure to contaminants, several pa-rameters need to be kept in mind. These include the prevalence and frequency of the be-haviors, whether the behaviors are age dependent, how long the behaviors occur as indi-vidual events, and the duration of occurrence of multiple events during the life of the child.In addition, variations in behaviors and their occurrences, and the resultant exposure toenvironmental contaminants, may be influenced by regional, cultural, temporal, and birthorder factors.
IV.4.2.1. Discrimination of specific age categories• Which age groups should be addressed for exposure assessment?
Based upon discussions at a workshop in July 2000, the US EPA has drafted a minimumset of 10 childhood age categories for exposure assessment. The breakdown includes 5“fine” subdivisions for children less than 12 months old. These “fine” subdivisions, pre-natal, neonatal less than 1 month, early infancy, mid infancy, late infancy, are less a re-sult of differences in the behaviors of the children in these age groups than of anatomical,physiological and functional changes occurring during the first year of life.Other options for creating age categories might be dietary habits (nursing, baby food,adult food limited variability, and adult food adult type variability) and activity patterns(mobility, mouthing habits, hygiene).

112
Dietary habits have an important influence on children’s exposure to pesticides. Duringthe nursing period, the child is exposed primarily to pesticides in the water compartmentof milk, or pesticides in the fat compartment that have been mobilized from the mother’sfat stores. Commercially available baby food in some countries is strictly monitored forpesticides and hence is less likely to be a source of exposure for the child. In contrast,some adult foods may have measurable pesticides. When the child starts eating adultfood, the range in diet tends to be limited, and the child may be more exposed to somepesticides than if the child ate a wider range of foods.Activity patterns of the child may influence where and to what extent the child is exposedto pesticides. Infants mouth a great deal, particularly while teething, yet their lack of mobi-lity limits their access to dusts and soils that contain contaminants. Young toddlers stillexhibit mouthing behavior and their greater mobility increases their potential exposure.Several time/activity studies are available (Germany, US-NHAPS, US-NHEXAS, US- Ca-lifornia Air Resources Board). There are, however, few data available on the time/activitypatterns of very young children.
• Are there characteristic exposures for specific age groups of children?Exposures to children other than toddlers have not been studied systematically, so that itis unclear if there are characteristic exposures related to age groups other than toddlers.For toddlers, both mouthing behaviors and limited diets of adult foods have increasedtheir exposures to some pesticides. The lack of data on other age groups means that wedo not know if these same behaviors contribute to exposure, or whether there are otherage-specific contributors to exposure.
IV.4.2.2. Influence of other persons (e.g., parents) on children’s exposure
• Breast feedingThere are good data on most exposure parameters related to breast feeding in Germany,as well as in the US and some other countries. What is needed is information aboutlevels of contaminants in breast milk, and information about variations in breast feedinghabits across countries, and cultures, and variations in contaminants across countriesand cultures. The critical importance of exposures by this route is in the first 6 –12months of life, depending on duration of breast feeding.
• Processed foodsThere is good information on pesticide levels in German baby food that is commerciallyprocessed. Levels in adult foods fed to children are known to the extent that they are mo-nitored in individual countries. Food intake habits need to be studied. In Germany, theDortmund study of children 0-5 years of age is expected to be available by 2003. TheWorld Health Organization collects data on world regional diets. In the US, the NationalHealth and Nutrition Evaluation Survey (NHANES) conducted by the CDC monitors a po-pulation-based sample of adults and children and has some information about dietary ha-bits. In addition the US Continuing Survey of Food Intake of Individuals (CSFII) providespopulation-based information about people’s eating habits. While these databases areinteresting and useful for some purposes, it is unclear whether one can extrapolate fromcountry to country or between cultural groups.What is still needed is longitudinal data to understand the eating habits of individuals.Most dietary studies do not follow individuals through a year but only collect data for oneor two days. Estimates of pesticides in diets are typically calculated from market basket

113
surveys or agricultural products. Combined duplicate diet studies with biomonitoring areneeded to compare and evaluate the reliability of pesticide dietary exposure estimatesmade by these other methods.
• Other factors (e.g., pets, toys, parental occupation, parental habits at home)Children may become exposed to pesticides from the clothes that their parents wear atwork and bring home with them. In addition, parent use or abuse of pesticides in thehome may lead to inadvertent contamination of food, food preparation areas, toys, andbedding. Contact between children and their pets is variable. Depending on the type ofpesticide treatment of the pet, children may or may not be exposed to pesticides from thissource. In addition, pets that play on treated carpets or lawns may become vehicles forexposing children. Behaviors of parents may also change the environmental conditionswithin a home, such as replacing carpeting or repainting walls. Replacement of carpetmay have two effects, disturbing the pesticides which are in the dust within and below thecarpet, and introducing new pesticides if the carpet has been treated with fungicides ormiticides. New paints may also contain fungicides which will off-gas for some period oftime.
IV.4.2.3. Influence of the child on his/her exposures
Activities in daily life
• Children at play (contact with soil, dust, etc)Both dust and soil are potential sources of exposure to children who play on floors andcarpets, or outdoors. Dust may actually have higher contaminant levels than soil sincesome pesticides degrade in sunlight, and therefore would degrade less readily indoors(example: chlorpyrifos).Critical research areas for dust and soil as sources are how much actual exposure occurs(dermal, oral) and in what circumstances (urban/suburban/rural, cleaning habits, pesticideuse patterns in and around the home).
• Eating (contamination of food)Contamination of food by children has been documented for lead and metals found inhouse dust. Similar studies have not been done for pesticide exposure. At the same ti-me, hand wipes and hand rinses have documented that children may be exposed to arange of pesticides which could be transferred to food when eaten by hand.
• Sucking (mouthing behavior)There are presently three small studies of mouthing behaviors in the literature (NL-Steenbekkers, US-Zartarian, US-Reed). Others are in progress (US-CPSC and US-RioBravo). In order to characterize behavioral influences on exposure, this information mustbe combined with knowledge of time/activity patterns (where children spend time) andcontamination levels in those locations.

114
• Regional factors influencing exposures (e.g., urban vs. rural)Differences in activity patterns between children in urban and rural settings and their ef-fect on exposures have not been studied systematically. Some differences in activitypatterns probably exist between countries and geographic regions as well, but data arelacking.
• Children’s exposure as a result of staying at specific places (home, day care,farms, etc.)
Other sources of exposure for children may be related to the specific places where child-ren live such as farms, or near to industrial sites. A few studies are available. Little isknown about the presence of residual pesticides in day care and nursery school environ-ments, or how these institutions are treated to control pests.
IV.4.3. ConclusionsThe behaviors that contribute significantly to a child’s exposure will depend upon the typeof pesticide as well as the age of the child. For example:a. With regard to volatile fumigants used in homes, a child’s level of physical ac-
tivity and respiration rate (relative to the number of alveoli) may be most important.Air levels of pesticides also may be important for other selected pesticides and for-mulations, or for specific applications designed to generate aerosols.
b. In contrast, for pesticides occurring in foods, food residue levels and dietaryhabits will be most important when assessing dietary ingestion.
c. Dermal contact with surfaces and mouthing behaviors may be most importantfor semi-volatile pesticides and pesticides distributed in particle forms. Again, boththe behavior and the formulation are important, as well as the persistence of thepesticide after application.
d. There are many significant data gaps and research needs for an adequateunderstanding of the effects of behavior on children’s exposures to pesticides, asnoted in the paragraphs above. In particular, major studies are needed to characte-rize:
• Time budgets and activity patterns (macro and micro) of children in differentage categories
• Longitudinal eating patterns and habits of individuals• Adult behaviors that influence children’s exposures
More biomonitoring data on children’s exposures would allow correlation with behaviorpatterns and validation of estimates from modeling.
IV.4.4. References
1. Adair, J.H. and Spengler, J.D. Assessing activity patterns for air pollution exposureresearch, in T.H. Starks (ed.) Research Planning Conference on Human Activity Pat-terns. U.S. Environmental Protection Agency (EPA-600/4-89-004) Las Vegas. 1989:pp. 6-1 to 6-19.

115
2. Baas, M.B.M., Steenbekkers, L.P.A. and van Veen, M.P., Residential use of biocidesprays, Proceedings of the international conference ‘Changes at the other end of thechain’, in press.
3. Bayley, N. Individual patterns of development,” pp. 417-426 in: Jones et al. (eds.) TheCourse of Human Development. Waltham MA: Xerox College Pubs. 1971.
4. Bjorklund, D.F. and Brown, R.D. Physical play and cognitive development: Integra-ting activity cognition, and education. Child Devel. 1998: 69: 604-606.
5. Buss, D.M., Block, J.H. and Block,J. Preschool activity level: Personality correlatesand developmental implications. Child Devel. 1980: 51: 401-408.
6. Byers, J.A. The biology of human play. Child Devel. 1998: 3: 599-600.
7. Bradman MA, Hearnly ME, Draper W, Seidel S, Teran S, Wakeham D, Neutra R. Pe-sticide exposures to children from California's Central Valley: results of a pilot study. JExp Anal Environ Epidemiol 7:217-234 (1997).
8. Carlstein, T. Time Resources, Society and Ecology. George Allen & Unwin, London.1982.
9. Carlstein, T. and Thrift, N. Afterword: towards a time-space structured approach tosociety and environment, in: T. Carlstein, et al. (eds.) Human Activity and Time Geo-graphy. John Wiley & Sons, New York. 1978: pp. 225-263.
10. Chapin Jr., F.S. Activity analysis, in: Whittick, A. (ed.). Encyclopedia of Urban Plan-ning. McGraw-Hill Book Co., New York. 1974a: pp. 5-8.
11. Chapin Jr., F.S. Human Activity Patterns in the City. John Wiley & Sons, New York.1974b.
12. Chapin Jr., F.S. Human time allocation in the city, in: T. Carlstein, et al. (eds.). HumanActivity and Time Geography. John Wiley & Sons, New York. 1978: pp. 13-26.
13. Cohen-Hubal, E.A., Sheldon, L.S., Burke, J.M., McCurdy, T.R., Berry, M.R., Rigas,M.L., and Zartarian, V.G. Children’s exposure assessment: A review of factors influ-encing children’s exposure, and the data available to characterize and assess thatexposure. Environ. Health Persp. 2000:108: 475-486.
14. Davis JR, Brownson RC, Garcia R. Family pesticide use in the home, garden,orchard, and yard. Arch Environ Contam Toxicol 22:260-266 (1992).
15. Eaton, W.O. and Yu, A.P. Are sex differences in child motor activity level a function ofsex differences in maturational status? Child Devel. 1989: 60: 1005-1011.
16. Echols, S.L., MacIntosh, D.L., Hammerstrom, K.A., and Ryan, P.B. Temporal variabi-lity of microenvironmental time budgets in Maryland. J. Exp. Anal. Environ. Epidem.1999: 9: 502-512.
17. Fales, E. A rating scale of the vigorousness of play activities of preschool children.Child Devel. 1938: 8: 15-46.

116
18. Fenske RA, Black KG, Elkner KP, Lee CL, Methner MM, Soto R. Potential exposureand health risks of infants following indoor residential pesticide application. Am J Pu-blic Health 80:689-693 (1990).
19. Fenske RA, Kissel JC, Lu C, Kalman DA, Simcox NJ, Allen EH, Keifer MC. Biologi-cally based pesticide dose estimates for children in an agricultural community. Envi-ron Health Perspect 108:515-520 (2000)
20. Freedson, P.S. Field monitoring of physical activity in children. Pediatr. Exer. Sci.1989: 1: 8-18.
21. Freedson, P.S. Electronic motion sensors and heart rate as measures of physical ac-tivity in children. J. School Health. 1991: 61: 215-219.
22. Freeman, N.C.G., Jimenez, M., Reed, K.J., Gurunathan, S., Edwards, R., Roy, A.,Adgate, J., Pellizzari, E.D., Quackenboss, J., Sexton, K., and Lioy, P.J. (2001) Quan-titative analysis of children's activity patterns of children: The Minnesota Children'sPesticide Exposure Study. Journal of Exposure Analysis and Environmental Epide-miology in press.
23. Freeman, NCG, Sheldon, L, Jimenez, M, Melnyk, L, Pellizzari, E, and Berry, M.(2001) Contribution of children's activities to lead contamination of food. Journal ofExposure Analysis and Environmental Epidemiology. 11: 407-413.
24. Freeman, N.C.G., Ettinger, A., Berry, M., and Rhoads, G. (1997) Association of hy-giene and food related behaviors with blood lead levels of young children from leadcontaminated homes. Journal of Exposure Analysis and Environmental Epidemiology7: 103-118.
25. Freeman, N.C.G. and Lioy, P.J. Responses to Region V NHEXAS time/activity diary.J. Exp. Anal. Environ. Epidem. 1999: 9: 414-426.
26. Groot, M.E., Lekkerkerk, M.C., and Steenbekkers, L.P.A.. Mouthing behaviour ofyoung children: an observational study. Agricultural University, Wageningen. Wa-geningen, The Netherlands. 1998.
27. Gurunathan S, Robson M, Freeman NC, Buckely B, Roy A, Mayor R, Bukowski j, LioyPJ. Accumulation of chlorpyrifos on residential surface and on/in toys accessible tochildren. Environ Health Perspect 106:9-16 (1998).
28. Guzelian P.S., Henry C.J., and Olin, S.S. (eds) Similarities and Differences Between
29. Children and Adults: Implications for Risk Assessment. ILSI Press, Washington, DC.1992.
30. Honzik, M.P. and McKee, J.P. The sex difference in thumb-sucking, pp. 179-182 in:Jones et al. (ed). The Course of Human Development. 1971.
31. Jenkins, P.L., Phillips, T.J., Mulberg, E.J., and Hui, S.P. Activity patterns of Califor-nians: Use of and proximity to indoor pollutant sources. Atmos. Environ. 1992: 26A:2141-2148.
32. Johnson, T. A Study of Personal Exposure to Carbon Monoxide in Denver, Colorado.Research Triangle Park NC: U.S. Environmental Protection Agency (EPA 600/S4-84-014). 1984.
117
33. Johnson, T. Human Activity Patterns in Cincinnati, Ohio. Electric Power Research In-stitute, Palo Alto CA. 1989.
34. Jones, M.C., Bayley, N., Macfarlane, J.W., and Honzik, M.P. The Course of HumanDevelopment. Waltham MA: Xerox College Publishing. 1971.
35. Juberg, D.R., Alfano, K., Coughlin, R.J., Thompson, K.M. "An observational study ofobject mouthing behavior by young children.” Pediatrics 2001: 107: 135-142.
36. Kalkwarf, H.J., Haas, J.D., Belko, A.Z., Roach, R.C., and Roe, D.A. Accuracy ofheart-rate monitoring and activity diaries for estimating energy expenditure. Amer. J.Clin. Nutr. 1989: 49: 37-43.
37. Klepeis, N., Tsang, A., and Behar, J.V. Analysis of the National Human Activity Pat-tern Survey (NHAPS) Respondents from a Standpoint of Exposure Assessment. Na-tional Exposure Research Laboratory, U.S. Environmental Protection Agency, LasVegas NV. 1995.
38. Loewenherz C, Fenske RA, Simcox NJ, Bellamy G, Kalman D. Biological monitoringof organo-phosphorous pesticide exposure among children of agricultural workers inCentral Washington State. Environ Health Perspect 105:1344-1353 (1997).
39. Lu C, Fenske RA, Simcox NJ, Kalman D. Pesticide exposure of children in an agri-cultural community: evidence of household proximity to farmland and take home ex-posure pathways. Environ Res 84:290-302 (2000).
40. Lu C, Fenske RA Dermal transfer of chlorpyrifos residues from residential surfaces:comparison of hand press, hand drag, wipe, and polyurethane foam roller measure-ments after broadcast and aerosol pesticide applications. Environ Health Perspect107:463-467 (1999).
41. Maffeis, C., Zaffanello, M., Pinelli, L., and Schutz, Y. Total energy expenditure andpatterns of activity in 8-10-year-old obese and nonobese children." J. Pediatr. Gast.Nutr. 1996: 23: 256-261.
42. McCurdy, T., Glen, G., Smith, L., and Lakkadi, Y. The National Exposure ResearchLaboratory’s Consolidated Human Activity Database. J. Exp. Anal. Environ. Epidem.2000: 10: 566-578.
43. McCauley LA, Lasrev MR, Higgins G, Rothlein J, Muniz J, Ebbert C, Phillips J. Workcharacteristics and pesticide exposures among migrant agricultural families: a com-munity-based research approach. Environ Health Perspect 109:533-538 (2001).
44. Melnyk, L.J., Berry, M.R., Sheldon, L.S., Freeman, N.C.G., Pellizzari, E.D., and Kin-man, R.N. (2000) Dietary exposure of children in lead-loden environments. J. Exposu-re Analysis and Environmental Epidemiology. 10: 723-731.
45. U.S. Environmental Protection Agency. Child-specific Exposure Factors Handbook.NCEA-W-0853 June 2000 External Review Draft.http://cfpub.epa.gov/ncea/cfm/efcsefh2.cfm
46. O’Rourke MK, Lizardi PS, Rogan SP, Freeman NC, Aguirre A, Saint CG. Pesticideexposure and creatinine variation among young children. J Exp Anal Environ Epide-miol 10:673-681 (2000).

118
47. Ott, W.R. Human activity patterns: a review of the literature for estimating time spentindoors, outdoors, and in transit, in: T.H. Starks, (ed.) Proceedings of the ResearchPlanning Conference on Human Activity Patterns. U.S. Environmental ProtectionAgency (EPA-450/4-89-004), Las Vegas. 1989: pp. 3-1 to 3-38.
48. Ott, W.R., Thomas, J., Mage, D., and Wallace, L. Validation of the Simulation of Hu-man Activity and Pollutant Exposure (SHAPE) Model using paired days from the Den-ver, CO, carbon monoxide field study. Atmos. Environ. 1988: 22: 2101-2113.
49. Ottensman, J.R. Systems of Urban Activities and Time: An Interpretative Review ofthe Literature. NC: Center for Urban and Regional Studies; University of North Caroli-na, Chapel Hill NC. 1972.
50. Pratt, M., Macera, C.A., and Blanton, C. Levels of physical activity and inactivity inchildren and adults in the United States: Current evidence and research items. Med.Sci. Sports Exer. 1999: 31 (Supp.): S526-S533.
51. Que Hee, S.S., Peace, B., Clark, C.S., Boyle, J.R., Bornschein, R.L., and Hammond,P.B. (1985). Evolution of efficient methods to sample lead sources, such as housedust and hand dust, in the homes of children. Environ. Res. 38: 77-95.
52. Reed, K.J., Jimenez, M., Freeman, N.C.G., and Lioy, P.J. Quantification of children’shand and mouthing activities through a videotaping methodology.” J. Exp. Anal. Envi-ron. Epidem. 1999: 9: 513-520.
53. Robertson, G.L., Lebowitz, M.D., O’Rourke, M.K., Gordon, S., and Moschandreas, D.National Human Exposure Assessment Survey (NHEXAS) study in Arizoniz–Intro-duction and preliminary results. J. Exp. Anal. Environ. Epidem. 1999: 9: 427-434.
54. Robinson, J.P. How Americans Use Time. New York: Praeger Publishers, New York.1977.
55. Robinson, J.P. Time-diary research and human exposure assessment: some metho-dological considerations. Atmos. Environ. 1988. 22: 2085-2092.
56. Robinson, J.P. and Thomas, J. Time Spent in Activities, Locations, and Microenvi-ronments. U.S. Environmental Protection Agency (EPA-600/4-91-006), Las Vegas.1991.
57. Robinson, J.P., Wiley, J.A., Piazza, T., Garrett, K., and Cirksena, K. Activity Patternsof California Residents and Their Implications for Potential Exposure to Pollution.Sacramento CA: California Air Resources Board (CARB-A6-177-33), Sacramento.1989.
58. Roth Associates A Study of Activity Patterns Among a Group of Los Angeles Asthma-tics. Palo Alto CA: Electric Power Research Institute. 1988.
59. Roth Associates A Survey of Daily Asthmatic Activity Patterns in Cincinnati. Palo AltoCA: Electric Power Research Institute. 1989.
60. Ruff, H.A. Infants’ manipulative exploration of objects: Effects of age and object cha-racteristics. Devel. Psychol. 1984: 20: 9-20.
61. Ruff, H.A. and Dubiner, K.. Stability of individual differences in infants’ manipulationand exploration of objects. Percep. Motor Skills 1987: 64: 1095-1101.

119
62. Savage EP, Keefe TJ, Wheeler HW, Mounce L, Halwic L, Applehans F, Goes E,Goes T, Mihlan G, Rench J, Taylor DK. Household pesticide usage in the UnitedStates. Arch Environ. Health 36:304-309 (1981).
63. Sayre, J.W., Charney, E., Vostal, J., and Pless, I.B. (1974). House and hand dust asa potential source of childhood lead exposure. Amer. J. Dis. Child. 127: 167-170.
64. Schwab, M., McDermott, A., and Spengler, J.D. Using longitudinal data to understandchildren's activity patterns in an exposure context: Data from the Kanawha Countyhealth study. Environ. Inter. 1992: 18: 173-189.
65. Schwab, M., Spengler, J.D., and Özkaynak, H. Using longitudinal data to understandchildren's activity patterns in an exposure context, in: Indoor Air '90. Vol. 3. 1990b: pp.471-476.
66. Shealy DB, Barr JR, Ashley DL, Patterson DG Jr., Camann DE, Bond AE. Correlationof environmental carbaryl measurements with serum and urinary 1-napthol measure-ments in a farmer applicator and his family. Environ Health Perspect 105:510-513(1997).
67. Simcox NJ, Fenske RA, Wolz SA, Lee IC, Kalman DA. Pesticides in household dustand soil: exposure pathways for children of agricultural families. Environmental HealthPerspectives 103:1126-1134 (1995).
68. Steenbekkers, L.P.A., Methods to study everyday use of products in households: theWageningen mouthing study as an example, Ann.occup.Hyg. Vol. 45, No. 1001, pp.S125-S129 (2001).
69. Sumner D, Langley R. Pediatric pesticide poisoning in the Carolinas: an evaluation ofthe trends and proposal to reduce the incidence. Vet Human Toxicol 42:101-103(2000).
70. Tsang, A.M. and Klepeis, N.E. Descriptive Statistics Tables from a Detailed Analysisof the National Human Activity Pattern Survey (NHAPS) Data. U.S. EnvironmentalProtection Agency (EPA/600/R-96/148), Las Vegas. 1996.
71. Touwen, B.C.L., Hempel, M.S., and Westra, L.C. “The development of crawling bet-ween 18 months and four years. Devel. Med. Child Neurol. 1992: 34: 410-416.
72. US Environmental Protection Agency. Summary Report of the Technical Workshopon Issues Associated with Considering Developmental Changes in Behavior andAnatomy when Assessing Exposure to Children. EPA/630/R-00/005. December 2000.
73. Vadarevu, R.V. and Stopher, P.R. “Household activities, life cycle, and role allocati-on.” Transport. Res. Rec. 1556: 77-85. 1996.
74. Vandell, D.L. and Powers, C.P. “Day care quality and children’s free play activities.”Amer. J. Orthopsychiat. 53: 493-500. 1983.
75. Watt, J., Thorton, I., and Cotter-Howells, J. (1993). Physical evidence suggesting thetransfer of soil Pb into young children via hand-to-mouth activity. Appl. Geochem..Supp. 2: 269-272.
76. Whitemore RW, Immerman FW, Camann DE, Bond AE, Lewis RG, Schaum JL. Non-occupational exposures to pesticides for residents of two U.S. Cities. Arch EnvironContam Tox 26:47-59 (1994).

120
77. Wiley, J.A., Robinson, J.P., Cheng, Y.-T., Piazza, T., Stork, L., and Pladsen, K. Studyof Children's Activity Patterns. Survey Research Center, University of California, Ber-keley CA. 1991a.
78. Wiley, J.A., Robinson, J.P., Piazza, T., Garrett, K., Cirksena, K., Cheng, Y.-T., andMartin, G. Activity Patterns of California Residents. Survey Research Center, Univer-sity of California, Berkeley CA. 1991b.
79. van Wijnen JH, Clausing P, Brunekreef B. Estimated soil ingestion by children. Envi-ron Res 51:147-162 (1990).
80. Zartarian, V.G., Ferguson, A.C., and Leckie, J.O. Quantified dermal activity data froma four-child pilot field study. J. Exp. Anal. Environ. Epidem. 1997a: 7: 543-552.
81. Zartarian, V.G., Ferguson, A.C., and Leckie, J.O. Quantified mouthing activity datafrom a four-child pilot field study. J. Exp. Anal. Environ. Epidem. 1998: 8: 543-554.
82. Zartarian, V.G. and Leckie, J.O. Dermal exposure: the missing link. Environ. Sci.Tech. 1998: 32: 134A-137A.
83. Zartarian V.G., Özkaynak H., Burke J.M., Zufall M.J., Rigas M.L., and Furtaw Jr. E.J.,“A modeling framework for estimating children's residential exposure and dose tochlorpyrifos via dermal residue contact and non-dietary ingestion.” Environ. HealthPersp. 2001: 108: 505-514.
84. Zartarian, V.G., Streiker, J., Rivera, A., Cornejo, C.S., Molina, S., Valadez, O.F., andLeckie, J.O. A pilot study to collect micro-activity data of two- to four-year-old farm la-bor children in Salinas Valley, California. J. Exp. Anal. Environ. Epidem. 1995: 5: 21-34.

121
V. Conclusion: What are the most important factors that limitexposure of children (to be discussed in the plenum. Eachworking group should provide a short statement)
Gerhard Heinemeyer
V.1. Age groups that should be considered for exposure estimation inchildhood.
Since the development of children does not occur linearily, it is important to characterizesome ages which can be referred to some developmental stages.Table 1 shows the main categories of age that should be considered for exposure esti-mation which has been proposed by the working group 1.
Age category age
Premature infant < 36 weeks
Newborn 1 – < 29 days
Infant 29 days - < 1 year
small child 1 - < 6 years
1 – <3 years3 - < 6 years
Due to proposals made by working group II, comparechapter IV.2.3.3
school child 6 - < 14 years
Adolescent 14 - < 18 years
Adult 18 - < 65 years Table 1: Age categories proposed for es-Senior >65 years timation of exposure in children vs. adults
The table of age categories is extensively characterised in chapter V. As a result of theworkshop, however, it seems appropriate to add a subcategory "toddler, 1-3 years" in or-der to consider the uptake of dust during this period of development.
V.2. The most important source of exposure to children (shown with theexample “pesticides”
Use of products in the home
• Children as bystanders of the use of household and leisure productsNormally, children do not use consumer products leading to direct exposure. Theyare, however, often bystanders which means that an indirect exposure takesplace. In general, this indirect exposure scenario is similar to that for adults.Mostly, bystander exposure is by inhalation.

122
Contaminations, either from consumer- or other uses
• SoilThe scenario of exposure from contamination of soil is typical for children who areplaying on the ground e.g. in sandboxes. Children may eat soil, or they can be ex-posed by hand-to-mouth contact. Contact with soil occurs normally outside andapplies to children in the age of one year up to shool ages.
The uptake of dust and soil has been studied by several authors. In the AUH-report, data from Calabrese have been proposed to be used for estimations ofdust exposure.
Table 2: Uptake of soil, most probable case (data from Calabrese, comparechapter III)age (y) < 1 1-3 4-6 7-9 10-14 15-19 20-75
Uptake of soil(mg/d)
20-100 20-100 20-100 5-25 5-25 2-10 2-10
• DustThis scenario is very similar to contamination of soil. Exposure, however occursinside the homes, and sust may by contaminated to higher amounts than soil. Ex-posure to dust applies for all ages, but particularly for little children (infants, todd-lers) crawling on the ground. Exposure occurs primarily by hand-to-mouth contact.
Food• Food may be contaminated with substances e.g. pesticides and may contribute
significantly to exposure of children.Animals
• pets may be treated with chemicals for care and for preventing illness or pest.Children often embrace the pets living in their homes which can lead to substantialexposures, particularly pesticides. Similar scenarios may apply for textiles that aretreated with chemicals against pest and where children are playing.
V.3. Important paths of exposure to children?
V.3.1. Oral• hand-to mouth-contact
As stated above, the hand-to-mouth contact plays a predominant role for exposureof children. This has been discribed in the contribution of B. Steenbekkers (chapterII.1.3) and by working group IV (chapter IV.4)
• foodDifferent eating habits of children vs. adults should be taken into consideration. Ho-vewer, the influence of eating with regard to age groups in children is not welldocumented.
123
• sucking, bitingThis typical habits of children may lead to oral exposure to substances. It applies forthose chemicals that are migrating from articles, in particular toys and other articles(dummies, suckers) and any other things children put into the mouth.
V.3.2. Dermal• Contact of skin to contaminated soil due to crawling and playing on the ground is mo-
re frequent than in adults. This applies for soil (outside) and for dust (inside). It is anti-cipated that the substances which are transferred by these carriers are mostly thosethat are not volatile.
• Due to the relative higher body surface of children the absorbed dose is higher than inadults when referred to bodyweight.
V.3.3. Inhalation• Because children and adults inhale the same substance concentration there is in
principle no difference between children and adults of ihalation exposure. The modelsused to not considere possible physiological differences between children and adults.They only consider the breathing volumes which must not reflect the real situation.Other models that consider lung surface and a gradient through the lung wall whichhas been described by Fick for the absorption of oxygen could be helpful for buildingmor precise models of lung absorption.
V.4. How do children differ from adults?
V.4.1. ToxicokineticsThere are important differences in toxicokinetics between children and adults. This is figu-red out in chapters II.1.1, II.5.13, and IV.1. In general, the clearance changes duringchildhood. From evaluations of drug kinetics, we know that in newborns the clearance islower, and, in the age between 1 and 6 years it is higher than in adults. This is due to thehigher capacity of metabolism and to changes in the volumes of distribution. For toxicoki-netic evaluations, this can mean, that toxic doses may be higher in children than in adults.Vice versa, if toxic metabolites are formed, this can lead to higher toxicity.
V.4.2. ToxicodynamicsDevelopmental changes during childhood are of great importance. As figured out inchapters II.1.1 and III, the different organ systems are developing differently in children,which must be considered. The consequence is that e.g. substances affecting the en-docrine system may be relative untoxic during the first years of life, but neurotoxic sub-stances may lead to desastrous effects during this period. Taking these points into ac-count, the toxic properties in of substances for children must be related to the develop-ment.
V.4.3. AnthropometricsChildren are no little adults. Effects that have been shown in adults cannot be extrapola-ted to children without some caution. There is no linear relationship between age and bo-dyweight. It has been shown that there is good correlation of body functions e.g. basalmetabolism with body surface. For instance, dosage of drugs in childhood can better becorrelated to body surface than to bodyweight.Body surface can be easily calculated by the formula BS= 0,0239 * H0,417*W0,517.For comparisons of data between children and adults, it seems therefor more appropriateto take to refer to bodysurface than to bodyweight.

124
Similar considerations have been made for lung function. In the existing approaches, onlythe breathing volume is used to estimate the exposure from inhalation. This concept,however, does not consider that there should be a steady state concentration between in-and outside the lung, the dead-volume is unconsidered and the lung respiratory minuteventilation rate per square meter of lung surfact area is 40-fold to 60-fold greater in child-ren than adults.
Age Body weight(kg)
Body height(cm)
Body sur-face (m²)
Age Body weight(kg)
Body height(cm)
Body sur-face
newborn 3,27 50,50 0,226 10 33,00 140,22 1,145
0,25 5,80 60,35 0,328 12 41,51 151,85 1,332
0,5 7,63 67,68 0,396 14 52,20 163,35 1,546
0,75 8,63 71,84 0,433 16 60,22 169,85 1,692
1 9,44 75,07 0,462 18 63,39 171,53 1,745
1,5 10,80 81,22 0,512 19 63,56 171,54 1,747
2 12,06 86,14 0,555 20-25 65,65 171,53 1,777
2,5 13,26 90,85 0,596 25-30 68,28 170,13 1,807
3 14,40 94,95 0,634 30-35 69,81 168,92 1,822
3,5 15,38 99,03 0,667 35-40 70,42 167,74 1,825
4 16,66 103,20 0,707 40-45 72,20 168,04 1,850
5 18,86 110,41 0,776 45-50 73,15 166,24 1,855
6 21,16 117,05 0,844 50-55 74,07 165,12 1,861
7 23,91 123,42 0,919 55-60 72,52 164,45 1,838
8 26,46 128,72 0,985
Table 3: Body weights, -heights, and -surfaces of humans in different ages (datataken from AUH-report), male and female. Body surface has been calculated by theabove mentioned formula.
V.4.4. BehaviourThe behaviour of children is one of the factors influencing their own exposure is highlyuncertain. It is, however, believed that it plays an important role. Children may influencetheir exposure by some activities which are different to adults.First of all, the time staying at home may be different to adults, but changes with age.This may be of importance for dicrimination of exposure in very young children and e.g.school-children and is reflected in table 1.Secondly, exposure in children may be ruled by their microactivities. The most importantactivities that should be considered for estimation of exposure are:1. Crawling on the floor. This applies to children in the early ages. Exposure occurs in-
doors to substances which are migrating from articles, furniture and other fixtures aswell as from impregnations.

125
2. Playing on the ground. This applies for all children. Exposure occurs during playinginside and outside.
3. Playing with pets. Occurs by playing with pets which are e.g. treated with agentsagainst flies and fleas.
4. Playing with food. Contaminations of hands may lead to oral exposure during eating.Some children extensively play with their food.
5. As a specific pathway for very young children, the uptake of pesticides via breast fee-ding should be taken into consideration. Due to measurements from a 20 year moni-toring programme for persistent organochlorine compounds show, that the uptake(95th percentiles) of e.g. HCH may account for ~0,7 , that of HCB for 0,75 and of DDTfor 3,8 µg/kg of bodyweight per day.
V.5. Needs for improvement knowledge on exposure in childhoodThe the most critical point is that knowlegde on data needed for exposure assessment inchildren is poor. This very general statement can be applied for data to be taken as varia-bles in models, scenarios and models and for studies that validate the models. In the ap-proach to use models for exposure assessment is taken as a basic concept, the followingconsequences must be kept in mind.
1. Models are mathematical expressions of scenarios. The most important prerequi-sition for modeling is therefore to characetrise the scenario as realistic as possible.There are lots of ideas on scenarios, either for single or for continous exposures.2. Exposure can be measured. This means that either the total exposure (given asµg/m³) can be measured as a concentration reflecting external exposure, or as aprocess e.g. migration or ventilation, or as an input variable of a model.
Figure 1: Relationship of measure-ments and modeling of exposureand role of data.
The relationship between modeling and measurement of exposure can be understood asa circle: Models are needed because measurements cannot be performed for any case ofexposure. Hovewer, only measurements can really quantitate the exposure. What is theinterface between both? The answer is, data. An appropriate use of sufficient data wouldlead to adequate modeling of exposure and to its validation via selected measurements.The key to improve exposure assessment is therefore to compile the data needed formodeling the exposure and to balance the values by measurements which must be per-formed hand in hand. For children, we have lots of data gaps that uncertain the exposureassessment. Most of these uncertainties have been figured out in the contributions to theworkshop.The most important aim of further work is therefore to (i) improve the database and (ii)validate models. This has been pointed out under the different subchapters of this report.Insufficient data bases are drawing through all the conclusions of the four working groups.

126
This means that for all of the parameters that are used for exposure assessment morecertainty is needed. This applies for data which are characteristic for the exposed personssuch as anthropometrics, behaviour, use characteristics, toxicokinetics, but also for thosedata that are independent of the person such as migrations, sinks and ventilation and thesubsequent risk characterisation.In the context of uncertainty it should be dicussed whether the variability of data can beincluded. This would mean that the distributions of unput variables have to be describedin a proper statistical manner and that both - uncertainty and variability - are discriminatedas far as possible. This means that distribution based (probabilistic) approaches shouldbe evaluated for exposure assessments. Epidemiologic studies can improve data to de-scribe age dependent changes in childhood.Dedicated surveillance systems are needed to monitor children's exposure accidents andtheir health consequences.
V.6. ConclusionAre children more sensitive than adults? When answering this question it should be con-sidered that children are representing a population of their own. According to age, thereare specific characteristics of scenarios, pathways of exposure and behaviour to be con-sidered, together with the developmental aspects that must be also be taken into account.Children are indeed a vulnerable population, but the effects are not steady during thewhole childhood, changing qualitatively and quantitatively in relation to organ develop-ment. On the other hand, the capacity for elimination of substances changes, leading todecreases and increases of toxicity depending to the age. For exposure assessments,these specific characteristics of children's exposure should be considered as pointed outin this report.

127
VI. Autor's indexAngerer, J. 26Aron, D 35Becker, K. 54, 56Begemann, K. 68Berger-Preiß, E. 52Besbelli, N. 23, 89Boehncke, A. 51Bois, F. 89Brehmer, W. 106Capleton, A. 38, 106Charnley, G. 80, 89Courage, C. 38Desel, H. 30, 89Dherbecourt, V. 35Franck, U. 14, 99Freeman, N. 110Furtaw, Ed 40Gundert-Remy, U. 68Gunier, R. 59Hahn, A. 68, 89Harnly, M. 59, 110Heinemeyer, G. 68, 83, 120Herbarth, O. 14Herrmann, J. 21, 106Hertz, A. 59Heudorf, U. 26Horn, W. 57Hughes, J. 38, 89Idel, H 52Kampzyk, U. 14Kraus, S. 54, 56Krause, C. 54, 56Krumbiegel, P. 14Leng, G. 52, 106Levsen, K 52Levy, L. 38Lunchick, C. 41, 106Mangelsdorf, I. 51Mathieu-Nolf, M. 35, 89Mekel, O. 46, 99Michalak, H. 68Mosbach-Schulz, O. 43, 110
Müller, A. 14Neumeister, L. 63, 106Nisse, P 35Olin, S. 110Olsson, A. 99Oomen, A. G. 75Ozkaynal, H. 40, 99Peucelle, D. 35Pydde, E. 110Ranft, U. 52Rehwagen, M. 14Reynolds, P. 59Rigas, M. 40Rosenheck, L.. 41Roßkamp, E. 57Rüdiger, T. 110Schilde, M. 14Schmidt-Faber, B. 64, 110Short, S. 38Schneider, K. 78Schümann, M. 99Schulz, C. 54, 56Schulz, S. 56Schwab, M. 7Seifert, B. 54, 56, 57Seiwert, M. 54, 56Snodgrass, W. R. 6, 89Stauber, F. 106Stärk, H.-J. 14Steenbekkers, B 9, 110Ullrich, D. 57van der Jagt, K. 20, 106van Engelen, J. 75 76, 99van Raaij, M.T.M. 77Vieth, Bärbel 72, 110von Behren, J. 59Wilks, M. 89Wintermeyer, D. 99Wolterink, G. 76Xue, J. 40Zartarian, V. 40

128
VII. Subjects index
@RISK 49
absorption 75, 84acceptable daily intake 64accidents 68acivities
playing 112activities 99
eating 112activity pattern 111activity patterns 42, 47ADI 95adolescents 78adverse effects 23age 47age categories 110age groups 10, 89, 120aggregation 43agricultural pesticide use 59air concentrations 57albumin/alpha-1-acid glycoprotein 6algicides 35alkyl phosphates 31, 32allergenic potential 57allergic diseases 15allergic reaction 32allergy 68alpha-Cyano-pyrethroides 22anthropometric parameters 51anthropometrics 87anticoagulant 31anti-vitamine K 35antropometrics 122area under curve 78, 90aspergillus 15asthmatic attack 32atopic sensitisation 16AUH-report 87
baby food 111beetles 52behaviour 86, 87, 123belching 32benzo[a]pyrene 51beverage 41bioaccessibility 75bioavailability 75biomonitoring 40, 54, 84, 87, 108biting 9blood 54body burden 90body height 123body surface 85, 87, 99, 122, 123
bodyweight 47, 48, 51, 71, 85, 87, 99, 123bones 95breast feeding 111, 124breast milk 100breast-fed infants 71bronchialsecretion excessive 68bystander 120
cadmium 64calendex 41carbamates 32, 35, 91cardiac shock 68cardiac sound 32CARES 80CARES/RExY 41carpets 16, 21, 86chemical tissue binding 6chemotherapy
pediatric 90chewing 9children's activity studies 41chlorpyrifos 26, 40, 56chlorpyriphos 80, 92, 93cholinesterase 81Cholinesterase
reduced 68circulatory disturbance 68cis-heptachlorepoxid 71cladosporium 15clearance 78, 90Clothing 86coal tar 51coma 68composition 87CONSEXPO 3.0 76consumer pesticide use 41contamination of food 86convulsion 68crawlers 78crawling 86, 123creatinine 54creosote 51cumulative pesticide exposure model 40cyanosis 32cytochrome P-450 6, 7
data availability 96, 103data compilation 87data needs 124data quality 102DDE 71DDT 56, 71, 72debrisoquine/sparteine-polymorphism 8
129
depression of consciousness 68dermal contact 40dermal irritations 32dermatitis
atopic 32deterministic approach 43, 48, 101development 7, 84, 122
metabolism 91neurotoxicity 91reprotoxicity 91
dialkylphosphates 28diarrhea 32diazinon 92dibenz[a,h]anthracene 51dichlofluanid 32dieldrin 71diet 100dietary 26, 41dietary intake 64, 71dietary study 111diethyldithiophosphate 26diethyl-phosphate 26diethylthiophosphate 26dimethyldithio-phosphate 26dimethylphosphate 26dimethylthiophosphate 26dioxins 71distribution 84
best fitted 44volume of 78
distribution of exposure 44dose response assessment 95drinking water 41drug sensitivity 7dust 26, 41, 51, 52, 54, 86, 112, 121
floating 86house 86
dust concentrations 87dust mite allergens 16dyspnoe 32
eating habits 100edema 32effects
acute vs. chronic 95elimination 84endpoint considerations 95environmental survey 54, 56EPA 40, 41EPA-Exposure factors handbook 87epidemiology 23ethylphosphate metabolites 26exposure
acute 68aggregate 41chronic 68, 87cumulative 41
dermal 122external 84inhalation 122internal 84measuring? 87modeling? 87oral 121pathways 100rural 112single 87urban 112
exposure computer models 101exposure data 107exposure measurements 124exposure model 99exposure modeling 40, 124
deterministic 43guidelines 43probabilistic 43
exposure models 40aggregate 40validation 103
exposure modlesevaluation 103
exposure prevention 54exposure related dose estimating model 40exposure scenario 99
fabrics 21farm family exposure study 41fasciculations 68feces
discoloration 32fenitrothion 32fever 32first-pass effect 75fluoroquinolones 95food 21, 35, 41, 121, 124
contamination of 86processed 111
food consumption 47food monitoring 64food quality protection act 41formaldehyde 57fruit 28fungicides 32, 35, 64furmecyclox 32furniture 21
garden fences 51gastrointestinal disturbance 68gastrointestinal irritation 32genetic 7glomerular filtration 6glucochloral 35glutathione 6glyphosate 35

130
hair consistency 32half life 90hand wipes 41hand-to-mouth behaviour 75, 76hand-to-mouth transfer 51hant-to-mouth-contact 11HCB 72HCH 71, 72headache 68health effects 3, 30, 38, 87, 92
acute 92age dependent 92animals 92chronic 92, 93
health hazard 23HEPO 71, 72herbicides 32, 35hexachlorobenzene 71hexachlorocyclohexane isomers 71home accident 35household dust 26, 28human biomonitoring 26human biomonitoring commission 55human milk 71
databank 71residues 71
hydrocarbons 35chlorinated 32, 91
hypersalivation 68
impregnated clothes 21impregnated industrial materials 21impregnation agent 51indoor 41indoor pesticide application 26infants
2 - 6 months 78ingestion
non-dietary 40inhalation 51insecticides 26, 30, 35intake 26IPCS 23isothiazolinone compounds 57
licking 9lifeline 41limitations 40lindane 56liver enzymes
slightly elevated 32low level toxicity 93low-level exposure 38lung respiratory minute ventilation 6
macroactivities 86, 87
margin of safety/exposure 95mattresses 16maximal plasma concentration 90maximum plasma concentration 78medicines
human / veterinary 21metabolic capacity 85metabolisers
poor 7rapid 7
metabolism 6, 7, 80, 84metabolite concentrations 52methoxychlor 56methyl parathion 93methylphophosphate metabolites 26microactivities 86, 87microbial volatile organic compounds 15migration 87milk intake 71minnesota children's pesticide exposure study 41miosis 68misuse
accidental 35model
deterministic 44probabilistic 44
modelingage dependent 102
modeling tools 41modeling, probabilistic 101models
long term 86molluscicides 35monitoring
biological 41mould 15mouthing 9, 11, 76, 99, 112, 121mouthing behaviour 9, 10mouthing time 9, 10, 12myoclonia 68
natural products 22neonates
full term 78premature 78
newborns 78nitrate 64, 66non-agricultural biocides 21non-dietary exposure task force ( 41non-dietary ingestion 76
ontogency. 7organochlorine pesticide levels 71organochlorined compounds 35organophosphate 26organophosphates 22, 26, 35, 59, 68, 91, 92outdoor 41, 47

131
outdoor air pollution 35outdoor dustfall 54outdoor residential exposure task force 41
paints 57paleness 32particle surface 18PCP 17, 54, 56penicillium 15pentachlorophenol 17perception
disturbed 32permethrin 17, 26, 32, 52personal activities 47personal exposure
aggregate 40pesticide application 47pesticide exposure record 23pesticide toxicity
age related 91pesticide usage 40pesticide use patterns 42pesticide use reporting system 63pets 112, 121, 124Pets 86pharmacogenetics 7pharmacogenomics 7pheromones 22phthalates 9pica behaviour 76piperonyl butoxide 32, 56plant protection products 21playing 86, 124playing habits 51point estimate approach 48poison centre 23, 30, 35, 92poisoning 23poisoning severity score 23pollutant 54pollutant level 47polycylic aromatic hydrocarbons 51polymorphisms 7population 110population exposure 42post-application use 41pre-adolescents 78probabilistic analysis 48probabilistic approach 50, 86, 95, 101, 104probabilistic assessment 42probabilistic method 51probability density distribution 49procymidon 64prodrugs 7product use 87propoxur 56protein binding 6provisional tolerable weekly intake 64
psychic disturbance 68PVC 9pyrethrines 22pyrethroids16, 22, 26, 31, 32, 35, 52, 56, 68, 91,
92pyrethrum 32
questionnaire 9, 46, 54
railway sleepers 51refusal of drinking 32residues 21residues of pesticides
non-dietary 41respiratory insufficiency 68respiratory sound 32risk management 95risk assessment
aggregate 41cumulative 41, 51
rodenticides 22, 31, 35room ventilation 87
sandbox edgings 51scalp hair 54seizure 32seizures 32sensitivity 80, 93sensitivity analysis 40, 45SHEDS 40, 41skin
detachment 32skin surface 51skin surface area 6smelling
disturbance of 68soil 41, 48, 51, 75, 86, 112, 121soil ingestion 48, 75, 99soil track in 86spores 15Stochastic Human Exposure and Dose Simulation
Model 40stochasticity 44sucking 9, 112, 122suicides 68susceptibility 89
safety assessment 94symptoms 32, 68synergists 22
tadpoles 51tap water 54taste perceptions
irregular 32teeth 15, 95tetracycline 95textile floor covering 52

132
thrist 32throat
sore 32tiered approach 101time budget 18time-activity data 40tiredness 68toddlers 78toxicodynamics 122toxicokinetics 78, 122
children vs. adults 89dose considerations 94
toys 9, 112tremor 68tubular secretion 6
uncertainty 40, 44, 46, 50, 87, 102, 104, 125model 47parameter 47scenario 47
uptake 52urine 26, 41, 52, 54
urticaria 32use
pesticide 59, 63use of pesticides 107, 120use of peticides 106
validation 42variability 44, 46, 49, 86, 87, 102, 104vegetables 28ventilation 87VOC 57volume of distribution 90
wall paper 21weakness 68weather 47wood protection products 32Wool carpets 52worst case 43, 48
yeast 15

133
VIII. Participants of the workshop:
NAME FIRSTNAME
INSTITUTION CITY COUNTRY
1. Becker Kerstin Umweltbundesamt, "Umweltbe-obachtung, einschl. Human- undBiomonitoring"
Berlin Germany
2. Berger-Preiß Edith Fraunhofer Institute of Toxicologyand Aerosol Research
Hannover Germany
3. Besbelli Nida International Programme on Che-mical Safety, World Health Organi-zation
Geneva Switzer-land
4. Bois Frederic Ineris, Unite de Toxicologie Expe-rimentale, responsable
Verneuil enHalatte
France
5. Brehmer Wolfgang Federal Institute for Health Protec-tion of Consumers and VeterinaryMedicine
Berlin Germany
6. Capleton Alex MRC Institute for Environment andHealth
University of Leicester
Leicester UnitedKingdom
7. Charnley Gail Health Risk Strategies Washington DC USA
8. Desel Herbert Göttingen University
GIZ-Nord Poison Information Cen-tre
Göttingen Germany
9. Dürkop Jutta Umweltbundesamt "Umwelthy-giene und Umweltmedizin, ge-sundheitliche Bewertung
Berlin Germany
10. Franck Ulrich Department of Human ExposureResearch and Epidemiology
UFZ - Centre for EnvironmentalResearch Leipzig - Halle
Leipzig Germany
11. Freeman Natalie Environmental Health and Occu-pational Health Science Institute
Piscateway, NJ USA
12. Hahn Axel Federal Institute for Health Protec-tion of Consumers and VeterinaryMedicine
Berlin Germany
13. Harnly Martha Environmental Health Investigati-ons Branch
California Department of HealthServices
Oakland, CA USA
14. Heinemeyer Gerhard Federal Institute for Health Protec-tion of Consumers and VeterinaryMedicine
Berlin Germany

134
NAME FIRSTNAME
INSTITUTION CITY COUNTRY
15. Herrmann Jutta Umweltbundesamt, "Wirksamkeits-und Anwendungsprüfung vonSchädlingsbekämpfungsmittelnnach § 18 IfSG
Berlin Germany
16. Heudorf Ursel Public Health Service, Frankfurt/Main Germany
17. Horn Wolfgang Bundesanstalt für Materialfor-schung und -prüfung
Berlin Germany
18. Hughes Joanne MRC Institute for Environment andHealth
Leicester UnitedKingdom
19. Klein Albrecht Umweltbundesamt, "Umweltprü-fung Pflanzenschutzmittel, EU-Wirkstoff-programm
Berlin Germany
20. Konietzka Rainer Umweltbundesamt, Umwelthy-giene und Umweltmedizin, ge-sundheitliche Bewertung
Berlin Germany
21. Leng Gabriele Bayer AG Leverkusen Germany
22. Lunchick Curt Aventis Crop Science Research Tri-angle Park
USA
23. Matthieu-Nolf Monique Lille Poison Centre Lille France
24. Mekel Odile School of Public HealthUniversity of Bielefeld
Bielefeld Germany
25. Mosbach-Schulz
Olaf University of BremenInstitute of Statistics
Bremen Germany
26. Neumeister Lars Pestizid Aktions-Netzwerk e.V.(PAN Germany)
Hamburg Germany
27. Olin Stephen ILSI Risk Science InstituteInternational Life Sciences Institute
Washington DC USA
28. Olsson Agneta National Chemicals Inspectorate(Kemi)
Solna Sweden
29. Özkaynak Hâluk Human Exposure Modeling Pro-gram, US EPA National ExposureResearch Laboratory
Research Tri-angle Park
USA
30. Pydde Emanuele Federal Institute for Health Protec-tion of Consumers and VeterinaryMedicine
Berlin Germany
31. Roßkamp Elke Umweltbundesamt, "Toxikologie Berlin Germany
32. Rüdiger Thomas Federal Institute for Health Protec-tion of Consumers and VeterinaryMedicine
Berlin Germany
33. Schmidt-Faber
Bettina Federal Institute for Health Protec-tion of Consumers and VeterinaryMedicine
Berlin Germany

135
NAME FIRSTNAME
INSTITUTION CITY COUNTRY
34. Schneider Klaus Forschungs- und BeratungsinstitutGefahrstoffe GmbH
Freiburg/Brsg. Germany
35. Schulz Christine Umweltbundesamt. "Umweltbeo-bachtung, einschließlich Human-und Biomonitoring"
Berlin Germany
36. Schümann Michael AgE Arbeitsgruppe Epidemiologieder BAGS und des IDME/UKE
Hamburg Germany
37. Schwab Matthias Margarete Fischer Bosch Institutfür Klinische Pharmakologie
Stuttgart Germany
38. Snodgrass Wayne R. University of Texas MedicalBranch, Clinical Pharmacology,Medical Toxicology
Houston, TX USA
39. Stauber Franz BASF Ludwigshafen Germany
40. Steenbek-kers
Bea Dept. Consumer Technology andProduct UseWageningen University
Wageningen The Neth-erlands
41. van der Jagt Katinka TNO Nutrition and Food Research
Chemical Exposure Assessment
Zeist The Neth-erlands
42. van Engelen Jacqueline Rijksinstituut vor Volksgezondheiten Milieuhygiene (RIVM), Centrumvoor Stoffen en Risicobeoordeling(CSR)
Bilthoven The Neth-erlands
43. Vieth Bärbel Federal Institute for Health Protec-tion of Consumers and VeterinaryMedicine
Berlin Germany
44. Wallén Maria National Chemicals Inspectorate(KemI)
Solna Sweden
45. Wilks Martin Syngenta Crop Protection AG Basel Switzer-land
46. Wintermeyer Dirk Umweltbundesamt, "Gesundheits-bezogene Exposition, Innenraum-hygiene
Berlin Germany

136
IX. Workshop Programme
Federal Institute for Health Protection ofConsumers and Veterinary Medicine
Workshop "Exposure of Children to Pesticides"27th - 29th September, 2001, Berlin
Under the auspices of the "Action Programme Environment and Health” (the German Na-tional Environmental Health Action Plan supported by the German Federal Ministries forHealth and the Environment, Nature Conservation and Nuclear Safety, the BgVV will or-ganise a workshop "Exposure of Children to Pesticides". The workshop will address spe-cial problems of exposure assessment for children. Scenarios and approaches for expo-sure assessment will be discussed on the basis of exposures to pesticides which coversan important items of the " Forum Children's, Environment and Health" to be held in Mu-nich on November 23rd and 24th.
venue:Federal Institute for Health Protection of Consumers and Veterinary Medicine; Bundesin-stitut für gesundheitlichen Verbraucherschutz und Veterinärmedizin, BgVV)meeting place:27. 9.2001: Umweltbundesamt, Corrensplatz 1, 14195 Berlin28./29. 9. 2001: Harnack-Haus, Tagungsstätte der Max-Planck-Gesellschaft zur Förde-rung der WissenschaftenIhnestraße 16-20, 14195 Berlin
The workshop will be held with ca. 30 invited experts working on health and exposure as-sessment, risk assessment for pesticides and statistics.The main objective of the workshop is to prepare a proposal for an approach of exposureassessment for children. In this context, the residential exposure to pesticides will betaken as an example The workshop will elaborate minimal requirements which areneeded to perform an adequate assessment. This includes the characterisation of theuse of substances and products, how they are released and transferred to the site of ex-posure, e.g. by residential contact after use by professionals or consumers, via contami-nation of indoor air, dust, soil, and food.
To address the question of children as a vulnerable population, toxicogenetics and toxi-cokinetics will be discussed, as well as children's special behaviour, e.g. mouthing, andhealth effects that can be observed.

137
Because measurement data are seldomly available to perform residential exposure as-sessments, models need to be developed. Data to be fed into those models need valida-tion.The consideration of variability and uncertainty of the data, models, and the respectiveresults has obtained an increased importance. The impact of statistical methodology andthe advantages and limits of probabilistic a ssessments will be addressed.
The workshop will be divided into three parts on three days:Day one: Lectures giving overviews of the main items will be held to the plenum. This
first day is also open for other interested persons, registration will be re-quired.
Day two: Closed working groups will be formed to work out recommendations.Day three: Presentation and discussion of the papers in the plenum.After the workshop, the papers will be reviewed and finalised by e-mail under the co-ordination of the chairs and rapporteurs of the working groups.
Agenda
Thursday, 27th SeptemberOn the first day, invited lectures are planned to cover the following items (9°° 18°°):
Are children more vulnerable than adults?
• Influence of age on factors that limit the internal exposure(W. Snodgrass, Houston, TX)
• Impact of pharmacogenetics for toxicity of xenobiotics in children(M. Schwab, Stuttgart, D)
• Behaviour patterns as a specific factor limiting exposure of children(B. Steenbekkers, Bilthoven, NL)
Characerisation of pesticide exposure to children
• Heavy metals, pentachlorphenol, pyrethroids, and allergens in house dust from child-ren’s dwellings(U. Frank, Leipzig, D)
• Pathways of pesticide exposures for children(K. van der Jagt, Zeist, NL)
• An overview and characterization of the use of pesticides in German households(J. Herrmann, Berlin, D)
• The EPA childrens pesticides exposure measurement program(L. Sheldon, Research Triangle Park, NC)
138
Health effects in children from pesticide exposures
• The WHO-survey for the identification of health hazards to pesticide exposures(N. Besbelli, Geneva, CH)
• Biomonitoring for the assessment of exposure to some pyrethroid pesticides inFrankfurt(U. Heudorf, Frankfurt, D)
• Health effects from exposure to pesticides in Germany(H. Desel, Göttingen, D)
• A Review of the Effects ofLow-level Exposure to OP Pesticides in Children.(J. Hughes and A. Capleton, Leicester, UK)
Estimation of exposure by modelling and/or measuring
• What is needed for modelling exposure to pesticides?(H. Ozkaynak, Research Triangle Park, NC)
• Requirements for models used for exposure assessment to pesticides.(L. Rosenheck, Greensboro, NC)
• Deterministic versus probabilistic estimation of exposure?(O. Mosbach-Schulz, Bremen, D)
• Uncertainty and variability of exposure data(O. Mekel, Bielefeld, D)
In addition to lectures, studies related to the workshop objectives will be presented asposters.1. Exposure to kreosote to children from wood-impregnation on playing grounds
(A. Boehncke, Hannover, D)
2. Homes with wool carpets, treated with permethrin - Exposure of adults and children(E. Berger-Preiß, Hannover, D)
3. German Environmental Survey 1990/92 (GerES II) and 1998 (GerES III): PCP in urine of theGerman population - spatial and temporal differences(C. Schulz, Berlin, D)
4. German Environmental Survey 1998 (GerES III): Biocides in house dust(K. Becker, Berlin, D)
5. Biocide emissions from indoor wall paints(Horn, Berlin D).
6. Areas of High Agricultural Pesticide Use in California:How Many Children Live There?(M. Harnly, Oakland, CA)
7. Dokumentation of pesticide use in the European Union(L. Neumeister, Hamburg, D
8. Models of exposure assessment of undesirable substances in foods - adults and children(B. Schmidt-Faber, Berlin,D).
9. Evaluation of symptoms from acute and chronic exposures of organophosphates and pyre-throids(A. Hahn, Berlin)
10. Pesticides in mother's milk(B. Vieth, Berlin)

139
Friday, 28th September
900 - 1800 working groups
Working group 1:
Children as a vulnerable group?
Topics to be addressed: Toxicokinetics, toxicogenetics, health effects of pes-ticide exposures in childrenChairman: W. R. Snodgrass, ChairpersonRapporteur: F. Bois, G. Charnley
Working group 2:
Modelling exposure of children to pesticides.
Topics to be addressed: Scenarios and models of exposure estimation, needsfor data, uncertainty and variability.Chairman: M. SchümannRapporteur: J. van Engelen, O.Mekel
Working group 3
Residential uses of pesticidesTopics to be addressed: Identification and characterisation of main pesticideuses in households, direct and indirect usesChairman: C. LunchickRapporteur: L. Neumeister, K. van der Jagt
Working group 4
Behaviour of children as a factor determining exposure,
Topics to be addressed: Behaviour of children that leads to typical exposures,children's time budgetsChairman: S. OlinRapporteur: B. Steenbekkers, N. Freeman

140
Saturday, 29th September
Plenum discussion
9°° Report of the 1st working group
930 Discussion and further resumee
1015 Coffee break
1045 Report of the 2nd working group
1115 Discussion and further resumee
1200 Lunch break
1300 Report of 3rd working group
1330 Discussion and further resumee
1415 Report of 4th working group
1445 Discussion and further resumee
1530 Closing ceremony
1600 End of the meeting


![Exposure Draft for the Hazardous Substances (Hazardous ... · 1. The EPA proposes to issue a Hazardous Substances (Hazardous Property Controls) Notice [the HPC Notice] that will set](https://img.dokumen.tips/doc/110x75/5f02b52b7e708231d4059c86/exposure-draft-for-the-hazardous-substances-hazardous-1-the-epa-proposes-to.jpg)


![Technical Report: The NIOSH Occupational Exposure Banding … · 2019-07-10 · guidance on thousands of chemical substances that lack reliable exposure limits [OSHA 2014]. To protect](https://img.dokumen.tips/doc/110x75/5f75491daa28313552112564/technical-report-the-niosh-occupational-exposure-banding-2019-07-10-guidance.jpg)