Embed Size (px)
Citation preview

The 2nd Workshop on Greenhouse Gas Inventories in Asia Region
7-8 February 2005, Shanghai, China
Proceedings
Ministry of the Environment, Japan
National Institute for Environmental Studies (NIES), Japan

The 2nd Workshop on Greenhouse Gas
Inventories in Asia Region 7-8 February 2005, Shanghai, China
Proceedings
Ministry of the Environment, Japan National Institute for Environmental Studies (NIES), Japan


Opening Remarks
Dr. Shuzo Nishioka (Japan)
Mr. Aimin Ma (China)
Prof. Zhang Yutian (China)

Chair & Co-Chairs
Ms. Mimi Nameki (Japan) Dr. Rizaldi Boer (Indonesia) Mr. Syamphone Sengchandala (Lao P.D.R)
Dr. Shuzo Nishioka (Japan) Mr. Dominique Revet (UNFCCC)
Dr. Damasa Macandog (Philippines) Dr. Sirintornthep Towprayoon (Thailand)

The 2nd Workshop on Greenhouse Gas Inventories in Asia Region 7-8 February 2005, Shanghai, China
Proceedings
-------------------------------- CONTENTS
------------------------- 1. Preface 2. Executive Summary …………………………………………………………………… 1 3. Chairpersons’ Summary……………………………………………………………….. 4
Attachment I: Agenda …………………………………………………………….. 12 Attachment II: List of Participants…………………………………………………. 15
--------------------------------------------------------------------------------------------------------------- 4. Documents (i) Presentations
1) Overview of workshop and explanation of schedule by Dr. Hideaki Nakane…….. 22
2) IPCC’s work for GHG inventory guidelines and national communications from non-Annex I Parties by Mr. Taka Hiraishi…………………………………………. 27
3) Submission of Viet Nam’s Initial National Communication
by Mr. Hoang Manh Hoa…………………………………………………………… 43
4) Submission of India’s Initial National Communication by Dr. Subodh Kumar Sharma……………………………………………………… 56
5) Submission of China’s Initial National Communication by Dr. Qingxian Gao….. 78
6) Current status of the GHG inventory in Japan by Ms. Mimi Nameki……………. 99
7) Development of application procedures of the Tier 2 methodology for CH4 emission from Korean landfills by Prof. Seungdo Kim……………………………………… 110
8) IPCC Good Practice Guidance for Land Use, Land-Use Change and Forestry
by Mr. Leandro Buendia………………………………………………………….. 123

9) Overview of the APN CAPaBLE Programme by Dr. Linda Anne Stevenson…….. 135
10) Introduction of the APN CAPaBLE Project “Capacity Building for GHG Inventory Development in Asia-Pacific Developing Countries (APN CAPaBLE GHG Inventory Project)” by Dr. Hideaki Nakane…………….. 145
11) Cambodia’s LULUCF inventory improvement under the APN CAPaBLE GHG Inventory Project by Mr. Thy Sum……………………………………………….. 148
12) Rapid and accurate measurements of methane emissions from rice paddies under the APN CAPaBLE GHG Inventory Project by Dr. Amnat Chidthaisong…………154
13) Identification of regionally-significant source/sink categories in Asia by Ms. Chisa Umemiya …………………………………………………………… 172
(ii) Other documents
i) Emission Factor Database (EFDB) ………………………………………………….... 181 ii) Mongolia’s GHG inventory: ST and LT strategy …………………………………………. 187 iii) Indonesia: Climate Change Activities …………………………………………...... 197
(iii) Appendix
i) National Communications to the UNFCCC of Countries that participated in the 1st and/or 2nd Workshop on GHG Inventories in Asia Region (WGIA)

Executive Summary
1 1

The 2nd Workshop on GHG Inventories in Asia Region 7 – 8 February 2005, Shanghai, China
EXECUTIVE SUMMARY
The Second Workshop on Greenhouse Gas (GHG) Inventories in Asia Region (WGIA) was attended by governmental officials and scientists from 10 countries and representatives of three international organizations.1 It was organized by the Ministry of the Environment, Japan and the National Institute for Environmental Studies (Japan) and hosted by the Chinese Research Academy of Environmental Science. Objectives of the meeting were to (1) update each other on the most up-to-date situation of GHG inventories in Asia, (2) share useful information and experiences in GHG inventory preparation, and (3) discuss future activities of the Asian network. During updates on the status of GHG inventories, participants received information on the Intergovernmental Panel on Climate Change (IPCC) work for GHG inventory guidelines and resources available for UNFCCC National Communications from non-Annex I Parties. Some resources that were mentioned include the (1) UNFCCC User Manual for the guidelines on national communications from non-Annex I Parties, 2 (2) various documents of the IPCC National Greenhouse Gas Inventory Programme (NGGIP),3 and (3) the IPCC’s Emission Factor Database.4 Work is under way to produce 2006 IPCC GHG inventory guidelines. Also, the UNFCCC website provides some useful materials, particularly a plain-language description (“User Manual”) of the latest UNFCCC guidelines for national communications (decision 17/CP.8), as well as the “NAI Update,”5 a brief newsletter on issues relevant for non-Annex I Parties which is released shortly after each Subsidiary Body (SB) meeting. China, India and Viet Nam reported on their submission of Initial National Communications to the UNFCCC Secretariat (in Nov. 2004, June 2004, and Nov. 2003, respectively). Of the participating countries in the WGIA, all countries have now submitted their Initial National Communications, while Korea has submitted its Second, and Japan has submitted its Third. A presentation was made on the GHG Inventory Project (Capacity Building for GHG Inventory Development in Asia-Pacific Developing Countries) supported by the APN CAPaBLE Programme. 6 It includes pilot studies in Cambodia and Thailand aiming to improve GHG
1 Countries that participated in the 1st and/or 2nd WGIA meetings include Cambodia, China, India, Indonesia, Japan,
Korea, Lao PDR, Mongolia, Philippines, Thailand, Viet Nam (Mongolia was unable to attend this time). 2 http://unfccc.int/files/essential_background/application/pdf/userman_nc.pdf3 www.ipcc-nggip.iges.or.jp4 www.ipcc-nggip.iges.or.jp/EFDB/main.php5 http://unfccc.int/national_reports/non-annex_i_natcom/nai_update/items/347txt.php 6 APN=”Asia-Pacific Network for Global Change Research (APN),” CAPaBLE=”Scientific Capacity Building and
2

inventories, establish sustainable systems for GHG inventories, provide more realistic emission factors reflecting country and regional conditions, and exchange information with other developing countries for better GHG inventories. Participants in the WGIA summarized constraints and problems that countries have experienced in GHG inventory compilation in the following four categories: (1) activity data for all five sectors7 (data is not being collected in some sectors; data has been collected but may not be readily accessible; data is accessible but there are problems with format and conversion; and data is available but there are problems with reliability), (2) emission factors (local EFs are needed that specifically reflect local conditions; more research is needed to improve EF quality); (3) capacity building (needed for experts responsible for GHG inventories) and (4) institutional arrangements (need to be improved, particularly at the national level, in order to facilitate greater efficiency and sustainability in preparing GHG inventories). The meeting discussed approaches to address these difficulties. The discussion concluded with a recommendation that countries encourage the following actions in the Asian region: (1) promote more sharing of experience among Asian countries regarding collection of activity data, updating of emission estimation methods, and refinement of emission factors; (2) put more effort into emission factors for the Asian region (compile relevant information on EFs that could be useful for other countries in the region that have similar environmental conditions; and submit locally-developed EFs to the IPCC’s Emission Factor Database to share with others); (3) share successful practices in each country regarding activity data and EFs, (4) strengthen the WGIA network, promote active use of the network’s mailing list, and participate in ongoing discussions on GHG inventories in Asia, and (5) compile reports; publish findings (e.g., related to research for GHG inventories, methodologies, local EFs, source/sink category analysis, etc.); and enhance the visibility of the activities of the WGIA. Participants welcomed a kind offer from the Philippines to host a third workshop in early 2006. In preparation for the workshop, participants will strive to have active communications between now and then.
Enhancement for Sustainable Development in Developing Countries.” See www.apn.gr.jp
7 Energy; industrial processes; agriculture; land use, land-use change and forestry (LULUCF); and waste.
3
Chairpersons’ Summary
Attachment I : Agenda Attachment II : List of Participants
4 4

The 2nd Workshop on GHG Inventories in Asia Region 7-8 February, 2005, Shanghai, China
Chairpersons’ Summary
Background 1. The Second Workshop on Greenhouse Gas (GHG) Inventories in Asia Region (WGIA) was
held in Shanghai, China on 7–8 February 2005 (one and a half days). It was organized by the Ministry of the Environment, Japan and the National Institute for Environmental Studies (Japan) and hosted by the Chinese Research Academy of Environmental Science. The workshop was held back-to-back with the Consultative Group of Experts (CGE) Hands-on Training Workshop on National GHG Inventories for the Asia-Pacific Region organized by the Secretariat of the UN Framework Convention on Climate Change (UNFCCC) from 8 to 12 February.
2. The workshop was attended by participants from 10 countries (Cambodia, China, India,
Indonesia, Japan, Korea, Lao PDR, Philippines, Thailand, Viet Nam), and representatives of three international organizations (the UNFCCC Secretariat, the Technical Support Unit of the IPCC National Greenhouse Gas Inventories Programme, and the Asia-Pacific Network for Global Change Research).
Opening Session 3. The opening session was chaired by Ms. Mimi Nameki of the Ministry of the Environment,
Japan who opened by pointing out that as the Kyoto Protocol will enter into force this month,
the role of GHG inventories will become even more important as a basis of climate change
policies. Dr. Shuzo Nishioka of the National Institute for Environmental Studies welcomed participants to the workshop and invited participants to consider future activities of this group as a network in Asia to improve GHG inventories. Mr. Aimin Ma of the Office to the National Coordination Committee on Climate Change (China) on behalf of the host country, welcomed participants to China and expressed his view that it is important for neighboring countries to learn from each other and share experiences relating to GHG inventories. Prof. Zhang Yutian of the Chinese Research Academy of Environmental Science also welcomed participants to China and expressed his hope for a fruitful workshop. He said that China had recently submitted its Initial National Communication (INC) to the UNFCCC Secretariat and he hoped that regional cooperation would benefit all countries in future GHG inventory work. Dr. Hideaki Nakane of the Greenhouse Gas Inventory Office of
5

Japan (GIO) described the objectives of the meeting as being (1) to update each other on the most up-to-date situation of GHG inventories in Asia, (2) to share useful information and experiences in GHG inventory preparation, and (3) to discuss future activities of the Asian network.
Session I: Update on the Status of Asian Inventories 4. Session 1 was co-chaired by Dr. Rizaldi Boer of Bogor Agricultural University in Indonesia
and Mr. Syamphone Sengchandala of Prime Minister’s Office of Lao PDR. In this session, presenters provided updates on activities since the first workshop, held in Phuket in 2003.
5. Mr. Taka Hiraishi of the Institute for Global Environmental Strategies (IGES) in Japan
presented information on the Intergovernmental Panel on Climate Change (IPCC) work for GHG inventory guidelines and resources available for UNFCCC National Communications from non-Annex I Parties. He referred participants to the UNFCCC User Manual for the guidelines on national communications from non-Annex I Parties,1 various documents of the IPCC National Greenhouse Gas Inventory Programme (NGGIP),2 and the IPCC’s Emission Factor Database.3 He pointed out that work is now under way to produce 2006 IPCC GHG inventory guidelines. In a comment, Mr. Dominique Revet of the UNFCCC Secretariat pointed out that the UNFCCC website 4 provides some useful materials, particularly a plain-language description (“User Manual”) of the latest UNFCCC guidelines for national communications (decision 17/CP.8), as well as the “NAI Update,”5 a brief newsletter on issues relevant for non-Annex I Parties which is released shortly after each Subsidiary Body (SB) meeting.
6. Next, three countries reported on their submission of Initial National Communications
(INC) to the UNFCCC Secretariat (see workshop proceedings for greater detail). First, Mr. Hoang Manh Hoa of the Ministry of Natural Resources and Environment of Viet Nam reported that his country had submitted its INC in November 2003 and gave a detailed description of its contents, including adaptation and mitigation efforts. Next steps are developing climate change scenarios in Viet Nam for 2010 to 2070, collecting data for the Second National Communication, continuing to study adaptation measures, and developing climate change project portfolio including potential Clean Development Mechanism
1 http://unfccc.int/files/essential_background/application/pdf/userman_nc.pdf2 www.ipcc-nggip.iges.or.jp3 www.ipcc-nggip.iges.or.jp/EFDB/main.php4 www.unfccc.int5 http://unfccc.int/national_reports/non-annex_i_natcom/nai_update/items/347txt.php
6

projects. 7. Next, Dr. Subodh Sharma of India’s Ministry of Environment and Forests reported that
India had submitted its INC in June 2004. He gave a detailed presentation of the main contents of the INC and explained the national institutional arrangements and the extensive work that had gone into the report. India had found that most of the IPCC default emission coefficients were not representative of India’s specific coefficients, and had to use a combination of indigenously-developed and the IPCC’s default emission factors. The shares of levels of inventory estimations in the INC were 23%, 70% and 7% for Tier 1, Tier 2, and Tier 3, respectively, and India desired to move to a higher tier in the future in many emission categories. Sectors requiring improvement in GHG emission estimates included energy, industrial processes, agriculture, LULUCF,6 and waste management.
8. Third, Dr. Qingxian Gao of the Chinese Research Academy of Environmental Science
reported that China had submitted its INC in November 2004. He described the development process and main contents of the INC. China’s experiences in preparing the INC including the following: some obstacles arose due to a lack of activity data; there were challenges in dealing with reliability and quality of data; much of the IPCC’s default data could not be applied directly to China; many models used for assessing the impacts of climate change were still introduced from abroad; the assessments of impacts were preliminary; and many uncertainties still existed. Dr. Gao reported that capacity building had been an important part of the entire INC exercise.
9. Then, Ms. Nameki of the Ministry of the Environment, Japan reported on the current status
of Japan’s GHG inventory at the national and local levels. At the national level, Japan started annual submission of its GHG inventory in 1996 and had now established the infrastructure and a routine for annual submissions, which allowed it to accurately track trends in overall emissions in each sector. At the local level, Japan had introduced the “Area Promotion Plan” which encourages local governments to plan local projects to tackle climate change. Japan's National Policy Programme on Climate Change includes a step-by-step process (in three phases, 2002-04, 2005-07, 2008-12) and fiscal 2004 marked the end of the first phase of implementation.
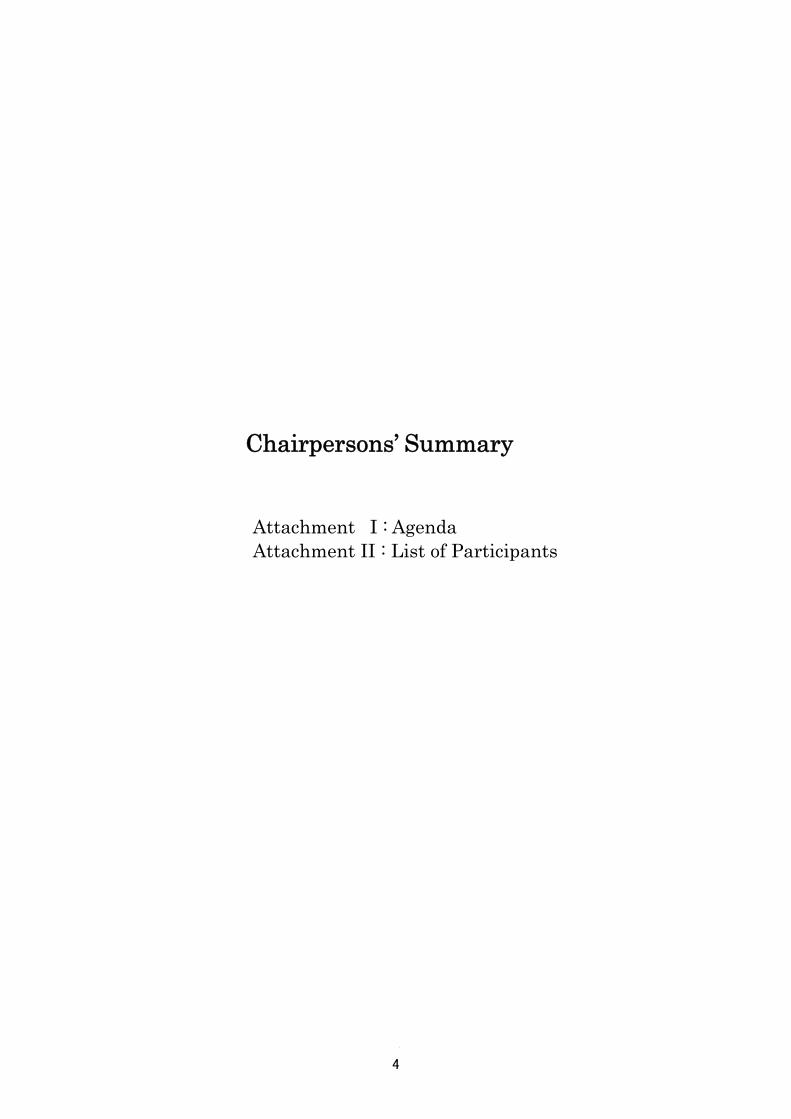
10. Finally, Prof. Seungdo Kim of Korea’s Hallym University made a presentation on his
country’s progress with procedures for estimating CH4 emissions from landfills using Tier
6 Land Use, Land-Use Change and Forestry
7

2 methodology. A comparison of this more rigorous Tier 2 (applying a specially developed Fortran code) with the IPCC’s Tier 1 methodology resulted in significantly different estimates for year-by-year emissions from a landfill. Some participants indicated their desire to obtain more details of the methodology in English.
11. The Co-Chairs summarized the session, saying that it was clear non-Annex I countries face
a number of challenges in preparing National Communications, and that capacity-building is still required. They said that GHG inventories could be enhanced by (1) improving institutional arrangements to make GHG inventory preparation a continuous process, (2) improving emission factors and sharing these with other countries that have similar characteristics, and (3) improving the methodologies for GHG emission estimates. Above all, it is clear that countries could benefit by sharing the information and experience that they gain through their respective work with GHG inventories and National Communications.
Session II: Sharing Useful Information and Experiences in GHG Inventory Preparation 12. Session II was co-chaired by Mr. Dominique Revet of the UNFCCC Secretariat and Dr.
Sirintornthep Towprayoon of King Mongkut’s University of Technology Thonburi in Thailand.
13. Mr. Leandro Buendia of the IPCC-Technical Support Unit for the National Greenhouse Gas
Inventories Programme made a presentation on the IPCC’s Good Practice Guidance for Land Use, Land-Use Change and Forestry (GPG-LULUCF), an extensive guide published in 2003 to support the development of good inventories. It also helps countries produce reliable estimates of the magnitude of uncertainties in GHG inventories, and describes how these uncertainties may be best managed to be acceptable for the UNFCCC. Default emission factors in the GPG-LULUCF are now accessible from the Emission Factor
Database7and many other materials are available from the main website. 14. Dr. Linda Stevenson of the Asia-Pacific Network for Global Change Research (APN)8
presented the APN CAPaBLE Program (Scientific Capacity Building and Enhancement for Sustainable Development in Developing Countries). One project the APN is currently funding (approximately US$120,000 over three years) is the APN CAPaBLE GHG
7 www.ipcc-nggip.iges.or.jp/EFDB/main.php8 www.apn.gr.jp
8

Inventory Project (Capacity Building for GHG Inventory Development in Asia-Pacific Developing Countries). Dr. Hideaki Nakane of the Greenhouse Gas Inventory Office of Japan, as the APN Project Leader for this project, introduced the project which includes pilot studies in Cambodia and Thailand. Among the project’s top aims are (1) to improve GHG inventories, (2) to establish sustainable systems for GHG inventories, (3) to provide more realistic emission factors reflecting country and regional conditions, and (4) to exchange information with other developing countries for better GHG inventories.
For Cambodia, Mr. Thy Sum of the Ministry of the Environment presented its work under the APN CAPaBLE GHG Inventory Project to improve GHG inventories for LULUCF, through trainings in Japan and field work in Cambodia to measure aboveground biomass and biomass growth rates of deciduous, evergreen and secondary forests.
For Thailand, Dr. Amnat Chidthaisong of King Mongkut’s University of Technology Thonburi made a presentation on a new instrument, developed by NIES and assembled under the APN CAPaBLE GHG Inventory Project, a semiconductor-based sensor that can measure methane flux in various situations, including rice paddies. The new sensor can replace the gas chromatographic measurement of sampling air from a chamber which is commonly used for this purpose, as the sensor is mobile (fits in a suitcase), makes quick measurements, is reliable and accurate, offers lower cost per measurement, and is relatively easy to operate. Under the APN CAPaBLE GHG Inventory Project, he has received training in Japan to use this instrument, plans to put it to use soon in methane emission measurements in various rice cultivation schemes in order to develop an emission factor database for methane emissions in Thailand, and hopes to share his experiences in the future with other countries in the region.
15. Ms. Chisa Umemiya of the Greenhouse Gas Inventory Office of Japan identified the
regionally-significant source/sink categories in Asia by applying the key category analysis method by nation and found that the characteristics of those categories differ across regions. She suggested one of the future activities of the region would be improving the accuracy of emission factors and activity data of those identified categories. Dr. Qingxian Gao said that differences in regional characteristics of key categories in the waste sector in her analysis might originate from different waste management practices used in different regions. Mr. Hiraishi mentioned that the methodology of her analysis should be discussed further in order to identify the regionally-significant categories where participating countries need real improvement in quality of GHG emissions estimations.
9

16. The Co-Chairs summarized the discussions of this session, saying that participants had
gained useful information. The discussion on the regionally-significant source/sink categories had stimulated thinking on these topics and deserves further discussion in the future. Also, there is an obvious link between the technical work being done, for example, at the IPCC level with regard to methodologies, on one hand, and the need for in-country capacity building, on the other.
Session III: Future Activities of the WGIA Community 17. Session 3 was co-chaired by Dr. Shuzo Nishioka and Dr. Damasa Macandog of the
University of the Philippines Los Banos. To begin with, Dr. Gao, as rapporteur, presented a summary of the previous day of discussions.
18. The meeting then discussed the constraints and problems that participants’ countries have
experienced in GHG inventory compilation. Common issues included the following: (a) Activity Data (for all five sectors)9
• Data is not being collected in some sectors. • Data has been collected but may not be readily accessible. • Data is accessible but there are problems with format and conversion. • Data is available but there are problems with its reliability.
(b) Emission Factors
• Local emission factors that specifically reflect local conditions need to be developed.
• More research studies are needed to improve quality of emission factors. (c) Capacity Building
• Capabilities of experts responsible for GHG inventories need to be enhanced. (d) Institutional Arrangements
• Institutional arrangements need to be improved, particularly at the national level, in order to facilitate greater efficiency and sustainability in preparing GHG inventories.
19. The meeting then discussed approaches to address these difficulties. The discussion
concluded with a recommendation for countries to encourage the following actions in the Asian region:
9 Energy; industrial processes; agriculture; land use, land-use change and forestry (LULUCF); and waste.
10

(a) Promote greater sharing of experience among Asian countries regarding collection of activity data, updating of emission estimation methods, and refinement of emission factors.
(b) Emission factors for the Asian region
• Compile relevant information on emission factors that could be useful for other countries in the region that have similar environmental conditions.
• Submit locally-developed emission factors to the IPCC’s Emission Factor Database to share with others.
(c) Share experience of successful practices in each country regarding activity data and emission factors.
(d) Strengthen the WGIA network, promote active use of the network’s mailing list, and participate in ongoing discussions on GHG inventories in Asia.
(e) Compile reports (including proceedings of this workshop); publish findings (e.g., related to research for GHG inventories, methodologies, local emission factors, source/sink category analysis, etc.); and enhance the visibility of the activities of the WGIA in the IPCC, CDM and CGE communities, for the benefit of all in their GHG inventory work.
20. Finally, the meeting discussed plans for a third WGIA workshop. Participants welcomed a
kind offer from the Philippines (University of the Philippines Los Banos, Department of Environment and Natural Resources, and the Manila Observatory) to host the meeting in early 2006. In preparation for the workshop, participants will strive to have active communications between now and then.
Closing Session 21. Dr. Nishioka wrapped up the workshop, thanking everyone for their contributions. Dr. Gao
thanked participants for coming to Shanghai and expressed his hopes that everyone had enjoyed
their time here. Ms. Nameki reviewed the main topics of discussions and mentioned that many
issues still remain to be discussed and addressed. Limited time and resources mean that
countries need to find the most efficient way to enhance the accuracy of GHG inventories so
that they reflect the local conditions of the Asian region. She urged everyone to keep working
together and was confident that the network established through this workshop would be of
great help for that purpose. The participants thanked the Japanese organizers for organizing the
workshop, and expressed special appreciation to the host organization in China for the warm
hospitality and fine venue.
11

Attachment I
The 2nd Workshop on GHG Inventories in Asia Region (WGIA) 7-8 February 2005, Shanghai, China
Agenda
Day 1, Monday 7th February 9:00~9:30 Participant Registration
9:30~10:30 Opening Session (60 min.)
Chair: Ms. Mimi Nameki, Japan
9:30~ 9:35 Dr. Shuzo Nishioka, Japan
Welcome address (5 min.)
9:35~ 9:40 Mr. Aimin Ma, China
Welcome speech from host country (5 min.)
9:40~9:45 Prof. Zhang Yutian, China
Welcome speech from host country (5 min.)
9:45~ 10:05 All Introduction of participants (20 min.)
10:05~10:20 Dr. Hideaki Nakane, Japan
Overview of workshop and explanation of schedule (13 min. + 2 min.)
10:20~10:30 All Questions (10 min.)
10:30~10:45 Tea Break (15 min.)
10:45~12:55 SessionⅠ: Update on the status of the Asian
inventories (130 min.)
Co-chairs: Dr. Rizaldi Boer, Indonesia & Mr. Syamphone Sengchandala, LAO P.D.R
10:45~11:05 Mr. Taka Hiraishi, Japan
IPCC’s work for GHG inventory guidelines and national communications from non-Annex I Parties (15 min. + 5 min.)
11:05~11:20 Mr. Hoang Manh Hoa, Viet Nam
Submission of Viet Nam’s Initial National Communication (10 min. + 5 min.)
12

11:20~11:40 Dr. Subodh Kumar Sharma, India
Submission of India’s Initial National Communication (15 min. + 5 min.)
11:40~12:00 Dr. Qingxian Gao, China
Submission of China’s Initial National Communication (15 min. + 5 min.)
12:00~12:20 Ms. Mimi Nameki, Japan
Current status of the GHG inventory in Japan (15 min. + 5 min.)
12:20~12:40 Prof. Seungdo Kim, Republic of Korea
Development of application procedures of the Tier 2 methodology for CH4 emission from Korean landfills (15 min. + 5 min.)
12:40~12:55 All Questions and discussion (15 min.)
12:55~14:25 Lunch Time (90 min.)
14:25~15:30 SessionⅡ: Sharing useful information and
experiences in GHG inventory preparation (65 min.)
Co-chairs: Mr. Dominique Revet, UNFCCC & Dr. Sirintornthep Towprayoon, Thailand
14:25~14:50 Mr. Leandro Buendia, IPCC-NGGIP/TSU
IPCC Good Practice Guidance for Land Use, Land-Use Change and Forestry (18 min. + 7 min.)
14:50~15:00 Dr. Linda Anne Stevenson, APN
Overview of the APN CAPaBLE Programme (8 min. + 2 min.)
15:00~15:10 Dr. Hideaki Nakane, Japan
Introduction of the APN CAPaBLE Project “Capacity Building for GHG Inventory Development in Asia-Pacific Developing Countries (APN CAPaBLE GHG Inventory Project)” (8 min. + 2 min.)
15:10~15:30 Mr. Thy Sum, Cambodia
Cambodia’s LULUCF inventory improvement under the APN CAPaBLE GHG Inventory Project (15 min. + 5 min.)
15:30~15:45 Tea Break (15 min.)
15:45~17:00 SessionⅡ: Sharing useful information and
experiences in GHG inventory preparation (75 min.)
13

15:45~16:10 Dr. Amnat Chidthaisong, Thailand
Rapid and accurate measurements of methane emissions from rice paddies under the APN CAPaBLE GHG Inventory Project (18 min. + 7 min.)
16:10~16:30 Ms. Chisa Umemiya, Japan
Identification of regionally-significant source/sink categories in Asia (15 min. + 5 min.)
16:30~17:00 All Questions, discussion, and wrap-up of Day 1 (30 min.)
Day 2, Tuesday 8th February
9:00~10:30 SessionⅢ: Discussion for the future activities of the
WGIA community (90 min.)
Co-chairs: Dr. Shuzo Nishioka, Japan & Dr. Damasa Macandog, Philippines
9:00~9:20 Rapporteur: Dr. Qingxian Gao, China
Report on Day 1 (20 min.)
9:20~10:15 All - Enhancement of use of WGIA as an effective network- Common features of GHG inventory preparation - How to determine short term strategies - Roles of each country and work plans (55 min.)
10:15~10:30 All Wrap-up of the discussion (15 min.)
10:30~11:30 Tea Break (60 min.)
11:30~12:00 Closing Session (30 min.)
11:30~11:50 Dr. Shuzo Nishioka, Japan
Wrap-up (20 min.)
11:50~11:55 Dr. Qingxian Gao, China
Closing remarks (5 min.)
11:55~12:00 Ms. Mimi Nameki, Japan
Closing remarks (5 min.)
14

Attachment II
LIST OF PARTICIPANTS
THE 2nd WORKSHOP ON GHG INVENTORIES IN ASIA REGION 7-8 February 2005, Shanghai, China
CAMBODIA Mr. Thy SUM Chief, Climate Change Office, Ministry of Environment 48, Samdech Preah Sihanouk Blvd., Chamkarmon, Phnom Penh, CAMBODIA Mr. Chan Thou CHEA Chief of Office, Ministry of Environment, Department of Planning and Legal Affairs 48, Room 303, Preah Sihanouk Blvd., Phnom Penh, CAMBODIA CHINA Dr. Qingxian GAO Center for Climate Impact Research, SEPA Chinese Research Academy of Environmental Science 8 Da Yangfang, An Wai, Beijing 100012, CHINA Prof. Zhang YUTIAN Director, International Cooperation Center Chinese Research Academy of Environmental Science 8, Da Yangfang, An Wai, Beijing100012, CHINA
Mr. Aimin MA Deputy Division Director Office to the National Coordination Committee on Climate Change National Development and Reform Commission 38, Yuetan Nanjie, Beijing 100824 CHINA Dr. Xinyou HUANG Department of Electronic Engineering Nanjing University of Information Science and Technology Nanjing, Jiangsu 210044 CHINA Mr. Huaqing XU National Project Coordinator of Initial National Communication Director, Professor, Center for Energy, Environment and Climate Change Energy Research Institute, National Development and Reform Commission, CHINA B-1405, Guohong Building, Muxidibeili, Beijing 100038, CHINA Dr. Xiaosu DAI Director of Climate Change Division
15 15

Department of Scientific and Technological Development China Meteorological Administration, CHINA INDIA Dr. Subodh Kumar SHARMA Adviser Ministry of Environment and Forests Government of India Paryavaran Bhawan, CGO Complex Lodi Road, New Delhi, INDIA Dr. Sumana BHATTACHARYA Expert Consultant, Natcom, India Project Management Cell Winrock International India 1, Navjeevan Vihar, New Delhi 110017 INDIA INDONESIA Mr. Mochamad NATSIR Head of Sub Division for Climate Change Adaptation, Ministry of Environment Jl. D.I. Panjaitan Kav. 24 Kebon Nanas, Jakarta Timur, INDONESIA 13410 Dr. Rizaldi BOER Head of Laboratory of Climatology Department of Geophysics and Meteorology Faculty of Mathematics and Natural Sciences, Bogor Agricultural University Kampus IPB Darmaga, Darmaga Bogor, INDONESIA
JAPAN Ms. Mimi NAMEKI Deputy Director Climate Change Policy Division, Global Environment Bureau Ministry of the Environment 1-2-2, Kasumigaseki, Chiyoda-ku, Tokyo 100-8975 JAPAN Dr. Shuzo NISHIOKA Executive Director National Institute for Environment Studies 16-2, Onogawa, Tsukuba, Ibaraki 305-8506 JAPAN Dr. Hideaki NAKANE Manager Greenhouse Gas Inventory Office of Japan Center for Global Environmental Research National Institute for Environment Studies 16-2, Onogawa, Tsukuba, Ibaraki 305-8506 JAPAN Mr. Tomoyuki AIZAWA Researcher Greenhouse Gas Inventory Office of Japan Center for Global Environmental Research National Institute for Environment Studies 16-2, Onogawa, Tsukuba, Ibaraki 305-8506 JAPAN Ms. Chisa UMEMIYA Assistant Fellow Greenhouse Gas Inventory Office of Japan Center for Global Environmental Research National Institute for Environment Studies
16 16

16-2, Onogawa, Tsukuba, Ibaraki 305-8506 JAPAN Mr. Takashi MORIMOTO Cooperation Researcher, Greenhouse Gas Inventory Office of Japan (Analyst, Climate Change Mitigation Policy Group, Environmental Policy Consulting Department, UFJ Institute Ltd.) UFJ Institute Ltd. 1-11-7, Shinbashi, Minato-ku, Tokyo 100-8631 JAPAN Mr. Taka HIRAISHI Senior Consultant, Institute for Global Environmental Strategies (Co-chair, IPCC National Greenhouse Gas Inventories Programme) Institute for Global Environmental Strategies 2108-11 Kamiyamaguchi, Hayama, Miura, Kanagawa, 240-0115, JAPAN KOREA (ROK) Prof. Seungdo KIM Associate Professor Department of Environmental System Engineering Hallym University 39 Hallymdaehak-gil Chuncheon Gangwon-do 200-702, REPUBLIC OF KOREA Ms. Sanghee UM Staff, Pyrolysis Research Laboratory Department of Environmental System Engineering
Hallym University 39 Hallymdaehak-gil Chuncheon Gangwon 200-702, REPUBLIC OF KOREA LAO P.D.R. Mr. Syamphone SENGCHANDALA Deputy Director of Environment Impact Assessment Division Science Technology and Environmental Agency, Prime Minister’s Office Ban Sisavad, Nahaydoi Road, P.O. Box 2279, Vientiane, LAO P.D.R. PHILIPPINES Ms. Raquel Ferraz VILLANUEVA Supervising Environmental Management Specialist Environmental Management Bureau Department of Environment and Natural Resources Felbet’s Bldg., Lanang, Davao City PHILIPPINES Dr. Damasa MACANDOG Institute of Biological Science, University of the Philippines at Los Banos College, Launa 4031 PHILIPPINES THAILAND Ms. Aree Wattana TUMMAKIRD Chief of Measures Analysis Section Office of Natural Resources and Environmental Policy and Planning (ONEP)
17 17

61/1 Soi Phibun Wattana 7, Rama VI Road, Bangkok 10400, THAILAND Dr. Sirintornthep TOWPRAYOON Associate Professor The Joint Graduate School of Energy and Environment King Mongkut’s University of Technology Thonburi 91 Pracha-Uthit Road, Bangmod, Tungkru Bangkok 10140, THAILAND Dr. Amnat CHIDTHAISONG Lecturer The Joint Graduate School of Energy and Environment King Mongkut’s University of Technology Thonburi 91 Pracha-Uthit Road, Bangmod, Tungkru Bangkok 10140, THAILAND VIET NAM Mr. Hoang Manh HOA Senior Expert and Researcher on Climate Change National Office for Climate Change and Ozone Protection, International Cooperation Department, Ministry of Natural Resources and Environment of Viet Nam 51, Quang Trung Street, Ha Noi, VIET NAM INTERNATIONAL ORGANIZATIONS UNFCCC
Mr. Dominique REVET Programme Officer United Nations - Climate Change Secretariat (UNFCCC) Implementation Programme, Non-Annex I Sub-Programme OBS - KennedyAllee 105 - 107 P.O. Box 260 124, D-53153 Bonn, GERMANY IPCC-NGGIP/TSU Mr. Leandro Valmonte BUENDIA Programme Officer Intergovernmental Panel on Climate Change Technical Support Unit for the National Greenhouse Gas Inventories Programme 2108-11 Kamiyamaguchi, Hayama, Miura, Kanagawa, 240-0115, JAPAN Asia-Pacific Network for Global Change Research (APN) Dr. Linda Anne STEVENSON Programme Manager for Scientific Affairs APN Secretariat IHD Centre Building, 5th Floor 1-5-1 Wakinohama Kaigan Dori Chuo-ku, Kobe 651-0073 JAPAN Dr. Chhemendra SHARMA APN Liaison Office for South Asia SASCOM c/o National Physical Laboratory Dr K. S. Krishnan Marg, New Delhi 110 012, INDIA
18 18

SECRETARIAT Mr. Randal HELTEN 408-1388 Nelson Street, Vancouver BC CANADA V6E 1J9 Ms. Kazuko WATANABE Workshop on GHG Inventories in Asia Region Secretariat 2-30-11, Shinkawa, Chuo-ku, Tokyo 104-0033 JAPAN Ms. Fumiko HIRASAWA Workshop on GHG Inventories in Asia Region Secretariat 2-30-11, Shinkawa, Chuo-ku, Tokyo 104-0033 JAPAN
19 19

DOCUMENTS
i) Presentations
ii) Other documents iii) Appendix
21 20

i) Presentations
22 21

1
Overview of workshop and Overview of workshop and explanation of scheduleexplanation of schedule
Hideaki Hideaki NakaneNakaneManager,Manager,
Greenhouse Gas Inventory Office of Japan (GIO),Greenhouse Gas Inventory Office of Japan (GIO),CenterCenter for Global Environmental Research (CGER),for Global Environmental Research (CGER),National Institute for Environmental Studies (NIES)National Institute for Environmental Studies (NIES)
Presented at the 2Presented at the 2ndnd Workshop of GHG Inventories in Asia Workshop of GHG Inventories in Asia regionregion
February 7February 7--8, 20058, 2005
2
Joint Hosting Organizations
Ministry of the Environment of JapanMs. Mimi Nameki
National Institute for Environmental Studies, Japan
Dr. Shuzo Nishioka
Chinese Research Academy of Environmental Science (Local Host)
Dr. Gao Qingxian
23 22

3
Participants
29 participants (governmental officials and researchers) from 11 countries
4 representatives from 3 international organizations
• UNFCCC Secretariat, Dr. Revet• IPCC-NGGIP/TSU, Dr. Leandro• Asia-Pacific Network for Global Change Research
(APN), Dr. Stevenson
Mr. Taka Hiraishi (IGES); Japan; IPCC’s work
4
Workshop objectives
1. Update the most up-to-date situation of GHG inventories in Asia
2. Share useful information and experiences in GHG inventory preparation and related research activities
3. Discuss on the future activities of the Asian network
24 23

5
Day 1 - Session 1
Objective 1: To update the most up-to-date situation of GHG inventories in Asia
Recent trend in IPCC/NGGIP and non-Annex-I NCsSubmission of new NCs by participating countriesExamples of some efforts of participating countries
Co-chaired by: Dr. R. Boer & Mr. S. Sengchandala
6
Objective 2: To share useful information and experiences in GHG inventory preparation
Use of IPCC GPG-LULUCFThe APN CAPaBLE Programme; A Project “Capacity Building for GHG Inventory Development in Asia-Pacific Developing Countries”Lessons learned from other projects, eg. the UNDP-GEF Regional Capacity Building ProjectMs. Chisa Umemiya (GIO) ; an example of analysis of the GHG inventories in Asia countries
Day 1 - Session 2Co-chaired by: Mr. D. Revet (UNFCCC) & Dr. S. Towprayoon
25 24

7
Objective 3: To discuss the future activities of the Asian network
Enhancement of effective use of the Asian networkHow to determine short term strategies for the regionRoles of each country and work plans
Day 2 - Session 3Co-chaired by Dr. S. Nishioka & Dr. D. Macandog and Dr. G. Qingxian as Rapporteur
eg. concrete outcomes; more visible
??????
Various ways, leaderships, roles, funding possibilities…:Let’s discuss together!!!
8
Expected outputs
Clear ideas of the latest circumstances in Asia and global of the GHG inventories and related activities Enhanced capacity to prepare GHG inventories and related researchMotivation and plans for the future activities of the Asian network
26 25

9
Roles of Co-chairs
To introduce yourselfTo remind the subject of the sessions at the beginning of the sessionTo make sure the session proceeds on time (Mr. Aizawa as the time-keeper)Very brief closing address may be helpful
27 26

IPCC’s Work for GHG Inventory Guidelinesand
National Communications from non-Annex I Parties
7 February 2005Taka Hiraishi <hiraishi@ iges.or.jp>
Senior ConsultantInstitute for Global Environmental S trategies (IGES)
2
Contents
• IPCC National Greenhouse Gas Inventory Programme (NGGIP) and UNFCCC Reporting
• Non-Annex I National Communications
28 27

3
IPCC – OrganisationWMO - UNEP
IPCC ChairIPCC
Secretariat
WMO/UNEP
IPCC Bureau
Working Group 1Science
Task Force onNational
Greenhouse GasInventories
Working Group 3Mitigation
Working Group 2Impact andAdaption
Technical SupportUnit
USA
Technical SupportUnit
Japan
Technical SupportUnit
UK
Technical SupportUnit
Netherlands
Experts - Authors - Contributors - Review Editors - Reviewers
4
IPCC NGGIP• IPCC/OECD/IEA GHG Inventories programme
started 1991 (within IPCC Working Group-I)• Since 1999 IPCC NGGIP (Technical Support Unit at
IGES/Japan)• Objectives and activities
– to develop and refine an internationally-agreed methodology and software for the calculation and reporting of national GHG emissions and removals; and
– to encourage the widespread use of this methodology by countries participating in the IPCC and by Parties of the United Nations Framework Convention on C limate C hange (UNFCCC).
29 28

5
IPCC - NGGIP Products“1995” and “Revised 1996” IPCC Guidelines for National
Greenhouse Gas Inventories<http://www.ipcc-nggip.iges.or.jp/public/gl/invs 1.htm>
(cf. COP Decisions 4/CP.1, 9 /CP.2, 2/CP.3 & 17/CP.8)
Volume 1Reporting
Instructions
Volume 2Workbook
+IPCC Software
Volume 3Reference
M anual
6
IPCC NGGIP ProductsIPPC Good Practice Guidance and Uncertainty
Management in National Greenhouse Gas Inventories<http ://www.ipcc-nggip .iges.or.jp /public/gp /english/> (All UN language versions)
Published in 2000
Complements the Revised 1996 IPCC Guidelines
- Endorsed by SBSTA12 -
Backg round Papers : IPCC Expert Meeting on Good Practice Gu idance and
Uncertainty Management in Nat ional GHG Inventories
Published in late 2002<http://www.ipcc-nggip.iges.or.j p/public/gp/gpg-bgp.htm >
30 29

7
IPCC NGGIP ProductsIPCC Good Practice Guidance for
Land use, Land-Use Change and Forestry, 2003<http://www.ipcc-nggip.iges .or.jp/public/gpglulucf/gpglulucf.htm>
- Actions by SBSTA at 19th, 20th & 21st(COP10) sessions -Complements the Revised 1996
IPCC Guidelines.GPG-LULUCF provides
supplementary methods and good practice guidance for estimating,
measuring, monitoring and reporting on carbon stock changes
and greenhouse gas emissions from LULUCF activities under Article
3, paragraphs 3 and 4, and Articles 6 and 12 of the K yoto Protocol.
8
Ongoing projects of the NGGIP
2006 IPCC Inventory Guide lines• Revis ion of the Revised 1996GLs;
– First authors meeting in May 2004, five meetings held.– Expert Review of F irst Order Draft to begin on 28 Feb.
2004;– Final Report to be ready in early 2006
• Invitation by SBSTA 17.
Database for emission factors and other parameters (EFDB project)
• Objective: to provide information on emission factors and other parameters needed in inventory calculations (robust; applicable; and documented)
31 30

9Http://www.ipcc-nggip.iges.or.jp/EFDB/main.php
EFDB Web applicationEFDB Web application
10
http://www.ipcc-nggip.iges.or.jp
32 31

National Communications: Guidelines for Non-Annex-I Parties
12
Legal Basis: UNFCCC Article 4.1 COMMITMENTSAll Parties, taking into account their common but differentiated
responsibilities and their specific national and regional development priorities, objectives and circumstances, shall:
(a) Develop, periodically update, publish and make available to the Conference of the Parties, in accordance with Article 12, national inventories of anthropogenic emissions by sources and removals by sinks of all greenhouse gases not controlled by the Montreal Protocol, using comparable methodologies to be agreed upon by the Conference of the Parties;
(j) Communicate to the Conference of the Parties information related to implementation, in accordance with Article 12.
33 32

13
Legal Basis: UNFCCC Article 12.1 Communication of Information Related to
ImplementationIn accordance with Article 4, paragraph 1, each Party shall communicate to the Conference of the Parties, through the secretariat, the following elements of information:
(a) A national inventory of anthropogenic emissions by sources and removals by sinks of all greenhouse gases not controlled by the Montreal Protocol, to the extent its capacities permit, using comparable methodologies to be promoted and agreed upon by the Conference of the Parties;
(b) A general description of steps taken or envisaged by the Party to implement the Convention; and
(c) Any other information that the Party considers relevant to the achievement of the objective of the Convention and suitable for inclusion in its communication, including, if feasible, materialrelevant for calculations of global emission trends.
14
Legal Basis: UNFCCC Article 12 (cont.)
• 5. <Annex I countries> shall make its initial communication within six months of the entry into force of the Convention for that Party. ... Each Party not so listed shall make its initial communication within three years of the entry into force of the Convention for that Party, or of the availability of financial resources in accordance with Article 4, paragraph 3. Parties that are least developed countries may make their initial communication at their discretion.
34 33

15
Non-Annex I Communication Guidelines[Decision 10/CP.2]
• National and regional development priorities, objectives and circumstances should, in accordance with Article 4.1, and the provisions of Article 3 and Artic le 4.3, 4.4, 4.5, 4.7, 4.8, 4.9 and 4.10, be taken into account by COPs in considering matters related to their initial communications; and
• Non-Annex I Parties which wish to submit vo luntarily additional information may use elements from the guidelines approved for Annex-I Parties when preparing their initial communications.
16
COP 8 Decisions related to NAI NCs
• Improved NAI NC Guidelines (Dec.17/CP.8)
• Continuation of CGE with the revised Terms of Reference (Dec.3/CP.8)
• Overall decision on NAI NCs (Dec.2/CP.8)
35 34

17
Non-Annex I Communication Guidelines [Dec.17/CP.8]
• Scope of NC:– A national inventory of anthropogenic emissions by
sources and removal by sinks of all greenhouse gases not controlled by the Montreal Protocol, to the extent its capacities permit, using comparable methodologies to be promoted and agreed upon by the Conference of the Parties;
– A general description of steps taken or envisaged by the non-Annex I Party to implement the Convention;
– Any othe r information that the non-Annex I Party considers relevant to the achievement of the objective of the Convention and suitable for inclusion in its communication, including, if feasible, material relevant for calculations of global emission trends
18
Non-Annex I Communication Guidelines[Dec.17/CP.8 ]
Principal Objectives of the Guidelines• To assist non-Annex I Parties in meeting their reporting
requirements under the Convention;• To encourage the presentation of information in a consistent,
transparent and comparable, as well as flexible manner, taking into account specific national circumstances;
• To facilitate the presentation of information on support required for the preparation and improvement of national communications from non-Annex I Parties;
• To serve as policy guidance to the operating entity of the financial mechanism for the timely provision of financial support needed by developing country Parties in order to meet the agreed full costs of complying with their obligations…
36 35

19
Non-Annex I Communication Guidelines[Dec.17/CP.8 ]
National circumstances– Non-Annex I Parties should provide a description of
their national and regional development priorities, objectives and circumstances, on the basis of which they will address climate change and its adverse impacts. …..
– Non-Annex I Parties are encouraged to provide a summary of relevant information regarding their national circumstances, as appropriate, in tabular form.
– Non-Annex I Parties may provide a description of existing institutional arrangements relevant to the preparation of their national communications on a continuous basis.
20
Non-Annex I Communication Guidelines[Dec.17/CP.8 ]
Inventory
– Each Non-Annex I Party shall, in accordance with Article 4, paragraph 1(a) and Article 12, paragraph 1(a ), co mmun icate to the Conference of the Parties a national inventory of anthropogenic emiss ions by sources and removals by s inks of all greenhouse gases (GHGs) not controlled by the Montreal Protocol, to the extent its capacities permits , following the provis ions in these guidelines .
– Non-Annex I Parties shall es timate national GHG inventories for the year 1994 for the in itia l national co mmunicat ion or alternatively may provide data for the year 1990. For the second national commun ication, non-Annex I Parties shall es timate national GHG inventories for the year 2000. The leas t developed country Parties could es timate their national GHG inventories for years at their discretion
– Non-Annex I Parties should use the Revised 1996 IPCC Guide lines for National Greenhouse Gas Inventories .
– Non-Annex I Parties are encouraged to apply the IPCC Good Practice Gu idance and Uncertainty Management in Nat ional Greenhouse Gas Inventories …, taking into account the need to improve transparency, consis tency, comparability, co mp leteness and accuracy in inventories .
37 36

21
Non-Annex I Communication Guidelines[Dec.17/CP.8 ]
Other information• General Description of steps taken or
envisaged to implement the Convention.• Other information considered relevant to
the achievement of the objective of the Convention.
• Constraints and gaps, and related financial, technical and capacity needs.
22
Non-Annex I Communication Guidelines[Dec.17/CP.8 ]
• Submission:– The information provided in accordance with these
guidelines shall be communicated by each non-Annex IParty to the COP in a single document, with an executive summary outlining the information contained in the full document, in both hard copy and electronic format.
– Each non-Annex I Party shall submit its national communication in one of the official languages of the United Nations. The executive summary, which is to be of no more than 10 pages, shall be translated into English and made publicly available. Parties are also encouraged to submit, to the extent possible and where relevant, English translations of their communications.
– Additional or supporting information may be supplied through other documents such as a technical annex.
38 37

23
Consultative Group of Experts on national communications from Parties not included in Annex I to
the Convention (CGE) Terms of Reference (Decision8/CP5)
• Exchange experience and information on the p reparation of national communications;
• Consider, as app rop riate, the needs for and availability of financial resources and technical support, and the identification of barriers to and gaps in this support;
• Consider, as app rop riate, information in national communications from non-Annex I Parties in accordance with the guidelines for the p reparation of initial national communications;
• Review existing activities and p rogrammes to facilitate and support the p reparation of national communications by non-Annex I Parties;
• Identify the difficulties encountered by non-Annex I Parties in the use of the guidelines;
• Identify the analy tical and methodological issues, including technical p roblems in the p reparation and reporting of greenhouse gas inventories;
• Examine national communications, in particular greenhouse gas inventories, submitted by non-Annex I Parties, with a view to arriving at recommendations on ways of overcoming difficulties in the use of the IPCC methodologies and the UNFCCC guidelines;
• Encourage interaction among experts from all Parties.
24
CGE Mandate Revised(Decision3/CP8)
COP8 adopted the revised mandate of the Consultative Group of Experts, comprising 24 experts:
– Five members from each of the regions of non-Annex I Parties, namely, Africa, Asia and the Pacific, and Latin America and the Caribbean;
– Six members from Parties included in Annex I to the Convention (Annex I Parties), including one from countries with economies in transition;
– One member from each of three international organizations with relevant experience in providing technical assistance to non-Annex I Parties in the preparation of national communications.
39 38

25
Consultative Group of Experts (CGE)(Decision3/CP.8) (2002) Mandate
• Identify and assess technical problems and constraints
• Identify and assess the difficulties encountered;• Examine national communications submitted to
the secretariat; • Provide technical advice and support, by
organizing and conducting workshops, includ ing hands-on training workshops at the regional or sub-regional level;
• Provide technical advice to the SBI. . .
26
CGE: Current MembersA. African Region • Ms. Em ily Ojoo-Massawa (Kenya), Mr . Moham ed Etayari (Libya), Ms . Marília
Manjate (Mo zam bique) , Mr. Sam uel Adejuwon (Nigeria), Ms . Madeleine Diouf(Senegal) (also LEG m ember)
B. As ian Region• Mr. M. Asaduzzam an (Bangladesh) , Mr. Subodh Kum ar Sharm a (India), Mr .
Jaekyu Lim (Republic of Korea), Mr . Jose Villarin (Philippines) , Mr. Muhamm ad Mundicar (Kuwait)
C. Latin Am erica and the Caribbean Region• Mr. Carlos Fuller (Belize), Mr. Arthur Rolle (Bahamas), Mr. Luis Paz Cas tro
(Cuba), Ms . Lilian Portillo (Paraguay), Mr . Luis Santos (Uruguay)
D. Annex I• Mr. Satender Singh (Canada), Ms . Riitta Pipatti (Finland), Ms . Renate
Vandeputte (Belgium ) (also LEG m ember), Mr. Othm ar Schwank (Switzerland), Mr. Alexander Pisarenko (Ukraine), Mr. Jack Fitzgerald (United States of Am erica)
E. Organizations• Ms. Bo Lim (NCSU/UNDP), Mr. Taka Hiraishi (IPCC/GHG Inventory Task
Force), Mr . Mahendra Kum ar (Clim ate Change Enabling Activities /UNEP)
40 39

27
Work of CGE• Regional workshop for the Latin America and the
Caribbean region in Mexico City, Mexico, from 8 to 12 May 2000
• Regional workshop for the Africa region in Nairobi, Kenya, from 15 to 18 August 2000
• Regional workshop for the Asia and the Pacific region in Bangkok, Thailand from 16 to 20 October 2000
• Three interregional workshops of the CGE were held in 2001 and 2002
• CGE Workshops have been held ; in Mauritius in April 2003, in Mexico in Sept. 2003, and in Malaysia in Apri l 2004
• CGE hands-on training workshop on national greenhouse gas inventories for the Latin America and the Caribbean region was held in Panama on 25 - 29 October 2004
• Similar training workshop will be he ld in Shanghai on 8-10 February 2005.
28
CGE Findings - Inventories• Insufficient resources to collect the necessary activity data for
the estimation of the GHG emissions (land use change and forestry, energy, etc.).
• Need for appropriate emission factors (forests, transport, agriculture, waste disposal).
• No technical coordinators or secretariat or technical focal points for performing the technical work.
• A lack of adequate capacities in the existing institutions to carry out research and training on climate change issues.
• Need for exchange of information related to national inventories among the countries of the regions.
• Need to improve UNFCCC Guidelines.• Provision of further financial and technical support.
41 40

29
CGE National Communication Guidelines User Manual
(November 2003)
• The user manual is available e lectronically in PDF-format in three UN languages: English, Français, Español.
<http://unfccc.int/files/essential_background/application/pdf/userman_nc.pdf>
30
Discussions: Issues re. NAI NCs• NC is a commitment by all Parties, under the
“common but differentiated responsibility”princ iple. 121 NAIs have done NCs
• NC preparation requires human, technological, institutional and financial capability.
• Continuation of NC activities and maintenance of NC institutional setup is difficult in many developing countries.
• Provision of agreed full cost funding is not a straightforward question.
• Unsuccessful negotiations at COP9, SBI 20 and COP10 (Dec. 2004).
42 41

31
NAI National Communications (As of January 2005)(Red: 2nd communicat ions)
ALBANIA, ALGERIA, ANTIGUA AND BARBUDA, ARGENTINA, ARMENIA, ZERBAIJAN, BAHAMAS, BANGLADESH, BARBADOS, BELIZE, BENIN, BHUTAN,BOLIVIA, BOT SWANA, BRAZIL, BURKINA FASO, BURUNDI, CAMBODIA, CAPEVERDE, CENT RAL AFRICAN REPUBLIC, CHAD, CHILE, CHINA, COLOMBIA, COMOROS, CONGO, COOK ISLANDS, COST A RICA, COTE D'IVOIRE, CUBA, DEMOCRATIC PEOPLE'S REPUBLIC OF KOREA, DEMOCRATIC REPUBLIC OF THE CONGO, DJIBOUTI, DOMINICA, DOMINICAN REPUBLIC, ECUADOR, EGYPT, EL SALVADOR, ERIT REA, ETHIOPIA, GABON, GAMBIA, GEORGIA, GHANA, GRENADA, GUATEMALA, GUINEA, GUYANA, HAITI, HONDURAS, INDIA, INDONESIA, IRAN, (Islamic Republic of), ISRAEL, JAMAICA, JORDAN, JORDAN, KAZAKHST AN, KENYA, KIRIBATI, KYRGYZST AN, LAO PEOPLE'S DEMOCRATICREPUBLIC, LEBANON, LESOT HO, MACEDONIA (The former Yugoslav Republic of), MADAGASCAR, MALAWI, MALAYSIA, MALDIVES, MALI, MALT A, MARSHALL ISLANDS, MAURITANIA, MAURITIUS, MEXICO, MICRONESIA, MONGOLIA, MOROCCO, NAMIBIA, NAURU, NEPAL, NICARAGUA, NIGER, NIGERIA, NIUE,PAKIST AN, PALAU, PANAMA, PAPUA NEW GUINEA, PARAGUAY, PERU, PHILIPPINES, REPUBLIC OF KOREA, REPUBLIC OF MOLDOVA, SAINT KITT S AND NEVIS, SAINT LUCIA, SAINT VINCENT AND GRENADINES, SAMOA, SENEGAL, SEYCHELLES, SINGAPORE, SOLOMON ISLANDS, SOUT H AFRICA, SRI LANKA,SUDAN, SWAZILAND, TAJIKIST AN, THAILAND, TOGO, TRINIDAD AND TOBAGO, TUNISIA, TURKMENISTAN, TUVALU, UGANDA, UNITED REPUBLIC OF TANZANIA, URUGUAY, UZBEKIST AN, VANUATU, VIET NAM, YEMEN, ZAMBIA, ZIMBABWE
43 42

Submission of the Viet Nam Initial National Communication
Hoang Manh HoaSenior Expert on Climate Change
International Cooperation DepartmentMinistry of Natural Resources and Environment of Viet Nam
The Second Workshop on GHG Inventories in Asia RegionShanghai, China, 7-8 February 2005
BackgroundViet Nam signed the UNFCCC in 1992 and ratified it on 16 November 1994.In order to fulfill the commitment described in the articles 12.1, 12.5 of UNFCCC and following the guidelines “Preparation of the Initial National Communication” for Non-Annex I Parties, the Government of Viet Nam assigned the M inistry of Natural Resources and Environment as a National Authority to implement the project “Viet Nam: Preparation of the Initial National Communication to the UNFCCC – GF/2200-97-54” with financial and technical support from the GEF and UNEP.There were many workshops and seminars held to prepare and complete the Initial National Communication.The Initial National Communication of Viet Nam was submitted to the UNFCCC Secretariat in November 2003.
44 43

Institutional arrangements for Preparing National Communication
Ministry of Natural Resources & Environment
Vietnam Climate Change Country Team
Project Management Team
National Study Team
GHG Inventory
Group
Mitigation Options/Plans
Group
Vulnerability & Adaptation
Assess ment Group
National Communication
Group
Government of Viet Nam
Institutional arrangements for preparing National Communication
The climate change enabling activity to prepare the Initial National Communication to the UNFCCC led to the establishment of a National Study Team composed of the following institutions: M inistry of Natural Resources and Environment (M ONRE)M inistry of Industry (M OI)M inistry of Planning and Investment (M PI)M inistry of Science and Technology (M OST)M inistry of Agriculture and Rural Development (M ARD)M inistry of Finance ( M OF)M inistry of Foreign Affairs (M OFA)M inistry of Transportation (MOT)Viet Nam Union of Science and Technology Associations (VUSTA).
45 44

Implemented activities1994 National GHG Inventory was carried out for the main
sectors:EnergyIndustry ProcessesForestry and Land Use Change AgricultureWaste
The methodology: the guidance of IPCC version 1996The guideline for preparation of National Communication for Non-Annex I Parties
The data sources were collected and processed from the General Statistical Office and other related Agencies of Viet Nam
G H G s In v e n to ry R e s u l ts i n 1 9 9 4
100103.8Total emission2.42.5Waste
18.719.4Forestry and Land Use Change
50.552.5Agriculture
3.73.8Industrial Processes24.725.6Energy
(%)CO2 equivalent (million tons)
Emission sector
46 45

G H G s In v e n to ry R e s u l ts i n 1 9 9 4
Energy25.6 Tg -
24.7%
Land use change and Forestry
19.4 Tg - 18.7%Waste
2.5 Tg -2.4%
Agriculture 52.5 Tg -
50.5%
Industrial processes
3.8Tg - 3.7%
G H G N a tio n a l & S e c to ra l P ro je c tio n
233.28140.6797.47Total
64.7057.2052.45Agriculture
-28.40-21.7019.38Land use change and Forestry
196.98105.1725.64Energy
202020101994Year
Unit: Tg CO2 equivalent
47 46

GHG Mitigation Options
Based on the results of GHG Inventory, GHG mitigation options in Viet Nam were developed for 3 major sectors:
Energy (9 options)Forestry and Land Use Change (6 options)Agriculture (3 options)
GHG mitigation options in Viet NamEnergy sector (Period 2000-2020)
6.0126.1E5: Development of solar power5.1529.2E4: Development of geo-thermal power
-6.7821.9E3: Fuel efficiency improvements with lean burn engine in transportation
-3.653.5E2: Replacement of low-efficiency oil fired boilers by higher efficiency one
3.6510.2E1: Replacement of low-efficiency coal fired boilers by higher efficiency one
Abatement Cost
($/tCO2)
GHG mitigation potential (Tg CO2)
Period 2000-2020Options
48 47

GHG mitigation options in Viet Nam (Cont.)Energy sector (Period 2000-2020)
283.8Total
4.6434E6: Development of wind power stations
-7.1970E9: More efficient industrial motors
-8.3116E8: Replace incandescent light bulbs by compact fluorescent lamps
-4.1573E7: Efficiency improvement in coal-cooking stoves
Abatement Cost ($/tCO2)
GHG mitigation
potential (TgCO2
Period 2000-2020Options
GHG mitigation options in Viet Nam (Cont.)Forestry and Land Use Change sector
(Period 2000- 2020)
3,221.6Total2.56278.7F6: Scattered trees planting0.20496.1F5: Long rotation reforestation-0.15445.8F4: Short rotation reforestation
0.26325.8F3: Planting of protective, specialized forest
0.11372.6F2: Combination of forest nursing and delineation for regeneration
0.211,320.6F1: Protection of forest
Reduced Cost ($/tCO2)
Carbon Sink (Tg
CO2)
Options
49 48

GHG mitigation options in Viet Nam (Cont.)Agriculture sector (Period 2000- 2020)
140.3Total
3.4127.3A3: Utilization of biogas
5.198.0A2: Food processing for animal
13.12105.0A1: Water management in rice field
Mitigation Cost ($/tCO2)
Reduced methane(Tg CO2 eq.)
Options
Implemented activitiesAdaptation measures for water resources:
1. Building reservoirs for containing flood water to mitigate losses caused by flood, meanwhile regulate water during low-flow season.
2. Upgrading and raising the scale of drainage system3. Upgrading existing sea and river-mouth dykes4. Actively limiting the population growth rate and
organizing new resettlement areas to avoid the effects of sea level rise
5. Reclaiming areas for agricultural production6. Using water scientifically and effectively with special
attention paid to increasing run-off during low-flow season
7. Exploiting while protecting water sources8. Conducting studies for planning rational and safe use of
surface water sources.
50 49

Implemented activitiesAdaptation measures for agriculture sector:1. Development of crop patterns suitable to climate change2. Effective use with of irrigation water3. Upgrading of irrigation system for agriculture4. Development of new varieties that could stand against severe environmental conditions5. Reserve and storage of local crop varieties, establishing crop seed banks6. Development of farming techniques appropriate to climate change
Implemented activitiesAdaptation measures for forestry and land use change sector: 1. Enhancing reforestation, regreening bare lands and hills, protecting and developing of mangrove forest2. Protecting natural forest and going forward to closing natural forest exploitation. Preventing forest fire3. Establishing bank of seeds of natural forest trees in order to protect some valuable varieties.4. Enhancing timber processing and limiting use wood as material.5. Selecting and developing plant varieties suitable to natural conditions taking into account climate change
51 50

Implemented activitiesAdaptation measures for aquaculture:
1. Researching on prediction of movement of fishes and providing fishermen with fish monitoring equipment.
2. Importing and developing valuable aquaculture varieties that could adapt to high temperature.
3. Changing farming structure in some wet areas from rice monoculture to fish-rice rotation system.
4. Taking into account sea level rise and increase of temperature while building infrastructures, quays, ports, store house, etc.
5. Developing plan on brackish water aquaculture for Central Viet Nam with 2000 km of coast and sandy land
6. Building back-up dyke behind sea dyke to create transitional belts between agricultural land and sea.
7. Building storm shelter port systems along the coast as well as in islands.
8. Establishing natural ecological reserves.
Implemented activities
Adaptation measures for coastal zone:Three strategic options:
1. Full protection:Make all dykes higher and strengthen coastal management2. Adaptation: reform infrastructures and habits of the people living in the coastal zone to adapt sea level rise.3. Withdrawal (or avoidance): resettlement, moving house and infrastructures from threatened areas.
52 51

Implemented activitiesAdaptation measures for energy, transportation sector:
1.Taking into account climate change factors in planning of energy and transport development
2. Upgrading and reconstructing transport infrastructure in areas often threatened by sea level rise and flood
3. Ensuring demand side management of energy based on high efficiency of energy use, economical and rational use of energy, ensuring energy security and safety
4. Developing strategies to response and adapt to the vagary of weather.
Implemented activitiesAdaptation measures for human health
1. Accelerating the implementation of the programme“Eliminating hunger and reducing poverty”, improving living standards of the people, especially of those in remote areas.
2. Developing national plan and programme for medical control and monitoring in areas that have high danger of infections in order to take timely response measures and prevent the spreading of diseases.
3. Establishing green, clean and beautiful areas in the dense populated areas.
4. Promoting public awareness on climate change so that every person could take adaptation measures for himself
5. Implementing strict quarantine at the borders, airports to prevent infection and disease transmission from outside.
53 52

Portfolio of some projects on climate change
2005-201011.5Southern Central Vietnam
Forest plantation on sandy soil in the coast of the Southern Central Viet Nam
4
2005-20070.46North of Vietnam
Encouraging utilization of renewable energy in rural areas
3
2005-20073.3All countryEnergy saving in industry
2
2005-200950All countryDevelopment of renewable energy
1
TimeTotal Budget (million USD)
LocationName of ProjectNo
Portfolio of some projects on climate change (cont.)
2003-20061.5All country
Energy conservation and saving in small and medium-sized enterprises
8
2004-20060.135All country
Research on-generation technology from biomass fuel in Vietnam
7
2004-20081.5All country
Using biogas as fuel to mitigate GHG in rural areas
6
2005-20090.35North of Viet Nam
Improving cooking stoves of the rural-mountainous community
5
TimeTotal Budge (million USD
LocationName of ProjectNo
54 53

Portfolio of some projects on c limate change (cont.)
2004-20050.3Central Viet Nam
Exploitation of geo-thermal energy in Vietnam
12
2004-20075.025Red River Delta and Mekong River Delta
Irrigation management of wetland rice field to reduce methane emission
11
2004-20127.01Ha TinhProvince
Planting protective forest in the watershed of Ngan Sau, Ngan Pho Rivers
10
2004-20110.2Quang NinhProvince
Wind power stations for the people in remote island
9
TimeTotal Budge (million USD
LocationName of ProjectNo
Next steps1. Carrying out the Project “Expedited financing for (interim)
measures for capacity building in priority areas” (Phase II). This project is a following-up to the Initial National Communication.The main objective of the project is to enhance capacity building at national level and maintain efforts to access and disseminate information related to climate change technologies.The specific objectives are:
To help meet the added requirement of enhancing capacity in order to identify and analyse technologies needsTo access information on technology transfer and sensitise the public awareness on climate changeTo build the capacity to prepare climate change programmes promoting technology transfer.To build the capacity to improve the quality of climatechange enabling activities.
55 54

Next steps
2. Developing climate change scenarios in Viet Nam for period 2010-2070
3. Collecting database provided for second National Communication
4. Continuing to study adaptation measures5. Developing climate change project portfolio
including potential CDM projects
Thank you for your attention
56 55

GHG inventory preparation - India’s Experience
Ministry of Environment & Forests
Subodh SharmaNational Project Director
National Communications
The Framework of presentation
National Circumstances and Diversity of activities
Inventory DevelopmentChronology of inventory developmentInventory of 1994 Uncertainty reductionDevelopment of indigenous emission factorsUtilisation of national emission factors
Constraints and gaps in inventory development
Need for improvementSectors requiring improvementSteps of refinement of GHG inventory
Further Capacity building requirements
57 56

The Setting
India is a vast country (3.28 million sq km)
Diverse physiographical features
Himalayas, Coastal areas, northern plains, peninsular plateau and islands
Occupies 2.4% of the worlds land area but support 16.2% of the worlds human population
Dominating feature of climate is the Monsoon
Endowed with varied soils, climate, biodiversity and ecological regions
Under such diverse natural conditions, a billion people speaking different languages, following different religions, inhabiting in rural and urban areas live in harmony under a democratic system
Diversity in emissions
Regional and sectoral variability exists in emissions across a large country like India
Wide technology diversity complicates India specific estimates as new and vintage technologies co-exist
For example: Energy and transformation industries
Different fuel combustion technologies operationalIndustrial Process
Diverse production technologies Agriculture
Dispersed sources therefore difficult to assess activity dataLand use Land use Change and Forestry
Assessment of all forest types still not coveredWaste
Rising urban population
58 57

1990
CO2CH4
Fossil Fuel RiceAnim als
1990
CO2CH4
Transport Coal m ines 1992 CH4cam paignAnim als-Tier-II
CO2 , CH4N2O, NOx,CO, NMVOCAdditional sources:Biom ass burning, cement prod. oil & nat. gasManure crop res idue soils and MSW
Base year
Gases
Sectors
Ref. M itra, 1991
Mitra, 1992
ALGAS, India, 1998
1998
CH4
1998 methane Cam paign &CH4 coefficients organicallyamended soils
1994
CO2, CH4N2O
Mostly all sources
Gupta et al. 1999
NATCOM 2004
CH4
Seasonally integrated approach and new class ification of rice fie lds based on water regimes developed
1990-1995
Parashar et. al., 1997
Chronology of Inventory Development
Used Published EF
Used Publish-ed & also devlopedfor rice
IPCC default + ow n published
1990-1995
EF developed for organically amended soil
EF devel-oped for key sectors
developed EF for various water regimes
EF
Inventory Estimation- Scope
Sectors Cove red:• Energ y a nd Transform a tion• Industria l Processes• Ag ricu ltu re• Land U se , La nd U se Chang e & Forestry • W aste
Gases Cov ere d:• Carbon d ioxide (CO2)• Methane (CH 4)• N itrous Oxide (N 2O)
Base year: 1994
Guid elin es : IPCC 1996
59 58

Inventory Estimation - Institutional Arrangement
19 Research Teams
GHG Emissions from Sources and Removals by Sinks - India 1994
743820
60 59

Sectoral emissions - Energy and Industrial Processes
Sectoral emissions- Agriculture
61 60

Sectoral Emissions – Land Use, Land Use Changes and Forestry
Sectoral Emissions – Waste Management
62 61

Sectoral Distribution of GHG emissions – India 1994
Em issions in te rm s of CO2 equ iva len t
Relative GHG Emissions - India 1994
CO 2 equ iva len t em ission d istribu tion (M t)
63 62

Energy85%
Industrial Process
13%
LULUCF2%
CO2 Emission Distribution in 1994
Key sources: Energy and transformation industriesSteel & Cement Production
All energy16%
W aste6%
Agriculture78%
CH4 Emission Distribution in 1994
Key sources : Enteric fermentation Rice cultivation
64 63

Agriculture84%
Energy7%
Waste4%
Ind. Proc.5%
N2O Emission Distribution in 1994
Key sources: N2O emissions from Soils
Levels of inventory estimations
Tier 1 Takes in to a ccount the g ross consum ption and a vera g e em issions fa ctors. e .g . N a tional level fue l consum ption a nd com m on em ission fa ctors (tC/un it fue l used ),
Tie r 2 R efe rs to estim a tions ba sed on sub-sectora l consum ption a nd em issions coe fficien ts deve loped rep resenting specific cond itio ns.
e .g . Fue l combustion a ttribu ted to techno log y types (like Sub-critica l pulve rized coal fo r power genera tion )
Tie r 3 R efe rs to em ission estim a tes m ade using de ta iled a ctivity a nd specific em ission coe fficien ts
e .g . em ission fa ctors exp ressed directly in te rm s o f un it o f a ctivity like tC/kW h of power g enera ted
Sha re o f d iffe ren t Tie rs used for N ATCOM GH G estim a tes
Tie r-I a pp roa ch 23%
Tie r-II a pp roa ch 70%
Tie r III a pp roa ch 7%
65 64

Uncertainties in Inventory Estimation
Top down and bottom up estimates of national activity data have variations due to aggregation errors
Existing activity data reporting formats are not meant for inventory reporting purposes
Most of the IPCC default emission coefficients not representative of India specific coefficients
Methodological issues
Uncertainty Reduction
Energy and Transformation SectorCalorif ic v alues of Indian coalsCH4 f rom Coal mining GHGs f rom Road Transport CO2 f rom some power, steel & cement plants
Industrial ProcessN2O f rom Nitric Acid ProductionCO2 f rom Cement , Lime and Dolomite
Agriculture SectorCH4 f rom Enteric FermentationCH4 f rom Rice Cultiv ationN2O f rom SoilsGHG f rom biomass combustion
ForestryEstimation of annual growth rates
WasteCH4 Municipal Solid Waste
To capture the diversity of Indian em ission characteris tics
To enhance the quality of the inventory
Fresh em issions m easurements / es tim ations were undertaken in some sectors
66 65

Uncertainty Reduction – Institutional Arrangement
17 Research Teams
Indigenous Emission Factors Developed for India
71.4 ± 0.5LCV71.4 ± 0.55MCV/HCVDiesel Oil61.5 ± 4.0Car/Taxi
S ingh et al., 2004a, S inghal et al, 2004
43.9 ± 7.32W /3WGasolineTCO/TjRoad Transport sector28.959.69+0.4Lignite
Choudhury et al., 200426.1319.63+0.4Non-coking coal
25.5324.18+0.3Coking coal
t CO2/TJNCVTJ/Kt
Indian Coal
ReferenceEmission Factor (EF)
67 66

India specific emission factors ………….contd.
m3CH4/tonCoal Mining
Post mining0.23During Mining1.83Surface mining3.12Degree III2.15Degree II
S ingh, 20040.98Degree IPost mining 23.64Degree III13.08Degree II2.91Degree IDuring Mining
Underground mining
ReferenceEmission Factor (EF)
Rao et al., 20040.534 - 0.539tons/ton of clinkerCement manufacturing
Rao et. al., 2004
0.24 – 0.57Dual pressure plant1.54 – 4.13High pressure plants
6.48 – 13.79 Medium pressure plantkg per ton of N2ONitric acid production
ReferenceEmission Factor (EF)
India specific emission factors ………….contd.
68 67

2.0+1.5Irrigated Multiple Aeration6.6+1. 9Irrigated Single Aeration
Gupta et al., 200417.5+ 4.0Irrigated, Continuously
Flooded
7.0+2Rain fed, Drought Prone19.0+ 6.0Rain fed Flood Prone
0Uplandg CH4/m2Rice Ecosystem
19.0+ 6.0Deep W ater
Refer enceEmission Factor (EF )
India specific emission factors ………….contd.
23+81-3 year
43+5Cross bred
4+1Sheep44+11Adult
g CH4 / animalEnteric fermentation
22+61-3 year8+30-1 yearNon- Dairy buffalo
50+17Dairy buffalo33+4Adult26+51-2 ½ year11+30-1 yearNon-dairy cattle (Cross Br ed)
Singhal et al., 2004Swamy et al., 200432+6Adult
4+1Goat
9+30-1yrsNon dairy cattle (Indigenous)
28+5IndigenousDairy cattle
Refer enceEmission Factor
India specific emission factors ………….contd.
69 68

Possible Reasons for Variation in Some Coefficients
Coal composition, boiler/ combustion efficiency, regional variations across the country, coal definition issues
CO2 from coal combustion
Technological variability in level and extent of control processes
Industrial process emissions
Waste composition, waste collection levels and mechanisms, dump management, reduction technologies
CH4 from Municipal Solid Waste
Irrigation practices, fertilizer and soil types in India are not conducive to high CH4 production
CH4 from rice paddy cultivation
Thinner cattle, not so rich feed typeCH4 from enteric fermentation
Possible reasons for variation of Indian coefficients from IPCC default values
Coefficient type
Status of Preparation GHG inventory – Energy Sector
DT ier I2.8Biomass burnt for en ergy
IT ier II6.5T ransport
Energy sector
DT ier I1.0Oil and natural gas systemIT ier II1.1 Coal miningDT ier I 1.7Commercial-institution alDT ier I2.6All other energy sectors
DT ier I3.6Residen tial
DT ier I12.3IndustryIT ier II28.9Energy and tran sformation industries
T ype of emission factor used
T ier used in the Initial NAT COM
Percentage of th e total Nation al CO2 eq. emissions
I: Indigenously developed, D: IPCC Default Emission factors
70 69

T ype of emission factor used
T ier used in the Initial NAT COM
Percentage of th e total Nation al CO2 eq. emissions
DT ier I0.9All OthersDT ier I1.2Ammonia productionIT ier II0.2Nitric acid productionIT ier II2.5Cement productionDT ier I3.6Iron and Steel production
Industrial Processes
Status of Preparation GHG inventory – Industrial Processes
I: Indigenously developed, D: IPCC Default Emission factors
DT ier I0.4Agricultural crop residue
DT ier I3.7Emission from Soils
Agriculture sector
DT ier I1.6Manure Man agem ent
IT ier III7.0Rice CultivationIT ier III15.3Enteric F ermentation
T ype of emission factor used
T ier used in the Initial NAT COM
Percentage of the total National CO2 eq. emissions
Status of Preparation GHG inventory – Agriculture
I: Indigenously developed, D: IPCC Default Emission factors
71 70

DT ier I0.7Domestic/Industrial Waste waterDT ier I1.0Municipal Solid Waste Dispo sal
Waste sector
DT ier I-1.2Changes in Forest and oth er woody biomass stock
DT ier I-0.8Uptake from abandonmen t of Man aged lands
DT ier I0.0T race gases from biomass burningDT ier I1.5Forest and Grassland Conver sionDT ier I1.6Emissions and removals from soils
LULUCF
DT ier I0.2Human Sewage
T ype of emission factor used
T ier used in the Initial NAT COM
Percentage of the total National CO2 eq. emissions
I: Indigenously developed, D: IPCC Default Emission factors
Status of Preparation GHG inventory – LULUCF and Waste
Constraints and Gaps in Inventory Estimation
72 71

Constraints and Gaps in Inventory Estimation
Sectors requiring improvement - Energy
T ier IIT ier IIIT ier II
T ier IIT ier IIT ier IIT ier IIIT ier II
T ier III
Desirability of switching over to a higher tier in the future
YY
YYY
Y
Wheth er improvement in activity data Required
T ier I2.8Biomass burnt for en ergy
T ier II6.5T ransport
ENERGY
T ier I1.0Oil and natural gas systemT ier II1.1 Coal miningT ier I 1.7Commercial-institution al
T ier I2.6All other energy sectors
T ier I3.6Residen tial
YT ier I12.3Industry
YT ier II28.9Energy and tran sformation industries
Desirability of use of IPCC Good Practice guidance
T ier used in the Initial NAT COM
Percentage of the total National CO2 eq. emissions
73 72

T ier IT ier I
T ier III
T ier III
Desirability of switching over to a higher tier in the future
Y
Y
Wheth er improvement in activity data Required
T ier I1.2Ammonia productionYT ier II2.5Cement production
YT ier I3.6Iron and Steel production
INDUSTRIAL PROCESSES
T ier I1.1All Others
Desirability of use of IPCC Good Practice guidance
T ier used in the Initial NAT COM
Percentage of the total National CO2 eq. emissions
Sectors requiring improvement - Industrial Processes
Sectors requiring improvement - Agriculture
T ier I T ier I T ier IIT ier IIIT ier III
Desirability of switching over to a higher tier in the future
YYY
Wheth er improvement in activity data Required
T ier I0.4Agricultural crop residue
T ier I3.7Emission from Soils
AGRICULTURE
T ier I1.6Manure Man agem ent
YT ier III7.0Rice CultivationYT ier III15.3Enteric F ermentation
Desirability of use of IPCC Good Practice guidance
T ier used in the Initial NAT COM
Percentage of the total National CO2 eq. emissions
74 73

T ier III
T ier III
T ier II
T ier III
T ier III
Desirability of switching over to a higher tier in the future
Y
Y
Y
Y
Y
Wheth er improvement in activity data Required
YT ier I-1.2Changes in Forest and other woody biomass stock
YT ier I-0.8Uptake from abandonmen t of Manag ed lands
YT ier I0.0T race gases from biomass burning
YT ier I1.5Forest and Grassland Conversion
YT ier I1.6Emissions and removals from soils
LULUCF
Desirability of use of IPCC Good Practice guidance
T ier used in the Initial NAT COM
Percentage of the total National CO2 eq. emissions
Sectors requiring improvement - LULUCF
T ier I
T ier II
T ier III
Desirability of switching over to a higher tier in the future
Y
Y
Wheth er improvement in activity data Required
T ier I0.7Domestic/Industrial Waste water
YT ier I1.0Municipal Solid Waste Disposal
WASTE MANAGEMENT
T ier I0.2Human Sewage
Desirability of use of IPCC Good Practice guidance
T ier used in the Initial NAT COM
Percentage of the total National CO2 eq. emissions
Sectors requiring improvement – Waste Management
75 74

Through higher sectoral disaggregation and hence riding the Tier ladder
Following Good Practices of Uncertainty Management and Quality Assurance and Quality Control
Comparing emission estimates with model runs
Comparisons with national, regional and global inventories
Steps of refinement of GHG estimations
Steps for refinement of GHG estimations
Validation
Validation throug h comparison of emiss ions
Validation throug h emission models
Archiving
Evaluation
Raising Awareness, Public Dissemination
1st communication
Start new cycle
Key source analysis
Determine emission coefficient of gases emitted
from key sources
Q A/Q C Peer Review
Short-term Recalculation
Recalculation
Measurement or estimate
Uncertainty Analysis
Q A
Individua lSource
Categories
Preparation
76 75

Capacity Building efforts required for further refinementContinuous and improved networkingBridging data Gaps
Strengthening existing emission coefficients
Training on inventory development for estimating inventories of new gases, revised guidelines for preparation of inventories
Developing emission factors representing Indian conditions for new gases to be reported
Establishing an Emission Factor Data Base and a Nodal Centre for validation of inventories
Emission Factor Database
Center for validation of inventories
Region specific inputs Country specific inputs
WasteLULUCFAgricultureIndustrial Processes
Energy
QA/QC Uncertainty analysis
Key source analysis
Intercompari-son
Modeling
Framework for a centre for validation of emission inventories and an emission factor database
77 76

78 77

1
中华人民共和国
气候变化初始国家信息通报
The People’s Republic of ChinaInitia l National Communication on
Climate Change
2nd W orkshop on GHG Inve ntory in Asia Region
Shanghai February 7, 2005
2
Contents
Preparation for the INCInstitutional ArrangementProcess of Developing the INCContents of the INCExperiences
79 78

3
Preparation for the INC
China ratified the Convention in early 1993
COP2 adopted the guidelines for preparing national communications from non-Annex I partiesChina started preparation its work in 1996, inc lud ing consultation with UNDP China OfficeA PDF project was initiated in 1999
4
Preparation for the INC
Budget: 324,000 US dollarDuration: 12 monthObjective: To assess previous works and identify the capacity needs in China for preparation of initial national communication, in particular national GHGs inventory.
PDF Process
80 79

5
National GHG inventories:Energy;Industrial processes;Agriculture;Land use change and forestry;Waste management
Vulnerab ility and adaptation assessment:Climate change scenarios, Agriculture, Water
resources, Ecosystem, Coastal zone and sea level, Health
Focusing Areas
Preparation for the INC
6
Response Strategy on Global Climate Change in Chinasupported by ADB and completed in 1993;China: Issues and Options in GHG Emissions Controlsupported by the GEF and UNDP (executed by World Bank) and completed in 1994; China Climate Change Country Study supported by the US Country Studies Program and completed in 1998; Asian Least-Cost GHG Abatement Strategy (ALGAS) funded by GEF/UNDP, executed by ADB and completed in 1998;Other domestically supported projects
Previous Works Reviewed
Preparation for the INC
81 80

7
Preparation for the INC
Needs identified: ☑ Understanding the methodology☑ Expanding the coverage of the inventories☑ Developing national emission factors☑ Collecting of data and Improving data quality ☑ Analyzing climate change related policies☑ Enhancing public awareness of climate change
A project proposal for “ Enabling China to prepare its initial national Communication ” was developed based on the outcomes of the PDF project.
Some Results from PDF
8
Seven immediate objectives Project activities including training, workshops, collection and analysis of data, development of emission factors, study tours, involvement of international consultants, experts review of the reports, government review of the reports, etc. Project output: INCProject budgetGEF: $3,500,000 Chinese government: $240,000 Project duration: 28 months
Design of the “ Enabling China to Prepare Its INC ” Project
Preparation for the INC
82 81

9
Institutional Arrangement
Executing AgencyNational Development and Reform Commission (NDRC), under the guidance of National Coordination Committee on Climate Change
Establishment of the Steering CommitteeProviding guidance to the project implementationChaired by NDRC, consisting of members from MoFA, MOST, MoF, SEPA, CMA, ERI, and UNDP China Office
10
Institutional Arrangement
Designation of the NPD, NPM and NPCNDRC appointed Mr.Gao Guangsheng, Director general of the Office to NCCCC, as the National Project Director (NPD)Mr. Ma Aimin, Deputy Division Director of the NCCCC, was appointed as the Project ManagerMr.Xu Huaqing, Director of Research Center for Energy, Environment and C limate C hange, ERI, was recruited as the Project Coordinator
Project officeEstablished within ERI, NDRC
83 82

11
Institutional Arrangement
Selection of the contractors through bidding process Criteria for contractorsEvaluation Committee established to make final selection Five organizations contracted for the project
12
Institutional Arrangement
Contractors Energy Research Institute , for ene rgy sector and industrial processes inventoriesInstitute of Atmos pheric Physics , Chinese Academy of Science, for agricultural sector inventoryChinese Academy of Forestry, for land use and forestsector inventoryChinese Research Academy of Environmental Sciences , for municipal waste inventoryAdministrative Center for China ’ s Agenda 21, for public awareness
84 83

13
Process of Developing the INC
PDF project in mid-1999INC Project approved by GEF Council on May 9th, 2000Project document signed in July, 2001Project inception in October, 2001First disbursement in November, 2001Submission in November, 2004
14
Process of Developing the INC
Phase 1: inceptionOct.2001-April, 2002Project inception workshop and Inception workshops of contractorsBetter understanding of UNFCCC guideline and IPCC methodologies, experts identification and networks, assessment of data availab ility, technical approaches, examination of previous works, etc.
85 84

15
Process of Developing the INC
Phase 2: implementationMay, 2002-Dec.2003Development of GHG inventories by sectorsActivity data,emission factors Draft of INC report outline and the first draft
16
Process of Developing the INC
Phase 3: finalizationJan.2004-Nov.2004Compilation of national GHG inventoryExperts and government review and improvement of INC reports (draft 2-draft 5)Approval procedureSubmission of China ’ s INC through UNFCCC secretariat
86 85

17
Process of Developing the INC
The Initial National Communication was approved by the State Council
A promulgation ceremony was conducted on Nov. 9th, 2004
Promulgation of China ’ s INC
18
Contents of the INC
National CircumstancesNational GHG InventoryImpacts of Climate Change and AdaptationPolic ies and Measures Related to Climate Change MitigationResearch and Systematic ObservationEducation, Training and Public AwarenessNeeds for Funds, Technologies and Capacity Build ing
87 86

19
Contents of the INC
Located in the east of the Asian continent, on the western shore of the Pacific Ocean China has a landmass of 9,600,000 km2
Extremely diverse: tropical in the south and frigid in the north
National Circumstances
20
Contents of the INC
China has a shortage as well as an uneven distribution of water resources☑ Per capita water resources are about one fourth
of the world average
• Coal dominant energy reserves☑ Per capita energy resources are less than half of
the world ave rage
National Circumstances
88 87

21
Contents of the INC
Huge population (1267 million ), although the growth rate is less than 1% in the year 2000Two thirds of population living in the rural areas Low income developing country with per capita GDP USD 1,000Need for development in many areas
National Circumstances
22
Contents of the INC
Sectors: Energy, industrial processes, agriculture, land use change and forestry, wastesGHGs: CO2, CH4, and N2OMethodologies:☑ Revised 1996 IPCC guidelines adopted; ☑ IPCC good practice guidance and uncertainty
management in national greenhouse gas inventory used as reference;
☑ Necessary improvement in accordance with China ’ s circumstances
National GHG Inventory
89 88

23
Contents of the INC
CO2 : 2.666 billion tons (728 million ton-C) from fossil fue l combustion and industr ial processesCH4: 34.29 million tons from rice growing, anima l husbandry, energy production and waste managementN2O: 0.85 million tons, from agriculture, industr ial processes and energy sectors
CO2
73%
CH4
20%
N2O
7%
National GHG Inventory
24
Difficulty in forecasting the future emissionAnalysis of factors which will influence the future trends of GHG emissionThese factors include:
Population growth and increasing urbanization, improvement of living standardEconomic developmentChanges of economic structure and technological progressChanges in forestry and ecological preservation and construction
National GHG Inventory
Contents of the INC
90 89

25
Contents of the INC
The trend of c limate change:☑ the warming would continue in the future
Water:☑ The runoff of major rivers has decreased in the
past 40 years☑ It is likely that the runoff of major rivers will
decrease in northern China and increase in southern China.
Impacts of Climate Change and Adaptation
26
Contents of the INC
The mountain glaciers have been shrinking and the water supply in western China might be threatened in the future
Impacts of Climate Change and Adaptation
Agriculture :☑ Plant growth will be speeded up
and crop growing period will be shortened;
☑ The cost for agricultural production will increase;
☑ The distribution of crops will change, with the northern boundary extending northwards;
☑ The grain production potentia l will be reduced due to climate change and extreme weather
91 90

27
Contents of the INC
Sea level:☑ It is projected that the
sea level r ise over five typical coastal zones would range from 31cm to 65 cm by 2100;
☑ The map shows the areas which are like ly submerged in Guangzhou, south China when the sea leve l rises 30 cm
Impacts of Climate Change and Adaptation
28
Contents of the INC
Cross-sector policies and measuresSustainable development strategy:☑ China ’ s Agenda 21 developed in 1994, Susta inable
development strategy integrated into nationa l economic and social deve lopment plans
• Relevant laws and regulations:☑ Law for promotion of clean production;☑ Energy conservation law;☑ Renewable energy law (under preparation)
Policies and Measures Related to Climate Change Mitigation
92 91

29
Contents of the INC
Industrial polic ies:☑ Providing guidance for investment;☑ Inventories of products and technologies to be encouraged;☑ Equipments and technologies to be phased out
• Economic incentives:☑ Tax reduction; ☑ Low interest loan
Policies and Measures Related to Climate Change Mitigation
30
Contents of the INC
Policies and measures in different sectors:☑ Management system;☑ Public awareness;☑ Technology improvement;☑ Standard, labeling, certification;☑ Demonstration projects;☑ ……
Policies and Measures Related to Climate Change Mitigation
93 92

31
Contents of the INC
Energy supplyEnergy conservationIndustryBuild ingTransportationAgricultureForestryWaste managementInternational cooperation
Policies and Measures Related to Climate Change Mitigation
32
Contents of the INC
A large three-dimens ional network for observation of the atmosphere has been established, including 143 reference climate stations, 530 basic weather stations and 1736 ordinary weather stations.Marine observation and monitoring system, including stations for ocean observation, voluntary observation vessels, buoy observations, marine investigation vessels, seashore ice-monitoring radars.
Research and Systematic Observation
94 93

33
Contents of the INC
Terrestrial observation system mainly consists of a network measuring data for hydrological systems, ice-snow, ecological systems, agro-meteorology and environmental protection.Meteorological satellite also plays important role for remote-sensing observation.
Research and Systematic Observation
34
Contents of the INC
Climate change related research in the past years, includ ing those sponsored by the Government and by international communities.Needs for future scientific research also identified, includ ing research on the atmosphere science, impact of and adaptation to climate change, and national strategy and polic ies for addressing climate change issues.
Research and Systematic Observation
95 94

35
Contents of the INC
Survey was made on the public awareness of climate changeEducation through media (newspapers, radios and TVs)Establishment of websites on climate change(www.ccchina.gov.cn)
Education, Training and Public Awareness
Training and workshopsPublications: Books, newslettersWorks by artists
36
Contents of the INC
Development of national GHG inventory☑ Training☑ Statistics sys tem☑ Improvement of e miss ion factors
• Mitigation and adaptation☑ Technologies for mitigation☑ Technologies for adaptation☑ Research and systematic observation
• Capacity building☑ Needs identified primarily, self-assessment is going on
Needs for F unds, Technologies and Capacity Building
96 95

37
Experiences
Lack of activity data: ☑ Statistics system can not provide all necessary data, some
rely on experts ’ judgment.
• Reliab ility and quality of data☑ Different data from different sources
• Emission factor:☑ IPCC default data could not be applied directly in China;☑ Data from specific sample observation may not fully
reflect the situation due to time and financial constrains
38
Experiences
Lack of work for impact assessment and adaptation optionsThe models used for assessing the impacts of climate change have mainly been introduced from abroad, whilst few models have been developed in ChinaThe assessment on the impacts of climate change is preliminary and there are still a lot of uncertainties
97 96

39
A time-consuming process, adequate time allocation is necessary for ensuring the quality of the INC report:☑ Complicated procedure for applying financial resources☑ Difficulties with implementing agency☑ Understanding of UNFCCC guidelines and IPCC
methodologies☑ Collection and analysis of information☑ Review and approval process
Experiences
40
ExperiencesA resource-demanding process, full financial support critical for the success:☑ In addition to the input from GEF, the C hinese
government also provided resources;☑ Based on works completed in the past years
Capacity building, an important part of the exerc ise:Professional expert team;☑ Training, continuous learning by doing process;☑ International exchange of information and expertise
98 97

41
Experiences
Political and Public Awareness, support from the different stakeholders neededEarly preparations for the future……
42
Thanks for your attention!
99 98

Current Status of the GHG Current Status of the GHG Inventory in JapanInventory in Japan
Mimi Mimi NamekiNamekiDeputy DirectorDeputy Director
Climate Cha nge Policy DivisionClimate Cha nge Policy DivisionGlobal Environment BureauGlobal Environment BureauMinistry of the Environment Ministry of the Environment
Workshop on GHG Inventories in Asia RegionWorkshop on GHG Inventories in Asia RegionFebruary 7February 7--8, 20058, 2005
OutlineOutlineNational Level: JapanNational Level: Japan’’s National Inventory s National Inventory
BackgroundBackgroundTrends in overa ll emissions and removalsTrends in overa ll emissions and removals
Local Level: Guideline for local governments Local Level: Guideline for local governments to promote local activities against Climate change to promote local activities against Climate change by establishing area specific action plan, Global by establishing area specific action plan, Global Warming Countermeasures Area Promotion PlanWarming Countermeasures Area Promotion PlanPlan, Do, C heck, ActionPlan, Do, C heck, Action
How we actually use Inv as a basis of policy How we actually use Inv as a basis of policy makingmaking
100 99

Current Institutional ArrangementCurrent Institutional Arrangement
Rele
vant
min
istr
ies,
go
vern
men
tal a
genc
ies,
an
d or
gani
zatio
ns
Ministry of the EnvironmentInventory compilation
Assessment of methodologyUncertainty assessmentSpecif ication of key sourcesDevelopment of QA/QC system etc.
Liaison w ith the expert review panel
Dissemination of information to the public
Activity Data
Data f or EmissionFactors
Measured dataFuel mi x r atiosProduc t mi x r atios
etc.
Greenhouse Gas Inventory Office of Japan (GIO)
Consultants
*Improv ement of sourcestatistics f or AD & EF
*Prompt submission of data
provide
request
Sample numbersIdentificati on of errorsTruncation etc .
Enquiries relating toUncertainty Assessment
cont
ract
6 6 subgroups subgroups (for each sector)(for each sector)
Current Institutional ArrangementCurrent Institutional Arrangement•• ““the Committee for the GHGs Emissions Estimation the Committee for the GHGs Emissions Estimation
MethodsMethods””, since 1999, , since 1999, •• Members: externa l experts, approximately 60Members: externa l experts, approximately 60•• The committee is in charge of methodological The committee is in charge of methodological
development o f the inventorydevelopment o f the inventory
Committee for the GHG Emissions Est imation MethodsCommittee for the GHG Emissions Est imation Methods
Energy and Energy and Industrial Processes Industrial Processes TransportationTransportation AgricultureAgriculture WasteWaste FF--gasgas
Inventory Working GroupInventory Working Group(crosscutting issue)(crosscutting issue)
LULUCFLULUCF
101 100

Trends in overall emissions and removalsTrends in overall emissions and removals
• Overall emission of GHGs:• 1,331 [Mt CO2 eq.] in 2002 (CO2, CH4, N2O, HFCs, PFCs, SF6)
• Increased by 7.6% since KP’s Base Year : 1990…CO2, CH4, N2O
1995…HFCs,PFCs,SF6
1,196 1,213 1,203 1,2631,352 1,337 1,302
1,103 1,112 1,128 1,1131,169
1,358 1,307 1,3281,187
1,327 1,331
1,230
-2000
200400
600800
1,000
1,2001,400
1990 1995 2000(Fiscal Year)
(Uni
t: M
t CO
2eq.
)
SF6
PFCs
HFCs
N2O
CH4
CO2 Emissions
CO2 Removals
NetEmissions/Removals
2002
Trends in overall emissionsTrends in overall emissions•• COCO22 +11.2%, CH+11.2%, CH44 --21.1%, N21.1%, N22O O --11.9% 11.9% (since 1990)(since 1990)
•• HFCs HFCs --34.1%, PFCs 34.1%, PFCs --23.4%, SF23.4%, SF66 --68.7% 68.7% (since (since 19951995))
•• Share of COShare of CO22 amounts to be 93.7%amounts to be 93.7%
CO2 93.7%
HFCs1.0%
PFCs0.7%
SF6
0.4%N2O2.7%
CH4
1.5%
Total Emissionsin FY2002 1,330.8
[Mt CO2eq.]
-80%
-60%
-40%
-20%
0%
20%
40%
1990 1995 2000 2002
CO2
SF6
HFCs
N2O
CH4
PFCs
(Rel
ativ
e ch
ange
s [%
])
102 101

※Beca use of the ro und off, the total may not b e 10 0%.
Total CO2 Emiss ions2002 (FY)1,248Mt
Total CO2 Emiss ions2002 (FY)1,248Mt
Resident ial 13.3%(5.5%)
Commercial & Inst itut ional 15.8%
(7.7%)
Transportat ion 21.0%
(20.4%)Manufacturing Industry& Construct ion
37.5%(30.1%)
Industrial Processes
3.9%
W aste1.9%
Energy Industries(e.g. Public Electricity)
6.6%
(30.4%)
Outside: CO2 emissions from heat and pow er
generation are allocated to demand side sectors
Inside: direct CO2 emissions
COCO22 Emissions by Sectors in 2002Emissions by Sectors in 2002
Mt-CO2
‘90 ‘95 20020
100
200
300
400
500
Energy Indus triesIndus trial Processes
Waste
(Base=‘90)
Trends of COTrends of CO2 2 Emissions of each SectorsEmissions of each Sectors
Manufacturing Indus try & Cons truction
476Mt → 468Mt (-1.7 %)
Transportation 217Mt → 261Mt (+20.4 %)
Comm ercial and Other Sector 144Mt → 197Mt (+36.7 %)
Res idential 129Mt → 166Mt (+28.8 %)
103 102

Nitrous Oxide (NNitrous Oxide (N22O)O)
Agriculture(Ente ric fermentation,Rice Cultivation , etc.)
Waste(Solid Waste Disposal,Wastewate r Handling, etc.)
Fugitive Emissions from Fuel
(natural Gas andC oal Mining)
3.1%
Fuel Com bustion
2.7%
Industrial Processes0.6%
69.4%24.2%
Anesthesia0.9%
Agriculture(Manure Management,Agricultural Soils , etc.)
56.7%
Fuel Com bustion27.2%
Industrial Processes(Production of AdipicAcid and Nitric Acid)
3.3%
Waste(W aste water Handling,Waste Incineration)
11.9%
Methane (CHMethane (CH44))
12.7%
17.0%
5.5%
20.1%
21.6%
9.5%
1.6%
8.1%
4.0%0.0%
National Total Em issionsof F-gas in 2002
Production ofF-gas
Foam Blowing
of HCFC-22
Metal Production
Aerosols, MDI
Solvents
SemiconductorManufacture, et c
Electri calEquipment
Other
Metal Production 4.0%
By-product Emissions ofHFC-23 from Production
of HC FC-2221.6%
Production ofF-gas
8.1%
Foam Blowing1.6%Ae rosols , MDI
9.5%Re frige rationand Air
Conditioning Equipment
12.7%
Solvents17.0%
SemiconductorManufacture , e tc
20.1%
Ele ctrical Equ ipment
5.5%
Other0.0%
HFCsHFCs, , PFCsPFCs and SFand SF66
104 103

Guideline to Establish Global Guideline to Establish Global Warming Countermeasures Warming Countermeasures
Area Promotion PlanArea Promotion Plan
Guideline for Local GovernmentsGuideline for Local Governments
BackgroundBackground
• 1990: Action Program for Arrest Global Warming • 1993: Guideline to Establish “Global Warming
Countermeasure Area Promotion Plan”• 2002: Revision of “Law to Promote Global Warming
Countermeasures”• Each Entitie s’ (National Government, Local Government,
Enterprising body, Citizen) responsibilities are clearly indicated
• Under this Law, Local Governments are encouraged to promote their area specific plan of GW countermeasure s
• 2003: Revision of Guideline to Establish “Global Warming Countermeasure Area Promotion Plan”
105 104

Objective of the GuidelineObjective of the Guideline
• To facilitate Local Government establishing GW Countermeasure Area Promotion Plan
• The Guideline is:to grasp the actual GHG emissions to find the key emission sources to be addressed (geographical, socio-economical characteristics
need to be considered)to evaluate the effects of conducted countermeasures against climate change
Work Flow of the Area Promotion Plan
Global Warming Countermeasure Area Promotion Global Warming Countermeasure Area Promotion PlanPlan
1. Rough estimation of GHG emissions by related statistics
2. Analysis of GHG emissions
3. Selection of key categories
4. Study countermeasures (e.g. tax, regulation, PRs) and their f easibility
5. Collect inf ormation of the area (e.g. questionnaire, interv iew
6. Detailed Estimation of GHG emissions & Analy sis
7. Setting GHG reduction Targets
8. Consideration of management strategies
9. Establish the Area Promotion Plan
10. Implementation of the plan
11. Check the progress
106 105

Current StatusCurrent Status• 44 Prefectures and Large Cities have
established GW Countermeasure Area Promotion Plans as of April 2004
Summary of the GuidelineSummary of the Guideline
Target User• Prefectures (47) and
Large Cities (13) (government ordinance designated cities)
• Municipalities are also expected and encouraged to use the Guideline
Target Coverage• GHG Emissions from any activities in the area• Evaluation of countermeasures, which are
strongly expected to promote in the area
107 106

Target Activities of Area Promotion Plan• GHG emissions caused by anthropogenic activities in the area are
expected to be covered.• Activities are classified into 5 categories; Energy Industries, Manufacturing
and Construction Industries (Blue Workers) , Resident & Commercial (White Workers and daily lives), Transport, Waste
Relationship with category of GHG Inventory
1. Energy Industries 1 A fuel combustion, 1 B fugitive emissions2. Industries CO2 allocated by electricity consumption*
1 A fuel combustion 2 Industrial Processes (incl. F-gas), 4 Agriculture
3. Resident & Commercial CO2 allocated by electricity consumption*1 A fuel combustion
4. Transport 1 A fuel combustion5. Waste 6 Waste
*These emission s ar e indir ect emissions
G W Countermeasure Area Promotion PlanG W Countermeasure Area Promotion Plan
Policy and M easures of Local Government on Global Warming• Countermeasures according to each local government’s
geographical & social-economical conditions• Countermeasures need not to cover all activities• Feasibility counts
To Grasp the actual GHG emissions• Estimate GHG emissions in the area, by category, and/or by gas • Estimation methods are indicated in the guideline (Chapter 1 - 5)• Each local government should choose methods taking into
consideration its area-specific conditions
G W Countermeasure Area Promotion PlanG W Countermeasure Area Promotion Plan
108 107

Target of the Area Promotion Plan• can be quantitative or qualitative• each local governments’ targets can be deferent according to its
geographical and/or socio-economical characteristics
Examples of Target,E1 : To reduce the certain % of total GHG emissions in the area
compared to the base year by target yearE2: To reduce the certain % of GHG emissions related to domestic
life compared to the base year by target yearE3: To reduce the certain % of GHG emissions per capita in the area
compared to the base year by target yearE4: “Some” industrial segment will reduce the certain % of total GHG
emissions compared to the base year by target year
Global Warming Countermeasure Area Promotion Global Warming Countermeasure Area Promotion PlanPlan
Responsible Entity• Countermeasures for all or main stakeholders in the area
(citizens, companies and local government itself)• Establishment of a forum for stakeholder dialogues is
encouraged.(e.g. Local Conference for Global Worming Countermeasure s)
Target Period• Revision in conjunction with the national Policy Programme is
preferable. • National Policy Programme on Climate Change takes step by
step approach.• 1st Step: 2002 – 2004• 2nd Step: 2005 – 2007• 3rd Step: 2008 - 2012
Global Warming Countermeasure Area Promotion Global Warming Countermeasure Area Promotion PlanPlan
109 108

Thank you !!Thank you !!
110 109

Development of Application Procedure Development of Application Procedure of the Tier 2 Methodology for CHof the Tier 2 Methodology for CH44Emission from Korean LandfillsEmission from Korean Landfills
Seungdo KimSeungdo KimPyrolysis Research LaboratoryPyrolysis Research Laboratory
Dept. of Environmental System Eng.Dept. of Environmental System Eng.Hallym UniversityHallym University
Pyrolysis Research Labora toryHALLYMUNIVERSITY
Introduction
111 110
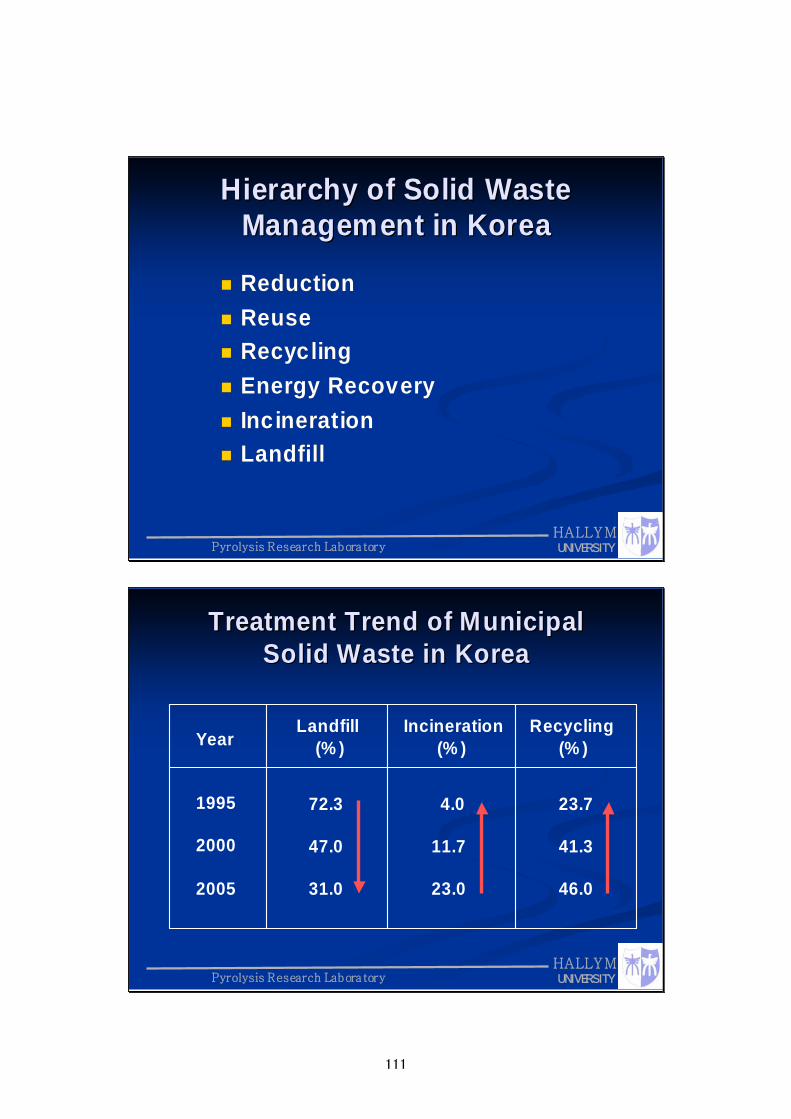
Pyrolysis Research Labora toryHALLYMUNIVERSITY
Hierarchy of Solid Waste Hierarchy of Solid Waste Management in KoreaManagement in Korea
ReductionReductionReuseReuseRecyclingRecyclingEnergy RecoveryEnergy RecoveryIncinerationIncinerationLandfillLandfill
Pyrolysis Research Labora toryHALLYMUNIVERSITY
Treatment Trend of Municipal Treatment Trend of Municipal Solid Waste in KoreaSolid Waste in Korea
Year
1995
2000
2005
Landfill Incineration Recycling(% ) (% ) (% )
72.3
47.0
31.0
4.0
11.7
23.0
23.7
41.3
46.0
112 111

Pyrolysis Research Labora toryHALLYMUNIVERSITY
MSW Compositional Generation Rate(2001 year)MSW Compositional Generation Rate(2001 year)
94.7 794.7 70.720.724.514.516.566.56Others (%)Others (%)
97.4 397.4 30.720.721.851.858.608.60Plastics (%)Plastics (%)
97.6 297.6 2ㅡㅡ2.382.384.444.44Cans (%)Cans (%)
99.6 099.6 0ㅡㅡ0.400.4019.8 219.8 2Metals (%)Metals (%)
98.6 698.6 6ㅡㅡ1.341.3415.4 715.4 7Glasses (%)Glasses (%)
99.6 699.6 60.080.080.260.2645.1 045.1 0Papers(%)Papers(%)
14,0 94.114,0 94.120.420.4138. 0138. 014,2 52.514,2 52.5Sum (ton/da y)Sum (ton/da y)
2.662.662.322.3295.0 295.0 28.678.67Others (%)Others (%)
2.152.150.020.0297.8 397.8 33.083.08Earth & Sand (%)Earth & Sand (%)
3.983.981.161.1694.8 694.8 62.782.78Metals & Glasses (%)Metals & Glasses (%)
8.488.48ㅡㅡ91.5 291.5 21.761.76Briquette ash (%)Briquette ash (%)
190. 7190. 780.280.25,31 1.65,31 1.65,582.55,582.5Sum (ton/da y)Sum (ton/da y)
0.900.9020.8 420.8 478.2 678.2 616.3 716.3 7Others (%)Others (%)
1.681.6831.4 231.4 266.9 066.9 07.257.25Plastics (%)Plastics (%)
1.651.6532.9 032.9 066.4 566.4 53.483.48Rubber &Leather (%)Rubber &Leather (%)
2.252.2545.1 945.1 952.5 652.5 67.017.01Woods (%)Woods (%)
1.831.8335.6 435.6 462.5 362.5 316.7 816.7 8Papers (%)Papers (%)
56.7 656.7 68.938.9334.3 134.3 132.8 132.8 1Food wastes (%)Food wastes (%)
6,63 7.36,63 7.36,47 5.76,47 5.715,5 50.615,5 50.628,6 63.628,6 63.6Sum (ton/da y)Sum (ton/da y)
20,9 22.120,9 22.16,57 6.36,57 6.321,0 00.221,0 00.248,4 98.648,4 98.6Total (ton/day)Total (ton/day)
Recyclin gRecyclin gInci nerationInci nerationLandfillLandfillG enerationG enerationItemItem
Com
bustib
les
No
n-C
om
bustib
les
Recycla
ble
s
Munic
ipalS
olid
Waste
Pyrolysis Research Labora toryHALLYMUNIVERSITY
Management Schemes of MSW in KoreaManagement Schemes of MSW in Korea
No
Landfill IncinerationAsh
Organic wastesInorganic wastes
Yes
• Aerobic digestion• Anaerobic digestion• Animal feeding
Food wastes
• Papers• P lastics• Meta ls
Others
MSW
Recycling
Source Separation
113 112

Pyrolysis Research Labora toryHALLYMUNIVERSITY
Estimation Methodology of CH4 from Landfill : Tier 2
Pyrolysis Research Labora toryHALLYMUNIVERSITY
Questions to be AnsweredQuestions to be Answered
Why should we apply the Tier 2?Why should we apply the Tier 2?
How much the accuracy may be improved How much the accuracy may be improved as a result of applying the Tier 2?as a result of applying the Tier 2?
What would be the most efficient What would be the most efficient approaches to adopt the Tier 2?approaches to adopt the Tier 2?
114 113

Pyrolysis Research Labora toryHALLYMUNIVERSITY
Methane Emission from Landfill: (1) Extraction Well, (2) Surface Diffusion
ExtractionWell
SurfaceDiffusion
Crack orWeak Point
A BRecovery of
Methane
Pyrolysis Research Labora toryHALLYMUNIVERSITY
Year
Generation Rate of CH4
(ton/yr)
Composite Gener ation Pattern of CH4
CH4 e mission fro m solid wastelandfilled durin g the 1s t yea r
2nd year 3rd ye ar
Emission Pattern of CH4 from Landfill over time
115 114

Pyrolysis Research Labora toryHALLYMUNIVERSITY
Methodologies suggested by IPCCMethodologies suggested by IPCCTier 1Tier 1
CH4 (ton/yr) = (MSW T x MSW F x MCF x DOC x DOCF x F x 16/12 –R) x (1-OX)
Assumptions(1) CH4 generated by the waste is released in the same year
the waste is deposi ted
(2) Landfilled amount is relatively constant over time
If waste disposal increases at about 2% per year over a 20~30 year period, the Tier 1 method would overestimate emissions by about 20~25%.
Pyrolysis Research Labora toryHALLYMUNIVERSITY
Methodologies suggested by IPCCMethodologies suggested by IPCC
Tier 2Tier 2
Basics(1) CH4 is emitted over a long period of t ime rather than instantaneously(2) First-order decay model has been broadly used to model generation rate
of CH4 from landf ills
L0 : Methane Generation PotentialMt : Annual am ount of solid was te landfilledk : Methane generation cons tant (yr-1)
)}exp(){exp(04
ktkcMLQ tCH −−−××=
116 115

Pyrolysis Research Labora toryHALLYMUNIVERSITY
Decis ion Tree for CH4 Emiss ions from Solid Waste Disposal Sites
Pyrolysis Research Labora toryHALLYMUNIVERSITY
What are the difficulties What are the difficulties in applying the Tier 2?in applying the Tier 2?
Lack of information on MSW landfilled Lack of information on MSW landfilled previouslypreviously
resulting in difficulty in estimating Lresulting in difficulty in estimating L0 0 valuevalue
Lack of information on how to measure Lack of information on how to measure the surface diffusion of CHthe surface diffusion of CH44
resulting in difficulty in estimating k valueresulting in difficulty in estimating k value
117 116

Pyrolysis Research Labora toryHALLYMUNIVERSITY
Methane Generation KineticsMethane Generation Kinetics
swCH MLk
dtdM
⋅⋅= 04Methane Generation Kinetic Equation
)}exp(){exp(04
ktkcMLQ tCH −−−××=Tier 2
Revised Tier 2
{ } { }[ ])1(exp)(exp)()()(1
004+−−−−−=∑
=
itkitkiLiMtQN
iCH
Pyrolysis Research Labora toryHALLYMUNIVERSITY
Key Parameters for Tier 2 MethodologyKey Parameters for Tier 2 Methodology
LL0 0 (Methane Generation Potential)(Methane Generation Potential)
L0 = MCF x DOC x DOCF x F x 16/12MCF: 0.4~1.0DOC: Country Specific Equation
DOCF : 0.5~0.6F: 0.4~0.6
DOC(%) = 0.114 x FW + 0.320 x PA + 0.366 x WO + 0.571 x RU+ 0.061 x SL + 0.114 x AN + 0.285 x OT
118 117
Pyrolysis Research Labora toryHALLYMUNIVERSITY
Key Parameters for Tier 2 MethodologyKey Parameters for Tier 2 Methodology
kk (Methane Generation Constant)(Methane Generation Constant)
(1) First Methodology(1) First Methodology
(2) Second Methodology(2) Second MethodologyBest fit to generation rate of CHBest fit to generation rate of CH44 at a certain yearat a certain year
ααγββ
242 −+−
=kt
CH
MLQ
cttc
0
224,,
2=−=
−= γβαwhere
Pyrolysis Research Labora toryHALLYMUNIVERSITY
Surface Diffusion MeasurementsSurface Diffusion MeasurementsDigital
Thermometer
Sampling Port
FloatingTube
48cm
19cm
119 118

Pyrolysis Research Labora toryHALLYMUNIVERSITY
Fortran Code for Estimating Fortran Code for Estimating kk valuevalue
Pyrolysis Research Labora toryHALLYMUNIVERSITY
Fortran OutputFortran Output
0
1000
2000
3000
4000
5000
6000
0 10 20 30 4
경과 연수(year)
TC
E
0
120 119

Pyrolysis Research Labora toryHALLYMUNIVERSITY
LL00 and Kand K values for Korean Landfillsvalues for Korean Landfills
LL00 : 0.15~0.30 ton: 0.15~0.30 ton--CHCH44/ton/ton--wastewaste
k : 0.04~0.09 yrk : 0.04~0.09 yr--11
IPCC default value : 0.05 yrIPCC default value : 0.05 yr--11
Pyrolysis Research Labora toryHALLYMUNIVERSITY
Comparison of CHComparison of CH44 emission emission from a Korean Landfill from a Korean Landfill
between Tier 1 and Tier 2between Tier 1 and Tier 2
-
5,000
10,000
15,000
20,000
25,000
30,000
1996 1997 1998 1999 2000 2001
Y ear
TC
E(t
on
/yr)
Tier 1
0
500
1000
1500
2000
2500
3000
1996 1997 1998 1999 2000 2001
Year
TC
E(t
on
/yr)
Tier 2
121 120

Pyrolysis Research Labora toryHALLYMUNIVERSITY
Estimation procedures for CHEstimation procedures for CH44emission by the Tier 2emission by the Tier 2
Classification of landfills by characteristics
Estimation of k values for characteristic landfills
Estimation of CH4 emissions form individual landfills
Summation of CH4 emission from individual landfills
Pyrolysis Research Labora toryHALLYMUNIVERSITY
Considerations on changing emission Considerations on changing emission methodology from Tier 1 to Tier 2methodology from Tier 1 to Tier 2
PrePre--requisitesrequisitesCollecting information on landfill histories of a ll Collecting information on landfill histories of a ll landfills: landfill amount, compositions of solid landfills: landfill amount, compositions of solid wastes, and landfill period etc.wastes, and landfill period etc.Monitoring the seasonal emission rates of CHMonitoring the seasonal emission rates of CH4 4 from the surfaces of representative landfills from the surfaces of representative landfills
Predicted ProblemsPredicted ProblemsUncertainty arising from the assumption of the Uncertainty arising from the assumption of the landfill histories of nonlandfill histories of non--sanitary landfillssanitary landfillsDifficulty in data managements: QA/QC and UADifficulty in data managements: QA/QC and UA
122 121

Pyrolysis Research Labora toryHALLYMUNIVERSITY
Thank you very much!
123 122

1
IPCC Good Practice Guidance IPCC Good Practice Guidance for Land Use, Landfor Land Use, Land--Use Change Use Change
and Forestryand Forestry
Leandro BuendiaProgramme Officer, IPCC-NGGIP-TS U
2nd Wor ksho p on G HG Inventories in Asia Region (WG IA)7-8 February 2005, Shanghai, China
2
Contents
Background InformationWhat is good practice guidance? Contents of GPG-LULUCFSummary of steps in LULUCF InventoryConclusions
124 123

3
Background InformationRevised 1996 IPCC Guidelines for National Greenhouse Gas Inventories (3 Volumes & software)Good Practice Guidance and Unce rtainty Management in National Greenhouse Gas Inventories (GPG2000)
EnergyIndustrial ProcessesAgricultureWaste
to avoi d the risk of inc onsistency with the SR-LULUCFKP sink negotiations were not conclude d in 2000
4
Background Information
Good Practice Guidance for Land Use, Land-use Change and Forestry (GPG-LULUCF)Publis hed in 2003
125 124

5
What is good practice guidance?
GPG2000 defines inventories consistent with good practice as those which contain neither over- nor underestimates so far as can be judged, and in which uncertaintiesare reduced as far as is practicable g iven national circumstances.
6
trans parentdocumentedconsistent over timecompletecomparableassessed for unce rtaintiessubject quality control and assuranceefficient in the use of resources available to inventory agenciesuncertainties are reduced as better information becomes available
Good practice guidance further s upports the development of inventories that are:
126 125

7
Contents of GPG-LULUCF
1 Overview2 Basis for Consistent Representation of
Land Areas3 LUCF Sector Good Practice Guidance4 Supplementary methods and good practice
guidance arising from the Kyoto Protocol5 Cross-Cutting Issues
8
1. Overviewsets out the mandate or the overall intent of the GPGsummarizes the practical advice provided to inventory agenciesprovides re lationship to 1996 GLshort summaries of the other chaptersdiscusses policy re levant issues
127 126

9
2. Basis for Consistent Representation of Land Areas
Provides guidance on the selection of methods for identifying and representing land areas and land-use changeIdentifies 6 land-use categories
Forest LandCroplandGrasslandWetlandSettlementsOther Land
10
2. Basis for Consistent Representation of Land Areas
Describes 3 approaches to identifying land areas:
Use of basic (and usually existing) land-use dataSurvey of land use and land-use changeGeographically explicit land-use mapping
Advice on the development of land-use databases and some examples on their usage to approaches
128 127

11
2. Basis for Consistent Representation of Land Areas (Annexes)
Examples of Approaches in Indiv idual CountriesExamples of International Land Cover Datasets
12
3. LUCF Sector Good P ractice GuidanceProvides methodological options for the estimation of emissions and removals of CO2 and non-CO2 GHG for the LULUCF sector
Methodological IssuesChoice of Method (3 tiers; decis ion trees)Choice of EFChoice of Acti vity DataCompletenessDe vel oping a Consistent Ti me Series
Uncertainty Assessment Inventory QA/QCReporting and Documentation
…Mapping back table to GL96 (Chapte r 5)
129 128

13
3. LUCF Sector Good P ractice Guidance
Addresses five carbon poolsAboveground biomassBelowground biomassDead woodLitterSoil C
Annexes and AppendicesBiomass Default Tables for Forest LandReporting Tables and WorksheetsBasis for Future Methodological Development (e.g. HWP, etc.)
14
4. Supplementary methods and good practice guidance arising from the Kyoto Protocol
General concepts of land-use change monitoring and reporting for KP.Summary tables of all reporting require ments, before, during, and after each Commitment Period.Decision trees that outline criteria to determine areas subject to afforestation (A), reforestation (R), deforestation (D), and manage ment activities.Supple mentary methods for estimating carbon stock changes and non-CO2 emissions for land-use change (AR, D) and land use (forest manage ment, cropland management, grazing land manage ment and revegetation).
130 129

15
4. Supplementary methods and good practice guidance arising from the Kyoto Protocol
4.3 LULUCF ProjectsGui dance for LUL UCF pr ojects on designing and imple menting multi-tier measuring and monitoring plansGui dance is s tand-al one, wi th cr oss-linkages to Chapters 3 and 5Does not cover:
baseline definitionAdditionalityLeakagenon-permanencemonitoring of socio-economic/environmental impacts
16
4. Supplementary methods and good practice guidance arising from the Kyoto Protocol
Annexes…
Tool for estimation of changes in soil carbon stocks associated with management changes in cropland and grazing lands based on IPCC default data (software in CD-ROM); see slides
Examples of allometric equations for estimating aboveground biomass and belowground biomass of trees
131 130

17
18
5 Cross-Cutting Issues
Uncertainty AssessmentCollecting and analysing data by samplingReconstruction of missing dataIdentification of Key Categories (to cover sink)Quality Assurance and Quality Control Time Series Consistency and RecalculationsVerification approaches (e.g. comparison of inventories, modelling approaches, and direct measurements)
132 131

19
Steps in LULUCF inventory preparation
1. Use the 3 approaches (Chapter 2) to e stimate land areas for each land-use category relevant to your country
2. Follow the good practice guidance (Chapter 3) to estimate the emissions and removals of GHGs for each land use, land-use change and pool relevant to your country. If necessary collect additional data to improve data quality. Perform key category analysis (Chapter 5).
3. Estimate uncertainties, report emissions/ removals, and implement Quality assurance/quality control procedure s (Chapter 5).
4. If required: prepare supplementary information for Kyoto Protocol reporting (follow Chapter 4))
20
ConclusionsGPG produces more reliable estimates of the magnitude of uncertainties in GHG inventories GPG provides improved understanding of how uncertainties may be managed to produce emissions estimates that are acceptable to UNFCCC (i.e. transparency, consistency, comparability, completenessand accuracy in inventories)
133 132
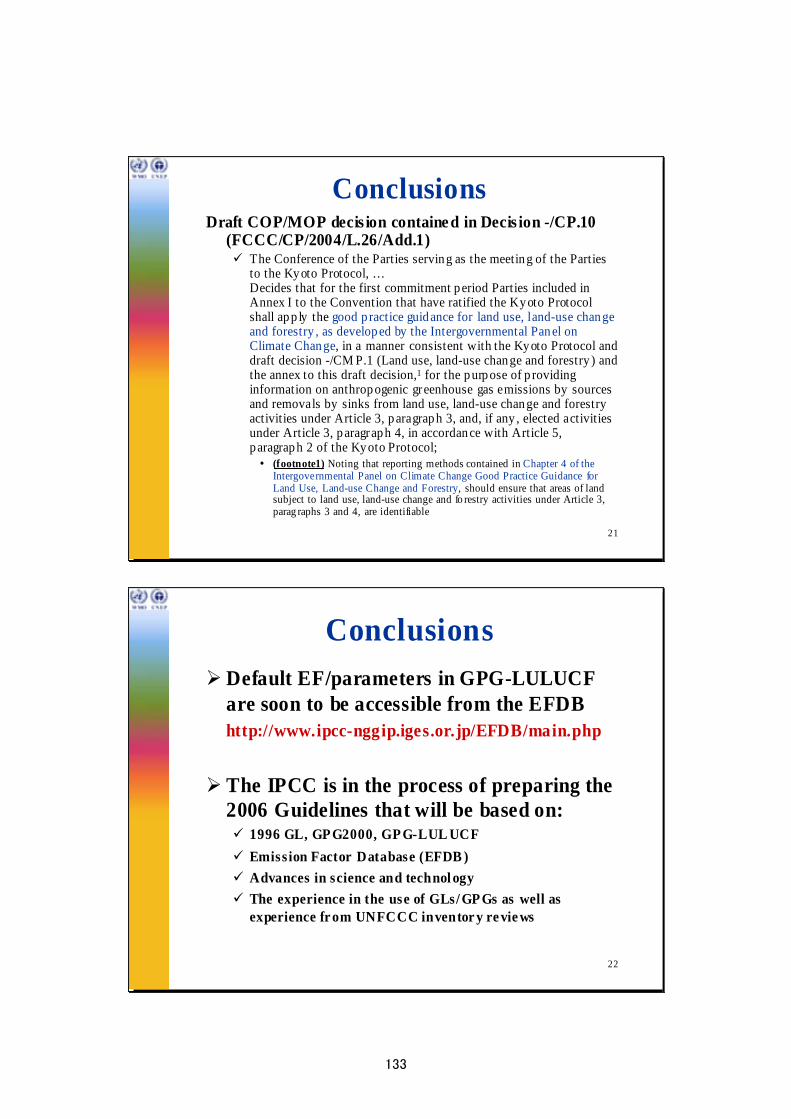
21
ConclusionsDraft COP/MOP decis ion containe d in Decis ion -/CP.10
(FCCC/CP/2004/L.26/Add.1)The Conference of the Parties serving as the meeting of the Parties to the Kyoto Protocol, …Decides that for the first commitment period Parties included inAnnex I to the Convention that have ratified the Kyoto Protocol shall app ly the good p ractice guidance for land use, land-use changeand forestry , as developed by the Intergovernmental Panel on Climate Change, in a manner consistent with the Kyoto Protocol and draft decision -/CM P.1 (Land use, land-use change and forestry ) and the annex to this draft decision,1 for the purpose of p roviding information on anthropogenic greenhouse gas emissions by sources and removals by sinks from land use, land-use change and forestry activities under Article 3, paragraph 3, and, if any , elected activities under Article 3, paragraph 4, in accordance with Article 5, paragraph 2 of the Kyoto Protocol;
(footnote1) Noting that reporting methods contained in Chapter 4 of the Intergovernmental Panel on Climate Change Good Practice Guidance for Land Use, Land-use Change and Forestry, should ensure that areas of land subject to land use, land-use change and fo restry activities under Article 3, parag raphs 3 and 4, are identifiable
22
ConclusionsDefault EF/parameters in GPG-LULUCF are soon to be accessible from the EFDBhttp://www.ipcc-nggip.iges.or.jp/EFDB/main.php
The IPCC is in the process of preparing the 2006 Guidelines that will be based on:
1996 GL, GPG2000, GP G-LUL UCFEmission Factor Database (EFDB )Advances in science and technol ogyThe experience in the use of GLs/ GP Gs as well as experience fr om UNFCCC inventor y re vie ws
134 133

23
http://www.ipcc-nggip.iges.or.jp
135 134

Asia-Pacific Network for Global Change Research
Dr. Linda Anne Stevenson
Outline of Presentation
APN – a very brief overview
APN and CAPaBLE ProgrammeCAPaBLE Programme
136 135

What is the APN?Inter-governmental network in the AsiaPacific Region with the priority goals of:
Increasing developing country participation in global change research through networking and capacity building
Fostering global change through regional cooperation and partnerships
Strengthening interactions betw een the natural and social sciences in global change w ith the policy- and decision-making community
Learn more about the APN
137 136

To support regional cooperation in global change research on issues particularly relevant to the region
To strengthen the interactions among scientists and policy-makers, provide a scientific input to policy decision making and scientific knowledge to the public
To improve the scientific and technical capabilities of nationsof the region
To facilitate the standardisation, collection, analysis and exchange of scientific data and information relating to global change research
To cooperate with other global change networks and organizations
To facilitate the development of research infrastructure and thetransfer of know-how and technology
6 G
oals
of
the
APN
APN Research Framework
Changes in Coastal Zones & Inland W aters
Climate Change & Variability
Changes in Terrestrial Ecosystems & Biodiversity
Integration of the findings of natural Integration of the findings of natural sc ience with social and economic fac torssc ience with social and economic fac tors
Input to policy mak ing and Input to policy mak ing and implementationimplementation
Changes in A tmospheric Composition
Human Dimensions
of Global Change
138 137

99thth SPG/IGM Meeting SPG/IGM Meeting
Canberra, Australia Canberra, Australia
March 2004 March 2004
Sombo Yamamura - Secretariat
Linda Ste venson - Secretariat
Yuki Imanari - Secretariat
Randal Helten – Consultant
Martin Rice – Secretariat
APN and CAPaBLE ProgrammeCAPaBLE Programme
139 138

Scientific Capacity Building and Enhancement for Sustainable Development in Developing Countries
The CAPaBLECAPaBLE Programm e is a concrete ini tiative to rea lize parts 110 to 114 of the Johannesburg Plan of Implem entation for the WSSDWSSD and
was registered as a WSSD Type II Partnership Initiative by the Ministry of the Environm ent, Japan.
The CAPaBLE programme is developing and enhancing scientific capacity in developing countries to improve their decision-making in the
target areas related to
climate change and w ater and food security that are directly linked to their sustainable evelopment.
The Official Launch The Official Launch 88thth IGM, April 2003IGM, April 2003
A WSSD T ype II Partnership Initiat iveA WSSD T ype II Partnership Initiat ive
Making a DifferenceMaking a Difference
140 139

The CAPaBLE Programme is sponsored by the governments of Australia, Japan, New Zealand and the
U.S.A.
Main Activities under Phase I (2003-2006)
Capacity Building: activities for aspiring scientists.
Dissemination: activ ities for policy-makers,
decision-makers & for civil-society.
Capacity Enhancement: research projects planned and implemented by leading developing country scientists targeting specific topics related to climate change.
End-Product: an APN publication as an end-product (synthesis book that will synthesise the activ ities and outcomes that resulted from first Phase of CAPaBLECAPaBLE).
141 140

CAPaBLE Regional Participation 76% APN member countries participating in
the first year
23%
23%
23%
15%
8%
8%
Southeast Asia
Oceania
East Asia
South Asia
Pan Asia-Pacific
Inter-Regional
Comprehensive Research Projects
CRP-Theme I: Dr. Khan, GCISCEnhancement of National Capabilities in the Application of Simulation Models for the Assessment of Climate Change and its Impacts on Water Resources and Food and Agriculture
CRP-Theme II: Professor Shukla, IIMIntegrated Assessment Model for Developing Countries and Analysis of Mitigation Options and Sustainable Development Options
142 141

Comprehensive Research Projects
Dr. Arshad M. Khan, GCISC, Pakistan
Professor Shukla, IIM, India
Capacity Building Activities
Regional Climate Models /CLIVAR W orkshop CB-08
National CB Workshop on GC Research (Pakistan)CB-07
UNFCCC Training Workshop on National CommunicationsCB-06
Climate Change Mitigation with Locally Owned Technology and Systems
CB-05
Creating Climate Knowledge Networks through Strategic, Global Linkages (with IAI)
CB-04
Capacity Building for GHG Inventory Develop ment in Capacity Building for GHG Inventory Develop ment in AsiaAsia--Pacific Developing CountriesPacific Developing Countries
CBCB--0303
Training Institute on Climate and Extreme Events in the Pacific
CB-02
Building Capacity of Mekong River Countries to Assess Impacts from Climate Chang e
CB-01
143 142

Capacity Building for GreenhouseCapacity Building for GreenhouseGas InventoryGas Inventory Development in Development in A siaA sia--
Pacific Developing CountriesPacific Developing Countries
Partnerships Creating CapacityPartnerships Creating Capacity
Creating Cl imateCreating Cl imateKnowledge NetworksKnowledge Networksthrougthrough h Strategic,Strategic, GlobalGlobalLinkagesLinkages
Building the Capacity of Mekong River Countries to AssessBuilding the Capacity of Mekong River Countries to AssessImpacts f rom Climate Change Impacts f rom Climate Change -- C ase Study Approach onC ase Study Approach onAssessment of Community Vulnerability and Adapatat ionAssessment of Community Vulnerability and Adapatat ionto the Impacts of Cl imate Change on Water Resources andto the Impacts of Cl imate Change on Water Resources andFood ProductionFood Production
WCRP Modelling Workshop / WCRP Modelling Workshop / CLIVAR ConferenceCLIVAR Conference
Training Institute on Climate and Ext remeTraining Institute on Climate and Ext remeEvents in theEvents in the PacificPacific
CapacCapacity Building Workshop on Climate Change Mitig ation ity Building Workshop on Climate Change Mitig ation w ithw ithLocally Owned Technology and SystemsLocally Owned Technology and Systems
National C apacity Building National C apacity Building Workshop on Global Change Workshop on Global Change ResearchResearch
APN/UNFCCC Tra ining Workshop for the Nat ional Cl imate APN/UNFCCC Tra ining Workshop for the Nat ional Cl imate Change Focal Points in the APN Region on the Guidelines for Change Focal Points in the APN Region on the Guidelines for
National Communicat ions of NonNational Communicat ions of Non--Annex I Part iesAnnex I Part ies
Capacity enhancement of leading researchers in developing countries to produce comprehensive scientific results on climate change impacts, vulnerabilities, adaptation and mitigation strategies.
Capacity building of aspiring scientists through sharing of Know ledge, experience, scientific information and data collection on climate change impacts, vulnerabilities, adaptation and mitigation.
Improvement of informed decision-making in developing countries by dissemination of the outcomes of research activities to policy-makers, decision-makers and civil society.
Partnerships Creating CapacityPartnerships Creating Capacity
144 143

“As a regional forum bringing together policy-makers and researchers on practical, policy-relevant research and capacity building, the
APN is making an invaluable contribution to our ability to respond to global change.”Statement: Howard Bamsey, CEO,
Australian Greenhouse Office
http://www.apn.gr.jpThank youThank you
145 144

1
Introduction of the APN CAPaBLE Project Introduction of the APN CAPaBLE Project ““Capacity Building for GHG Inventory Capacity Building for GHG Inventory
Development in AsiaDevelopment in Asia--Pacific Developing Countries Pacific Developing Countries
(APN CAPaBLE GHG Inventory Project)(APN CAPaBLE GHG Inventory Project)””
Hideaki Hideaki NakaneNakane, , TomoyukiTomoyuki AizawaAizawa and and ChisaChisa Umemiya Umemiya Greenhouse Gas Inventory Office of Japan (GIO),Greenhouse Gas Inventory Office of Japan (GIO),
CenterCenter for Global Environmental Research (CGER),for Global Environmental Research (CGER),National Institute for Environmental Studies (NIES)National Institute for Environmental Studies (NIES)
Presented at the 2Presented at the 2ndnd Workshop of GHG Inventories in Asia regionWorkshop of GHG Inventories in Asia regionFebruary 7February 7--8, 20058, 2005
2
Collaborators
ThailandDr. Sirintornthep Towprayoon
Dr. Amnat Chidthaisong
King’s Mongkut’s University of Technology Thonburi
CambodiaMr. Thy SUM
Mr. Heng Chan Thoeun
Ministry of Environment
146 145

3
Relation between the pilot project and WGIA
This pilot studies will pursue training in Japan, establis hment of sustainable inventory, development of the system and studies on country/regional emission factors including field measurements in Thailand and Cambodia.
In the workshops, the direction of pilot studies and the results of them will be discussed. The accomplishme nts of the pilot studies will be shared by the participating countries of the workshops to establish more reliable emission factorsand more involve ment of ASIA-PACIFIC countries with the international activities on GHG inventories.
4
Main objectives
1. To carry out pilot studies on improvement of GHG inventories for effective countermeasures.
2. To make sustainable systems to develop GHG inventories.
3. To provide more realistic emission factors reflecting country and regional conditions
4. To exchange information and experiences to establish accurate activity data.
5. To clarify directions to apply the methodologies developed in the pilot studies to all
ASIA-PACIFIC countries.
6. To enhance involvement and leadership of ASIA-PACIFIC developing countries in
the international efforts to improve GHG inventories
7. To provide policy makers with basic information to formulate and implement measures to reduce GHG emissions and enhance GHG removals.
8. To share useful information and experiences in GHG inventory preparation
9. To discuss the future activities of the Asian network
147 146

5
Outcomes of the first year· The 1st Work shop on GHG Inventories in Asia Region
· The first collaborator’s meeting with the collaborator from Cambodia;
(1) pro moted better understating of outline of a pilot s tudy,
(2) e xchanged information of GHG inventories of Ca mbodia and Japan,
(3) c reated a well-s tructured file sys tem for the Ca mbodia’s GHG inventory,
(4) carried out a key category analysis .
· The four-week training of the project collaborator from Thailand
(1) pro moted better understating of outline of a pilot s tudy in Thailand.
(2) indicated the usefulness of the new portable CH4 and CO2 detection sys tem,
(3) provided the necessary skills to operate and ma intain the es tablished system.
Evaluation: very positive
6
Thank you very much!!
Details of the activities of the pilot project will be given
by Mr. Thy Sum and Dr. Amnat Chidthaisong.
148 147

The 2nd Workshop on GHG Inventories in Asia Region
7 -8 February 2005Shanghai, China
Cambodia’s LULUCF inventory improvement under the APN CAPaBLE GHG Inventory Project
Presented by: Sum ThyChief of Climate Change Office, Ministry of Environment, Cambodia
Outline of Presentation
• Why improve Cambodia's LULUCF inventory
• Scope of study
• Location of Study
• Methodology
• Progress to date
• Next activities
• Conclusion/recommendation
149 148

1. Why improve Cambodia's LULUCF inventory (1)
Emission from LULUCF contributed about 97 % of the Cambodia's 1994 National GHG Inventory
There was no research on emission factor (aboveground biomass, biomass growth rate), therefore the IPCC emission factors were used for the preparation of Cambodia's 1994 GHG inventory.
In 2001, a fie ld study on aboveground biomass and biomass increment was conducted under CCEAP-phase 2. However the data from the field survey may not reflect to the overall condition of Cambodian forests, due to:(1) limitation of time, financial support, and expertise (2) limitation of number of location and sample selected
1. Why improve Cambodia's LULUCF inventory (1)
AIPCC Source Category
BDirectGHGs
C1994 Estimate
ABS ELevelAssessment
F% Contributionto Level
Cumulative
5A Changes in Forest / Woody Biomass Forest - Deciduous CO2 -28,597.80 28,597.80 0.203 20.26% 20.26%5A Changes in Forest / Woody Biomass Forest - Evergreen CO2 -22,148.50 22,148.50 0.157 15.69% 35.95%5B Forest & Grassland Conversion Biomass-Decay- Forest - Secondary/Regrowth CO2 14,124.00 14,124.00 0.100 10.01% 45.96%5A Changes in Forest / Woody Biomass Forest - Mixed&Coniferous CO2 -11,757.90 11,757.90 0.083 8.33% 54.29%5B Forest & Grassland Conversion On-Site-Burning- Forest - Secondary/Regrowth CO2 10,169.28 10,169.28 0.072 7.20% 61.49%5A Changes in Forest / Woody Biomass Roundwood Harvested CO2 8,271.94 8,271.94 0.059 5.86% 67.35%5B Forest & Grassland Conversion Biomass-Decay- Forest - Deciduous CO2 4,154.33 4,154.33 0.029 2.94% 70.29%5A Changes in Forest / Woody Biomass Shrubland CO2 -3,974.67 3,974.67 0.028 2.82% 73.11%5B Forest & Grassland Conversion On-Site-Burning- Forest - Deciduous CO2 2,991.12 2,991.12 0.021 2.12% 75.23%4A Enteric Fermentation Non-dairy Cattle CH4 2,587.20 2,587.20 0.018 1.83% 77.06%5B Forest & Grassland Conversion Biomass-Decay- Forest - Evergreen CO2 2,586.38 2,586.38 0.018 1.83% 78.89%5B Forest & Grassland Conversion Off-Site-Burning- Forest - Secondary/Regrowth CO2 2,542.32 2,542.32 0.018 1.80% 80.70%5A Changes in Forest / Woody Biomass Forest - Secondary/Regrowth CO2 -2,179.10 2,179.10 0.015 1.54% 82.24%4C Rice Cultivation Rainfed CH4 2,177.07 2,177.07 0.015 1.54% 83.78%5A Changes in Forest / Woody Biomass Forest - Inundated CO2 -1,890.31 1,890.31 0.013 1.34% 85.12%5B Forest & Grassland Conversion On-Site-Burning- Forest - Evergreen CO2 1,862.19 1,862.19 0.013 1.32% 86.44%5B Forest & Grassland Conversion On-Site-Burning CH4 1,570.08 1,570.08 0.011 1.11% 87.55%5B Forest & Grassland Conversion Biomass-Decay- Shrubland CO2 1,440.40 1,440.40 0.010 1.02% 88.57%5B Forest & Grassland Conversion Biomass-Decay- Forest - Inundated CO2 1,204.50 1,204.50 0.009 0.85% 89.43%4B Manure Management Solid System and Drylot N2O 1,196.81 1,196.81 0.008 0.85% 90.27%5B Forest & Grassland Conversion On-Site-Burning- Shrubland CO2 1,037.09 1,037.09 0.007 0.73% 91.01%4C Rice Cultivation Irrigated CH4 981.29 981.29 0.007 0.70% 91.70%4D Agricultural Soils 1 Direct Emissions N2O 971.12 971.12 0.007 0.69% 92.39%5A Changes in Forest / Woody Biomass Plantation CO2 -918.50 918.50 0.007 0.65% 93.04%5B Forest & Grassland Conversion On-Site-Burning- Forest - Inundated CO2 867.24 867.24 0.006 0.61% 93.66%4D Agricultural Soils 3 Indirect Emissions N2O 848.05 848.05 0.006 0.60% 94.26%4A Enteric Fermentation Buffalo CH4 808.50 808.50 0.006 0.57% 94.83%5B Forest & Grassland Conversion Off-Site-Burning- Forest - Deciduous CO2 747.78 747.78 0.005 0.53% 95.36%
Key category analysis
Tomoyuki AIZAWA, March 2004. 1st Collaborators’ Meeting
150 149

2. Scope of study
The field survey will focus on the main forest types that play important role as the key source/sink in the estimation of emission and removal in LULUCF.
Selected Forest type to be conducted field survey: (a) deciduous, (b) evergreen, and (c) secondary forests.
Data to be measured: Annual Growth Rate and aboveground biomass of the metioned forest type.
Proposed schedule for field survey: Starting from February 2005.
3. Location of study
Deciduous
Evergreen
Secondary
Deciduous
Evergreen
Secondary
151 150

4. Methodology (1)
• FAO's methodology will be adapted, but more precise as CAPaBLE Project measures biomass in necromass, understorey, and litters.
• Two permanent plots of 2,500 m2 (50 m x 50 m) for each forest type will be established in two different provinces. All trees species with a diameter of 30 cm or greater are numbered and measured.
• Furthermore, establish three sub-plots from the same corner peg for the collection of tree information of different tree diameter classes as follows:
4. Methodology (2)
(a) Sub-plot 1: a 2x2=4m2 plot in which count is made for all seedlings less than 5 cm in diameter.
(b) Sub-plot 2: a 5x5=25m2 plot in which all sapling by species or species class, over 5 cm and under 7.5 cm in diameter, are numbered and measured.
(c) Sub-plot 3: 20x20 = 400m2 plot in which all trees with a diameter of 7.5 cm or greater and less than 29.9 cm (>7.5-29.9cm) are numbered
and measured for diameter with species recorded.
152 151

4. Methodology (3)
P4
P3
P2P1
2m
5m
20m
50m
5m2m 20m
50m
5. Progress to date
• Visited Greenhouse Gas Inventory Office of JapanNational Institute for Environmental Studies (NIES) in March 2004 to identify the potential improvement of emission factors reflecting country and regional conditions including actual measurements.• Assessed key source category for Cambodian GHG Inventory• Several discussion have been made through email to find out appropriate methodology for improving the GHG inventory in LULUCF.• Three days field training has been organized for project team. • Selected methodology, forest types and locations for field measurement.
153 152

6. Next Activities
• Field measurement for selected forest types and locations• Data compiling and report writing.
7. Conclusion/recommendation
• APN CAPaBLE GHG Inventory Project will help Cambodia to improve its national GHG inventory by focusing on the key factors.
• Aboveground biomass and biomass growth rate of dec iduous, evergreen, and secondary forests will be deve loped.
• Project team will gain experiences and skills in fie ld measurement.
• Some difficulties: limited budget, expertise, equipements.
• Our recommendation:(1) More research on Biomass After Conversion of each forest
type would be done. (2) Expend collaboration with other programs/projects (3) APN's fund for next year activities is needed for second
measurement.
154 153

Rapid and Accate Measurements of Methane Emissions from Rice Paddies under the APN
CAPaBLE GHG Project
Amnat Chidthaisong
Joint Graduate School of Energy & Environment, King Mongkut’s Univers ity of Technology
Thonburi, Bangkok, Thailand
Thailand Greenhouse Gas Inventory 1994
GHGs Emission CO2-equivalent %(Gg) (Gg)
CO2 202,458 202,458 71CH4 3,171 66,598 23N2O 56 17,317 6
155 154

Rice cultivation2111
Mannure management140
Enteric Fermentation630
Oil & Natual gas178
Others20
Methane Emission from Thailand (Gg, 1994)
Oil & Natural gas
Current InventoryEmission Factors calculated from;
-Derived using the average of the measurements conducted in four typical rice growing areas in Thailand (1.56 kg-CH4 per ha per d) which were under continuous flooding (no fertilizer) in the wet season during 1992 to1994-The average methane emission rate was converted according to different water regimes and organic matter amendment using IPCC correction factors.
156 155

157 156

IPCC EFLocal EF
0.00420210
1653303271648
16232251,878
• Link to main economic activity (rice production) and majority of population well-being.
• Room to improve emission inventory;area coveringtemporal variationscultivation practices: organic/inorganic
fertilization, water management, seasons.
Methane Emission from Rice Paddy in Thailand
158 157

Method for Emission Measurements
Static Chamber methods
0 10 20 30 40 50
5
10
15
20
25
0
Cham
ber h
eads
pace
CH
4 con
cent
ratio
n(pp
m)
Closure time (min)
dtdC
AV Flux
4CH =
159 158

Chamber enclosure
Gas samples
Gas Chromatography
Flux estimate
Current Procedures
• Time consuming• Limited replication• Expensive• Accuracy concerns• Not applicable in the remote area
160 159

Chamber enclosure
Gas samples
Gas Chromatography
Flux estimate
Training: Determination of CH4Concentration using semiconductor
sensor at NIES
• To learn how to use the CH4 sensor unit for determining CH4concentration.
• 1-30 March 2004, 15-31 August 2004
161 160

Sensing Mechanism
Conductivity increases as electrons are released; proportional to the amount of reduced gasR+O2
2- RO+2e-
162 161

Std gas for calibration
Filter
Filter Filter Filter-inlet
pump
Nafion tube
Back flush adjustment
3-way exchange valve
Mg(ClO4)2
Insulator
OutIn
CH4sensor
glass wool
P2O5 moisture trap
NDIR
Data logger
air flow toward CH4sensor
Outlet
40.0
Std
water trap & discard
Std gas for calibrationStd gas for calibration
Filter
Filter Filter Filter-inlet
pump
Nafion tube
Back flush adjustment
3-way exchange valve
Mg(ClO4)2
Insulator
OutIn
CH4sensor
glass wool
P2O5 moisture trap
NDIR
Data logger
air flow toward CH4sensor
Outlet
40.0
Std
water trap & discard
CH4sensor, NDIR
Control Unit
Data logger
Air flow in
Air flow out
163 162

Sensor Mobile Unit
04/0
3/23
6:4
1:11
04/0
3/23
6:4
9:31
04/0
3/23
6:5
7:51
04/0
3/23
7:0
6:11
04/0
3/23
7:1
4:31
04/0
3/23
7:2
2:51
04/0
3/23
7:3
1:11
04/0
3/23
7:3
9:31
04/0
3/23
7:4
7:51
04/0
3/23
7:5
6:11
04/0
3/23
8:0
4:31
04/0
3/23
8:1
2:51
04/0
3/23
8:2
1:11
04/0
3/23
8:2
9:31
04/0
3/23
8:3
7:51
04/0
3/23
8:4
6:11
04/0
3/23
8:5
4:31
04/0
3/23
9:0
2:51
04/0
3/23
9:1
1:11
04/0
3/23
9:1
9:31
1.60
1.62
1.64
1.66
1.681700.16
1903.27
1753.85
1798.05
1821.23
1851.45
CH4 se
nsor
sign
al (V
)
Acquiring time
CH4 Determination
164 163

1700 1750 1800 1850 19001.62
1.64
1.66
1.68
1.70
1.72
Parameter Value Error------------------------------------------------------------A 2.39686 0.01539B -4.00736E-4 8.49709E-6------------------------------------------------------------
R SD N P-------------------------------------------------------------0.9991 0.7324 6 <0.0001------------------------------------------------------------
CH
4 sig
nal o
utpu
t (V
)
CH4 concentration (ppb)
1.62
1.64
1.66
1.68
1.70
1.72
Measurement Range
6 0 0 8 0 0 1 0 0 0 1 2 0 0 1 4 0 0 1 6 0 0 1 8 0 01
2
3
4
5
6
7
8
9
1 0
1 1
Met
hane
con
cent
ratio
n (p
pm)
S i g n a l o u t p u t ( m V )
165 164

1700 1750 1800 1850 1900
1700
1750
1800
1850
1900
Concentration by sensor (ppb)
r2 = 0.99923C
once
ntra
tion
by N
IES
(ppb
)
CH4
04/0
3/23
6:3
7:51
04/0
3/23
6:4
2:51
04/0
3/23
6:4
7:51
04/0
3/23
6:5
2:51
04/0
3/23
6:5
7:51
04/0
3/23
7:0
2:51
04/0
3/23
7:0
7:51
04/0
3/23
7:1
2:51
04/0
3/23
7:1
7:51
04/0
3/23
7:2
2:51
04/0
3/23
7:2
7:51
04/0
3/23
7:3
2:51
04/0
3/23
7:3
7:51
04/0
3/23
7:4
2:51
04/0
3/23
7:4
7:51
04/0
3/23
7:5
2:51
04/0
3/23
7:5
7:51
04/0
3/23
8:0
2:51
04/0
3/23
8:0
7:51
04/0
3/23
8:1
2:51
04/0
3/23
8:1
7:51
04/0
3/23
8:2
2:51
04/0
3/23
8:2
7:51
04/0
3/23
8:3
2:51
04/0
3/23
8:3
7:51
04/0
3/23
8:4
2:51
04/0
3/23
8:4
7:51
04/0
3/23
8:5
2:51
04/0
3/23
8:5
7:51
04/0
3/23
9:0
2:51
04/0
3/23
9:0
7:51
04/0
3/23
9:1
2:51
04/0
3/23
9:1
7:51
0 .9 0
0 .9 2
0 .9 4
0 .9 6
0 .9 8
1 .0 0
1 .0 2
3 6 9 .5 0
3 7 3 .8 7
3 8 4 .4 53 8 3 .5 7
3 5 8 .9 8
3 9 8 .6 4
CO2 si
gnal
(V)
A cq u irin g tim e
CO2 Determination
166 165

360 370 380 390 4000.90
0.92
0.94
0.96
0.98
1.00
1.02
Parameter Value Error------------------------------------------------------------A 0.02383 0.00203B 0.00248 5.35869E-6------------------------------------------------------------
R SD N P------------------------------------------------------------0.99999 0.2616 6 <0.0001------------------------------------------------------------
Sign
al o
utpu
t (V
)
CO2 concentration
0.90
0.92
0.94
0.96
0.98
1.00
1.02
360 370 380 390 400
360
370
380
390
400
Conc
entra
tion
dete
rmin
ed b
y N
IES
(ppm
)
Concentration determined by sensor unit(ppm)
r2 = 0.99996
Conc
entra
tion
dete
rmin
ed b
y N
IES
(ppm
)
360 370 380 390 400
360
370
380
390
400
Concentration determined by sensor unit(ppm)
r2 = 0.99998
167 166

Field Deployment
168 167

2004/8/26 19:40:502004/8/26 22:27:30
2004/8/27 1:14:102004/8/27 4:00:50
2004/8/27 6:47:302004/8/27 9:34:10
400
600
800
1000
1200
1400
1600
1800
2000 a) MethaneSi
gnal
out
put (
mV
)
-8
-7
-6
-5
-4
-3
-2
-1
0
1
2
3
4
2004/8/26 19:40:50
2004/8/26 22:27:302004/8/27 1:14:10
2004/8/27 4:00:502004/8/27 6:47:30
2004/8/27 9:34:10
30.6
30.8
31.0
31.2
31.4
31.6
31.8
32.0c) Flow rate & humidity
Relative humidity(%)
Humudity output
RH (%
)
Flow
rate
(mL
min
-1)
Flow rate
2004/8/26 19:40:50
2004/8/26 22:27:302004/8/27 1:14:10
2004/8/27 4:00:502004/8/27 6:47:30
2004/8/27 9:34:10-200
0
200
400
600
800
1000
1200
1400
1600b) Methane
Time (year/month/day hr:mm:ss)
Sign
al o
utpu
ts (m
V)
2004/8/26 19:40:50
2004/8/26 22:27:302004/8/27 1:14:10
2004/8/27 4:00:502004/8/27 6:47:30
2004/8/27 9:34:1070
72
74
76
78
80
d) Temperatures
Cell
tem
pera
ture
( C)
Sensor temperature
Time (year/month/day hr:mm:ss)
Sens
or te
mpe
ratu
re (
C)
850
855
860
865
870
875
880
885
890
895
900
1.01.11.21.31.41.51.61.71.81.92.02.12.22.32.42.52.62.72.82.93.0
Hum
idity
out
put s
igna
l (m
V)
28
30
32
34
Room temperature
49.0
49.5
50.0
50.5
51.0
51.5
52.0
Room
tem
pera
ture
( C)
Cell temperaturer
b) CO2
2004/8/26 14:25:20
2004/8/26 14:42:00
2004/8/26 14:58:40
2004/8/26 15:15:20
2004/8/26 15:32:00
2004/8/26 15:48:40
2004/8/26 16:05:20
2004/8/26 16:22:00
2004/8/26 16:38:401400
1450
1500
1550
1600
1650
1700
1750
CO
2 out
put s
igna
l (m
V)
Met
hane
out
put s
igna
l (m
V)
2004/8/26 14:25:20
2004/8/26 14:42:00
2004/8/26 14:58:40
2004/8/26 15:15:20
2004/8/26 15:32:00
2004/8/26 15:48:40
2004/8/26 16:05:20
2004/8/26 16:22:00
2004/8/26 16:38:401.2
1.3
1.4
1.5
1.6
1.7
1.8
1.9
2.0
Tem
pera
ture
(C)
Sensor temperature
Air temperature Relative humidityRela
tive
hum
idity
(%)
400
600
800
1000
1200
1400
1600
3rd measurement2nd measurement
CO2
CH41st measurement
32
33
34
35
36
37
74
75
76
77
169 168

Methane Flux
0 5 10 15 20 25 301.5
1.6
1.7
1.8
1.9
2.0
2.1
2.2
2.3
2.4
2.5
CH4 flux =1.43 mg CH4 m2 h-1
y = 1.62577+0.01847x,
r2=0.9970, n=157,p<0.0001Con
cent
ratio
n (p
pm)
Time (min)
0 5 10 15 20 25 30
100
150
200
250
300
350
CO
2 con
cent
ratio
n (p
pm)
Time (min)
0 1 2 3 4
260
270
280
290
300
310
320
330
340
y = 333.94-18.03x
r2= 0.9963, n=25, p<0.0001
CO
2 con
cent
ratio
n
Time (min)
CO2 flux : -3066 mg m-2 hr-1
170 169

• The sensor unit:• mobile, no need for external
power supply• quick measurement, reliable,
accurate• many measurement replications• cheaper cost per measurement• relatively easy to operate
What’s next?
Use for CH4 emission measurement in Thai paddies
Comparing with the conventional chamber-GC method
Apply in various rice cultivation schemes
Emission factor database for CH4 emission in Thailand
Application in other countries
171 170

Thanks NIES GHG Inventory Team--JapanJoint Graduate School of Energy & Environment (JGSEE), King Mongkut’s Univ. of Technology Thonburi---ThailandAPN—Financial supports
172 171

1
Identification of regionallyIdentification of regionally--significant significant source/sink categories in Asiasource/sink categories in Asia
ChisaChisa UM EMIYA and UM EMIYA and TomoyukiTomoyuki AIZAWAAIZAWAGreenhouse Gas Inventory Office of JapanGreenhouse Gas Inventory Office of Japan
The 2The 2ndnd Workshop of GHG Inventories in Asia regionWorkshop of GHG Inventories in Asia regionFebruary 7February 7--8, 20058, 2005
2
OutlineOutline
1.1. Purpose of presentationPurpose of presentation
2.2. Good experiences in other regions: Good experiences in other regions: UNDP-GEF Regional Capacity Development Project in Europe/CIS region
3.3. RegionallyRegionally--significant source/sink significant source/sink categories in Asia categories in Asia
4.4. SummarySummary
173 172

3
Purpose of presentationNetwork of Asia Region on GHG Inventories successfully established to:
• Share experiences and information
• Enhance technical and institutional capacity
How can we utilize How can we utilize NetworkNetwork of Asia Region of Asia Region more effectively more effectively in the future?in the future?
Let’s see what other regions are doing!!
4
Good experiences in other regions
UNDP-GEF Regional Capacity Building ProjectGoal: to strengthen capacity to improve quality of GHG inventories
Idea: additional to efforts within a country while taking into account national priorities
Size: participated by 12 countries in the regions
Source: Project document for Capacity-building for Improving the Quality of Greenhouse Gas Inventories in Europe/CIS regi on available at http://www.gefonline.org/ projectDetails.cfm?projID=1018 accessed on Dec. 2004
174 173

5
UNDP-GEF Regional Capacity Building ProjectOverview:
Funds (million US D)DurationNo. of countries
Region
GEF:2.992Co-finance*2: 0.605
3 yrs since Jan. 2004
14West & Francophone Central A frica
GEF:2.263Co-finance*1: 0.994
3 yrs since Jun. 2003
12Europe/CIS
*1: 0.944 from Government in kind + 0.05 from Swiss Government
*2: Only from Government in kind
Good experiences in other regions
6
UNDP-GEF Regional Capacity Building ProjectWhat they do:
Examples of actionsProject objectives
Compilation of local EFs; Improved at least 3 regionally-significant EFs
4) Improved methodology & EFs
Training of trainers in GPG; Na tiona l QA/QC plan
3) Enhanced technical capacity
Da tabase of na tional experts; Awareness-raising campaign
2) Sustainable inventory team
“Country-so lution” manual ; Review mechanism
1) Strengthened national arrangements
Good experiences in other regions
175 174

7
Regionally-significant source/sink categories in Asia
Methodology:1. Nation-by-Nation
key category analysis nation-by-nation (level only)identify Top 5 KCs in each countrycount frequency of countries identifying as KC
2. Asia-combined inventorycombine all countries’ inventories into one Asia-combined inventorykey category analysis (level only)
UNDP-GEF Capacity Build ing Project
Influenced by large emitters!
8
Target:Cambodia, China, India, Indonesia, Japan, Korea, Lao PDR,
Mongolia, Philippines, Thailand, Viet Nam (Total 11)
Source:• NC1 with Base Year 1994, if not available, 1990 (8)• NC2 with 2001 (Korea)• ALGAS Report with 1990 (China) • GHG Inventory for 1995 (Japan)
Accessed on Dec. 2004
Regionally-significant source/sink categories in Asia
176 175

9
IPCC Categories GHG Freq. Countries
#1 5.AChanges in Forest andOther Woody BiomassStocks
CO2 9Cambodia, China, Indonesia, Japan,Korea, Lao PDR, Mongolia, Philippines,Viet Nam
#2 1.A.1Fuel Combustion:Energy
CO2 8 China, India, Indonesia, Japan, Korea,Mongolia, Philippines, Thailand
#3 4.C Rice cultivation CH4 7 Cambodia, China, India, Lao PDR,Philippines, Thailand, Viet Nam
#4 5.BForest and GrasslandConversion
CO2 7 Cambodia, Indonesia, Lao PDR, Mongolia,Philippines, Thailand, Viet Nam
#5 1.A.2
Fuel Combustion:Manufacturing IndustriesandConstruction
CO2 6 China, India, Indonesia, Japan, Korea,Thailand
#6 1.A.3Fuel Combustion:Transport
CO2 5 India, Japan, Korea, Philippines, Thailand
#7 4.A Enteric Fermentation CH4 3 Cambodia, India, Mongolia
#8 5.CAbandonment of ManagedLands
CO2 3 Indonesia, Mongolia, Viet Nam
#9 1.A.4
Fuel Combustion:Other Sectors,e.g. Commercial,Residential
CO2 3 China, Japan, Korea
#10 4.D Agricultural Soils N2O 1 Cambodia
#11 5.DCO2 Emissions andRemovals from Soil
CO2 1 Viet Nam
Regionally-significant source/sink categories in Asia
Perhaps, potential priority areas in
Asia
10
Regionally-significant source/sink categories in AsiaComparison to those in Europe/CIS region…
Asia Europe/CIS
IPCC Categories GHG Freq.(of 11)
IPCC Categorieswithout LULUCF
GHG Freq.(of 12)
#1 5.AChanges in Forestand Other WoodyBiomass Stocks
CO2 9 6.ASoild Waste Disposalon Land
CH4 7
#2 1.A.1Fuel Combustion:Energy
CO2 8 1.B.2Fugitive Emissionsfrom Fuels:Oil and Natural Gas
CH4 7
#3 4.C Rice cultivation CH4 7 4.A Enteric Fermentation CH4 6
#4 5.BForest andGrasslandConversion
CO2 7 1.A.3.bFuel Conbustion:Transport - RoadTranportation
CO2 6
#5 1.A.2
Fuel Combustion:ManufacturingIndustries andConstruction
CO2 6 4.D Agricultural Soils N2O 5
#6 1.A.3Fuel Combustion:Transport
CO2 5 1.A.1Fuel Combustion:Energy
CO2 3
#7 4.A Enteric Fermentation CH4 3 1.B.1Fugitive Emissionsfrom Soild Fuels
CH4 3
#8 5.CAbandonment ofManaged Lands
CO2 3 4.B Manure Management N2O 2
#9 1.A.4
Fuel Combustion:Other Sectors,e.g. Commercial,Residential
CO2 3 1.A.2
Fuel Combustion:ManufacturingIndustries andConstruction
CO2 2
Not including LULUCFUnique
to Asia!
177 176

11
IPCC Categories GHG Freq. CountriesNo. ofreports
Impacts (%)
#1 5.AChanges in Forest andOther Woody BiomassStocks
CO2 9Cambodia, China, Indonesia, Japan,Korea, Lao PDR, Mongolia, Philippines,Viet Nam
11 12.2
#2 1.A.1Fuel Combustion:Energy
CO2 8 China, India, Indonesia, Japan, Korea,Mongolia, Philippines, Thailand 11 18.9
#3 4.C Rice cultivation CH4 7Cambodia, China, India, Lao PDR,Philippines, Thailand, Viet Nam 10 5.6
#4 5.BForest and GrasslandConversion
CO2 7Cambodia, Indonesia, Lao PDR, Mongolia,Philippines, Thailand, Viet Nam 11 8.7
#5 1.A.2
Fuel Combustion:Manufacturing IndustriesandConstruction
CO2 6China, India, Indonesia, Japan, Korea,Thailand 10 19.0
#6 1.A.3Fuel Combustion:Transport
CO2 5 India, Japan, Korea, Philippines, Thailand 10 7.5
#7 4.A Enteric Fermentation CH4 3 Cambodia, India, Mongolia 11 4.1
#8 5.CAbandonment of ManagedLands
CO2 3 Indonesia, Mongolia, Viet Nam 5 0.4
#9 1.A.4
Fuel Combustion:Other Sectors,e.g. Commercial,Residential
CO2 3 China, Japan, Korea 10 8.7
#10 4.D Agricultural Soils N2O 1 Cambodia 9 1.3
#11 5.DCO2 Emissions andRemovals from Soil
CO2 1 Viet Nam 4 0.0
Regionally-significant source/sink categories in Asia Impacts on
region
Total45.4%
Potential regionally-significan t
areas
N umber of countries reporting
More reports can be
generated?
12
SummaryOverall:Our existing network has excellent potential
to evolve into more concrete project status that can effectively contribute to an improved inventory
More precisely, my suggestion is:
To improve accuracy of EFs and AD of regionally-significant categories since regional characteristics in key categories are identified
To encourage information transfer in certain categories with insufficient reports by countries
Any other suggestions??
178 177

13
Thank you very much!
14
Regionally-significant source/sink categories in Asia
Comparison to those in the world…
◎: First
○: Second
△: Third
most significant
KCs
Source: CO2 Emissions from Fuel Combustion 2004 Edition (IEA, 2004)
IPCC Category GHG Brazil EUFormerUSSR
USA World
Energy Fuel Combustion CO2 ○ ◎ ◎ ◎ ◎Fugitive CO2
CH4 ○ ○N2O
Industrial Processes CO2N2OHFCPFCSF6
Agriculture CH4 △ △ △ △N2O ○ △ ○
Waste CH4Other CO2 ◎
CH4N2O
Not including LULUCF
IPCC Categories GHG Freq.
#1 5.AChanges in Forestand Other WoodyBiomass Stocks
CO2 9
#2 1.A.1Fuel Combustion:Energy
CO2 8
#3 4.C Rice cultivation CH4 7
#4 5.BForest and GrasslandConversion
CO2 7
179 178

15
Regionally-significant source/sink categories in Asia
KC analysis results of Asia-combined inventoryLevel Assessment Result
IPCCCategories
GHGNo. ofreports
Non-LULUCF
(Gg CO2eq.)
LULUCF(Gg CO2eq.)
AbsoluteValue
(Gg CO2eq.)
WithoutLULUCF
CumulativeTotal
WithoutLULUCF
WithLULUCF
CumulativeTotalWith
LULUCFSUM 6,664,351 -240,107 8,502,028 1.0000 1.0000
#1 1.A.2 CO2 10 1,618,644 0 1,618,644 0.2429 0.2429 0.1904 0.1904#2 1.A.1 CO2 11 1,606,437 0 1,606,437 0.2410 0.4839 0.1889 0.3793#3 5.A CO2 11 0 -1,038,892 1,038,892 0.0000 0.4839 0.1222 0.5015#4 5.B CO2 11 0 743,372 743,372 0.0000 0.4839 0.0874 0.5890#5 1.A.4 CO2 10 737,839 0 737,839 0.1107 0.5946 0.0868 0.6757#6 1.A.3 CO2 10 640,530 0 640,530 0.0961 0.6908 0.0753 0.7511#7 4.C CH4 10 479,436 0 479,436 0.0719 0.7627 0.0564 0.8075#8 4.A CH4 11 346,245 0 346,245 0.0520 0.8147 0.0407 0.8482#9 2.A CO2 9 225,925 0 225,925 0.0339 0.8486 0.0266 0.8748#10 1.B.1 CH4 10 202,258 0 202,258 0.0303 0.8789 0.0238 0.8986#11 1.A.4 CH4 11 109,866 0 109,866 0.0165 0.8954 0.0129 0.9115#12 4.D N2O 9 109,827 0 109,827 0.0165 0.9119 0.0129 0.9244#13 1.A.1 N2O 8 74,024 0 74,024 0.0111 0.9230 0.0087 0.9331#14 2.C CO2 8 66,851 0 66,851 0.0100 0.9330 0.0079 0.9410#15 1.B.2 CH4 8 64,780 0 64,780 0.0097 0.9427 0.0076 0.9486#16 4.B CH4 11 62,292 0 62,292 0.0093 0.9521 0.0073 0.9559
6.A CH4 11 59,950 0 59,950 0.0090 0.9611 0.0071 0.96305.C CO2 5 0 35,168 35,168 0.0000 0.9611 0.0041 0.9671
1.A.5 CO2 3 33,450 0 33,450 0.0050 0.9661 0.0039 0.97104.B N2O 2 30,721 0 30,721 0.0046 0.9707 0.0036 0.97474.G N2O 5 27,900 0 27,900 0.0042 0.9749 0.0033 0.97796.C CO2 8 26,383 0 26,383 0.0040 0.9788 0.0031 0.98102.B CO2 3 19,101 0 19,101 0.0029 0.9817 0.0022 0.9833
Asia-Comboined
16
Regionally-significant source/sink categories in Asia
Nation-by-Nation & Asia-combined inventoryIPCC Categories GHG Freq. Countries Combined
No. ofreports
#1 5.AChanges in Forest andOther Woody BiomassStocks
CO2 9Cambodia, China, Indonesia, Japan,Korea, Lao PDR, Mongolia, Philippines,Viet Nam
#3 11
#2 1.A.1Fuel Combustion:Energy
CO2 8 China, India, Indonesia, Japan, Korea,Mongolia, Philippines, Thailand #2 11
#3 4.C Rice cultivation CH4 7 Cambodia, China, India, Lao PDR,Philippines, Thailand, Viet Nam #7 10
#4 5.BForest and GrasslandConversion
CO2 7 Cambodia, Indonesia, Lao PDR, Mongolia,Philippines, Thailand, Viet Nam #4 11
#5 1.A.2
Fuel Combustion:Manufacturing IndustriesandConstruction
CO2 6 China, India, Indonesia, Japan, Korea,Thailand #1 10
#6 1.A.3Fuel Combustion:Transport
CO2 5 India, Japan, Korea, Philippines, Thailand #6 10
#7 4.A Enteric Fermentation CH4 3 Cambodia, India, Mongolia #8 11
#8 5.CAbandonment of ManagedLands
CO2 3 Indonesia, Mongolia, Viet Nam - 5
#9 1.A.4
Fuel Combustion:Other Sectors,e.g. Commercial,Residential
CO2 3 China, Japan, Korea #5 10
#10 4.D Agricultural Soils N2O 1 Cambodia #12 9
#11 5.DCO2 Emissions andRemovals from Soil
CO2 1 Viet Nam - 4
180 179

ii) Other documents
181 180

Emission Factor Database Emission Factor Database (EFDB)(EFDB)
Fe bruary 2005
Authore d by
Ki yoto Tanabe, Tec hnical Support UnitIP CC National Gree nhouse Gas Inve ntories Programme
Why is the EFDB needed?Why is the EFDB needed?Desirably, emission factors that reflect national circumstances should be used in inventory compilation. However, development of such emission factors is difficult - it is costly, time consuming, requires much expertise.
EF for N2O from utility boilers?
EF for CH4 from rice cu ltivation?
EF for CH4 from industrial wastewater?
EF for CO2 from metal p roduction?
182 181

Using similar reducing agent in metal p roduction
EF for CO2 from metal p roduction?
Why is the EFDB needed?Why is the EFDB needed?By sharing data/information, emission factors that take into account local conditions (national circumstances) can be obtained cost-effectively.
EF for CH4 from rice cu ltivation?
EF for N2O from utility boilers?
EF for CH4 from industrial wastewater?
EF for CO2 from metal production
EF for CH4 from rice cu ltivation?
EF for N2O from utility boilers?
EF for CH4 from industrial wastewater?
EF for CH4 from rice cu ltivation?
EF for CH4 from industrial wastewater?
Similar p ractices and similar climate
EF for CO2 from metal production
EF for N2O from utility boilers?
EF for CH4 from industrial wastewater?EF for CH4 from
rice cultivation
EF for CO2 from metal production
EF for CH4 from industrial wastewater?EF for CH4 from
rice cultivation
EF for CO2 from utility boile rs
EF for CO2 from metal production
EF for CH4 from rice cultivation
EF for CO2 from utility boile rs
EF for CH4from industrial wastewate r
Why is the EFDB needed?Why is the EFDB needed?An easily accessible database on emission factors and other relevant parameters will facilitate sharing data/information by inventory compilers, experts, scientists worldwide.
Emission Factor Emiss ion Factor Database (EFDB) Database (EFDB)
183 182

EFDB is expected to serve as...EFDB is expected to serve as...LibraryLibrary of well documented emission factors and other parameters which
Evolves dynamically through contributions of new data from researchers, scientists, industry...Provides a wide variety of emission factors and other parameters with background documentation or technical references so that users can select and use appropriate data on their own responsibility.
Communication platformCommunication platform for distribution and commenting on new research and measurement data
Data contained in EFDBData contained in EFDBAt present, EFDB contains only the IPCC default data and the data from CORINAIR94.New data are expected to be provided by the global scientific and inventory society.New data will be evaluated for acceptance by EFDB Editorial Board according to the following criteria.
EFDB should assist countries in producing inventories that are neither over- nor underestimates so far as can be judged and in which uncertainties are reduced as far as practicable.To this end, the data to be included should be…
184 183

Criteria for Inclusion of New DataCriteria for Inclusion of New DataRobustRobust
Within the accepted uncertainty, the value is unlikely to change if there was repetition of the original measurement programme or modelling activity.
ApplicableApplicableAn emission factor can only be applicable if the source and its mix of technology, operating and environmental conditions and abatement and control technologies under which the emission factor was measured or modeled are clear and allow the user to see how it can be applied.
DocumentedDocumentedAccess information to the original technical reference must be provided to evaluate the robustness and applicability as described above.
“Properties”
How to Access the EFDBHow to Access the EFDBTwo different applications are available.
Web applicationWeb applicationFor all users to carry out on-line searchFor data providers to submit new emission factors or other parameters
CDROM applicationCDROM applicationFor all users, in particular for those who have difficulty with Internet connection, to carry out off-line search
The web application is the core of this system. New data will be made available in the Web application first.
185 184

Http://www.ipcc-nggip.iges.or.jp/EFDB/main.php
EFDB Web applicationEFDB Web application
EFDB Local CDROM applicationEFDB Local CDROM application
Can be operated locally (on a stand-alone PC).For detailed guidance, seethe User Guide for Local User Guide for Local CDROM applicationCDROM application. For supplementary information, see also:
Appendices A-D of the User Manual for Web applicationAnnex to the User Manual for Web application
186 185

EFDB Local CDROM applicationEFDB Local CDROM application
EFDB Local CDROM application works with MS Access MDB file, which contains the copy of the on-line web database.
The latest MDB file will be made availableThrough the Internet: At the "Downloads" section of the web application; and/orIn the form of CD-ROM: Will be distributed annually or biannually, possibly on the occasion of sessions of SBSTA or COP.
Success – depending on input from the global scientific and inventory society
EFDB is open to any relevant data proposals.If you have your own data on emission factors, please contact the Technical Support Unit (TSU) by e-mail <ipccipcc--efdbefdb@@igesiges.or..or.jpjp>.
Continuous improvement on the content and functionality – Users’ feedback will be quite important
Your involvement is highly appreciated!!
187 186

The 2nd Workshop on GHG Inventories in AsiaThe 2nd Workshop on GHG Inventories in Asia
77--8 February 20058 February 2005ShanghaiShanghai
MongoliaMongolia’’s GHG inventory:ST s GHG inventory:ST and LT strategyand LT strategy
Batima P. Institute of M eteorology and Hydrologyweb: www.mongolclimate.mnE-mail: mcco@magicn et.mn
Identify sources of available data fro m prior and ongoing international and regional projects
• Mongolia prepared its first greenhouse gases (GHG) inventory in 1996 for the base year 1990 under the US Country Studies Programme
• Updated within the Asia Least-Cost Greenhouse Gas Abatement Strategy (ALGAS),
• As part of the enabling activities of preparation of the Initial National Communication (GEF/UNEP), the GHG inventories were updated to 1998 with base year 1994.
188 187

Problems and Gaps
Information• No standard data for inventory• No system in collection and checking • No Institutional framework
Methodologies and tools • No country specific emission factor
Mongolia participate in the project Capacity Building for Improving the Quality of GHG Inventories Europe /CIS Region
What should do…
189 188

What should do…
• Improve reliability of activity data• Increase number of NE and Train
NE• Archive and document • Improve GHG inventory procedure• Improve the EFs• Establish NDB for GHG inventory
STS:Experts involved
• National Agency for Meteorology, Hydrology and Environment Monitoring
• Institute of Meteorology and Hydrology• Mongolian State Univers ity• Energy Conservation Co.Ltd• Ulaanbaatar City Governor's Office• Expert for EF
190 189

Improve reliability of activity data
• AD assessment• EF assessment• Methodology assessment
No SectorActivity data necessary for GHG inventory Data source Bariers to find activity data How to overcome the barier
5 WasteLandfills Urban population Statistical year bookDomestic wastewater Urban population Statistical year book
Commercial and industrial wastewater Annual wastewater
Annual Water usage Report of Water management Institute
This annual report is not avialable from libruary.
There are necessary official documantion to include in Annual report on environmental issues of Ministry of nature and Environment.
Data and EF assessment
191 190

Sectors
• Mobile sources • Waste. Urban solid waste, WW
Identify prior and ongoing national sources of existing data
• Annual statistical book• only general activity data, such as
– fuel consumption, – cement production, – livestock population, – area of cultivated land
192 191

STS:Prepare data flow chart Solid waste
AD flow
Darhan
7 districts
Ulaanbaatar Erdenet
Amount Contents
Data
Aimag centre
NSO
NAMHEM
MNE
Laboratory
IPCC
EF
AD flow
imported Liquid Fuel
Data
CO
Sale
Data
TO
Jet Kerosene
travel
Data
MIAT
Diesel oil
Travel
Data
RTA
Diedel oil
Travel
Data
RA
NSO
NAMHEM
MNE
Laboratory
IPCC
EF
STS:Prepare data flow chart Mobile
193 192

Methodologies
• IPCC GPG• IPCC default EF• Country Specific EF
SRS:Archiving existing data and information
Preparedall available informationWorld versionExcel versionDesign of documentation
194 193

LTS: Improve GHG inventory procedure
Develop NM for GHG Inventory– Drafting– Approval
Outline of NM for GHG inventory
• Introduction• Legal framework• Institutional framework• Data collection• Methodology • EF• Completeness• Documentation• Reporting• Annex
195 194

Long-term strategy
Establish legal framework– Data collection– Archiving and documentation – Preparation of GHG inventory– Information access (re lated to GHG issue)– Agreement/memorandum
Establish institutional framework– Institutions: national/sectoral– Compiling/Reporting– Person/staff – QA and QC – Review
LTS
Establish electronic data base– Access or SQL
Implementation– Annual inventory
196 195

197 196

INDONESIA:Climate Change Activities
M. NatsirMinistry of Environment
The Second Workshop on Inventories in Asia RegionShanghai, China
7-8 February 2005
Outline
Climate Change Activities in IndonesiaRatification of Kyoto ProtocolIndonesian DNA
Update on processStructure and working mechanismSustainable Development (SD) criteria
CDM projects in IndonesiaCDM Indonesia Information DeskPreparation of National Communication
198 197

Climate Change Activities in Indonesia
1990IPCC Report on Climate Change
2000 08 - 12
First Commitment
Period
94
UNFCCCEnters into
force
97(COP-3)
KP
CDM Projectsmay start
CDM Implementation
National Committee on Climate & Environment
03
National Committee on Climate Change
04
KP enters into force
Ratification of UNFCCC
(Act no. 6/1994)
SigningKP
AIJ (1996-2000)
(COP-5)
First National Communication
95(COP-1)
IndonesiaCountry Study
99
ALGAS (1996-1998)
96 0201
NSS on Energy
NSS onForestry
21001850
354 354 ppmppm290 290 ppmppm
367 367 ppmppm
478478--1099 1099 ppmppm
‘Business as Usual’
Global Target: 5,2% below
emission level on 1990
‘Kyoto Scenario’
? ? ppmppm
Ratification of Kyoto Protocol (Act no. 17/2004)
05
Est. of Indonesian DNA
GHGs concentration
ACTIVITIES ON CLIMATE CHANGE (1)
NSS on Energy Sector, 2001NSS on Forestry Sector, 2003Bilateral cooperation with:
GTZ to establish Indonesian DNAThe Nether lands to form National Committee on Climate Change & awareness bui lding to all stakeholder
Developing Regional and National Capacity regarding climate change mitigation
199 198

ACTIVITIES ON CLIMATE CHANGE (2)
Establishment of National Committee on Clim ate Change by MOE Decree No. 53 of 2003Ratific ation of Kyoto Protocol through the Act no. 17/2004Developm ent of Regional and National Capacity in climate change mitigation by:
Greenhouse Gas Emission Reduction from Industry in Asia & the Pacific (GERIAP)-UNEP (SIDA July 2002 – Dec 2005)Project of Global Warming Prevention – JICA Need Survey 2003Integrated Capacity Strengthening for the CDM (ICS - CDM ) MOE Japan (Oct 2003 - 2004)CTI Industry Join Seminar on Technology Division in ASEAN and the Paci fic Region (Jan 2003, NE DO Japan)Feasibility Study on Lodoyo Hy dro Electric Power Plant Expansion – East Java (Japan 2003)
GERIAP PROJECTS IN INDONESIA
The project runs from July 2002 until December 2005 and includes the following steps :
Capacity building through training NFPs on Cleaner Production/ Energy efficiencyPrac tical demonstration of energy efficiency resulting in four sector specific manualsReview of national policies and other fac tors that affect industry’s abili ty to manage energy and climate changeReporting and dissemination of project outputs
200 199

GERIAP PROJECTS IN INDONESIA
Companies Commitment6 companies commited to GERIAP as fo llowed:1. Cement industry :PT. SEMEN C IB INONG, PT SEMEN PADANG, PT INDOCEMENT2. Steel Industry :PT KRAKATAU STEEL3. Fertilizer :PT PUPUK KUJANG4. Pulp and Paper Industry :PT P INDO DELI PULP AND PAPER
Indonesian DNA Development (1)
The process has been initiated in April 2003.The Ministry of Environment with support from GTZ and assisted by Pelangi, conducts this processConsultations have been conducted:
Multi-stakeholders consultation: 1 Steering Committee meetingInterdepartmental consultation: 2 technical committee meetingsConsultation with departments
201 200

Indonesian DNA Development (2)
DNA is expected to be finalized and operated on October 2004Main principles: efficient, rigorous, easy access, low cost, accountable and transparentMulti stakeholder consultation process continuous
Basic functions of DNA
Stating that the country’s participation in a CDM project activity is voluntaryStating that the project activity assists the country in achieving sustainable developmentStating that the project have fulfilling related national environmental regulation such as environmental impact assessmentStating that stakeholders’ comment have been taken into account
202 201

Proposed structured of DNA
National Committee on Climate Change
Indonesian DNA
Secretariat
Technical Team
Roster of Expert
StakeholderForum
CDM projects in Indonesia (1)
ENERGY SECTORThe National Strategy Study (NSS) has developed a strategy for energy sector as followed:
• The technical potential for and cost of GHG em ission reduction projects• using both top-down and bottom -up approach• International m arket scenarios , including the s ize of CDM m arket and
the• factors that will affect Indones ia’s share• The international and national ins titutional setting for the CDM.• Lesson learned from pilot emiss ion reduction projects in Indones ia.• A range of potential CDM projects that could be im plem ented relatively• quickly
203 202

CDM projects in Indonesia (2)
Since 1996, Indonesia has active ly supported the Activities Implement Jointly (A IJ) mechanism.The energy component financed by GTZ and coordinated by the State Ministry for the Environment, which was completed in la te 2001.Based on NSS potential energy sector volume is 125 – 300 MT CO2 for the year 2008-2012Project WayangWindu Unit 2 has been accepted by CERUPT and around 20 pro jects are looking for potential buyers and preparing the PDDs
CDM projects in Indonesia…(3)Potential Project in Energy Sector based on NSS:Renewable Energy/ Electricity Supply
Saru lla Geother mal Field in North SumateraSatar Messe, Manggara i, Flores, East Nusa TenggaraPLN Yapen Se latan, Jayapura, Ir ian JayaPLN East Nusa Tenggar a and West Nusa TenggaraPLN Su law esi
Energy Efficienc ySura laya Pow er Generat ion Plant
Waste Management / Fuel SwitchPT. Fa jar SuryaWisesa, Bekasi, West JavaPonorogo , East JavaTorgamba Palm Oil Plantat ion, North SumateraPangkalanbrandan, North Sumatera
Energy ConservationTBA, Centr al Java
204 203

CDM projects in Indonesia…(4)FORESTRY SECTOR
Potential volum e in forestry sectors : 3,020 M T CO2eThe NSS attem pts to explore issues and challenges in sink or land-use, landuse change and forestry (LULUCF) sectors.The current LULUCF component, is funded by AusAID, which will be deal wit h the implem entation of the CDMTotal CDM bolume is 36 Mt Co2 per year which provide 6% of market share 32.5 Mha land os potential in the forest carbon projectsThe allocation of the area for the forest carbon projects were Regreening (3.2 Mha), Agroforestry (12.7 M ha), Community forestry (9.8 Mha), Forest Plantation known as HTI (1.9 Mha), Reforestration known as Reboisasi (4.9 Mha)
CDM Indonesia Information Desk
Will be designed as an information deskRequirements for CDM projects in Indonesia, i.e. national SD, priorities and other documents will be posted on the websiteApplication for DNA approval on potential projects can be done onlinePotential projects will be listed on the websitePotential buyers will be listed on the websiteOperational Entities will be listed on the website
205 204

Preparation of Indonesia’s 2nd National Communication (1)
Development of the 2nd Natcom proposal facilitated by the GEF through Climate Change Enabling Activity (Self-assessment exercise)Objectives: identify and fill in the gaps between the activities carried out under the First National Communication (FNC) and the current status of climate change related activities in Indonesia
Preparation of Indonesia’s 2nd National Communication (2)
Activities undertaken on self-assessment exercise:
Stakeholder consultationData gathering (through stocktaking exercise)2nd Natcom projec t proposal preparationWorkshop on draf t of proposalFinalization and submission of 2nd Natcomproposal
206 205

THANK YOU …
M. NatsirMinistry of EnironmentRepublic of Indonesia
[email protected]@menlh.go.id
207 206

iii) Appendix
208 207

Appendix
National Communications to the UNFCCC of Countries that Participated in the 1st and/or 2nd
Workshop on GHG Inventories in Asia Region (WGIA) (Data as of 18 Feb 2005)
Initial National
Communications Second National Communications
Third National Communications
Download Most Recent
Version 1. Cambodia 08/10/02 Cambodia
(1,179 kB) 2. China 10/12/04 China
(Exec. Summary)
3. India 22/06/04 India (5,892 kB)
4. Indonesia 27/10/99 Indonesia (1,167 kB)
5. Japan 20/09/94 02/12/97 31/05/02 Japan (14,178 kB)
6. Lao P.D.R. 02/11/00 Lao P.D.R (10,466 kB)
7. Mongolia 01/11/01 Mongolia (2,367 kB)
8. Philippines 19/05/00 Philippines (2,147 kB)
9. Korea (ROK)
12/02/98 01/12/03 Korea (4,265 kB)
10. Thailand 13/11/00 Thailand (5,525 kB)
11. Viet Nam 02/12/03 Viet Nam (1,007 kB)
Notes: 1. Dates are in the form DD/MM/YY. 2. Source: Website of the UN Framework Convention on Climate Change (http://unfccc.int/national_reports/non-annex_i_natcom/items/2979.phpandand http://unfccc.int/national_reports/items/1408.php) .
208

Greenhouse Gas Inventory Office of JapanCenter for Global Environmental Research, National Institute for Environmental Studies (NIES) 16-2, Onogawa, Tsukuba, Ibaraki, Japan 305-8506 Phone: 81-29-850-2169, Fax:81-29-858 http://www-gio.nies.go.jp
Printed on recycled paper