Embed Size (px)
Citation preview

WorkSafe Victoria
Scheme Update
Tehn Chin & Julie Evans
13 November 2017

Contents
• where we are today
• changing environment
• where we are going: Strategy 2030

WHERE WE ARE TODAY

SafetyStrong positive result
ServiceStrong
employer/worker satisfaction
SustainabilityFinancially sound
Culture &
PlaceTransition & uncertainty
Return to
WorkMental health
challenge
End of Financial Year 2016-17

2012 to 2017 Overview
• 22 % reduction in claims per million hours worked –
largest reduction on record
• improved rate of return to work, but target unmet
• increase in mental health injury
• WorkSafe financially sound
• delivery of service – workers and employers satisfied
• 2016/17 the safest year on record

Safety
Our measures:
• Claims per million hours worked (CpMHW)
– our headline measure of safety
– million hours worked in a better measure of
exposure of risk than count of worker
• 4 week claims per million hours worked (4wkCpMHW)
– indication of severity and complexity of the claim

Strong improvement in CpMHW
Moderate improvement
in 4wk CpMHW
2.97
2.0
2.5
3.0
3.5
4.0
Jun-12 Dec-12 Jun-13 Dec-13 Jun-14 Dec-14 Jun-15 Dec-15 Jun-16 Dec-16 Jun-17
4 wk CpMHW
6.43
6.0
6.5
7.0
7.5
8.0
8.5
Jun-12 Dec-12 Jun-13 Dec-13 Jun-14 Dec-14 Jun-15 Dec-15 Jun-16 Dec-16 Jun-17
CpMHW

Safety Challenges
• mental injury
• occupational violence
• claim statistics suggest
more prevalent in some
industries, occupations
eg. healthcare workers

Return to Work
• return to work is part of the worker’s recovery –
employer, agent and treating health practitioner
have critical roles to play
• our measure: % Return to Work
– the percentage of claims with 10 days of time
loss reported in a 12 month period, that are back
at work six months after claim lodgement

% Return to Work
• Impacted by mental
injury claims
– greater mix of
mental injury; and
– return to work rates
reducing for mental
injury claims
Mental Injury 54.5%
Physical Injury 81.8%
All claims 78.5%
30%
40%
50%
60%
70%
80%
90%
30
-Ju
n-1
2
31
-Dec
-12
30
-Ju
n-1
3
31
-Dec
-13
30
-Ju
n-1
4
31
-Dec
-14
30
-Ju
n-1
5
31
-Dec
-15
30
-Ju
n-1
6
31
-Dec
-16
30
-Ju
n-1
7

Sustainability
• scheme is financially sound
– actuarial increase/(release): $169m
– break-even premium: 1.262%
– PFIO: $233m
– funding ratio: 119%
• key challenges:
– increasing mix of mental injuries claims
– more workers remaining on weekly benefits for longer
(physical and mental injuries)

Actuarial release challenges
394
511
78
189 136
182 179
303
(60) (135) (169)-300
-200
-100
0
100
200
300
400
500
600
06/0
7
07/0
8
08/0
9
09/1
0
10/1
1
11/1
2
12/1
3
13/1
4
14/1
5
15/1
6
16/1
7
$m
Historical Actuarial Releasesby Financial Year
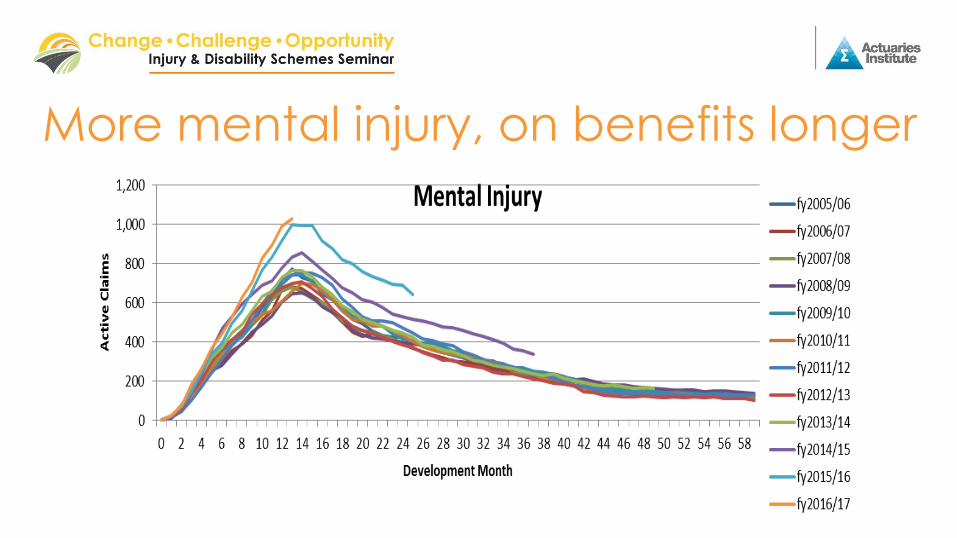
More mental injury, on benefits longer
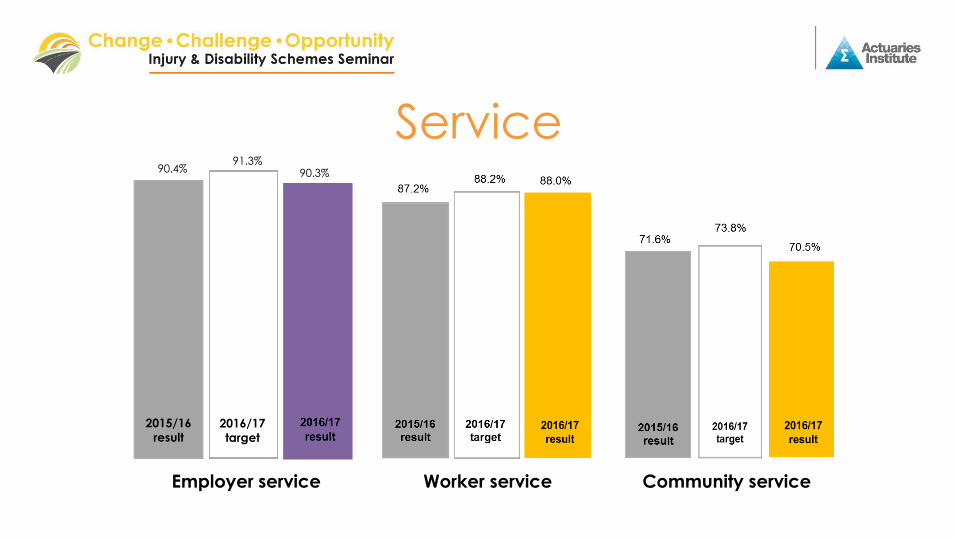
Worker serviceEmployer service Community service
90.4%91.3%
90.3%
2015/16
result2016/17
target
Service
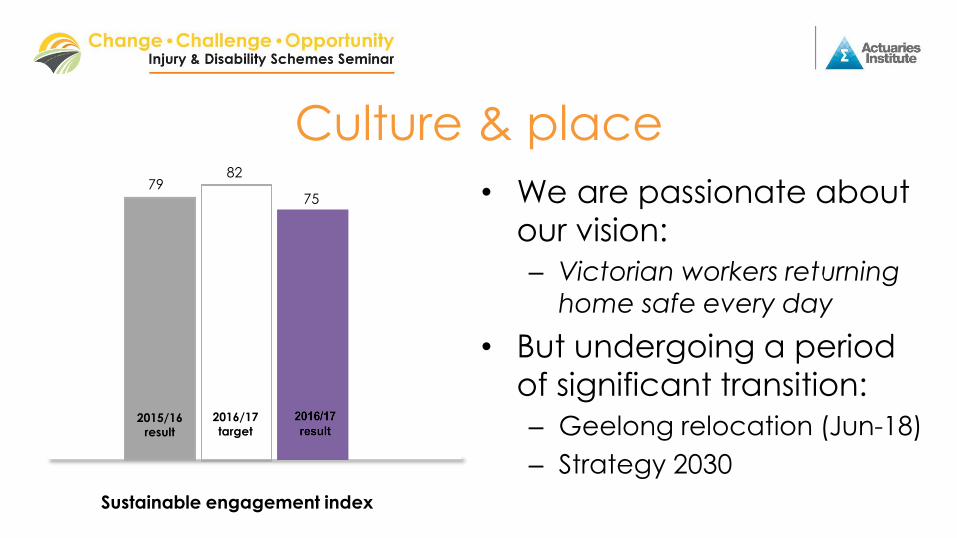
7982
75
Sustainable engagement index
2015/16
result
2016/17
target
Culture & place
• We are passionate about
our vision:
– Victorian workers returning
home safe every day
• But undergoing a period
of significant transition:
– Geelong relocation (Jun-18)
– Strategy 2030

CHANGING ENVIRONMENT

The nature of work is changing
Increasing mobility / work from anywhere
Changing industry mixChanging jobs through automation
Greater exposure to global supply chains
Increasing workforce flexibility
Expanding definition of workplace

Trends & predictions
Service industries
Mental injuries
Older workers
Claims
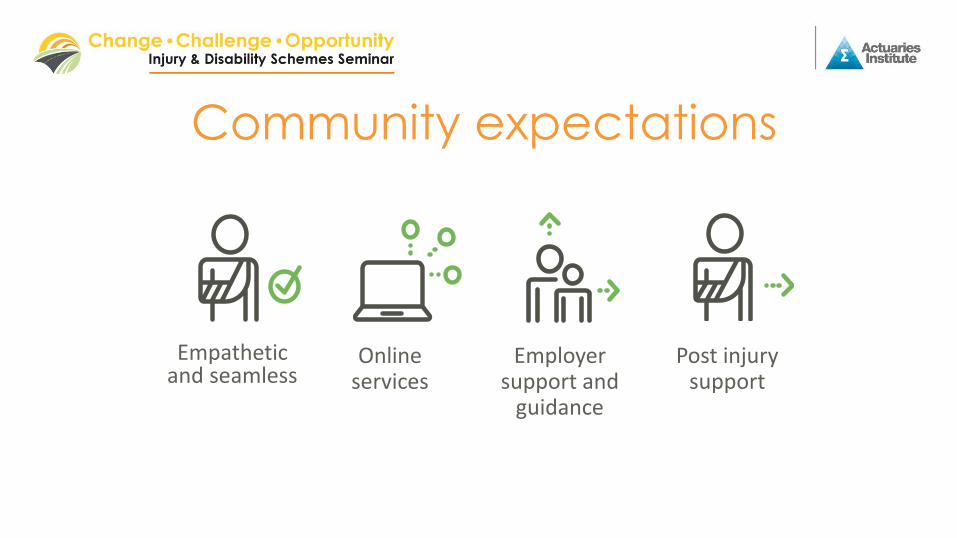
Community expectations
Online services
Employer support and
guidance
Post injury support
Empathetic and seamless

STRATEGY 2030

Strategy 2030
Analytics and data
Prevention-led
Simplifying WorkSafe’s
business
Focused on the needs of workers and employers
Leading the way and
adapting quickly
Offering tailored products,
services and support
Sharing goals & outcomes
with the community

Prevention-led transformation
WorkSafe invests in being more efficient in targeting health and safety risks.
WorkSafe has effectively demonstrated ROI on prevention at employer level.
WorkSafe invests in enabling employers and employees to take greater ownership in preventing injuries.
Workplaces are enabled through tools and education to deliver greater self assessment and RTW outcomes.
WorkSafe invests in changing community views and expectations so that the community takes ownership of prevention.
Communities assist with hazard prevention induction, delivery of RTW outcomes through emotional support and creation of employment opportunities.
WSV-owned prevention
Community-owned prevention
Workplace-owned prevention
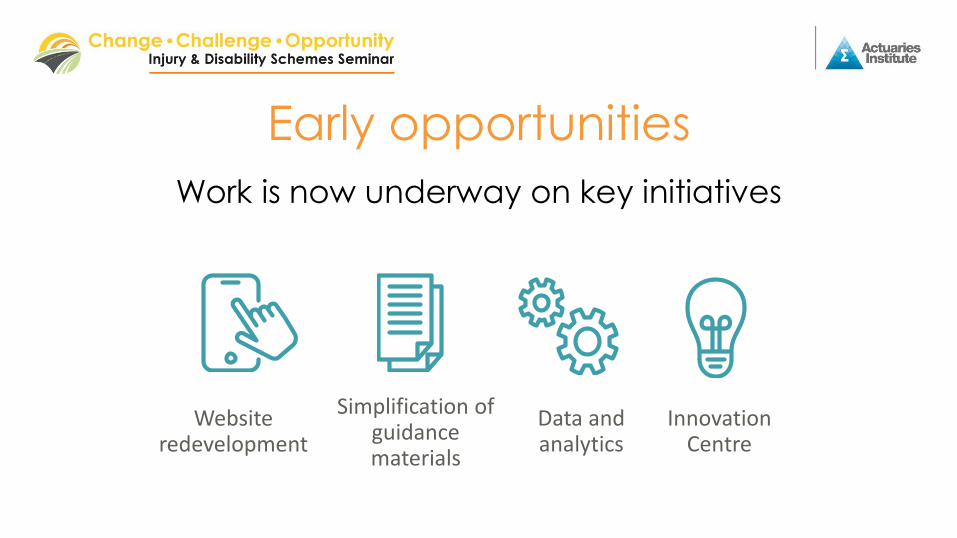
Early opportunities
Work is now underway on key initiatives
Website redevelopment
Simplification of guidance materials
Data and analytics
Innovation Centre

Detailed design
e.g. process mapping
• 140 workshops
• over 3,000 processes mapped
• Develop a picture of WorkSafe at its future best
• Re-think processes in line with S2030

Timeline
Build and delivery of early
opportunities
Establish enabling capabilities
Business and technology
design
Enabling capabilities matured
Initial transformation packages
completed
Ongoing rollout and
completion of transformation
packages
Commencement of final
transformation packages
HORIZON 3 (to mid 2023)HORIZON 1 (to mid 2019) HORIZON 2 (to mid 2021)
ONGOING COMMS & ENGAGEMENT, CAPABILITY & CULTURAL CHANGE MANAGEMENT
THANK YOU – ANY QUESTIONS?