Embed Size (px)
Citation preview
Workplace violence in Queensland, Australia: The results of a comparative study Complete citation: Hegney, Desley and Eley, Robert and Plank, Ashley and Buikstra, Elizabeth and Parker, Victoria (2006) Workplace violence in Queensland, Australia: The results of a comparative study. International Journal of Nursing Practice, 12 (4). pp. 220-231. This is the final manuscript of the paper at http://www.blackwell-synergy.com/doi/abs/10.1111/j.1440-172X.2006.00571.x Authors: Professor Desley Hegney, RN, DNE, BA (Hons), PhD, FRCNA, FCN (NSW), FAIM, Director, Centre for Rural and Remote Area Health, University of Queensland and University of Southern Queensland, Toowoomba, Queensland, Australia Dr. Robert Eley, BSc (Hons), MSc, PhD, CBiol, MIBiol, Senior Research Fellow, Centre for Rural and Remote Area Health, University of Southern Queensland, Toowoomba, Australia. Dr. Ashley Plank, Dip. Teaching, BSc, MSc (Hons), PhD, Senior Lecturer, Department of Mathematics and Computing, University of Southern Queensland, Toowoomba, Australia Dr. Elizabeth Buikstra, BSc (Hons), PhD, Research Fellow, Centre for Rural and Remote Area Health, University of Southern Queensland, Toowoomba, Queensland, Australia Ms. Victoria Parker, RN, BN, MN, Grad. Dip. Critical Care, Lecturer, Department of Nursing, University of Southern Queensland, Toowoomba, Queensland, Australia. Address for Correspondence: Desley Hegney, Centre for Rural and Remote Area Health, University of Southern Queensland, PO Darling Heights, Queensland, Australia 4350. E-mail: [email protected] ABSTRACT This paper presents the results on workplace violence from a larger study undertaken in 2004. Comparison is made with the results of a similar study undertaken in 2001. The study involved the random sampling of 3000 nurses from the Queensland Nurses’ Union’s membership in the public (acute hospital and community nursing), private (acute hospital and domiciliary nursing) and aged care sectors (both public and private aged care facilities). The self-reported results suggest an increase in workplace violence in all three sectors. Whilst there are differences in the sources of workplace violence across the sectors, the major causes of workplace violence are: clients/patients, visitors/relatives, other nurses, nursing management and
medical practitioners. Associations were also found between workplace violence and gender, the designation of the nurse, hours of employment, the age of the nurse, morale and perceptions of workplace safety. Whilst the majority of nurses reported that policies were in place for the management of workplace violence, these policies were not always adequate. Key words: violence, workplace, nurses, morale, safety
INTRODUCTION
In 2001 the University of Southern Queensland, in conjunction with the Queensland Nurses’ Union (QNU), undertook a study of members of the QNU. The participants were registered nurses (RNs), enrolled nurses (ENs) and assistants-in-nursing (AINs). In Queensland, registered nurses’ and enrolled nurses’ work is controlled by the regulating authority – the Queensland Nursing Council. ENs, must work under the direct or indirect supervision of a registered nurse. AINs (also known as carers, personal assistants) are unregulated care providers. While the Queensland Nursing Council has no regulatory influence over AINs, their work is directly or indirectly supervised by RNs. The study sampling was confined to RNs, ENs and AINs employed in the public sector (State Government funded acute hospitals, community/domiciliary nursing), the private sector (non-government funded acute hospitals, community/domiciliary nursing) and the aged care sector (State Government and privately funded facilities). Workplace violence takes many forms such as aggression, harassment, bullying, intimidation and assault. Inconsistencies in definitions and varied terminologies make comparison difficult. This paper uses the same definition of workplace violence outlined in a previous paper by the authors (Hegney, Plank et al. 2003b). Workplace violence against nurses is reported to be high (Carter 2000) and increasing (Erickson and Williams-Evans 2000). Nurses were demonstrated in one study to be at four times higher risk of assault than the general workforce (Home Office Directorate 1999). Data from Australia are consistent with those from other countries demonstrating that workplace violence towards nurses is an international problem (Farrell 1999; O'Connell, Young et al. 2000; Jackson, Clare et al. 2002; Hegney, Plank et al. 2003b; Day 2005). It is generally accepted that there may be a direct link between episodes of violence and aggression towards nurses and sick leave, burnout and poor recruitment and retention rates (Jackson, Clare et al. 2002; Wells and Bowers 2002) (Gerberich, T R Church et al. 2004). Nurses subjected to physical and verbal attacks have stated that it made them miss work (Nabb 2000) or want to leave (Sofield and Salmond 2003). In the former study, one senior nurse stated ‘two of my staff nurses have left their jobs and another staff nurse has requested a permanent night post because she won’t have to deal with visitors and their families’ (Nabb 2000). Unfortunately there is a paucity of studies providing reliable numbers on retention and turnover due to workplace aggression, although a study in South Australia reported that 19.6% of resignations were as a result of workplace bullying (Working Women’s Centre SA Inc 1997). Furthermore a recent study has linked workplace violence to levels of personal morale, and subsequently retention (Day 2005)
In the UK, Wells and Bower (2002) undertook a systematic literature review on workplace violence, which they noted has been attributed to be an adverse factor in recruitment and retention. They concluded that although research findings were limited and data were very difficult to compare, nurses do appear to have a high level of risk compared to the general workforce and other health care professionals. A review of the literature illustrates differences in violence across medical disciplines and sectors. For example, aside from verbal abuse, higher rates of violence may be found in psychiatric units as well as units catering for those with a disability and the aged (Genovese 2003). In a study in the USA it was noted that nurses working in aged care facilities in addition to emergency departments, intensive care and psychiatric units, encountered the highest incidence of violence (Gerberich, T R Church et al. 2004). Similar results were found in a survey of Queensland nurses in 2001 that noted a significant difference in the rate of workplace violence across the aged care (50%), public (47%) and private (29%) sectors (Hegney, Plank et al. 2003b). Studies have shown that the vast majority of occurrences of violence are in departments other than the assumed “front-line” areas of accident and emergency (Wells and Bowers 2002) It has been shown that acts are perpetrated against nurses from a variety of sources, including patients, relatives, management and other nurses, with patients consistently being the highest offenders (O'Connell, Young et al. 2000) (Hegney, Plank et al. 2003b). Bullying and intimidation has been reported as the most common form of violence from other nurses and higher ranked staff members on nurses (Jackson et al, 2002) (O'Connell, Young et al. 2000) Differences in definition and perception of what constitutes violence, the source of data and methodology employed make comparison of incidence difficult and wide variations occur in the literature. Incidences against the nursing workforce exceeding 50% and 90% for physical attacks and verbal abuse in any one year have been reported in Australia (Jackson, Clare et al. 2002) (O'Connell, Young et al. 2000). At the other end of the scale Wells and Bower estimated that at least 9.5 % of general nurses working in general hospitals in the UK are the subject of violence in any one year (Wells and Bowers 2002). In perhaps the largest recent study of 217,000 NHS staff by the independent Healthcare Commission in England, physical abuse in the past 12 months by patients, relatives, managers and colleagues was 12%, 3%, 0% and 1% respectively. Bullying and harassment over the same period was 22%, 17%, 7% and 10%. In total, 15% of staff had been physically abused and 37% verbally abused (Healthcare Commission 2005) Any violent acts against nurses are unacceptable. So much so that concern about the levels and consequences of workplace violence have resulted in zero tolerance positions taken by organisations and indeed governments. In the UK the Government adopted a position in 1999 whereby all health trusts were directed to reduce their incidents of violence by 30% over a three-year period. In Queensland a zero tolerance policy was launched in 2001 by the
Minister for Health and in 2005 the reports of Steering Committee were released (Violence against Nurses Steering Committee 2005). Similar initiatives are taking place in other states, for example, Victoria established a Taskforce on Violence in Nursing in 2004 to define violence, review existing practices and develop strategies. This paper reports on the extent and perpetrators of violence and factors influencing violence against Queensland nurses.
Aim of the study Both the 2001 and 2004 studies aimed to identify the factors impacting upon nursing work and to use the results of the study to inform strategic planning of the Queensland Nurses’ Union (QNU).
METHOD Research design This study involved a descriptive, self-report, postal survey of members of the QNU in October 2004. Sample design The study involved a postal survey of 30,000 financial members of the QNU in October 2004. A stratified random sampling design was employed with a sampling frame restricted to financial members of the QNU. The strata were the three largest employment sectors in Queensland: aged care (non-government and government), public (government acute hospitals and community nursing) and private (non-government acute hospitals and community nursing). To ensure adequate levels of precision in estimating key measures, 1000 nurses from each of the three sectors were invited to participate. Of the 3,000 participants invited to participate in the 2004 study, 1349 responded representing an overall response rate of 45%. Response rates varied among the sectors (aged care 42%, public sector 45% and private sector 48%). Of the 1342 who provided information that allowed their allocation to a sector, 1306 were in paid employment in nursing in Queensland at the time of the study. The respondents were comprised of 172 AINs, 157 ENs and 913 RNs. Survey Instrument The 2004 survey instrument was based on the survey used in 2001 (Hegney, Plank et al. 2003b). Only minor changes were incorporated, since the instrument had been validated in 2001 and a comparison of changes in responses between 2001 and 2004 was of particular interest. Piloting of the instrument was unwarranted because the data collection process was unchanged from that used for the 2001 study. Items modified or added to the 2001 questionnaire procedure, however, were pre-tested by independent experts.
Procedure The survey packages containing the questionnaire, plain language statement, covering letter and reply-paid envelope were posted to participants by the QNU in early October 2004. Two weeks after the initial mail-out a reminder package was sent to non-respondents. All surveys were coded and the research team were not able to link the codes to individual members of the QNU. Similarly, the QNU was only provided with de-identified data. The only change from the procedure in 2001 was that the questionnaires were designed using the software program Verity Teleform Version 9. Data Analysis Quantitative data were analysed within and across the three sectors using descriptive and inferential statistical tools as appropriate to the scale of measurement involved. Also, the 2001 and 2004 results were compared within each sector. In order to contain the false positive error rate, only inferences supported at the one percent level of significance were reported except where more than one sector exhibits a similar trend or where there is prior expectation of an effect. In these cases, a five percent level of significance has been invoked. It should be noted that because of the number of nurses in each of the sectors in the QNU database are not proportional to the number of respondents in each sector, measure averaged over the three sectors must be weighted to be valid. The appropriate weights for the 2004 data are: 17.8%, 65.8% and 16.4% respectively for the aged care, public and private sectors. Limitations of the study To assess the possibility of non-response bias, checks where made against the QNU database in each sector regarding the distributions of gender, age and job designation. No significant difference exists between the gender distribution of the respondents and the gender distribution of the QNU database within each sector. Similarly, there were no significant differences in the distribution of job designation when compared to the database within each sector. Concerns exist, however, regarding bias in the age distribution of respondents in the survey compared to the QNU database. In the aged-care sector, 30 to 40 year olds appear under-represented, and 50 and above over-represented. In the public sector, under 30s appear under-represented, and 40 and above over-represented. In the private sector, under 40s appear under-represented, and 40 and above over-represented. However, this issue is clouded by the QNU database being incomplete – the ages of about 20% of members are unknown. Some evidence of bias exists in the age of respondents in relation to the order of receipt of the questionnaires. In particular, in the aged care and private sectors, on average, surveys from younger respondents, and hence less experienced nurses, were received earlier than surveys from older respondents. Relatively weak evidence exists of a reverse trend in the public sector. Although the effect is statistically significant the size of the effect is small. The inference from this: that older, more experienced nurses are under-
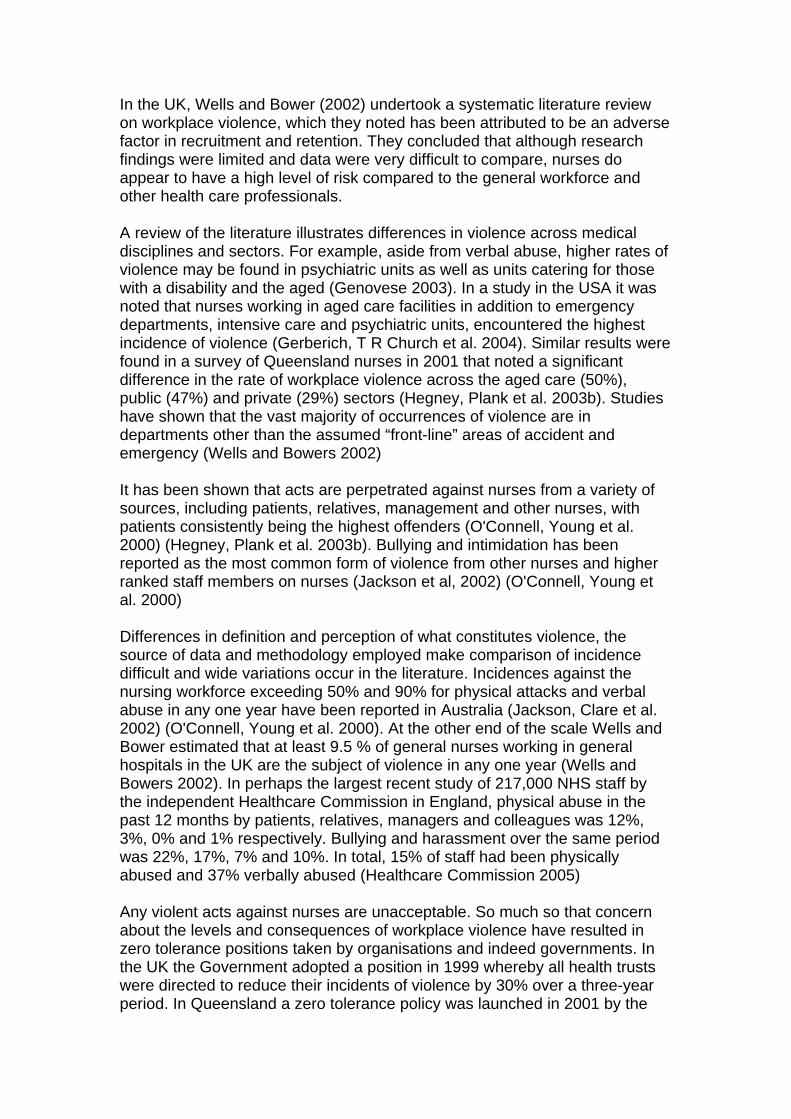
represented in the aged-care and acute-care sectors, is not supported in comparing the overall age distributions of respondents and QNU members. Ethics The study was approved by the Human Research and Ethics Committee of the University of Southern Queensland, Toowoomba, Australia. RESULTS Levels and sources of workplace violence The majority of nurses in this study reported experiencing some form of workplace violence in the previous three months (see Figure 1). Not only is there evidence of a highly significant difference in reports of workplace violence (p<0.001) but there is also evidence that the incidence of workplace violence has increased in each of the sectors between 2001 and 2004 (p=0.02 aged care, p<0.01 public and p<0.001 private). Figure 1 Experience of workplace violence in previous three months
0 10 20 30 40 50 60 70 80
No
Yes
No
Yes
No
Yes
Aged
Car
eP
ublic
P
rivat
e
Percent
2001 2004
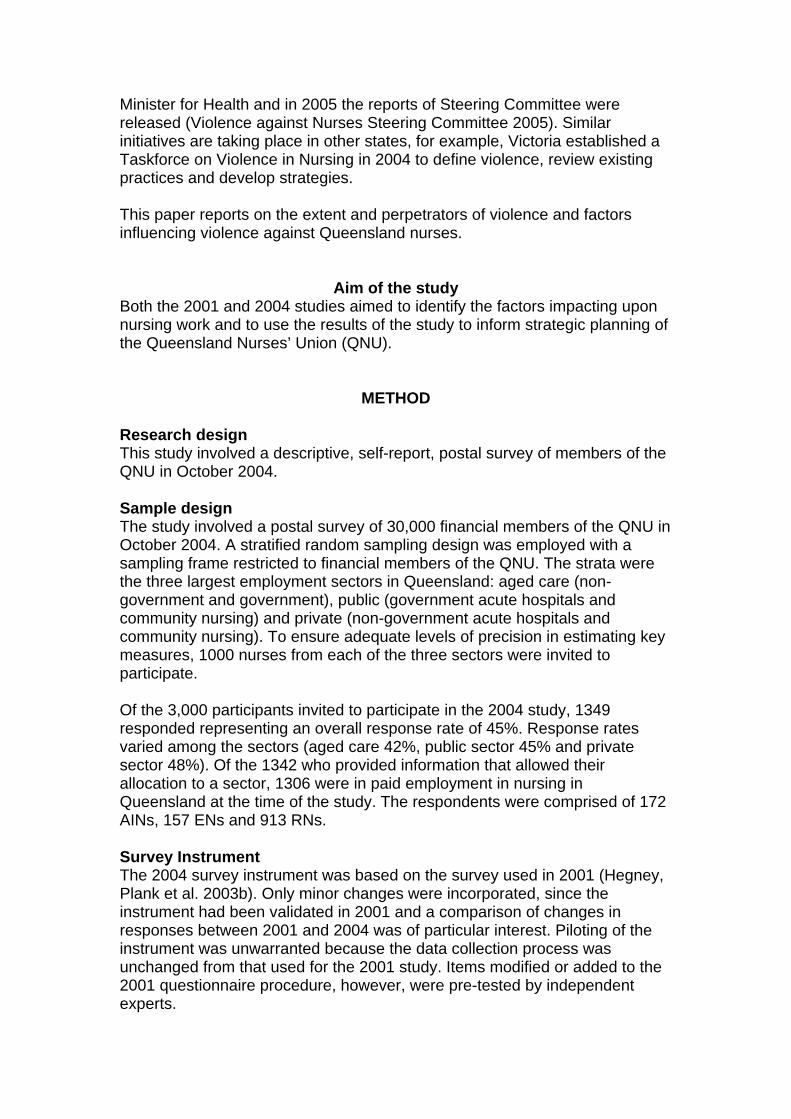
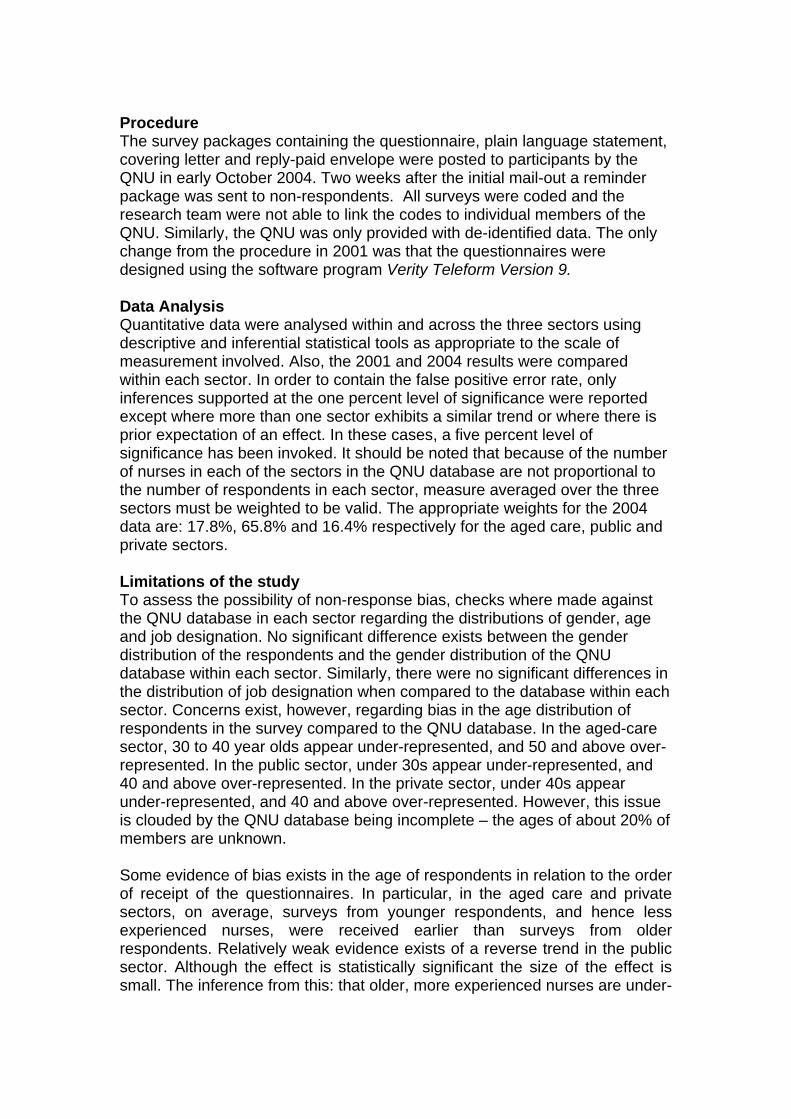
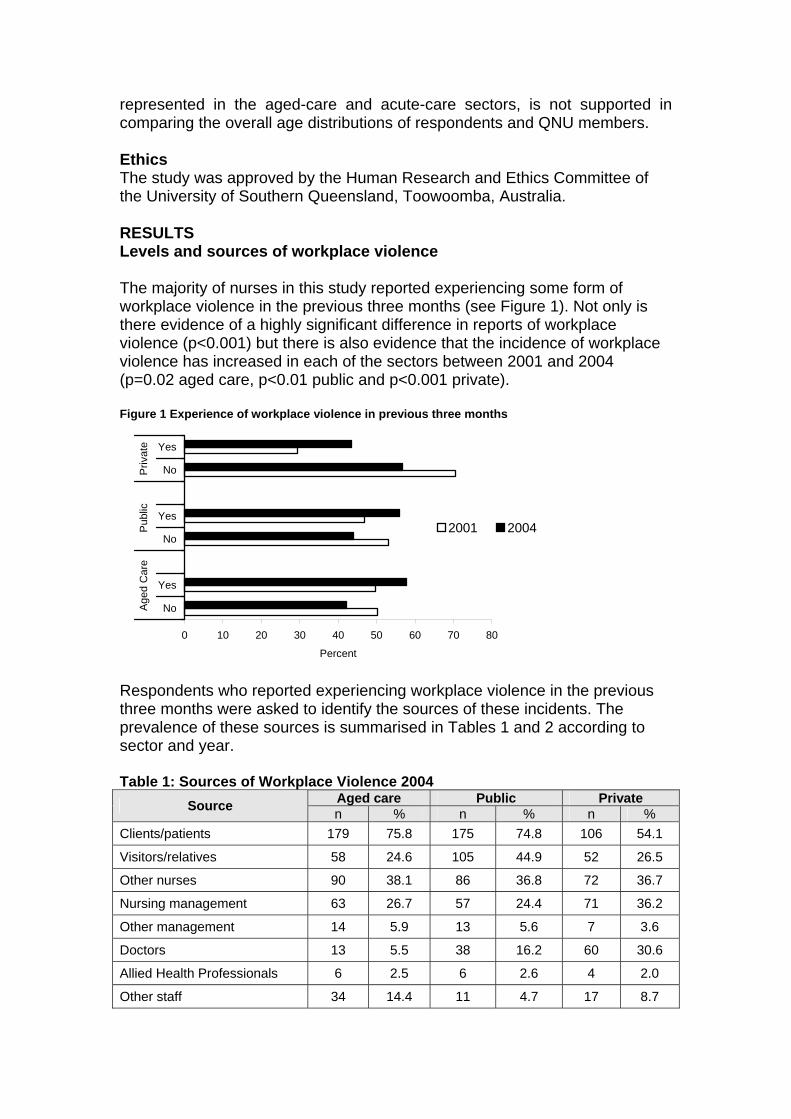
Respondents who reported experiencing workplace violence in the previous three months were asked to identify the sources of these incidents. The prevalence of these sources is summarised in Tables 1 and 2 according to sector and year. Table 1: Sources of Workplace Violence 2004
Aged care Public Private Source n % n % n % Clients/patients 179 75.8 175 74.8 106 54.1
Visitors/relatives 58 24.6 105 44.9 52 26.5
Other nurses 90 38.1 86 36.8 72 36.7
Nursing management 63 26.7 57 24.4 71 36.2
Other management 14 5.9 13 5.6 7 3.6
Doctors 13 5.5 38 16.2 60 30.6
Allied Health Professionals 6 2.5 6 2.6 4 2.0
Other staff 34 14.4 11 4.7 17 8.7

Others/unknown 7 3.0 10 4.3 0 0 Total number of respondents* 236 234 196
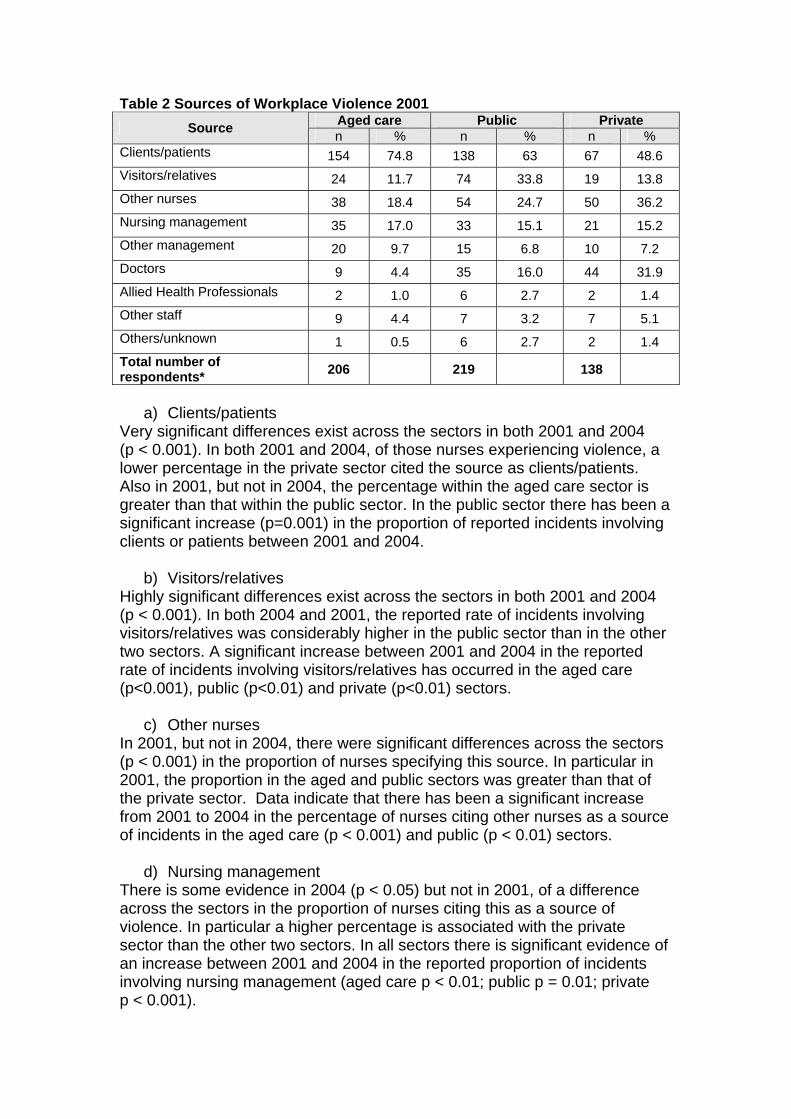
Table 2 Sources of Workplace Violence 2001 Aged care Public Private Source n % n % n %
Clients/patients 154 74.8 138 63 67 48.6 Visitors/relatives 24 11.7 74 33.8 19 13.8 Other nurses 38 18.4 54 24.7 50 36.2 Nursing management 35 17.0 33 15.1 21 15.2 Other management 20 9.7 15 6.8 10 7.2 Doctors 9 4.4 35 16.0 44 31.9 Allied Health Professionals 2 1.0 6 2.7 2 1.4 Other staff 9 4.4 7 3.2 7 5.1 Others/unknown 1 0.5 6 2.7 2 1.4 Total number of respondents* 206 219 138
a) Clients/patients
Very significant differences exist across the sectors in both 2001 and 2004 (p < 0.001). In both 2001 and 2004, of those nurses experiencing violence, a lower percentage in the private sector cited the source as clients/patients. Also in 2001, but not in 2004, the percentage within the aged care sector is greater than that within the public sector. In the public sector there has been a significant increase (p=0.001) in the proportion of reported incidents involving clients or patients between 2001 and 2004.
b) Visitors/relatives Highly significant differences exist across the sectors in both 2001 and 2004 (p < 0.001). In both 2004 and 2001, the reported rate of incidents involving visitors/relatives was considerably higher in the public sector than in the other two sectors. A significant increase between 2001 and 2004 in the reported rate of incidents involving visitors/relatives has occurred in the aged care (p<0.001), public (p<0.01) and private (p<0.01) sectors.
c) Other nurses In 2001, but not in 2004, there were significant differences across the sectors (p < 0.001) in the proportion of nurses specifying this source. In particular in 2001, the proportion in the aged and public sectors was greater than that of the private sector. Data indicate that there has been a significant increase from 2001 to 2004 in the percentage of nurses citing other nurses as a source of incidents in the aged care (p < 0.001) and public (p < 0.01) sectors.
d) Nursing management There is some evidence in 2004 (p < 0.05) but not in 2001, of a difference across the sectors in the proportion of nurses citing this as a source of violence. In particular a higher percentage is associated with the private sector than the other two sectors. In all sectors there is significant evidence of an increase between 2001 and 2004 in the reported proportion of incidents involving nursing management (aged care p < 0.01; public p = 0.01; private p < 0.001).
e) Medical practitioners
There is very significant evidence (p < 0.001) in both 2004 and 2001 of a difference across the sectors in the proportion of nurses citing this source of violence. In particular a higher percentage is associated with the private sector than the public sector, which in turn is higher than the aged care sector. There is no significant evidence of a difference between 2001 and 2004.
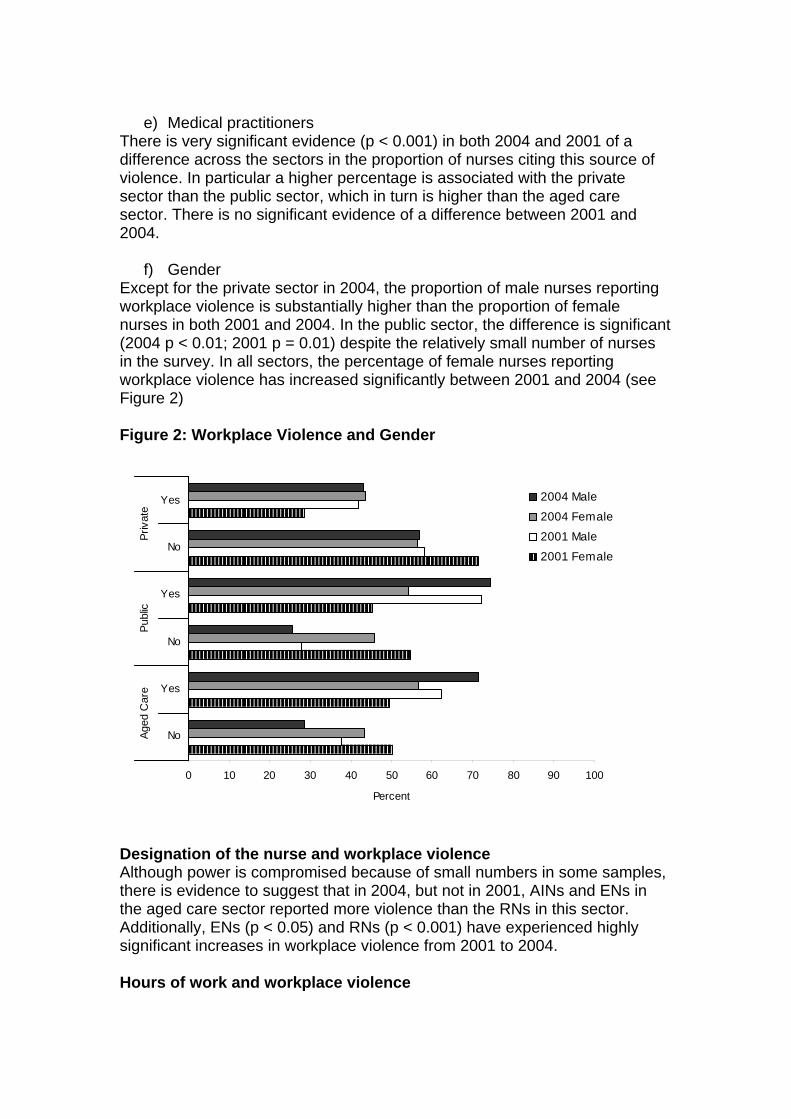
f) Gender Except for the private sector in 2004, the proportion of male nurses reporting workplace violence is substantially higher than the proportion of female nurses in both 2001 and 2004. In the public sector, the difference is significant (2004 p < 0.01; 2001 p = 0.01) despite the relatively small number of nurses in the survey. In all sectors, the percentage of female nurses reporting workplace violence has increased significantly between 2001 and 2004 (see Figure 2) Figure 2: Workplace Violence and Gender
0 10 20 30 40 50 60 70 80 90 100
No
Yes
No
Yes
No
Yes
Aged
Car
ePu
blic
Priv
ate
Percent
2004 Male
2004 Female
2001 Male
2001 Female
Designation of the nurse and workplace violence Although power is compromised because of small numbers in some samples, there is evidence to suggest that in 2004, but not in 2001, AINs and ENs in the aged care sector reported more violence than the RNs in this sector. Additionally, ENs (p < 0.05) and RNs (p < 0.001) have experienced highly significant increases in workplace violence from 2001 to 2004. Hours of work and workplace violence
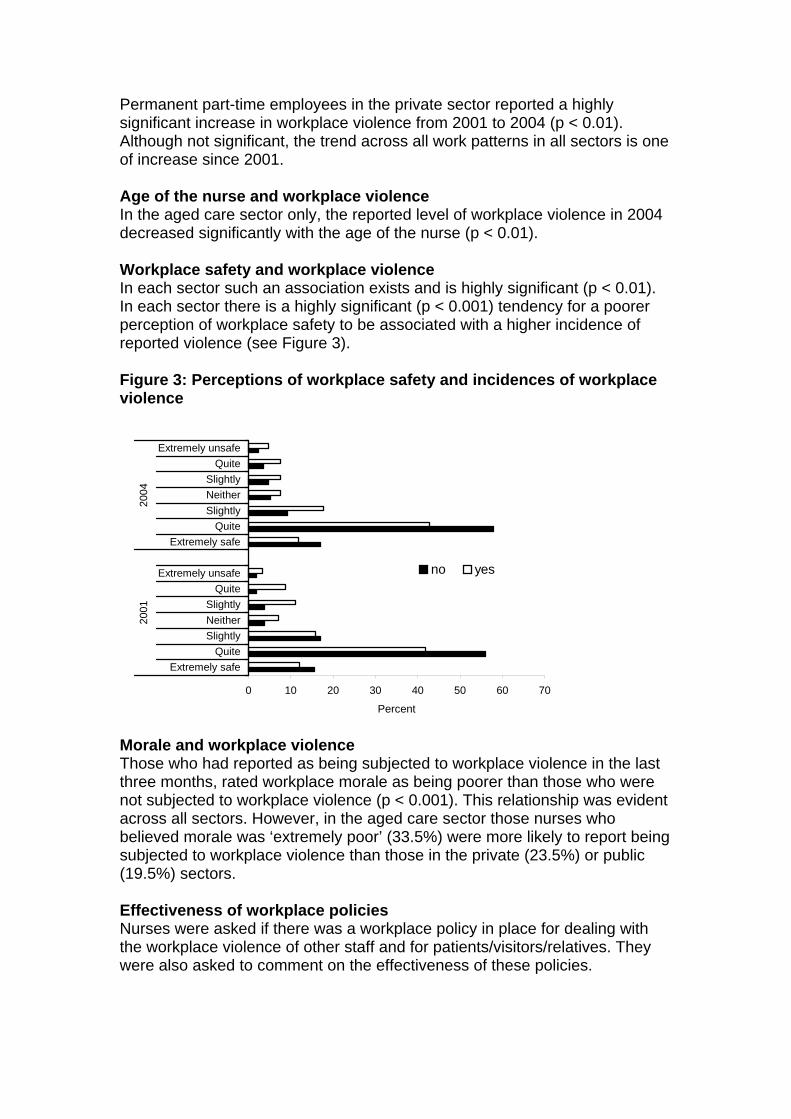
Permanent part-time employees in the private sector reported a highly significant increase in workplace violence from 2001 to 2004 (p < 0.01). Although not significant, the trend across all work patterns in all sectors is one of increase since 2001. Age of the nurse and workplace violence In the aged care sector only, the reported level of workplace violence in 2004 decreased significantly with the age of the nurse (p < 0.01). Workplace safety and workplace violence In each sector such an association exists and is highly significant (p < 0.01). In each sector there is a highly significant (p < 0.001) tendency for a poorer perception of workplace safety to be associated with a higher incidence of reported violence (see Figure 3). Figure 3: Perceptions of workplace safety and incidences of workplace violence
0 10 20 30 40 50 60 70
Extremely safeQuite
SlightlyNeitherSlightly
QuiteExtremely unsafe
Extremely safeQuite
SlightlyNeitherSlightly
QuiteExtremely unsafe
2001
2004
Percent
no yes
Morale and workplace violence Those who had reported as being subjected to workplace violence in the last three months, rated workplace morale as being poorer than those who were not subjected to workplace violence (p < 0.001). This relationship was evident across all sectors. However, in the aged care sector those nurses who believed morale was ‘extremely poor’ (33.5%) were more likely to report being subjected to workplace violence than those in the private (23.5%) or public (19.5%) sectors. Effectiveness of workplace policies Nurses were asked if there was a workplace policy in place for dealing with the workplace violence of other staff and for patients/visitors/relatives. They were also asked to comment on the effectiveness of these policies.
a) Workplace policy for aggressive behaviour of other staff (defined as nurses, management, doctors and allied health professionals)
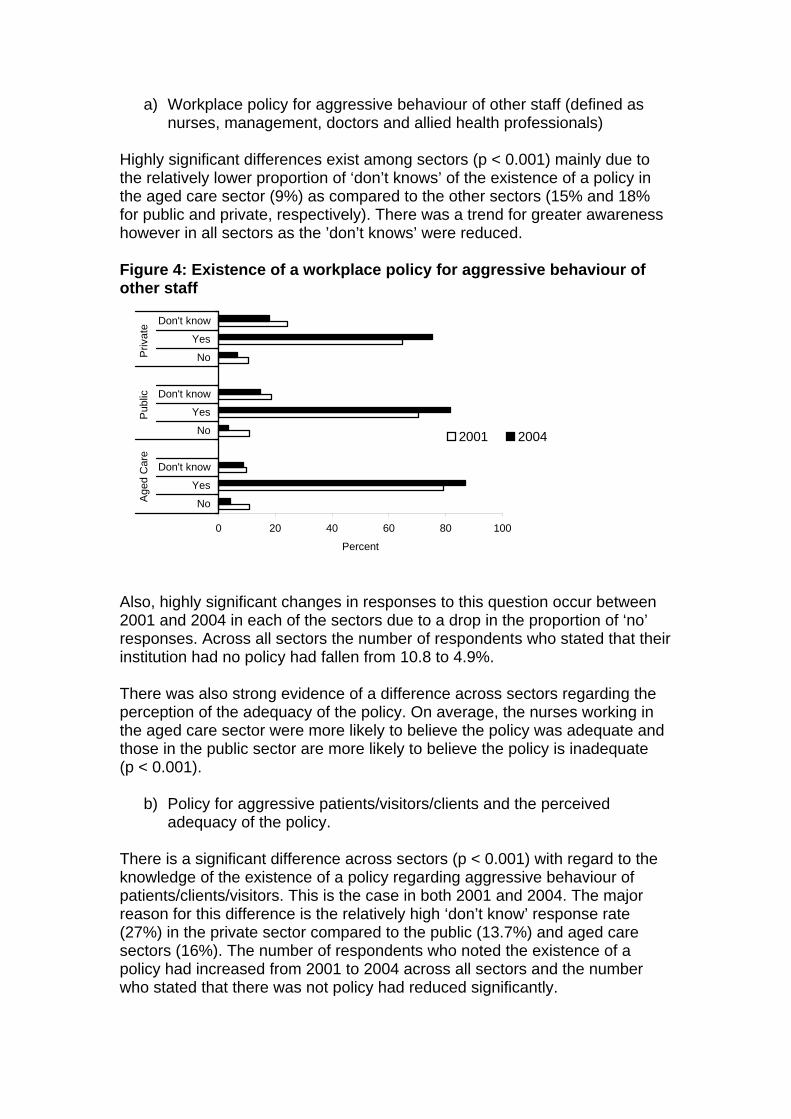
Highly significant differences exist among sectors (p < 0.001) mainly due to the relatively lower proportion of ‘don’t knows’ of the existence of a policy in the aged care sector (9%) as compared to the other sectors (15% and 18% for public and private, respectively). There was a trend for greater awareness however in all sectors as the ’don’t knows’ were reduced. Figure 4: Existence of a workplace policy for aggressive behaviour of other staff
0 20 40 60 80 100
No
Yes
Don't know
No
Yes
Don't know
No
Yes
Don't know
Age
d C
are
Pub
lic
Priv
ate
Percent
2001 2004
Also, highly significant changes in responses to this question occur between 2001 and 2004 in each of the sectors due to a drop in the proportion of ‘no’ responses. Across all sectors the number of respondents who stated that their institution had no policy had fallen from 10.8 to 4.9%. There was also strong evidence of a difference across sectors regarding the perception of the adequacy of the policy. On average, the nurses working in the aged care sector were more likely to believe the policy was adequate and those in the public sector are more likely to believe the policy is inadequate (p < 0.001).
b) Policy for aggressive patients/visitors/clients and the perceived adequacy of the policy.
There is a significant difference across sectors (p < 0.001) with regard to the knowledge of the existence of a policy regarding aggressive behaviour of patients/clients/visitors. This is the case in both 2001 and 2004. The major reason for this difference is the relatively high ‘don’t know’ response rate (27%) in the private sector compared to the public (13.7%) and aged care sectors (16%). The number of respondents who noted the existence of a policy had increased from 2001 to 2004 across all sectors and the number who stated that there was not policy had reduced significantly.

Table 3: Knowledge of workplace policy for aggressive patients/visitors/clients
Aged care Public Private n % n % n %
No 39 9.40% 19 4.50% 35 7.70% Yes 308 74.60% 345 81.80% 298 65.20% Don’t know 66 16.00% 58 13.70% 124 27.10%
2004
Total 413 100.00% 422 100.00% 457 100.00% No 82 19.30% 76 15.50% 61 12.50% Yes 303 71.30% 315 64.40% 270 55.30% Don’t know 40 9.40% 98 20.00% 157 32.20%
2001
Total 425 100.00% 489 100.00% 488 100.00% With regard to the adequacy of the policy, there were differences evident across the sectors (p < 0.01). The main differences are the relatively low proportion of ‘sometimes’ response in the private sector and relatively low proportion of ‘always or nearly always’ response in the public sector compared to the other sectors (see Figure 5). Figure 5: Perceptions of the adequacy of workplace policy for aggressive behaviour of patients/visitors/clients
0 10 20 30 40 50 60
Never or very seldomSeldom
SometimesMostly
Always or nearly always
Never or very seldomSeldom
SometimesMostly
Always or nearly always
Never or very seldomSeldom
SometimesMostly
Always or nearly always
Age
d C
are
Pub
lic
Priv
ate
Percent
2001 2004
DISCUSSION Although Farrell (1999) undertook a qualitative followed by a quantitative study. to our knowledge our data are the first from a follow-up quantitative study. One of the most significant findings in this study is the high rate of workplace violence and the increase in reports of workplace violence from 2001. Extent of workplace violence The extent of reported violence is extremely high when compared to recent overseas surveys. For example 12% of nurses reported physical abuse from patients and 3% from relatives in a survey of public sector NHS workers that included over 60,000 nurses (Healthcare Commission 2005). In the same
study the proportion of workers noting verbal abuse from patients, relatives, managers and other colleagues was 22%, 17%, 7% and 10% respectively. Wells and Bowers (2002) review of the literature concluded an annual rate of 9.5% for physical assault and a “significantly higher” incidence of verbal assault in general nursing. Similarly in the USA recent figures of for physical and non-physical violence were 13.2% and 38.8% in a survey of 6000 nurses (Gerberich, T R Church et al. 2004). Many violent acts are unreported and small increases in reporting alone may have huge effects. A study 9000 nurses in Alberta, Canada found that 300 were abused once every five shifts but only 46% reported the violence (Rickers 2003). Erickson and Williams-Evans (2000) report that 50% of violent acts were unreported and cite evidence of even lower reporting frequency. In 2004 in England reporting of incidence by NHS staff was around 68% for physical and 54% for verbal attacks (Healthcare Commission 2005). A higher proportion (in excess of 50%) of our respondents noted that they have been subject to an act of violence in the last three months. Nevertheless this high frequency of workplace violence is consistent with other studies in Australia (Farrell 1999) (O'Connell, Young et al. 2000; Day 2005) that have all undertaken surveys within single institutions. Questions have to be asked as to why the Australian figures are high. It is possible that it is due to a different understanding of what constitutes violence. However, the definition in the UK is equally as broad. Other explanations are societal differences in extent of aggression, structure of the health service and workload. Further investigation is warranted to determine the cause of these differences. Whilst the literature and these results point to increased violence in the workplace it is important to exercise some caution in the interpretation of these results. Hollings (1997) suggested that violence has not rocketed out of control, rather people are experiencing an increased level of fear that is damaging any sense of objectivity and perception. Bowie (1998) suggests that there might be a number of other reasons for this purported increase in violence in hospitals, including de-institutionalisation of psychiatric patients into the community, the spilling over of domestic violence into the workplace and societal acceptance of increasing levels of violence as a means to an end. There are other possible explanations. For example, nurses may be coming more assertive and refusing to accept abuse and violence as a normal and acceptable element of their working environment. When asked about violence people are more likely to recognise they have been a victim and indicate so on a survey. Queensland Health has a zero tolerance policy and it should follow that with increased awareness more reporting would occur. Furthermore Queensland Health have defined violence to include physical and psychological harm or injury caused by threats, abuse, intimidating behaviour attacks and assaults including ‘intentional physical attacks’ and ‘sexual harassment’ (Violence

against Nurses Steering Committee, 2005). Interpretation of our question on violence, therefore, may have changed from 2001. Sector differences. It is known that there are violent ‘hotspots’ (e.g., mental health) for nurses. In our study we were not able to analyse the data to this level. However, we did compare sectors, and the private sector although reporting a lower overall incidence of workplace violence, reported the greatest increase. The sector differences are consistent with our previous study (Hegney et al 2003). Farrell noted that private sector nurses were more concerned about aggressive acts but less inclined to speak out and suggested that the overall lower reported incidence of violence in the private sector may be evidence of job security (Farrell 1999). Regardless, we believe that it is entirely conceivable that the differences that we found correspond to genuine differences in the level of workplace violence, rather than a reluctance to speak out. Perpetrators of violence It is a general assumption that patients are the source of violence to nurses. However, this is clearly not so and other studies have demonstrated this (e.g. (Farrell 1999) (Healthcare Commission 2005). The perpetrators of violence in this study yielded very interesting results for they differ considerably among sectors. Consistent with the previous study’s patients were the highest source of violence in all sectors (Hegney, Plank et al. 2003b) but were 20% lower in the private sector. The reported level from patients increased in all sectors but the public sector demonstrated by far the highest increase since 2001. It is possible that an explanation of the increase of this source of workplace violence from patients is cost containment. A study in the USA has noted that funding cuts, which resulted in increased waiting lists for admission to hospital, had resulted in increased patient aggression towards nurses (Genovese 2003). Another USA study identified that the principal perpetrators of patient physical and non-physical violence were male over 65 years of age and male between 35 and 65 years respectively (Gerberich, T R Church et al. 2004). Further investigation is warranted to determine if such classifications may be identified here to support pre-emptive action. Visitors and relatives as the source of workplace violence were reported by at least a quarter of respondents in the private and aged care sectors. Other studies have shown similar results (Nabb 2000) (Farrell 1999). What is of great concern is that the figures have doubled since 2001. Violence by visitors and relatives in the public sector also increased since 2001 and was reported by almost 50% of the respondents. Although no specific studies have provided information it is possible, as noted for patient/client sourced violence, that one influence on this change is cost containment (Genovese 2003). The qualitative data support this theory with some nurses noting that abuse from relatives was linked to the nurse’s inability to provide the expected level of care to a patient (due to workload).
Similarly, there was also some indication from respondents in this study that the Privacy Guidelines/Legislation meant that they were now more contained in the information they could provide to next-of-kin. The nurses believed that lack of information by relatives about restrictions resulting from the change in legislation resulted in an increase of abuse from visitors/relatives. Nursing management was indicated as the perpetrators of violence by over a third of the respondents. This figure had almost doubled since 2001. In addition, although no pattern emerged from the 2001 data, in 2004 private sector nurses were more likely to identify nursing management as a source (36% - an increase of 15% since 2001). This compares to increases from 15% to 25% for the other two sectors. It may be that the larger workload and shortage of nurses has resulted in increased bullying by senior management towards nurses to ‘work harder with less’. Certainly the qualitative data suggest that this is one factor, and bullying by higher ranked staff has been reported to be the most common form of workplace violence by other studies (Working Women’s Centre SA Inc 1997). Other nurses are the second most common source of workplace violence. No sector differences occurred however, there was a significant increase from 2001 to 2004 (25% to 37%). It is interesting to note that private sector nurses in a Tasmanian study were twice a likely as those from the public sector to report that stress associated with aggression from other colleagues was the most disturbing type of stress (Farrell 1999). Violence from medical practitioners in the private sector was higher than in other sectors. Previous studies have noted that a collegial working relationship between medical practitioners and nurses does impact upon the job satisfaction of nurses (Rosenstein 2002). Similar to the results in 2001, there is a significant difference across sectors in 2004. In the private sector respondents are more likely to report workplace violence from medical practitioners (30.6%), compared with 16.2% in the public and a low 5.5% in the aged care sectors. There is no significant change in the percentage of nurses reporting medical practitioners as a source of workplace violence between the 2001 and 2004 study. We did not separate the type of violence according to perpetrator. From other studies it is likely that the incidence of violence by management, colleagues and other staff is mostly of a non-physical nature and this is one area that warrants further study. Gender differences In 2004 the proportion of male nurses reporting workplace violence was higher than female nurses in both the public and aged care sectors. In the public sector despite the small number of male nurses in the survey the difference is statistically significant. In 2001, male nurses in the private sector were more likely than female nurses to report workplace violence. This difference was no longer apparent in 2004. In all sectors the percentage of female nurses who stated that they had experienced workplace violence has increased significantly in 2004 and a similar but not significant trend appeared for males.
There is conflicting evidence with regard to workplace violence and gender in previous studies. These include: (a) no statistically significant difference for gender in two UK studies of nurses (Whittington, Shuttleworth et al. 1996) (Wells and Bowers 2002), (b) more likely to occur in females than males (Queensland Government 2002) and (c) male nurses experiencing more workplace violence than female nurses in Sweden (Arnetz, Arnetz et al. 1996) and the USA (Gerberich, T R Church et al. 2004). No definite explanation can be offered at this time as to why there may be gender effects or why studies yield differing results. However it is speculated that male nurses may have more exposure to violent patients. This aspect certainly warrants further investigation focussing on the gender of both aggressor and victim, the type of aggression and location. Job grade and age There is evidence to suggest that in 2004, but not in 2001, ENs and AINs in the aged care sector (both public and private aged care) are more likely to report workplace violence than RNs. This is an expected finding as the ENs and AINs provide the clinical care within this sector with RNs often in a more supervisory role. Grade and age differences in violence have been reported by various authors with in most cases younger and less experienced student nurses (Grenade and Macdonald 1995). (Wells and Bowers 2002) (Rippon 2000) (Whittington, Shuttleworth et al. 1996) This age effect is in accordance with our data only for the aged care sector. In that sector nurses who reported that they had been subject to violence in the last three months were nearly three years younger than those who reported no violence. No significant age effects were seen in the other sectors although similar trends could be detected. Workplace safety In each sector the perceived degree of workplace safety was inversely related to the incidence of reported workplace violence. This finding is consistent with Spurgeon and Barwell (2002) who also found that lowered perceptions of a safe workplace were linked to workplace violence. We did not identify types of violence however, studies show that physical and verbal are equally damaging. Workplace morale Several authors have associated workplace violence with morale (Day 2005). In another recent international study of nurses and verbal abuse in the clinical setting, 92% of respondents reported that verbal abuse negatively affected morale (Uzun 2003). In our study, those who had been subjected to workplace violence in the last three months rated workplace morale as being poorer than those who were not subjected to workplace violence. This relationship was evident and extremely dramatic across all three sectors. The proportion of nurses who indicated that morale in their workplace was positive dropped by at least 20% if they had been subjected to violence. Workplace policies
Recognition of the adverse effects of workplace violence has resulted in policies and strategies being implemented at levels from government down to individual institutions. We were interested in comparing if there was a change since 2001 in the number of workplaces with policies and nurses’ knowledge about those policies. For each sector there were fewer ‘don’t know’ responses and less ‘no’ responses than in 2001 in answer to questions regarding the existence of policies about workplace violence perpetrated by both other staff and patients/clients. Although we cannot say definitively that more policies exist it is apparent that awareness of their existence has increased. This finding may reflect activity from institutions, Queensland Health and the QNU over the three-year period aimed at increasing awareness of workplace violence. Sector differences did occur however, suggesting that workplace awareness may be lacking or not consistent. In particular, in the private sector 18% of nurses were unaware of the existence of staff policies and 27% of nurses were unaware of the existence of patient/client/ visitor policies. This finding suggests that this sector really needs to raise the profile of this important issue. One study revealed that less than ten years ago 65% of nurses in an Australian teaching hospital did not know about the support mechanisms to assist them to deal with and recover from an aggressive episode.(O'Connell, Young et al. 2000). In the UK where a great deal of action has taken place in the last five years with respect to workplace violence, 85% of healthcare workers (nurses constituted 30% of respondents) had knowledge of reporting policy (Healthcare Commission 2005). It is interesting that the lack of knowledge about the existence of policy for staff violence and policies for patient/clients/visitors violence differed in both the aged care and private sectors. While knowledge of the existence or absence of policies was consistent in the public sector, in the other two sectors twice as many staff were unaware of the patient/client/visitor policy as they were of the staff policy. The differences that nurses perceived in adequacy of policies demonstrated between the two source groups could reflect differing management attitudes towards violence from different sources. Nurses in one study perceived senior management’s reluctance to recognise visitors’ violence towards nurses as a problem (Nabb 2000). In the same study nurse believed they were most vulnerable in situations of high workload. Zero tolerance is not just about preventing violence and raising awareness of its existence. Probably the most critical issue is to ensure that action is taken. We therefore explored what nurses’ perceptions were as to the effectiveness of policies against workplace violence. In the Healthcare Commission survey in England NHS workers responded “yes”, “no” or “don’t know” to questions about effective action to reported abuse. The proportion who stated that effective action was not taken was 5% in the case of physical and 11% in the case of verbal abuse (Healthcare
Commission 2005) The QNU nurses were given a graded scale for their answers however the proportion who stated “never” to the adequacy of policy was 8.3% for patient and 12.6% for other workers. It is recognised that one question was related to action and one to policy, but the results do show similar magnitude. QNU nurses in the aged care sector were more likely to believe that the policies were ‘always or nearly always’ effective. In contrast, nurses in the public sector were the least likely to believe that the policy was effective. When compared with the percentage of nurses reporting workplace violence the results suggest that while there are policies in place they are not as effective as they should be. Furthermore as no differences appeared from 2001 to 2004 concern must be expressed that despite the development of policies and strategies actual progress is lagging behind. Rickers (2003) postulated that a reason for increased violence was in management response. Through a Broken Windows theory it was suggested that lesser criminal acts—such as vandalism—in a community creates an environment where more crime takes place ( Rickers 2003). The same explanation can be applied to hospital settings whereby if co-workers are abusing each other and that is seen as okay, patients are more likely to commit violent acts. Only by taking action against each and all forms of violence will it end. Many nurses commented on workplace violence. The major themes indicated that nurses associated violence with increased workloads, the lack of understanding by relatives of the Privacy legislation and guidelines, cost containment exercises on the part of the organisation and tolerance by management of violent acts from other staff. Nurses reacted to the experience of aggression in a variety of ways (O'Connell, Young et al. 2000). Whether the response is the taking of sick leave, alcohol or drugs or leaving the profession none of these actions are conducive to improving medical care. CONCLUSIONS The results of the 2001 and 2004 studies have confirmed previous findings of workplace violence as well as provided new evidence of influences on workplace violence not previously reported. One of the major findings is that the sources of workplace violence differ across the three sectors. The results suggest the context of practice is an important consideration, and that a ‘one size fits all’ education program or policy would not be effective to manage these differences. The studies confirm workplace violence remains an issue within nursing and we would suggest that the issue is increasing in importance in parallel as the data from the 2004 study appear to indicate an increase. Whether this is an increase in actual workplace violence, or an increase in awareness of what workplace violence is, cannot conclusively be stated. The bottom line is

however, that regardless of source or frequency an environment that is considered unsafe is not good for clients, employees or employers. Some aspects of this study (for example, gender) require further investigation. ACKNOWLEDGEMENTS We wish to thank the Queensland Nurses’ Union for funding both the 2001 and 2004 studies. We also wish to thank the nurses who took the time to complete and return the survey. REFERENCES Arnetz, J., B. Arnetz, et al. (1996). "Violence in the nursing profession: occupation and life style factors in Swedish nurses." Work and Stress 10: 119-127. Carter, R. (2000). "High risk of violence against nurses." Nursing Management - UK 6(8): 5. Day, G. (2005). Nurse Morale plummets in Queensland, University of New England. Erickson, J. and S. Williams-Evans (2000). "Attitudes of Emergency Nurses regarding patient assaults." Journal of Emergency Nursing 26(3): 210-215. Farrell, G. (1999). "Aggression in clinical nurse settings: nurses'views - a follow-up study." Journal of Advanced Nursing 29(3): 532-541. Genovese, M. (2003). Hospital workplace is too violent, say nurses. New York State Nurses Association. Gerberich, S. G., T. T R Church, et al. (2004). "An epidemiological study of the magnitude and consequences of work related violence: the Minnesota Nurses’ Study." Occupational and Environmental Medicine 61: 495-503. Grenade, G. and E. Macdonald (1995). "Risk of physical assault among student nurses." Occupational Medicine 45: 256–258. Healthcare Commission (2005). National NHS staff survey 2004. Hegney, D., A. Plank, et al. (2003b). "Workplace violence in nursing in Queensland Australia: A self-reported study." International Journal of Nursing Practice 9: 261 - 268. Hollings, L. (1997). "Fear Factor." Nursing Standard 11(39): 18. Home Office Directorate (1999). Violence at Work: Findings from the British Crime Survey. Home Office Research, Development and Statistics. London, Home Office Research, Development and Statistics Directorate.
Jackson, D., J. Clare, et al. (2002). "Who would want to be a nurse? Violence in the workplace - a factor in recruitment and retention." Journal of Nursing Management 10(1): 13 - 20. Nabb, D. (2000). "Visitors’ violence: the serious effects of aggression on nurses and others." Nursing Standard 14(36-38). O'Connell, B., J. Young, et al. (2000). "Nurses' Perceptions of the Nature and Frequency of Aggression in General Ward Settings and High Dependency Areas." Journal of Clinical Nursing, 9(4), 602-610. 9(4): 602-610. Queensland Government (2002). Workplace Bullying Taskforce: Creating Sage and Fair Workplaces: Strategies to Address Workplace Harassment in Queensland. Brisbane. Rickers, K. (2003). "Workplace Violence in Hospitals." Health Policy. Rippon, T. H. (2000). "Aggression and violence in health care professionals." Journal of Advanced Nursing 31: 452-460. Rosenstein, A. H. (2002). "Nurse-physician relationships: impact on nurse satisfaction and retention." American Journal of Nursing 102(6): 26 - 34. Sofield, L. and S. Salmond (2003). "Workplace Violence. A Focus on Verbal Abuse and Intent to Leave the Organisation." Orthopaedic Nursing 22(4): 274. Spurgeon, P. and F. Barwell (2002). "Staff Attitude Surveys: The Morale Majority." Health Services Journal, 112(5808), 22-24.(5208): 22 - 24. Uzun, O. (2003). "Perceptions and Experiences of Nurses in Turkey about Verbal Abuse in Clinical Settings." Journal of Nursing Scholarship 35(1): 81 -85. Violence against Nurses Steering Committee (2005). Violence Against Nurses Report, Queensland Health. Wells, J. and L. Bowers (2002). "How prevalent is violence towards nurses working in general hospitals in the UK?" Journal of Advanced Nursing 39(3): 230 - 240. Whittington, R., S. Shuttleworth, et al. (1996). "Violence to staff in a general hospital setting." Journal of Advanced Nursing 24: 326-333. Working Women’s Centre SA Inc (1997). Workplace bullying: Finding some answers. Adelaide., WWC SA Inc.