Embed Size (px)
Citation preview

Workplace Safety and Health Report
2019 National Statistics


WORKPLACE SAFETY AND HEALTH REPORT, 2019
Notations and List of Charts
List of Statistical Tables
Key Facts
Overview of Trends
Work Injury Compensation
Business Under Surveillance
Medical and Hygiene Surveillance
Annexes
Annex A - Statistical Tables
Annex B - Business under Surveillance
Annex C - Medical and Hygiene Surveillance
Annex D - Source of Data
Annex E - Data Coverage
Annex F - Concepts and Definitions
Page 01
Page 02
Page 03
Page 05
Page 24
Page 25
Page 26
Page 30
Page 55
Page 56
Page 57
Page 58
Page 59
CONTENTS

WORKPLACE SAFETY AND HEALTH REPORT, 201901
NOTATIONS
LIST OF CHARTS
- : Nil or negligiblen.a. : Not applicable/Not available* : Estimated rates. The employment data excludes self-employed persons.
Figure 1: Number and rate of workplace injuries, 2010-2019
Figure 2: Number and rate of workplace fatal injuries, 2010-2019
Figure 3: Number of workplace fatal injuries by industry, 2010-2019
Figure 4: Number of workplace fatal injuries by cause of injury, 2014-2019
Figure 5: Number and rate of fatal injuries for Construction industry, 2010-2019
Figure 6: Number and rate of fatal injuries for Marine industry, 2010-2019
Figure 7: Number and rate of fatal injuries for Manufacturing industry, 2010-2019
Figure 8: Number and rate of fatal injuries for Transportation & Storage industry, 2010-2019
Figure 9: Number and rate of workplace major injuries, 2011-2019
Figure 10: Number of workplace major injuries by industry, 2011-2019
Figure 11: Number of workplace major injuries by cause of injury, 2014-2019
Figure 12: Number and rate of major injuries for Construction industry, 2011-2019
Figure 13: Number and rate of major injuries for Marine industry, 2011-2019
Figure 14: Number and rate of major injuries for Manufacturing industry, 2011-2019
Figure 15: Number and rate of major injuries for Transportation & Storage industry, 2011-2019
Figure 16: Number and rate of workplace minor injuries, 2011-2019
Figure 17 Number of workplace minor injuries by industry, 2011-2019
Figure 18: Number of workplace minor injuries by cause of injury, 2014-2019
Figure 19: Number of dangerous occurrences, 2011-2019
Figure 20: Number of dangerous occurrences by industry, 2011-2019
Figure 21: Number and rate of occupational diseases, 2010-2019
Figure 22: Number of occupational diseases by industry, 2010-2019
Figure 23: Number of occupational disease by type, 2010-2019
Figure 24: Number and rate of work-related musculoskeletal disorders, 2013-2019
Figure 25: Number and rate of noise-induced deafness, 2010-2019
Figure 26: Number of companies entering and exiting surveillance, 2012-2019
Figure 27: Number of workers under medical surveillance, 2010-2019
Figure 28: Number of workplaces under medical surveillance, 2010-2019
Figure 29: Medical monitoring for noise exposure by Top 5 industries, 2019
Note: To align with international practices, information on Accident Frequency Rate and Accident Severity Rate were no longer published since the January to June 2019 edition of the Workplace Safety and Health Report.

02WORKPLACE SAFETY AND HEALTH REPORT, 2019
LIST OF STATISTICAL TABLESTable 1: Number of workplace injuries, dangerous occurrences and occupational diseases,
2018 and 2019
Table 2: Key safety and health indicators, 2018 and 2019
Table 3: Number of TI and PI workplace injuries compensation claims and amount awarded, 2017-2019
Table 4: Number of Fatal and Total workplace injuries compensation claims and amount awarded, 2017-2019
Table 5: Number of workplace fatal injuries by industry, 2018 and 2019
Table 6: Workplace fatal Injury rates by industry, 2018 and 2019
Table 7: Number of workplace fatal injuries by incident type and incident agent, 2018 and 2019
Table 8: Number of workplace fatal injuries by industry and incident type, 2019
Table 9: Number of workplace major injuries by industry, 2018 and 2019
Table 10: Workplace major injury rates by industry, 2018 and 2019
Table 11: Types of workplace major injury, 2018 and 2019
Table 12: Number of workplace major injuries by key incident type and key incident agent, 2018 and 2019
Table 13: Top 3 incident types for workplace major injuries by industry, 2019
Table 14: Number of workplace minor injuries by industry, 2018 and 2019
Table 15: Workplace minor injury rates by industry, 2018 and 2019
Table 16: Number of workplace minor injuries by key incident type and key incident agent, 2018 and 2019
Table 17: Top 3 incident types for workplace minor injuries by industry, 2019
Table 18: Types of workplace minor injury, 2018 and 2019
Table 19: Dangerous occurrences by industry, 2018 and 2019
Table 20: Types of dangerous occurrences, 2018 and 2019
Table 21: Number of confirmed occupational disease cases by industry, 2018 and 2019
Table 22: Occupational disease incidence rates by industry, 2018 and 2019
Table 23: Number of confirmed occupational diseases by type, 2018 and 2019
Table 24: Number of confirmed WRMSD cases by industry, 2018 and 2019
Table 25: Number of confirmed NID cases by industry, 2018 and 2019
Table 26: Number of confirmed OSD cases by industry, 2018 and 2019
Table 27: Top causative agents of Occupational Skin Diseases, 2019
Table 28: Number of man-days lost to workplace incidents in selected industries, 2018 and 2019
Figure 30: Medical monitoring for chemical exposure by Top 5 industries, 2019
Figure 31: Static noise monitoring results by industry, 2017-2019
Figure 32: Personal noise exposure results by industry, 2017-2019
Figure 33: Chemical exposure results by industry, 2019

WORKPLACE SAFETY AND HEALTH REPORT, 201903
39 WORKPLACE FATAL INJURIES IN 2019, TWO LESS THAN IN 2018; BUT MORE MAJOR AND MINOR INJURIES
Overall workplace injury cases1 increased from 12,810 cases in 2018 to 13,779 cases in 2019. The number of workplace fatal injury cases decreased from 41 cases in 2018 to 39 cases in 2019, resulting in a lower fatal injury rate of 1.1 per 100,000 workers.
The number of workplace major injuries increased 5.5% from 596 in 2018 to 629 in 2019. Likewise, the number of workplace minor injuries increased 7.7% from 12,173 in 2018 to 13,111 in 2019.
The confirmed cases of occupational disease decreased from 563 cases in 2018 to 517 cases in 2019 while the number of dangerous occurrences decreased from 23 incidents in 2018 to 21 incidents in 2019.
Table 2: Key safety and health indicators, 2018 and 2019
2018 2019
2018 2019
KEY FACTS
Table 1: Number of workplace injuries, dangerous occurrences and occupational diseases, 2018 and 2019
Workplace Injuries 12,810 13,779
Fatal Injuries 41 39
Major Injuries 596 629
Minor Injuries 12,173 13,111
Dangerous Occurrences 23 21
Occupational Diseases (OD) 563 517
Workplace Injury Rate2 373 396
Fatal Injury rate 1.2 1.1
Major Injury rate 17.4 18.1
Minor Injury rate 355 377
Occupational Disease Incidence Rate3 16.4 14.9
Man-days Lost4 530,961 544,664
Per 100,000 workers
A workplace injury is any personal injury or death resulting from a workplace accident, including work-related traffic injuries. Please refer to Annexes D and E for the types of workplace injuries covered.
No. of Fatal and Non-Fatal Workplace InjuriesNo. of Workers
1
2
3
Workplace Injury Rate =
Occupational Disease Incidence Rate =
x 100,000
No. of Occupational Disease Cases No. of Workers
x 100,000
4 For the purpose of this publication, MOM considers a fatal injury as equivalent to the loss of 6,000 man-days, similar to the U.S. National Institute of Occupa-tional Safety and Health (NIOSH)'s table of scheduled charges.

04WORKPLACE SAFETY AND HEALTH REPORT, 2019
In addition to reporting outcome indicators like workplace injury rates and occupational disease incidence rates, this report has included leading indicators from prevention activities. The proactive activities include workplace Medical and Hygiene surveillance which monitors health risks from exposures to physical and toxic or harmful substances at work, and Business under Surveillance (BUS), which guides poor performing companies to improve their WSH management system.
The main findings on workplace safety and health performance for 2019 are:
WORKPLACE INJURIES
• 39 workers were fatally injured, a rate of 1.1 per 100,000 workers.
• 629 workers sustained workplace major injuries, a rate of 18.1 per 100,000 workers.
• 13,111 workers sustained minor injuries, a rate of 377 per 100,000 workers.
• 544,664 man-days were lost due to workplace injuries in 2019. DANGEROUS OCCURRENCES
• 21 dangerous occurrences (DO) were reported to MOM in 2019.
OCCUPATIONAL DISEASES
• 517 occupational disease (OD) cases were confirmed in 2019, with an incidence rate of 14.9 per 100,000 workers.
• The leading OD was work-related musculoskeletal disorders (WRMSD) with 293 cases, including back injury cases due to ergonomic risks.
• The second most common OD was noise-induced deafness (NID) with 169 cases. BUSINESS UNDER SURVEILLANCE
• 20 companies entered the Business under Surveillance5 (BUS) programme in 2019.
MEDICAL AND HYGIENE SURVEILLANCE
• 133,740 workers from 2,156 workplaces were monitored under the Medical Surveillance6 Programme.
• Under the Hygiene Surveillance7 Programme, 80% of the workplaces had static noise levels greater than 85dBA.
5 Refer to Annex B and website http://mom.gov.sg/workplace-safety-health/programmes/Pages/regulatory-programmes.aspx#bus for information on BUS programme.
6 Medical surveillance monitors the results of the medical examinations of workers who are exposed to specific hazards for early detection and prevention of potential ill health. Examinations are conducted by Designated Workplace Doctors (DWDs). Refer to Annex C for more information. 7Hygiene surveillance determines the levels of persons' exposure to noise and airborne toxic substances in the workplace. Refer to Annex C for more information.

WORKPLACE SAFETY AND HEALTH REPORT, 201905
WORKPLACE INJURIES
For 2019, the overall number of reported injuries8 increased by 8% compared to 2018. The workplace injury rate increased from 373 per 100,000 workers to 396 per 100,000 workers.
8 Employer or Occupier has to report work incidents to the Ministry of Manpower under the WSH (Incident Reporting) Regulations.
Figure 1: Number and rate of workplace injuries, 2010-2019
OVERVIEW OF TRENDS
2010 2011 2012 2013 2014 2015 2016 2017 2018 2019No. of Workplace Injuries 10,319 10,121 11,113 12,453 13,595 12,351 13,014 12,498 12,810 13,779Workplace Injury Rate 411 387 407 384 405 364 382 369 373 3963-year rolling average 442 415 402 393 399 384 384 372 375 379
411387
407
384
405
364382
369 373
396
442415
402
393
399
384 384372 375
379
0
50
100
150
200
250
300
350
400
450
500
0
2,000
4,000
6,000
8,000
10,000
12,000
14,000
16,000
Rate (Per 100,000 Workers)Number ofWorkplace Injuries

06WORKPLACE SAFETY AND HEALTH REPORT, 2019
WORKPLACE FATAL INJURIES
There were 39 workplace fatal injuries in 2019, two cases less than in 2018. The workplace fatal injury rate per 100,000 workers decreased from 1.2 in 2018 to 1.1 in 2019.
Figure 2: Number and rate of fatal injuries, 2010-2019
The Construction industry remained as the top contributor with 13 workplace fatal injuries. There was an increase of four workplace fatal injuries in the Transportation & Storage industry at eight cases compared to four cases in 2018. Both Marine and Manufacturing industries contributed four workplace fatal injuries each in 2019.
Figure 3: Number of workplace fatal Injuries by industry, 2010-2019
2010 2011 2012 2013 2014 2015 2016 2017 2018 2019No. of Workplace Fatal Injuries 55 61 56 73 60 66 66 42 41 39Workplace Fatal Injury Rate 2.2 2.3 2.1 2.3 1.8 1.9 1.9 1.2 1.2 1.13-year rolling average 2.6 2.5 2.2 2.2 2.1 2.0 1.9 1.7 1.4 1.2
2.2 2.32.1
2.3
1.8 1.9 1.9
1.2 1.2 1.1
2.62.5
2.2
2.2
2.1 2.01.9
1.71.4
1.2
0.0
1.0
2.0
3.0
4.0
5.0
0
10
20
30
40
50
60
70
80
90
Rate (Per 100,000 Workers)Number ofWorkplace Fatal Injuries
2010 2011 2012 2013 2014 2015 2016 2017 2018 2019Construction 32 22 26 34 27 27 24 12 14 13Transportation & Storage 4 10 7 11 12 15 11 7 4 8Marine 6 10 6 3 4 4 6 2 4 4Manufacturing 7 13 12 7 6 6 9 7 4 4Wholesale & Retail Trade 1 0 0 3 4 2 3 3 6 2Others 5 6 5 15 7 12 13 11 9 8
0
5
10
15
20
25
30
35
40
Number of Workplace Fatal Injuries
Construction
Wholesale & Retail Trade
Manufacturing
Others
Marine
Transportation & Storage
9
9 Others refers to the summation of various industries with low incidence of workplace fatalities. For more information, please refer to the statistical tables in Annex A.

WORKPLACE SAFETY AND HEALTH REPORT, 201907
Figure 4: Number of workplace fatal Injuries by cause of injury, 2014-2019
CAUSES OF WORKPLACE FATAL INJURIES
In 2019, the top three causes of fatal injuries were Collapse/Failure of Structure & Equipment, Falls from Height and Vehicular Incidents10 . Collectively, they accounted for 54% (21 cases) of all workplace fatal injuries in 2019.
10 Vehicular Incidents includes Struck by Moving Objects and Caught In/Between Objects where the agent(s) was a vehicle.11 Others refers to the summation of various fatal injury causes with low incidence of workplace fatalities. For more information, please refer to the statistical tables in Annex A.
2014 2015 2016 2017 2018 2019Collapse/Failure of Structure & Equipment 6 5 1 0 4 7Falls from Height 10 14 13 8 8 7Vehicular Incidents 15 21 22 14 7 7Slips, Trips & Falls 4 9 6 4 7 3Others 25 17 24 16 15 15
0
5
10
15
20
25
30
Number of Workplace Fatal Injuries
Others
Slips, Trips & Falls
Vehicular Incidents
Falls from Height
Collapse/Failure of Structure & Equipment
11

08WORKPLACE SAFETY AND HEALTH REPORT, 2019
WORKPLACE FATAL INJURIES BY HIGH-RISK INDUSTRY
CONSTRUCTION
The workplace fatal injury rate in the Construction industry decreased from 3.1 per 100,000 workers in 2018 to 2.9 per 100,000 workers in 2019. A total of 13 workplace fatal injuries occurred in the Construction industry in 2019.
Figure 5: Number and rate of fatal injuries for Construction industry, 2010-2019
2010 2011 2012 2013 2014 2015 2016 2017 2018 2019No. of Workplace Fatal Injuries 32 22 26 34 27 27 24 12 14 13Workplace Fatal Injury Rate 8.1 5.5 5.9 7.2 5.5 5.4 4.9 2.6 3.1 2.93-year rolling average 7.7 7.2 6.5 6.2 6.2 6.0 5.3 4.3 3.5 2.9
8.1
5.55.9
7.2
5.5 5.44.9
2.63.1 2.9
7.77.2
6.5
6.2
6.2 6.0
5.3
4.3
3.52.9
0.0
2.0
4.0
6.0
8.0
10.0
0
5
10
15
20
25
30
35
Rate (Per 100,000 Workers)Number ofWorkplace Fatal Injuries

WORKPLACE SAFETY AND HEALTH REPORT, 201909
MARINE
The number of workplace fatal injuries in the Marine12 industry remained unchanged at four fatal injuries, from 2018 to 2019. The workplace fatal injury rate in the Marine industry decreased from 6.2 per 100,000 workers in 2018 to 6.0 per 100,000 workers in 2019.
Figure 6: Number and rate of fatal injuries for Marine industry, 2010-2019
2010 2011 2012 2013 2014 2015 2016 2017 2018 2019No. of Workplace Fatal Injuries 6 10 6 3 4 4 6 2 4 4Workplace Fatal Injury Rate 5.6 9.4 5.6 2.7 3.8 4.2 6.7 2.7 6.2 6.03-year rolling average 8.6 8.7 6.9 5.9 4.0 3.6 4.9 4.5 5.2 5.0
5.6
9.4
5.6
2.7 3.8
4.2
6.7
2.7
6.2 6.0
8.6 8.76.9
5.94.0
3.6
4.9
4.55.2 5.0
0.0
2.0
4.0
6.0
8.0
10.0
12.0
0
3
6
9
12
15
Rate (Per 100,000 Workers)Number of
Workplace Fatal Injuries
12 The marine industry includes the following activities: • Shipbuilding and Ship Repair • Marine Surveying Services (other than classification societies) • Salvaging of distressed vessels and cargo Works carried out in the anchorage are also included.

10WORKPLACE SAFETY AND HEALTH REPORT, 2019
MANUFACTURING
The number of workplace fatal injuries in the Manufacturing industry remained unchanged at four fatal injuries, from 2018 to 2019. The workplace fatal injury rate in the Manufacturing industry increased from 0.9 per 100,000 workers in 2018 to 1.0 per 100,000 workers in 2019.
Figure 7: Number and rate of fatal injuries for Manufacturing industry, 2010-2019
2010 2011 2012 2013 2014 2015 2016 2017 2018 2019No. of Workplace Fatal Injuries 7 13 12 7 6 6 9 7 4 4Workplace Fatal Injury Rate 1.6 3.1 2.8 1.6 1.4 1.4 2.2 1.7 0.9 1.03-year rolling average 2.4 2.4 2.5 2.5 1.9 1.5 1.7 1.8 1.6 1.2
1.6
3.1
2.8
1.6
1.4 1.4
2.2
1.7
0.9 1.0
2.4 2.4
2.5 2.51.9
1.51.7
1.81.6
1.2
0.0
1.0
2.0
3.0
4.0
0
3
6
9
12
15
Rate (Per 100,000 Workers)Number ofWorkplace Fatal Injuries

WORKPLACE SAFETY AND HEALTH REPORT, 201911
TRANSPORTATION & STORAGE
The workplace fatal injury rate in the Transportation & Storage industry increased from 1.5 per 100,000 workers in 2018 to 3.1 per 100,000 workers in 2019. A total of eight workplace fatal injuries occurred in the Transportation & Storage industry in 2019.
Figure 8: Number and rate of fatal injuries for Transportation & Storage industry, 2010-2019
2010 2011 2012 2013 2014 2015 2016 2017 2018 2019No. of Workplace Fatal Injuries 4 10 7 11 12 15 11 7 4 8Workplace Fatal Injury Rate 2.0 4.8 3.2 4.9 5.1 6.3 4.6 2.9 1.5 3.13-year rolling average 2.2 2.8 3.3 4.3 4.4 5.4 5.3 4.6 3.0 2.5
2.0
4.8
3.2
4.95.1
6.3
4.6
2.9
1.5
3.1
2.2
2.8
3.3 4.3 4.4
5.4
5.3
4.6
3.0
2.5
0.0
2.0
4.0
6.0
8.0
0
3
6
9
12
15
18
Rate (Per 100,000 Workers)Number of
Workplace Fatal Injuries

12WORKPLACE SAFETY AND HEALTH REPORT, 2019
WORKPLACE MAJOR INJURIES
The number of workplace major injuries13 increased from 596 cases (17.4 per 100,000 workers) in 2018 to 629 cases (18.1 per 100,000 workers) in 2019.
Figure 9: Number and rate of workplace major injuries, 2011-2019
The Manufacturing industry was the top contributor in 2019 with 137 workplace major injuries followed by the Construction and Transportation & Storage industries with 121 and 57 workplace major injuries, respectively. These industries collectively accounted for 50% (315 cases) of all workplace major injuries in 2019.
Figure 10: Number of workplace major Injuries by industry, 2011-2019
13 Refer to Annex F for definition workplace major injury.
2011 2012 2013 2014 2015 2016 2017 2018 2019No. of Workplace Major Injuries 556 588 640 672 597 594 574 596 629Workplace Major Injury Rate 21.3 21.6 19.8 20.0 17.6 17.4 16.9 17.4 18.13-year rolling average 20.9 20.5 19.1 18.3 17.3 17.2 17.5
21.3 21.6
19.8 20.0
17.6 17.4 16.9
17.4 18.1
20.920.5
19.118.3
17.3
17.2 17.5
0.0
5.0
10.0
15.0
20.0
25.0
0
100
200
300
400
500
600
700
800
Rate (Per 100,000 WorkersNumber ofWorkplace Major Injuries
2011 2012 2013 2014 2015 2016 2017 2018 2019Manufacturing 118 140 140 140 126 125 124 123 137Construction 133 153 176 202 157 153 110 124 121Transportation & Storage 42 44 43 39 37 43 60 49 57Accommodation & Food Services 27 27 38 27 46 39 41 37 54Wholesale & Retail Trade 32 24 30 44 30 33 35 30 35Others 204 200 213 220 201 201 204 233 225
0
50
100
150
200
250
300
Number of Workplace Major Injuries
Construction
Wholesale & Retail Trade
Manufacturing
Others
Accommodation & Food ServicesTransportation & Storage

WORKPLACE SAFETY AND HEALTH REPORT, 201913
CAUSES OF WORKPLACE MAJOR INJURIES
In 2019, the top three causes of workplace major injuries were Slips, Trips and Falls, Machinery Incidents14 and Falls from Height. They collectively accounted for 57% (360 cases) of all workplace major injuries in 2019.
Figure 11: Number of workplace major Injuries by cause of injury, 2014-2019
14 Machinery-related Incidents includes Struck by Moving Objects, Caught In/Between Objects and Cut/Stabbed by Objects where the agent(s) is an industrial machine, industrial hand tool or other machines and tools.
2014 2015 2016 2017 2018 2019Slips, Trips & Falls 171 153 173 177 203 216Machinery Incidents 73 66 86 74 76 82Falls from Height 88 102 73 63 71 62Vehicular Incidents 86 51 50 41 46 41Others 254 225 212 219 200 228
0
50
100
150
200
250
300
Number of Workplace Major Injuries
Others
Slips, Trips & Falls
Vehicular Incidents
Falls from Height
Machinery Incidents

14WORKPLACE SAFETY AND HEALTH REPORT, 2019
WORKPLACE MAJOR INJURIES BY HIGH-RISK INDUSTRY
CONSTRUCTION
The workplace major injury rate in the Construction industry decreased from 27.8 per 100,000 workers in 2018 to 26.6 per 100,000 workers in 2019. A total of 121 workplace major injuries occurred in the Construction industry in 2019.
Figure 12: Number and rate of major injuries for Construction industry, 2011-2019
2011 2012 2013 2014 2015 2016 2017 2018 2019No. of Workplace Major Injuries 133 153 176 202 157 153 110 124 121Workplace Major Injury Rate 33.3 35.0 37.2 41.2 31.3 30.9 24.2 27.8 26.63-year rolling average 35.2 37.8 36.6 34.5 28.8 27.6 26.2
33.335.0
37.241.2
31.3 30.9
24.2
27.826.6
35.237.8
36.634.5
28.8
27.6 26.2
0.0
10.0
20.0
30.0
40.0
50.0
0
50
100
150
200
250
Rate (Per 100,000 Workers)Number ofWorkplace Major Injuries

WORKPLACE SAFETY AND HEALTH REPORT, 201915
MARINE
The workplace major injury rate in the Marine industry increased from 23.1 per 100,000 workers in 2018 to 28.5 per 100,000 workers in 2019. A total of 19 workplace major injuries occurred in the Marine industry in 2019.
Figure 13: Number and rate of major injuries for Marine industry, 2011-2019
2011 2012 2013 2014 2015 2016 2017 2018 2019No. of Workplace Major Injuries 27 31 39 29 32 33 22 15 19Workplace Major Injury Rate 25.4 29.1 35.4 27.3 32.9 37.0 29.6 23.1 28.53-year rolling average 30.0 29.3 31.8 32.4 33.1 29.9 27.1
25.4
29.1
35.4
27.3
32.9
37.0
29.623.1
28.530.0
29.3
31.8
32.4 33.1
29.9
27.1
0.0
10.0
20.0
30.0
40.0
0
10
20
30
40
Rate (Per 100,000 Workers)Number of
Workplace Major Injuries

16WORKPLACE SAFETY AND HEALTH REPORT, 2019
MANUFACTURING
The workplace major injury rate in the Manufacturing industry increased from 28.9 per 100,000 workers in 2018 to 32.7 per 100,000 workers in 2019. A total of 137 workplace major injuries occurred in the Manufacturing industry in 2019.
Figure 14: Number and rate of major injuries for Manufacturing industry, 2011-2019
2011 2012 2013 2014 2015 2016 2017 2018 2019No. of Workplace Major Injuries 118 140 140 140 126 125 124 123 137Workplace Major Injury Rate 28.2 32.7 32.6 32.5 29.9 30.2 29.9 28.9 32.73-year rolling average 31.2 31.5 31.7 30.9 30.0 29.7 30.5
28.2
32.7 32.6 32.5
29.9 30.2 29.9 28.9
32.7
31.2 31.5
31.7 30.930.0 29.7
30.5
0.0
10.0
20.0
30.0
40.0
0
30
60
90
120
150
Rate (Per 100,000 Workers)Number ofWorkplace Major Injuries

WORKPLACE SAFETY AND HEALTH REPORT, 201917
TRANSPORTATION & STORAGE
The workplace major injury rate in the Transportation & Storage industry increased from 18.9 per 100,000 workers in 2018 to 21.8 per 100,000 workers in 2019. A total of 57 workplace major injuries occurred in the Transportation & Storage industry in 2019.
Figure 15: Number and rate of major injuries for Transportation & Storage industry, 2011-2019
2011 2012 2013 2014 2015 2016 2017 2018 2019No. of Workplace Major Injuries 42 44 43 39 37 43 60 49 57Workplace Major Injury Rate 20.2 20.3 19.0 16.7 15.6 17.9 24.4 18.9 21.83-year rolling average 19.8 19.1 17.1 16.7 19.3 20.4 21.7
20.2 20.3
19.0
16.715.6
17.9
24.4
18.9
21.819.8
19.117.1
16.7
19.320.4
21.7
0.0
5.0
10.0
15.0
20.0
25.0
30.0
0
10
20
30
40
50
60
70
Rate (Per 100,000 Workers)Number of
Workplace Major Injuries

18WORKPLACE SAFETY AND HEALTH REPORT, 2019
Figure 16: Number and rate of workplace minor injuries, 2011-2019
WORKPLACE MINOR INJURIES
The number of workplace minor injuries increased by 8% from 12,173 cases (355 per 100,000 workers) in 2018 to 13,111 cases (377 per 100,000 workers) in 2019.
The Manufacturing industry was the top contributor in 2019 with 2,653 workplace minor injuries followed by the Construction and Accommodation & Food Services industries with 1,981 and 1,265 workplace minor injuries, respectively. These industries collectively accounted for 45% (5,899 cases) of all workplace minor injuries in 2019.
Figure 17: Number of workplace minor Injuries by industry, 2011-2019
2011 2012 2013 2014 2015 2016 2017 2018 2019No. of Workplace Minor Injuries 9,504 10,469 11,740 12,863 11,688 12,354 11,882 12,173 13,111Workplace Minor Injury Rate 364 384 362 383 344 363 351 355 3773-year rolling average 370 376 363 363 353 356 361
364384
362
383
344363
351 355
377370
376
363 363 353 356
361
0
50
100
150
200
250
300
350
400
450
0
2,000
4,000
6,000
8,000
10,000
12,000
14,000
Rate (Per 100,000 Workers)Number ofWorkplace Minor Injuries
2011 2012 2013 2014 2015 2016 2017 2018 2019Manufacturing 2,153 2,550 2,697 2,992 2,556 2,605 2,413 2,473 2,653Construction 1,718 1,928 2,468 2,686 2,076 2,132 1,774 1,656 1,981Accomodation & Food Services 795 852 878 920 923 1,072 1,118 1,159 1,265Transportation & Storage 720 742 847 1,062 1,051 1,090 1,025 1,038 1,064Wholesale & Retail Trade 527 541 577 631 594 608 580 707 723Others 3,591 3,856 4,273 4,572 4,488 4,847 4,972 5,140 5,425
0
1,000
2,000
3,000
4,000
5,000
6,000
Number of Workplace Minor Injuries
Construction
Wholesale & Retail Trade
Manufacturing
Others
Accomodation & Food ServicesTransportation & Storage

WORKPLACE SAFETY AND HEALTH REPORT, 201919
CAUSES OF WORKPLACE MINOR INJURIES
In 2019, the top three causes of workplace minor injuries were Slips, Trips and Falls, Machinery Incidents and Struck by Moving Objects. They collectively accounted for 54% (7,045 cases) of all workplace minor injuries in 2019.
Figure 18: Number of workplace minor Injuries by cause of injury, 2014-2019
2014 2015 2016 2017 2018 2019Slips, Trips & Falls 2,962 2,863 3,315 3,323 3,407 3,694Machinery Incidents 2,228 2,083 2,172 2,025 2,051 2,178Struck by Moving Objects 897 882 971 938 1,114 1,173Struck by Falling Objects 1,326 1,205 1,138 996 1,016 1,081Others 5,450 4,655 4,758 4,600 4,582 4,985
0
1,000
2,000
3,000
4,000
5,000
6,000
Number of Workplace Minor Injuries
Others
Slips, Trips & Falls
Struck by Moving Objects
Struck by Falling Objects
Machinery Incidents

20WORKPLACE SAFETY AND HEALTH REPORT, 2019
DANGEROUS OCCURRENCES
The number of DOs decreased by 9% from 23 in 2018 to 21 in 2019. Among the DO cases, 13 were due to Collapse/Failure of Structures & Equipment of which eight cases were Crane-related. The eight remaining DO cases were due to Fires and Explosion.
Figure 19: Number of dangerous occurrences, 2011-2019
2011 2012 2013 2014 2015 2016 2017 2018 2019No. of Dangerous Occurrences 34 25 35 27 46 45 35 23 21
0
5
10
15
20
25
30
35
40
45
50
Number of Dangerous Occurrences
DANGEROUS OCCURRENCES BY INDUSTRY
The Construction industry was the top contributor in 2019 with 10 cases followed by the Marine and Manufacturing industries with 4 and 3 cases, respectively. These industries collectively accounted for 81% (17 cases) of all DO in 2019.
Figure 20: Number of dangerous occurrences by industry, 2012-2019
2012 2013 2014 2015 2016 2017 2018 2019Construction 14 21 12 23 22 16 10 10Marine 1 3 3 1 3 0 1 4Manufacturing 4 4 8 12 11 10 5 3Transportation & Storage 2 2 2 2 2 3 1 1Others 4 5 2 8 7 6 6 3
0
5
10
15
20
25
30
Number of Dangerous Occurences
Construction
Manufacturing
Others
Marine
Transportation & Storage

WORKPLACE SAFETY AND HEALTH REPORT, 201921
OCCUPATIONAL DISEASES
The number of OD cases decreased by 8% from 563 in 2018 to 517 in 2019. Likewise, the OD incidence rate decreased from 16.4 confirmed cases per 100,000 workers in 2018 to 14.9 confirmed cases per 100,000 workers in 2019.
Figure 21: Number and rate of occupational diseases, 2010-2019
2010 2011 2012 2013 2014 2015 2016 2017 2018 2019OD Cases Confirmed 432 839 987 887 992 935 732 799 563 517OD Incidence 17.2 32.1 36.2 27.4 29.5 27.5 21.5 23.6 16.4 14.93-year rolling average 24.2 22.9 28.5 31.9 31.0 28.1 26.2 24.2 20.5 18.3
17.2
32.1
36.2
27.429.5
27.5
21.523.6
16.414.9
24.222.9
28.5
31.931.0
28.126.2
24.2
20.5
18.3
0.0
5.0
10.0
15.0
20.0
25.0
30.0
35.0
40.0
0
200
400
600
800
1000
1200
Rate (Per 100,000 Workers)Number of Confirmed OD Cases
OCCUPATIONAL DISEASES BY INDUSTRY
The Manufacturing industry was the top contributor in 2019 with 154 OD cases confirmed followed by the Transportation & Storage industry and the Construction industry with 62 and 53 OD cases, respectively. These industries collectively accounted for 52% (269 cases) of all OD cases confirmed in 2019.
2013 2014 2015 2016 2017 2018 2019Manufacturing 331 356 312 260 294 169 154Transportation & Storage 59 75 97 80 85 55 62Construction 96 140 145 93 123 55 53Marine 129 151 125 53 49 35 13Others 272 270 256 246 248 249 235
0
50
100
150
200
250
300
350
400
Number of Occupational Diseases
Construction
Manufacturing
Others
Marine
Transportation & Storage
Figure 22: Number of occupational diseases by industry, 2013-2019

22WORKPLACE SAFETY AND HEALTH REPORT, 2019
Figure 23: Number of occupational disease by type, 2010-2019
TYPES OF OCCUPATIONAL DISEASES
In 2019, the top three types of OD cases confirmed were WRMSD15, NID and Occupational Skin Diseases (OSD). They collectively accounted for 97% (501 cases) of all OD cases confirmed in 2019.
15 Back injuries due to ergonomic risks were considered as a WRMSD cases and included as an occupational disease since 2013.
2010 2011 2012 2013 2014 2015 2016 2017 2018 2019Work Related Musculoskeletal Disorder 4 6 18 237 315 304 316 337 326 293Noise-Induced Deafness 364 741 869 564 594 498 322 329 163 169Occupational Skin Diseases 43 52 57 56 54 89 47 78 48 39Others 21 40 43 30 29 44 47 55 26 16
0
200
400
600
800
1000
Number of Confirmed OD Cases
Others
Noise-Induced Deafness
Work Related Musculoskeletal Disorder
Occupational Skin Diseases

WORKPLACE SAFETY AND HEALTH REPORT, 201923
WORK-RELATED MUSCULOSKELETAL DISORDERS
WRMSD cases reduced from 326 cases in 2018 to 293 cases in 2019. The Manufacturing and Transportation & Storage industries were the highest contributors, with each having 41 cases, or 14% of all WRMSD. This is followed by the Health Activities industry, which contributed 12% (35 cases) of all WRMSD cases in 2019.
Figure 24: Number and rate of work-related musculoskeletal disorders, 2013-2019
Figure 25: Number and rate of noise-induced deafness, 2010-2019
NOISE-INDUCED DEAFNESS
NID cases increased from 163 cases in 2018 to 169 cases in 2019. The Manufacturing industry continued to be the top contributor to NID cases, accounting for 60% (101 cases) of all NID cases. This is followed by the Construction industry and the Transportation & Storage industry with 18 (11%) and 17 (10%) cases, respectively.
2013 2014 2015 2016 2017 2018 2019Number of WRMSD Cases 237 315 304 316 337 326 293WRMSD Incidence Rate 7.3 9.4 9.0 9.3 9.9 9.5 8.43-year rolling average 8.6 9.2 9.4 9.6 9.3
7.3
9.49.0
9.39.9
9.5
8.48.69.2 9.4
9.6 9.3
0.0
2.0
4.0
6.0
8.0
10.0
12.0
0
50
100
150
200
250
300
350
400
Rate (Per 100,000 Workers)
Number of WRMSD Cases
2010 2011 2012 2013 2014 2015 2016 2017 2018 2019Number of Confirmed NID Cases 364 741 869 564 594 498 322 329 163 169NID Incidence rate 14.5 28.4 31.9 17.4 17.7 14.7 9.5 9.7 4.8 4.93-year rolling average 20.5 19.5 24.9 25.9 22.3 16.6 14.0 11.3 8.0 6.5
14.5
28.4
31.9
17.4 17.7
14.7
9.5 9.7
4.8 4.9
20.5
19.5
24.9
25.9
22.3
16.6
14.0
11.3
8.06.5
0.0
5.0
10.0
15.0
20.0
25.0
30.0
35.0
0
100
200
300
400
500
600
700
800
900
1000
Rate (Per 100,000 Workers)Number of Confirmed NID Cases

24WORKPLACE SAFETY AND HEALTH REPORT, 2019
WORK INJURY COMPENSATION
Table 3: Number of TI and PI workplace injuries compensation claims and amount awarded, 2017-2019
Year No. of Cases MC Wages ($million) No. of Cases MC Wages
($million)PI Compensation
($million)
2017 10,354 $8.80 4,513 $14.15 $74.35
2018 10,170 $9.48 4,304 $12.41 $73.88
2019 11,496 $11.22 4,370 $14.92 $76.26
Temporary Incapacity Permanent Incapacity
Table 4: Number of Fatal and Total workplace injuries compensation claims and amount awarded, 2017-2019
Year No. of Cases Death Compensation ($million) No. of Cases MC Wages
($million)
PI/Death Compensation
($million)
2017 149 $20.58 15,016 $22.95 $94.93
2018 111 $15.96 14,585 $21.89 $89.84
2019 126 $17.62 15,992 $26.14 $93.88
Fatal Total
The Work Injury Compensation Act (WICA) lets employees make claims for work-related injuries or diseases with-out having to file a civil suit under common law. It is a low-cost and quicker alternative to common law for settling compensation claims.
NUMBER OF WORK INJURY CLAIMS AND PAYOUT AMOUNT
The total number of work injury claims16 increased 10% from 14,585 cases in 2018 to 15,992 cases in 2019. Corre-spondingy, the total compensation payout increased 7% from $111.73 million in 2018 to $120.02 million in 2019. These increases were seen across the board for Temporary Incapacity (TI)17, Permanent Incapacity (PI)18 and Fatal claims.
.
17 Temporary incapacity claims arise from non-permanent work injuries where an injured employee is temporarily unable to perform work and earn his usual wages after being placed on medical leave.18 Permanent incapacity claims arise from injuries which cause permanent injuries or loss of bodily functions to an injured employee.
16 Work injury compensation data excludes cases that were withdrawn, cases with No-Further-Action required and cases that were not admitted under WICA.

WORKPLACE SAFETY AND HEALTH REPORT, 201925
Proactive surveillance of high risk workplaces enables preventive measures to be taken early. The Business Under Surveillance (BUS) programme focuses on improvement of WSH management systems.
BUSINESS UNDER SURVEILLANCE
More than 300 companies have been placed under the programme since inception in 2007. Companies on the BUS programme include those with serious accidents, and those which were issued with Stop Work Orders (SWO) for poor WSH management or which have accumulated a substantial number of demerit points. Companies exit the programme when their WSH standards have improved to a level where they can effectively manage their WSH risks.
In 2019, 20 companies entered the BUS programme. They were all from the Construction industry. For the seven companies which exited the programme in 2019, they were under surveillance for an average of 20 months.
Figure 26: Number of companies entering and exiting surveillance, 2012-2019
BUSINESS UNDER SURVEILLANCE
2012 2013 2014 2015 2016 2017 2018 2019Number of companies entering Surveillance 22 15 19 14 28 10 28 20Number of companies exiting Surveillance 21 30 13 16 12 23 14 7
0
5
10
15
20
25
30
35

26WORKPLACE SAFETY AND HEALTH REPORT, 2019
Hygiene and Medical surveillance programmes monitor workers’ exposure and health effects from exposure to the list of hazards under the Workplace Safety and Health (General Provisions) Regulations, Workplace Safety and Health (Noise) Regulations and the Workplace Safety and Health (Medical Examinations) Regulations.
MEDICAL SURVEILLANCE
Workplaces with hazards listed in the Schedule of the WSH (Medical Examinations) Regulations are required to send their exposed workers for pre-placement and periodic medical examinations.
There was an increase in the number of workers under surveillance from 121,219 in 2018 to 133,740 in 2019. Similarly, the numbers of workplaces under medical surveillance increased from 2,137 in 2018 to 2,156 in 2019.
Figure 27: Number of workers under medical surveillance, 2010-2019
Figure 28: Number of workplaces under medical surveillance, 2010-2019
MEDICAL AND HYGIENE SURVEILLANCE
2010 2011 2012 2013 2014 2015 2016 2017 2018 2019Number of Workers
Examined 100,054 112,835 112,487 129,122 139,685 134,963 120,999 124,101 121,219 133,740
0
20,000
40,000
60,000
80,000
100,000
120,000
140,000
160,000
2010 2011 2012 2013 2014 2015 2016 2017 2018 2019Number of Workplaces
Examined 1,794 1,943 1,892 2,099 2,217 2,138 2,211 2,147 2,137 2,156
0
500
1,000
1,500
2,000
2,500

WORKPLACE SAFETY AND HEALTH REPORT, 201927
Figure 29: Medical monitoring for noise exposure by Top 5 industries, 2019
Figure 30: Medical monitoring for chemical exposure by Top 5 industries, 2019
0% 10% 20% 30% 40% 50% 60% 70% 80% 90% 100%
All Sectors (109,724)
Metalworking (32,154)
Manufacture of Other Transport Equipment (14,812)
Marine (13,001)
Logistics and Transport (7,548)
Manufacture of Petrochemical Pdts (7,978)
% of workers examined
Indu
stry
(No.
of w
orke
rs e
xam
ined
)
Normal Results Abnormal Results - Non Work-related Abnormal Results - Work-related
0% 10% 20% 30% 40% 50% 60% 70% 80% 90% 100%
All Sectors (24,016)
Construction (503)
Logistics and Transport (188)
Marine (368)
Administrative and Support Service Activities (2,073)
Logistics and Transport (671)
% of workers examined
Indu
stry
(No.
of w
orke
rs e
xam
ined
)
Normal Results Abnormal Results - Non Work-related Abnormal Results - Work-related

28WORKPLACE SAFETY AND HEALTH REPORT, 2019
HYGIENE SURVEILLANCE
Workplaces where persons are likely to be exposed to excessive noise or toxic substances are required to conduct regular hygiene monitoring to measure their workers' exposure to noise and chemicals under the WSH (Noise) Regulations and the WSH (General Provisions) Regulations respectively.
NOISE EXPOSURE LEVELS
Based on the noise monitoring results submitted over the past three years, 80% of the workplaces had noisy processes exceeding 85dBA. 79% of the workplaces that conducted personal exposure monitoring had workers who were exposed to excessive noise (above an equivalent sound pressure level of 85dBA over an eight-hour workday).
Workplaces with noisy processes or workers who are exposed to excessive noise will need to implement additional control measures to reduce or control the noise generated from machinery or equipment so as to reduce workers' exposure to below the permissible limits as stipulated in the Schedule of the WSH (Noise) Regulations.
Figure 31: Static noise monitoring results by industry, 2017-2019
Figure 32: Personal noise exposure results by industry, 2017-2019
0% 25% 50% 75% 100%
All Sectors (675)Manufacture of Pharmaceutical and Biological Pdts (16)
Water Supply, Sewerage, Waste Mgmt and Remediation Activities (13)Manufacture of Other Transport Equipment (23)
Marine (32)Manufacture of Petrochemical Pdts (66)
Transportation & Storage (27)Manufacture of Food, Beverages & Tobacco (23)
Metalworking (233)Electricity, Gas & Air Conditioning Supply (4)
Manufacture of Computer, Electronic and Optical Pdts (37)Other Manufacturing (33)
Manufacture of Paper Pdts & Printing (17)Professional, Scientific and Technical Activities (13)
Manufacture of Rubber and Plastic Pdts (54)Manufacture of Other Non-metallic Mineral Pdts (56)
Construction (6)Other Sectors (22)
Indu
stry
(N
o. o
f wor
kpla
ces -
Stat
ic N
oise
)
< 85 dBA ≥ 85 dBA - < 90 dBA ≥ 90 dBA - < 95 dBA > =95 dBA
% Workplaces Monitored
0% 25% 50% 75% 100%
All Sectors (650)Manufacture of Other Transport Equipment (23)Manufacture of Food, Beverages & Tobacco (21)
Construction (17)Transportation & Storage (25)
Metalworking (220)Marine (30)
Manufacture of Petrochemical Pdts (66)Other Manufacturing (32)
Water Supply, Sewerage, Waste Mgmt and Remediation Activities (13)Manufacture of Paper Pdts & Printing (15)
Professional, Scientific and Technical Activities (11)Manufacture of Computer, Electronic and Optical Pdts (37)
Manufacture of Other Non-metallic Mineral Pdts (47)Manufacture of Rubber and Plastic Pdts (49)
Manufacture of Pharmaceutical and Biological Pdts (15)Other Sectors (29)
Indu
stry
(N
o. o
f wor
kpla
ces
-Per
sona
l Noi
se)
< 85 dBA ≥ 85 dBA - < 90 dBA ≥ 90 dBA - < 95 dBA > =95 dBA% Workplaces Monitored

WORKPLACE SAFETY AND HEALTH REPORT, 201929
CHEMICAL EXPOSURE LEVELS
A total of 1,405 chemical monitoring results were received in 2019, of which 21% of the results were from the Manufacture of Petrochemical Products industry and 9% from the Metalworking industry. Workplaces with chemical exposure levels higher than permissible exposure level (PEL19) will require implementation of additional engineering control measures to eliminate or reduce workers' exposure to below the PEL.
Figure 33: Chemical exposure results by industry, 2019
0% 25% 50% 75% 100%
All Sectors (1,405)
Manufacture of Computer, Electronic and Optical Pdts (65)
Wholesale and Retail Trade (81)
Manufacture of Petrochemical Pdts (297)
Other Manufacturing (53)
Manufacture of Pharmaceutical and Biological Pdts (49)
Construction (20)
Metalworking (125)
Water Supply, Sewerage, Waste Mgmt and Remediation Activities (23)
Manufacture of Food, Beverages & Tobacco (7)
Manufacture of Other Non-metallic Mineral Pdts (12)
Manufacture of Rubber and Plastic Pdts (14)
Manufacture of Other Transport Equipment (14)
Marine (11)
Logistics and Transport (81)
Repair and Maintenance of Vehicles (10)
Other Sectors (543)
Indu
stry
(No.
of c
hem
ical
mon
itorin
g re
sults
)
< 10% PEL ≥ 10% - <50% PEL ≥ 50% PEL - < 100% PEL ≥ 100% PEL
% Chemical Monitoring results
19 Permissible Exposure Level (PEL) refer to the maximum time weighted average concentration of a toxic substance to which any person may be exposed.

30WORKPLACE SAFETY AND HEALTH REPORT, 2019
All Industries 41 39
Construction 14 13
Marine 4 4
Manufacturing 4 4
Metalworking 1 3
Manufacture of Petrolchemical Products 0 1
Manufacture of Computer, Electronic and Optical Products 1 0
Manufacture of Food Products 1 0
Manufacture of Other Non-metallic Mineral Products 1 0
Electricity, Gas, & Air Conditioning Supply 1 1
Water Supply, Sewerage & Waste Management and Remediation Activities
1 1
Wholesale & Retail Trade 6 2
Wholesale Trade 5 2
Retail Trade 1 0
Transportation & Storage 4 8
Logistics & Transport 3 3
Food & Beverage Service Activities 0 2
Rental & Leasing Activities 1 2
Real Estate Services 4 1
Social Services 0 1
Telecommunications 1 0
Cleaning & Landscape Maintenance Activities 1 0
Table 5: Number of workplace fatal injuries by industry, 2018 and 2019
20192018Industry
ANNEX ASTATISTICAL TABLES

WORKPLACE SAFETY AND HEALTH REPORT, 201931
All Industries 1.2 1.1
Construction 3.1 2.9
Marine 6.2 6.0
Manufacturing 0.9 1.0
Metalworking 0.9 2.8
Manufacture of Petrolchemical Products 0.0 1.9
Manufacture of Computer, Electronic and Optical Products 1.1 0.0
Manufacture of Food Products 2.1 0.0
Manufacture of Other Non-metallic Mineral Products 23.8 0.0
Electricity, Gas & Air Conditioning Supply n.a. n.a.
Water Supply, Sewerage & Waste Management and Remediation Activities
6.1 6.0
Wholesale & Retail Trade 1.2 0.4
Wholesale Trade 1.5 0.6
Retail Trade 0.6 0.0
Transportation & Storage 1.5 3.1
Logistics & Transport 2.9 2.9
Food & Beverage Service Activities 0.0 0.9
Rental & Leasing Activities n.a. n.a.
Real Estate Services 4.6 1.2
Social Services n.a. n.a.
Telecommunications n.a. n.a.
Cleaning & Landscape Maintenance Activities 1.3 0.0
Table 6: Workplace fatal injury rates by industry, 2018 and 2019Per 100,000 employed persons
2018Industry 2019

32WORKPLACE SAFETY AND HEALTH REPORT, 2019
Total Workplace Fatal Injuries 41 39
Falls Total 15 10
Falls from Height Total 8 7
Physical Workplace - Structures 4 4
Means of Access - Ladders 1 1
Means of Access - Others 0 1
Other Incident Agents 0 1
Means of Access - Scaffold 1 0
Physical Workplace - Roofs 2 0
Slips, Trips & Falls Total 7 3
Physical Workplace - Floor/Level Surfaces 5 2
Goods / Cargo 0 1
Vehicles 1 0
Means of Access - Others 1 0
Struck by Moving Objects
Total 5 9
Work-related Traffic 2 4
Vehicles 0 3
Other Incident Agents 1 1
Lifting Equipment - Lifting Appliances / Gears 0 1
Material & Substances - Metal Items 1 0
Physical Workplace - Formwork 1 0
Collapse/Failure of Structure & Equipment
Total 4 7
Physical Workplace - Structures 2 3
Goods / Cargo 2 1
Lifting Equipment - Cranes 0 1
Lifting Equipment - Mobile Work Platform 0 1
Means of Access - Scaffold 0 1
Caught in/between Objects
Total 7 4
Industrial Machines 1 2
Lifting Equipment - Lifts & Hoists 1 1
Other Incident Agents 0 1
Vehicles 5 0
Drowning Total 2 3
Struck by Falling Objects From Heights
Total 1 2
Material & Substances - Metal Items 0 2Other Incident Agents 1 0
Table 7: Number of workplace fatal injuries by incident type and incident agent, 2018 and 2019
2018Incident Type Incident Agent 2019

WORKPLACE SAFETY AND HEALTH REPORT, 201933
Total Workplace Fatal Injuries 41 39
Electrocution Total 2 1
Electrical Equipment 2 1
Crane-related Total 1 1
Lifting Equipment - Cranes 0 1
Lifting Equipment - Mobile Work Platform 1 0
Fires and Explosion
Total 0 1
Pressurised Equipment 0 1
Exposure to/Contact With Extreme Temperature (Heat / Cold)
Total 0 1
Material & Substances - Hot Scalding Liquid / Steam 0 1
Cave-In of Excavation, Tunnel, Etc
Total 2 0
Other Incident Agents 2 0
Collapse of Formwork/ Failure of its Supports
Total 1 0
Suffocation Total 1 0
Dust, Gas, Liquids & Chemicals 1 0
(continued) Table 7: Number of workplace fatal injuries by incident type and incident agent, 2018 and 2019
2018Incident Type Incident Agent 2019

34WORKPLACE SAFETY AND HEALTH REPORT, 2019
Table 8: Number of workplace fatal injuries by industry and incident type, 2019In
dust
ry
All
Cons
truc
tion
Mar
ine
Man
ufac
turin
g
Elec
tric
ity, G
as &
Air
Cond
ition
ing
Sup
ply
Wat
er S
uppl
y, Se
wer
age
&
Was
te M
anag
emen
t and
Re
med
iatio
n Ac
tiviti
es
Who
lesa
le &
Ret
ail T
rade
Total 39 13 4 4 1 1 2
Falls 10 2 1 2 0 0 0
Falls from Height 7 3 1 1 0 0 0
Slips, Trips & Falls 3 0 0 1 0 0 0
Struck by Moving Objects
9 1 1 0 0 1 1
Collapse/Failure of Structure & Equipment
7 4 1 0 0 0 0
Caught in/between Objects
4 2 0 1 0 0 0
Drowning 3 0 1 0 0 0 0
Struck by Falling Objects From Heights
2 2 0 0 0 0 0
Electrocution 1 0 0 1 0 0 0
Crane-related 1 1 0 0 0 0 0
Fires and Explosion 1 0 0 0 1 0 0
Exposure to/Contact With Extreme Temperature (Heat / Cold)
1 0 0 0 0 0 1

WORKPLACE SAFETY AND HEALTH REPORT, 201935
(continued) Table 8: Number of workplace fatal injuries by industry and incident type, 2018In
dust
ry
Tran
spor
tatio
n &
Stor
age
Food
& B
ever
age
Serv
ice
Activ
ities
Rent
al &
Lea
sing
Activ
ities
Real
Est
ate
Serv
ices
Soci
al S
ervi
ces
Total 8 2 2 1 1
Falls 1 2 0 0 1
Falls from Height 1 1 0 0 0
Slips, Trips & Falls 0 1 0 0 1
Struck by Moving Objects
4 0 1 0 0
Collapse/Failure of Structure & Equipment
1 0 1 0 0
Caught in/between Objects
0 0 0 1 0
Drowning 2 0 0 0 0
Struck by Falling Objects From Heights
0 0 0 0 0
Electrocution 0 0 0 0 0
Crane-related 0 0 0 0 0
Fires and Explosion 0 0 0 0 0
Exposure to/Contact With Extreme Temperature (Heat / Cold)
0 0 0 0 0

36WORKPLACE SAFETY AND HEALTH REPORT, 2019
Table 9: Number of workplace major injuries by industry, 2018 and 2019
2018Industry 2019
All Industries 596 629
Construction 124 121
Marine 15 19
Manufacturing 123 137
Metalworking 35 42
Manufacture of Food, Beverages & Tobacco 29 24
Manufacture of Paper/ Rubber/ Plastic Products & Printing 13 12
Manufacture of Petrochemical 14 10
Water Supply, Sewerage & Waste Management and Remediation Activities
6 5
Wholesale & Retail Trade 30 35
Wholesale Trade 15 15
Retail Trade 15 20
Transportation & Storage 49 57
Logistics & Transport 33 38
Accommodation & Food Service Activities 37 54
Accommodation 7 12
Food & Beverage Service Activities 30 42
Financial & Insurance Activities 12 5
Real Estate Activities 15 15
Professional, Scientific & Technical Activities 13 12
Administrative & Support Service Activities 25 30
Cleaning and Landscape Maintenance Activities 7 10
Security and Investigation Activities 7 9
Community, Social & Personal Services 59 61
Health Activities 11 15
Education 14 11
Repair & Maintenance of Vehicles 10 6

WORKPLACE SAFETY AND HEALTH REPORT, 201937
Table 10: Workplace major injury rates by industry, 2018 and 2019
2018Industry 2019Per 100,000 employed persons
All Industries 17.4 18.1
Construction 27.8 26.6
Marine 23.1 28.5
Manufacturing 28.9 32.7
Metalworking 31.6 39.5
Manufacture of Food, Beverages & Tobacco 57.0 45.8
Manufacture of Paper/ Rubber/ Plastic Products & Printing 43.5 41.8
Manufacture of Petrochemical 25.9 18.9
Water Supply, Sewerage & Waste Management and Remediation Activities
36.4 30.1
Wholesale & Retail Trade 6.1 7.2
Wholesale Trade 4.6 4.6
Retail Trade 9.2 12.5
Transportation & Storage 18.9 21.8
Logistics & Transport 31.4 36.3
Accommodation & Food Service Activities 14.6 20.6
Accommodation 20.1 32.7
Food & Beverage Service Activities 13.7 18.6
Financial & Insurance Activities 6.1 2.5
Real Estate Activities 17.3 17.9
Professional, Scientific & Technical Activities 5.3 4.7
Administrative & Support Service Activities 10.3 11.9
Cleaning and Landscape Maintenance Activities 9.2 14.8
Security and Investigation Activities 14.5 18.1
Community, Social & Personal Services 7.1 7.2
Health Activities* 9.9 13.1
Education n.a. n.a.
Repair & Maintenance of Vehicles* n.a. n.a

38WORKPLACE SAFETY AND HEALTH REPORT, 2019
Table 11: Types of workplace major injuries, 2018 and 2019
2018Workplace Major Injury Types 2019
Total 596 629
Crushing, Fractures and Dislocations 358 368
Amputations 106 132
Burns, with more than 20 MC days 66 55
Multiple Injuries 38 38
Concussion, with more than 20 MC days 15 13
Exposure to/ contact with Electric Current 10 18
Blindness 1 3
Exposure to Biological Materials 0 1
Mosquito Borne 0 1
Paralysis 1 1
Deafness 1 0

WORKPLACE SAFETY AND HEALTH REPORT, 201939
Table 12: Number of workplace major injuries by key incident type and key incident agent, 2018 and 2019
2018Incident Type Incident Agent 2019
Total Workplace Major Injuries 596 629
Falls Total 274 278
Slips, Trips & Falls Total 203 216
Physical Workplace - Floor/Level Surfaces 84 113
Means of Access - Stairs or Steps 33 29
Vehicles 30 25
Falls from Height Total 71 62
Means of Access - Ladders 45 29
Physical Workplace - Structure 4 15
Means of Access - Scaffold 6 7
Struck by Moving Objects
Total 76 102
Vehicles 16 22
Work-related Traffic 25 17
Metal Items (excluding knives/needles) 2 14
Industrial Machines 10 13
Caught in/between Objects
Total 50 59
Industrial Machines 26 24
Metal Items (excluding knives/needles) 9 13
Vehicles 5 2
Exposure to/contact with Extreme Temperatures
Total 43 34
Hot scalding liquid/Steam 36 31
Industrial Machines 2 1
Struck by Falling Objects
Total 45 34
Metal Items (excluding knives/needles) 16 8
Wooden Items 0 6
Goods/Cargo 5 4
Cut/Stabbed by Objects
Total 33 30
Industrial Machines 27 22
Industrial Hand Tools 5 5
Knives and Needles 1 3
Exposure to Electric Current
Total 13 23
Electric Equipment 11 11
Industrial Machines 1 8
Over-exertion/ Strenuous Movements
Total 16 21
Human Factors 3 10
Goods/Cargo 6 8

40WORKPLACE SAFETY AND HEALTH REPORT, 2019
All Industriess STF SBMO FFH
Construction STF FFH SBMO
Marine CIBO FFH, STF SBMO
Manufacturing STF CIBO SBMO
Metalworking CIBO SBMO STF
Manufacture of Food, Beverages & Tobacco STF SBMO CSBO
Manufacture of Paper/ Rubber/ Plastic Products & Printing
STF CIBO CSBO, SAO, SBFO
Manufacture of Petrochemical STF ETHS ETET, FFH, FE, OESM, SBMO
Water Supply, Sewerage & Waste Management and Remediation Activities
STF CIBO, ETBM, ETHS -
Wholesale & Retail Trade STF OESM SBMO
Wholesale Trade STF OESM, SBMO CSBO, ETET, FFH, SAO
Retail Trade STF OESM CSBO, ETET
Transportation & Storage STF SBMO SAO
Logistics & Transport STF SBMO FFH, SAO, SBFO
Accommodation & Food Service Activities STF ETET SBMO
Accommodation STF ETEC, ETET, FFH -
Food & Beverage Service Activities ETET, STF SBMO FE
Financial & Insurance Activities STF ETET, SBFO, SBMO -
Real Estate Activities STF ETET ETEC
Professional, Scientific & Technical Activities FFH, STF CIBO, CFOS, CSBO, OESM, SBFO, SBMO
-
Administrative & Support Service Activities STF SBMO FFH
Cleaning and Landscape Maintenance Activities STF CIBO, SAO, SBFO -
Security and Investigation Activities STF CIBO, SBMO -
Community, Social & Personal Services STF SBMO FFH, OESM, SAO
Education STF SAO, SBMO FFH
Health Activities STF OESM CIBO, CSBO, OTH
Repair & Maintenance of Vehicles SBMO CSBO, STF -
Table 13: Top 3 incident types for workplace major injuries by industry, 2019
Industry
Legend:
CIBO Caught In/Between Objects
CSBO Cut/Stabbed by Objects
CFOS Collapse/Failure of Structures
ETEC Exposure to/ Contact with Electric
Current
ETET Exposure to/ Contact with Extreme
Temperature
ETBM Exposure to/ contact with Biological
Materials
ETHS Exposure to/ Contact with Hazardous
Substances
FE Fires & Explosion
FFH Falls from Height
OESM Over-exertion and Strenuous
Movements
OTH Other Incident TypesSAO
Strike Against Objects
SBFO Struck by Falling Objects
SBMO Struck by Moving Objects
STF Slips, Trips and Falls
1st 2nd 3rd
Top 3 Incident Types

WORKPLACE SAFETY AND HEALTH REPORT, 201941
2018Industry 2019
Table 14: Number of workplace minor injuries by industry, 2018 and 2019
All Industries 12,173 13,111
Construction 1,656 1,981
Marine 252 330
Manufacturing 2,473 2,653
Metalworking 985 1,089
Manufacture of Food, Beverages & Tobacco 497 535
Manufacture of Paper/ Rubber/ Plastic/ Products & Printing 188 186
Water Supply, Sewerage & Waste Management and Remediation Activities
111 125
Wholesale & Retail Trade 707 723
Wholesale Trade 351 352
Retail Trade 356 371
Transportation & Storage 1,038 1,064
Logistics & Transport 780 819
Accommodation & Food Service Activities 1,159 1,265
Accommodation 257 273
Food & Beverage Service Activities 902 992
Financial & Insurance Activities 163 200
Real Estate Activities 402 455
Professional, Scientific & Technical Activities 427 442
Legal, Accounting & Management Activities 171 186
Architectural & Engineering Activities 195 185
Administrative & Support Service Activities 580 715
Cleaning & Landscape Maintenance Activities 210 281
Office Administrative, Office Support & Other Business Support Activities 186 205
Security and Investigation Activities 140 182
Community, Social & Personal Services 1,339 1,539
Health Activities 481 567
Education 275 310
Other Personal Service Activities 166 180
Arts, Entertainment and Recreation 137 143
Repair & Maintenance of Vehicles 109 117

42WORKPLACE SAFETY AND HEALTH REPORT, 2019
Table 15: Workplace minor injury rates by industry, 2018 and 2019 Per 100,000 employed persons
2018Industry 2019
All Industries 355 377
Construction 371 436
Marine 389 495
Manufacturing 581 634
Metalworking 891 1,023
Manufacture of Food, Beverages & Tobacco 976 1,021
Manufacture of Paper/ Rubber/ Plastic/ Products & Printing 629 648
Water Supply, Sewerage & Waste Management and Remediation Activities
673 753
Wholesale & Retail Trade 145 149
Wholesale Trade 108 109
Retail Trade 218 231
Transportation & Storage 401 407
Logistics & Transport 741 782
Accommodation & Food Service Activities 456 482
Accommodation 739 744
Food & Beverage Service Activities 411 439
Financial & Insurance Activities 83 100
Real Estate Activities 465 543
Professional, Scientific & Technical Activities 175 175
Legal, Accounting & Management Activities 136 140
Architectural & Engineering Activities 324 303
Administrative & Support Service Activities 239 283
Cleaning & Landscape Maintenance Activities 277 353
Office Administrative, Office Support & Other Business Support Activities n.a. n.a.
Security and Investigation Activities 290 367
Community, Social & Personal Services 161 181
Health Activities* 432 494
Education n.a. n.a.
Other Personal Service Activities n.a. n.a.
Arts, Entertainment and Recreation 241 249
Repair & Maintenance of Vehicles* n.a. n.a.

WORKPLACE SAFETY AND HEALTH REPORT, 201943
Total Workplace Minor Injuries 12,173 13,111
Falls Total 3,987 4,313
Slips, Trips & Falls Total 3,407 3,694
Physical Workplace - Floor/Level Surfaces 1,734 2,008
Means of Access - Stairs or Steps 500 604
Vehicles 276 282
Falls from Height Total 580 619
Means of Access - Ladders 426 431
Means of Access - Scaffold 51 55
Physical Workplace - Structures 44 47
Struck by Moving Objects
Total 2,388 2,428
Industrial Hand Tools 415 455
Metal Items (excluding knives/needles) 380 452
Vehicles 360 339
Cut/Stabbed by Objects
Total 1,352 1,452
Knives and Needles 534 625
Industrial Machines 294 305
Industrial Hand Tools 285 277
Struck by Falling Objects
Total 1,016 1,081
Metal Items (excluding knives/needles) 319 335
Furniture and Fittings 151 166
Goods/Cargo 146 143
Caught in/between Objects
Total 840 923
Industrial Machines 269 269
Metal Items (excluding knives/needles) 184 207
Furnitures & Fittings 98 112
Vehicles 96 112
Over-exertion/ Strenuous Movements
Total 835 902
Human Factors 469 561
Goods/Cargo 163 186
Furniture and Fittings 32 33
Strike against Objects
Total 669 784
Metal Items (excluding knives/needles) 191 241
Furniture & Fittings 182 184
Industrial Machines 51 71
Exposure to Extreme Temperatures
Total 368 398
Hot scalding liquid/steam 310 320
Industrial Machines 17 24
Pressure Equipment 6 10
Table 16: Number of workplace minor injuries by key incident type and key incident agent, 2018 and 2019
2018Incident Type Incident Agent 2019
44WORKPLACE SAFETY AND HEALTH REPORT, 2019
All Industries STF SBMO CSBO
Construction SBMO STF SBFO
Marine SBMO STF CIBO
Manufacturing SBMO STF CSBO
Metalworking SBMO CIBO STF
Manufacture of Food, Beverages & Tobacco STF CSBO SBMO
Manufacture of Paper/ Rubber/ Plastic/ Products &
Printing
STF CIBO CSBO
Water Supply, Sewerage & Waste Management and Remediation Activities
STF SBMO CIBO
Wholesale & Retail Trade STF SBMO CSBO
Wholesale Trade STF SBMO OESM
Retail Trade STF CSBO SBMO
Transportation & Storage STF SBMO OESM
Logistics & Transport STF SBMO CIBO
Accommodation & Food Service Activities CSBO STF ETET
Accommodation CSBO STF SBFO
Food & Beverage Service Activities CSBO STF ETET
Financial & Insurance Activities STF OESM CSBO
Real Estate Activities STF OESM, SBMO CSBO
Professional, Scientific & Technical Activities STF SBMO OESM
Legal, Accounting & Management Activities STF OESM, SBMO CSBO
Architectural & Engineering Activities STF SBMO SBFO
Administrative & Support Service Activities STF SBMO OESM
Cleaning & Landscape Maintenance Activities STF SBMO CSBO
Office Administrative, Office Support & Other Business Support Activities
STF SBMO CSBO
Security and Investigation Activities STF SBMO OESM
Community, Social & Personal Services STF SBMO OESM
Health Activities STF OESM SBMO
Education STF SBMO OESM
Other Personal Service Activities STF SBMO CSBO
Arts, Entertainment and Recreation STF ETBM CSBO
Repair & Maintenance of Vehicles SBMO STF CIBO
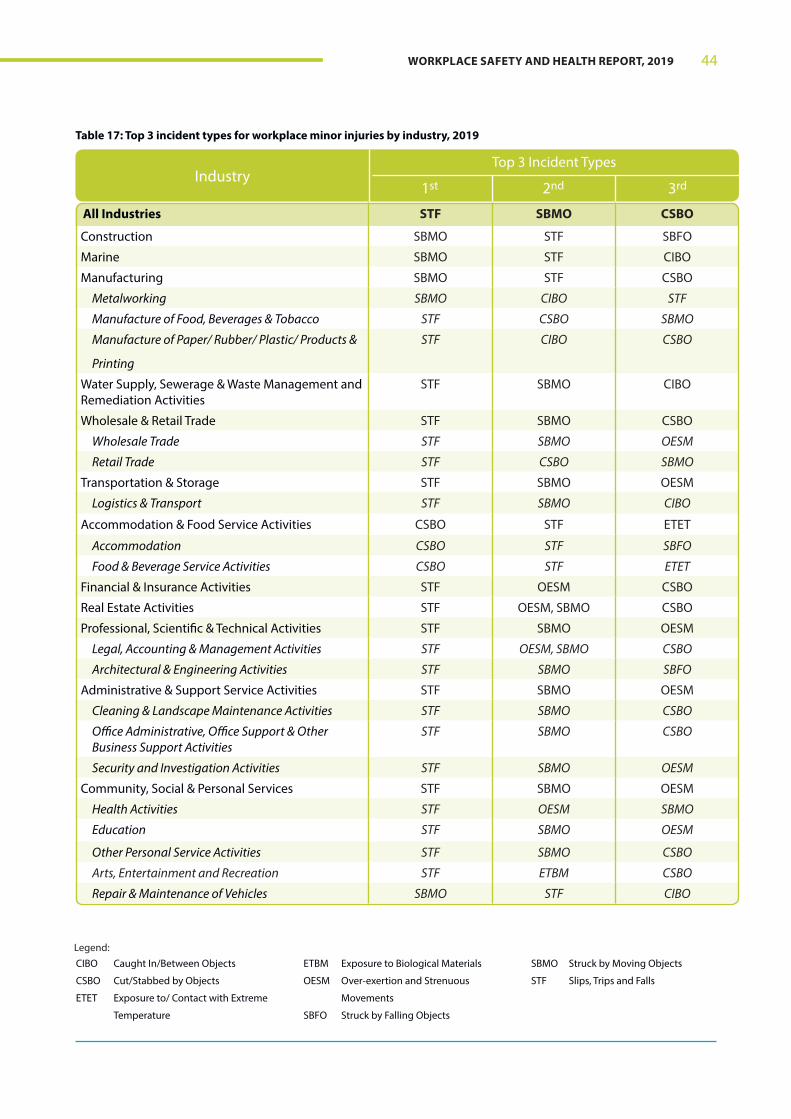
Table 17: Top 3 incident types for workplace minor injuries by industry, 2019
IndustryTop 3 Incident Types
Legend:
1st 2nd 3rd
CIBO Caught In/Between Objects
CSBO Cut/Stabbed by Objects
ETET Exposure to/ Contact with Extreme
Temperature
ETBM Exposure to Biological Materials
OESM Over-exertion and Strenuous
Movements
SBFO Struck by Falling Objects
SBMO Struck by Moving Objects
STF Slips, Trips and Falls

WORKPLACE SAFETY AND HEALTH REPORT, 201945
Total 12,173 13,111
Cuts and Bruises 4,041 4,500
Crushing, Fractures and Dislocations 3,127 3,107
Sprains & Strains 1,724 1,982
Burns 433 459
Multiple Injuries 260 276
Puncture Wound 162 168
Bites and Stings 94 102
Concussion 74 85
Others 2,258 2,432
Table 18: Types of workplace minor injury, 2018 and 2019
2018Workplace Minor Injury Types 2019

46WORKPLACE SAFETY AND HEALTH REPORT, 2019
Table 19: Dangerous occurrences by industry, 2018 and 2019
2018Industry 2019
All Industries 23 21
Construction 10 10
Marine 1 4
Manufacturing 5 3
Manufacture of Petrochemical Products 2 1
Manufacture of Computer, Electronic and Optical Products 1 1
Manufacture of Paper/ Rubber/ Plastic/ Products & Printing 0 1
Manufacture of Other Transport Equipment 2 0
Water Supply, Sewerage & Waste Management and Remediation Activities
2 0
Wholesale & Retail Trade 0 2
Transportation & Storage 1 1
Accommodation & Food Service Activities 1 1
Cleaning and Landscape Maintenance Acivities 1 0
Public Administration and Defence 1 0
Education 1 0

WORKPLACE SAFETY AND HEALTH REPORT, 201947
Total Dangerous Occurrences 23 21
Collapse/Failure of Structure & Equipment
Total 14 13
Lifting Equipment - Cranes 12 8
Lifting Equipment - Mobile Work Platform 1 2
Physical Workplace - Formwork 1 1
Lifting Equipment - Lifts and Hoists 0 1
Lifting Equipment - Piling Machines 0 1
Fires & Explosion Total 9 8
Dust, Gas, Liquid and Chemicals 2 2
Pressurised Equipment 0 2
Other Incident Agents 3 2
Goods/ Cargo 1 1
Explosives/ Flammable Substances 0 1
Electrical Installation 2 0
Hot Scalding Liquid / Steam 1 0
Table 20: Types of dangerous Occurrences, 2018 and 2019
2018Incident Type Incident Agent 2019

48WORKPLACE SAFETY AND HEALTH REPORT, 2019
Table 21: Number of confirmed occupational disease cases by industry, 2018 and 2019
2018Industry 2019
All Industries 563 517
Construction 55 53
Marine 35 13
Manufacturing 169 154
Manufacture of Petrolchemical 5 53
Metalworking 75 36
Manufacture of Food, Beverages & Tobacco 22 23
Wholesale & Retail Trade 32 23
Transportation & Storage 55 62
Logistics & Transport 46 39
Accommodation & Food Service Activities 41 33
Accommodation 14 11
Food & Beverage Service Activities 27 22
Information & Communications 6 3
Financial & Insurance Activities 5 10
Real Estate Activities 12 13
Professional, Scientific & Technical Activities 21 29
Legal, Accounting and Management Services 15 8
Administrative & Support Service Activities 13 16
Community, Social & Personal Services 75 68
Health Activities 45 44
Education 4 9
Other Personal Service Activities 11 5

WORKPLACE SAFETY AND HEALTH REPORT, 201949
All Industries 16.4 14.9
Construction 12.3 11.7
Marine 54.0 19.5
Manufacturing 39.7 36.8
Manufacture of Petrolchemical 9.2 100.0
Metalworking 67.8 33.8
Manufacture of Food, Beverages & Tobacco 43.2 43.9
Wholesale & Retail Trade 6.6 4.8
Transportation & Storage 21.2 23.7
Logistics & Transport 43.7 37.2
Accommodation & Food Service Activities 16.1 12.6
Accommodation 40.2 30.0
Food & Beverage Service Activities 12.3 9.7
Information & Communications 4.2 2.0
Financial & Insurance Activities 2.6 5.0
Real Estate Activities 13.9 15.5
Professional, Scientific & Technical Activities 8.6 11.5
Legal, Accounting and Management Services 11.9 6.0
Administrative & Support Service Activities 5.3 6.3
Community, Social & Personal Services 9.0 8.0
Health Activities* 40.4 38.4
Education n.a. n.a.
Other Personal Service Activities n.a. n.a.
Table 22: Occupational disease incidence rates by industry, 2018 and 2019Per 100,000 employed persons
2018Industry 2019

50WORKPLACE SAFETY AND HEALTH REPORT, 2019
Total 563 517
Work-related Musculoskeletal Disorders 326 293
Back injuries due to ergonomic risks 297 279
Tendinitis 10 6
Trigger Finger/Thumb 4 4
Nerve Disorder such as Carpal Tunnel Syndrome, Cubital Tunnel Syndrome
4 3
Tenosynovitis 0 1
Musculoskeletal Disorder of the Back 3 0
Lateral Epicondylitis (Tennis Elbow) 2 0
Others 6 0
Noise Induced Deafness 163 169
NID (E) - Early 148 163
NID (A) - Advanced 15 6
Occupational Skin Disease 48 39
Eczema 47 36
Others 1 3
Occupational Lung Disease 6 4
Occupational Asthma 3 3
Silicosis 1 1
Asbestosis 2 0
Barotrauma 5 2
Sinus 1 2
Aural 3 0
Pulmonary 1 0
Cancers 6 2
Mesothelioma 6 2
Heat Disorder 3 2
Infectious Disease 3 2
Compressed Air Illness 2 2
CAI Type 1 1 2
CAI Type 2 1 0
Others 1 2
Table 23: Number of confirmed occupational diseases by type, 2018 and 2019
2018 2019

WORKPLACE SAFETY AND HEALTH REPORT, 201951
All Industries 163 169
Construction 22 18
Marine 32 8
Manufacturing 86 101
Manufacture of Petrolchemical 5 50
Metalworking 49 23
Manufacture of Food, Beverages & Tobacco 3 14
Electricity, Gas & Air Conditioning Supply 0 4
Wholesale & Retail Trade 2 2
Transportation & Storage 11 17
Logistics & Transport 9 5
Information & Communication 1 1
Professional, Scientific & Technical Activities 2 14
Architectural & Engineering Activities 1 10
Community, Social & Personal Services 3 2
Education 1 1
Table 24: Number of confirmed NID cases by industry, 2018 and 2019
2018Industry 2019

52WORKPLACE SAFETY AND HEALTH REPORT, 2019
All Industries 326 293
Construction 24 29
Marine 1 2
Manufacturing 66 41
Other Manufacturing 7 9
Metalworking 20 8
Manufacture of Food, Beverages & Tobacco 19 7
Water Supply, Sewerage & Waste Management and Remediation Activities
1 3
Wholesale & Retail Trade 28 19
Wholesale Trade 16 12
Retail Trade 12 7
Transportation & Storage 40 41
Logistics & Transport 33 31
Accommodation & Food Service Activities 37 28
Accommodation 12 9
Food & Beverage Service Activities 25 19
Information & Communications 4 2
Financial & Insurance Activities 3 9
Real Estate Services 10 13
Professional, Scientific & Technical Activities 17 11
Administrative & Support Service Activities 8 12
Community, Social & Personal Services 46 56
Health Activities 28 35
Other Personal Service Activities 6 4
Arts, Entertainment and Recreation 5 2
Table 25: Number of confirmed WRMSD cases by industry, 2018 and 2019
2018Industry 2019

WORKPLACE SAFETY AND HEALTH REPORT, 201953
All Industries 48 39
Construction 3 3
Marine 0 2
Manufacturing 11 11
Metalworking 5 4
Manufacture of other Transport Equipment 2 3
Manufacture of Food, Beverages & Tobacco 3 2
Wholesale & Retail Trade 2 1
Transportation & Storage 3 2
Logistics & Transport 3 1
Accommodation & Food Service Activities 4 5
Accommodation 2 2
Food & Beverage Service Activities 2 3
Financial & Insurance Activities 2 0
Administrative and Support Service Activities 0 2
Community, Social & Personal Services 21 9
Health Activities 15 8
Other Personal Service Activities 3 1
Table 26: Number of confirmed OSD cases by industry, 2018 and 2019
2018Industry 2019
Wetwork and Occlusion 12
Alcohol 9
Oils 3
Thermal 3
Latex 2
Cement 2
Table 27: Top Causative Agents of Occupational Skin Diseases, 2019
No. of CasesCausative Agents
54WORKPLACE SAFETY AND HEALTH REPORT, 2019
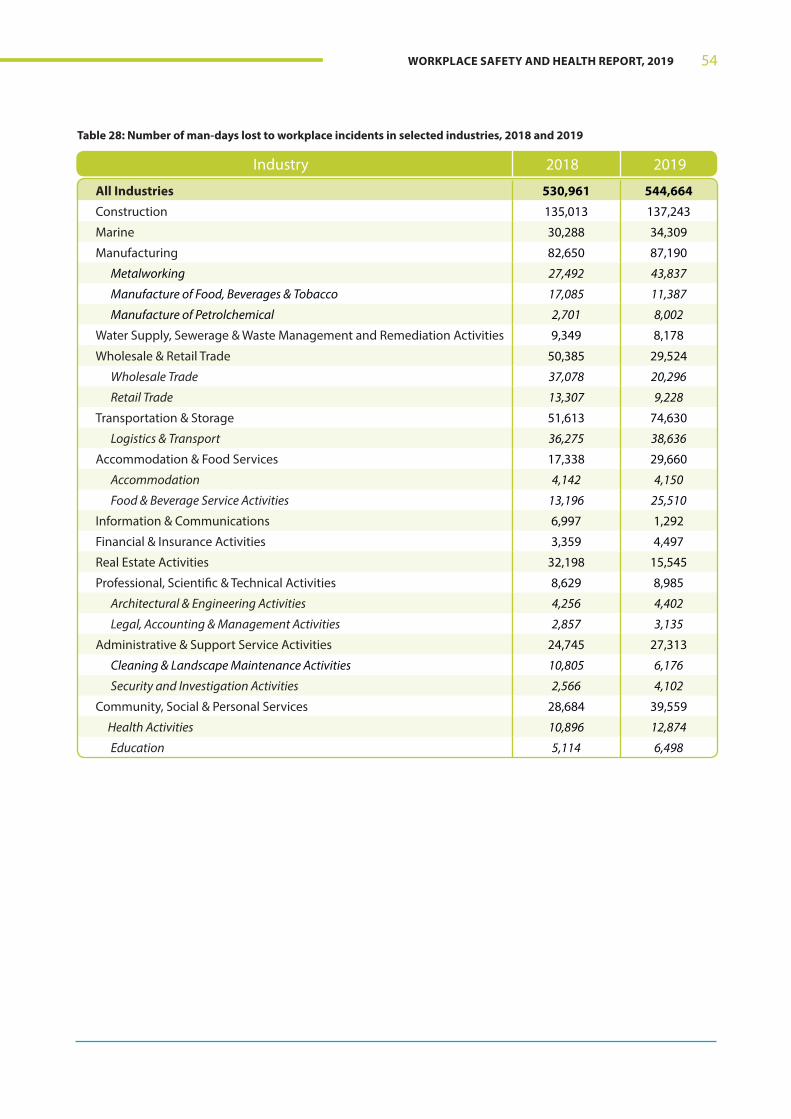
All Industries 530,961 544,664
Construction 135,013 137,243
Marine 30,288 34,309
Manufacturing 82,650 87,190
Metalworking 27,492 43,837
Manufacture of Food, Beverages & Tobacco 17,085 11,387
Manufacture of Petrolchemical 2,701 8,002
Water Supply, Sewerage & Waste Management and Remediation Activities 9,349 8,178
Wholesale & Retail Trade 50,385 29,524
Wholesale Trade 37,078 20,296
Retail Trade 13,307 9,228
Transportation & Storage 51,613 74,630
Logistics & Transport 36,275 38,636
Accommodation & Food Services 17,338 29,660
Accommodation 4,142 4,150
Food & Beverage Service Activities 13,196 25,510
Information & Communications 6,997 1,292
Financial & Insurance Activities 3,359 4,497
Real Estate Activities 32,198 15,545
Professional, Scientific & Technical Activities 8,629 8,985
Architectural & Engineering Activities 4,256 4,402
Legal, Accounting & Management Activities 2,857 3,135
Administrative & Support Service Activities 24,745 27,313
Cleaning & Landscape Maintenance Activities 10,805 6,176
Security and Investigation Activities 2,566 4,102
Community, Social & Personal Services 28,684 39,559
Health Activities 10,896 12,874
Education 5,114 6,498
Table 28: Number of man-days lost to workplace incidents in selected industries, 2018 and 2019
2018Industry 2019

WORKPLACE SAFETY AND HEALTH REPORT, 201955
ANNEX B
BUSINESS UNDER SURVEILLANCE
The Business under Surveillance (BUS) programme consists of two phases – Assessment and Surveillance.
The Assessment phase involves rigorous and methodical review on companies that are of concern to ascertain the effectiveness of their Risk Management programme as well as the strength of their WSH Management Systems.
Companies that fail the Assessment phase would then be placed under the Surveillance phase. During the Surveillance phase, the Occupational Safety and Health Division (OSHD) of Ministry of Manpower (MOM) works closely with the senior management and WSH personnel of these BUS companies to carry out a gap analysis and to develop outcome-based action plans.
OSHD then conducts frequent inspections to verify the progress of the companies’ implementation of their action plans and closely monitors the companies’ WSH performance. BUS companies can only exit from the programme upon successful implementation of their Action Plan, achieved satisfactory audit outcomes, and have plans to build a strong WSH culture within the company.

56WORKPLACE SAFETY AND HEALTH REPORT, 2019
HYGIENE SURVEILLANCE
Measuring the exposure levels of specific workplace chemical hazards provide a good indication on whether the conditions in the work environment are within the Permissible Exposure Levels (PEL), as stipulated under the WSH (General Provisions) Regulations. Companies with chemical exposures exceeding 10% PEL are required to monitor the exposure levels at least annually, conducted by a competent person.
Under the WSH (Noise) Regulations, workplaces with 10 or more workers who are exposed to excessive noise are required to monitor their workers’ noise exposure at least once every three years, or earlier when there are changes to the processes. The monitoring must be conducted by a competent person using calibrated equipment to ensure accuracy of results.
Industrial hygiene data from assessments conducted by MOM and results submitted by companies with in-plant monitoring are maintained within a National Database for Noise and Chemical Exposure. This enables MOM to proactively identify high-risk workplaces, evaluate trends in exposure levels and advise employers on control measures and appropriate monitoring programmes.
MEDICAL SURVEILLANCE
The Medical Surveillance Programme serves to monitor workers’ exposure to specific hazards and to identify early and possibly reversible changes in health effects. The programme aims to prevent overt occupational diseases through early detection of cases with excessive occupational exposure to specific health hazards. It involves monitoring of workers’ health and implementation of measures to minimise the risks. High-risk workplaces would be monitored more rigorously to ensure control measures are put in place.
This monitoring assesses the “internal dose” of the worker and the effects from exposure by determining:a) The concentrations of the chemicals or their metabolites in biological samples (measuring the absorption or body burden) indirectly via blood, urine, and/or end-exhaled air.b) The indicators of health effect related to the internal dose so as to identify early and reversible changes, such as degree of hearing loss, and effects on liver and kidney.
Central to the Medical Surveillance Programme is the WSH (Medical Examinations) Regulations which prescribe a list of 19 hazards requiring medical examinations which can only be conducted by Designated Workplace Doctors (DWDs) registered with MOM. In addition, Occupational Safety and Health Division (OSHD) of the MOM may also recommend the implementation of medical surveillance programmes for non-prescribed hazards if the health risk is significant and where biological indicators are available. Some of these hazards include toluene, trinitrotoluene, xylene, fluoride and hexane.
Based on the findings of the medical examinations, workers who are medically unfit or who are over-exposed to chemicals are suspended, either on a temporary or permanent basis. The objective is to ensure that all exposed work-ers remain healthy and fit for work while exposed to the hazards. Medical monitoring is conducted once every six months for lead and organophosphate, and annually for all other hazards.
HYGIENE AND MEDICAL SURVEILLANCE
ANNEX C

WORKPLACE SAFETY AND HEALTH REPORT, 201957
ANNEX D
SOURCE OF DATA
Data on workplace and work-related traffic injuries, dangerous occurrences and occupational diseases were collated from incident reports made by employers, occupiers and medical practitioners in fulfilment of their obligations under the Workplace Safety and Health Act and Workplace Safety and Health (Incident Reporting) Regulations.
Medical and Hygiene Surveillance data were collated from reports submitted to OSHD, MOM as well as industrial hygiene data from assessments conducted by OSHD, MOM. Business Under Surveillance information was obtained from OSHD, MOM.
Employment data used in the computation of workplace fatal, injury and occupational disease incidence rates and data on the average weekly hours worked used in the estimation of man-hours worked were extracted from records within the Ministry of Manpower.

58WORKPLACE SAFETY AND HEALTH REPORT, 2019
The types of workplace and work-related traffic injuries and occupational diseases covered in the reported statistics include the following:
• Workplace and work-related traffic injuries sustained by employees and resulting in
more than three days of medical leave, regardless of whether these were consecutive
days;
• Workplace and work-related traffic injuries sustained by employees and resulting in at
least 24 hours of hospitalisation;
• Workplace and work-related traffic incidents resulting in the death of employees and
self-employed persons;
• Workplace and work-related traffic incidents resulting in the injury of self-employed
persons who have to be taken to the hospital for treatment; and
• Occupational diseases listed in the Second Schedule of the Workplace Safety and
Health Act and Work Injury Compensation Act.
DATA COVERAGE
ANNEX E
Work-related traffic accidents are reportable with effect from 6 January 2014.
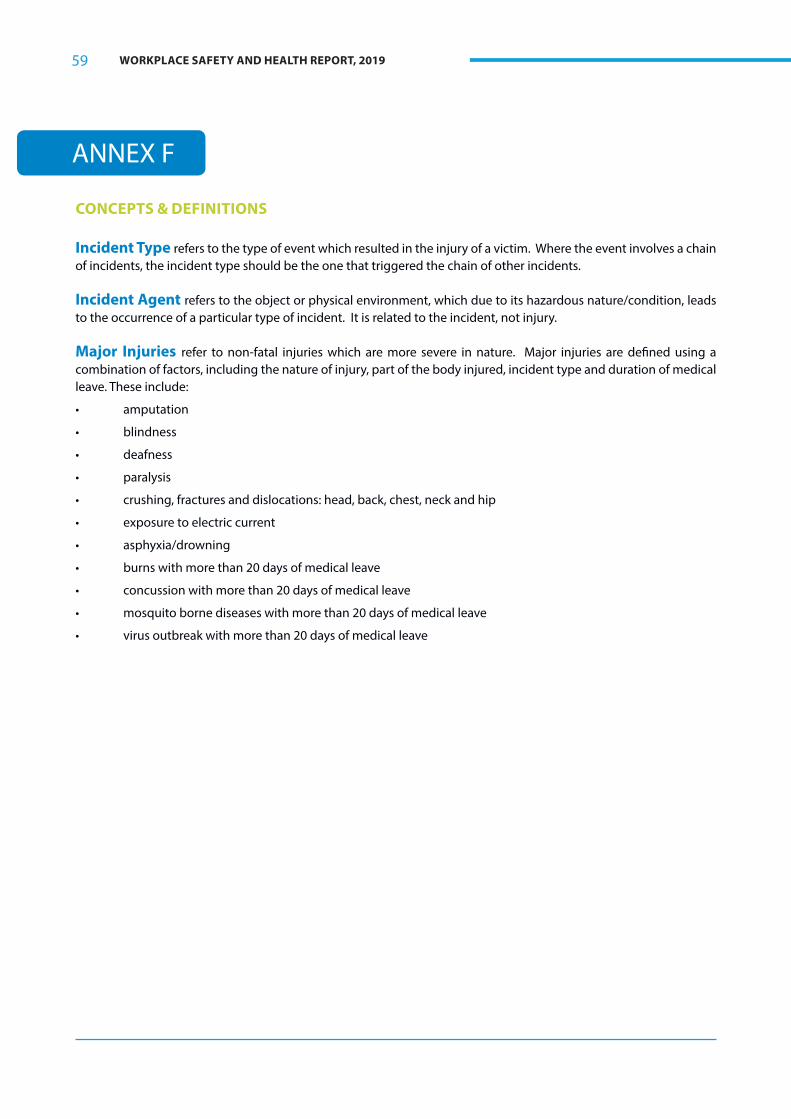
WORKPLACE SAFETY AND HEALTH REPORT, 201959
Incident Type refers to the type of event which resulted in the injury of a victim. Where the event involves a chain of incidents, the incident type should be the one that triggered the chain of other incidents.
Incident Agent refers to the object or physical environment, which due to its hazardous nature/condition, leads to the occurrence of a particular type of incident. It is related to the incident, not injury.
Major Injuries refer to non-fatal injuries which are more severe in nature. Major injuries are defined using a combination of factors, including the nature of injury, part of the body injured, incident type and duration of medical leave. These include:
• amputation
• blindness
• deafness
• paralysis
• crushing, fractures and dislocations: head, back, chest, neck and hip
• exposure to electric current
• asphyxia/drowning
• burns with more than 20 days of medical leave
• concussion with more than 20 days of medical leave
• mosquito borne diseases with more than 20 days of medical leave
• virus outbreak with more than 20 days of medical leave
CONCEPTS & DEFINITIONS
ANNEX F


ISSN 2424 - 7774 Print / ISSN 2424 - 7782 OnlinePublished in March 2020 by the Ministry of Manpower1500 Bendemeer Road #04-01Ministry of Manpower Services CentreSingapore 339946website: www.mom.gov.sg
All rights reserved. This publication may not be reproduced or transmitted in any form or by any means, in whole or in part, without prior written permission.