Embed Size (px)
Citation preview

Working with Cube Reportsusing Actuate Analytics Option

Information in this document is subject to change without notice. Examples provided are fictitious. No part of this document may be reproduced or transmitted in any form, or by any means, electronic or mechanical, for any purpose, in whole or in part, without the express written permission of Actuate Corporation.
© 1995 - 2011 by Actuate Corporation. All rights reserved. Printed in the United States of America.
Contains information proprietary to:Actuate Corporation, 2207 Bridgepointe Parkway, San Mateo, CA 94404
www.actuate.comwww.birt-exchange.com
The software described in this manual is provided by Actuate Corporation under an Actuate License agreement. The software may be used only in accordance with the terms of the agreement. Actuate software products are protected by U.S. and International patents and patents pending. For a current list of patents, please see http://www.actuate.com/patents.
Actuate Corporation trademarks and registered trademarks include:Actuate, ActuateOne, the Actuate logo, Archived Data Analytics, BIRT, Collaborative Reporting Architecture, e.Analysis, e.Report, e.Reporting, e.Spreadsheet, Encyclopedia, Interactive Viewing, OnPerformance, Performancesoft, Performancesoft Track, Performancesoft Views, Report Encyclopedia, Reportlet, The people behind BIRT, X2BIRT, and XML reports.
Actuate products may contain third-party products or technologies. Third-party trademarks or registered trademarks of their respective owners, companies, or organizations include:
Adobe Systems Incorporated: Flash Player. Apache Software Foundation (www.apache.org): Axis, Axis2, Batik, Batik SVG library, Commons Command Line Interface (CLI), Commons Codec, Derby, Shindig, Struts, Tomcat, Xerces, Xerces2 Java Parser, and Xerces-C++ XML Parser. Bits Per Second, Ltd. and Graphics Server Technologies, L.P.: Graphics Server. Bruno Lowagie and Paulo Soares: iText, licensed under the Mozilla Public License (MPL). Castor (www.castor.org), ExoLab Project (www.exolab.org), and Intalio, Inc. (www.intalio.org): Castor. Codejock Software: Xtreme Toolkit Pro. DataDirect Technologies Corporation: DataDirect JDBC, DataDirect ODBC. Eclipse Foundation, Inc. (www.eclipse.org): Babel, Data Tools Platform (DTP) ODA, Eclipse SDK, Graphics Editor Framework (GEF), Eclipse Modeling Framework (EMF), and Eclipse Web Tools Platform (WTP), licensed under the Eclipse Public License (EPL). Jason Hsueth and Kenton Varda (code.google.com): Protocole Buffer. ImageMagick Studio LLC.: ImageMagick. InfoSoft Global (P) Ltd.: FusionCharts, FusionMaps, FusionWidgets, PowerCharts. Mark Adler and Jean-loup Gailly (www.zlib.net): zLib. Matt Ingenthron, Eric D. Lambert, and Dustin Sallings (code.google.com): Spymemcached, licensed under the MIT OSI License. International Components for Unicode (ICU): ICU library. KL Group, Inc.: XRT Graph, licensed under XRT for Motif Binary License Agreement. LEAD Technologies, Inc.: LEADTOOLS. Microsoft Corporation (Microsoft Developer Network): CompoundDocument Library. Mozilla: Mozilla XML Parser, licensed under the Mozilla Public License (MPL). MySQL Americas, Inc.: MySQL Connector. Netscape Communications Corporation, Inc.: Rhino, licensed under the Netscape Public License (NPL). Oracle Corporation: Berkeley DB. PostgreSQL Global Development Group: pgAdmin, PostgreSQL, PostgreSQL JDBC driver. Rogue Wave Software, Inc.: Rogue Wave Library SourcePro Core, tools.h++. Sam Stephenson (prototype.conio.net): prototype.js, licensed under the MIT license. Sencha Inc.: Ext JS. Sun Microsystems, Inc.: JAXB, JDK, Jstl. ThimbleWare, Inc.: JMemcached, licensed under the Apache Public License (APL). World Wide Web Consortium (W3C)(MIT, ERCIM, Keio): Flute, JTidy, Simple API for CSS. XFree86 Project, Inc.: (www.xfree86.org): xvfb. Yuri Kanivets (code.google.com): Android Wheel gadget, licensed under the Apache Public License (APL). ZXing authors (code.google.com): ZXing, licensed under the Apache Public License (APL).
All other brand or product names are trademarks or registered trademarks of their respective owners, companies, or organizations.
Document No. 110812-2-530321 July 25, 2011

i
ContentsAbout Working with Cube Reports using Actuate Analytics Option . . . . . v
Chapter 1Starting Actuate Analytics Cube Viewer . . . . . . . . . . . . . . . . . . . . . . . . . . . 1About Actuate Analytics Cube Viewer and Actuate Analytics option . . . . . . . . . . . . . . . . . . . . . 2Launching Actuate Analytics Cube Viewer using a cube report . . . . . . . . . . . . . . . . . . . . . . . . . . 3
Chapter 2Viewing data . . . . . . . . . . . . . . . . . . . . . . . . . . . . . . . . . . . . . . . . . . . . . . . . . . 5About data analysis . . . . . . . . . . . . . . . . . . . . . . . . . . . . . . . . . . . . . . . . . . . . . . . . . . . . . . . . . . . . . . . . 6
About the data cube . . . . . . . . . . . . . . . . . . . . . . . . . . . . . . . . . . . . . . . . . . . . . . . . . . . . . . . . . . . . . 6About categories and measures . . . . . . . . . . . . . . . . . . . . . . . . . . . . . . . . . . . . . . . . . . . . . . . . . . . 6
About Actuate Analytics Cube Viewer . . . . . . . . . . . . . . . . . . . . . . . . . . . . . . . . . . . . . . . . . . . . . . . . 7Recognizing features in Actuate Analytics Cube Viewer . . . . . . . . . . . . . . . . . . . . . . . . . . . . . . 7Using the Actuate Analytics Cube Viewer toolbar . . . . . . . . . . . . . . . . . . . . . . . . . . . . . . . . . . . . 7
Selecting an experience level . . . . . . . . . . . . . . . . . . . . . . . . . . . . . . . . . . . . . . . . . . . . . . . . . . . . . . . . 9Expanding and collapsing the data . . . . . . . . . . . . . . . . . . . . . . . . . . . . . . . . . . . . . . . . . . . . . . . . . . .11
Expanding the data . . . . . . . . . . . . . . . . . . . . . . . . . . . . . . . . . . . . . . . . . . . . . . . . . . . . . . . . . . . . . .11Collapsing the data . . . . . . . . . . . . . . . . . . . . . . . . . . . . . . . . . . . . . . . . . . . . . . . . . . . . . . . . . . . . . .11
Displaying data in tables, charts, and graphs . . . . . . . . . . . . . . . . . . . . . . . . . . . . . . . . . . . . . . . . . 12Navigating a table . . . . . . . . . . . . . . . . . . . . . . . . . . . . . . . . . . . . . . . . . . . . . . . . . . . . . . . . . . . . . . 12Navigating an analysis view . . . . . . . . . . . . . . . . . . . . . . . . . . . . . . . . . . . . . . . . . . . . . . . . . . . . . 12Navigating a presentation view . . . . . . . . . . . . . . . . . . . . . . . . . . . . . . . . . . . . . . . . . . . . . . . . . . 12Navigating a vertical bar chart . . . . . . . . . . . . . . . . . . . . . . . . . . . . . . . . . . . . . . . . . . . . . . . . . . . 12Navigating a horizontal bar chart . . . . . . . . . . . . . . . . . . . . . . . . . . . . . . . . . . . . . . . . . . . . . . . . . 13Navigating a pie chart . . . . . . . . . . . . . . . . . . . . . . . . . . . . . . . . . . . . . . . . . . . . . . . . . . . . . . . . . . 14Navigating a line graph . . . . . . . . . . . . . . . . . . . . . . . . . . . . . . . . . . . . . . . . . . . . . . . . . . . . . . . . . 14
Displaying balloon help . . . . . . . . . . . . . . . . . . . . . . . . . . . . . . . . . . . . . . . . . . . . . . . . . . . . . . . . . . . 14Sorting the data . . . . . . . . . . . . . . . . . . . . . . . . . . . . . . . . . . . . . . . . . . . . . . . . . . . . . . . . . . . . . . . . . . 15
Sorting data by columns . . . . . . . . . . . . . . . . . . . . . . . . . . . . . . . . . . . . . . . . . . . . . . . . . . . . . . . . . 15Sorting data by rows . . . . . . . . . . . . . . . . . . . . . . . . . . . . . . . . . . . . . . . . . . . . . . . . . . . . . . . . . . . . 16Canceling sorting on columns or rows . . . . . . . . . . . . . . . . . . . . . . . . . . . . . . . . . . . . . . . . . . . . 17Applying a filter to sort the highest or lowest values . . . . . . . . . . . . . . . . . . . . . . . . . . . . . . . . 18
Using filters . . . . . . . . . . . . . . . . . . . . . . . . . . . . . . . . . . . . . . . . . . . . . . . . . . . . . . . . . . . . . . . . . . . . . . 19Writing filter expressions . . . . . . . . . . . . . . . . . . . . . . . . . . . . . . . . . . . . . . . . . . . . . . . . . . . . . . . . 19Applying filters to columns or rows . . . . . . . . . . . . . . . . . . . . . . . . . . . . . . . . . . . . . . . . . . . . . . . 19Clearing filters on columns or rows . . . . . . . . . . . . . . . . . . . . . . . . . . . . . . . . . . . . . . . . . . . . . . . 20Applying filters in the category bar . . . . . . . . . . . . . . . . . . . . . . . . . . . . . . . . . . . . . . . . . . . . . . . 21Applying filters on a category axis . . . . . . . . . . . . . . . . . . . . . . . . . . . . . . . . . . . . . . . . . . . . . . . . 23

ii
Searching for categories and subcategories . . . . . . . . . . . . . . . . . . . . . . . . . . . . . . . . . . . . . . . . . . . .25Manipulating the data . . . . . . . . . . . . . . . . . . . . . . . . . . . . . . . . . . . . . . . . . . . . . . . . . . . . . . . . . . . . . .25
Displaying categories on rows and columns . . . . . . . . . . . . . . . . . . . . . . . . . . . . . . . . . . . . . . . .26Swapping rows and columns . . . . . . . . . . . . . . . . . . . . . . . . . . . . . . . . . . . . . . . . . . . . . . . . . . . . .28Selecting and deselecting subsets of data . . . . . . . . . . . . . . . . . . . . . . . . . . . . . . . . . . . . . . . . . . .28Hiding data . . . . . . . . . . . . . . . . . . . . . . . . . . . . . . . . . . . . . . . . . . . . . . . . . . . . . . . . . . . . . . . . . . . .29Expanding to level in a category . . . . . . . . . . . . . . . . . . . . . . . . . . . . . . . . . . . . . . . . . . . . . . . . . .30Suppressing rows and columns with no data . . . . . . . . . . . . . . . . . . . . . . . . . . . . . . . . . . . . . . . .31Suppressing rows and columns with zero values . . . . . . . . . . . . . . . . . . . . . . . . . . . . . . . . . . . .33
Restoring the initial view . . . . . . . . . . . . . . . . . . . . . . . . . . . . . . . . . . . . . . . . . . . . . . . . . . . . . . . . . . .34
Chapter 3Customizing data . . . . . . . . . . . . . . . . . . . . . . . . . . . . . . . . . . . . . . . . . . . . . 35About customizing data . . . . . . . . . . . . . . . . . . . . . . . . . . . . . . . . . . . . . . . . . . . . . . . . . . . . . . . . . . . .36Presenting data . . . . . . . . . . . . . . . . . . . . . . . . . . . . . . . . . . . . . . . . . . . . . . . . . . . . . . . . . . . . . . . . . . . .36
Selecting a chart style . . . . . . . . . . . . . . . . . . . . . . . . . . . . . . . . . . . . . . . . . . . . . . . . . . . . . . . . . . . .36Setting preferences for a chart . . . . . . . . . . . . . . . . . . . . . . . . . . . . . . . . . . . . . . . . . . . . . . . . . . . . .37Adjusting the fit to page options . . . . . . . . . . . . . . . . . . . . . . . . . . . . . . . . . . . . . . . . . . . . . . . . . .38Opening the cube in a new window . . . . . . . . . . . . . . . . . . . . . . . . . . . . . . . . . . . . . . . . . . . . . . .39Displaying variables in the main title, subtitle, and footer . . . . . . . . . . . . . . . . . . . . . . . . . . . . .39Selecting Preferences . . . . . . . . . . . . . . . . . . . . . . . . . . . . . . . . . . . . . . . . . . . . . . . . . . . . . . . . . . . .40Using Undo and Redo . . . . . . . . . . . . . . . . . . . . . . . . . . . . . . . . . . . . . . . . . . . . . . . . . . . . . . . . . . .43
Analyzing data . . . . . . . . . . . . . . . . . . . . . . . . . . . . . . . . . . . . . . . . . . . . . . . . . . . . . . . . . . . . . . . . . . . .43Analyzing subcategory data . . . . . . . . . . . . . . . . . . . . . . . . . . . . . . . . . . . . . . . . . . . . . . . . . . . . . .46Displaying data values as a percentage of a total . . . . . . . . . . . . . . . . . . . . . . . . . . . . . . . . . . . .49Analyzing data in relative time periods . . . . . . . . . . . . . . . . . . . . . . . . . . . . . . . . . . . . . . . . . . . .50
About exception highlighting . . . . . . . . . . . . . . . . . . . . . . . . . . . . . . . . . . . . . . . . . . . . . . . . . . . . . . .52About exporting detail data to a spreadsheet . . . . . . . . . . . . . . . . . . . . . . . . . . . . . . . . . . . . . . . . . .53
Chapter 4Exporting data . . . . . . . . . . . . . . . . . . . . . . . . . . . . . . . . . . . . . . . . . . . . . . . 55About exporting data . . . . . . . . . . . . . . . . . . . . . . . . . . . . . . . . . . . . . . . . . . . . . . . . . . . . . . . . . . . . . .56Exporting data to a spreadsheet . . . . . . . . . . . . . . . . . . . . . . . . . . . . . . . . . . . . . . . . . . . . . . . . . . . . .56Exporting data to a document . . . . . . . . . . . . . . . . . . . . . . . . . . . . . . . . . . . . . . . . . . . . . . . . . . . . . . .57Saving a cube locally for offline viewing . . . . . . . . . . . . . . . . . . . . . . . . . . . . . . . . . . . . . . . . . . . . . .59Saving cube reports . . . . . . . . . . . . . . . . . . . . . . . . . . . . . . . . . . . . . . . . . . . . . . . . . . . . . . . . . . . . . . . .60Sending cube reports by e-mail . . . . . . . . . . . . . . . . . . . . . . . . . . . . . . . . . . . . . . . . . . . . . . . . . . . . . .60Viewing cubes managed by Microsoft Analysis Services . . . . . . . . . . . . . . . . . . . . . . . . . . . . . . . .61
Chapter 5Customizing Actuate Analytics Cube Viewer . . . . . . . . . . . . . . . . . . . . . . 63About customizing Actuate Analytics Cube Viewer . . . . . . . . . . . . . . . . . . . . . . . . . . . . . . . . . . . .64Exporting detail data to a spreadsheet . . . . . . . . . . . . . . . . . . . . . . . . . . . . . . . . . . . . . . . . . . . . . . . .64

iii
Customizing the graphic resources . . . . . . . . . . . . . . . . . . . . . . . . . . . . . . . . . . . . . . . . . . . . . . . . . . 65Locating the branding kits . . . . . . . . . . . . . . . . . . . . . . . . . . . . . . . . . . . . . . . . . . . . . . . . . . . . . . . . . 66Customizing the About box . . . . . . . . . . . . . . . . . . . . . . . . . . . . . . . . . . . . . . . . . . . . . . . . . . . . . . . . 66Understanding Actuate Analytics Cube Viewer localization limitations . . . . . . . . . . . . . . . . . . 69Localizing the user interface . . . . . . . . . . . . . . . . . . . . . . . . . . . . . . . . . . . . . . . . . . . . . . . . . . . . . . . . 70Unsupported changes . . . . . . . . . . . . . . . . . . . . . . . . . . . . . . . . . . . . . . . . . . . . . . . . . . . . . . . . . . . . . 72
Index . . . . . . . . . . . . . . . . . . . . . . . . . . . . . . . . . . . . . . . . . . . . . . . . . . . . . . . 73

iv

A b o u t W o r k i n g w i t h C u b e R e p o r t s u s i n g A c t u a t e A n a l y t i c s O p t i o n v
A b o u t W o r k i n g w i t hC u b e R e p o r t s u s i n g
A c t u a t e A n a l y t i c sO p t i o n
Working with Cube Reports using Actuate Analytics Option provides information about analyzing data from Actuate Cube reports to understand market trends and relationships, such as differences, averages, and growth trends.
Working with Cube Reports using Actuate Analytics Option includes the following chapters:
■ About Working with Cube Reports using Actuate Analytics Option. This chapter provides an overview of this guide.
■ Chapter 1. Starting Actuate Analytics Cube Viewer. This chapter provides an overview of Actuate Analytics Cube Viewer and Actuate Analytics option. This chapter also describes how to access a cube report to start using Actuate Analytics Cube Viewer.
■ Chapter 2. Viewing data. This chapter describes the Actuate Analytics Cube Viewer views, how to set up views of data, and how to navigate the various views. The chapter also describes how to use filters to narrow the scope of a data view.
■ Chapter 3. Customizing data. This chapter describes how to view and present data in various formats. This chapter also describes ways to analyze data by applying functions to calculate sum, difference, average, ratio of values, minimum value, maximum value, percentage of total, and percentage of growth.
■ Chapter 4. Exporting data. This chapter describes how to export data to a spreadsheet, to a word processing program, or to a PDF file.

vi W o r k i n g w i t h C u b e R e p o r t s u s i n g A c t u a t e A n a l y t i c s O p t i o n
■ Chapter 5. Customizing Actuate Analytics Cube Viewer. This chapter describes how a BIRT iServer System administrator can customize the user interface and set default preferences.

C h a p t e r 1 , S t a r t i n g A c t u a t e A n a l y t i c s C u b e V i e w e r 1
C h a p t e r
Chapter 1Starting Actuate AnalyticsCube Viewer
This chapter contains the following topics:
■ About Actuate Analytics Cube Viewer and Actuate Analytics option
■ Launching Actuate Analytics Cube Viewer using a cube report

2 W o r k i n g w i t h C u b e R e p o r t s u s i n g A c t u a t e A n a l y t i c s O p t i o n
About Actuate Analytics Cube Viewer and Actuate Analytics option
Actuate Analytics Cube Viewer supports the multidimensional analysis of data. Actuate Analytics Cube Viewer enables you to view data as tables, bar charts, pie charts, and line graphs. You can then drill down into that data to determine relationships and trends.
Using Actuate Analytics Cube Viewer, you choose which data to include in a graphic comparison. You can then manipulate the data display in tables and charts and save them as cube reports in an Encyclopedia volume.
Actuate Analytics Cube Viewer is an application distributed as a component of Information Console and Actuate Management Console.
Using Actuate Analytics Cube Designer, a developer creates a cube profile and adds it to an Encyclopedia volume where you can access it. A profile contains specifications for building and running a cube.
To use Actuate Analytics Cube Viewer, complete the following tasks:
■ In the Encyclopedia volume, run or schedule the cube profile to generate multidimensional data cubes for analysis. BIRT iServer retrieves data, structures the data in a data cube, and adds the data cube to the Encyclopedia volume.
■ Analyze the data using Actuate Analytics Cube Viewer. When analyzing a cube, you can aggregate or categorize data, summarize data, and create graphs based on the data.
Using Actuate Analytics Cube Viewer, you can view an existing cube in an Encyclopedia volume. If the Actuate Analytics option is enabled for BIRT iServer System, you can run and schedule cube profile generation in an Encyclopedia volume if you have the appropriate privileges. Actuate Analytics option is a licensing option enabled using a licensing key. For more information about installing and enabling Actuate Analytics option, see Installing BIRT iServer for Windows. For information about privileges, see Using Information Console.
Actuate Analytics Cube Viewer cannot display data correctly unless the operating system on which you start the web browser has the appropriate locale setting. The operating system locale setting determines which fonts are available for display. For example, if you use a web browser for which the locale setting is US English to access a report containing Chinese characters, Actuate Analytics Cube Viewer cannot display Chinese characters, because the fonts are not available.

C h a p t e r 1 , S t a r t i n g A c t u a t e A n a l y t i c s C u b e V i e w e r 3
Launching Actuate Analytics Cube Viewer using a cube report
Before you can use Actuate Analytics Cube Viewer, you access a cube report in an Encyclopedia volume. The following procedure explains briefly how to access Actuate Analytics Cube Viewer on the web.
How to access a cube report
1 Start your web browser.
2 If your company has a web site with a link to the login page, choose the link. If not, go to the next step.
3 Type a URL for the Information Console login page, such as the following URL sample:
http://actuate1:8900/iportal/login.do?repositoryType=Enterprise&serverURL=http://actuate2:8000
where
■ actuate1:8900 is the BIRT iServer that runs web pages that provide the interface to the Encyclopedia volume.
■ iportal is a keyword that indicates access to Information Console.
■ login.do is the web page that displays the login interface.
■ repositoryType=Enterprise indicates using an Encyclopedia volume.
■ serverURL=http://actuate2:8000 specifies the location of the BIRT iServer System that manages the Encyclopedia volume.
Your BIRT iServer configuration and security implementation can require you to use a different URL to view a report in the Encyclopedia volume. For more information, see your BIRT iServer System administrator.
4 Press Enter.
5 In the Information Console login page, complete the following tasks:
■ Select a volume from the drop-down list.
■ Type your user name.
■ Type your password.
■ Select a language from the drop-down list. Your selection determines the language to use for the user interface. You can change the language setting when you log in to the volume.

4 W o r k i n g w i t h C u b e R e p o r t s u s i n g A c t u a t e A n a l y t i c s O p t i o n
■ Select a time zone from the drop-down list. Your selection determines the time stamp the BIRT iServer uses for files. You can change the time zone setting when you log in to the volume.
■ Choose Log In.
An initial Encyclopedia volume page appears, as shown in Figure 1-1.
Figure 1-1 An Encyclopedia volume page
How to launch Actuate Analytics Cube Viewer
1 In Cubes You Can View, choose the cube report to view.
2 In Security Warning choose one of the following options:
■ Deselect Always trust content from this publisher then choose Run to start Actuate Analytics Cube Viewer for this particular session.
■ Select Always trust content from this publisher then choose Run to enable Actuate Analytics Cube Viewer for every session.
Actuate Analytics Cube Viewer appears in a browser and presents a view of the data in the cube. The initial view is in table format, as shown in Figure 1-2.
Figure 1-2 The initial view
3 To view another cube report, choose the browser Back button to return to the previous Encyclopedia volume page.

C h a p t e r 2 , V i e w i n g d a t a 5
C h a p t e r
Chapter 2Viewing dataThis chapter contains the following topics:
■ About data analysis
■ About Actuate Analytics Cube Viewer
■ Selecting an experience level
■ Expanding and collapsing the data
■ Displaying data in tables, charts, and graphs
■ Displaying balloon help
■ Sorting the data
■ Using filters
■ Searching for categories and subcategories
■ Manipulating the data
■ Restoring the initial view

6 W o r k i n g w i t h C u b e R e p o r t s u s i n g A c t u a t e A n a l y t i c s O p t i o n
About data analysisUsing Actuate Analytics Cube Viewer, you can view and analyze trends in multiple categories of data simultaneously. Identifying the data and trends among multiple categories is easier than if you used a traditional two-dimensional spreadsheet view. You can apply filters simultaneously to multiple categories so that you can view relationships among them.
Using Actuate Analytics Cube Viewer, you can answer questions such as:
■ How do total sales break down by product?
■ What are product A’s sales over time?
■ How many units of product B shipped to all locations in April?
You can quickly manipulate the data in the view and change how the data display appears.
About the data cubeA data cube is a multidimensional data structure that provides multiple measures and categories to access or analyze large quantities of data. A data cube or .cb4 file is generated from a cube profile. For information on building cube profiles see the documentation for Actuate Analytics Cube Designer. You can run cube files or .cb4 files on the BIRT iServer, manipulate the data in the cube, and save it as a cube report or a .cvw file.
About categories and measuresA category is a data grouping used by Actuate Analytics Cube Viewer to create an axis of a cube for presentation of a data view. The view displays two categories of the data at a time. One category appears on the vertical rows axis and one on the horizontal columns axis.
A category lists all the distinct entries found in a specific field. For example, within the payment method category, you can have entries such as Visa™, American Express™, and MasterCard™. Categories that contain numeric data are collectively labeled measures. The category bar that appears in the view contains all the categories of the cube. By default, the measures category appears on the right in the category bar. In the initial view, the measures category appears on the columns axis.
A subcategory is a group within a category. Subcategories appear in rows on the vertical axis and in columns on the horizontal axis. For example, within the category labeled Date, you can have the subcategories labeled 2004 and 2005. Within the measures category, you can have subcategories labeled Cost, Quantity, and Sales.

C h a p t e r 2 , V i e w i n g d a t a 7
About Actuate Analytics Cube Viewer When you start Actuate Analytics Cube Viewer, the initial view of the cube displays all categories on the rows axis and displays the first measures category on the columns axis. This view is the top level of all of the cube categories in table format. No functions or filters apply to the data that appears in the initial view.
Recognizing features in Actuate Analytics Cube ViewerFigure 2-1 shows the features of Actuate Analytics Cube Viewer.
Figure 2-1 Actuate Analytics Cube Viewer features
Using the Actuate Analytics Cube Viewer toolbarThe number of features on the Actuate Analytics Cube Viewer toolbar depends on experience level of the user. The illustrations in this section display the features available for the advanced experience level. The Actuate Analytics Cube Viewer toolbar supports the following tasks:
■ Reorganizing the data view with one click
■ Expanding the columns or rows display
■ Accessing menus with additional view controls
■ Accessing menus to export data
■ Saving your analysis of cubes files as cube reports
Figure 2-2 shows buttons that control the data display. Each button displays a new graphic view.
Columns axis subcategories
Category bar
Data display area
View title
Rows axis subcategoriesCategory
Columns axis category labelRows axis category label

8 W o r k i n g w i t h C u b e R e p o r t s u s i n g A c t u a t e A n a l y t i c s O p t i o n
Figure 2-2 Toolbar buttons that control the data display
Figure 2-3 shows buttons that change the view with one click. The Vertical fit to page and Horizontal fit to page buttons change the height of the rows or the width of the columns with the first click. A second click returns the previous view. If you want to change actions you make, choose the Undo or Redo button.
Figure 2-3 Toolbar buttons that change the view with one click
Figure 2-4 shows buttons that access additional menus to perform calculations, set global preferences, choose views, and get help.
Figure 2-4 Toolbar buttons that access additional menus
Figure 2-5 shows the buttons that access additional menus that enable you to export data in several forms and to e-mail or print the view.
Figure 2-5 Toolbar buttons that access more menus
Table view
Pie chartHorizontal bar chart
Vertical bar chart
Line graph
Vertical fit to page
Horizontal fit to page
Undo
Redo
HelpCalculations
PreferencesException highlighting
Save
PrintSave as Microsoft WordSave as Microsoft ExcelCollaborate

C h a p t e r 2 , V i e w i n g d a t a 9
Selecting an experience levelYou can select an experience level that best suits your needs and experience. Each experience level offers a unique set of features for working with data. For example, one experience level can be appropriate for viewing cube reports, while another experience level is appropriate for advanced analysis. The experience levels that are available in Actuate Analytics Cube Viewer are:
■ Novice
■ Standard
■ Advanced
Each experience level sets the visibility of the following user interface elements:
■ Bar elements, such as category bar, toolbar, view bar, title banner, and title box
■ Toolbar buttons
■ Context menu items
The novice experience level enables fewer features than standard or advanced. Set the experience level to standard or advanced to enable the features that appear in Table 2-1.
When working with an Actuate cube report on the web, if you save the cube report in the Encyclopedia volume, Information Console saves the experience level for the saved cube report. Accessing that saved cube report launches cube viewer using the saved experience level.
Table 2-1 Features available to standard and advanced experience levels
Available feature
Experience level
Standard Advanced
Line chart Fit to page Save or Delete view Categories appear on category bar Filter, Search, and Expand to Level Functions View raw data as text or spreadsheet Exception highlighting

10 W o r k i n g w i t h C u b e R e p o r t s u s i n g A c t u a t e A n a l y t i c s O p t i o n
For more information about how an Information Console Administrator can modify Actuate Analytics experience levels, see Information Console Developer Guide.
How to select an experience level
1 On the toolbar, choose Preferences.
2 From the menu, choose Experience Level, then select an experience level, as shown in Figure 2-6. The default experience level is Standard.
Figure 2-6 Selecting an experience level
How to set a default experience level
You can set a default experience level in Information Console.
1 In Information Console, choose Options, as shown in Figure 2-7.
Figure 2-7 Choosing Options in Information Console
2 On Options—General, set an Analytics experience level. For example, set Analytics experience level to Advanced, as shown in Figure 2-8.
Figure 2-8 Setting Analytics experience level to Advanced
Options

C h a p t e r 2 , V i e w i n g d a t a 11
Choose Save Options.
Expanding and collapsing the dataBy expanding and collapsing data, you view detailed or summarized information in the cube. You can expand or collapse data. Each time you expand or collapse the data, the selection of data values changes and the view instantly changes.
Expanding the dataTo display detailed information, you expand the categories and data in the data display area and on the axes. You can expand the subcategories on the rows or the columns axis in one of the following ways:
■ Choose the plus sign (+) on a subcategory.
■ Right-click a subcategory label or data in the data display area to show a context menu. Choose Expand to level and select a subcategory level.
■ Double-click a subcategory or data element in the view.
The subcategory expands, displays a lower level of subcategories, and updates the data to reflect your selection.
If a plus sign (+) does not appear next to a data label, the subcategory is fully expanded. If Expand to level does not appear on the context menu, the information is the most detailed you can display. In these cases you cannot expand the data any farther.
Collapsing the dataYou can collapse subcategories to display summarized information. To collapse subcategories on the rows or columns axis, do one of the following:
■ Choose the minus sign (-) on a subcategory.
■ Right-click a subcategory label or data element in the data display area to show a context menu. Choose Collapse.
The subcategory collapses, displays a higher level subcategory, and updates the data to reflect your selection.
Collapsing the data displays summarized information and the most inclusive category label appears.

12 W o r k i n g w i t h C u b e R e p o r t s u s i n g A c t u a t e A n a l y t i c s O p t i o n
Displaying data in tables, charts, and graphsTo display and work with the data stored in the cube, choose from the buttons on the toolbar to view the data in the following forms:
■ Table
■ Analysis View
■ Presentation View
■ Vertical Bar Chart
■ Horizontal Bar Chart
■ Pie Chart
■ Line Graph
Navigating a tableThe table compares all of the subcategories on the columns axis with the subcategories on the rows axis. To include more data or less data in the table, expand or collapse the data.
Navigating an analysis viewChoosing View allows you to select between analysis and presentation view. Analysis view presents the data as a table, chart, or graph. You can perform analysis tasks such as arranging data categories and inserting calculated rows and columns.
Navigating a presentation viewChoosing View allows you to select between analysis and presentation view. In the presentation view data is presented as a table, chart, or graph. You can display, hide, or resize a chart or graph legend by selecting and dragging the right edge of the chart or graph. You can also right-click the legend for more options. In a presentation view, categories are not available for analysis tasks such as arranging data categories and inserting calculated rows and columns.
Navigating a vertical bar chartA vertical bar chart compares all of the subcategories in a bar chart on the columns axis with one or more selected subcategories on the rows axis, as shown in Figure 2-9. The chart appears as a set of vertical bars for the selected data in the rows. To navigate through the data in a vertical bar chart, select any rows axis

C h a p t e r 2 , V i e w i n g d a t a 13
subcategory label or labels. The selection changes the base data of the vertical bar chart.
Figure 2-9 A vertical bar chart
If you select a stacked bar chart, you can display data values as segments of a single stacked bar. The height of the bar represents the total value of all the segments in the subcategory, as shown in Figure 2-10.
Figure 2-10 A stacked bar chart
If you select a stacked hundred percent bar chart, the chart displays subcategories values as stacked bar segments that add up to 100% in each subcategory.
Navigating a horizontal bar chartA horizontal bar chart compares all of the subcategories in a bar chart on the rows axis with one or more selected subcategories on the columns axis. The chart appears as a set of horizontal bars for the selected data in the columns. To navigate through the data in a horizontal bar chart, select any columns axis subcategory label or labels. The selection changes the base data of the horizontal bar chart.

14 W o r k i n g w i t h C u b e R e p o r t s u s i n g A c t u a t e A n a l y t i c s O p t i o n
Navigating a pie chartA pie chart compares a selected single base subcategory on the columns axis with one or more selected subcategories on the rows axis. The chart appears as a segmented pie for the selected data in the column and rows. To navigate through the data in a pie chart, select any columns axis subcategory label or labels. The selection changes the base data of the pie chart.
Navigating a line graphA line graph is a chart that compares a trend for all subcategories on the columns axis with all of the subcategories at the lowest selected level on the rows axis. The chart appears as connected points for the selected data in the columns and rows. To navigate through the data in a line graph, select any rows axis subcategory label or labels. The selection changes the base data of the line graph.
Displaying balloon helpIn all of the graphical formats for Actuate Analytics Cube Viewer, you can use balloon help to find more detail about the data display. Hover the pointer over a graphic element, such as a pie chart segment or a data point on a line graph. The balloon help appears with more information about the data element. If you move the pointer over a pie chart segment, the balloon help always displays the numeric value of the section, not the percent represented by the segment.
For example, in Figure 2-11, the balloon help displays a sales revenue amount as well as the row and column reference for the pie chart segment. The balloon help also displays the Right click for options item to choose other options.
Figure 2-11 Displaying balloon help

C h a p t e r 2 , V i e w i n g d a t a 15
Sorting the dataTo display trends and deviations, sort columns and rows of data numerically. Use the plus sign (+) or the minus sign (-) to increase or decrease the number of columns and rows that you want to view on each axis.
You can only sort one column subcategory and one row subcategory at the same time. While you view a pie chart, you are unable to sort data.
Sorting data by columnsSorting data on a column changes the order of the rows that appear.
How to sort data by columns
1 Right-click a subcategory label on the columns axis, such as Sales. A menu appears, as shown in Figure 2-12.
Figure 2-12 Sorting data by columns
2 Choose Sort. The Sort options appear as shown in Figure 2-13.
Figure 2-13 Sort options
3 Select one of the following sort options:

16 W o r k i n g w i t h C u b e R e p o r t s u s i n g A c t u a t e A n a l y t i c s O p t i o n
■ Show highest 10 displays the greatest ten values.
■ Show lowest 10 displays the lowest ten values.
■ Highest to lowest displays the values with the greatest value at the top of the column.
■ Lowest to highest displays the values with the lowest value at the top of the column.
■ Custom displays Custom Sort, which enables you to choose to display only a specific number of the highest or lowest values in the column.
An arrow appears in the lower right corner of a sorted subcategory, as shown in Figure 2-14. The arrow points in the direction of the greatest value in the sorted subcategory.
Figure 2-14 An arrow indicates that sorting applies
4 To change the sort order, do one of the following:
■ To reverse the sort order, choose the sort arrow.
■ Right-click the subcategory and choose between Sort➛Highest to lowest and Sort➛Lowest to highest.
Sorting data by rowsYou can sort rows of data numerically to display trends and deviations. Sorting data on a row changes the order of the columns in the data display.
How to sort data by rows
1 Right-click a subcategory on the rows axis. A menu appears, as shown in Figure 2-15.
Figure 2-15 Sorting data by rows

C h a p t e r 2 , V i e w i n g d a t a 17
2 Choose Sort. The Sort options appear, as shown in Figure 2-16.
Figure 2-16 Sort options
3 Select one of the following sort options:
■ Show highest 10 displays the greatest ten values.
■ Show lowest 10 displays the lowest ten values.
■ Highest to lowest displays the values with the greatest value in the left column.
■ Lowest to highest displays the values with the lowest value in the right column.
■ Custom displays Custom Sort, which enables you to choose to display only a specific number of the highest or lowest values in the column.
An arrow appears on the right side of the sorted subcategory, as shown in Figure 2-17. The arrow points in the direction of the greatest value in the sorted subcategory.
Figure 2-17 An arrow indicates that sorting applies
4 To change the sort order, do one of the following:
■ To reverse the sort order, choose the arrow.
■ Right-click the subcategory and choose between Sort➛Highest to lowest and Sort➛Lowest to highest.
Canceling sorting on columns or rowsAfter applying sorting, an arrow appears in the lower right corner of the subcategory label to indicate a change in the data display, as shown in Figure 2-18.

18 W o r k i n g w i t h C u b e R e p o r t s u s i n g A c t u a t e A n a l y t i c s O p t i o n
Figure 2-18 An arrow indicates that sorting applies
How to cancel sorting on a columns or rows axis
1 Right-click the sorted subcategory.
2 On the menu, choose Sort➛Cancel sorting. Actuate Analytics Cube Viewer removes the sorting. The arrow disappears from the subcategory to indicate there is no sorting.
Applying a filter to sort the highest or lowest valuesIn a subcategory, to determine the lowest or highest subcategories, you can filter and sort the data to display only the highest or lowest values. When you apply a highest or lowest filter, an arrow appears in the lower right corner of a subcategory to indicate sorting of the data.
How to sort the highest or lowest values
1 Right-click a subcategory in the column or row. The selected subcategory menu appears.
2 Choose Sort➛Custom. Sort appears, as shown in Figure 2-19.
Figure 2-19 Selecting Sort options
3 In Sort, you can do the following:
■ In Show, select lowest or highest and enter the number of values you want to appear in the view.

C h a p t e r 2 , V i e w i n g d a t a 19
■ In Show, if you select all values, you can select Disregard hierarchy. This option enables sorting data numerically without displaying the value in its category hierarchy.
■ In Sort, select the sort order, lowest to highest or highest to lowest.
4 Choose OK. The sorted numbers appear in the view.
Using filtersUsing Actuate Analytics Cube Viewer, you apply a filter that specifies a range of data that appear in the view. You can apply filters simultaneously to multiple categories so that you can view their relationships.
Writing filter expressionsUse the following syntax conventions for filter expressions:
■ X to represent the subcategory name
■ Parentheses ( ) to indicate the order of the operations
■ OR, AND, or NOT if you use more than one expression
■ Operators: <, <=, >, >=, =
Do not use commas or dollar signs. For example, if you want to display sales between $10,000 and $100,000, inclusive, type the filter expression:
(x>=10000) AND (x<=100000)
To apply filters to floating point numbers, do not use the expression x=. Use the expressions x> and x<. For example, if you want to display values between $2.25 and $10.50, type the filter expression:
(x>2.25) AND (x<10.5)
If none of the data that appears meets the filter criteria, you see the following message:
There is no data to display.
Applying filters to columns or rowsYou can filter the data that appears in a cube by selecting a subcategory on the columns axis or rows axis. This filter selects and displays values on the columns or rows axes that meet certain conditions.

20 W o r k i n g w i t h C u b e R e p o r t s u s i n g A c t u a t e A n a l y t i c s O p t i o n
How to apply a filter on a subcategory
1 Right-click a subcategory on the columns axis or rows axis. The selected subcategory menu appears.
2 On the menu, choose Filter by value, as shown in Figure 2-20.
Figure 2-20 Choosing Filter by value
3 In Filter by Value in the Filter field, as shown in Figure 2-21, type the required filter expression using the displayed operators. Choose OK.
Figure 2-21 Filter by Value
A filter icon appears in the lower right corner of the subcategory to indicate that there is a filter, as shown in Figure 2-22.
Figure 2-22 An arrow indicates that filtering applies
Clearing filters on columns or rowsAfter applying a filter, a filter icon appears in the lower right corner of the subcategory label to indicate a change in the data display, as shown in Figure 2-23.

C h a p t e r 2 , V i e w i n g d a t a 21
Figure 2-23 An arrow indicates that filtering applies
How to clear a filter on a columns or rows axis
1 Right-click the filtered subcategory.
2 On the menu, choose Cancel value filter. Actuate Analytics Cube Viewer removes the selected subcategory filter. The filter icon disappears from the subcategory to indicate there is no filter.
You can choose Reports➛Home to clear all filters, cancel all sorting, and return to the default preferences of the initial view.
Applying filters in the category barYou can filter the data in a cube by selecting one or more subcategories from one or more categories in the category bar.
How to apply a filter in the category bar
1 On the category bar, right-click a category label. Select: <category name> displays the chosen category’s list of subcategories, as shown in Figure 2-24.
Figure 2-24 Select: <category name> dialog box
In the list, if necessary, choose the plus sign (+) next to a subcategory to display the underlying subcategories. You can also use the Expand to level drop-down list to expand the various subcategories.
2 Select the subcategories through which you want to filter the data, as shown in Figure 2-25.

22 W o r k i n g w i t h C u b e R e p o r t s u s i n g A c t u a t e A n a l y t i c s O p t i o n
Figure 2-25 Selecting subcategories
Only the data for the specific subcategories you select appears in the display area of the view. A filter icon appears next to the category label in the category bar to indicate the filtering, as shown in Figure 2-26.
Figure 2-26 A filter icon indicates that filtering applies
If you are selecting from a date category, Select can offer the option to use relative time periods, as shown in Figure 2-27. This option is available if the data in the cube supports relative time periods.
Figure 2-27 Select Time Period dialog box
If you select a relative time period, such as previous year to date, the resulting table, chart, or graph shows only data for that time period. The available time

C h a p t e r 2 , V i e w i n g d a t a 23
periods are relative to the reference date of the data that appears in Select Time Period. For example, Figure 2-28 shows the selection of Previous year to date and Use relative time periods as of March 10, 2006.
Figure 2-28 Selecting Previous Year to Date
3 To remove the sorting, choose the subcategory at the top of the list, or choose Reset.
Applying filters on a category axisYou can apply filters on the category axis to filter the categories and subcategories that you want to show on a rows or columns axis. You filter the categories and subcategories using the categories and subcategories labels text.
How to apply a filter on a category axis
Apply a filter to specify which category and subcategory labels appear in the view.
1 On an axis, right-click a category label and choose Filter by pattern.
Filter by Pattern appears, as shown in Figure 2-29.

24 W o r k i n g w i t h C u b e R e p o r t s u s i n g A c t u a t e A n a l y t i c s O p t i o n
Figure 2-29 Filter by Pattern
2 To specify the category or subcategory label to filter, select one of the following:
■ Whole word if you know the exact text in the label
■ Contains if you want to use specific letters or numbers in the label
■ Starts with if you want to use the text with which the label starts
■ Ends with if you want to use the text with which the label ends
3 In Patterns, type the letters or numbers you want to filter.
4 You can select the following to apply to the filter:
■ Case-sensitive requires that the category text matches the case of the text you type in Patterns.
■ Show matching enables the filter to apply to all subcategories on the axis.
5 Choose OK. Actuate Analytics Cube Viewer applies the filter. A filter icon appears next to the category axis label to indicate the filtering, as shown in Figure 2-30.
Figure 2-30 A filter icon indicates that filtering applies
How to cancel or edit a filter on a category axis
1 On an axis, right-click a category label.
2 On the menu, do one of the following:
■ To cancel the filter, choose Cancel pattern filter. Actuate Analytics Cube Viewer removes the filter.

C h a p t e r 2 , V i e w i n g d a t a 25
■ To edit the filter, choose Edit pattern filter.In Filter by Pattern, complete the following tasks:
❏ Edit the filter criteria.
❏ Choose OK to apply the changes.
Searching for categories and subcategoriesYou can search an axis for category and subcategory labels.
How to search for categories and subcategories
1 On the rows or columns axis, right-click a category label. The selected category menu appears.
2 On the menu, choose Find. Find appears, as shown in Figure 2-31.
Figure 2-31 The Find dialog box
3 Type one or more characters.
4 Choose Find Next. Actuate Analytics Cube Viewer searches the selected category, navigates to the first category or subcategory label that matches the search string, and highlights the label in the view.
5 To find another match, choose Find Next.
Manipulating the dataYou can manipulate the data in the following ways:
■ Display categories on rows and columns.
■ Swap rows and columns.
■ Sort the data by rows or columns.
■ Select and deselect subsets of data.

26 W o r k i n g w i t h C u b e R e p o r t s u s i n g A c t u a t e A n a l y t i c s O p t i o n
■ Hide data.
■ Suppress rows and columns with no data or with zero values.
Displaying categories on rows and columnsYou can display any categories in a cube on the rows or columns axis. When you display a category on a row or column, you can collapse, expand, filter, sort, and hide the data using its subcategories. You can also create a hierarchy of categories by adding as many as four categories to an axis.
How to replace and display a category on a row or column
1 From the categories bar, select and hold the raised move handle on the left side of the category label, as shown in Figure 2-32.
Figure 2-32 Selecting the move handle on a category label
2 Drag the category label and position it over the category you want to replace on the row or column until you see the rectangular highlight box appear, as shown in Figure 2-33.
Figure 2-33 Dragging a category label
3 Release the category label. The category appears on the axis and updates the data to reflect your selection.
How to display more than one category on an axis
1 From the category bar, select and hold the raised move handle on the left side of a category label, as shown in Figure 2-34.
Move handle

C h a p t e r 2 , V i e w i n g d a t a 27
Figure 2-34 Selecting a move handle
2 Drag the category label and position the label to the left or right side of the rows axis subcategory labels until you see a black highlight line appear, as shown in Figure 2-35.
Figure 2-35 Dragging a category label
3 Release the category label. The category label appears on the rows axis, as shown in Figure 2-36.
Figure 2-36 The category label appears on the rows axis
The category appears on the rows axis in the place that you released it and updates the data to reflect your change.
Move handle

28 W o r k i n g w i t h C u b e R e p o r t s u s i n g A c t u a t e A n a l y t i c s O p t i o n
By dragging a category label from the category bar to the columns axis, you can display more than one row on the columns axis, as shown in Figure 2-37.
Figure 2-37 Displaying more than one row on the columns axis
Swapping rows and columnsYou can view the data in the data display area from a different perspective by swapping the category on one axis with the category on the other axis.
How to swap axes
1 Right-click the rows or columns category label.
2 Choose Swap rows and columns from the context menu, as shown in Figure 2-38.
Figure 2-38 Swapping rows and columns
The categories swap on the axes and update the data to reflect your selection.
Selecting and deselecting subsets of dataYou can view subsets of data by selecting and grouping subcategories. After you select subcategories, you can hide the selected subcategories, hide the unselected subcategories, or apply a function to the selected subcategories.

C h a p t e r 2 , V i e w i n g d a t a 29
How to select a subcategory
1 Move the pointer over a subcategory label.
2 Choose the subcategory label.
How to select a group of subcategories
1 Select one subcategory label.
2 To add a subcategory to the current set of selected subcategories, press and hold down Ctrl. Then, select a subcategory label. Using Ctrl keeps the subcategories in the order that you selected them.
How to select a range of subcategories
1 Select one subcategory label.
2 Press and hold down Shift. Then select the subcategory label of the last subcategory in the range. Using Shift does not preserve the order of the subcategories selected. By default, the selected subcategories appear in order from left to right or from top to bottom. The first subcategory in the sort is the left or top subcategory.
How to deselect a subset of data
Do one of the following:
■ Press Esc.
■ Press and hold Ctrl. Then, click the selected subcategory label.
Hiding dataTo hide a small number of subcategories, select the subcategories you want to hide. Then, choose Hide selected. To hide a large number of subcategories, select the subcategories you do not want to hide. Select Hide unselected.
The Hide option is not available in the pie chart view.
How to hide selected subcategories
1 Select one subcategory label.
2 To add or remove subcategories in the current set of selected subcategories, press and hold Ctrl. Then, select additional subcategory labels.
3 Right-click the subcategory label of a selected subcategory. The selected subcategory menu appears, as shown in Figure 2-39.

30 W o r k i n g w i t h C u b e R e p o r t s u s i n g A c t u a t e A n a l y t i c s O p t i o n
Figure 2-39 Hiding selected categories
4 On the context menu, complete one of the following tasks:
■ Choose Hide selected. The selected subcategories do not appear in the display.
■ Choose Hide unselected. The unselected subcategories do not appear in the display.
A filter icon appears next to the category label to which the filter applies as shown in Figure 2-40.
Figure 2-40 A filter icon indicates that a filter applies
How to display hidden subcategories
1 Right-click a subcategory or axis label.
2 On the menu, choose Cancel hiding. The hidden subcategories appear.
Expanding to level in a categoryUsing Expand to level, you can quickly expand a category or data item to a specific level in its hierarchy. For example, in a Date category with a Year, Quarter, and Month hierarchy, you can use Expand to level to expand Date to the month level in a single step.
How to expand a category or data item to a specific level
1 Right-click a category label or data item label.
2 Move the pointer over Expand to level in the menu, as shown in Figure 2-41. Select a level name.

C h a p t e r 2 , V i e w i n g d a t a 31
Figure 2-41 Expanding a category or data item
3 To collapse the category or data level, choose Collapse in the menu.
Suppressing rows and columns with no dataBy suppressing rows or columns that do not contain any data, you can filter out all empty rows subcategories in a cube. When you suppress empty rows, rows that contain data with zero values appear.
You can suppress all rows and columns that have no data in the cube by setting a general preference or you can suppress subcategories that have no data in one or more rows or columns. The filter expression x!=nan applies to the view or to a selected row, column, or subcategory. In this expression, x!=nan, nan means not a number.
In Preferences, if you set a general preference, the view does not display an indication that a general preference applies to the view.
If you apply a preference to a row, column, or category label, Actuate Analytics Cube Viewer displays a filter icon to indicate that the view contains suppressed rows or columns. A filter icon appears in a category label as shown in Figure 2-42.
Figure 2-42 A filter icon indicates that a filter applies
How to hide all rows and columns with no data
1 On the toolbar, choose Preferences➛Rows.
2 On Rows, deselect Show blank rows, as shown in Figure 2-43.

32 W o r k i n g w i t h C u b e R e p o r t s u s i n g A c t u a t e A n a l y t i c s O p t i o n
Figure 2-43 Deselecting Show blank rows
3 Choose Columns.
4 On Columns, deselect Show blank columns, as shown in Figure 2-44.
Figure 2-44 Deselecting Show blank columns
Choose OK. All the rows and columns subcategories that do not contain data do not appear.
How to display all rows and all columns with no data
1 On the toolbar, choose Preferences➛Rows.
2 On Rows, select Show blank rows.
3 Choose Columns.
4 On Columns, select Show blank columns. Choose OK. All the rows and columns subcategories that do not contain data appear.
How to hide rows or columns with no data
1 Right-click a subcategory label on a row or column.
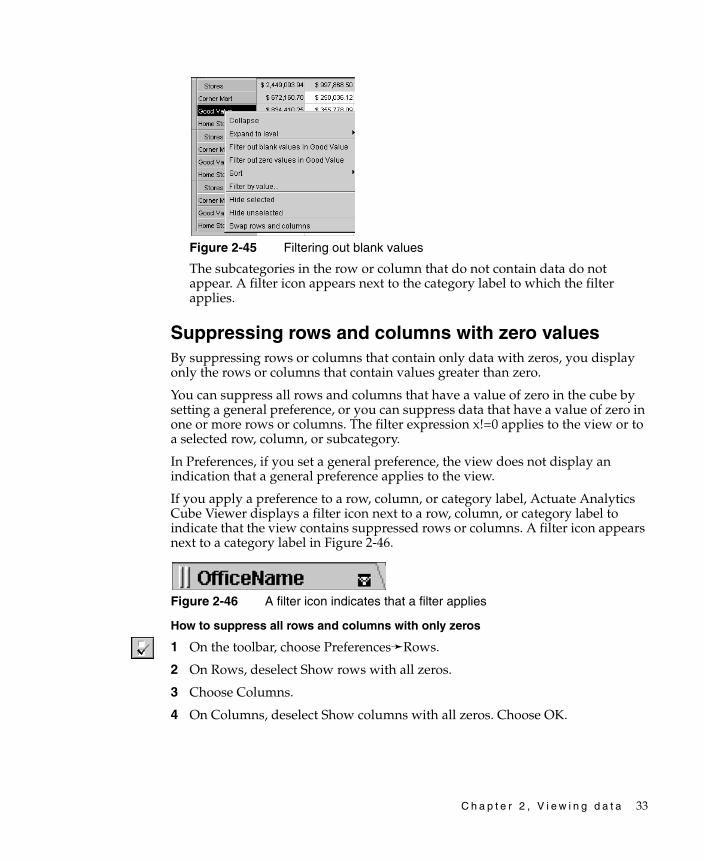
2 On the subcategory menu, choose Filter out blank values, as shown in Figure 2-45.
C h a p t e r 2 , V i e w i n g d a t a 33
Figure 2-45 Filtering out blank values
The subcategories in the row or column that do not contain data do not appear. A filter icon appears next to the category label to which the filter applies.
Suppressing rows and columns with zero valuesBy suppressing rows or columns that contain only data with zeros, you display only the rows or columns that contain values greater than zero.
You can suppress all rows and columns that have a value of zero in the cube by setting a general preference, or you can suppress data that have a value of zero in one or more rows or columns. The filter expression x!=0 applies to the view or to a selected row, column, or subcategory.
In Preferences, if you set a general preference, the view does not display an indication that a general preference applies to the view.
If you apply a preference to a row, column, or category label, Actuate Analytics Cube Viewer displays a filter icon next to a row, column, or category label to indicate that the view contains suppressed rows or columns. A filter icon appears next to a category label in Figure 2-46.
Figure 2-46 A filter icon indicates that a filter applies
How to suppress all rows and columns with only zeros
1 On the toolbar, choose Preferences➛Rows.
2 On Rows, deselect Show rows with all zeros.
3 Choose Columns.
4 On Columns, deselect Show columns with all zeros. Choose OK.

34 W o r k i n g w i t h C u b e R e p o r t s u s i n g A c t u a t e A n a l y t i c s O p t i o n
How to display all rows and all columns with only zeros
1 On the toolbar, choose Preferences➛Rows.
2 On Rows, select Show rows with all zeros, as shown in Figure 2-47.
Figure 2-47 Selecting Show rows with all zeros
3 Choose the Columns.
4 On Columns, select Show columns with all zeros. Choose OK.
How to suppress rows or columns with a value of zero
1 Select a subcategory label.
2 Right-click the selected subcategory label.
3 From the subcategory menu, choose Filter out zero values. The row or column subcategories that have a value of zero do not appear. A filter icon appears next to the subcategory label to which the filter applies.
How to display rows or columns with zero value
1 Right-click the subcategory label that contains a filter icon.
2 From the subcategory menu, choose Cancel filter.
Restoring the initial viewWhen you start Actuate Analytics Cube Viewer, the initial view appears, displaying data in table format with no sorting or filters applied. After applying filters and sorting, you can quickly restore the initial view, removing all filters and sorting and resetting preferences to the default settings.
How to restore the initial view
To restore the initial view, on the toolbar, choose Reports➛Home. Actuate Analytics Cube Viewer removes all sorting, filtering, and customizing and displays the data in table format.

C h a p t e r 3 , C u s t o m i z i n g d a t a 35
C h a p t e r
Chapter 3Customizing dataThis chapter contains the following topics:
■ About customizing data
■ Presenting data
■ Analyzing data
■ About exception highlighting
■ About exporting detail data to a spreadsheet

36 W o r k i n g w i t h C u b e R e p o r t s u s i n g A c t u a t e A n a l y t i c s O p t i o n
About customizing dataUsing Actuate Analytics Cube Viewer, you can do the following:
■ Arrange and present the data in table or chart format.
■ Show or hide features in the display to present a custom data view.
■ Analyze data by applying functions to compare or combine the data in subcategories.
Presenting dataBy customizing the presentation of data, you choose categories and subcategories to view, select ranges of data values, and choose the display type.
Use the options in Table 3-1 to customize your data presentation.
Selecting a chart styleTo select a chart style, you choose one of the chart style buttons to select the corresponding view of the data. The view updates to reflect your selection.
On the toolbar, choose from the following data displays:
■ Table
■ Vertical Bar Chart
■ Horizontal Bar Chart
■ Pie Chart
■ Line Graph
Table 3-1 Presentation options
Presentation features Effects
Chart style Displays data in a table, vertical bar chart, horizontal bar chart, pie chart, or line graph
Fit to page Adjusts the rows and columns to fill the data display area
Main title Displays text
Preferences Changes settings to modify how your data appears in the data display area

C h a p t e r 3 , C u s t o m i z i n g d a t a 37
Setting preferences for a chartYou can customize a chart’s display using Preferences, as described in the Table 3-2.
Table 3-2 Chart preferences
Chart style
Preference selection
Preference value Effect on chart appearance
Bar Show 3D visual effect
Select to display three-dimensional visual effects. Deselect to display two-dimensional visual effects.
Show data values as
Percentage (%)
Displays values of each bar as a percent of the total subcategory.
Number Displays numeric values of each bar.
Pie Show 3D visual effect
Select to display three-dimensional visual effects. Deselect to display two-dimensional visual effects.
Show data values as
Percentage (%)
Displays percent values of each segment as a percent of the whole pie. Deselect Show data values as to hide the data values.
Number Displays the numeric values of each segment.
Show labels Select to display labels for each segment.
Pie slices Show all slices
Displays all segments.
Limit display by combining slices that are less than this % of the pie
Sets a value for the smallest pie segment that appears in the view. Smaller segments combine to display as the Other segment. If you choose a percent value that results in the Other pie segment equalling 100%, Actuate Analytics Cube Viewer does not combine the subcategories.
Limit display by number of slices
Sets a limit on how many pie segments appear in the view. Additional segments combine to display as the Other segment.
(continues)

38 W o r k i n g w i t h C u b e R e p o r t s u s i n g A c t u a t e A n a l y t i c s O p t i o n
How to set preferences for a bar chart, pie chart, or line graph
1 On the toolbar, choose Preferences➛General.
2 On Preferences—General, choose one of the following:
■ Bar charts
■ Line graph
■ Pie chart
3 Select the preferences you want to apply. Choose OK.
Adjusting the fit to page optionsYou can adjust the width and height of the view in the following ways:
■ Choose the Vertical fit to page button on the toolbar to expand the rows to fill the height of the data display area. Choose the Vertical fit to page button again to shrink the rows to the previous size.
■ Choose the Horizontal fit to page button on the toolbar to expand the columns to fill the width of the data display area. Choose the Horizontal fit to page button again to shrink the columns to the previous size.
■ Drag the line between two subcategories to enlarge or shrink the size of the subcategory in the display area.
■ Drag the border between the subcategories and the data display area to change the size of the display area.
If the width of columns in the table is too narrow to fully display data values in the cells, the values appear as gray bars in the cells, or pound signs (#) appear in the cell. You can choose the Horizontal fit to page button, or drag the border between the cells to increase the width of the cells, enabling the full number of digits to appear.
Line Show data values as
Percentage (%)
Displays values of each point as a percent of the total subcategory.
Number Displays numeric values of each point.
Show labels Displays labels for each point.
Table 3-2 Chart preferences (continued)
Chart style
Preference selection
Preference value Effect on chart appearance
C h a p t e r 3 , C u s t o m i z i n g d a t a 39
Opening the cube in a new windowTo open a cube in a new Java window, on the Actuate Analytics Cube Viewer title bar, choose the New window button.
A new window opens and fills your screen.
Displaying variables in the main title, subtitle, and footerYou can use text and variables in the main title, subtitle, and footer. The main title can display a maximum of four lines of text. The subtitle and footer appear in documents you save as RTF and PDF files. Use the following syntax for variables in the main title, subtitle, and footer:
%<variable name>%
The supported variables for use in the main title, subtitle, and footer appear in Table 3-3.
How to add a variable to the main title
1 In the view, select the view title.
2 Type:
%<variable name>%
Table 3-3 Variables for use in the main title, subtitle, and footer
Variable name Displays these values
column-categories Name of the categories on the columns axis
company-name Name of the company, as shown in the About box
cube-name Name of the cube, as shown in the About box
current-view Current categories in the columns and the rows
data Name of the current numerical data
date-created Date the cube was created, as shown in the About box
description Description of the cube, as shown in the About box
filters Names of all category filters currently applied to the cube
measure Name of the current measure appearing in the data display area
product-name Name of the product, as shown in the About box
row-categories Name of the categories on the rows axis
version Actuate Analytics Cube Viewer build number

40 W o r k i n g w i t h C u b e R e p o r t s u s i n g A c t u a t e A n a l y t i c s O p t i o n
where <variable name> is one of the supported variables, for example, %company-name%.
3 Press Enter. The variable name appears in the view title.
How to change the main title of the view
1 Select Main Title above the columns labels.
2 Type the new title or variable name.
3 To start a new line, you can type:
\n
Then type text or a variable name. You can display a maximum of four lines in the view title.
4 Press Enter.
Selecting PreferencesYou can customize your presentation of the data in the display area with the options on the toolbar in Preferences.
The options include:
■ Show leading or trailing column totals
■ Show leading or trailing row totals
■ Show or hide expand and collapse controls (+) or (-)
■ Show or hide gridlines
■ Resize width for new labels
■ Show labels as hierarchical
■ Show labels as columnar
■ Show cell value with percentage of total
■ Decimal places for percentage of total
Preferences return to the default settings when you analyze another cube report. You can save the Preferences settings in Actuate Analytics Cube Viewer for one session. If you restart Actuate Analytics Cube Viewer, the default settings apply to the view.
How to show leading or trailing column totals
In the table, the default settings for Actuate Analytics Cube Viewer show leading column totals. Most of the illustrations in this document show the table using the default settings. A system administrator can change the default settings to show the leading or trailing column totals.

C h a p t e r 3 , C u s t o m i z i n g d a t a 41
If you choose to show leading or trailing column totals, the displayed total might combine measures that you do not intend to combine in a sum. For example, Actuate Analytics Cube Viewer might analyze an order number as a measure and display a sum total of order numbers.
1 On the toolbar, choose Preferences➛Columns.
2 On Preference—Columns, to show leading totals for columns, select Show totals. Select leading.
3 To show trailing totals for columns, select Show totals. Select trailing. Choose OK.
The Preferences settings that do not show leading or trailing totals on the rows or columns appear in the table in Figure 3-1.
Figure 3-1 Preferences settings that do not show leading or trailing totals
The Preferences settings that show leading totals on the rows and columns appear in the table in Figure 3-2.
Figure 3-2 Preferences settings that show leading and trailing totals
How to show leading or trailing row totals
If you choose to show leading or trailing row totals, the displayed total might combine measures that you do not intend to combine in a sum. For example, Actuate Analytics Cube Viewer might analyze an order number as a measure and display a sum total of order numbers.
1 On the toolbar, choose Preferences➛Rows.
2 On Preferences—Rows, to show leading totals for rows, select Show totals. Select leading.
3 To show trailing totals for rows, select Show totals. Select trailing. Choose OK.

42 W o r k i n g w i t h C u b e R e p o r t s u s i n g A c t u a t e A n a l y t i c s O p t i o n
How to show or hide expand and collapse controls (+) or (-)
1 On the toolbar, choose Preferences➛General. Preferences—General appears as shown in Figure 3-3.
Figure 3-3 Preferences—General options
2 To show expand and collapse controls, select Show Expand and Collapse controls.
3 To hide drill controls, deselect Show Expand and Collapse controls. Choose OK.
How to show or hide gridlines
1 On the toolbar, choose Preferences➛General.
2 On Preferences—General, to show gridlines, select Show grid lines.
3 To hide gridlines, deselect Show grid lines. Choose OK.
How to resize subcategory width for labels
1 On the toolbar, choose Preferences➛Rows.
2 On Preferences—Rows, select Automatically size label width. Choose OK.
How to show or hide row and column hierarchy
1 On the toolbar, choose Preferences➛General.
2 On Preferences—General, in Show labels as (Analysis view only), select Hierarchical.
3 Choose Rows.
C h a p t e r 3 , C u s t o m i z i n g d a t a 43
4 On Rows:
■ To show hierarchy for rows, select Show category hierarchy.
■ To hide hierarchy for rows, deselect Show category hierarchy.
5 Choose Columns.
6 On Columns:
■ To show hierarchy for columns, select Show category hierarchy.
■ To hide hierarchy for columns, deselect Show category hierarchy.
Choose OK.
How to show labels as hierarchical
1 On the toolbar, choose Preferences➛General.
2 On Preferences—General, to show hierarchy in labels, in Show labels as (Analysis view only), select Hierarchical.
3 To hide hierarchy in labels, in Show labels as (Analysis view only), select Columnar.
4 Choose OK.
How to show labels as columnar
1 On the toolbar, choose Preferences➛General.
2 On Preferences—General, to show labels as columnar, in Show labels as (Analysis view only), select Columnar. Choose OK.
Using Undo and RedoUsing Undo and Redo, you can reverse or restore the last ten actions you performed on your data.
How to undo or redo an action
Choose Undo to undo an action.
Choose Redo to redo an action.
Analyzing dataWith the Calculate option, you can compare and summarize data using the functions that appear in Table 3-4. Applying each of these functions to one or more selected columns or rows creates a new column or row that displays calculated values.

44 W o r k i n g w i t h C u b e R e p o r t s u s i n g A c t u a t e A n a l y t i c s O p t i o n
Table 3-4 Functions
Function Description
Sum Calculates the value of the following formula for the selected subcategories:
a1+a2+…+an
Average Calculates the value of the following formula for the selected subcategories:
(a1+a2+…+an)/n
Difference Calculates the value of the following formula for the two subcategories:
a-b
Percent of total Calculates a percentage value that is equal to the ratio between the cell’s value and the total value for the subcategory in which the cell appears. You can also display each data value in the table as a percentage of a column, row, or grand total.
Ratio Calculates the value of the following formula for the two subcategories:
a/b
Percentage growth Calculates the value of the following formula for the two subcategories:
(b-a)/a
Minimum value Determines the minimum value among the selected subcategories.
Maximum value Determines the maximum value among the selected subcategories.
Relative time periods
Filters a date category to show only the data items in a specific time period, such as Previous Year to Date or Current Month.
Sum over relative time periods
Calculates the sum of values for a time period, such as Current Year to Date, or Previous Month and displays the sum in a row or column.

C h a p t e r 3 , C u s t o m i z i n g d a t a 45
Note that you cannot combine subcategories that are in rows and columns. You must select either rows or columns. The function type appears in the table next to the last subcategory that you selected.
When you use the difference, ratio, or percentage growth functions, the subcategory that you select first is a, and the subcategory that you select second is b.
When you include subcategories that contain empty data fields, Actuate Analytics Cube Viewer does not use the empty data fields in calculations. As in OLAP tools, including null values in data analysis does not generate an error message.
For a calculation function, if you choose data that results in division by zero, the data field for that calculation shows /0 in the table. When plotting charts, Actuate Analytics Cube Viewer treats division by zero as an empty cell.
For a subcategory label, you cannot use a backslash (\), a slash (/), an asterisk (*), a dash (-), or any other symbol that normally appears as an operator. When using NOT, place it inside brackets.
If you apply functions both in the rows axis and the columns axis, the columns axis function applies at the intersection of the rows and columns. In the example
Union (Or) Determines the number of data rows that contain a value in the selected subcategories. The union function counts data rows that are in one subcategory or another subcategory, inclusive. For example, to count the number of sales in the large appliances subcategory or the small appliances subcategory, select both subcategories and apply the union function. The count represents the total number of data rows that contain a sale value in the large appliances subcategory or the small appliances subcategory.
Intersection (And) Determines the number of data rows that apply to the selected subcategories. The intersection function counts data rows that are in all selected subcategories.For example, to count the number of sales that include an item from the large appliances subcategory and an item from the small appliances subcategory, select both subcategories and apply the intersection function. The count represents the total number of data rows that contain a sale in the large appliances subcategory and the small appliances subcategory.
Table 3-4 Functions
Function Description

46 W o r k i n g w i t h C u b e R e p o r t s u s i n g A c t u a t e A n a l y t i c s O p t i o n
in Table 3-5, the intersection applies the sum function, A+B, and not the ratio function, C/D.
When you analyze ZIP codes, Actuate Analytics Cube Viewer treats a ZIP code as a measure, unless the report designer identifies the control as a category. Actuate Analytics Cube Viewer sums measures and uses them in other calculations. This applies if the ZIP codes contain numbers only. For example, if a 9-digit ZIP code contains a hyphen, the ZIP code is not treated as a measure.
By default, Actuate Analytics Cube Viewer creates cubes with precision of three decimal places. For values in the cube, a BIRT iServer System administrator can specify between 0 and 10 decimal places. When analyzing numbers that contain more than two decimal places, you get different results if you work with numbers without rounding. The number of categories Actuate Analytics Cube Viewer uses to build the cube affects the results. The differences are typically in the hundredths place. For example, add three numbers, each equal to 1.004. If you round the numbers to two decimal places before the addition, the calculation is 1.00 + 1.00 + 1.00 = 3.00. If you perform the addition before you round the numbers, the calculation is 1.004 + 1.004 + 1.004 = 3.012. The rounded result is 3.01.
Analyzing subcategory dataYou can apply the following functions to subcategory data:
■ Sum
■ Average
■ Difference
■ Percent of total
■ Ratio
■ Percentage growth
■ Minimum value
■ Maximum value
■ Union (Or)
Table 3-5 An example of the columns axis function taking precedence over the rows axis function
A B A+B
C 1 2 3
D 3 4 7
C/D 0.33 0.50 0.83

C h a p t e r 3 , C u s t o m i z i n g d a t a 47
■ Intersection (And)
When you apply one of these functions, a new subcategory appears in the table view. Actuate Analytics Cube Viewer calculates values and displays them in the new subcategory.
A cube developer must include a count measure in the cube to use the union (or) and intersection (and) functions. If the cube does not contain a count measure, the union (or) and intersection (and) functions do not appear in the Calculate menu.
How to apply a function to a subcategory
Use this procedure to apply a sum, average, difference, percent of total, ratio, percentage growth, minimum value, maximum value, union, or intersection function to a selected subcategory.
1 Select the row or column subcategories to which to apply a function.
■ If the formula for the function uses a and b values, press and hold Ctrl. Select the first subcategory label, a. Then, select the second subcategory label, b.
■ If you want to select a range to sum or average, select the first subcategory label. Then, press and hold Shift and select the last subcategory label.
Choose Calculate.
2 On the Calculate menu, choose one of the following functions:
■ Sum
■ Average
■ Difference
■ % of total
■ Ratio
■ % growth
■ Minimum value
■ Maximum value
■ Union (Or)
■ Intersection (And)
Calculate appears.
Figure 3-4 shows Calculate with a default label value that appears when you apply a sum function to Appliances and Automotive subcategories.

48 W o r k i n g w i t h C u b e R e p o r t s u s i n g A c t u a t e A n a l y t i c s O p t i o n
Figure 3-4 The Calculate dialog box
3 On Calculate, you can specify the following information:
■ In Label, type the name for the new subcategory.
■ In Format, to specify a number format, select the symbol, thousands separator, decimal separator, and number of decimal places. In Sample, you can view an example of the number format.
Choose OK. The new subcategory appears next to the last selected subcategory, as shown in Figure 3-5.
Figure 3-5 A new calculated subcategory
How to modify a function
1 Right-click a function subcategory.
2 Choose Edit calculation.
3 On Calculate, you can
■ Change the name of the function subcategory.
■ Change the number format.
Choose OK to apply the changes.

C h a p t e r 3 , C u s t o m i z i n g d a t a 49
How to delete a function
1 Right-click a function subcategory.
2 Choose Delete calculation.
Displaying data values as a percentage of a totalWhen working with data in the table, you can display data values as a percentage of the following values:
■ Column totalEach cell displays a percentage value that is equal to the ratio of the value of that cell compared to the value of the column total.
■ Row totalEach cell displays a percentage value that is equal to the ratio between the value of that cell compared to the value of the row total.
■ Grand totalEach cell displays a percentage value that is equal to the ratio between the value of that cell compared to the table root value, which is the sum of all the cell values.
If you change the display from a table to either a horizontal or vertical bar chart, or a line graph, only the cell values from the table appear in the chart or graph. The percentages do not appear in the chart or graph.
How to show data as a percentage of a total
Use this procedure to display all data values in the table as percentages or as both percentages and cell values.
1 Right-click a table cell and choose Show Data as.
2 Choose one of the following options:
■ % of column total
■ % of row total
■ % of grand total
3 To display both a cell value and the percentage of the total in a table cell, right-click a table cell and choose Show cell value with % of total. A cell value and a percentage appear in each cell, as shown in Figure 3-6.
Figure 3-6 Displaying a cell value and a percentage in each cell

50 W o r k i n g w i t h C u b e R e p o r t s u s i n g A c t u a t e A n a l y t i c s O p t i o n
The table maintains any sorting that applies to the columns and rows axes.
Analyzing data in relative time periodsYou can analyze data in relative time periods in the following ways:
■ Filter by relative time periodsYou can filter a date category to show only the data items in a specific time period, such as Previous Year to Date or Current Month. This option temporarily hides all other date data items in your table, chart, or graph. If you apply a relative time period filter, the category expands to the appropriate level. For example, if you filter on Current Month, the category expands to the month level.
■ Sum over relative time periodsYou can insert a row or column in a date category that calculates the sum of values for a given time period, such as Current Year to Date, or Previous Month. To insert a calculated row or column, you must be working in a table.
How to filter by relative time periods
1 On the rows or columns axis, select a Date category that you want to filter. Choose Calculate➛Relative time periods.
2 In Calculate Relative Time Periods, in Available Time periods, select a time period and choose Add to add your selection to Insert Relative Time Periods. Choose OK.
All data items that do not meet the filter criteria do not appear. An icon appears in the lower right corner of the category button, indicating that a filter applies.
3 To show a given time period in regular intervals, for example, to show the current month for each of the past five years:
1 Select Show more than one time period.
2 Specify the number of intervals and the repeat period.
If you apply a filter that hides all items in a category, you receive message that indicates that there is no data to display.
How to calculate a sum over relative time periods
1 Select a row or column in a date category.
2 On the toolbar choose Calculate➛Relative time periods.
Calculate Relative Time Periods appears, as shown in Figure 3-7.

C h a p t e r 3 , C u s t o m i z i n g d a t a 51
Figure 3-7 Calculate Relative Time Periods dialog box
3 To insert a row or column:
1 In Available relative time periods, select the time period.
2 Choose Add. The time period moves to Insert relative time periods.
To insert additional relative time period calculations, repeat this step.
4 To remove a row or column:
1 In Insert relative time periods, select the time period.
2 Choose Remove. The time period moves to Available relative time periods.
To remove additional relative time period calculations, repeat this step.
5 In Show, select one of the following options:
■ To show only the calculated rows or columns, select Only relative time periods.
■ To show the calculated rows or columns before all other rows or columns, select Relative time periods leading fixed time periods
■ To show the calculated rows or columns after all other rows or columns, select Relative time periods trailing fixed time periods.
Choose OK.
The calculated rows or columns appear in the table. The available time periods are relative to the reference date of the data, which appears on Calculate
Range of the selected relative time period
Row or column date category

52 W o r k i n g w i t h C u b e R e p o r t s u s i n g A c t u a t e A n a l y t i c s O p t i o n
Relative Time Periods after As of. If you select Only relative time periods in Show, Actuate Analytics Cube Viewer filters the fixed time rows or columns out of the table. You can later cancel this filter by returning to Calculate Relative Time Periods and selecting another option in Show.
About exception highlightingYou can use exception highlighting to reveal anomalies and significant trends in data. With exception highlighting, you use color to highlight table cells based on the cell value or how the cell value compares to other values. You can apply more than one exception highlighting rule to cells. For example, to analyze sales among different departments, you can display cells with values that are less than $2500 with red background color and cells with values greater than $10,000 with green background color.
If more than one exception highlighting rule applies to the same table cell, the exception highlighting rules apply in the order in which they appear in the Exception Highlighting dialog box. The first exception highlighting rule in the list takes precedence over the second rule, the second rule takes precedence over the third rule, and so on.
How to apply exception highlighting
1 On the toolbar, choose Exception Highlighting.
2 In Exception Highlighting, choose New. A new rule appears in Exception Highlighting, as shown in Figure 3-8.
3 In Rule Properties, specify the following properties:
■ Type a name for a label to identify the exception highlighting rule.
■ Specify the exception condition, operator, and value using the drop-down lists.In Rule Properties, if Condition is set to % of row total, % of column total, or % of grand total, then type a percentage value in Value. For example, in Value, type 20 for 20%, rather than 0.2.
■ Specify the font color and fill color.
■ In Apply to, select one of the following options to which to apply the exception highlighting rule:
❏ All rows and columns
❏ This row or column: <selected row or column name>

C h a p t e r 3 , C u s t o m i z i n g d a t a 53
Figure 3-8 Exception Highlighting dialog box
4 Choose Save Changes.
5 Choose OK or Apply.
About exporting detail data to a spreadsheetUse Export detail data to spreadsheet to retrieve the source data records used to calculate the value of a data element in a table, chart, or graph. The detail data is presented in CSV format in a new browser window.
An BIRT iServer administrator can make the drill to details functionality available in the user interface.
Export detail data to spreadsheet is unavailable when you work offline.
Export detail data to spreadsheet performance affects system performance and database performance. Performance might degrade if you perform multiple export detail data to spreadsheet operations on different data elements during a single cube viewing session.
How to export detail data to a spreadsheet
1 Right-click one of the following data elements:
■ Cell in a table
■ Bar in a bar chart
■ Segment in a pie chart
■ Point in a line graph

54 W o r k i n g w i t h C u b e R e p o r t s u s i n g A c t u a t e A n a l y t i c s O p t i o n
Select Menu appears.
2 Choose Export detail data to spreadsheet.
Depending on your BIRT iServer configuration, it may take a few seconds or minutes to retrieve the detail data. The detailed source records appear in a new window in CSV format.

C h a p t e r 4 , E x p o r t i n g d a t a 55
C h a p t e r
Chapter 4Exporting dataThis chapter contains the following topics:
■ About exporting data
■ Exporting data to a spreadsheet
■ Exporting data to a document
■ Saving a cube locally for offline viewing
■ Saving cube reports
■ Sending cube reports by e-mail
■ Viewing cubes managed by Microsoft Analysis Services

56 W o r k i n g w i t h C u b e R e p o r t s u s i n g A c t u a t e A n a l y t i c s O p t i o n
About exporting dataAfter you manipulate the data and arrange the view, you are ready to export the data. You can export the data to the following formats:
■ CSV file, which contains comma-separated values in text format
■ Microsoft Excel
■ PDF file for viewing using Adobe Acrobat Reader
■ RTF file for viewing using Microsoft Word or a plug-in
■ TSV file, which contains tab-separated values in text format
Exporting to PDF or RTF saves or prints the charts. Exporting to a CSV, spreadsheet, or TSV exports only the data, not the charts.
Exporting data to a spreadsheetYou can use the Save as Microsoft Excel option to export the data you view in a cube to a spreadsheet program installed on your computer. Using this option to export the data to a spreadsheet program saves cube data values, row heading labels, and column heading labels in a Microsoft Excel file. You can then work with the data in a Microsoft Excel spreadsheet. Choosing Save as Microsoft Excel exports only the data values that are visible in the table view, chart, or graph, not the values that a hidden or collapsed category contains.
A BIRT iServer System administrator can also enable exporting the detail data values from a cube view to Microsoft Excel.
How to export data to a spreadsheet
1 Choose Save as Microsoft Excel. Save as Microsoft Excel (*.xls) appears.
For some report servers, a Java security message appears. You must choose Grant to display Save as Microsoft Excel (*.xls).
2 In Save in, select a location for the file.
3 In File name, type a file name with the extension, .slk or .xls. For spreadsheets, the default file format is .slk. Microsoft Excel recognizes both .xls and .slk extensions.
4 If required, in Save as type, select the file type.
5 Choose Save. If you have a spreadsheet plug-in installed with your browser, the spreadsheet appears, but you can only view the document.

C h a p t e r 4 , E x p o r t i n g d a t a 57
The recommended limit for data export to a spreadsheet is 64,000 rows by 256 columns. Exceeding the limit may result in incorrect data transfer.
If you export data to a spreadsheet, you can export functions only if the functions do not rely on a hidden row or column. If a function does rely on a hidden column or row, the function is preserved during exporting, but the function is not translated into cell references.
How to export detail data to a spreadsheet
A BIRT iServer System administrator must enable exporting detail data to a spreadsheet for this functionality to be available. If you are working offline, exporting detail data to a spreadsheet is unavailable.
1 In the data display area, right-click one of the following data elements:
■ Cell in a table
■ Bar in a bar chart
■ Segment in a pie chart
■ Point in a line graph
A context menu appears.
2 Choose Export detail data to spreadsheet.
Actuate Analytics Cube Viewer retrieves the detailed data source records from the BIRT iServer System and saves them to a file. Microsoft Excel starts in a new browser window and displays the detail data. Depending on your BIRT iServer System configuration, retrieving and displaying the detail data can take several seconds to several minutes.
Exporting data to a documentYou can export data to text documents such as an RTF file, a tab-separated text file, a comma-separated text file, or a PDF file.
How to export data to an RTF file
1 Choose Save as Microsoft Word.
2 In Page Setup, make selections for the following settings:
■ Paper size and orientation
■ Margins
■ OutputSelect Subtitle or Footer to enable typing text or a variable name.
3 Select Show Save as dialog box. Choose OK.
58 W o r k i n g w i t h C u b e R e p o r t s u s i n g A c t u a t e A n a l y t i c s O p t i o n
If you do not select this option, Actuate Analytics Cube Viewer saves the file using the default file name and location. The new file overwrites any previous file with the same name in the default location.
4 In Page Range, select the page range. Choose OK.
5 In Save as Microsoft Word (*.doc), in Save in, select a location for the file.
6 In File name, type a name for the file using the extension, .doc.
7 If required, in the Save as type field, select the file type. Choose Save. If you have a document plug-in installed with your browser, the document appears, but you can only view the document.
When you export bar charts and line graphs to an RTF file, Actuate Analytics Cube Viewer sets the scale range for the charted data. The scale range changes to present a meaningful scale for each set of data.
How to export data to a tab-separated text file
Data that you export to a tab-separated file does not include special characters, such as dollar sign ($) and greater than (>).
1 Choose Save➛Save As➛Tab-Separated Values (.tsv).
2 In Save as Separated Values (*.tsv), in Save in, select a location for the file.
3 In File name, type a name for the file using the extension, .txt or .tsv.
4 If required, in the Save as type field, select the file type. Choose Save.
5 Open the saved file using a text editor such as Notepad.
How to export data to a comma-separated text file
Data you export to a comma-separated file does not include special characters, such as a dollar sign ($) and greater than (>).
1 Choose Save➛Save As➛Comma-Separated Values (.csv).
2 In Save as Separated Values (*.csv), in File name, type a name for the file using the extension .txt or .csv.
3 If required, in Save as type, select a file type. Choose Save.
4 If you have a spreadsheet plug-in installed with your browser, and you have the extension .csv on the file name, the spreadsheet appears. If you do not have a spreadsheet plug-in, open the saved file using a text editor such as Notepad.
How to export data to a PDF file
You can export the view to a PDF file for viewing, saving, or printing. You must have Adobe Acrobat Reader or Adobe Acrobat installed to view a PDF file.
1 Choose Save➛Save As➛Adobe PDF (.pdf).
C h a p t e r 4 , E x p o r t i n g d a t a 59
2 In Page Setup, select the settings needed for your document, which include:
■ Paper size and orientation.
■ Margins.
■ In Output, you can select Subtitle and Footer to enable typing text or a variable name, which appears in the document.
3 To enable saving the PDF file before printing, select Show Save as dialog box. Choose OK.
If you do not select Show Save as dialog box, Actuate Analytics Cube Viewer saves the file using the default file name and location. The new file overwrites any previous file with the same name in the default location.
4 In Page Range, select the page range and choose OK.
5 In Save as PDF (*.pdf), in Save as Adobe PDF (*.pdf), type a file name for your document and select a location. Choose Save. The document opens in Adobe Acrobat Reader.
6 To print the file, from the File menu, choose Print.
7 Select your print options. Choose OK.
When you export bar charts and line graphs to a PDF file, Actuate Analytics Cube Viewer sets the scale range for the charted data. The scale range changes to present a meaningful scale for each set of data.
Saving a cube locally for offline viewingYou can save a cube locally on your computer’s hard disk, which enables you to work offline without the need for a network or an Internet connection. BIRT iServer System saves the title of the view on the web server.
When you work offline, features that require access to network or server resources are not available. For example, drilling through to detail data and saving a cube report in an Encyclopedia volume are not available.
How to save a cube locally
1 On the toolbar, choose Save➛Work Offline.
2 In Save Offline, type a name for your cube in File name. Choose Save. The cube opens in a fresh browser window. The address bar shows the location of the saved cube.
3 To quickly access the cube in the future, bookmark the cube in your browser window.

60 W o r k i n g w i t h C u b e R e p o r t s u s i n g A c t u a t e A n a l y t i c s O p t i o n
Saving cube reportsIn Actuate Analytics Cube Viewer, the Reports drop-down list displays the cube reports available for viewing. You can also use the Reports drop-down list to overwrite a modified cube report or to save a modified cube report as a new report. An asterisk (*) next to a cube report in the Reports drop-down list indicates that the file has been modified.
On an Encyclopedia volume, you can save a maximum of thirty cube report (.cvw) files for each cube (cb4) file. To manage cube reports, use Actuate Management Console or Information Console. For more information about managing cube reports, see Managing an Encyclopedia Volume and Using Information Console.
How to save a cube report
1 To overwrite a cube report in the Encyclopedia volume with the modified cube report:
1 On the toolbar, choose Reports➛Save, as shown in Figure 4-1.
Figure 4-1 Saving a cube report
A message stating that the report already exists in the Encyclopedia volume appears.
2 In the message, choose OK.
2 To save a new cube report to the Encyclopedia volume:
1 Choose Reports➛Save As.
2 In Save As, type an appropriate name for the report. Choose OK. The new report appears in the Reports drop-down list.
Sending cube reports by e-mailYou can send a cube report via e-mail to a person or group of people. The cube report contains the current table, chart, or graph, and is delivered as a document

C h a p t e r 4 , E x p o r t i n g d a t a 61
attached to an e-mail message. The send mail feature is available only if your machine has the following applications:
■ Microsoft Internet Explorer with Microsoft JVM enabled
■ Microsoft Outlook as the e-mail client with MAPI enabled
How to send a report
1 On the toolbar, choose Collaborate➛Send report through mail client.
Select from the following report formats:
■ Word
■ Excel
■ Tab-Separated Values
■ Comma-Separated Values
2 In Page Setup, select page setup options. Choose OK.
3 In Message, in your e-mail, type your e-mail address.
4 In To and CC, type the e-mail addresses of the people to whom you want to send the report.
5 In Subject, type an appropriate subject for your message.
6 Type a message to send with the report.
7 Choose Send. The report is sent to the e-mail addresses listed.
Viewing cubes managed by Microsoft Analysis Services
Actuate Analytics option supports viewing cubes managed by Microsoft Analysis Services using Actuate Analytics Cube Viewer. The following features are not available when working with Microsoft Analysis Services:
■ Drill to detail data
■ Expand to level
■ Export data to a spreadsheet
■ Filter by pattern
■ Find
■ Intersection and union functions that use a distinct count measure

62 W o r k i n g w i t h C u b e R e p o r t s u s i n g A c t u a t e A n a l y t i c s O p t i o n
■ Relative time periods
■ Work offline
■ Percentage calculationsFor example, percentage of total, percentage of row total, percentage of column total, and performance index are not available.
The following Actuate Analytics Cube Viewer features are restricted when working with cubes managed by Microsoft Analysis Services:
■ Arranging categoriesAdding a category to an axis does not automatically expand the category to the first level.
■ Expand or collapseAll instances of a category item expand or collapse simultaneously.
■ HideYou cannot apply Hide to the unselected rows or columns.
■ Hide row or column selectionShift Select is not available to select a range of rows or columns.
■ SelectionYou can select only one item from a category on the category bar at a time.
■ Show totalsTotals always appear, if available in the cube, and are shown in the leading position.
■ SortCategory items are always sorted independent of their position in the category hierarchy.

C h a p t e r 5 , C u s t o m i z i n g A c t u a t e A n a l y t i c s C u b e V i e w e r 63
C h a p t e r
Chapter 5Customizing ActuateAnalytics Cube Viewer
This chapter contains the following topics:
■ About customizing Actuate Analytics Cube Viewer
■ Exporting detail data to a spreadsheet
■ Customizing the graphic resources
■ Locating the branding kits
■ Customizing the About box
■ Understanding Actuate Analytics Cube Viewer localization limitations
■ Localizing the user interface
■ Unsupported changes

64 W o r k i n g w i t h C u b e R e p o r t s u s i n g A c t u a t e A n a l y t i c s O p t i o n
About customizing Actuate Analytics Cube ViewerThis chapter describes how a BIRT iServer System administrator can customize Actuate Analytics Cube Viewer by completing the following tasks:
■ Exporting detail data to a spreadsheet
■ Customizing the graphic resources
■ Customizing the About box
■ Localizing the user interface
Exporting detail data to a spreadsheetFrom a cube view, you can choose Save as Microsoft Excel to save the visible cube data values, row heading labels, and column heading labels in Microsoft Excel. You can then work with the data in Microsoft Excel.
A BIRT iServer System administrator can also enable the exportation of detail data to Microsoft Excel. For example, a user can right-click a table cell, pie chart segment, or bar chart bar and choose to export the source data for that data element to a spreadsheet.
How to enable exporting detail data to a spreadsheet for Management Console and Information Console
1 In a text editor that supports UTF-8 encoding, open web.xml:
■ For Management Console, to enable Export detail data to spreadsheet, open \Program Files\Actuate11\iServer\servletcontainer\mgmtconsole\WEB-INF\web.xml.
■ For Information Console, to enable Export detail data to spreadsheet, open \Program Files\Actuate11\iPortal\webapps\iportal\WEB-INF\web.xml.
Web.xml contains the following code:
<context-param><!--
Enables or disables the drill to detail functionality in the cube viewer.
Overrides the setting in the cube design.--><param-name>ANALYTICS_CUBE_VIEW_RECORDS</param-name><param-value>false</param-value>
</context-param>

C h a p t e r 5 , C u s t o m i z i n g A c t u a t e A n a l y t i c s C u b e V i e w e r 65
2 To enable Export detail data to spreadsheet, set the parameter value to true:
<param-value>true</param-value>
3 Save the file.
4 To view the change, restart the Apache Tomcat for Actuate Information Console service, and close all browser instances before you start another applet.
Customizing the graphic resourcesFiles that are associated with Actuate Analytics Cube Viewer, such as applet archives and images, are in the analytics folder in the Information Console and Management Console application root folders, as shown in Table 5-1.
Table 5-2 lists the files that you can modify or replace to customize Actuate Analytics Cube Viewer.
Table 5-1 Paths to Actuate Analytics Cube Viewer files
Application Path to Actuate Analytics Cube Viewer files
Actuate Information Console
C:\Program Files\Actuate11\iPortal\analytics
Management Console C:\Program Files\Actuate11\iServer\servletcontainer\mgmtconsole\analytics
Table 5-2 Files to use to customize Actuate Analytics Cube Viewer
File namePixel coordinates
Size (width x height) in pixels Contents and usage
dbimage.gif 0, 210 250 x 50 Logo that appears when Actuate Analytics Cube Viewer launches.
dbimage.gif 102, 67 12 x 12 Icon that appears at the upper left corner of the Actuate Analytics Cube Viewer title bar.
AboutBox.properties
Text that appears in the Actuate Analytics Cube Viewer title bar.
collab-header.gif 695 x 65 Header that appears on the e-mail message when you e-mail a cube report.
(continues)

66 W o r k i n g w i t h C u b e R e p o r t s u s i n g A c t u a t e A n a l y t i c s O p t i o n
Locating the branding kitsTo customize the About box and localize Actuate Analytics Cube Viewer, you work with the following branding kits:
■ Sun Microsystems JDK 1.4.1 or later
The Sun JDK is available at the following URL:
http://java.sun.com/products/
■ Microsoft Cabinet Software Development Kit
The Microsoft Cabinet Software Development Kit is available at the following URL:
http://msdn.microsoft.com/library/default.asp?url=/library/en-us/dncabsdk/html/cabdl.asp
Customizing the About box When you enable Actuate Analytics option for BIRT iServer System, the About box looks like the one in Figure 5-1.
A BIRT iServer System administrator can change some information that appears in the About box, using the following resources:
■ AboutBox.properties, which is in resource.jar and resource.cab
■ The Sun Microsystems jar.exe utility, which is in \JDK1.4.1\bin
■ cabarc.exe, which is part of the Microsoft Cabinet Software Development Kit
collab-footer.gif 695 x 50 Footer that appears on the e-mail message when you e-mail a cube report.
Table 5-2 Files to use to customize Actuate Analytics Cube Viewer (continued)
File namePixel coordinates
Size (width x height) in pixels Contents and usage
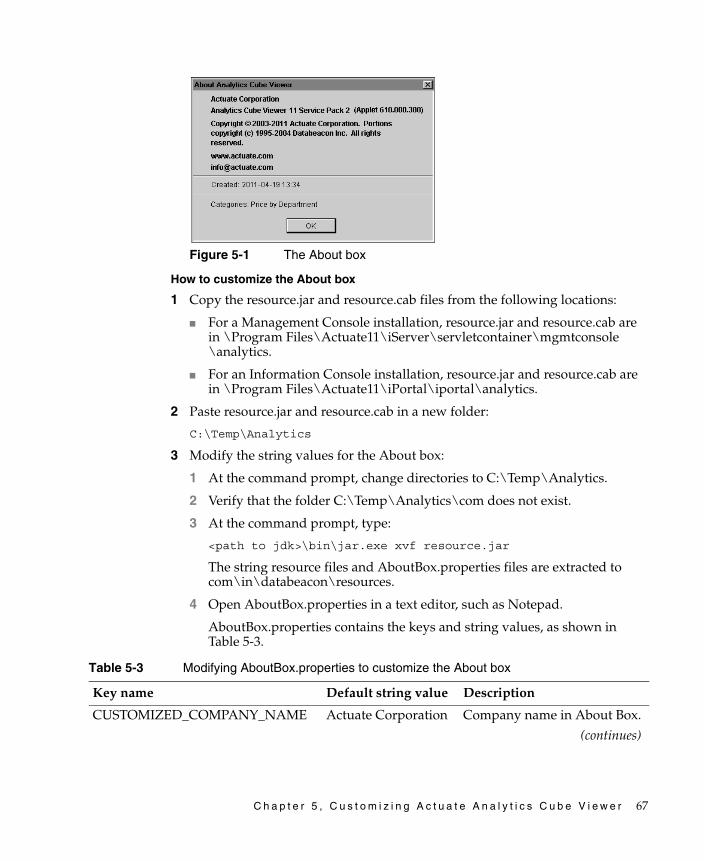
C h a p t e r 5 , C u s t o m i z i n g A c t u a t e A n a l y t i c s C u b e V i e w e r 67
Figure 5-1 The About box
How to customize the About box
1 Copy the resource.jar and resource.cab files from the following locations:
■ For a Management Console installation, resource.jar and resource.cab are in \Program Files\Actuate11\iServer\servletcontainer\mgmtconsole\analytics.
■ For an Information Console installation, resource.jar and resource.cab are in \Program Files\Actuate11\iPortal\iportal\analytics.
2 Paste resource.jar and resource.cab in a new folder:
C:\Temp\Analytics
3 Modify the string values for the About box:
1 At the command prompt, change directories to C:\Temp\Analytics.
2 Verify that the folder C:\Temp\Analytics\com does not exist.
3 At the command prompt, type:
<path to jdk>\bin\jar.exe xvf resource.jar
The string resource files and AboutBox.properties files are extracted to com\in\databeacon\resources.
4 Open AboutBox.properties in a text editor, such as Notepad.
AboutBox.properties contains the keys and string values, as shown in Table 5-3.
Table 5-3 Modifying AboutBox.properties to customize the About box
Key name Default string value Description
CUSTOMIZED_COMPANY_NAME Actuate Corporation Company name in About Box.
(continues)
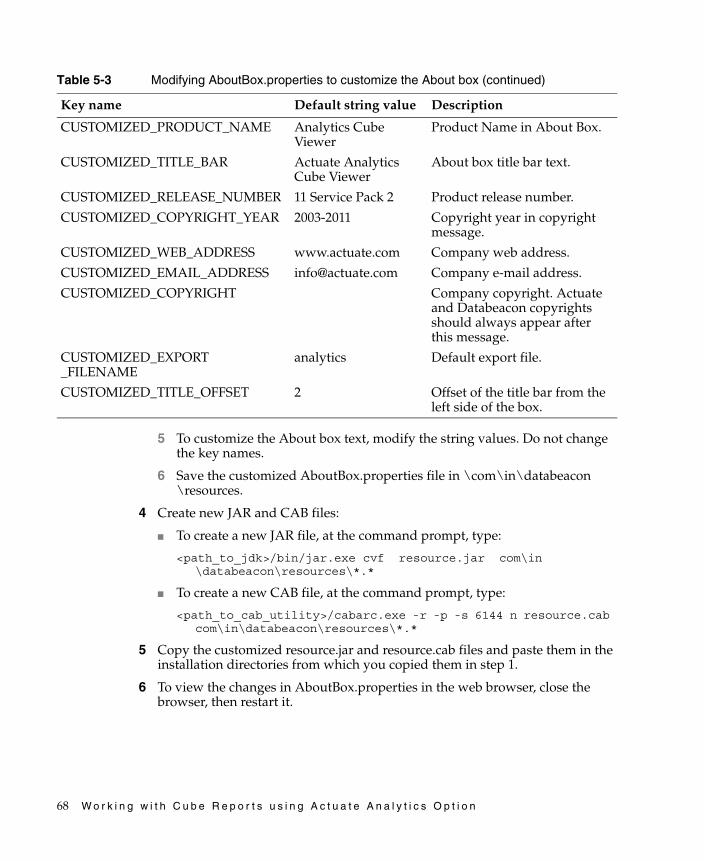
68 W o r k i n g w i t h C u b e R e p o r t s u s i n g A c t u a t e A n a l y t i c s O p t i o n
5 To customize the About box text, modify the string values. Do not change the key names.
6 Save the customized AboutBox.properties file in \com\in\databeacon\resources.
4 Create new JAR and CAB files:
■ To create a new JAR file, at the command prompt, type:
<path_to_jdk>/bin/jar.exe cvf resource.jar com\in\databeacon\resources\*.*
■ To create a new CAB file, at the command prompt, type:
<path_to_cab_utility>/cabarc.exe -r -p -s 6144 n resource.cab com\in\databeacon\resources\*.*
5 Copy the customized resource.jar and resource.cab files and paste them in the installation directories from which you copied them in step 1.
6 To view the changes in AboutBox.properties in the web browser, close the browser, then restart it.
CUSTOMIZED_PRODUCT_NAME Analytics Cube Viewer
Product Name in About Box.
CUSTOMIZED_TITLE_BAR Actuate Analytics Cube Viewer
About box title bar text.
CUSTOMIZED_RELEASE_NUMBER 11 Service Pack 2 Product release number.
CUSTOMIZED_COPYRIGHT_YEAR 2003-2011 Copyright year in copyright message.
CUSTOMIZED_WEB_ADDRESS www.actuate.com Company web address.
CUSTOMIZED_EMAIL_ADDRESS [email protected] Company e-mail address.
CUSTOMIZED_COPYRIGHT Company copyright. Actuate and Databeacon copyrights should always appear after this message.
CUSTOMIZED_EXPORT_FILENAME
analytics Default export file.
CUSTOMIZED_TITLE_OFFSET 2 Offset of the title bar from the left side of the box.
Table 5-3 Modifying AboutBox.properties to customize the About box (continued)
Key name Default string value Description

C h a p t e r 5 , C u s t o m i z i n g A c t u a t e A n a l y t i c s C u b e V i e w e r 69
Understanding Actuate Analytics Cube Viewer localization limitations
Before you begin the process of localizing the user interface for Actuate Analytics Cube Viewer, you should review the following localization limitations:
■ You cannot use a comma as the decimal separator in the Filter by Value dialog box with the French numeric format.
■ Multilingual data is not always displayed correctly in dialogs.
■ The following languages are not supported:
■ Arabic
■ Hindi
■ Hebrew
■ Farsi
■ Urdu
■ Japanese Gaiji
■ Asian character input is supported only with the Microsoft virtual machine.
■ Subcategory names cannot be sorted if they contain non-Latin 1 characters.
■ If the About box uses a localized date format and you build the cube on a BIRT iServer System running in a different locale, the About box displays the date using US English format.
■ The workstation locale setting determines the fonts available for display.For example, if the report contains Chinese characters, you must set the workstation locale to Chinese to display these characters correctly.
■ If Actuate Analytics Cube Viewer encoding does not match the source data encoding, the Drill to detail generation of source data records fails.
■ Actuate Analytics Cube Viewer does not display localized AM/PM symbols or date formats.
■ Cubes managed by the Microsoft Analysis Service do not display with localized decimal and thousands separators.
■ If a cube contains Thai characters and the JVM is running on a Solaris platform, you must set the locale of the Solaris machine to US English to build the cube.The locale parameter for the cube profile is changed to US English.
■ Right to left character display is not supported.

70 W o r k i n g w i t h C u b e R e p o r t s u s i n g A c t u a t e A n a l y t i c s O p t i o n
■ If the JVM runs on a Solaris platform or a Sun VM runs on a Microsoft Windows platform, Thai dates use the Buddhist calendar, not the Gregorian calendar.
Localizing the user interfaceA BIRT iServer System administrator can customize Actuate Analytics Cube Viewer to display localized strings in the user interface. A BIRT iServer System administrator can set the user interface to display the following languages:
■ English (United States)
■ French
■ German
■ Indonesian
■ Japanese
■ Korean
■ Simplified Chinese
■ Spanish
■ Thai
■ Traditional Chinese
To localize or customize the strings, modify the files that are listed in Table 5-4. These files are in resource.jar and resource.cab.
Table 5-4 Localized string files
Language Localized string file name
English (United States) StringBundle_en_US.properties
French StringBundle_fr_FR.properties
German StringBundle_de_DE.properties
Indonesian StringBundle_id_ID.properties
Japanese StringBundle_ja_JP.properties
Korean StringBundle_ko_KR.properties
Simplified Chinese StringBundle_zh_CN.properties
Spanish StringBundle_es_ES.properties
Thai StringBundle_th_TH.properties
Traditional Chinese StringBundle_zh_TW.properties

C h a p t e r 5 , C u s t o m i z i n g A c t u a t e A n a l y t i c s C u b e V i e w e r 71
How to localize the user interface
You need access to the Sun Microsystems jar.exe utility and Microsoft Cabinet Software Development Kit to complete this procedure.
1 Copy the resource.jar and resource.cab files from the following locations:
■ For Management Console that uses Apache Tomcat for Actuate Information Console service, resource.jar and resource.cab are in \Program Files\Actuate11\iServer\servletcontainer\mgmtconsole\analytics.
■ For an Information Console installation, resource.jar and resource.cab are in \Program Files\Actuate11\iPortal\iportal\analytics.
2 Paste resource.jar and resource.cab in C:\Temp\Analytics.
3 Modify the string bundle files:
1 Choose Start➛Programs➛Command Prompt.
2 Change directories to C:\Temp\Analytics.
3 At the command prompt, type:
<path to jdk>\bin\jar.exe xvf resource.jar
4 Using a text editor, modify the string bundle files.
If your modifications include characters that are encoded with more than one byte, such as Chinese and Japanese, you must convert the native encoding to an encoding that is compatible with Actuate Analytics Cube Viewer.
To convert the encoding, use native2ascii.exe, which is available as part of the Sun Microsystems JDK at the following URL:
http://java.sun.com/products/
5 To customize the string bundle files, modify the string values. Do not change the key names.
6 Save the customized string bundle files in \com\in\databeacon\resources.
Follow Actuate’s naming conventions when you save the string bundle:
StringBundle_<languageCode>_<countryCode>.properties
where
❏ <languageCode> is a valid ISO Language Code. These codes are lowercase, two-letter codes as defined by ISO-639.
❏ <countryCode> is a valid ISO Country Code. These codes are uppercase, two-letter codes as defined by ISO-3166.

72 W o r k i n g w i t h C u b e R e p o r t s u s i n g A c t u a t e A n a l y t i c s O p t i o n
4 Create new JAR and CAB files:
■ To create a new JAR file, at the command prompt, type:
<path_to_jdk>/bin/jar.exe cvf resource.jar com\in\databeacon\resources\*.*
■ To create a new CAB file, at the command prompt, type:
<path_to_cab_utility>\cabarc.exe -r -p -s 6144 n resource.cab com\in\databeacon\resources\*.*
5 Copy the customized resource.jar and resource.cab files and paste them in the installation directories from which you copied them in step 1.
6 To view the changes in AboutBox.properties in the web browser, close the browser, then restart it.
Unsupported changesActuate does not support changes to the following information:
■ Copyright information in the About box
■ The security warning message, as shown in Figure 5-2
Figure 5-2 Security warning message

I n d e x 73
IndexSymbols( ) (parentheses) in expressions 19* (asterisks) characters 45/ (slash) characters 45\ (backslash) characters 45# (number signs) in cells 38% directive 39, 40% Growth command 47% of column total option 49% of grand total option 49% of row total option 49+ control 42- (hyphen) characters 45– control 42
Numerics2D charts 373D charts 37
AAbout box 39, 66–68, 72AboutBox.properties file 68accessing
Analytics Cube Viewer 3context menus 11, 14cube reports 3, 4
Actuate Analytics Cube Viewer applicationoverview v
addition operations 46addressing e-mail 61administrators 64Adobe Acrobat Reader 56, 58Analysis Services 61analysis view 12Analysis View button 12Analytics Cube Designer 2Analytics Cube Viewer
canceling sort operations for 18canceling value filters 21changing About box for 66changing defaults for 40changing views in 7
customizing 64, 65, 66, 72data groupings for 6displaying balloon help for 14features disabled 9interface described 7launching 3, 4limitations of 69localizing user interface for 70overview 2, 6, 7, 36related files for 65restarting 40restoring defaults for 34, 40restrictions for 62saving reports for 60security options for 4selecting experience levels for 9viewing data cubes with 12, 61
analytics folder 65Analytics option 2analyzing data 2, 6, 12, 43–52AND keyword 19applets 65application icon 65applying filters 18, 19–25, 44, 50arithmetic mean 47asterisks (*) 45Average command 47average function 44, 47averages 47axis defaults 7axis labels
See also labelsfiltering on 23, 24searching on 25selecting 12, 13, 14
axis subcategories. See subcategories
Bbackslash (\) characters 45balloon help 14bar charts
See also chartsdisplaying percentages in 49

74 W o r k i n g w i t h C u b e R e p o r t s u s i n g A c t u a t e A n a l y t i c s O p t i o n
bar charts (continued)exporting 58, 59navigating through 12, 13setting preferences for 37, 38
bar height 13blank columns or rows 31bookmarks 59branding kits 66browsers. See web browsersbuild numbers 39buttons 7
Ccab files 67, 68, 70, 72cabarc.exe 66Calculate command 47Calculate menu 47Calculate Relative Time Periods dialog 50calculated columns 44, 50calculations 43–52
default precision for 46editing functions for 48null values and 45retrieving source data for 53
Cancel filter command 34Cancel hiding command 30Cancel pattern filter command 24Cancel sorting command 18Cancel value filter command 21canceling data filters 24canceling sort operations 17case-sensitive filters 24Case-sensitive option 24categories
applying filters to 6clearing data filters for 20, 21collapsing/expanding 30display restrictions for 19displaying 7, 26–28editing data filters for 24editing functions in 48expanding 11filtering data in 19, 21, 23, 44, 50overview 6pivoting 28removing functions from 49
replacing 26searching for 25viewing hierarchy of 42viewing multiple 6, 26viewing subcategories of 6viewing subsets of data in 28viewing trends 6
category bar 6, 21category labels
See also labelsadding 42filtering on 21, 24moving 26, 27searching on 25
.cb4 files 6changes, undoing 8, 43changing
configurations 64cube reports 60data filters 24defaults 40numeric formats 48resource files 65sort order 16, 17views 7, 11
character filters 24character searches 25characters 45, 58, 71charts
See also specific typedisplaying 7, 12exporting 58, 59filtering date categories for 44, 50hiding data for 29labeling data points in 38navigating through data in 12, 13, 14plotting values for 45, 49printing 56retrieving source data for 53saving 56selecting style 36selecting type 12, 13, 14setting preferences for 37–38sorting restrictions for 15viewing balloon help for 14viewing percentages in 49viewing relative time periods in 22

I n d e x 75
clearing data filters 20, 21, 23Collaborate button 61Collapse command 11, 31collapsing data 11, 31colors 52column headings 39column-categories variable 39columns
See also fieldsapplying functions to 45changing order of 16comparing subcategories for 12, 13, 14data categories and 6displaying blank values in 32displaying categories on 26–28displaying category hierarchies for 43displaying leading/trailing totals 40–41displaying subcategories 11displaying totals as percentages in 49displaying zero values in 34expanding 15exporting functions for 57filtering on 19, 20referencing subcategories in 45resizing 8, 38sorting on 15–16suppressing blank 31–33suppressing zero values in 33, 34swapping 28
columns axis labels 13, 14See also category labels
columns axis subcategories. See subcategoriesColumns command 32, 41command buttons (menus) 8comma-separated text files 56, 58, 61company names 40, 67company-name variable 39comparisons
applying exception highlighting to 52chart types and 12, 13, 14multiple categories and 6selecting functions for 43–52subcategories and 12
computed columns 44, 50configuration files 64connections 59context menus 11, 14
copying resource files 67, 71copyright information 68, 72count measure 47country codes 71creating cube reports 6CSV files 56, 58, 61CSV formats 53cube profiles 2, 6cube reports
accessing 3, 4changing 60creating 6displaying 4, 60e-mailing 65exporting 56localizing 2, 3overwriting 59saving 39, 57, 58, 60saving preferences 40sending by e-mail 60setting preferences for 36, 40viewing offline 59
Cube Viewer See Analytics Cube Viewercube-name variable 39cubes. See data cubescurrency filters 19current-view variable 39Custom command 18Custom option 17Custom Sort dialog 16, 17, 18Custom sort option 16customizing
About box 66–68Analytics Cube Viewer 64, 65, 66, 72data 36, 40default views 64sort operations 18title bars 39, 68
.cvw files 6
Ddata
See also data cubesanalyzing 2, 6, 12, 43–52customizing 36, 40customizing sort operations for 18

76 W o r k i n g w i t h C u b e R e p o r t s u s i n g A c t u a t e A n a l y t i c s O p t i o n
data (continued)displaying 2, 6, 7, 12, 36expanding levels of 30exporting 53, 56–59, 64filtering 44, 50grouping 6, 28hiding 29, 31, 33highlighting exceptions 52overview 25replacing categories of 26resizing cells for 38searching for 25selecting range of values for 47sorting 15–19, 50summarizing 41, 44, 50undoing changes to 43viewing details of 11viewing relative time periods for 22viewing subsets of 28viewing summary information for 11viewing trends 6
data categories. See categoriesdata cubes
applying exception highlighting to 52building profiles for 2collapsing levels in 31creating axis of 6default view for 7displaying 39, 61expanding levels in 30filtering in 18, 19, 20, 21, 23, 44, 50generating multi-dimensional 2hiding subcategories in 29, 31, 33opening in new windows 39overview 6pivoting categories in 28resizing subcategories in 38, 42saving 6, 59selecting subcategories in 29setting preferences for 31, 33suppressing blank values in 31–33suppressing zero values in 33–34viewing categories in 6, 26–28viewing data in 6, 11, 12
data filtersapplying to multiple categories 6canceling 24
changing 24clearing 20, 21default views and 7entering criteria for 20resetting 23returning time periods with 44, 50setting 19–25sorting with 18
data ranges 19, 47data sources 53data variable 39date-created variable 39dates 22, 30, 44, 50decimal places
default 46setting 48
decimal separators 48default experience level 10default views 7defaults
changing 40restoring 34, 40
Delete calculation command 49deleting
computed columns 51functions 49
delimited text files 56deploying cube reports 60description variable 39deviations 15, 16Difference command 47difference function 44, 47display options 36, 40displaying
balloon help 14blank columns or rows 32categories 7, 26–28category hierarchies 42chart legends 12charts 7, 12computed columns 51cube reports 4, 60data 2, 6, 7, 12, 36data cubes 39, 61data subsets 28functions 45hidden subcategories 30

I n d e x 77
leading/trailing totals 40–41multiple rows 28PDF documents 58, 59percentages 14, 49spreadsheets 56, 58subcategories 6, 11summary information 11truncated values 38zero values 34
Disregard hierarchy preference 19division by zero 45document files
exporting to 57–59documents
See also cube reportsattaching to e-mail 61, 65exporting to Microsoft Word 56, 57sending Microsoft Word 61viewing PDF 58, 59
downloading branding kits 66drill controls 42Drill to detail data option 53
Ee.Spreadsheet reports 56
See also spreadsheetsEdit calculation command 48Edit pattern filter option 25editing. See changingeditors 58, 64, 67e-mail
changing headers for 65entering address in About box 68sending cube reports as 60
empty columns or rows 31empty data fields 45encoding 71Encyclopedia volumes
adding data cubes 2adding reports 60opening cube reports in 4
error messages 45Excel spreadsheets
displaying 56exporting to 56–57, 64sending as e-mail 61
exception highlighting 52Exception Highlighting dialog 52Expand to level command 11, 30Expand to level list 21expanding data categories 11, 30experience levels 9Export detail data command 53, 54export files 68exporting data 53, 56–59, 64
limitations for 57, 58expressions
filtering with 19, 20, 25restrictions for 19suppressing blank values with 31suppressing zero values with 33
Ffields
See also columnsapplying filters to 19, 21, 23categorizing distinct entries for 6clearing data filters for 20, 21editing data filters for 24entering in functions 45hiding empty values in 31hiding zero values in 33sorting data in 15, 17truncated values in 38
file names 56, 58files
attaching to e-mail 61changing resource 65copying resource 67, 71exporting to 57–59opening resource 67overwriting 59, 60setting default export 68
fill colors 52Filter by pattern command 23Filter by Pattern dialog 23Filter by value command 20Filter by Value dialog 20filter icon 20, 21, 22, 24, 31Filter out blank values command 32Filter out zero values command 34

78 W o r k i n g w i t h C u b e R e p o r t s u s i n g A c t u a t e A n a l y t i c s O p t i o n
filtersapplying to multiple categories 6canceling 24changing 24clearing 20, 21default views and 7entering criteria for 20resetting 23returning time periods with 44, 50setting 19–25sorting with 18
filters variable 39Find command 25Find dialog 25Find Next command 25finding data 25fit to page options 38floating point numbers 19fonts 2, 52footers 39, 66forecasting 14formats
changing 48e-mail attachments and 61exporting and 53selecting number 48
functionsanalyzing data with 43–52default views and 7deleting 49exporting 57
Ggenerating
multi-dimensional data cubes 2PDF documents 59reports for offline viewing 59
grand totals 49graphic resources 65graphic views 7graphical user interfaces 64, 70graphs. See charts; line graphsgray bars in cells 38gridlines 42grouping data 6, 28GUIs 64, 70
Hheaders 39, 40, 65help 14Hide selected command 29, 30Hide unselected command 29, 30hiding
blank values 31–33chart legends 12data 29, 31, 33drill controls 42gridlines 42subcategories 28zero values 33–34
Hierarchical preferences 42, 43Highest to lowest command 16, 17Highest to lowest option 16, 17highlight line 27highlighting data 52Home command 34Horizontal Bar Chart button 12, 36horizontal bar charts 13
See also bar chartsHorizontal fit to page button 8, 38hyphens (-) 45
Iimage files 65Information Console 64, 67, 71
accessing Encyclopedia from 3customizing Analytics Cube Viewer
for 65, 67, 71exporting data from 64managing cube reports with 60
intersection (AND) function 45Intersection command 47
Jjar files 67, 68, 70, 72jar.exe utility 66
Kkeyboard shortcuts 29, 47

I n d e x 79
Llabels
filtering on 21, 23, 24highlighting 52interface-specific 7moving 26, 27resizing subcategories for 42searching on 25selecting 12, 13, 14setting preferences for 37, 43
language codes 71language settings 3, 70launching Analytics Cube Viewer 3, 4leading totals 40, 41legends 12licensing keys 2Line Graph button 12, 36line graphs
displaying percentages in 49exporting 58, 59filtering date categories for 44, 50labeling data points in 38navigating through 14setting preferences for 38
localesconverting multi-byte encoding for 71displaying data for specific 2selecting language settings for 3specifying language settings for 70
localizing Analytics Cube Viewer 70locating data 25login pages 3logos 65Lowest to highest command 16, 17Lowest to highest option 16, 17
Mmail. See e-mailMain Title bar. See title barsManagement Console
customizing Analytics Cube Viewer for 65, 67, 71
exporting data from 64managing cube reports with 60
Maximum Value command 47maximum value function 44
measure variable 39measures category 6, 41menus
accessing context 11, 14selecting commands 8, 9
Message dialog 61messages 72
See also e-mailMicrosoft Analysis Services 61Microsoft Cabinet SDK 66Microsoft Excel. See Excel spreadsheetsMicrosoft Word documents 56, 57, 61Minimum Value command 47minimum value function 44moving labels 26, 27multibyte characters 71multidimensional analysis 2multidimensional data structures 6
Nnaming conventions 71nan value 31native2ascii.exe 71network administrators. See administratorsNew window button 39no data to display message 50NOT keyword 19, 45null values 45numeric filters 19, 24numeric formats
changing 48selecting 48
numeric values 6, 14, 37, 41, 46See also values
Ooffline viewing 59opening
comma-separated files 58configuration files 64cube reports 4multiple views 39resource files 67tab-separated files 58
operating systems 2operators 19, 45

80 W o r k i n g w i t h C u b e R e p o r t s u s i n g A c t u a t e A n a l y t i c s O p t i o n
options 36, 40OR keyword 19overwriting report files 59, 60
Ppage footers 39page headers 39, 40param-value element 65parentheses in expressions 19passwords 3patterns 24PDF files
attaching to e-mail 61exporting to 56, 58saving reports as 39
Percent of total command 47percent of total function 44percentage growth function 44, 47percentages 13, 37, 47, 49
displaying as numbers 14performance 53Pie Chart button 12, 36pie charts
See also chartsdisplaying data in 14displaying numeric values for 14hiding data for 29labeling sections in 37limiting number of slices 37setting preferences for 37, 38sorting restrictions for 15
Pie Slices preference 37pivoting categories 28plug-ins 56, 58pound signs in cells 38precedence 19precision 46preferences
restoring defaults 34, 40saving 40setting chart 37–38setting cube 31, 33, 40–43
presentation view 12Presentation View button 12previous year to date 22printing 59
product names 68product-name variable 39properties files 70
Rraised move handle 26range of values 19, 47Ratio command 47ratio function 44, 47ratios 47records. See rowsRedo button 43redoing changes 43relationships 2, 6, 19relative time period filters 50relative time periods 22, 50–52Relative time periods command 50relative time periods function 44release numbers 68removing. See deletingrenaming views 40replacing categories 26report files
attaching to e-mail 61overwriting 59, 60
reports. See cube reportsReports drop-down list 60reserved characters 45, 58resetting data filters 23Resize label width preference 42resizing
chart legends 12columns 8, 38rows 8subcategories 38, 42views 38
resource files 65, 67, 71restoring defaults 34, 40Rich Text Formats 56rounding 46row-categories variable 39rows
applying functions to 45changing order of 15comparing subcategories for 12, 13, 14data categories and 6

I n d e x 81
displaying blank values in 32displaying categories on 26–28displaying category hierarchies for 43displaying leading/trailing totals 41displaying multiple 28displaying subcategories 11displaying totals as percentages in 49displaying zero values in 34expanding 15, 38exporting functions for 57filtering on 19, 20referencing subcategories in 45resizing 8sorting on 16–17suppressing blank 31–33suppressing zero values in 33, 34swapping 28
rows axis labels 12, 14See also category labels
rows axis subcategories. See subcategoriesRows command 31, 41RTF files 39, 56, 57
SSave As command 60Save as Microsoft Excel icon 56Save as Microsoft Word command 57Save as PDF dialog 59Save as Separated Values dialog 58Save command 60Save Offline dialog 59saving
charts 56cube reports 39, 57, 58, 60data cubes 6, 59preferences 40string bundle files 71
searching 25security options 4security warnings 72Select Time Period dialog 22Send report command 61sending e-mail 61, 65setting preferences 37, 40–43Show 3D visual effect preference 37Show blank columns preference 32
Show blank rows preference 31, 32Show category hierarchy preference 43Show cell value option 49Show Data as command 49Show data values as preference 37Show Expand and Collapse controls
preference 42Show grid lines preference 42Show highest 10 option 16, 17Show labels preference 37, 43Show lowest 10 option 16, 17Show matching option 24Show radio buttons 18Show rows with all zeros preference 33, 34Show Save as dialog 59Show totals preferences 41slash (/) characters 45Sort command 15, 17sort options 15, 17sort order
changing 16, 17specifying 19
Sort radio buttons 19sorting arrow 16, 17sorting data 15–19, 50special characters 45, 58spreadsheets
displaying 56, 58exporting to 53, 56–57, 64sending as e-mail 61
stacked bar charts 13See also bar charts
starting Analytics Cube Viewer 4string bundle files 71subcategories
analyzing in charts 12, 13, 14applying filters to 18canceling filters for 24canceling sort operations on 17changing filters for 24choosing multiple 29collapsing 11, 31comparing 12defined 6deselecting 29editing functions in 48entering in expressions 19

82 W o r k i n g w i t h C u b e R e p o r t s u s i n g A c t u a t e A n a l y t i c s O p t i o n
subcategories (continued)expanding 11filtering on 20, 21, 23getting lowest/highest 18grouping 28hiding 29, 31, 33referencing in functions 45, 48removing filters 23removing functions from 49resizing 38, 42searching for 25selecting 29setting chart preferences for 37sorting on 15, 16, 18sorting restrictions for 19suppressing blank values in 32viewing hidden 30
subcategory labelsSee also labelsadding 42filtering on 24selecting 12, 13, 14
subsets (data) 28subtitles 39subtraction 47Sum command 47sum function 44sum over relative time periods function 44summarizing data 41, 44, 50Sun Microsystems JDK 66suppressing
blank columns or rows 31–33zero values 33–34
Swap rows and columns command 28swapping rows and columns 28symbols 45system administrators. See administratorssystem settings 2
Ttable 12, 38, 40Table button 12, 36tables
displaying relative time periods from 22retrieving 53
tab-separated text files 56, 58, 61
text 39text editors 58, 64, 67text files 56, 57, 58, 61thousands separators 483D charts 37time periods 22, 50–52time stamps 4time zones 4title bars
adding variables to 39, 40customizing 39, 65, 68setting offset for 68shown 7
toolbars 7, 9totals 40, 41, 46, 49trailing totals 40, 41trends 2, 6, 14, 15, 16truncated values 38TSV files 56, 58, 612D charts 37
UUndo button 43undoing changes 8, 43union (OR) function 45Union command 47URLs 3user interfaces 64
localizing 70–72user names 3user preferences. See preferences
Vvalues
See also dataappearing as gray bars 38applying exception highlighting to 52averaging 47calculations and null 45categorizing distinct entries for 6customizing sort operations for 18displaying blank 32displaying cell 49displaying zero 34getting lowest/highest 18resizing cells for 38

I n d e x 83
retrieving source data for 53rounding 46searching for 25selecting range of 47sorting highest to lowest 16, 17sorting lowest to highest 16, 17specifying range of 19suppressing blank 31–33suppressing zero 33–34
variables 39, 40version variable 39Vertical Bar Chart button 12, 36vertical bar charts 12
See also bar chartsVertical fit to page button 8, 38viewing
balloon help 14blank columns or rows 32categories 7, 26–28category hierarchies 42chart legends 12charts 7, 12computed columns 51cube reports 4, 60data 2, 6, 7, 12, 36data cubes 39, 61data subsets 28functions 45hidden subcategories 30leading/trailing totals 40–41multiple rows 28PDF documents 58, 59percentages 14, 49spreadsheets 56, 58subcategories 6, 11summary information 11truncated values 38zero values 34
viewschanging 7, 11choosing specific 12
collapsing data categories for 11customizing 39, 64default 7displaying hidden categories in 30displaying multiple categories 6, 26expanding data categories for 11features described 7hidden subcategories and 31hiding subcategories in 30opening multiple 39renaming 40resizing 38resizing columns and rows in 8restoring defaults for 34, 40restoring previous 8saving preferences 40selecting chart styles for 36setting display options for 36setting preferences and 31, 33setting preferences for 38, 40
volume administrators. See administrators
Wwarnings 72web addresses 68web browsers
bookmarking reports 59displaying cube reports with 2, 3spreadsheet plug-ins and 56, 58
web.xml 64Word documents 56, 57, 61Work Offline option 59
Yyear to date time periods 22
Zzero values 31, 33zip codes 46

84 W o r k i n g w i t h C u b e R e p o r t s u s i n g A c t u a t e A n a l y t i c s O p t i o n