Embed Size (px)
Citation preview
Unclassified TAD/CA/APM/WP(2014)5/FINAL Organisation de Coopération et de Développement Économiques Organisation for Economic Co-operation and Development 16-Jul-2014 ___________________________________________________________________________________________
English - Or. English TRADE AND AGRICULTURE DIRECTORATE COMMITTEE FOR AGRICULTURE
Working Party on Agricultural Policies and Markets
OECD-FAO AGRICULTURAL OUTLOOK, 2014-2023: PART II
Contact: Grégoire Tallard ([email protected])
JT03360466
Complete document available on OLIS in its original format This document and any map included herein are without prejudice to the status of or sovereignty over any territory, to the delimitation of international frontiers and boundaries and to the name of any territory, city or area.
TAD
/CA
/APM
/WP(2014)5/FIN
AL
Unclassified
English - O
r. English

TAD/CA/APM/WP(2014)5/FINAL
2
(Note by the Secretariat)
This is the final version of Part II of the OECD-FAO Agricultural Outlook 2014-2023, the annual report prepared in close collaboration with the Food and Agriculture Organization (FAO) of the United Nations.
It is circulated on OLIS as part of the following set of documents forming the 2014 report:
Part I [TAD/CA/APM/WP(2014)4/FINAL]
Executive Summary
Chapter 1. Overview
Chapter 2. Special Feature: Feeding India: Prospects and Challenges in the Next Decade
Part II [TAD/CA/APM/WP(2014)5/FINAL]
Chapter 3. Biofuels
Chapter 4. Cereals
Chapter 5. Oilseeds and Oilseed Products
Chapter 6. Sugar
Chapter 7. Meat
Chapter 8. Fish and Seafood
Chapter 9. Dairy
Chapter 10. Cotton
Part III [TAD/CA/APM/WP(2014)6/FINAL]
Glossary of terms
Methodology
Statistical Tables

TAD/CA/APM/WP(2014)5/FINAL
3
TABLE OF CONTENTS
CHAPTER 3. BIOFUELS ............................................................................................................................... 7
Abstract ....................................................................................................................................................... 7 Market situation ........................................................................................................................................... 7 Projection highlights.................................................................................................................................... 7 Market trends and prospects ........................................................................................................................ 9 Main issues and uncertainties .................................................................................................................... 21
CHAPTER 4. CEREALS .............................................................................................................................. 24
Abstract ..................................................................................................................................................... 24 Market situation ......................................................................................................................................... 24 Projection highlights.................................................................................................................................. 25 Market trends and prospects ...................................................................................................................... 25 Main issues and uncertainties .................................................................................................................... 40
REFERENCES .............................................................................................................................................. 40
CHAPTER 5. OILSEEDS AND OILSEED PRODUCTS ............................................................................ 41
Abstract ..................................................................................................................................................... 41 Market situation ......................................................................................................................................... 41 Projection highlights.................................................................................................................................. 41 Market trends and prospects ...................................................................................................................... 43 Main issues and uncertainties .................................................................................................................... 48
CHAPTER 6. SUGAR .................................................................................................................................. 52
Abstract ..................................................................................................................................................... 52 Market situation ......................................................................................................................................... 52 Projection highlights.................................................................................................................................. 53 Market trends and prospects ...................................................................................................................... 54 Main issues and uncertainties .................................................................................................................... 65
CHAPTER 7. MEAT ..................................................................................................................................... 67
Abstract ..................................................................................................................................................... 67 Market situation ......................................................................................................................................... 67 Projection highlights.................................................................................................................................. 68 Market trends and prospects ...................................................................................................................... 69 Main issues and uncertainties .................................................................................................................... 79
CHAPTER 8. FISH AND SEAFOOD .......................................................................................................... 83
Abstract ..................................................................................................................................................... 83 Market situation ......................................................................................................................................... 83 Projection highlights.................................................................................................................................. 84 Market trends and prospects ...................................................................................................................... 84 Main issues and uncertainties .................................................................................................................... 93
CHAPTER 9. DAIRY ................................................................................................................................... 97
Abstract ..................................................................................................................................................... 97 Market situation ......................................................................................................................................... 97 Projection highlights.................................................................................................................................. 97

TAD/CA/APM/WP(2014)5/FINAL
4
Market trends and prospects ...................................................................................................................... 99 Main issues and uncertainties .................................................................................................................. 105
CHAPTER 10. COTTON ............................................................................................................................ 107
Abstract ................................................................................................................................................... 107 Market situation ....................................................................................................................................... 107 Projection highlights................................................................................................................................ 107 Market trends and prospects .................................................................................................................... 108 Main issues and uncertainties .................................................................................................................. 115
Tables
Table 3.1. Simulation of gasohol and hydrous ethanol prices (BRL/litre) based on the harvest data for 2012/13 ...................................................................................................................................................... 14 Table 3.2. Price simulation presupposing that petrol had fully accompanied oil price variations and the Brazilian exchange rate (BRL/litre) .......................................................................................................... 14 Table 4.1. Bread waste statistics ............................................................................................................... 33 Table 4.2. Production and price changes of commodities requiring feeds in 2023 based on the counterfactual scenario .............................................................................................................................. 35 Table 4.3. Policy scenarios and simulations results for rice under climate change conditions ................. 39 Table 6.1. EU sugar market effects of continuing production quotas from 2013 to 2023 ........................ 62
Figures
Figure 3.1. Biofuel prices to remain almost constant in real terms ............................................................. 9 Figure 3.2. Structure of US mandates in 2013, in EISA 2014 and in the EPA proposal for 2014 ............ 10 Figure 3.3. Development of the world ethanol market .............................................................................. 15 Figure 3.4. Regional distributions of world ethanol production and use in 2023 ..................................... 16 Figure 3.5. Development of the world biodiesel market ........................................................................... 17 Figure 3.6. Regional distributions of world biodiesel production and use in 2023 ................................... 18 Figure 3.7. Share of feedstocks used for ethanol production1 .................................................................. 20 Figure 3.8. Share of feedstocks used for biodiesel production .................................................................. 20 Figure 4.1. Cereal prices fall over the medium term ................................................................................. 26 Figure 4.2. Limited potential to increase cereal production due to weak area expansion and moderate yield growth over the medium term .......................................................................................................... 27 Figure 4.3. Recovery of wheat stocks led by production increases in the Russian Federation ................. 27 Figure 4.4. A rapid recovery of coarse grains stocks is led by higher production of US corn .................. 28 Figure 4.5. Stabilisation of world rice stocks and progressive reduction in Thailand ............................... 29 Figure 4.6. Increasing food and feed demand for wheat in developing countries ..................................... 30 Figure 4.7. African countries increase their share in world rice imports .................................................. 31 Figure 4.8. Increasing biofuel and feed demand for coarse grains ............................................................ 31 Figure 4.8. Increasing biofuel and feed demand for coarse grains ............................................................ 32 Figure 4.9. Increasing use of non-conventional feeds led by dried distiller's grains ................................. 35 Figure 4.10. Wheat export shares for major countries .............................................................................. 36 Figure 4.11. Rapid expansions of coarse grains exports ........................................................................... 37 Figure 4.12. Cereal net trade in China ....................................................................................................... 37 Figure 4.13. Rice export shares of major countries ................................................................................... 38 Figure 5.1. Oilseeds prices remain at higher plateau ................................................................................. 42

TAD/CA/APM/WP(2014)5/FINAL
5
Figure 5.2. Share of global oilseed crush among leading regions ............................................................. 44 Figure 5.3. Biodiesel to use a large share of vegetable oil consumption................................................... 45 Figure 5.4. Growth in protein meal consumption and animal production, (2011-13 vs. 2023 .................. 46 Figure 5.5. Share of vegetable oil exports in 2023 .................................................................................... 48 Figure 5.6. Potential influence of the National Indonesian Energy Policy (KEN) on global vegetable oil markets ...................................................................................................................................................... 51 Figure 6.1. World sugar balance moves into a fourth consecutive production surplus ............................. 52 Figure 6.2. World sugar prices to recover in the near term and to remain on a higher plateau ................. 53 Figure 6.3. The global sugar stock-to-use ratio to follow a downward trend ............................................ 54 Figure 6.4. Most of the additional ethanol and sugar increases will come from sugarcane production .... 56 Figure 6.5. Much higher growth in sugar demand is expected in developing countries ........................... 57 Figure 6.6. Sugar production and exports to increase in Brazil as ethanol output expands ...................... 58 Figure 6.7. China’s sugar stock-to-use ratio to decline ............................................................................. 59 Figure 6.8. Contrasting trends among major sugar importers ................................................................... 64 Figure 6.9. Sugar exports will stay concentrated and dominated by Brazil .............................................. 65 Figure 7.1a. World prices in nominal terms, USD/c.w.e or r.t.c1 ............................................................. 69 Figure 7.1b. World prices in real terms, USD/c.w.e or r.t.c1, 2 ................................................................ 69 Figure 7.2. Meat to feed price ratios should return to historical trend ...................................................... 70 Figure 7.3. Growth of meat production by region and meat type, 2023 vs. 2011-2013 (Kt c.w.e./r.t.c) .. 71 Figure 7.4. Countries with the greatest share of additional meat production by meat type, 2023 vs. 2011-2013 (kt c.w.e. or r.t.c) .............................................................................................................................. 71 Figure 7.5. Cattle cycle: Inventory of beef cows in the United States ...................................................... 73 Figure 7.6. Meat consumption per capita increases as income levels rise ................................................ 74 Figure 7.7. Regional composition of meat consumption - average 2010-13 ............................................. 75 Figure 7.8. Per capita meat consumed in the world 2023 vs. base period 2011-13 .................................. 76 Figure 7.9. Buffalo meat exports from India 2012-13 ............................................................................... 77 Figure 7.10. Changes in the net trade of meat by type and region 2023 vs. base period .......................... 79 Figure 8.1. World prices in real terms expected to remain high ............................................................... 85 Figure 8.2. Asian countries dominate fisheries production ....................................................................... 86 Figure 8.3. Aquaculture surpassing capture fisheries for human consumption ......................................... 87 Figure 8.4. Increase in fish consumption by region between the base period and 2023 ........................... 90 Figure 8.5. Reduction in the inclusion rate of fishmeal in animal feed rations ......................................... 91 Figure 8.6. Trade of fish for human consumption ..................................................................................... 92 Figure 9.1. World dairy prices in nominal terms ....................................................................................... 98 Figure 9.2. World dairy prices in real terms (2005 USD) ......................................................................... 98 Figure 9.3. Outlook for milk production ................................................................................................. 100 Figure 9.4. China's dairy product imports continue to increase over the Outlook period ....................... 101 Figure 9.5. Major dairy product consumption (in milk equivalent ......................................................... 102 Figure 9.6. Dairy product exporter .......................................................................................................... 104 Figure 9.7. Major dairy product importers .............................................................................................. 105 Figure 10.1. Cotton prices rise between 2000-09 and 2014-23 ............................................................... 108 Figure 10.2. World cotton production by major producer ....................................................................... 109 Figure 10.3. Cotton ending stocks rise sharply ....................................................................................... 110 Figure 10.4. Cotton area relative to area for total grains and oilseeds in major producing countries ..... 111 Figure 10.5. World per capita consumption of cotton remains below peak ............................................ 112 Figure 10.6. World cotton consumption rebounds, but relatively slowly ............................................... 113 Figure 10.7. World cotton trade shares by exporter, 2011-13 and 2023 ................................................. 114 Figure 10.8. World cotton trade shares by importer, 2011-13 and 2023 ................................................. 115 Figure 10.9. World cotton stocks shift out of China ............................................................................... 116

TAD/CA/APM/WP(2014)5/FINAL
6
Boxes
Box 3.1. Uncertainties around the Environmental Protection Agency (EPA) decision concerning the levels of US biofuels mandates ................................................................................................................. 10 Box 3.2. The influence of petrol price controls on hydrous ethanol prices in Brazil ................................ 13 Box 3.3. Sub-national policies supporting biofuels ................................................................................... 21 Box 4.1. Campaign to prevent bread waste in Turkey .............................................................................. 33 Box 4.2. Structural changes in the feed market ......................................................................................... 34 Box 4.3. Contribution of agricultural investments to stabilising international rice price volatility under climate change ........................................................................................................................................... 39 Box 5.1. Policy options for biofuel in Indonesia: Implications for vegetable oil markets ........................ 50 Box 6.1. Some market impacts of EU sweetener production quotas ........................................................ 61 Box 6.2. The US sugar programme under pressure to remove surpluses .................................................. 63 Box 7.1. Income and meat consumption ................................................................................................... 74 Box 7.2. Exports of buffalo meat from India ............................................................................................ 77 Box 7.3. Global agenda for sustainable livestock ..................................................................................... 81 Box 8.1. Recycling fish residue in the fishmeal and oil market ................................................................ 88 Box 9.1. Challenges and opportunities facing China’s dairy sector ........................................................ 100 Box 9.2. Milk and dairy products in human nutrition ............................................................................. 103 Box 10.1. China’s cotton policies drive large changes in world ending stocks ...................................... 110

TAD/CA/APM/WP(2014)5/FINAL
7
Chapter 3. Biofuels
Abstract
This chapter describes the market situation and the latest set of quantitative medium term projections for global and national biofuel markets for the ten-year period, 2014-23. It covers the developments expected in world and national ethanol and biodiesel prices, production, use, trade and stocks. The quantitative projections are developed with the aid of the partial equilibrium Aglink-Cosimo model of world agriculture. The chapter also includes three boxes that explain the uncertainties around the US Environmental Protection Agency (EPA) decision concerning the levels of biofuels mandates, the influence of petrol price controls on hydrous ethanol prices in Brazil, and, sub-national policies supporting biofuels. The chapter concludes with a discussion of some main issues and uncertainties that may have an impact on the medium term outlook for biofuels. These include biofuel policies, and specific market developments influencing production, consumption and trade in biofuels.
Market situation
The year 2013 was marked by several policy decisions that have strongly influenced the market environment for biofuels. The European Union put in place trade measures against imports of biofuels from Argentina, Indonesia and the United States. There were also proposals towards lower first generation biofuels targets for 2020 in the European Renewable Energy Directive (RED). In Brazil, the ethanol blending requirement was raised to 25% for low blends.1 At the same time, artificially lower domestic petrol prices in Brazil had some impacts on the use of high blends of ethanol. In Argentina and Indonesia, domestic biodiesel mandates were increased - partly in response to European anti-dumping measures. And for the first time, the EPA made proposals to reduce the total, advanced and cellulosic biofuel mandates for 2014.
The availability of cereals, oilseeds and palm oil in 2013 improved compared to 2012, and thus commodity prices edged lower. In 2013, world ethanol2 and biodiesel3 prices continued their declines from their historical high levels of 2011 in a context of ample supply for both ethanol and biodiesel.
Projection highlights
• Ethanol prices (Figure 3.1) are projected to increase in line with the inflation rates and crude oil prices over the next decade. Biodiesel prices are also expected to increase but their growth should be slower, mostly driven by the expected growth in vegetable oil prices and to a lesser extent by the growth in crude oil prices.
1 Low blends refer gasohol sold at the pump for ordinary cars. By opposition, high blends refer to gasohol
sold at the pump that only flex-fuel vehicles can accept. 2 Brazil, Sao Paolo (ex-distillery), anhydrous. 3 Producer price Germany net of biodiesel tariff and of energy tax.

TAD/CA/APM/WP(2014)5/FINAL
8
• Increasing domestic demand in key exporting countries is expected to raise biodiesel prices in 2016 and 2017. This trend is in line with the assumptions in this Outlook on the continuation of biofuel policies.
• Global ethanol and biodiesel production are both expected to expand to reach, respectively, 158 Bln L and 40 Bnl L by 2023. Ethanol and biodiesel will continue to be mostly produced from feedstocks that can also be used for food. By 2023, 12%, 28% and 14% of world coarse grains, sugar cane, and vegetable oil production, respectively, are expected to be used to produce biofuels.
• Ethanol use in the United States will be limited by the ethanol blend wall4 and should only grow marginally in the latter years of the projection period, leaving additional biodiesel use necessary to meet the advanced and total mandates. The policy driven imports of sugarcane based ethanol to fill the advanced gap5 are also expected to flatten at the end of the next decade to reach 10 Bln L by 2023. It is assumed that by 2023 only 12% of the US cellulosic mandate will be implemented.
• For the European Union, the Outlook assumes that the fulfilment percentage of the RED coming from biofuels should reach 8.5% in 2020.6 Biodiesel use is expected to increase in the first part of the projection period and then to stay at a plateau of 19 Bln L from 2020 onwards. The increase in production of second generation biofuel will remain very limited. Imports will be necessary to satisfy the RED target.
4 The term blend wall refers to short run technical constraints that act as an impediment to increased ethanol
use. It is assumed in this Outlook that US cars will not be able to consume gasohol with more than 14% of ethanol mixed with petrol. The blend wall should increase gradually from the current 10%, and it is assumed to be reached by 2020.
5 The advanced gap corresponds to the difference between the advanced mandate, and the biodiesel and cellulosic mandates. It corresponds to fuels being able to achieve a 50% greenhouse gas reduction. Sugarcane based ethanol qualifies as an advanced biofuel.
6 This assumption responds to likely market developments and is in line with the recently published Prospects for Agricultural Markets and Income in the EU 2013-2023 (www.eurocarne.com/pdf/informes/previsionesUE2013-2023.pdf). The remainder of the target will be met from other renewable energy sources such as electric cars for example.

TAD/CA/APM/WP(2014)5/FINAL
9
Figure 3.1. Biofuel prices to remain almost constant in real terms
Evolution of prices expressed in nominal terms (left) and in real terms (right)
Notes: Ethanol: Brazil, Sao Paulo (anhydrous, ex-distillery), Biodiesel: Producer price, Germany, net of biodiesel tariff and energy tax.
Source: OECD and FAO Secretariats.
Market trends and prospects
Main assumptions
Over the last seven years, a certain number of developed and developing countries have implemented ambitious biofuel targets or mandates as well as other support measures to the biofuel sector. Their motivation was based mainly on different, and in some cases complementary objectives, including achieving a high level of energy security, reducing greenhouse gas emission, and increasing domestic value added products for export as well as rural development.
In the United States, biofuel production and use are mainly driven by policies in place, namely the Renewable Fuel Standard (RFS2) set in 2007. It is important to note that this Outlook does not take into account the latest proposal7 made by the EPA to reduce the total, the advanced and the cellulosic mandates for 2014. A final decision by the EPA is expected in June 2014 at the earliest. Uncertainties around this proposal are described in Box 3.1.
7 http://www.epa.gov/OTAQ/fuels/renewablefuels/documents/420f13048.pdf.
0
20
40
60
80
100
120
140USD/hl
Ethanol Biodiesel
0
20
40
60
80
100
120
140USD/hl
Ethanol Biodiesel

TAD/CA/APM/WP(2014)5/FINAL
10
Box 3.1. Uncertainties around the Environmental Protection Agency (EPA) decision concerning the levels of US biofuels mandates
The US Energy Independence and Security Act (EISA) of 2007 defined the Renewable Fuel Standard programme known as RFS2.1 Under this programme,2 EISA established four quantitative annual mandates up to 2022. The total and advanced mandates require fuels to achieve respectively at least a 20% and a 50% GHG reduction. A minimum quantity of the advanced mandate must come from biodiesel and cellulosic renewable fuels. The biodiesel and cellulosic minimums leave an advanced gap which can be met with fuels such as sugarcane based ethanol. The conventional gap, the difference between the total mandate and the advanced mandate could potentially come from maize based ethanol. The mandates only restrict minimum quantities and are nested within each other.
Blenders, the obligated party in the system of mandates, must show compliance in all four mandate categories through the submission of Renewable Identification Numbers (RINs) to EPA. A RIN is a 38-digit number which indicates the year, volume and highest mandate classification the renewable fuel is capable of meeting. A blender can detach and use the RIN for compliance or sell the RIN to another blender on the RIN market to help satisfy their obligation. Blenders are allowed to “rollover”’ or run a “deficit” of RINs into the following year, although only up to 20% of a given mandate may be met with RINs produced in the previous or following year. RIN prices have experienced important variations over recent years as stakeholders may be concerned with issues such as the ethanol blend wall3, the availability of certain category of biofuels or the uncertainties concerning future mandate levels.
Since the establishment of EISA, the EPA has provided the minimum quantities for each of the four classes of biofuels required each year. Thus far, the production capacity for cellulosic ethanol has lagged well behind the mandated quantities. Until now the EPA has systematically chosen to reduce the applicable volume of cellulosic biofuels. In that situation, EPA would have been allowed to also reduce the applicable volume of advanced biofuel and total renewable fuel specified in RFS2. EPA has always kept the total and advanced mandate at their original levels given expected availability of biofuels (being biodiesel, imported sugarcane based ethanol or other advanced biofuels) to meet the advanced mandate.
The implementation decision of the EPA for 2014 is not yet known. In November 2013, EPA made a proposal to cut for the first time the total renewable fuel mandate, the total advanced biofuels mandate as well as the cellulosic mandate for 2014. This proposal is significantly below the final 2013 RFS and the initial numbers set by EISA for 2014 (Figure 3.2). The biodiesel mandate for 2014 is proposed to remain the same as in 2013.
Figure 3.2. Structure of US mandates in 2013, in EISA 2014 and in the EPA proposal for 2014
Source: US Environmental Protection Agency.
0
10
20
30
40
50
60
70
80
Final 2013 RFS 2014 EISA EPA proposal for 2014
bln L
Conventional gap Other advanced gap Biodiesel (in fuel ethanol eq) Cellulosic mandate

TAD/CA/APM/WP(2014)5/FINAL
11
The main arguments behind this cut are:
• The limitations for the industry to produce cellulosic biofuels;
• The issue of ethanol blend wall. Quantitative biofuel mandates have been rising in the United States since the establishment of EISA whereas motor fuel use has been decreasing. In 2012, the maximum blend of ethanol for conventional petrol vehicles was set at 15% for vehicles produced in 2001 or later. However, the dispensing of E154 and E855 is not widespread in the United States. For the EPA, the blend wall problem represents a circumstance that warrants a reduction in the mandated volumes for 2014 under the “inadequate domestic supply” waiver provision in the RFS.
A period of comments on the proposal for all stakeholders ended at the end of January 2014. The final EPA rule-making on 2014 mandates is expected in June 2014 and could be slightly different from the proposal. EPA has announced that it will also propose a methodology to derive future mandates. This would prevent periods of uncertainties on US biofuel markets and the RIN spot markets when the annual EPA decisions are not known. This methodology is likely to take into account the fact that, unless retailers have strong incentives to propose higher blends at the pump, ethanol use in the United States will be limited in the future by the blend wall and will not be able to reach the level specified in EISA. Any reduction in total, advanced and cellulosic mandates in the coming years will have an impact on US biofuel use and production especially as the cellulosic mandates was set to expand massively. If the advanced gap is reduced significantly it is likely that the two way ethanol trade between the United States and Brazil will be reduced. The uncertainty around the EPA implementation decision comes at a period when the US administration is seeking to develop its bioeconomy.6
1 http://www.epa.gov/OTAQ/fuels/renewablefuels/ 2 US biofuel policies were described in details in OECD – FAO (2012). 3 The blend wall term refers to short run technical constraints that act as an impediment to increased ethanol use. 4 E15 refers to gasohol with 15% volume of ethanol blended into gasoline. E10 is still the most commonly available gasohol
in the United States. 5 E85 refers to gasohol with 85% volume of ethanol blended into gasoline. E85 is used by flex fuel vehicles. 6 The National bioeconomy blueprint was released in April 2012:
http://www.whitehouse.gov/sites/default/files/microsites/ostp/national_bioeconomy_blueprint_april_2012.pdf.
The Outlook assumes that it is unlikely that the strong increases for lingo-cellulosic biomass based biofuels, which are foreseen in the RFS2, can be met as the industry does not seem to be prepared for large scale production technologies in the upcoming years. It is assumed that by 2023 only 12% of the cellulosic mandate will be implemented and that the difference between the EISA cellulosic mandate and the assumed mandate will be entirely waived. This means that the Outlook assumes the United States advanced and the total mandates to be respectively 67% and 40% lower than what is specified in RFS2. The biodiesel mandate is assumed to remain constant. As a consequence, the advanced gap should reach 11.6 Bln L by 2023. The biodiesel blender tax credit is not expected to be reinstated.
In the United States the maximum amount of ethanol that can be mixed with petrol in low blends is 15% for cars built after 2001. Since older cars will eventually leave the fleet, the amount of ethanol being consumed in low blend mixes is assumed to increase over the next decade to reach a maximum level of 14% by 2020. However, this assumption is subject to uncertainty as at present the supply of E15 blends8 to consumers is encountering some difficulties. There are different reasons for this: retailers may not be willing to supply E15 due to the fact that earlier car warrantees may limit ethanol content to the previous 10% limit; mis-fuelling of vehicles by consumers or simply problems of availability at the pump. The quantity of ethanol to be used over the next decade in the United States will be limited by the blend wall and by the expected decrease in petrol consumption.
8 E15 refers to gasohol with 15% volume of ethanol blended into petrol. E10 is still the most commonly
available gasohol in the United States.

TAD/CA/APM/WP(2014)5/FINAL
12
In the European Union, the 2009 RED9 states that renewable fuels (including non-liquids) should increase to 10% of total transport fuel use by 2020 on an energy equivalent basis. At the moment, the political environment for biofuels in the European Union is marked by a certain degree of uncertainty. The European Parliament proposed a revision of the RED in September 2013. Energy ministers did not reach a consensus on the reform in December 2013.
In January 2014, the European Commission proposed a framework providing predictable and certain energy and climate objectives10 applicable beyond 2020 and up to 2030. The framework underlined that first generation biofuels have a limited role in decarbonising the transport sector, and that a range of alternative renewable fuels and a mix of targeted policy measures are needed to address the challenges of the transport sector in a 2030 perspective, but it did not propose new targets for the transport sector after 2020.
Any reform in the coming years in the European Union will have some impact on global biodiesel and ethanol markets. This Outlook assumes a continuation of actual mandates and tax reductions by EU countries. When accounting for the fact that each unit of second generation biofuel (including those produced from used cooking oil) consumed counts double for the purpose of the Directive, the Outlook assumes that the fulfilment percentage coming from biofuels expressed in energy share should reach 8.5% in 2020.
In Brazil, the blending requirement (in volume share) in petrol is 25%. Flex-fuel vehicles can either run on E25 gasohol or on E100 (hydrous ethanol).11 Box 3.2 describes the influence of petrol price controls on Brazilian hydrous ethanol prices. Contrary to what was done over the past few years to temper Brazilian price inflation, this Outlook assumes that Petrobras12 will seek convergence between the international and the domestic retail prices of petrol over the next decade.13
9 http://eur-lex.europa.eu/LexUriServ/LexUriServ.do?uri=OJ:L:2009:140:0016:0062:EN:PDF. 10 http://ec.europa.eu/energy/2030_en.htm 11. Hydrous ethanol - about 96% ethanol and 4% water - can be used as fuel for flex-fuel vehicles. 12 Petrobras is a semi-public Brazilian multinational energy corporation. It is the largest company in the
Southern Hemisphere (by market capitalisation) and the largest in Latin America (measured in 2011 revenues).
13 This is a key assumption of the strategic plan for Petrobras issued in February 2014: http://www.investidorpetrobras.com.br/en/business-management-plan/2030-strategic-plan-and-2014-2018-business-and-management-plan-presentation.htm.

TAD/CA/APM/WP(2014)5/FINAL
13
Box 3.2. The influence of petrol price controls on hydrous ethanol prices in Brazil
Sugarcane based ethanol has been a key component of Brazil’s energy policy for a long time. Just after the first oil crisis, the Brazilian government launched the PROALCOOL programme to improve the country’s energy self-sufficiency and also the market for sugar cane. Since April 2011, the blend rate for anhydrous ethanol and petrol has to range between 18% and 25%. At present, gasohol sold at the pump is required to be E25. The Brazilian fleet of flex-fuel vehicles that can run either on gasohol or hydrous ethanol (E100) is about 20 million, the biggest in the world. Flex-fuel vehicles represented 87% of cars sold in Brazil in 2012.
With the discovery and development of huge pre-salt petroleum deposits offshore Brazil, the priority the government has given to ethanol as a domestic energy source has slackened. Along with this downgrading in importance, and ensuing credit problems, the sugarcane industry has undergone a downturn and found itself in a period of stagnation and reduced greenfield investment.
In addition to the sector’s internal problems, the profitability of hydrous ethanol has also been negatively affected by:
• the relatively more attractive sugar prices in the international market
• price controls imposed on transport fuels sold by Petrobras.1
Since 2010, Brazil’s rate of inflation has operated persistently between the centre of the target (4.5% p.a.) and its upper bound (6.5% p.a.). To avoid a rise in interest rates, the government resorted to various indirect policies to attenuate price inflation. One of these has been to regulate the prices of some of Petrobras’ refined petroleum products. Those products that have a greater weight in the IPCA (Brazilian Consumer Price Index), such as diesel oil and especially petrol, have had their prices effectively controlled. Other products, such as naphtha and kerosene for aviation, which have a lower weight in the inflation index, have been subject to more frequent readjustments in prices.
The Petrobras decision to not readjust petrol prices with world parity levels has hampered the sugarcane industry. Hydrous ethanol is a substitute for E20-E25 gasohol and remains competitive on an energy equivalent basis at a price up to 70%, on average, of the gasohol price. Since the price of petrol has remained fixed below international levels, with rising production costs, hydrous ethanol has become less a competitive with gasohol, cutting into the profit margins of ethanol producers.
The two simulations presented below estimate the impact of the Petrobras price policy on hydrous ethanol prices. However, while hydrous ethanol remains less profitable as long as petrol prices remain fixed, other government regulations requiring the blending of between 18 to 25% of anhydrous ethanol with petrol as gasohol has increased the demand for this alternative ethanol fuel.
Simulation 1: At what gasohol price is the production of hydrous ethanol economically viable, considering its energy equivalence to be 70% of gasohol?
Production costs compiled by PECEGE (Programme of Continuing Education in Economics and Management) from ESALQ/USP (Luiz de Queiroz College of Agriculture of the University of São Paulo), enabled a simulation of the sales price for gasohol at a gas station pump that would make the price of hydrous ethanol economically viable. Based on data from the 2012/13 harvest, this analysis was carried out in traditional ethanol producing states (São Paulo and Paraná) as well as in regions where the expansion of sugarcane for ethanol is taking place (Minas Gerais, Goiás, Mato Grosso do Sul and Mato Grosso) (Table 3.1).

TAD/CA/APM/WP(2014)5/FINAL
14
Table 3.1. Simulation of gasohol and hydrous ethanol prices (BRL/litre) based on the harvest data for 2012/13
Region Operating Cost
Economic Cost*
Distribution Cost
Econ.Viable Hydrous Ethanol Price
Econ.Viable Gasohol
Price
Hydrous Ethanol Price in 12/13
Harvest**
Gasohol Price in 12/13
Harvest**
Traditional 1.10 1.30 0.67 1.97 2.81 1.83 2.67 Expansion 1.07 1.27 0.90 2.17 3.10 1.99 2.83
*Source: PECEGE
** Source: Brazilian National Agency of Petroleum, Natural Gas and Biofuels (ANP)
According to the simulation results, in order for it to be economically feasible to market hydrous ethanol, on average, a litre of gasohol would have to be sold for BRL 2.81 in São Paulo and in Paraná, and at BRL 3.10 in the other states. These values suggest that the price of hydrous ethanol was off by BRL 0.14 and by BRL 0.18 per litre in each region respectively.
Simulation 2: What would be the price of hydrous ethanol if the price of petrol followed the price variation for crude oil in the international market and if Petrobras was not used to fight inflation?
Supposing Petrobras maintained since 2006 a direct relationship between (i) the price of petrol in the domestic market and (ii) variations of oil quotations in the international market, controlled by variations in the exchange rate, then on average a litre of gasohol would be sold in the Traditional Region at BRL 4.21 and in the Expansion Region at BRL 4.44.Error! Reference source not found. Assuming that the ratio of 0.7 between hydrous ethanol and gasohol prices operates in these markets, a litre of hydrous ethanol would be sold, on average, at BRL 2.95 and BRL 3.11 in each region, respectively that is, at 61% and 56% higher than occurred (Table 3.2). These results clearly suggest, on the one hand, that the price controls on petrol have contributed to containing inflation but that on the other hand, they have severely reduced the profitability of the sugarcane industry. However, it is difficult to judge whether a total liberalisation of petrol prices in Brazil would result in a much greater use of hydrous ethanol because the supply of the latter is also a function of volatile sugar prices.
Table 3.2. Price simulation presupposing that petrol had fully accompanied oil price variations and the Table 3.2. Price simulation presupposing that petrol had fully accompanied oil price variations and the Brazilian exchange rate (BRL/litre)
Period
Traditional Area Expansion Area Gasohol Hydrous Ethanol Gasohol Hydrous Ethanol
Observed Price
Simulated Price
Observed Price
Simulated Price
Observed Price
Simulated Price
Observed Price
Simulated Price
Sep-06 2.44 2.26 1.32 1.58 2.58 2.38 1.71 1.67 Sep-07 2.40 2.44 1.11 1.71 2.45 2.57 1.41 1.80 Sep-08 2.41 2.65 1.29 1.86 2.51 2.79 1.59 1.95 Sep-09 2.39 2.22 1.32 1.55 2.47 2.34 1.53 1.64 Sep-10 2.46 2.22 1.44 1.56 2.53 2.34 1.62 1.64 Sep-11 2.67 3.23 1.89 2.26 2.84 3.40 2.00 2.38 Sep-12 2.63 3.82 1.77 2.68 2.80 4.03 1.93 2.82 Sep-13 2.72 4.21 1.75 2.95 2.89 4.44 1.95 3.11
Sources: Brazilian National Agency of Petroleum, Natural Gas and Biofuels (ANP), Central Bank and International Monetary Fund. 1 Petrobras is a semi-public Brazilian multinational energy corporation. It is the largest company in the Southern Hemisphere (by market capitalisation) and the largest in Latin America (measured in 2011 revenues). 2 Obviously there are other factors influencing petrol prices in Brazil such as a transformation margin or taxes.
This box has been prepared by Antonio Carlos Kfouri Aidar, Director of Control, and Felipe Serigati, Project Coordinator at FGV Projetos. It is a summary of an article published in the Agroanalysis magazine entitled “The profitability of the sugar and ethanol sector depends on Petrobras”.
In response to anti-dumping duties on its biodiesel shipments, Argentina increased domestic biodiesel blending requirements to 10% in February 2014. A gradual increase to the 10% blending requirement is taken into account in this Outlook.

TAD/CA/APM/WP(2014)5/FINAL
15
In developing countries, except for Brazil, the Outlook assumes that only 40% of biofuel targets can be reached. This assumption reduces the pressure on world biodiesel prices where developing countries account for a larger share of world trade compared to ethanol. In Indonesia, where a 25% biodiesel blending requirement is targeted for 2025, the Outlook assumes that only 20% of this target can be reached by 2023. A simulation, which assumed that Indonesia is going to reach its biodiesel target, revealed strong impacts and is described in Box 5.1 in the oilseeds chapter.
Prices
World ethanol prices are projected to increase by 9% in real terms over the projection period. Two elements are expected to strongly influence the level of ethanol prices. First, the Outlook expects an increase in market-driven demand of hydrous ethanol by owners of flex-fuel cars in Brazil, given the assumptions of strong crude oil prices and of Petrobas not freezing the retail price of petrol anymore. Second, policies in place such as the 25% blending requirement in Brazil and the level of the advanced gap in the United States should also reinforce ethanol prices. The domestic US corn-based ethanol price should not increase as much as the Brazilian world ethanol price, and the United States are expected to be exporting 8% of its domestic production by 2023.
In line with world vegetable oil prices, world biodiesel prices expressed in real terms are expected to decrease by 6% over the outlook period. They are not expected to be strongly influenced by the increasing crude oil prices as demand of biodiesel is mostly driven by policies in place and not by market forces. In the early years of the projections, increasing policy-dictated domestic demand in two key exporting countries, Argentina and Indonesia as well as anti-dumping measures in place in the European Union are expected to raise biodiesel prices above their medium term trend.
Production and use of ethanol
After a significant decline in 2012, global ethanol production increased in 2013, surpassing the levels of 2011 due to lower prices for coarse grains and sugar. This increasing trend is assumed to prevail during the outlook period: world ethanol supply should reach some 158 Bln L by 2023 (Figure 3.3). The three major ethanol producers are expected to remain the United States, Brazil and the European Union (Figure 3.4).
Figure 3.3. Development of the world ethanol market
Source: OECD and FAO Secretariats.
0
20
40
60
80
100
120
140
160
180
200
2007 2008 2009 2010 2011 2012 2013 2014 2015 2016 2017 2018 2019 2020 2021 2022 2023
bln L
World ethanol production World ethanol trade
TAD/CA/APM/WP(2014)5/FINAL
16
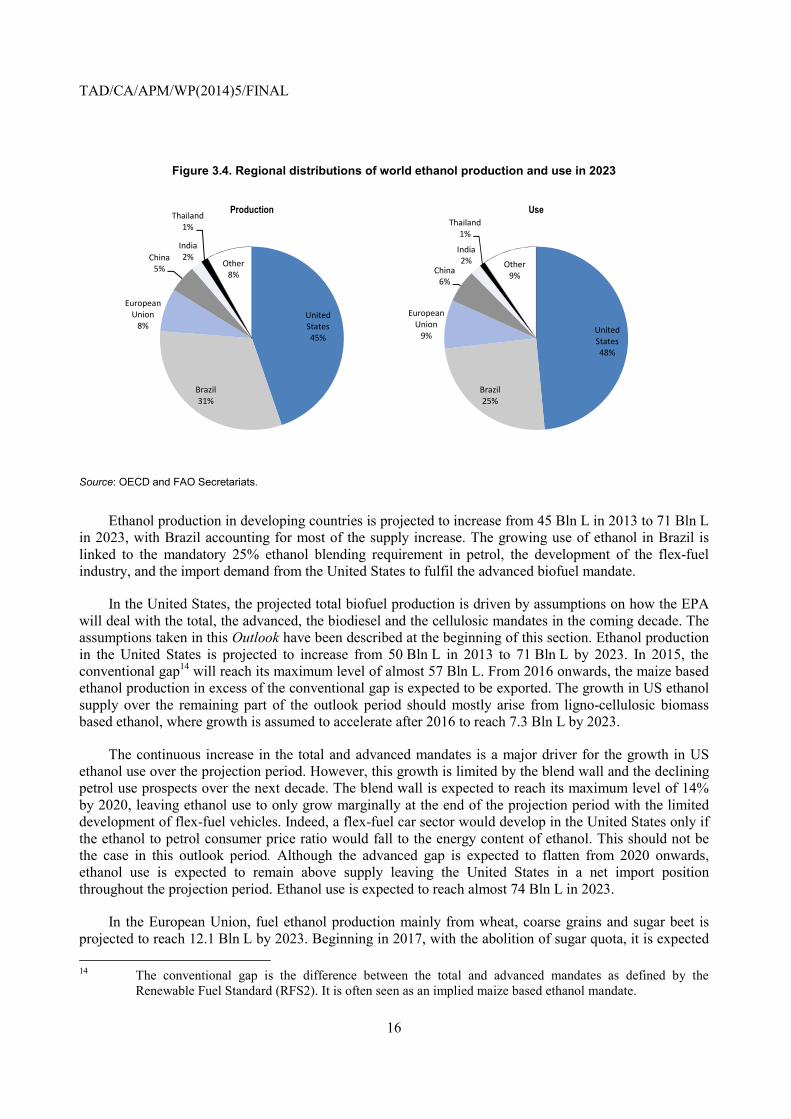
Figure 3.4. Regional distributions of world ethanol production and use in 2023
Source: OECD and FAO Secretariats.
Ethanol production in developing countries is projected to increase from 45 Bln L in 2013 to 71 Bln L in 2023, with Brazil accounting for most of the supply increase. The growing use of ethanol in Brazil is linked to the mandatory 25% ethanol blending requirement in petrol, the development of the flex-fuel industry, and the import demand from the United States to fulfil the advanced biofuel mandate.
In the United States, the projected total biofuel production is driven by assumptions on how the EPA will deal with the total, the advanced, the biodiesel and the cellulosic mandates in the coming decade. The assumptions taken in this Outlook have been described at the beginning of this section. Ethanol production in the United States is projected to increase from 50 Bln L in 2013 to 71 Bln L by 2023. In 2015, the conventional gap14 will reach its maximum level of almost 57 Bln L. From 2016 onwards, the maize based ethanol production in excess of the conventional gap is expected to be exported. The growth in US ethanol supply over the remaining part of the outlook period should mostly arise from ligno-cellulosic biomass based ethanol, where growth is assumed to accelerate after 2016 to reach 7.3 Bln L by 2023.
The continuous increase in the total and advanced mandates is a major driver for the growth in US ethanol use over the projection period. However, this growth is limited by the blend wall and the declining petrol use prospects over the next decade. The blend wall is expected to reach its maximum level of 14% by 2020, leaving ethanol use to only grow marginally at the end of the projection period with the limited development of flex-fuel vehicles. Indeed, a flex-fuel car sector would develop in the United States only if the ethanol to petrol consumer price ratio would fall to the energy content of ethanol. This should not be the case in this outlook period. Although the advanced gap is expected to flatten from 2020 onwards, ethanol use is expected to remain above supply leaving the United States in a net import position throughout the projection period. Ethanol use is expected to reach almost 74 Bln L in 2023.
In the European Union, fuel ethanol production mainly from wheat, coarse grains and sugar beet is projected to reach 12.1 Bln L by 2023. Beginning in 2017, with the abolition of sugar quota, it is expected 14 The conventional gap is the difference between the total and advanced mandates as defined by the
Renewable Fuel Standard (RFS2). It is often seen as an implied maize based ethanol mandate.
United States45%
Brazil31%
European Union
8%
China5%
India2%
Thailand1%
Other8%
Production
United States48%
Brazil25%
European Union
9%
China6%
India2%
Thailand1%
Other9%
Use
TAD/CA/APM/WP(2014)5/FINAL
17
that the production of ethanol from sugar beets will be less profitable than the production of sugar for human consumption. Ethanol production based on sugar beets is thus projected to drop to 1.3 Bln L. Ligno-cellulosic biomass based ethanol should grow towards the end of the projection period but should remain marginal. Ethanol fuel use is expected to amount to an average energy share of 6.6% in petrol types for transport fuels by 2023.
Ethanol markets in Brazil are driven by increasing domestic demand for hydrous and anhydrous ethanol due to the 25% blending requirement, and by the development of demand for hydrous ethanol by the flex-fuel vehicles fleet in the context of increasing crude oil prices as well as by import demand from the United States to fulfil the advanced mandate. Brazilian ethanol production is projected to almost double from 25 Bln L in 2013 to 50 Bln L in 2023, while net exports and use are expected to rise, respectively, from 2 to 11 Bln L and 22.4 to 39 Bln L.
Production and use of biodiesel
Global biodiesel production stagnated in 2013. In the major producing region, the European Union, biodiesel supply did not increase given the continuing debate on a possible reduction in support for first generation biodiesel linked to the sustainability criteria. Argentinean biodiesel production declined as the European Union introduced anti-dumping duties against their importation.
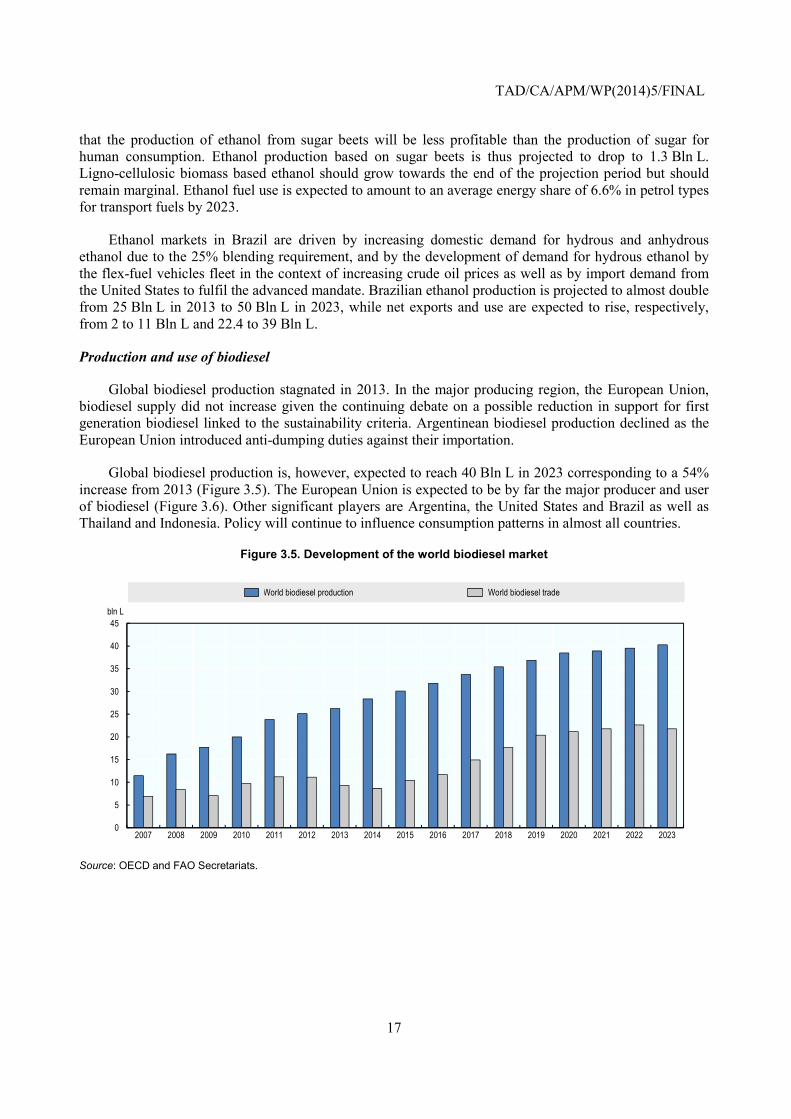
Global biodiesel production is, however, expected to reach 40 Bln L in 2023 corresponding to a 54% increase from 2013 (Figure 3.5). The European Union is expected to be by far the major producer and user of biodiesel (Figure 3.6). Other significant players are Argentina, the United States and Brazil as well as Thailand and Indonesia. Policy will continue to influence consumption patterns in almost all countries.
Figure 3.5. Development of the world biodiesel market
Source: OECD and FAO Secretariats.
0
5
10
15
20
25
30
35
40
45
2007 2008 2009 2010 2011 2012 2013 2014 2015 2016 2017 2018 2019 2020 2021 2022 2023
bln L
World biodiesel production World biodiesel trade

TAD/CA/APM/WP(2014)5/FINAL
18
Figure 3.6. Regional distributions of world biodiesel production and use in 2023
Source: OECD and FAO Secretariats.
In 2013, biodiesel production increased in Brazil, Indonesia, Thailand and Malaysia, offsetting the supply reduction in Argentina. Total biodiesel production in developing countries is projected to increase to 16 Bln L in 2023. One factor limiting any increase in biodiesel production in developing countries is the availability of alternative feedstocks, such as jatropha, which are not yet suitable for biofuels production on a larger scale.
After a relatively strong decline in the European Union in 2013 (12 Bln L versus 13.4 Bln L in 2012), biodiesel use is projected to reach a plateau of 19 Bln L from 2020 onwards given mandates and tax reductions by European member states. This should represent an average energy share of biodiesel in diesel type fuels of 7.4%. Domestic biodiesel production in the European Union is assumed to increase until 2020 to keep pace with demand. Second generation biodiesel production is not assumed to take off during the outlook period. About 3.2 Bln L biodiesel imports will be necessary to satisfy the RED target.
In the United States, the mandate for biodiesel is assumed to stay constant over the projection period at 4.8 Bln L. Given a decreasing biodiesel to diesel consumer price ratio, US biodiesel consumption is projected to increase and to be above the mandate in every year during the next decade. Biodiesel should therefore capture a share of the other advanced gap, lowering the need for imports of sugarcane based ethanol.
Due to the ethanol blend wall, biodiesel use should increase more strongly in the last years of the projection period to reach 6.5 Bln L by 2023, helping the fulfilment of the advanced and total mandates.15 If the EPA chooses lower total, advanced and cellulosic mandates than those that have been assumed in this Outlook, it is likely that biodiesel consumption would return very close to the mandate level. In a context of declining diesel consumption, biodiesel blending in diesel type fuels is expected to increase from 1.4% in 2013 to 2.7% in 2023. Biodiesel from tallow or other animal fat is expected to represent about 37% of total US production.
15 Biodiesel like sugarcane based ethanol qualifies for the advanced mandate. It is important to note that a
unit of biodiesel counts for 1.5 units of advanced mandate.
United States16%
Brazil10%
European Union39%
Indonesia8%
Argentina9%
Thailand3%
Other15%
Production
United States16%
Brazil10%
European Union47%
Indonesia5%
Argentina4%
Thailand3%
Other15%
Use

TAD/CA/APM/WP(2014)5/FINAL
19
The Outlook assumes increasing biodiesel production in developing countries, mainly driven by the developments in Argentina and Indonesia. Argentinean biodiesel production is expected to be affected in 2014, as it was in 2013, by anti-dumping duties imposed by the European Union. It should reach 3.6 Bln L by 2023 to satisfy both export and domestic demand. The Outlook assumes biodiesel use to rise in Argentina up to 1.7 Bln L in 2023, given a stronger domestic biodiesel blending requirement at 10% and sustained demand for diesel. Competition between export and domestic demand is also expected to increase in Indonesia. Although the blending requirements will increase in the coming years, it is expected that Indonesia will satisfy both markets. Assuming that Indonesia can reach only 20% of their biodiesel targets, production increases from 1.8 Bln L in 2013 to 3.3 Bln L by 2023.
Trade in ethanol and biodiesel
Global ethanol trade is set to increase strongly. Most of this increase is due to the ethanol trade between Brazil and the United States. This trade16 is expected to grow until 2020 when the ethanol blend wall should be reached, limiting additional ethanol use in the United States. The United States is expected to import about 10 Bln L of sugarcane based ethanol from Brazil by 2023. At the same time, given strong world ethanol prices and relatively lower domestic corn based ethanol prices, the United States is expected to export 5 Bln L of maize based ethanol by 2023. A large share of these exports will be destined to the Brazilian market to satisfy ethanol demand.
Canada and the European Union should also import US ethanol. The level of European imports would be strongly influenced by the conclusion of the actual trade dispute17 between the United States and the European Union. Imports of ethanol into the European Union should be of about 1.6 Bln L on average over the projection period, as domestic production is expected to grow at the same rate as demand. Developing countries are net exporters of ethanol. Brazil (11 Bln L), India, Pakistan, South Africa and Thailand (1.2 Bln L combined) are expected to dominate ethanol exports among developing countries.
Biodiesel trade is projected to increase only slightly over the next ten years, with Argentina remaining the major exporter followed by Indonesia. The export growth potential of both countries is expected to be limited due to domestic biodiesel targets and strong import restrictions in the European Union in 2014 and 2015. Net import demand in the European Union should stay at a plateau of 3.2 Bln L during the last years of the projection period as the RED target is defined for 2020, and diesel use is expected to decrease slightly afterwards. The United States is expected to export a small surplus of biodiesel over the projection period. US exports are expected to decline in the last years of the projection period, when biodiesel use increases strongly to meet the total and advanced mandates.
Feedstocks used to produce biofuels
Coarse grains and sugarcane will remain the dominant ethanol feedstock (Figure 3.7), while vegetable oil continues to dominate biodiesel production (Figure 3.8). The share of coarse grain based ethanol production in global ethanol production is reduced by about 13% over the outlook period to 45% in 2023, which corresponds to 12% of global coarse grain production. The share of sugar crops share of world ethanol production increases from 25% in 2013 to 31% in 2023. 28% of global sugar cane production is expected to be used for ethanol production in 2023. Ligno-cellulosic biomass based ethanol is projected to
16 According to the RFS2, sugarcane based ethanol is classified to be an advanced biofuel, while maize based
ethanol is not. 17 The European Union has launched an anti-dumping and anti-subsidy action against exports of American
ethanol. A key element of the case is the credit from the US federal excise tax on petrol. That credit has not been renewed in 2012 and in 2013 and the same is assumed in all the years of the Outlook.

TAD/CA/APM/WP(2014)5/FINAL
20
account for 5% of world ethanol production by 2023. Cellulosic ethanol is expected to be mostly produced in the United States on the assumption that the cellulosic mandate would be filled at 12% in 2023.
Figure 3.7. Share of feedstocks used for ethanol production1
1. Sugar crop includes ethanol produced from sugar beets in the European Union.
Source: OECD and FAO Secretariats.
Figure 3.8. Share of feedstocks used for biodiesel production
Source: OECD and FAO Secretariats.
The share of biodiesel produced from vegetable oil in global biodiesel production decreases from 80% in 2013 to 76% in 2023, which corresponds to 14% of global vegetable oil production in 2023. The share of biodiesel produced from other sources, mostly used cooking oil and animal tallow, is expected to
0 10 20 30 40 50 60
Coarse grains
Sugar crops
Wheat
Molasses
Ligno-cellulosic biomass
Other
%
2023 2011-13
0 10 20 30 40 50 60 70 80 90
Vegetable oils
Jatropha
Biomass
Other
%
2023 2011-13

TAD/CA/APM/WP(2014)5/FINAL
21
expand from 18% in 2013 to 21% in 2023 given the fact that each consumed unit of biodiesel produced from cooking oil in the European Union counts double for the RED targets.
Main issues and uncertainties
The outlook for biofuel markets is strongly influenced by policies in place. It is likely that the policy assumptions made in this Outlook are not going to reflect the reality of the coming decade. In the course of 2013, for the first time since the beginning of the biofuel era, it became clear that biofuel policies and implied targets or mandates may face explicit downward revisions in the future.
In November 2013, the EPA proposed to lower the total, the advanced, and the cellulosic mandates because of the blend wall issue and the limitations in large scale production of advanced biofuels such as second generation ones (Box 3.1). In December 2013, European ministers could not reach an agreement on the revision of the RED that was proposed by the European Parliament. This revision was seeking to limit at 6% the extent to which food-derived fuels can contribute to the 10% targets, and also to take indirect land use changes into account.
The question of energy security in a context of high crude oil prices was prioritised in the initial development of the biofuel sector. If major biofuel producing countries were to become less dependent on imported fossil fuels (like Brazil or the United States, for example), it is likely that the policy environment around biofuel production might become less favourable.
Box 3.3 describes sub-national policies supporting biofuels as these may play a bigger role in the coming years where national policies begin to be phased down. It is interesting to note that in the United States, even if mandates were to be reduced according to the EPA proposal of November 2013 and hence the policy driven two-way trade between the United States and Brazil was to almost disappear, the Low Carbon Fuel Standard of the State of California would require some imports of sugarcane based ethanol.
Box 3.3. Sub-national policies supporting biofuels
Over the last decade, most OECD countries have adopted policies to support the production or use, or both, of liquid biofuels - mainly ethanol as a substitute for petrol and biodiesel and renewable diesel fuels as substitutes for petroleum diesel. National governments have traditionally played the most important supporting role, through providing capital grants for biofuel factories, bounties or tax benefits proportional to the volume produced or blended and exemptions from excise taxes on marketed biofuels.
In recent years, however, national support policies for first-generation biofuels - i.e. ethanol made from starch or sugar and renewable substitutes for diesel that are made from vegetable oils, tallow or used cooking oil - have been phased down, leaving mainly mandatory blending ratios or volumetric biofuel targets (“biofuel mandates”, for short) as the main support mechanisms.
At the sub-national level, however, many other incentives remain in place. When assessing the effects of public policies on the supply and demand of biofuels, and of the feedstock agricultural commodities used for biofuels, it is important to take these additional policies into account. For example, in November 2013 the US Environmental Protection Agency (EPA) proposed to reduce the total annual quota for “advanced biofuels,” which heretofore has been met mainly with biodiesel and imported sugarcane based ethanol. If this reduction is confirmed, then imports of ethanol from Brazil are likely to be affected. However, because the US State of California has a Low Carbon Fuel Standard that assigns a lower greenhouse gas value to cane ethanol, it is expected that some of that reduction would be offset by higher imports into California.
In countries with strong federal systems, such as Australia, Canada, Mexico and the United States, some states and provinces have instituted biofuel mandates that exceed those of their federal governments. The Provinces of Saskatchewan and Manitoba require, respectively, 7.5% and 8.5% ethanol in their gasoline, in contrast with the federal Canadian requirement of 5%. Similarly, the Province of British Columbia specifies a minimum of 4% biodiesel in its

TAD/CA/APM/WP(2014)5/FINAL
22
diesel fuel, whereas the federal requirement is just 2%. In the United States, the effect of the Federal Renewable Fuel Standard has been to raise the average ethanol content of blended petrol fuel to almost 10%, which is currently the maximum allowed for most vehicles manufactured before 2001. Nonetheless, a law passed by the State of Minnesota calls for all gasoline blends sold in the state after 20 August 2015 to contain at least 20% ethanol by volume, or the maximum percent of ethanol by volume allowed by the EPA if that percentage is lower. A few US states have also set minimum blending shares for biodiesel.
In Australia, which has no national biofuel mandate, its most populous state, New South Wales, requires a 4% blend of ethanol in its petrol, and 2% biodiesel in its diesel fuel. Mexico likewise has no national mandate, but a 2% biodiesel mandate applies in the municipality of Guadalajara, and there are plans to expand the mandate to Mexico City and Monterrey.
Outside the OECD region, biofuel mandates have often first been introduced at the subnational level. China’s current blending of 10% ethanol with petrol is applied only in nine provinces. Ethiopia has an ethanol mandate only for Addis Ababa, and Kenya only in the province of Kisumu. In India, the state government of Maharashtra has recently upped the blending percentage of ethanol with gasoline to 10%, which is twice the national mandate.
Several Canadian provinces (British Columbia, Saskatchewan, Manitoba and Quebec) and US states (Louisiana, Montana, Oregon and Washington) have linked implementation of their biofuel-content mandates with the development of in-state or in-province manufacturing capacity for the mandated fuel. For example, Washington State stipulated that, before for its mandate went into effect, a positive determination would have to be made by the State Department of Ecology that feedstock grown in Washington State could satisfy a 2% biodiesel blending requirement. The biodiesel requirement was increased to 5% once in-state feedstocks and oil-seed crushing capacity were determined to be able to meet the needs of a 3% average blend.
Whereas the federal governments of Canada and the United States formerly granted excise-tax reductions for biofuels, the United States no longer does, and Canada created a new system based on production-linked payments. Nonetheless, three Canadian provinces and thirteen US states offer some reductions in excise taxes or sales taxes for ethanol or biodiesel - sometimes on pure biofuels but in many cases for specific blends, such as E85. In addition, five Canadian provinces and 12 US states provide their own volumetric incentives to support in-state production of ethanol or biodiesel, many at rates equivalent to at least USD 0.05 per litre of pure biofuel.
Although the Member States of the European Union are not “sub-national units” in the same sense as those outside the European Union, they are nonetheless subject to the EU-wide policy on biofuels. Seven of the EU’s Member States still offer exemptions or reductions on the excise tax normally applied to petrol or diesel transport fuels, in many cases only when the biofuel is used in a high-biofuel blend, such as E85.
Sometimes sub-national support policies require the use of locally harvested crops or locally produced biofuel. Ethanol-production plants operating in the US state of Louisiana and deriving their fuel from the distillation of maize must use maize harvested in Louisiana to meet at least 20% of the facility‘s total feedstock requirement. The US state of Montana’s production tax incentive of USD 0.20 per gallon (USD 0.053 per litre) is available only for ethanol produced solely from agricultural products produced in Montana, unless Montana products are unavailable. Missouri’s production incentive for ethanol, which pays up to USD 7.5 million cumulative per producer, is contingent on the use of Missouri agricultural products or qualified biomass. In the Canadian province of Nova Scotia, only biodiesel produced within the province is eligible for a CAD 0.154 fuel-tax exemption.
The effects of these various sub-national measures on the markets for biofuels and their feedstocks depend on the situation in each country. Where a national biofuels mandate allows obligated parties to trade in biofuel credits, higher blending mandates in particular sub-national jurisdictions may only alter the internal pattern of production and consumption. Production or consumption incentives provided by sub-national governments may, however, increase overall domestic production or consumption if the blend limit for ethanol or biodiesel has not already been attained. If a production incentive is tied to the use of locally grown feedstock, the net effect of the policy will depend on the generosity of the incentive relative to the extra cost incurred by having to meet the local-content requirement.
In countries with no national biofuels mandate, the effect of one or more sub-national jurisdiction applying a mandate or offering a financial incentive (as long as it is not contingent on the use of locally produced feedstock) will be to increase national consumption above what it would likely be in the absence of the sub-national measure.
Sources : Bahar, H., J. Egeland and R. Steenblik (2013), “Domestic incentive measures for renewable energy with possible trade implications”, OECD Trade and Environment Working Papers, 2013/01, OECD Publishing. http://dx.doi.org/10.1787/5k44srlksr6f-en
Lane, J. (2013), “Biofuels mandates around the world: 2014”, Biofuels Digest, 31 December 2013.

TAD/CA/APM/WP(2014)5/FINAL
23
http://www.biofuelsdigest.com/bdigest/2013/12/31/biofuels-mandates-around-the-world-2014/
This Outlook assumes that most of the biofuels to be produced in the next decade will be based on agricultural feedstocks. Biofuel production is thus likely to have direct and indirect effects on the environment and on land use in the medium term. Any disturbance to agricultural production caused by climatic events, or in fossil fuel markets may have an impact on the availability of those biofuels.
A major uncertainty for biofuel markets is related to the availability of advanced biofuels produced from ligno-cellulosic biomass, waste or non-food feedstock. Their development depends strongly on current research and development spending to explore new technologies. The uncertainties regarding the future of biofuel policies in key countries might act as an impediment to new investment decisions.

TAD/CA/APM/WP(2014)5/FINAL
24
Chapter 4. Cereals
Abstract
This chapter describes the market situation and the latest set of quantitative medium-term projections for world and national cereal markets for the ten-year period, 2014-2023. It covers the developments expected in national and global wheat, coarse grains and rice prices, production, use (human consumption, industrial and feed use), trade (imports and exports) and stocks in the medium-term. The quantitative projections are developed with the aid of the partial equilibrium Aglink-Cosimo model of world agriculture. The chapter also includes four boxes that explain the importance of public stockholding for food security, the structural changes in world feed markets, the campaign to prevent bread waste in Turkey, and the contribution of agricultural investments to stabilising international rice price volatility under climate change. The chapter concludes with a discussion of some main issues and uncertainties that may have an impact on the medium-term outlook for cereals. These include weather events, policies, and specific market events influencing cereal production, consumption and trade.
Market situation
While world cereal production in 2014 may not exceed its 2013 record18, large carryover stocks are expected to keep global supplies in the 2014 marketing year adequate relative to expected world demand. In Canada, reduced wheat plantings could result in a significant drop in production this year. By contrast, wheat production is anticipated to rise in 2014 in the United States and European Union, assuming good results from spring plantings. In Australia, wheat production could decline from last year’s above average level, mostly on expected drier conditions. In the major producing states of the Commonwealth of Independent States (CIS), wheat yields are expected to fall from the relatively high levels in 2013, which may result in lower production in Kazakhstan, the Russian Federation and Ukraine. Regarding coarse grains, production prospects are mixed in the Southern hemisphere. The outlook is generally favourable in South Africa and Argentina. However, the first maize crop in Brazil could be adversely affected by unfavourable weather conditions. World rice production in 2014 could modestly rise, as growth is likely to be dampened by falling world prices and fears of a recurring El Niño event. Production is seen rising in Brazil, Indonesia and Madagascar, while drought problems are anticipated to depress output in Australia, Peru, Sri Lanka and Tanzania.
In 2014, food consumption of cereals is forecast to keep up with the rise in world population, resulting in a stable per capita consumption level at the global level. The strongest growth in food consumption is expected in Asia, where wheat and rice are the main staples. Feed utilisation of cereals may decrease marginally in 2014, after a firm growth in 2013. In particular, feed use of wheat is likely to stagnate, and rice continues to be consumed primarily as food. Industrial use of coarse grains is projected to increase, but most of the rise is likely to reflect the continuing growth in the demand for other industrial uses, especially starch and starch derivatives in China, rather than any significant rise in biofuel use.
18 See the glossary for the definition of crop marketing years for wheat, coarse grains and rice in various
countries.
TAD/CA/APM/WP(2014)5/FINAL
25
World cereal stocks in 2013 increased by 15%. As a result, the global cereal stocks-to-use ratio is expected to increase by 3 percentage points to almost 25% in 2014, its highest value since 2005. World cereal trade is also expected to increase in 2014, hitting a new record high for the second year in a row.
International prices of major cereals, namely wheat, rice and maize, are likely to remain mostly under downward pressure, resulting in average cereal prices falling slightly below their 2013 level in 2014.
Projection highlights
• After a good harvest in 2013, favourable supply prospects in 2014 are projected to keep downward pressure on prices. Grains prices will ease both in nominal and real terms over the outlook period.
• Ample world rice supplies are expected with developing countries accounting for most of the increase. The slowdown of rice production and consumption growth contrasts with a rapid expansion of trade.
• World cereal utilisation will increase, driven by larger non-food use in developed and emerging economies and food in least developed countries.
• A considerable rebuilding of grains stocks and increase of global trade are expected, with record carryover rice stocks in Asian countries.
Market trends and prospects
Prices
Cereal prices are projected to decrease compared to previous Outlook editions, mainly influenced by a slower economic growth and strong recovery of world grain supply after the 2012 droughts in the United States and CIS countries. Wheat prices are projected to approach USD 270/t in nominal terms by 2023, starting at USD 284/t in 2014, the lowest levels since 2010. In the first three years of the outlook period, wheat prices will further decrease due to ample production prospects in the United States, Canada and Brazil, reaching USD 267/t in 2016 (Figure 4.1).

TAD/CA/APM/WP(2014)5/FINAL
26
Figure 4.1. Cereal prices fall over the medium term
Evolution of prices expressed in nominal (left) and real terms (right)
Source: OECD and FAO Secretariats.
Coarse grain prices are also expected to considerably decrease in the first two years of the outlook period as a response to the ample production prospects in the United States, the Russian Federation and Argentina. Subject to average weather conditions, the representative maize Gulf price is projected to reach USD 195/t in 2014, 32% lower than the 2010-2012 period of high prices and more in line with historical trends, and then to recover and stabilize over the second half of the projection period. At the end of the projection period, coarse grain prices are expected to be around USD 225/t in nominal terms (USD 160/t in real terms), significantly lower than in previous Outlook editions.
Rice prices over the projected period are anticipated follow the recent trend since 2011 and slide further down until reaching USD 391/t in 2023. This reflects the large supplies accumulated earlier in this decade. In particular exporting countries in Asia amassed large inventories, which will take long to offload on the market and will weigh on international prices at least until 2015. After this drop the nominal world rice price is projected to recover but to continue to fall in real terms.
Production
The potential for area expansion in the next decade is weak for cereals, and production growth will mostly be driven by yield increases. While the accumulated yield growth over the outlook versus the base period is projected at 10%, the increase in crop land devoted to wheat is less than 3% (Figure 4.2). World wheat production is expected to reach 778 Mt by 2023, about 12% higher than in the base period.19 This represents an annual growth rate of around 1%, compared to 1.5% in the previous decade (Figure 4.3). The underlying factor for this sharp deceleration is the stabilisation of land use for wheat production over the outlook period.
19 The three-year average 2011, 2012 and 2013 has been considered as the “base period.”
0
100
200
300
400
500
600
700
1993 1998 2003 2008 2013 2018 2023
USD/t
Coarse grains Wheat Rice
0
100
200
300
400
500
600
1993 1998 2003 2008 2013 2018 2023
USD/t
Coarse grains Wheat Rice

TAD/CA/APM/WP(2014)5/FINAL
27
Figure 4.2. Limited potential to increase cereal production due to weak area expansion and moderate yield growth over the medium term
Evolution of global cereal harvested area and yields over the projection period
Note: The size of the bubbles indicates the proportion of harvested area of one crop relative to all crops.
Source: OECD and FAO Secretariats.
Figure 4.3. Recovery of wheat stocks led by production increases in the Russian Federation
Evolution of supply, demand and stocks; World (left) and Russian Federation (right)
Source: OECD and FAO Secretariats.
Despite an unstable production trend, the Russian Federation is expected to further increase wheat production after last year’s recovery from the severe drought in 2012. Production will outpace utilisation, contributing to a gradual rebuilding of stocks. Ukraine is projected to lead the developing world in both wheat and coarse grain production and net exports. Exports from Ukraine should be sustained by growing demand from East Asian countries, and China in particular.
0
2
4
6
8
10
12
14
16
-4 -2 0 2 4 6 8 10 12 14
Chan
ges
in yie
ld (%
, 202
3 vs
.2011
-13)
Changes in harvested area (%, 2023 vs.2011-13)
Wheat Coarse grains Rice Oilseeds Sugarbeet Sugarcane Cotton
0
50
100
150
200
250
300
350
400
500
550
600
650
700
750
800MtMt
Stocks (right axis) Consumption
Production
0
2
4
6
8
10
12
14
16
18
0
10
20
30
40
50
60
70
80MtMt
Stocks (right axis) ConsumptionProduction

TAD/CA/APM/WP(2014)5/FINAL
28
World production of coarse grains is projected to reach 1 417 Mt by 2023, up 17% from the base period (Figure 4.4). As in the case of wheat, yields are projected to increase at a slower rate than in the past (0.8% p.a.), and crop land is only expected to moderately expand, therefore, limiting the scope for a faster increase in production (Figure 4.2). Rebuilding of stocks in the United States is particularly strong in 2013 and 2014, while in 2015 and 2016 the country is expected to face a rebounding effect on production and stock, also driven by large export volumes.
Figure 4.4. A rapid recovery of coarse grains stocks is led by higher production of US corn
Evolution of coarse grains supply, demand and stocks; World (left) and United States (right)
Source: OECD and FAO Secretariats.
The additional demand for biofuel production is behind the area expansion of coarse grains and oilseeds in developed countries. In developing countries the main driver is the feed demand for livestock production. Globally, coarse grains represent the largest share of the total harvested area (34%), followed by wheat (22%) and oilseeds (21%).
World rice production is also projected to expand, but the projected 1.2% p.a. growth rate is about half of the 2.2% recorded in the previous ten years, implying a substantial slowdown (Figure 4.5). Virtually all of the expected increase in production stems from productivity gains rather than area expansion, which is, in fact, almost stagnating. Much of the area expansion is in Africa and some Asian countries, such as Cambodia and Myanmar, which still hold large tracts of uncultivated land and abundant water.
0
50
100
150
200
250
300
350
400
200
400
600
800
1 000
1 200
1 400
1 600MtMt
Stocks (right axis) ConsumptionProduction
0
10
20
30
40
50
60
70
0
50
100
150
200
250
300
350
400
450MtMt
Stocks (right axis) ConsumptionProduction

TAD/CA/APM/WP(2014)5/FINAL
29
Figure 4.5. Stabilisation of world rice stocks and progressive reduction in Thailand
Evolution of rice supply, demand and stocks; World (left) and Thailand (right)
Source: OECD and FAO Secretariats.
Developing countries, which produce about 96% of world’s rice crop, are foreseen to account for the bulk of the projected 67 Mt increase in output. Significant contributions are made by India, Cambodia, Myanmar and other Asian least developed countries, while more sluggish price projections result in a lower expansion of output in Africa than projected in the 2013 Outlook. Reversing earlier expectations and consistent with the policy line endorsed by the Chinese government early in 2014 to achieve self-sufficiency. China, the largest world rice producer, is expected to keep output rising, albeit modestly.
Thailand’s government announced that official paddy procurements from farmers would be suspended, until further notice, by the end-February 2014, when the 2013 main crop buying scheme would be complete.20 Such move could weigh on farmers’ planting decisions and negatively affect production in the short run. In the medium term, however, yields in Thailand have still much room for improvement, and productivity gains will contribute to a steady production growth.
The favourable outlook on supply allows for the rebuilding of world grain stocks, especially for coarse grains in the major exporting regions (i.e. Argentina, Australia, Canada, European Union, United States, Russian Federation, Ukraine and Kazakhstan). It is also important to recognise the importance of stockholding policies in some developing countries and the potential impacts on world markets, an issue largely debated at the 9th World Trade Organization Ministerial Conference in Bali (Box 4.1). For instance, China is projected to hold about 60%, 26%, 19% of world total stock of rice, coarse grains and wheat, respectively, in 2023. India is also expected to considerably increase grain stocks, especially in rice and wheat.
Use of cereals
Total wheat utilisation is projected to reach nearly 774 Mt by 2023, 295 Mt in developed countries and 479 Mt in developing countries (Figure 4.6). Wheat is expected to remain a commodity predominantly consumed for food, with direct human consumption reaching a stable 68% of its total use over the outlook 20 IGC, (2013), Grain Market Report, 28 February.
0
50
100
150
200
250
300
350
400
300
350
400
450
500
550
600MtMt
Stocks (right axis) ConsumptionProduction
0
5
10
15
20
25
0
5
10
15
20
25
30
35MtMt
Stocks (right axis) ConsumptionProduction

TAD/CA/APM/WP(2014)5/FINAL
30
period. At this level, per capita food consumption is projected to remain steady at around 66 kg per person p.a. World feed utilisation of wheat is expected to grow at a slower pace than in the historical period, but still representing around 20% of total consumption (38% in developed countries and 9% in developing countries). In developed countries wheat is also used for biofuel production, utilisation that is expected to moderately increase over the outlook period.
Figure 4.6. Increasing food and feed demand for wheat in developing countries
Evolution of wheat utilisation shares in developed and developing countries between the base year and 2023
Note: In “other use” other non-disaggregated industrial demand sources (e.g. processing of straw) are included.
Source: OECD and FAO Secretariats.
Sustained by the demand for rice as food, the total utilisation of rice is to expand by about 1.1% p.a. to some 554 Mt in 2023 (Figure 4.7). In Asia, where much of the rice produced is consumed domestically, per capita rice consumption is expected to rise only marginally, as diets diversify. On the other hand, per capita rice consumption will keep growing in African countries, where rice is gaining relative importance as a major food staple. While demand continues to outpace production in Africa, rice imports are expected to increase, lifting Africa’s share of world imports from 31% to 38%.
0 100 200 300 400 500 600
2023
2011-13
2023
2011-13
Deve
loped
Deve
loping
Mt
Food Use Feed Use Biofuel Use Other Use

TAD/CA/APM/WP(2014)5/FINAL
31
Figure 4.7. African countries increase their share in world rice imports
Evolution of rice imports in regional aggregates between 2004 and 2023
Source: OECD and FAO Secretariats.
Despite a slower growth rate than in the previous decade, world utilisation of coarse grains is projected to increase by 20% by 2023 compared to the base period. This is driven largely by expansions in the demand for feed, which holds the largest share of total utilisation. Moderate increases in demand for industrial uses in developed countries and food in developing countries are also expected, the latter following larger population growth in these countries (Figure 4.8).
Figure 4.8. Increasing biofuel and feed demand for coarse grains
Evolution of coarse grains utilisation shares in China, other developing countries and developed countries between the base year and 2023
Note: In “other use” other non-disaggregated industrial demand sources (e.g. production of high fructose corn syrup or corn starch) are included.
Source: OECD and FAO Secretariats.
0
10
20
30
40
50
60
2003 2004 2005 2006 2007 2008 2009 2010 2011 2012 2013 2014 2015 2016 2017 2018 2019 2020 2021 2022 2023
Mt
Africa Asia and Pacific Developed Rest of the World
0 100 200 300 400 500 600 700
2023
2011-13
2023
2011-13
2023
2011-13
Deve
loped
Othe
r dev
elopin
gCh
ina
Mt
Food Use Feed Use Biofuel Use Other Use

TAD/CA/APM/WP(2014)5/FINAL
32
The strong developments in feed use are mostly driven by strong growth in China, United States and Brazil. Among its industrial uses, maize-based ethanol production in the United States is projected to continue expanding after reaching the target of the Energy Independence and Security Act of 2007, with a considerable increase in ethanol exports. Within the United States, the share of maize used for ethanol production goes up to 44% of total domestic production. World use of coarse grains for production of biofuels is projected to reach 173 Mt, representing 12.2% of total world coarse grains utilisation.
With moderate increases in supply, the most important feature of Chinese coarse grains markets in the coming ten years is the rapid increase in imports. The government’s efforts to achieve self-sufficiency will likely concentrate on wheat and rice markets. While the Outlook projects considerable increases in meat imports (between 4 and 9% growth p.a.), this will not prevent coarse grains imports to follow a similar pattern with a 4% p.a. increase between 2014 and 2023, in order to satisfy demand. Feed demand is expected to increase the most, reaching 183 Mt in 2023 (Figure 4.8).
Figure 4.8. Increasing biofuel and feed demand for coarse grains
Evolution of coarse grains utilisation shares in China, other developing countries and developed countries between the base year and 2023
Note: In “other use” other non-disaggregated industrial demand sources (e.g. production of high fructose corn syrup or corn starch) are included.
Source: OECD and FAO Secretariats.
Starch and starch derivatives play a major role in Chinese food and non-food industries, and the demand of maize for processing into starch and other industrial uses increased rapidly between 2001 and 2007, when the government halted growth in the production of corn-based ethanol. Nevertheless, while restrictions on corn-based ethanol production are still in place, industrial processing of corn continued growing, reaching a record high of 50 Mt in 2015. Over the outlook period, we expect the industrial use of maize to fall slightly to a 16% share of total coarse grains consumption.
In view of more efficient supply chains with high productivity to meet the growing demand, one of the challenges for agriculture is to reduce food loss and waste along the food chain. The problem of food loss and waste has drawn greater attention in many parts of the world with, for example, 2014 designated as the European year against Food Waste (Box 4.1). On the supply side, problems of food loss have been addressed through the recycling of waste into feed and fertilisers in an economic manner (Box 4.2). Entries
0 100 200 300 400 500 600 700
2023
2011-13
2023
2011-13
2023
2011-13
Deve
loped
Othe
r dev
elopin
gCh
ina
Mt
Food Use Feed Use Biofuel Use Other Use

TAD/CA/APM/WP(2014)5/FINAL
33
of non-conventional feeds, such as distiller’s dry grains (DDG), into feed markets have been significant in the last decade and are expected to continue during the projection period (Figure 4.9). If these measures are effective during the medium term, they will further contribute to stable agricultural markets.
Box 4.1. Campaign to prevent bread waste in Turkey
Studies of the Food and Agriculture Organization (FAO) show that 1.3 Gt of food are wasted every year. This amount is equal to the total food production of Sub-Saharan Africa. Moreover, FAO estimates that one-third of the global food production is either wasted or lost.1 If one-quarter of the food currently lost or wasted globally could be saved, it would be enough to feed the 840 million hungry people in the world.2
Against this background, the Turkish Government launched a campaign to decrease bread waste in the country, even though per capita household food waste is lower in Turkey compared to other OECD countries.3 The Turkish Grain Board, which is a subsidiary organisation of the Ministry of Food, Agriculture and Livestock, conducted research in 2008 and 2012 on the production, consumption, consumption habits and waste of bread in Turkey. The results of these studies were alarming because they showed that the bread waste in Turkey reached serious amounts. As a consequence, a campaign was launched in January 2013 to inform and raise society’s awareness of bread waste. The aims of the campaign are to create public awareness, prevent waste in bread production and consumption, ensure bread is bought as needed and preserved properly, inform society on different ways of using stale bread and contribute to the economy by preventing waste.
The bread waste campaign included a media campaign with estimated advertisement costs of USD 243 million.4 spread on internet, TV commercials, newscasts, newspaper articles, a research book about bread waste, a stale bread recipe book and various brochures. Several conferences, exhibitions, press meetings, stale bread recipe competitions etc., have been organised with the cooperation of the universities, non-governmental organisations, the private sector and local administrators and reached all parts of the Turkish society.
At the end of 2013, the Turkish Grain Board carried out another study in order to evaluate the impact of the campaign on bread waste and consumption habits. The research results show that, between end of 2012 and 2013, daily bread waste in the country decreased by 18% from 5.95 million to 4.9 million loaves and totally 384 million loaves of bread had not been wasted in 2013. On a per capita basis, these improvements resulted in a 19% decrease in daily bread waste to 16.2 grams. Furthermore, the campaign resulted in a 10% decrease in the daily total bread production and consumption. Based on calculations by the Turkish Grain Board (Table 4.1), reducing bread waste saved USD 159 million and reducing unnecessary bread purchases saved USD 1.3 billion, for a total savings of USD 1.5 billion within a year.5
Table 4.1. Bread waste statistics
Before the Campaign
After the Campaign
(End Of 2012) (End Of 2013) Annual expenditure on bread consumption (billion TRL) 26 23.5 Annual expenditure on bread consumption (billion USD) 13.8 12.4 Daily bread production (million loaves) 101 91 Daily bread consumption (million loaves) 95 86 Daily bread waste (million loaves) 5.95 4.9 Daily per capita bread consumption (g) 319 284 Daily per capita bread waste (g) 19.9 16.2
Sources: The research on bread waste in Turkey, The Turkish Grain Board, December 2013. (Accessible at: http://www.ekmekisrafetme.com/UploadResim/Kampanya/ArastirmaKitabi.pdf)
The official internet site of the campaign (http://www.ekmekisrafetme.com/).
1. Food losses refer to the decrease in edible food mass throughout the part of the supply chain that specifically leads to edible food for human consumption. Food losses occurring at the end of the food chain, which relates to retailers’ and consumers’ behaviour, are rather called “food waste”. (Source: Global Food Losses and Food Waste (2011) - FAO) (For further information please see: Food Waste Along The Food Chain – OECD Working Party on Agricultural Policies and Markets)
2. Opening speech by Mustapha M. Sinaceur (FAO Representative in Turkey) on the campaign’s results disclosure meeting, 17 January 2014. (Full speech can be accessed at: www.ekmekisrafetme.com/UploadResim/Kampanya/17012014EkmekFAO.pdf)
3. For further information please see: Food Waste Along The Food Chain – OECD Working Party on Agricultural Policies and

TAD/CA/APM/WP(2014)5/FINAL
34
Markets. 4. 2013 avg. exchange rate 1.89 (USD/TRL) of Aglink-Cosimo Model is used. 5. “The Research on Bread Waste in Turkey” is the source of the figures in this paragraph. (The research can be accessed at
www.ekmekisrafetme.com/UploadResim/Kampanya/ArastirmaKitabi.pdf.)
Box 4.2. Structural changes in the feed market
Structural changes
The use of by-products in the feed market has expanded greatly with the massive arrival of distiller’s dry grains (DDG). DDGs are a by-product of cereal based ethanol. The boom in the biofuel industry generated much larger supply of DDG and created a structural change in the feed market. The new regulation on the use of meat and bone meal (MBM) which was introduced in the European Union in the second half of the 1990s and in Japan in 2001also created a structural change, albeit a smaller one. The decline in the share of coarse grains due to the increase in the relative price of maize is another important recent structural change. Additionally, the elimination of the European Union’s cereal support price in 2001 combined with the higher world cereal prices experienced in recent years has reduced the competiveness of manioc and corn gluten feed substantially in the European market but strengthened it in Asia and the Americas.
But probably the most important structural change affecting the feed market in the last twenty years is the greater use of crop protein meals in the feed rations in many developing countries. This occurred as a result of the transition from backyard production to specialized, commercial livestock farms using concentrated feeds. In the 1990s this generated a sufficient improvement in the feed conversion ratio of non-ruminant production to offset the increasing use of concentrated feeds caused by the change in the farming structure. But a growing number of commercial farms in developing countries have reached the maximum amount of protein meal that can be used in the feed ration. In these countries improvement in the feed conversion ratio will be more limited in future and insufficient to offset increasing consumption of concentrated feeds. Going forward, this will become a key element of demand for cereals and other feeds.
The use of by-products in the feed rations
DDG, MBM and corn gluten feed are all by-products of agricultural commodities. The same applies to cereal bran and dried beet pulp. An increasing share of fish meal production is also resulting from the use of fish residue. The feed market has provided a useful outlet for these by-products and they have become an important part of the system. The Aglink-Cosimo model was used to analyse these characteristics of the feed market. To capture their importance in the agricultural markets, a stylised counterfactual scenario was implemented, consisting of reducing the production of these by-products by 25% in every year of the outlook. The reduction in supply increased prices and led to higher demand for the other concentrated feeds like cereals and crop protein meals. This stronger demand generated higher prices with average increases over the projection period of 9%, 6.3%, 18% and 6% for coarse grains, wheat, protein meal and oilseeds, respectively.
Under this scenario, by 2023, the total production of the six feeds derived from by-products is 75.9 Mt less. This represents almost 4.5% of the world concentrated feed use. A shock of this magnitude would generate major adjustments in the market After ten years of these higher prices, production of cereals and oilseeds has increased respectively by 30 Mt and 10 Mt. This larger oilseed production generates almost 7.6 Mt of additional protein meal production. Therefore, on the production side, 37.6 Mt have become available to replace almost 50% of the imposed reduction in the scenario. The higher prices also reduce consumption; 25.4 Mt less concentrated feeds are used by livestock and fish farmers, 3.4 Mt less by the cereal food (including sweeteners) and other use sector and 4.2 Mt less by the biofuel sector for a total of 33 Mt or 43% of the imposed reduction in the scenario. 1 The remaining 5.3 Mt (75.9 minus 37.6, minus 33) have been replaced by fodder feeds (hay, pasture and cereal silage) in countries endowed with this type of resource.
These higher feed prices eventually reduce the supply of livestock and fish products and lead to lower world production levels for livestock (except beef) and fish and higher prices(Table 4.1). The resulting higher prices of beef substitutes have shifted beef demand upward sufficiently that it crosses the lower beef supply in the scenario at a higher production level, by 0.42% in 2023. Being less intensive in the use of these feeds, beef supply is not falling as much as the supply of non-ruminants. The substitution effect in demand is stronger than the supply effect resulting from higher feed prices.

TAD/CA/APM/WP(2014)5/FINAL
35
Table 4.2. Production and price changes of commodities requiring feeds in 2023 based on the counterfactual scenario
% Eggs Poultry Pork Fish Milk Beef Production -3.8 -1.6 -0.74 -1.2a -0.05 0.42 Priceb 13.5 9.7 8.2 8 4 5.2
a Eggs is the price in the United States, pork and beef are the simple averages of the Atlantic and Pacific markets and milk is the cheese price.
b Aquaculture production.
The higher cereal prices affect also the ethanol and sweetener markets. By 2023, world ethanol and cereal sweetener production are both1.2% lower and prices higher by 2.6% and 6% respectively. These higher prices contribute to higher sugar prices (2.6%) by shifting supply downward due to the higher price of ethanol and demand upward due to the higher price of HFCS.
The hypothetical scenario illustrates the moderating effect the use of agricultural by-products in the feed markets has on cereal and animal product prices contributing to food security and mitigating to some extent the impact of the use of cereals for ethanol production.
1. This decline is due to the lower profitability caused by the higher price of maize and the lower receipts from the sale of DDG.
Figure 4.9. Increasing use of non-conventional feeds led by dried distiller's grains
Source: OECD and FAO Secretariats.
Trade of cereals
Continuing historical trends, the developed world continues to supply wheat and coarse grains to developing countries. Net trade flows from developed countries to developing countries will increase by 17%. For wheat and coarse grains combined, the United States and Canada are projected to be the major exporters in 2023, with 108 Mt, followed by the CIS countries (67 Mt between the Russian Federation, Ukraine and Kazakhstan). While the US wheat market balances remain fairly steady over time, Canada will considerably increase wheat production and gain share in world exports (Figure 4.10). Argentina is also expected to improve its share of international wheat markets.
0
2
4
6
8
10
12
14
16
0
20
40
60
80
100
120
140
160
180%Mt
Manioc / roots and tubers Cereal bransMolasses Field peasDried Distiller's Grains Corn gluten feedDried beet pulp Ratio of non-conventional feeds to total feed (right axis)

TAD/CA/APM/WP(2014)5/FINAL
36
Volatility of supply in wheat markets of the Russian Federation has been a historical issue and mainly due to severe periods of drought. Nevertheless, a positive trend has been observed in the last ten years, and further increase of wheat production and exports are expected. Similarly, Ukraine and Kazakhstan are expected to continue agricultural investments to achieve wheat exports in 2023 close to half of their domestic supply. Wheat imports by Egypt, the Middle East and Indonesia are projected to capture about 18% of the total volume in 2023, while coarse grain imports are more dispersed around the globe.
Figure 4.10. Wheat export shares for major countries
Source: OECD and FAO Secretariats.
With 52 Mt, United States is projected to remain the main coarse grains exporter, followed by Argentina and Brazil, both adding another 56 Mt; making the Americas as the principal port of origin for coarse grains (Figure 4.11). With yields growing steadily, area stabilises at 36 Mha during the second half of the outlook period, about 6% less than in the base year. This supply response is caused by lower coarse grains prices after the expected production surpluses in 2013 and 2014. Demand for feed will profit from lower prices and is expected to increase at 0.7% p.a.
Argentina’s outlook on coarse grains is favourable, mainly due to the positive expected developments in barley markets and a clear orientation on exports. Out of 46 Mt of coarse grains production projected in 2023, 32 Mt will be exported and 10 Mt will be used for feed. Brazil’s supply of coarse grains in 2023 is expected to be around 82 Mt, but only 24 Mt are for exports and 47 Mt for feed. Both countries expect expansions in harvested area over 1% p.a., which is more than double the world average growth. Among other countries, Ukraine is also expected to diversify its crop sector and increase plantings of coarse grains, mainly maize and barley for exports.
United States21%
Russian Federation
10%
Canada13%European
Union14%
Australia15%
Ukraine5%
Kazakhstan6%
Argentina4% Rest of the
World12%
2011-13
United States18%
Russian Federation
14%
Canada14%
European Union13%
Australia12%
Ukraine6%
Kazakhstan6%
Argentina7% Rest of the
World10%
2023

TAD/CA/APM/WP(2014)5/FINAL
37
Figure 4.11. Rapid expansions of coarse grains exports
The Americas will be the principal port of origin for coarse grains
Source: OECD and FAO Secretariats.
China has embarked on the transformation of its food security strategy at the end of 2013. The new strategy has clearly separated the positioning of staple food grains, namely rice and wheat, from oilseeds and feed grains, and the focus of food security has been placed on “absolute self-sufficiency” in the two staple food grains - wheat and rice. The projections of cereal net trades are in line with these ambitions (Figure 4.12). Yet, the policy allows international markets to compensate any production shortfall of non-staple food grains, while their domestic production is pursued to the extent possible. The transformation, which positioned imports as an important part of the food supply, is regarded as the historical turnaround from the strategy of “95% self-sufficiency in food production” launched in 1996.
Figure 4.12. Cereal net trade in China
Source: OECD and FAO Secretariats.
0
20
40
60
80
100
120
140
160
180
2003 2004 2005 2006 2007 2008 2009 2010 2011 2012 2013 2014 2015 2016 2017 2018 2019 2020 2021 2022 2023
Mt
Latin America and Caribbean North America Europe Rest of the World
-20
-15
-10
-5
0
5
10
2003 2004 2005 2006 2007 2008 2009 2010 2011 2012 2013 2014 2015 2016 2017 2018 2019 2020 2021 2022 2023
Mt
Wheat Coarse grains Rice

TAD/CA/APM/WP(2014)5/FINAL
38
Despite being a thin market, compared with other agricultural commodities, international rice trade registered a particularly fast annual growth of 3.6% in the past ten years. A relatively fast pace of expansion of 3.1% p.a. is projected for the next ten years, which boosts the volume exchanged to 49 Mt by 2023. All of the traditional exporters, including India, Pakistan, Thailand, Viet Nam and the United States, are expected to increase their exports. Thailand, in particular, is foreseen to regain its leadership (Figure 4.13), following a relaxation of the high producer price policy applied in the past three years and on the back of the large inventories held in public warehouses, which will take several years for the market to absorb. Less attractive world prices, on the other hand, may prompt smaller exporters, such as Egypt, Brazil or the Russian Federation, to curtail international sales. However, one of the developments likely to dominate developments in the next decade is the probable rise of Cambodia and Myanmar (now included in the Asia Least Developed country grouping) as major rice exporters which would further stoke competition among rice producers (Box 4.3).
Figure 4.13. Rice export shares of major countries
Source: OECD and FAO Secretariats.
0
10
20
30
40
50
60
70
80
90
100
2003 2004 2005 2006 2007 2008 2009 2010 2011 2012 2013 2014 2015 2016 2017 2018 2019 2020 2021 2022 2023
%
LDC Asia Pakistan United States Viet Nam India Thailand

TAD/CA/APM/WP(2014)5/FINAL
39
Box 4.3. Contribution of agricultural investments to stabilising international rice price volatility under climate change
The role of agricultural investment growth in alleviating climate risks of rice production systems and rice markets was examined using a partial equilibrium model. The Rice Economy Climate Change (RECC) model covers rice markets in 15 countries and regions(Thailand, Viet Nam, Indonesia, Malaysia, the Philippines, Cambodia, Lao PDR, Myanmar, China, Japan, South Korea, India, the United States, EU27 and the rest of the world).1 Rice yield in each economy is estimated from minimum and maximum temperatures, precipitation, and agricultural investments. Rice area harvested is estimated from rice and wheat producer prices and precipitation. All climate variables for the future period come from a climate change projection by BCM2 (Bergen Climate Model Version 2) Global Climate Model under A2 greenhouse gas emission scenario both in baseline and policy scenario projections.
It is assumed that the current growth rate of agricultural investments (land development2 and machinery and equipment) from 2000-07 in each country will continue during the baseline projection period.3 With this assumption, the coefficient of variation (CV) of the international rice price (milled 5% broken f.o.b. Ho Chi Minh price) in the baseline is 0.076 from 2010-12 to 20304 (Table 4.3).
Projections were made under several scenarios of agricultural investments in selected countries for comparison against the baseline projection. These agricultural investments can be considered as climate change adaptation measures.
Table 4.3. Policy scenarios and simulations results for rice under climate change conditions
Countries Growth rate of agricultural investment during the
projection period (2010-2030) The coefficient of variation (CV) of
international Rice Price (2010/12-2030) Land development
Machinery and Equipment
Baseline 15 countries and regions Same as 2000-2007 rate Same as 2000-2007 rate 0.076
Policy scenario 1 ASEAN 8 countries 2.0% annum 1.0% annum 0.036 Policy scenario 2 The Philippines 2.0% annum 1.0% annum 0.072
Policy scenario 3 Thailand 2.0% annum 1.0% annum 0.055 Policy scenario 4 Vietnam 2.0% annum 1.0% annum 0.059
Policy scenario 5 ASEAN 8 countries 0.0% annum (no growth) 0.0% annum (no growth) 0.125
The simulation results suggest that the volatility in the rice price will increase compared to the baseline, if agricultural investment in ASEAN 8 countries do not grow during the projection period. However, a constant agricultural investment (2.0% p.a. increase for land development and 1.0% p.a increase for machinery and equipment) in ASEAN 85 countries will contribute to a decrease in the international rice price volatility. Particularly, investments in Thailand and Viet Nam are the most important in stabilising the international rice price under the future climate change.
1. 14 countries and the EU account for 82% of total world rice production in 2010/12 (FAOSTAT). Other countries that produce rice are treated as “the rest of the world” in the model.
2. Land development includes land clearance, land contouring, creation of wells and watering holes, boundaries and irrigation channels built by farmers, and irrigation works, soil conservation works, flood control structures undertaken by government and other local bodies.
3. The growth rate of investments in land development in ASEAN 8 countries ranged from -0.1% to 1.9% and that in machinery and equipment in ASEAN 8 countries ranged from -0.1% to 1.0%.
4. The CV is measured by annual price from 2010/12 to 2030.Thailand, Viet Nam, Indonesia, the Philippines, Malaysia, Cambodia, Lao PDR and Myanmar.
Source: Koizumi, T. and H. Kanamaru (2014), Contribution of Agricultural Investments to Stabilizing International Rice Price Volatility under Climate Change, FAO website, http://www.fao.org/climatechange/amicaf/85845/.
TAD/CA/APM/WP(2014)5/FINAL
40
Main issues and uncertainties
After a sharp recovery from the 2012 drought, current production prospects for the main producing regions (for instance United States, Russian Federation and Argentina) are rather optimistic. There is a high likelihood that adverse weather events such as El Niño will continue affecting cereal markets in these regions. In the Outlook, no weather cyclical patterns are projected, although adverse trends linked to extreme weather events are part of the projections, with Australia as the typical example.
Cereal prices could be affected by a potential further slowdown of fast growing economies, such as China, and lower energy prices caused by new energy sources and new extraction technologies. Moreover, the reinforcement of food security and sustainability criteria in the reform and design of biofuel policies may also have the effect of lowering the demand of cereals. Additionally, unrests in exporting regions (i.e. Ukraine) or importing regions (i.e. Middle East), or changes to demographic policies such as the reform of China’s one-child policy could provoke tensions on markets that are not reflected in the projections.
References
Turkish Grain Board, (2013), The official internet site of the campaign to prevent bread waste, http://www.ekmekisrafetme.com/
Koizumi, T., and H. Kanamaru (2014), Contribution of Agricultural Investments to Stabilizing International Rice Price Volatility under Climate Change, FAO website, http://www.fao.org/climatechange/amicaf/85845/

TAD/CA/APM/WP(2014)5/FINAL
41
Chapter 5. Oilseeds and oilseed products
Abstract
This chapter describes the market situation and the latest set of quantitative medium-term projections for global and national oilseed, protein meal and vegetable oil markets for the ten-year period, 2014-23. The discussion covers the developments expected in world and national prices, production, use (human consumption, industrial and feed use), trade (imports and exports) and stocks. The quantitative projections are developed with the aid of the partial equilibrium Aglink-Cosimo model of world agriculture. The chapter also includes a box that explains policy options for biofuel in Indonesia. It concludes with a discussion of main issues and uncertainties concerning the medium term outlook for oilseeds. These include biodiesel policies, and specific market developments influencing production, consumption and trade of oilseeds and oilseed products.
Market situation
Recently the United States and Brazil21 were affected by significant droughts which contributed to high prices of oilseeds and other crops. Farmers in many parts of the world responded to these higher prices, by strongly increasing oilseed production in 2013.22 As a consequence, the global area under oilseeds cultivation and oilseed production reached new records. World coarse grain production also reached a new record. The large increase in crop production led to a significant decline in most crop prices, particularly in coarse grains, due to the large production increase in the United States. As a result, a shift in land to oilseeds is expected in the 2014 crop year which should lead to another record crop and further declines in the prices of the oilseed complex.
The lower oilseed prices will improve the crushing margin and lead to large expansion in crush and in oilseed meals and oils production. Global palm oil production is anticipated to continue to grow in the short term. Increases in income, population and biodiesel production are contributing to higher vegetable oil demand. This will avert large price declines for vegetable oil following the anticipated large increase in supply. Demand for protein meal will not be as strong due to a slowdown in world meat production in 2013 and 2014, resulting from the high feed prices since 2010.
The record crops of 2013 and 2014 will replenish oilseeds stock to levels that should buffer most unanticipated shortfalls in production in the short term.
Projection highlights
• World production of oilseeds has increased in marketing year 2013 and, in the absence of climate incidents, is expected to stay at this high level in 2014. These two large crops will significantly reduce international oilseeds and products prices. After this reduction, prices are expected to
21 Brazilian oilseed sector data are reported on a calendar year basis. 22 See the glossary for the definition of crop marketing years for oilseeds and products in various countries.
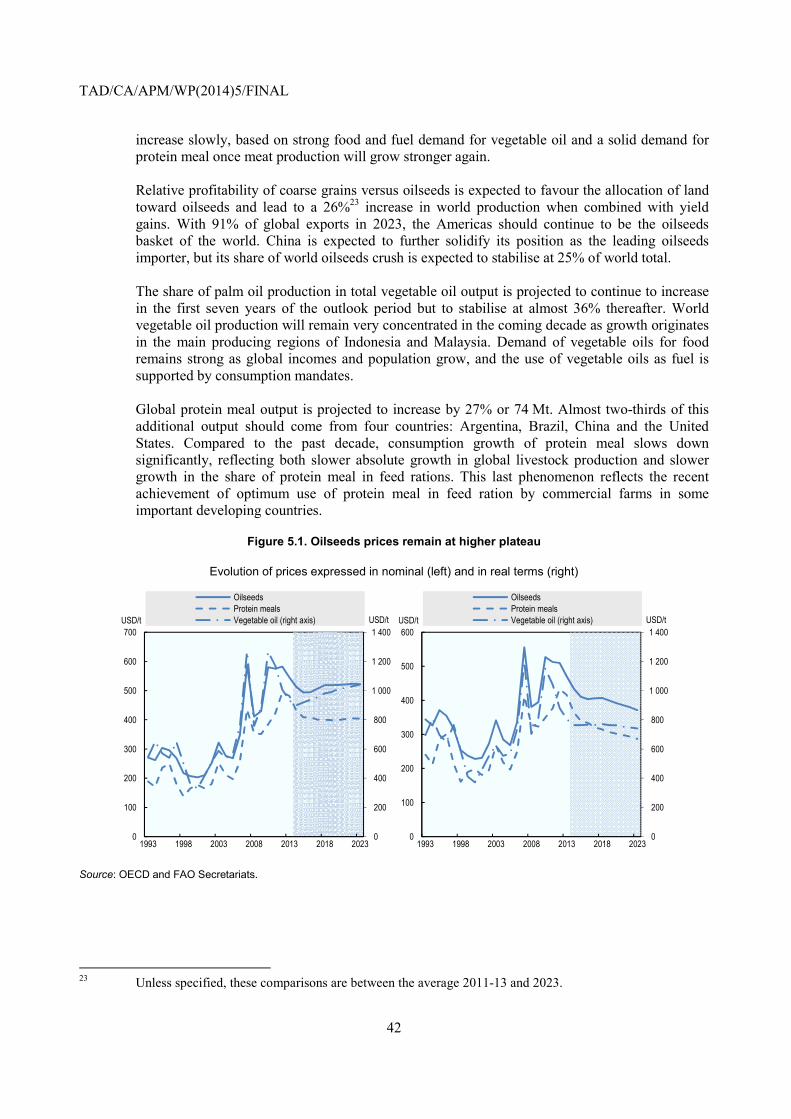
TAD/CA/APM/WP(2014)5/FINAL
42
increase slowly, based on strong food and fuel demand for vegetable oil and a solid demand for protein meal once meat production will grow stronger again.
• Relative profitability of coarse grains versus oilseeds is expected to favour the allocation of land toward oilseeds and lead to a 26%23 increase in world production when combined with yield gains. With 91% of global exports in 2023, the Americas should continue to be the oilseeds basket of the world. China is expected to further solidify its position as the leading oilseeds importer, but its share of world oilseeds crush is expected to stabilise at 25% of world total.
• The share of palm oil production in total vegetable oil output is projected to continue to increase in the first seven years of the outlook period but to stabilise at almost 36% thereafter. World vegetable oil production will remain very concentrated in the coming decade as growth originates in the main producing regions of Indonesia and Malaysia. Demand of vegetable oils for food remains strong as global incomes and population grow, and the use of vegetable oils as fuel is supported by consumption mandates.
• Global protein meal output is projected to increase by 27% or 74 Mt. Almost two-thirds of this additional output should come from four countries: Argentina, Brazil, China and the United States. Compared to the past decade, consumption growth of protein meal slows down significantly, reflecting both slower absolute growth in global livestock production and slower growth in the share of protein meal in feed rations. This last phenomenon reflects the recent achievement of optimum use of protein meal in feed ration by commercial farms in some important developing countries.
Figure 5.1. Oilseeds prices remain at higher plateau
Evolution of prices expressed in nominal (left) and in real terms (right)
Source: OECD and FAO Secretariats.
23 Unless specified, these comparisons are between the average 2011-13 and 2023.
0
200
400
600
800
1 000
1 200
1 400
0
100
200
300
400
500
600
700
1993 1998 2003 2008 2013 2018 2023
USD/tUSD/t
OilseedsProtein mealsVegetable oil (right axis)
0
200
400
600
800
1 000
1 200
1 400
0
100
200
300
400
500
600
1993 1998 2003 2008 2013 2018 2023
USD/tUSD/t
OilseedsProtein mealsVegetable oil (right axis)
TAD/CA/APM/WP(2014)5/FINAL
43
Market trends and prospects
Prices
After the initial downward correction, all prices of the oilseed complex are expected to increase over the medium term due to strong demands for vegetable oil and protein meal (Figure 5.1). The demand for protein meal is mainly driven by the growth in non-ruminant and milk production in developing countries and a greater incorporation rate of protein in feed rations in these countries. Vegetable oil demand is mainly driven by the food and biodiesel sectors. Despite the high crude oil price assumed in the projections, the bulk of global biodiesel demand will be driven by national mandates, because generally biodiesel is not expected to be economically viable compared to diesel. Those mandates include the advanced biofuel mandate in the United States, which is expected to be filled partly by biodiesel in most years of the projection period.
Over the medium-term, the price of protein meal will stabilise around 5% above the average level of the period 2006-12; corresponding to the new higher price plateau. As of 2015, the price of vegetable oils is expected to increase again. Oilseed prices will increase from 2017 onwards, except in 2023 due to larger production generated by the lower coarse grains price in the two preceding years. In real terms, these prices are expected to fall but from very high levels (Figure 5.1). When compared to 2005 (i.e. before the new higher price plateau), the world price of vegetable oil, protein meal and oilseed in 2023 will be, respectively, 30%, 46% and 38% higher in real terms.
The strong demand for vegetable oil drives the production of protein meals because both products are produced in fixed proportions. Despite solid meal demand from milk, pork, poultry and egg production in developing and certain developed countries, the protein meal price increases slowly because supply stays ahead of demand. Prices would be even lower if they were not supported by the high price of fishmeal, which is caused by the growing aquaculture production and a somewhat stagnating fishmeal supply due to fishing quotas. Additionally, the prices for vegetable protein meal are strengthened by the prohibition and/or regulation in the use of meat and bone meal as farm animal feed in many countries.
Oilseed production and crush
Since maize production requires larger amounts of fertiliser and energy than oilseeds, the anticipated increase in the price of these inputs should give a cost advantage to soybean. As a result, the oilseeds’ share of world area for the commodities covered in the Outlook is expected to grow slightly between the 2011-13 average and 2023 but at a slower pace than in the previous decade. Global area expansion of 11%, combined with yield improvements of 14%, should generate a 26% increase in world oilseed production over the coming decade.
Founding countries of the Mercado Común del Sur (MERCOSUR, Argentina, Brazil, Paraguay and Uruguay) are expected to reach 36% of world production in 2023, compared to an average of 34% in 2011-13. In spite of a small decline, the United States should remain the leading oilseeds producer, with a global share of 21% by 2023. The RKU countries (Russian Federation, Ukraine and Kazakhstan) and Canada are expected to maintain their 6.6% and 5% share, respectively, throughout the outlook period.
In the context of an increasing use of biodiesel to meet the Renewable Energy Directive, oilseeds production in the European Union should increase by 19% over the projection period and maintain more or less its 7% share of world total. This should be mostly driven by yield increases.
Which regions of the world will crush these oilseeds depends on many factors, including transport cost, trade policies, acceptance of genetically modified crops, processing costs (e.g. labour and energy costs) and infrastructure (e.g. ports and roads). In this Outlook, it is anticipated that China will continue to

TAD/CA/APM/WP(2014)5/FINAL
44
increase oilseed crush, but its share of the world total will stabilise around 25% (Figure 5.2). However, since the bulk of the anticipated increase in crushing is expected from imported oilseeds, China’s imports should reach almost 81.5 Mt in 2023.
Large production increases of oilseeds in more remote regions in MERCOSUR will enable these countries to gradually reach 25% of the world total crush by the end of the outlook period. Underpinned by its biodiesel policies, the European Union’s crushing share should only fall slightly over the outlook period. The downward trend in the share of the countries of North American Free Trade Agreement (NAFTA, United States, Canada and Mexico) should continue but at a slower pace.
Figure 5.2. Share of global oilseed crush among leading regions
Source: OECD and FAO Secretariats.
Based on the projected smaller rate of growth in global oilseed production, annual average growth in world oilseed crush is expected to be 2%, compared to 3.5% in the previous decade. This, in absolute terms, translates into an expansion of 96.5 Mt over the outlook period. The largest expansion in crush volume is projected to come from the MERCOSUR countries with 36.4 Mt, followed by China with 25 Mt.
Since there are no new stock holding policies by any major producer or consumer country, the global stock-to-use ratio is expected to fall to 8% at the end of the outlook period. This limits the capacity to compensate potential production shortfalls in a major producing region and contributes to the continued risk of price volatility in the oilseed sector.
Vegetable oil production and consumption
World vegetable oil production is expected to increase by 28%, or 46 Mt, over the outlook period, relative to the 2011-13 average. It is likely to remain very concentrated with eight major producers (Indonesia, Malaysia, China, the European Union, the United States, Argentina, Brazil and India) accounting for almost 77% of total production throughout the projection period. Malaysia’s and Indonesia’s palm oil output is projected to grow on average at about 2.9% p.a., a slower rate than in the past as land restrictions, environmental constraints and labour costs become more constraining. The share of palm oil production in total vegetable oil output is projected to continue to increase in the first seven years of the outlook period but to be at almost 36% thereafter. Based on its use of imported seeds in domestic crush, China ranks second in vegetable oil production.
0
5
10
15
20
25
30
2000 2001 2002 2003 2004 2005 2006 2007 2008 2009 2010 2011 2012 2013 2014 2015 2016 2017 2018 2019 2020 2021 2022 2023
%
China European Union MERCOSUR NAFTA

TAD/CA/APM/WP(2014)5/FINAL
45
Rising per capita income is expected to lead to a 1.3% increase p.a. in per capita vegetable oil consumed as food in developing economies. Annual food vegetable oil use per capita is expected to average 20.3 kg across developing countries, but no more than 9.4 kg in least developed countries by 2023. As a group, developed countries are showing a stable consumption level of 24-25 kg, but individual countries differ based on tastes and dietary preferences.
Globally, the use of edible vegetable oil for biodiesel production is expected to expand by almost 10 Mt to 28.8 Mt over the outlook period. This constitutes a 50% increase over the base period and takes up almost one-quarter of the total production growth of vegetable oil. The European Union is expected to remain the largest producer of biodiesel, stabilising at about 40% of global output after 2017. Other important producing countries are Argentina, Brazil, Indonesia and the United States.
In developed countries, continuing sustained demand for non-food uses, in particular for biodiesel production, is expected to lead to an average annual growth of vegetable oil use of 1% p.a. This rate is much slower than over the previous decade when biofuel policies were taking effect. The share of vegetable oil consumption used for world biodiesel production is expected to increase from 12% in 2011-13 to 14% in 2023 (Figure 5.3).
Argentina is expected to maintain an export-oriented biodiesel industry: consumption of vegetable oil for biodiesel production is expected to reach 3 Mt by 2023, i.e. 74% of domestic vegetable oil use. In the European Union and Thailand, vegetable oil for biodiesel production is expected to account for 44% and 47%, respectively, of domestic vegetable oil consumption by 2023.
The use of maize oil for biodiesel production has emerged in the United States, and it is expected to amplify over the outlook period. Maize oil is extracted during the processing of maize into ethanol and sweeteners in wet milling plants. Since only about 10% of ethanol is produced in wet milling plants, the largest part of maize oil production is derived as a by-product of maize sweeteners.
Figure 5.3. Biodiesel to use a large share of vegetable oil consumption
Source: OECD and FAO Secretariats.
0 10 20 30 40 50 60 70 80
Argentina
Thailand
European Union
Brazil
Indonesia
United States
World
Malaysia
%
2023 2011-13

TAD/CA/APM/WP(2014)5/FINAL
46
Protein meal production and consumption
Global meal output is projected to increase by 27%, reaching almost 351 Mt by 2023. Production remains highly concentrated, with six producers (Argentina, Brazil, China, European Union, India and United States) accounting for almost 77% of global production. Almost two-thirds of the 74 Mt increase will come from only four countries: Argentina, Brazil, China and the United States. In China and the European Union, meal production will continue to rely on both domestically grown and imported seeds, while the others will barely import any seeds
Global meal consumption should rise by 27%, with developing countries accounting for 84% of the increase and reaching 66% of global consumption by 2023. Compared to the past decade, annual consumption growth is expected to slow down markedly reflecting the lower growth of the livestock industry in developing countries and a slower growth in the inclusion of protein meal in feed rations.
In Least Developed Countries (LDC), protein meal use remains low, but its use is projected to grow faster in the coming ten years than over the previous decade because of a faster growth of livestock production and increasing feed intensity of protein meal. While this projected development represents a positive development for these countries, it is not a driving factor in the global protein meal market, since the increase in LDC consumption accounts for only 2.4% of the total growth. As for developed countries, growth in animal production is expected to follow the slow growth path of the past, and the penetration rate of protein meal in feed rations remains stable (Figure 5.4).
China and the European Union are expected to remain the leading protein meal consumers, followed by the United States, Brazil and India. The strong increase in demand for protein meal in China will not be entirely met by additional domestic production, which leads to 9 Mt of imports by 2023. In the United States, meal use is expected to expand, following a period of decline that was caused by rising availability of dried distillers grains (DDG). The massive increase in ethanol production in the United States led to a surge in the production of the by-product DDG which can replace, to some extent, protein meal in some feed rations. Approaching the Renewable Fuel Standard (RFS2) maximum amount of ethanol that can be produced from maize in 2015, DDG supply will eventually stabilise, contributing to rising demand for protein meal. The livestock industry in the Russian Federation is projected to increase the amount of protein meal used in the feed rations; yet, it will still remain much below the use rate of other developed countries.
Figure 5.4. Growth in protein meal consumption and animal production, (2011-13 vs. 2023
0
10
20
30
40
50
60
LDC Developing Developed
%
Protein meals Milk Pork Poultry Eggs

TAD/CA/APM/WP(2014)5/FINAL
47
Source: OECD and FAO Secretariats.
Trade in oilseeds and oilseed products
The average annual growth rate of world trade in oilseeds is expected to slow down considerably in the next decade, compared to the previous decade. This development is directly linked to the projected deceleration of the oilseed crush in China. The country is expected to expand its crush by only about 25 Mt in the coming decade compared to an increase of 46 Mt in the previous decade.
Imports by the second largest importer of oilseeds, the European Union, remain stable as increased crush demand is met primarily by rising domestic production. Many smaller importers are expected to expand their imports significantly relative to the base period, but in absolute volumes these additional shipments are small. Purchases by China and the European Union account for 71% of world oilseeds imports by 2023.
In terms of global oilseeds exports, growth over the next decade is expected to be slightly higher for developed than for developing countries. Exports from the United States should grow by 22% over the projection period. A similar growth is expected for Canada (21%) as a growing exportable surplus is generated through continued gains in canola cultivation in the Canadian prairies. Brazil’s shipments of oilseeds should increase by 8%24 over the next decade. Argentina’s exports are expected to increase by 21%. Overall, world trade in oilseeds remains highly concentrated, with these four leading exporters holding an 82% market share in 2023. Additional exports by Paraguay and Uruguay, which are growing rapidly in the projection period, move this concentration ratio to 90%.
Vegetable oil imports are less concentrated than oilseeds, but there are three main market players. The European Union, China and India are expected to represent about 48% of world imports in 2023. With a projected increase in imports of 52% and 63%, China’s and India’s import dependency rates (imports divided by consumption) reach 36% and 64%, respectively. Imports of vegetable oil by the European Union will remain below the average of 2011-13 because of a 5.6 Mt increase in domestic oilseed crush.
The vegetable oil deficit of LDCs will continue to grow along with domestic usage. The share of domestically produced vegetable oil in this market is expected to fall from 35% to 32% over the outlook period. Their imports are expected to increase from 5.3 Mt in 2011-13 to 7.4 Mt by 2023.
Vegetable oil exports continue to be dominated by a few players (Figure 5.5). Indonesia and Malaysia will continue to account for almost two-thirds of total vegetable oil exports during the coming decade. Argentina is expected to be the third largest exporter with a share of 9%. A share of 65% of Argentina’s domestic vegetable oil production is exported in 2023, as the differential export tax system continues to favour exports of oilseed products over oilseeds.
For meal, the projections indicate a slowdown in trade expansion from 48% in the previous decade to 28% in the next decade. The deceleration of imports will be much more pronounced in developed than in developing countries. Between the average of 2011-13 and 2023, global imports are projected to increase by 22 Mt, 90% of this anticipated expansion is projected to occur in the developing world.
The large increase in meal consumption in China is anticipated to change its trade balance from a small net exporter at the beginning of the century to a net importer of about 9 Mt in 2023. The EU trade
24 This low growth rate is partly due to fairly high levels in the base period and a rapid increase in crush in
Brazil.

TAD/CA/APM/WP(2014)5/FINAL
48
deficit should remain mostly stable as the additional oilseeds produced to obtain the necessary oil for biodiesel production will also increase the domestic supply of protein meal.
Argentina will remain, by far, the largest meal exporter, because it is the only country among the large oilseed meal producers with a very small consumption base. This low level of consumption is directly tied to the composition of its livestock sector which requires small amounts of protein meal. The anticipated growth in crushing in Brazil will generate a greater surplus of protein meal. Exports will therefore grow by 38%. The five significant American producers - Argentina, Paraguay, Brazil, the United States and Canada - account for a large share of protein meal trade, reaching 74% of world exports by 2023.
Figure 5.5. Share of vegetable oil exports in 2023
Source: OECD and FAO Secretariats.
Main issues and uncertainties
In addition to the issues and uncertainties common to most commodities (e.g. macroeconomic environment, crude oil prices and weather conditions), each sector has its specific supply and demand sensitivities. The low stock level at the end of the outlook period is a source of uncertainty for the stability of prices, for example, if the sector is affected by adverse weather events.
Biofuel policies in the United States, European Union and Indonesia are a source of major uncertainties in the vegetable oil sector, because they have an impact on a large share of the demand in these countries. The proposal by the European Commission to limit the amount of first generation biofuels that can be counted towards the (10%) bloc’s renewable energy targets to 5% remains an uncertainty. If, contrary to what is assumed in this Outlook, the new policy requiring Indonesia to replace 25% of its consumption of diesel oil with domestically produced biodiesel by 2025 is successful, the impact on the vegetable oil market would be significant according to the analysis presented in Box 5.1.
Since biodiesel is considered an advanced biofuel in the United States Renewable Fuel Standard mandates, all the uncertainties related to that policy are also relevant for the vegetable oil market.
The main uncertainties are the yearly decision by the Environment Protection Agency (EPA) regarding the cellulosic, advanced and total mandate. Until now, none of the reductions in the cellulosic mandate has translated into a reduction in the advanced and total mandates. As indicated in Box 3.1, the
Indonesia36%
Malaysia26%
Ukraine6%
Canada4%
Brazil3%
Argentina9%
Rest of the World16%

TAD/CA/APM/WP(2014)5/FINAL
49
EPA’s final implementation decision for 2014 is still outstanding. In November 2013, the EPA made a proposal to cut, for the first time, the total renewable fuel mandate, the total advanced biofuels mandate as well as the cellulosic mandate for 2014. This proposal is significantly below the final 2013 Renewable Fuel Standard and the initial numbers set by the Energy Independence and Security Act for 2014. The biodiesel mandate for 2014 is proposed to remain the same as in 2013. But since biodiesel is eligible to fulfil part of the other advanced gap, any decision affecting total and advanced mandates could have an impact on the biodiesel and vegetable oil sectors. An additional factor is the uncertain renewal of the biodiesel tax credit in the United States which can hugely affect the profitability of biodiesel production. The other factor affecting the incentives for blenders to use more biodiesel in the United States is the ethanol blend wall. In the Outlook, it is assumed that E15 blends (i.e. 15% ethanol and 85% fossil fuel) will be introduced in the market. However, this is far from being certain.
For protein meal, the European Commission announced in early 2013 that processed animal protein (PAP) from poultry and pigs would be allowed in fish farming as of 1 June 2013 (EU, 2013). There is also a possibility that the European Commission might reintroduce the use of PAP from pork and poultry to poultry and pig farming as of 2014. Both measures could affect the outlook for oilseed meal consumption in the European Union.

TAD/CA/APM/WP(2014)5/FINAL
50
Box 5.1. Policy options for biofuel in Indonesia: Implications for vegetable oil markets
The Global Bioenergy Partnership (GBEP) is an initiative promoted by the G8 and G20 and launched in 2006 with the scope to support wider, cost effective bioenergy deployment, particularly in developing countries where biomass use is prevalent. Within this Partnership, 49 governments and 26 international organisations have agreed on a set of 24 indicators for bioenergy, designed to inform national policymaking about sustainability criteria of biofuel developments. The establishment of these indicators provides a framework that ensures the consideration of key factors related to sustainable policy decisions; however, they are not binding to pre-established thresholds, allowing individual countries to evaluate their envisioned policy goals independently.
Sustainable development is based on three pillars; economic development, social development and environmental protection. The indicators were designed to cover aspects related to all three pillars. Specifically related to the pillar of social development, one indicator assesses the impact of an emerging bioenergy sector on domestic food markets. Evaluation of this indicator involves three tiers. The first two tiers relate to qualitative assessments of the economic impacts that bioenergy could have on food prices, while the third tier is a model-based quantitative assessment of these impacts.
In Indonesia’s case, the Aglink-Cosimo model was used to quantify the effects of proposed policy changes on different food product markets, with a special focus on vegetable oil. The study involved the simulation of four scenarios. The first scenario involved an ex-post simulation of a “no biodiesel” situation in Indonesia. It tested the effects of palm oil use for biofuel on domestic food prices from 2007 to 2012. Removing the biofuel use from the domestic vegetable oil demand increased vegetable oil exports proportionately leaving food demand and domestic prices unchanged.
The second scenario involved an increase in the blending requirements for biodiesel in diesel fuel from the currently achieved 1.5% to 10%, requiring approximately 1.5 billion litres of additional biodiesel by 2020, which was satisfied through a combination of significant production growth and almost complete elimination of biodiesel exports. The additional feedstock demand would be satisfied through slightly reduced exports of palm oil and a small production expansion of about 1% in 2020. No disturbance in the food sector was detected.
Scenario 3 involved an increase in domestic biodiesel production from 1.5 Mt to the currently installed annual processing capacity of 4.3 Mt, while maintaining the baseline blending ratio of 1.5%-3%. The effect on vegetable oil production was insignificant however as exports were reduced to supply the needed feedstock to the biodiesel production.
The policy options evaluated in the first three scenarios caused only marginal changes in vegetable oil prices. Changes to the domestic price of rice, wheat and coarse grains were also found to be minimal and vegetable oil consumption in Indonesia remained stable.1 The impacts on the biofuel industry were mainly through minor changes in trade patterns but without significant shifts in the world market.
The fourth scenario assessed the effects of a new Indonesian policy requiring the use of 25% domestically produced biodiesel in domestically consumed diesel fuel by 2025.2 The market impacts in this case are more significant. The domestic blending requirement implies additional production of approximately 10 Bnl of biodiesel and the elimination of biodiesel exports by 2020. The additional demand for biodiesel results in a 14% (approximately 3.5 Mt) reduction in vegetable oil exports. Domestic vegetable oil production increases 2.5% in response to the policy change, while domestic food consumption decreases approximately 1% by 2020. Due to Indonesia’s importance within the global vegetable oil market, the projected decline in exports has global market implications. It results in an increase of 8% in the world vegetable oil price and 9% in the international biodiesel price by 2020 (Figure 5.6). As a result of the price increase, global vegetable oil food consumption decreased by 1.4% (approximately 2 Mt), while global vegetable oil production increased by 1.2% (approximately 2.3 Mt) in 2020.

TAD/CA/APM/WP(2014)5/FINAL
51
Figure 5.6. Potential influence of the National Indonesian Energy Policy (KEN) on global vegetable oil markets
Source: FAO. 2014. Pilot Testing of GBEP Sustainability Indicators for Bioenergy in Indonesia – Indicator 10: Price and supply of a national food basket. Rome, Italy. Food and Agriculture Organization of the United Nations.
This price increase stimulated global competitors to produce an additional 1.4 Mt of vegetable oil. Malaysia provided approximately one-third of this total, while the balance was shared equally among Canada, China, the European Union and Brazil. The greatest decline in vegetable oil consumption as food was observed in China, where consumption decreased by approximately 800 Kt in 2020.
Application of the GBEP indicators in Indonesia demonstrated their contribution to sustainable development through comprehensive policy guidance at the national level. Illustration of the extent to which domestic policy changes can influence global food markets further highlights the need to provide guidelines for sustainable development on a global scale.
1 Additional information available at http://www.globalbioenergy.org/ 2 For all sectors including transport, industry and commerce, and electricity generation.
References European Union (2013), Official Journal of the European Union, EU No 56/2013 Regulations, Brussels:
European Union, Brussels.
0
200
400
600
800
1 000
1 200
1 400
1 600
1 800
2001 2002 2003 2004 2005 2006 2007 2008 2009 2010 2011 2012 2013 2014 2015 2016 2017 2018 2019 2020 2021 2022
USD/t
Base - Biodiesel Scenario - Biodiesel Base - Vegetable oil Scenario - Vegetable oil

TAD/CA/APM/WP(2014)5/FINAL
52
Chapter 6. Sugar
Abstract
This chapter describes the market situation and the latest set of quantitative medium-term projections for global and national sugar markets for the ten crop-year period, 2014-2023. It covers the developments expected in world and national sugar prices, production, use, trade (imports and exports) and stocks (including stock-to-use). The quantitative projections are developed using the partial equilibrium Aglink-Cosimo model of world agriculture. The chapter also includes two boxes that explain market impacts of EU sweetener production quotas and the challenges that the US sugar programme faces in removing sugar surpluses. The chapter concludes with a discussion of some main issues and uncertainties that may have an impact on the medium term outlook for sugar. These include sugar policies, and specific market developments influencing production, consumption and trade in sugar.
Market situation
After a fourth consecutive season of large global surplus (Figure 6.1), world sugar prices weakened in late 2013. Market fundamentals provide little support to prices during the remaining months of the current season (1 October 2013 to 30 September 2014). World sugar production is now expected to grow less rapidly at the beginning of the outlook period, signalling the end of the surplus phase in the world sugar cycle. But any world sugar price recovery is likely to be muted in the short term by the accumulation of large global stocks in a number of countries since the beginning of the surplus phase in 2011. Global stocks and the stocks-to-use ratio have reached a six year high at the start of the outlook period.
Figure 6.1. World sugar balance moves into a fourth consecutive production surplus
Source: International Sugar Organisation, world sugar balances.
-15
-10
-5
0
5
10
15
2001 2002 2003 2004 2005 2006 2007 2008 2009 2010 2011 2012 2013
Mt r.s.e.

TAD/CA/APM/WP(2014)5/FINAL
53
Projection highlights
• Global sugar production is projected to increase by 1.9% p.a. over the projection period and to reach nearly 216 Mt by 2023, an increase of around 36 Mt over the base period.25 Most of the increase in production will originate from countries producing sugarcane rather than sugar beet, and is attributed to higher yields rather than area expansion, even though yields will continue to flatten in the short term. Global sugar consumption is projected to increase by 1.9% p.a., much slower than in the previous decade, and will reach 211 Mt in 2023. Growth in consumption of sugar will continue to be dominated by the sugar deficit regions of Asia and Africa.
• World sugar prices are expected to continue to be volatile over the course of the outlook period but will edge moderately upward on the back of rising costs of production (Figure 6.2). Prices will remain attractive enough to enhance new investments in production capacity, notably in some exporting countries facing world market prices. The raw sugar price (Intercontinental Exchange No. 11 contract nearby futures) is projected to reach in nominal terms USD 431/t (USD 19.5 cts/lb) in 2023. The indicator world white sugar price (Euronet, Liffe futures Contract No.407, London) is projected to reach USD 519/t (USD 24 cts/lb) in nominal terms, in 2023. The white sugar premium is projected to narrow over the coming decade to reach USD 95/t. Brazil’s cost of production and the allocation of its large sugarcane crop between sugar and ethanol production remains a key determinant of world sugar prices over the outlook period. World sugar prices are expected to remain on a raised plateau and to average higher over the projection period, but to continue to decline in real terms.
Figure 6.2. World sugar prices to recover in the near term and to remain on a higher plateau
Evolution of world sugar prices in nominal (left) and real terms (right) to 2023ª
Note: Raw sugar world price, Intercontinental Exchange contract No. 11 nearby futures price Refined sugar price, No. 5. Euronext Liffe, Futures Contract No. 407, London. Real sugar prices are nominal world prices deflated by the US GDP deflator (2005=1)
Source: OECD and FAO Secretariats.
25 See the glossary for the definition of the sugar crop year. The assumptions underlying the baseline
projections can be found in the Overview, Box 1.1.
0
100
200
300
400
500
600
700
800USD/t
Raw sugar White sugar
0
100
200
300
400
500
600
700USD/t
Raw sugar White sugar
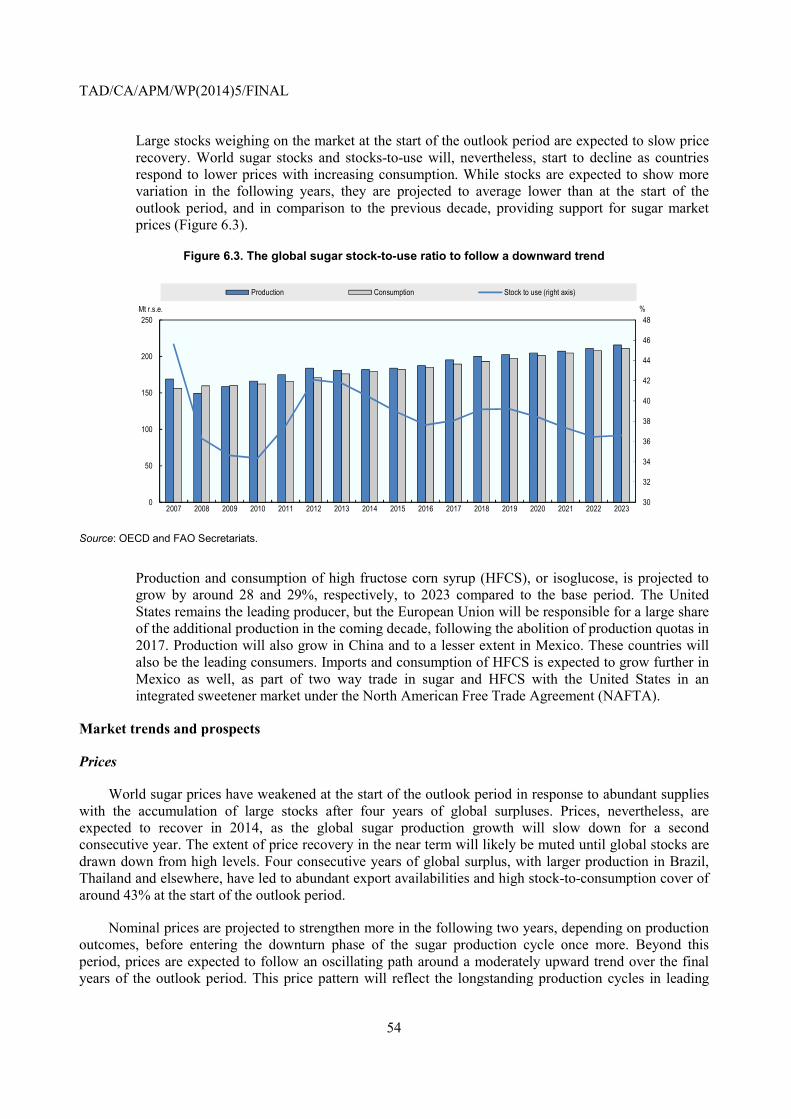
TAD/CA/APM/WP(2014)5/FINAL
54
• Large stocks weighing on the market at the start of the outlook period are expected to slow price recovery. World sugar stocks and stocks-to-use will, nevertheless, start to decline as countries respond to lower prices with increasing consumption. While stocks are expected to show more variation in the following years, they are projected to average lower than at the start of the outlook period, and in comparison to the previous decade, providing support for sugar market prices (Figure 6.3).
Figure 6.3. The global sugar stock-to-use ratio to follow a downward trend
Source: OECD and FAO Secretariats.
• Production and consumption of high fructose corn syrup (HFCS), or isoglucose, is projected to grow by around 28 and 29%, respectively, to 2023 compared to the base period. The United States remains the leading producer, but the European Union will be responsible for a large share of the additional production in the coming decade, following the abolition of production quotas in 2017. Production will also grow in China and to a lesser extent in Mexico. These countries will also be the leading consumers. Imports and consumption of HFCS is expected to grow further in Mexico as well, as part of two way trade in sugar and HFCS with the United States in an integrated sweetener market under the North American Free Trade Agreement (NAFTA).
Market trends and prospects
Prices
World sugar prices have weakened at the start of the outlook period in response to abundant supplies with the accumulation of large stocks after four years of global surpluses. Prices, nevertheless, are expected to recover in 2014, as the global sugar production growth will slow down for a second consecutive year. The extent of price recovery in the near term will likely be muted until global stocks are drawn down from high levels. Four consecutive years of global surplus, with larger production in Brazil, Thailand and elsewhere, have led to abundant export availabilities and high stock-to-consumption cover of around 43% at the start of the outlook period.
Nominal prices are projected to strengthen more in the following two years, depending on production outcomes, before entering the downturn phase of the sugar production cycle once more. Beyond this period, prices are expected to follow an oscillating path around a moderately upward trend over the final years of the outlook period. This price pattern will reflect the longstanding production cycles in leading
30
32
34
36
38
40
42
44
46
48
0
50
100
150
200
250
2007 2008 2009 2010 2011 2012 2013 2014 2015 2016 2017 2018 2019 2020 2021 2022 2023
%Mt r.s.e.
Production Consumption Stock to use (right axis)

TAD/CA/APM/WP(2014)5/FINAL
55
sugar producing countries of Asia, such as India, and its neighbours. These cycles result in periodic large switches in sugar imports and exports to the world market and cause adjustments in world prices. Sugar prices over the medium term are expected to be underpinned by stronger demand with a return to broadly-based global economic growth, rising production of ethanol from sugarcane in Brazil and elsewhere, a stronger US dollar, rising production costs and tighter stocks cover as stocks-to-use decline to 2023. Slowing yield growth and increasing constraints on the expansion of sugar production areas in many producing countries, other than perhaps Brazil, will help support higher sugar prices as demand continues to expand.
Both raw and white sugar prices are expected to follow a similar pattern over the projection period. The raw sugar price (Intercontinental Exchange No. 11 contract nearby futures) is projected in nominal terms at USD 431/t (USD 19.5 cts/lb) in 2023. The indicator world white sugar price (Euronext, Liffe Contract No.407, London) is projected to reach USD 519/t (USD 24 cts/lb), in nominal terms, in 2023. These price trends are predicated on growing demand for ethanol in Brazil as a fuel for the rapidly expanding domestic fleet of flex-fuel vehicles and other uses. Higher fuel demand arises from ethanol’s use as a petrol substitute (100% hydrous ethanol) and as a petrol complement, anhydrous ethanol, which is a blend of 20-25% of ethanol and petrol to form gasohol. The production of ethanol for domestic fuel consumption and export is projected to utilise over 63% of Brazil’s sugarcane harvest by 2023 and provide indirect support to world sugar prices. Should this additional sugarcane capacity be redirected to sugar production rather ethanol, the results would be much lower world sugar prices. Sugar production costs in Brazil, as the main supplier to the world market, will provide an effective floor to world prices in the coming decade. However, the projected depreciation of the Brazilian Real against the US dollar will imply a lower floor price, currently equivalent to a cost of production of around USD 19-20 cts/lb, when denominated in US dollar terms.
The white sugar premium (difference between the white and raw sugar price), or refining margin, is anticipated to narrow to average around USD 95/t in the coming decade, compared to USD 106/t during the base period. This lower margin reflects the expected growth in refining capacity as additional destination and toll sugar refineries come on stream in various locations around the world such in the Middle East, Africa and Asia. As these refineries process raw sugar, and increasingly high quality (VHP) raws, their higher demand will support raw sugar prices while the additional white sugar supplies they produce will put downward pressure on the refined product price and, thus, narrow the margin or premium between the two types of sugar over time.
Sugar remains one of the most volatile of all agricultural commodities. However, with abundant supplies, increased export availabilities and higher stock cover, sugar price volatility has abated to some extent in recent months. Despite this short-term development, world sugar prices are, nevertheless, expected to remain highly volatile in future years. This outcome reflects a combination of sugar market characteristics. These include reasonably steady, year-on-year consumption growth, but more variable production and its increasing concentration in regions of greater yield variation, continuing government interventions that impair market adjustment and growing links to more volatile energy markets. The concentration of production and trade in a handful of countries, including the dominant role of Brazil which is itself subject to periodic adverse weather events, is an important factor in this equation. Changes in crop prospects in Brazil are immediately reflected in world sugar prices and contribute to enhanced sugar price volatility.
Production and use of sugar
The sugar sector is capital intensive with a very high level of fixed costs. There has been a slowdown in the rate of expansion in primary processing capacity in recent years which continued in 2013. Despite some slowdown in production growth at the beginning of the outlook period, returns to sugar production

TAD/CA/APM/WP(2014)5/FINAL
56
are expected to remain sufficiently remunerative, on average, to encourage further investment and increased production over the coming decade. Although some expansion of sugar crop areas is expected in Brazil and a few other countries, additional production will come from higher yields. It is projected that sugarcane will account for virtually all of the additional sugar production and represent nearly 86% of sugar output in 2023, with only minimal additional contribution from sugar beets over the same period. Some expansion of sugar beet production is anticipated in the Russian Federation and the European Union following quota removal in 2017. In parallel, the share of sugarcane allocated to ethanol will continue to follow an upward trend and in 2023, 28% of sugarcane will be allocated to ethanol production (only 15% during the base period). The share of sugar beet allocated to ethanol (5%) will decrease slightly.
Figure 6.4. Most of the additional ethanol and sugar increases will come from sugarcane production
Source: OECD and FAO Secretariats
World sugar production is projected to grow by 1.9% p.a. to reach 216 Mt by 2023, up nearly 36 Mt, or some 20%, above the average for the base period (2011-13). The developing countries share of global sugar production is projected at 79% in 2023 compared to just 21% in developed countries. In the developing world, the leading region is Latin America and Caribbean which accounts for 34% of global sugar production during the base period, where production is to increase by 22% by 2023. Sugar production in the Asia and Pacific region is expected to increase by 2.4% p.a. to 2023. This growth is driven mainly by higher output in China and Thailand. Finally, sugar output in Africa is projected to increase by 42% to the end of 2023 as a result of expansion in production in Sub-Saharan countries and Egypt. Higher internal demand for sugar will provide the incentive for an expansion of the sector in Africa. Trade opportunities offered under the Economic Partnership Agreements (EPAs) and the Everything But Arms (EBA) initiatives of the European Union are foreseen to reduce following the abolition of the EU quota in 2017. Regarding the developed countries, the European Union is the leading sugar producer with sugar output expected to increase by 1.3% p.a. to 2023, followed by North America where production grows by 0.8% p.a. and Oceania where production expands by 1.2% p.a. over the coming decade.
0
500
1 000
1 500
2 000
2 500
2011-13 2023 2011-13 2023Sugarbeet Sugarbeet Sugarcane Sugarcane
Mt
Sugar Biofuel

TAD/CA/APM/WP(2014)5/FINAL
57
Figure 6.5. Much higher growth in sugar demand is expected in developing countries: developed (left) and developing (right)
Source: OECD and FAO Secretariats.
World sugar demand will be influenced by the recovery in global economic growth and the slightly slower growth in world population over the coming decade. Global consumption of sugar is projected to grow at around 1.9% p.a., slightly slower than in the previous decade, to reach 211 Mt in 2023. Developing countries as a group, with their dominant share of world sugar use, will continue to display the fastest growth in demand, driven by rising incomes, urbanisation and growing populations, although with considerable variation between countries (Figure 6.5). In contrast, sugar consumption is projected to show little or no growth in many of the developed countries consistent with their status as mature or saturated sugar markets. Slowly growing and ageing populations along with increased health consciousness and dietary changes are factors that are impeding sugar use in these countries. Compared to the base period, the sugar deficit regions of Asia and Pacific and Africa will account for most of the expansion in use to 2023 which is projected to increase faster than the world average (32% and 47% respectively). In the former region, it is expected that China and India will experienced the biggest increase in sugar consumption, but the growth in terms of per capita consumption is expected to be largest in China, Indonesia, Saudi Arabia and Thailand. Africa should see the highest growth in world consumption, but Sub-Saharan African countries will still face the lowest per capita consumption at the end of the projection period.
Brazil is the world’s leading sugar producer following the rapid expansion of the industry in the 1990s as a result of relatively low production costs and vast land resources suitable for increased sugar production. The last few years have witnessed a slowdown in the rate of expansion of the industry due to a combination of factors including adverse weather, the industry’s limited access to credit and government fuel policy favouring petrol consumption. Adding to industry difficulties have been higher production costs in the short term associated with the mechanisation of harvesting, and rising labour and transport costs. These factors have lowered returns, reduced incentives for investment in the sector and contributed to slower growth in sugarcane output and mill capacity. However, with restored profitability anticipated in coming years, the area under sugar cane is expected to expand and to grow at an average of 1.3% p.a. to 2023. In addition to their considerable supply potential with favourable production advantages, Brazil’s sugarcane producers have also benefited over many years from two competing outlets for their cane with strong demand from both sugar and ethanol productions, the latter as a domestic fuel. Ethanol’s increasingly dominant share of the growing sugar cane harvest, expanding from around 52% in 2013 to
0
40
80
120
160
200
2011-13 2023
Mt
Other OECD United States European Union
0
40
80
120
160
200
2011-13 2023
Mt
Other non OECD AfricaLatin America and Caribbean Asia and Pacific

TAD/CA/APM/WP(2014)5/FINAL
58
over 63% by the close of the outlook period, will be a key factor influencing both global sugar production and price prospects to 2023.
In 2014, sugar production in Brazil is expected to be marginally lower than in the previous year with more of the reduced sugarcane crop going to ethanol production. However, increased sugarcane production is expected in the following years, leading to higher sugar (and ethanol) output aided in part by strengthening sugar prices in domestic currency terms, because the Brazilian Real is expected to weaken further against the US dollar over the coming decade. This will boost the industry’s competiveness and effectively lower the world’s floor price for sugar. Brazil’s sugar production is projected to grow at an average of around 1.7% p.a. in the coming decade to reach 49 Mt by 2023. The projected growth in sugar output will be faster in later years than in the near term but slower overall than in the last decade. Consumption of sugar is projected to continue to grow strongly, by around 1.8% p.a., to reach nearly 16.3 Mt in the same period (Figure 6.6).
Figure 6.6. Sugar production and exports to increase in Brazil as ethanol output expands
Source: OECD and FAO Secretariats.
India as the world’s second largest sugar producer and the leading sugar consumer exerts an important influence on the world sugar market and global prices. Sugar production in the past has followed a cyclical pattern with periods of surplus followed by periods of deficit. This was the result of contrary movements between administered sugarcane and market determined sugar prices which could lead to payment arrears by mills. This production cycle is expected to continue over the projection period, if somewhat less pronounced, as initiatives to deregulate prices by the government have so far be limited to a two-year abolition of the levy sugar mechanism and system of quota release orders. High sugarcane prices at the beginning of the outlook period and limited competition from alternative crops have helped to maintain cane areas and slowing the fall in sugar production despite mounting payment arrears by mills. Lower sugar production is nevertheless anticipated in the near term period. India’s production, although variable, is projected to grow at 2.2% p.a., on average, to reach about 31 Mt in 2023. Less variable and relatively strong growth in sugar demand is expected over the coming decade. Consumption is projected to rise to more than 32 Mt by 2023. Depending on the phase of the production cycle, these supply and demand trends are expected to result in India becoming a significant sugar importer in some years and a small, periodic exporter in other years of the coming decade.
0
10
20
30
40
50
60
0
10
20
30
40
50
60
2007 2008 2009 2010 2011 2012 2013 2014 2015 2016 2017 2018 2019 2020 2021 2022 2023
bln LMt r.s.e.
Production Exports Bio-ethanol production (right axis)

TAD/CA/APM/WP(2014)5/FINAL
59
Thailand as the world’s second largest exporter has continued to produce large sugarcane crops following the surge in production in 2011. Sugar production at the start of the outlook period is projected to remain high but with the pace of production growth moderating in the first few years, as producers respond to weaker world prices. Faster production increases are expected in following years, and Thailand’s sugar production will reach around 13.5 Mt by the close of the projection period which results in an average growth rate of 3.1% p.a. over the outlook period. This represents an additional 3.2 Mt over and above the average in the base period, with producers benefitting from higher prices in domestic currency terms as the Thai Baht weakens against the US dollar. Sugar consumption with a continuation of the longstanding domestic pricing arrangements will grow by 2.9% p.a. to reach 4.1 Mt in 2023.
In China, the Far East Asia region’s largest producer, it is expected that the outlook period will commence with only a slightly increase in production, because low sugar prices will discourage farmers to invest in their plantations. Going forward, with growth in cropping area and yields, sugar production from mainly sugarcane and a smaller crop of sugar beets is projected to increase at 2.6% p.a. but to struggle to keep up with demand growth. With sugar consumption significantly below the world’s average, it is expected that China’s sugar demand will continue to grow rapidly for both direct and indirect uses, but per capita consumption will stay low compared to other countries assuming that no radical changes in consumer food preferences take place over the coming decade. As a result, the stock-to-use ratio will decrease slowly to reach 11.6% in 2023.
Figure 6.7. China’s sugar stock-to-use ratio to decline
Source: OECD and FAO Secretariats
In the developed countries, changes are expected to be less pronounced, and growth in production and consumption (1.4% and 0.5% p.a. respectively) is projected to be much lower than the growth from world levels over the forecast period. The growth in the OECD area will continue to shrink over the next decade and will account for about 20% of global production (down from 22% in the base period) and 22% of global consumption (down from 27% in the base period). Since its sugar reform in 2006, the European Union has turned from being a net exporter of sugar into a net importer. On 1 October 2017, the European Union will abolish production quotas for sugar beet and HFCS (Box 6.1). Based on the underlying assumptions of this Outlook, especially regarding the oil price and exchange rate, it is expected that after a rather steady production level in the short period, the removal of the quota will support EU sugar beet production. Both low cost and less efficient producers will expand their output at least at the beginning as
0
5
10
15
20
25
30
35
40
45
0
5
10
15
20
25
2007 2008 2009 2010 2011 2012 2013 2014 2015 2016 2017 2018 2019 2020 2021 2022 2023
%Mt r.s.e.
Production Consumption Imports Stock to use (right axis)

TAD/CA/APM/WP(2014)5/FINAL
60
the additional volumes will be used to produce sugar, a product more profitable than sugar beet used as feedstock for ethanol. On the other hand, the removal of HFCS quota will also create additional production and, even if there is a lot of uncertainty around this expansion, it will likely contribute to a large proportion of the internal sweetener demand as a lower priced product. According to the projections, sweetener consumption is expected to increase by about 0.5 Mt toward 2023 compared to the base period, with 11.2% attributed to HFCS, up from 3.5% before the removal of the quota. With this reform, domestic prices are projected to be significantly lower and closer to world price levels.
The sugar market of the United States is another market heavily influenced by the policy environment (Box 6.2). After a production record in 2012 and the need to trigger actions to maintain US prices above support levels, production is projected to be relatively stable at the start of the projections. It is expected that low prices will again result in some purchases by the Commodity Credit Corporation (CCC) of the United States Department for Agriculture (USDA) for resale to ethanol in 2013 and over the outlook period in 2014 and 2018. The low sugar prices will also affect Mexico, which forms with the United States a fully integrated market under NAFTA. Since 2009, the tendency was for food manufacturers in Mexico to substitute domestically produced sugar by lower cost imported HFCS from the United States, but recent lower prices have resulted in a reverse situation. The consumption of sugary drinks has placed Mexico on top of the global list of countries with the biggest weight problems, overtaking the United States. In order to address obesity concerns in Mexico, a tax of 8% per litre was imposed on soft drinks in 2014 but per capita consumption of sweeteners is expected to see only a little decline on the forecast period. It is forecasted that the share of HFCS in Mexico sweetener consumption will resume again at the start of the outlook period, to accelerate toward the end of the period and to reach a level of penetration of the sweetener market not far from the situation in the United States. The later, however, will see a fairly steady growth ratio over the medium term. Beginning 2019, production in both countries is forecasted to increase again, supported by higher prices.

TAD/CA/APM/WP(2014)5/FINAL
61
Box 6.1. Some market impacts of EU sweetener production quotas
A system of production quotas has operated in the EU sugar market for many years, dating back to the origins of the sugar regime in 1968, in order to limit excess production in response to high support prices. These quotas govern how much sugar domestic producers can sell in the internal market. As part of the fundamental sugar policy reforms initiated in November 2005, administered prices were significantly reduced (although market prices did not follow due to production shortfalls) and the production quota system was simplified and sugar producers were encouraged to renounce a quota of 6 Mt [white sugar value (wv)] by 2010. The quota is currently limited to a total production in the EU of 14.5 Mt [raw sugar equivalent (rse)] which is allocated across member states. Out-of-quota production of sugar is what is produced in excess of the quota. The level of this production varies from year to year and depends mainly on growing conditions and the level of yields. The sugar made from out-of-quota production cannot (normally) be sold for food use in the European Union and must be sold for industrial uses (chemicals or biofuels) or else exported within annual limits.
Production quotas also apply to isoglucose (HFCS) in the Community, which is limited to 5% of the total EU sugar quota (0.665 Mt), effectively containing production and access to this sweetener. Isoglucose competes with sugar in mainly beverage and food preparations. EU subsidised sugar exports are subject to quantity (and value) limits of around 1.37 Mt (wv) under the GATT/WTO Uruguay Round agreement. As a consequence of the reform and with domestic sugar consumption reasonably stable at around 18 Mt p.a., the European Union has become a structural sugar deficit region requiring the importation of 3.5-4 Mt (wv) p.a. to satisfy its internal needs. As a result, the European Union has switched from being a large exporter of white sugar to the world’s largest importer of mainly raw sugar. The bulk of imports enter the European Union under preferential agreements while others are subject to import duties. These large imports can have a significant impact on the world sugar market.
Under the latest Common Agricultural Policy (CAP) reforms of 2013 a new EU-wide sugar agreement will enter into force in 2017. This will lead the abolition of sugar and isoglucose quotas and minimum beet prices, but with existing high import barriers remaining in place. The termination of quotas after the 2016 season is reflected in the sugar baseline for the EU. To assess the sugar market impacts of eliminating the production quotas, a counterfactual scenario is performed whereby the existing quotas for sugar and isoglucose (HFCS) are not abolished before the end of the projection period in 2023. The results of this scenario are compared with the EU sugar baseline in Table 6.1 below. This table shows, inter alia, the percentage differences of the continuing quota(s) scenario up to 2023 and with the no-quota(s) baseline projection.
The scenario results suggest that the continuation of quotas would, first and foremost, reduce EU domestic sugar production from 2017 onwards by nearly 11% by the end of the projection period, when compared to the baseline. This reduction would presumably be felt most by the more efficient producers and possibly with some additional production accruing to the less efficient and higher cost sugar producers within the European Union. Consumption of sugar appears to be slightly lower with production quotas, due to an increase in domestic sugar prices, as supplies of isoglucose, which are expected to expand strongly in a no-quota environment after 2017 and competing for a larger share of the sugar market, are restricted by quota. Domestic sugar prices will be higher than in the baseline and world levels with a continuation of quota and existing import barriers. This is because the significant shortfall between EU production and consumption under this scenario would need to be met by imports. Imports would increase by around 52% by the end of 2023, when compared with the baseline of no-quotas. This would potentially be beneficial to the EU‘s preferential suppliers who through the Everything But Arms (EBA) Initiative and the Economic Partnership Agreements (EPAs) of the Cotonou Agreement have first call in filling this larger import requirement. The EU refineries would see greater access to cane supplies which would be supportive of sugar production. While most imports would likely come from preferential suppliers duty free, some of these would likely be subject to import duties. These duties would have the effect of raising the average level of domestic prices above the world level. Furthermore, with the application of subsidised export limits in the production quota situation, EU exports would be lower, declining by over 36%, when compared to baseline value for 2023.

TAD/CA/APM/WP(2014)5/FINAL
62
Table 6.1. EU sugar market effects of continuing production quotas from 2013 to 2023
(Comparison with baseline values)
2013 2016 2023 2023 relative to 2013
Quota Scenario
Baseline Difference from
Baseline (%)
Quota Scenario
(%)
Baseline (%)
Suga
r bee
t
Sugar beet area ('000 ha) 1 592 1 571 1 538 1 580 2.72 -3.37 -0.75 Sugar beet yield (t/ha) 69 71 75 75 -0.45 8.95 8.46
Sugar beet production ('000 t) 110 218
111 151 116 028 118 646 2.26 5.27 7.65
..Sugar beet for biofuel ('000 t) 14 181 16 942 21 033 13 137 -37.54 48.32 -7.36 Sugar beet price (€/t) 31 31 30 26 -14.25 -2.70 -16.56 ..Sugar beet out-of quota price (€/t) 17 18 21 26 23.13 24.51 53.31 ..Sugar beet support price (€/t) 26 26 26 0 -100.00 0.00 -100.00
Whi
te s
ugar
(r.s
.e)
Sugar production ('000 t) 17 068 16 742 16 885 18 757 11.08 -1.07 9.90 ..Sugar quota ('000 t) 14 496 14 496 14 496 0 -100.00 0.00 -100.00 Sweetener total use* ('000 t) 20 401 19 687 20 441 21 086 3.16 0.20 3.36 ..Sugar food and industry use ('000 t) 19 694 19 004 19 748 18 726 -5.17 0.27 -4.91 Sugar exports ('000 t) 2 076 1 960 1 716 2 332 35.92 -17.35 12.34 Sugar imports ('000 t) 4 413 3 760 4 767 2 313 -51.48 8.02 -47.59 ..Sugar imports, EBA & EPA ('000 t) 2 080 2 128 3 388 1 390 -58.97 62.91 -33.16 ..Share of white sugar in total imports (%) 32 36 38 38 0.03 18.75 18.78 Sugar total stocks ('000 t) 2 884 1 596 1 856 1 504 -18.97 -35.63 -47.84 White sugar producer price (€/t) 624 624 585 426 -27.13 -6.23 -31.67 ..White sugar reference price (€/t) 404 404 404 0 -100.00 0.00 -100.00 White sugar world price (€/t) 355 376 401 394 -1.93 13.19 11.01
Isog
luco
se
Isoglucose production ('000 t) 690 690 690 2 355 237.26 0.00 237.26 Isoglucose use ('000 t) 650 627 638 2 171 240.42 -1.94 233.81 ..Share of isoglucose in Sweetener use (%) 3.5 3.5 3.4 11.2 230.00 -2.13 222.96 Isoglucose exports ('000 t) 60 80 91 155 84.60 54.95 186.04 Isoglucose imports ('000 t) 20 16 39 16 -64.60 101.72 -28.59 Isoglucose world price (€/t) 333 354 395 395 -1.28 20.77 19.23
Note: including white sugar and isoglucose.
Source: OECD and FAO Secretariats.
With the no-quota situation in the European Union, all sugar beet production is potentially available for higher value domestic sugar use or for export as a sweetener, such that secondary uses of sugar beets become less attractive including for ethanol production. With quotas remaining in place throughout the entire projection period, and continuing over-quota production, sugar beet use for ethanol production and other industrial purposes will be higher. Finally, the continuation of production quotas after 2017 would have the effect of raising world prices by 2% in 2023, when compared to baseline value as import demand in the European Union would increase significantly. In terms of isoglucose (HFCS), the prolongation of production quotas beyond 2017 to 2023 would lower production and consumption of this caloric sweetener by over 237% and 240%, respectively, by the end of 2023. In general, the reinstatement of production quotas would appear to constrain the potential of the EU sugar industry to expand globally (and nationally within member states with a comparative cost advantage), and to thus impair the efficiency and prospects of the sector.1
1. rse = raw sugar equivalent; wv = white sugar value, conversion factor raw to white of 0.92.
TAD/CA/APM/WP(2014)5/FINAL
63
Box 6.2. The US sugar programme under pressure to remove surpluses
The United States is one of the world’s largest sugar producers, with production shared between sugarcane (42%) and sugar beets (58%), and is also a major global sugar importer. The US sugar market remains heavily influenced by government policies. In essence, the US sugar programme involves price support via the loan programme and supply control mechanisms, which include domestic marketing allotments, import restrictions and sales to bioenergy producers to manage the sugar market. One of the main selling points of the US sugar programme, particularly in the context of the recently completed 2014 Farm Bill negotiations, was that it operates at a zero costs to the US taxpayer to the extent practicable. However, with unrestricted sweetener trade with Mexico as sanctioned under the North American Free Trade Agreement (NAFTA), it has become increasingly difficult to control supply as demonstrated by the need in 2012 to reduce surplus sugar.
The US government, through the US Department of Agriculture (USDA) and its Commodity Credit Corporation (CCC), implements a price support programme for sugar underpinned by a non-recourse loan rates scheme which allows the processor to repay the loan in full with sugar that was pledged as collateral for the loan when the price is low enough. The USDA operates the programme by seeking domestic prices high enough so that the likelihood of loan forfeitures to the CCC is minimized. Those prices have been above comparable world levels over the course of the sugar programme. Under World Trade Organization (WTO) obligations, the United States has a minimum import quota (TRQ) for raw and refined sugar of 1.14 Mt which is allocated between a wide-range of trading countries. The margin between the internal US price and the (usually lower) world price determines the attractiveness of shipping sugar from TRQ countries compared to shipping their sugar elsewhere. Under NAFTA, Mexico and the United States have formed a single integrated sugar market, with Mexico having gained unlimited, duty-free, access to the usually higher priced US market since 2008. The available amount of Mexican sugar export is influenced by domestic sugar production and the quantity of high fructose corn syrup (HFCS) consumed in Mexico which is mainly imported from the United States.
For many years prior to 2012, supplies of sugar to the US market have generally been tight, maintaining domestic prices well above support levels and making it unnecessary to implement various provisions of the US sugar programme designed to safeguard the domestic market from being over supplied. To help attain an adequate supply at reasonable prices, the USDA can increase TRQ access in addition to the United States’ minimum WTO commitments, especially after 1 April, or six months into the October/September fiscal year. However, the situation changed fundamentally in the 2012 season with bumper harvests of sugar in both the United States and Mexico, resulting in record shipments from Mexico of 1.9 Mt and lifting the ending stocks to use ratio in the region to 26%. With US domestic prices in 2013, at or near loan levels, there was a high risk of sugar loan forfeitures. Under the legislation, the USDA is required to operate the sugar programme at the lowest possible cost and pre-empt forfeitures of sugar under loans by whatever means, including the purchase of surplus sugar for conversion to ethanol under the Feedstock Flexibility Program (FFP) provisions of the US Food, Conservation and Energy Act of 2008.
Despite a decline in TRQ imports in 2012, as the margin between the world and internal prices became unprofitable for many exporting countries, record Mexican sugar shipments pushed US sugar prices below loan rates for many sugar producing regions and required the USDA to take action. The CCC of USDA took ten separate measures in 2013 to manage the large sugar surplus in the domestic market. The first action by the CCC was to increase temporarily sugar refiner’s limits for participation in the Refined Sugar Re-export Program (RSRP). To benefit from the RSRP scheme, refiners had to promise to surrender or forego RSRP imports of at least 2.5 times the amount of sugar awarded by USDA. This scheme implied that more exports would be sourced from domestic sugar, helping to clear some of the sugar surplus from the market, albeit with a delay and at a lower cost than the FFP facility. Under the FFP, USDA pays sugar producers the loan rate for their sugar production while selling it to ethanol factories at its ethanol value.
The CCC of USDA announced two invitations for the FFP measure in 2013. Under the first FFP action, results were modest with only 7 118 tonnes of forfeited sugar purchased and subsequently sold to an ethanol producer. According to USDA, the CCC paid USD 25.2 cts/lb for the beet sugar and received USD 6 cts/lb for its resale. The second FFP action was much larger with some 136 026 tonnes purchased at an average of USD 24.2 cts/lb but with a resale price for ethanol averaging only USD 4.6 cts/lb. In total, about 21.7% of CCC interventions were for FFP measures. Such interventions are expected to be repeated in some of the future years of the Outlook when forfeiture trigger levels are reached.

TAD/CA/APM/WP(2014)5/FINAL
64
Trade
Over the coming decade, developments in some of the sugar producing countries known as deficit countries will provide a change in the pattern of global importing sugar markets. This is the case for the European Union, where sugar and isoglucose quotas will be abolished in 2017. From this date onward, more sugar beet will be devoted to sugar production for human consumption, which is more profitable than ethanol production, and this will affect the quantity of EU imports. The European Union is expected to lose its position as the world largest sugar importer with imports projected to regress by 1.9 Mt in 2023 compared with the base period. In the Russian Federation too, a decrease in sugar imports is anticipated over the forecast period as the growth in sugar production, combined with a decline in population, should help to slow the deficit.
Figure 6.8. Contrasting trends among major sugar importers
Source: OECD and FAO Secretariats.
Asia and Pacific and Africa will see the strongest growth in sugar demand, driving the growth in imports for those two regions. At the beginning of the outlook period, China and Indonesia are, after the European Union, the leading importers. However, over the forecast period, Indonesia is expected to turn into the leading sugar importer. China, where a significant decrease in stocks will contribute to a decline of about 920 kt of imports, is anticipated to become the second largest sugar importer, followed by the United States. The latter will recover from recent low world prices, but sugar supplies should stay relatively tight resulting in a continuation of TRQ imports from third countries as well as from Mexico as part of a fully integrated market under NAFTA. An average level of 3.2 Mt of imports is expected over the forecast period, which will make the United States the third largest importer worldwide in 2023.
Sugar exports should remain highly concentrated. It is expected that Brazil will keep its position as the leading exporter. However, despite the fact that the sugar export volumes will continue to be related to the evolution of world sugar prices, they will become increasingly dependent on the development of the domestic and export markets for ethanol. After a slowdown at the beginning of the outlook period due to lower production growth, exports are anticipated to further expand, with Brazil accounting for about 48% of world trade in 2023, up from 45% during the base period. Good prospects are considered for the world’s second largest exporter, Thailand, which will continue to invest in new irrigations schemes and technologies to improve sugarcane output, because the current price advantage over other crops such as cassava is anticipated to remain. This will result in an increase of export availabilities of 2.4 Mt over the
0
1
2
3
4
5
6
European Union United States Korea Japan China Indonesia Malaysia India
Mt r.s.e.
2011-13 2023
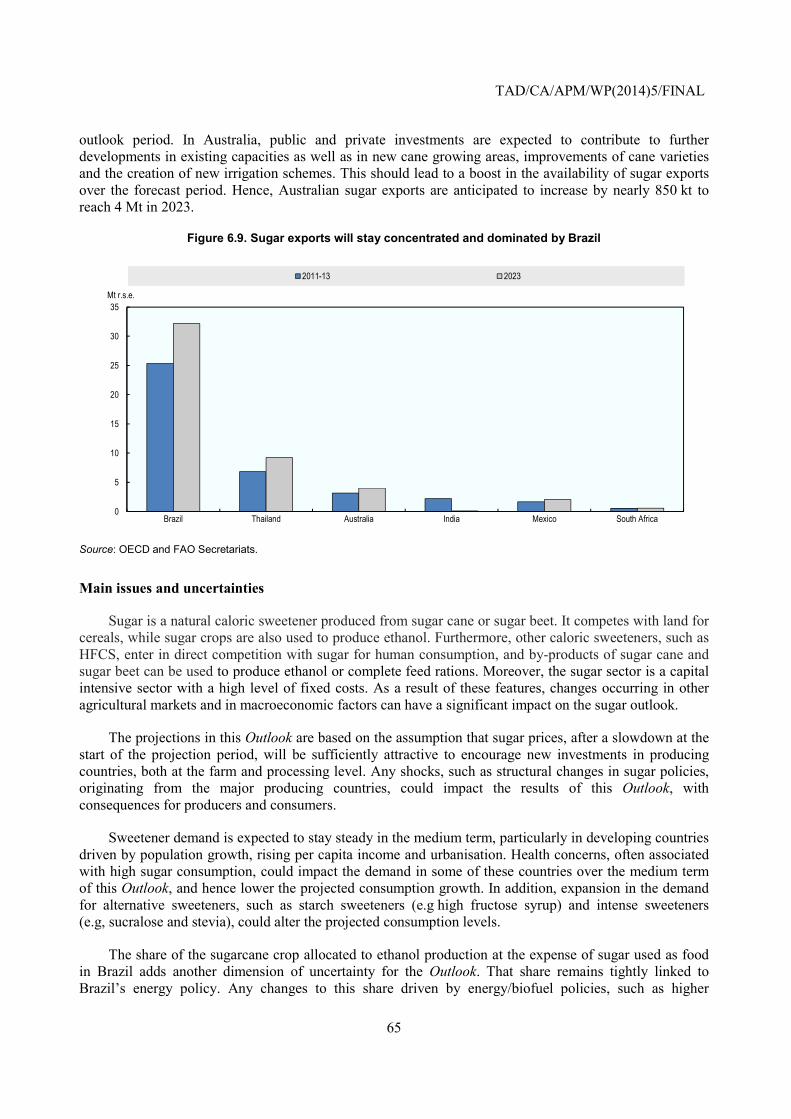
TAD/CA/APM/WP(2014)5/FINAL
65
outlook period. In Australia, public and private investments are expected to contribute to further developments in existing capacities as well as in new cane growing areas, improvements of cane varieties and the creation of new irrigation schemes. This should lead to a boost in the availability of sugar exports over the forecast period. Hence, Australian sugar exports are anticipated to increase by nearly 850 kt to reach 4 Mt in 2023.
Figure 6.9. Sugar exports will stay concentrated and dominated by Brazil
Source: OECD and FAO Secretariats.
Main issues and uncertainties
Sugar is a natural caloric sweetener produced from sugar cane or sugar beet. It competes with land for cereals, while sugar crops are also used to produce ethanol. Furthermore, other caloric sweeteners, such as HFCS, enter in direct competition with sugar for human consumption, and by-products of sugar cane and sugar beet can be used to produce ethanol or complete feed rations. Moreover, the sugar sector is a capital intensive sector with a high level of fixed costs. As a result of these features, changes occurring in other agricultural markets and in macroeconomic factors can have a significant impact on the sugar outlook.
The projections in this Outlook are based on the assumption that sugar prices, after a slowdown at the start of the projection period, will be sufficiently attractive to encourage new investments in producing countries, both at the farm and processing level. Any shocks, such as structural changes in sugar policies, originating from the major producing countries, could impact the results of this Outlook, with consequences for producers and consumers.
Sweetener demand is expected to stay steady in the medium term, particularly in developing countries driven by population growth, rising per capita income and urbanisation. Health concerns, often associated with high sugar consumption, could impact the demand in some of these countries over the medium term of this Outlook, and hence lower the projected consumption growth. In addition, expansion in the demand for alternative sweeteners, such as starch sweeteners (e.g high fructose syrup) and intense sweeteners (e.g, sucralose and stevia), could alter the projected consumption levels.
The share of the sugarcane crop allocated to ethanol production at the expense of sugar used as food in Brazil adds another dimension of uncertainty for the Outlook. That share remains tightly linked to Brazil’s energy policy. Any changes to this share driven by energy/biofuel policies, such as higher
0
5
10
15
20
25
30
35
Brazil Thailand Australia India Mexico South Africa
Mt r.s.e.
2011-13 2023

TAD/CA/APM/WP(2014)5/FINAL
66
blending rates in Brazil and/or new biofuel mandates in the United States, could affect sugar availabilities in Brazil.
The world sugar market and prices are largely influenced by government policies; the sugar market remains one of the most protected markets. It is dominated by border measures, including high import tariffs and price supports. Indirect support, through assistance to the biofuel sector, also provides some price support. Reforms have taken place in some producing countries, but more efforts are required to create a more transparent and efficient global sugar market. Reforms of the sugar market in India have been less ambitious than expected, while the new US Farm Act leaves much of the existing provisions in place. All these policies influence the sugar outlook, and any changes will result in a new set of projections.

TAD/CA/APM/WP(2014)5/FINAL
67
Chapter 7. Meat
Abstract
This chapter describes the market situation and the latest set of quantitative medium-term projections for global and national meat markets for the ten-year period, 2014-2023. It covers the developments expected in world and national meat production, use, trade and stocks. The quantitative projections are developed with the aid of the partial equilibrium Aglink-Cosimo model of world agriculture. The chapter also includes three boxes that describe the income-meat demand relationship across countries, the driving factors of India’s rise as the top bovine meat exporter and the importance of closing efficiency gaps in meat production. The chapter concludes with a discussion of some main issues and uncertainties that may have an impact on the medium term outlook for meat. These include the uncertainties surrounding herd rebuilding in North America, animal disease outbreaks and the increasing trend in China to import meat.
Market situation
FAOs Meat Price Index, a measure of global meat prices, has remained at historically high levels since 2011. It currently stands some 90% higher than ten years earlier, reflecting the impact of higher feed costs, which more than doubled over the decade. Though a rapid fall of feed costs in 2013 has set the stage for renewed profitability in the meat sector, supply growth is hampered by tighter sanitary and environmental regulations, and sustained costs of energy, water and labour. The structure of world meat trade is evolving due to shifts in the size and location of demand. Market growth is underpinned by higher demand from emerging regions, particularly from rising incomes, population growth and urbanisation, while the location of demand is reshaped by falling or stagnant demand in many OECD countries.
Global meat production rose just over 1% in 2013, led by growth in pig and sheep meat, but slower growth in bovine meat and poultry. Growth in poultry meat production, at 0.5% was the slowest in at least the last twenty years. It reflects not only the impact of high feed prices which persisted in the first half of the year, but also falling production in China, following consumer reaction to its H7N9 avian influenza outbreak. The United States and Canada have been coping with an outbreak of the Porcine Epidemic Diarrhoea virus (PEDv), which has also reduced pigmeat supplies.
Meat trade has stagnated in the past three years at around 30 Mt. This outcome stems from higher prices that limit demand growth in emerging countries, many of which are net importers of various meat products. In 2013, higher imports of bovine and sheep meats were somewhat offset by lower pig and poultry meat imports - particularly from the Russian Federation, as higher domestic production lowered import demand from this typically large meat importer.
A number of current issues, enumerated below, may impact the medium-term market outlook. The first of these is the situation in the North American, and particularly the bovine, meat market. A confluence of factors, such as higher productivity, higher feed costs, disease related issues and the occurrences of droughts, resulted in the North American beef cow herd declining since 2005. Estimates of the United States cow herd in January 2014 indicate the smallest inventory in decades. The recent decline in feed costs, combined with short supplies, has pushed US fed beef prices to record levels, and a herd rebuilding

TAD/CA/APM/WP(2014)5/FINAL
68
process appears to have started. Conditions in the United States have a significant impact on global bovine markets, and particularly on the Pacific market where it trades. A second issue is linked to the impact disease outbreaks in major meat markets, in particular PEDv in North America and avian influenza in Asia will have in the next years. The third issue relates to the duration of the sharp increase in net meat imports from China. Though most of increased trade can be attributed to the avian influenza H7N9 outbreak in the case of poultry meat, imports of bovine meat, pig meat and sheep meat have all increased in recent years, pointing to a trend increase that would have important implications for global meat markets.
Projection highlights
• Nominal meat prices are expected to remain high throughout the outlook period. Feed costs remain above historic norms and rising costs related to other inputs such as energy, labour, water and land will also support higher prices. The price of bovine meat in the Pacific Market, which is currently at historic record levels, will rise to around USD 4 800/t by 2016 before falling under increased supplies. Pigmeat prices will oscillate up to the USD 2 000/t level over the projection period, while poultry prices follow feed costs closely over the outlook period, reaching USD 1 550/t by 2023. Sheepmeat prices which fell sharply from high levels in 2013, should resume rising over the medium term in line with the prices of other competing meats (Figure 7.1a). In real terms, however, meat prices have already, or will soon, peak, and will decline moderately by 2023 (Figure 7.1b).
• Global meat production is projected to rise by 1.6% p.a. over the Outlook period, down from 2.3% p.a. in the last ten years. Driven largely by demand preferences, poultry meat will become the largest meat sector by 2020. Over the projection period poultry meat production will capture almost half of the increase in global meat production by 2023, compared to the base period. The sheep meat sector will also exhibit strong growth, recovering from slow growth during the past decade.
• Global meat consumption per capita is expected to reach 36.3 kg in retail weight by 2023, an increase of 2.4 kg compared to the base period. This additional consumption will mostly (72%) consist of poultry, followed by pig, sheep and bovine meat. Consumption growth in developed countries will be slower than that of the developing countries, but in absolute terms, at 69 kg per capita, will remain more than double that in developing countries by the end of the projection period.
• Meat trade is projected to grow slower than in the past decade and in global terms just over 10.6% of meat output will be traded. The most significant import demand growth originates from Asia, which represents the greatest share of additional imports for all meat types.

TAD/CA/APM/WP(2014)5/FINAL
69
Figure 7.1a. World prices in nominal terms, USD/c.w.e or r.t.c1
Figure 7.1b. World prices in real terms, USD/c.w.e or r.t.c1, 2
1) US Choice steers, 1 100-1 300 lb dressed weight, Nebraska. New Zealand lamb schedule price dressed weight, all grade average. US Barrows and gilts, No. 1-3, 230-250 lb dressed weight, Iowa/South Minnesota. Brazil average chicken producer price ready to cook.
2) c.w.e. is carcass weight equivalent, r.t.c is ready to cook equivalent.
Source: OECD and FAO Secretariats.
Market trends and prospects
Prices
Nominal beef prices in the Pacific market are expected to remain firm in the short term, as herd rebuilding constrains the supply response from the United States, the biggest beef producer in the world. The expected rise in Pacific prices will open up a higher margin with Atlantic prices as the latter pasture based market has sustained larger supplies in recent years. Sheep meat prices reached record levels in 2012
0
500
1 000
1 500
2 000
2 500
1993 1998 2003 2008 2013 2018 2023
USD/t
Pork (nominal) Poultry (nominal)
0
1 000
2 000
3 000
4 000
5 000
6 000
1993 1998 2003 2008 2013 2018 2023
USD/t
Beef (nominal) Sheep (nominal)
0
500
1 000
1 500
2 000
2 500
1993 1998 2003 2008 2013 2018 2023
USD/t
Pork (real) Poultry (real)
0
500
1 000
1 500
2 000
2 500
3 000
3 500
4 000
4 500
5 000
1993 1998 2003 2008 2013 2018 2023
USD/t
Beef (real) Sheep (real)

TAD/CA/APM/WP(2014)5/FINAL
70
as competition with dairy for pasture in Australia and New Zealand in recent years reduced exports. A strong supply response from those countries brought prices down sharply in 2013. They are projected to rise again over the medium term to a level of around USD 4 750/t c.w.e., underpinned by firm import demand from China and the European Union. Poultry and pig production relies on more intensive use of feed grains, with the result that prices demonstrate a closer correlation to feed prices. The prices of both poultry and pigmeat are expected to decline in the short term in line with feed costs, then rise to USD 1 550/t c.w.e. and USD 1 980/t c.w.e., respectively, by 2023 as feed costs trend higher in the projection (Figure 7.1a). After accounting for general price inflation, real meat prices will average higher over the outlook period than in the previous decade, but they will decline from their current high levels (Figure 7.1b).
Meat-to-feed price margins as well as feed conversion ratios are expected to improve compared to those experienced in the last three years (Figure 7.2), when feed costs reached their recent heights. The Outlook anticipates that productivity growth will continue. Long run trend estimates from 1980 to 2013 suggest that pig meat and poultry meat to feed price ratios are falling at the rate of 1.5% p.a. and 0.8% p.a., respectively. The bovine meat to feed price ratio over this period does not reveal a significant downward trend. Over the medium-term, farm price to feed price ratios will remain at or above trend levels as a result of higher non-feed costs, due in particular to factors related to energy, services and environmental regulations.
Figure 7.2. Meat to feed price ratios should return to historical trend
Source: OECD and FAO Secretariats
Production
While the recent decline in feed costs from their peak in 2012 imply improved profitability for the meat sector, feed costs are nevertheless projected to remain relatively high through the next decade. With other input costs rising - including those associated with meeting more stringent regulations and requirements for the environment, animal welfare and health, as well as water and labour - production growth will be restrained. Global meat production will increase by 19% in 2023 compared to the base period, and of the additional 57.7 Mt, developing countries as a group are projected to account for 45.1 Mt, or 78%, of the total (Figure 7.3).
0
0.2
0.4
0.6
0.8
1
1.2
1.4
1.6
1.8
2
0
0.5
1
1.5
2
2.5
3
3.5Ratio 2003-05Ratio 2003-05
Feed Cost Index (left) Pig meat/Feed Index (right) Poulty/Feed Index (right) Beef/Feed Index (right)

TAD/CA/APM/WP(2014)5/FINAL
71
Figure 7.3. Growth of meat production by region and meat type, 2023 vs. 2011-2013 (Kt c.w.e./r.t.c)
Note: c.w.e. is carcass weight equivalent, r.t.c is ready to cook equivalent.
Source: OECD and FAO Secretariats.
Contributing to the increased production, in order of importance, are Asia, Latin America and the Caribbean, North America and Africa. China remains the greatest contributor, with an additional 15.3 Mt, followed by the United States with 6 Mt and Brazil with 4.5 Mt (Figure 7.4.). Of the major meat producers, the fastest growers are Argentina (30%), the Russian Federation (28%), Indonesia (47%) and Viet Nam (39%). However, slower output growth is expected in the OECD area as a result of stagnating domestic demand and escalating costs related to the preservation of the environment.
Figure 7.4. Countries with the greatest share of additional meat production by meat type, 2023 vs. 2011-2013 (kt c.w.e. or r.t.c)
Source: OECD and FAO Secretariats.
8624
13537
19623
3303 2823174 8723
78%
452 22%
0
10 000
20 000
30 000
40 000
50 000
60 000
70 000
Beef Pork Poultry Sheep Beef Pork Poultry Sheep Total increaseDeveloping Developed
kt
-2 000 0 2 000 4 000 6 000 8 000 10 000 12 000 14 000 16 000 18 000
Indonesia
Argentina
Viet Nam
European Union
Russian Federation
Brazil
United States
China
kt
Beef Pork Poultry Sheep

TAD/CA/APM/WP(2014)5/FINAL
72
Of the projected 57.7 Mt of additional meat production in 2023, 28.3 Mt is poultry meat, 16.7 Mt is pigmeat, 9 Mt is bovine meat, and 3.8 Mt is sheep meat. By the end of this decade poultry will overtake pigmeat as the largest meat produced. While both poultry and pig meat production growth will be slower through the outlook period than in the past decade, production of both bovine and sheep meat are expected to increase more rapidly than they did in the last decade.
In terms of output growth, poultry has some clear advantages over other meats. Production does not require a large land base, and it is often situated close to highly populated, growing and richer urban markets. Its short production cycle enables a quicker response from producers in adapting to profitability conditions, and a high feed conversion ratio (meat/feed) results in the lowest production costs of all meats. These attributes are favourable in stimulating growth, especially in developing regions with competitive feed grain prices. Recently, however, poultry has faced problems with high density production, which can be problematic for the spread of diseases. Asia will remain the world’s fastest growing market for poultry meat, and it will be critical to resolve disease issues. In India, meat production is dominated by poultry, and output is anticipated to advance around 5% p.a., albeit from still a small base. China’s production will recover as consumers regain confidence in the safety of poultry meat.
Global pigmeat production is projected to increase at 1.1% p.a. In developed countries, production will be just 8% higher by 2023 compared to the 2011-13 base period, due mainly to slow growth in the United States and Europe. Considerable uncertainty exists in the United States due to the recent outbreak of the Porcine Epidemic Diarrhoea virus (PEDv), which will reduce production and, given the importance of US trade, will raise pigmeat prices across the Pacific markets until the disease is arrested. The Outlook’s assessment is a 2% reduction in US production in 2014 with growth resuming thereafter as the problem is solved. Elsewhere, Asia will account for two-thirds of the growth in pigmeat supplies. This is largely due to China, which represents almost half of additional global pigmeat production. As domestic pigmeat demand becomes more satiated, with the world highest per capita pigmeat consumption, China’s, domestic production growth will slow to 0.9% p.a. in the projection period. Brazil and Argentina continue to grow comparatively strongly at 1.9% p.a. and 3% p.a. respectively, despite a sustained high real exchange rate relative to the USD, which bolsters domestic demand.
In bovine markets, an important event is the herd rebuilding phase which is currently underway in North America, and in particular in the United States, a country which accounts for about one sixth of global supplies. Liquidation in the United States, which started in 2006 and has continued for eight years, was encouraged mainly by high feed and other input prices and weak domestic demand. The drought of 2012 also induced high cow slaughter. Figure 7.5 indicates the depth of cow herd liquidation and the projected expansion over the outlook period, which is anticipated to have a major impact on Pacific meat markets. After weak growth in the last decade, US beef supplies are expected to advance 1.2% p.a. in the Outlook period.

TAD/CA/APM/WP(2014)5/FINAL
73
Figure 7.5. Cattle cycle: Inventory of beef cows in the United States
A noticeable turnaround is also expected in the Russian Federation and Argentina, following a decade of diminishing output. Significant production growth will also occur in the least developed countries in Africa, traditionally a pastoral production system. India will account for almost 10% of additional bovine meat produced by 2023 as programmes to encourage commercial slaughter for export are implemented by the government (Box 7.1).
Global sheep meat production, based largely on pastoral systems, is projected to advance rapidly, due to stronger growth in Africa and Asia, encouraged by the higher prices of recent years. These two regions together account for 71% of global supplies, and their share should continue to increase in the medium term. Australia and New Zealand, whose combined shipments account for 75% of global sheep meat trade, witnessed declining production in the last decade, as high grain and dairy product prices increased the cost of pasture. Reduction in output from these countries was the reason for the large upswing in sheep meat prices during the last ten years. Production of sheep meat is expected to resume at a stronger pace in Australia, but to remain flat in New Zealand, given the high milk prices which are anticipated over the outlook period.
The livestock supply response in some countries is being conditioned by environmental and food safety regulations that stem from concerns for the environment and sustainability; especially, but not exclusively, in developed markets. In many areas of the developing world, a considerable productivity gap remains, with potential for meat output expansion, if higher productivity can be realised.
Consumption
While production costs are the key determinant of prices, it is mostly consumer preferences, together with income and population growth, that lead and drive the meat sector over time. These drivers clearly support higher growth in poultry demand compared to other meats - it is the cheapest and most accessible meat, it is also free of the cultural barriers that affect pigmeat. Aggregate meat consumption remains strongest in developing countries, but recent trends suggest that they have weakened in developed/higher income countries, where per capita levels of meat consumption are already high. However, poultry consumption growth is more robust everywhere. Basic demand analysis suggests that poultry meat is most sensitive to income changes in developing countries (Box 7.1).
25 000
26 000
27 000
28 000
29 000
30 000
31 000
32 000
33 000
34 000
35 000
2000 2001 2002 2003 2004 2005 2006 2007 2008 2009 2010 2011 2012 2013 2014 2015 2016 2017 2018 2019 2020 2021 2022 2023
Mn heads
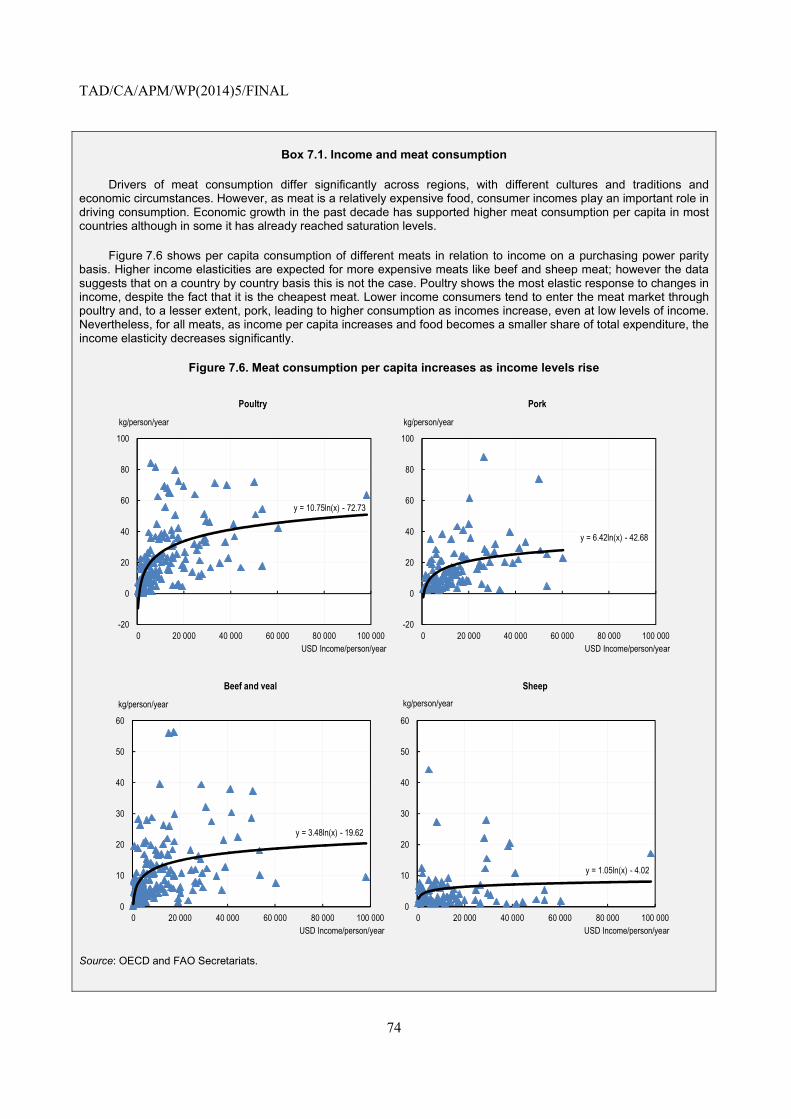
TAD/CA/APM/WP(2014)5/FINAL
74
Box 7.1. Income and meat consumption
Drivers of meat consumption differ significantly across regions, with different cultures and traditions and economic circumstances. However, as meat is a relatively expensive food, consumer incomes play an important role in driving consumption. Economic growth in the past decade has supported higher meat consumption per capita in most countries although in some it has already reached saturation levels.
Figure 7.6 shows per capita consumption of different meats in relation to income on a purchasing power parity basis. Higher income elasticities are expected for more expensive meats like beef and sheep meat; however the data suggests that on a country by country basis this is not the case. Poultry shows the most elastic response to changes in income, despite the fact that it is the cheapest meat. Lower income consumers tend to enter the meat market through poultry and, to a lesser extent, pork, leading to higher consumption as incomes increase, even at low levels of income. Nevertheless, for all meats, as income per capita increases and food becomes a smaller share of total expenditure, the income elasticity decreases significantly.
Figure 7.6. Meat consumption per capita increases as income levels rise
Source: OECD and FAO Secretariats.
y = 10.75ln(x) - 72.73
-20
0
20
40
60
80
100
0 20 000 40 000 60 000 80 000 100 000USD Income/person/year
Poultry
kg/person/year
y = 6.42ln(x) - 42.68
-20
0
20
40
60
80
100
0 20 000 40 000 60 000 80 000 100 000USD Income/person/year
Pork
kg/person/year
y = 3.48ln(x) - 19.62
0
10
20
30
40
50
60
0 20 000 40 000 60 000 80 000 100 000USD Income/person/year
Beef and veal
kg/person/year
y = 1.05ln(x) - 4.02
0
10
20
30
40
50
60
0 20 000 40 000 60 000 80 000 100 000USD Income/person/year
Sheepkg/person/year
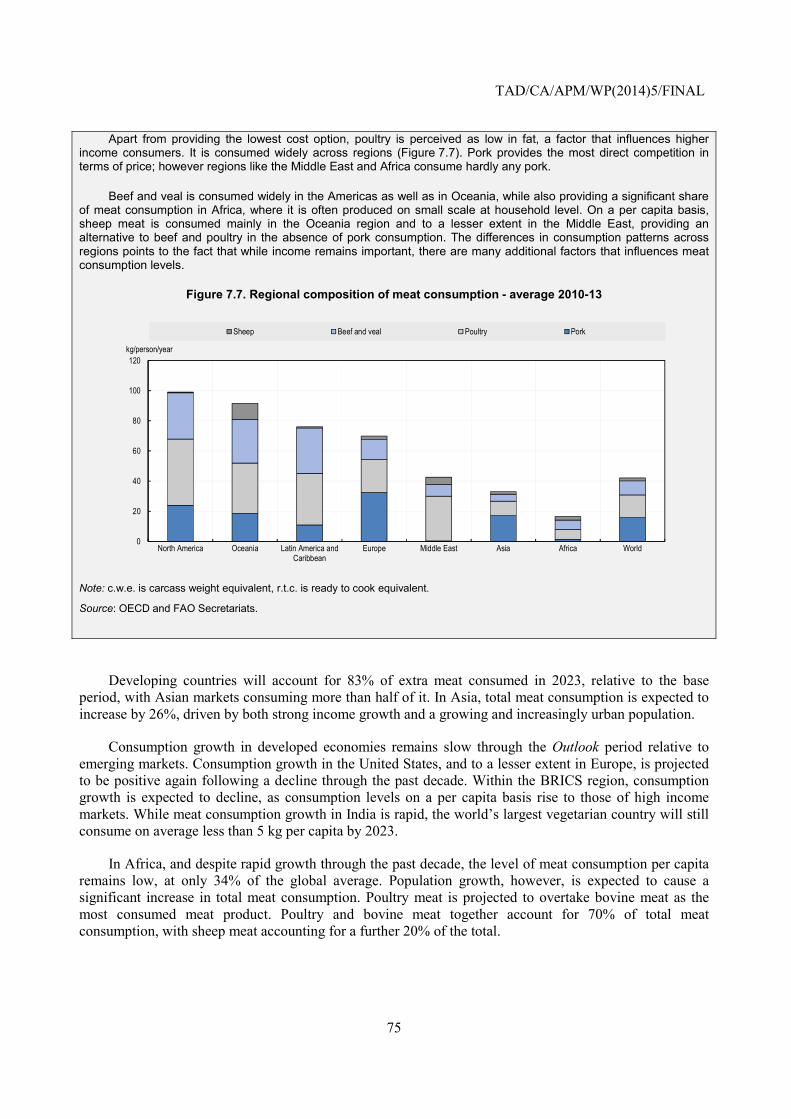
TAD/CA/APM/WP(2014)5/FINAL
75
Apart from providing the lowest cost option, poultry is perceived as low in fat, a factor that influences higher income consumers. It is consumed widely across regions (Figure 7.7). Pork provides the most direct competition in terms of price; however regions like the Middle East and Africa consume hardly any pork.
Beef and veal is consumed widely in the Americas as well as in Oceania, while also providing a significant share of meat consumption in Africa, where it is often produced on small scale at household level. On a per capita basis, sheep meat is consumed mainly in the Oceania region and to a lesser extent in the Middle East, providing an alternative to beef and poultry in the absence of pork consumption. The differences in consumption patterns across regions points to the fact that while income remains important, there are many additional factors that influences meat consumption levels.
Figure 7.7. Regional composition of meat consumption - average 2010-13
Note: c.w.e. is carcass weight equivalent, r.t.c. is ready to cook equivalent.
Source: OECD and FAO Secretariats.
Developing countries will account for 83% of extra meat consumed in 2023, relative to the base period, with Asian markets consuming more than half of it. In Asia, total meat consumption is expected to increase by 26%, driven by both strong income growth and a growing and increasingly urban population.
Consumption growth in developed economies remains slow through the Outlook period relative to emerging markets. Consumption growth in the United States, and to a lesser extent in Europe, is projected to be positive again following a decline through the past decade. Within the BRICS region, consumption growth is expected to decline, as consumption levels on a per capita basis rise to those of high income markets. While meat consumption growth in India is rapid, the world’s largest vegetarian country will still consume on average less than 5 kg per capita by 2023.
In Africa, and despite rapid growth through the past decade, the level of meat consumption per capita remains low, at only 34% of the global average. Population growth, however, is expected to cause a significant increase in total meat consumption. Poultry meat is projected to overtake bovine meat as the most consumed meat product. Poultry and bovine meat together account for 70% of total meat consumption, with sheep meat accounting for a further 20% of the total.
0
20
40
60
80
100
120
North America Oceania Latin America andCaribbean
Europe Middle East Asia Africa World
kg/person/year
Sheep Beef and veal Poultry Pork

TAD/CA/APM/WP(2014)5/FINAL
76
Figure 7.8. Per capita meat consumed in the world 2023 vs. base period 2011-13
Source: OECD and FAO Secretariats.
Poultry meat will continue to dominate growth in meat consumption through the outlook period, increasing by 27% in 2023, relative to the base period. It is noteworthy that the United States is projected to increase per capita consumption of poultry from 51 kg to 57 kg by 2023, encouraged by its lower price relative to other meats Consequently poultry’s share of meat consumption expands after slipping in the previous decade. Some of the largest consumers of poultry on a per capita basis are in countries where pork is not consumed, such as Malaysia, Israel and Saudi Arabia.
While pork represents the greatest share of meat consumption in the historical base period, slower growth will see it lose market share to the benefit of poultry in the next decade. In China, which has the largest pork sector in the world, consumption growth rates will decline indicating that consumers are reaching near saturation levels and are diversifying to alternative sources of animal proteins.
Global bovine meat consumption is expected to advance again in the next decade, although it will rise only by 0.1 kg on a per capita basis by 2023, compared to the base period average, having fallen by the same amount in the last ten years. Consumption per capita falls slightly in developed countries, as it rises in developing countries. The decline in North America is most severe at -3.1 kg per capita, as a result of higher prices relative to other competitive meats.
With an expected stabilisation of sheep meat prices in real terms, consumption is projected to grow in the projection period. However, sheep meat will still represent only a small share of global meat consumed. The most significant growth in sheep meat consumption will be in Africa, China, and other economies in the Middle East and Asia.
Trade
Meat trade expansion is anticipated to increase at a slower pace in the next decade when compared to the previous one, but nevertheless will outpace production growth. Higher domestic production in traditionally importing developing and least developed countries is the reason for the slower trade growth. Total meat trade will remain around 10% of production, with bovine meat having the highest trade share at 15.8%.
0
10
20
30
40
50
60
70
80
90
100
2011
-13
2023
2011
-13
2023
2011
-13
2023
2011
-13
2023
2011
-13
2023
2011
-13
2023
2011
-13
2023
2011
-13
2023
2011
-13
2023
2011
-13
2023
2011
-13
2023
2011
-13
2023
Brazil RussianFederation
India China BRICS Africa Developing Japan United States EuropeanUnion
Developed World
kg rtc, r.t.w./capita
Poultry Pork Sheep Beef

TAD/CA/APM/WP(2014)5/FINAL
77
Developed countries are expected to account for 54% of global meat exports by 2023, down from 56% in the base period. Traditional exporting countries are expected to maintain a high share of the global trade, notably North America (31%) and South America (28%) which also account for 60% of the additional shipments. In these regions, production growth is declining and yet outpaces consumption growth, resulting in an expansion of export supplies. In contrast, the position of the European Union as world meat exporter, while still significant, will continue to weaken through the next decade. Its decline is driven by the combined effect of a strong Euro and higher production costs, following the implementation of stringent animal welfare requirements, notably in the pig meat sector.
Some developing exporting countries, notably Argentina, Brazil, India and Thailand, are expected to benefit from higher global prices and strengthen their strategic position within the structure of international meat trade. A significant development is the consolidation of India as a giant exporter of beef to developing regions, notably with low priced buffalo meat (Box 7.2).
Box 7.2. Exports of buffalo meat from India
For a country with predominantly vegetarian traditions, and with the majority of the population averse to consuming beef, it is remarkable that India is currently counted as a major beef exporter. Beef from India largely comprises buffalo meat, also known as carabeef. Under the 11th Five Year Plan (2007-12) of the Planning Commission of the Government of India, initiatives such as “The Salvaging and Rearing of Male Buffalo Calves Scheme” contributed to an increase in the population of male buffaloes, while “The Utilization of Fallen Animals” scheme led to an improvement in carcass utilisation. These two key policy initiatives, along with an increased rate of slaughter, boosted buffalo meat production from about 2.5 Mt in 2009 to 3.75 Mt in 2013. These policies will continue in the 12th Plan (2012-17) and it is expected that production of buffalo meat will continue to grow.
India has also enhanced investments in the meat slaughter and food safety sectors. The Agricultural and Processed Food Products Export Development Authority (APEDA) of India has provided financial assistance for setting up a number of integrated abattoirs, slaughterhouses and meat processing plants. It has also supported the modernisation of a large number of abattoirs across the country. These have contributed to improving the quality of the meat and also meeting safety requirements for exports.
For a number of reasons, India is considered to have a comparative advantage in producing and exporting carabeef as against traditional beef producers and exporters like Brazil and Australia. First, commercial beef-ranching is not practised in India and the male and unproductive female buffaloes are allowed to be slaughtered. Since these animals do not produce milk, they are rarely fed expensive nutritious feeds and therefore the cost of producing meat is much lower than other beef exporting countries. Second, as the production is going up while the domestic market is limited, India will have a substantial surplus to export which, at present, stands at around 30% of its total production. Third, the beef produced in India is halal meat, which is preferred in a number of South Asian, African and the Middle Eastern markets. The potential for India to increase its exports competitively is therefore enormous.
The bulk of the buffalo meat that is exported comes from Uttar Pradesh, a large State in India’s north and the Southern Indian State of Andhra Pradesh. Most of India’s buffalo meat is shipped to South East Asian countries, followed by Middle-Eastern and African countries, with Viet Nam with the largest market share at 30%. Sanitary standards have limited India’s access to new markets, especially to OECD countries to which exports are minuscule.
Figure 7.9. Buffalo meat exports from India 2012-13

TAD/CA/APM/WP(2014)5/FINAL
78
Source: Agricultural and Processed Food Products Export Development Authority (APEDA), Ministry of Commercie and Industry, Government of India (www.apeda.gov.in).
Figure 7.10 illustrates the absolute change in imports and exports for specific meat types across regions from the base period to 2023. Most of the additional meat traded is poultry meat accounting for just over half of additional trade through the outlook period, followed by beef and pork. Sheep trade represents a very small share of the additional trade.
The most significant growth in import demand originates from Asia, which represents the greatest share of additional imports for all meat types. Africa also accounts for a significant share of additional meat imports, as domestic consumption growth exceeds growth in domestic production. Japan and China are the largest net importer of meat products, followed by Viet Nam, Saudi Arabia and the Russian Federation. The Russian Federation's net import position is expected to fall significantly, relative to the base period, as efforts to lower import dependency through government programmes are expected to yield some results in stimulating production. The origin of additional exports differs across meat types. South America seizes a significant share of additional exports for all meat types except sheep, which originates mainly from Oceania.
Viet Nam30%
Middle East20%Africa
17%
Malaysia10%
Thailand8%
Iran4%
Philippines4%
Iraq2%
Europe2%
Rest of the World3%

TAD/CA/APM/WP(2014)5/FINAL
79
Figure 7.10. Changes in the net trade of meat by type and region 2023 vs. base period
Source: OECD and FAO Secretariats.
Considering specific meat types, additional poultry exports originate mainly from North and South America, but Ukraine is also showing a substantial expansion of its poultry sector, leading to substantial export growth and contributing to a positive trade balance for poultry products in Europe. Continued unrest in the area, however, could reduce this expected export growth. The most significant importers after Asia are North Africa and the Middle East.
The majority of additional pork exports are expected to originate from North America, where exports are projected to grow through the ten-year period, while the only other significant net exporting region is the European Union. The greatest demand for additional imports is from Asia, followed by Sub-Saharan Africa and South America.
The demand for additional beef imports is centred in Asia, followed by the Middle East and North Africa, while the bulk of additional exports are expected to originate from South America, thanks to export growth of 2.4% p.a. through the outlook period. Exports from North America and Europe are anticipated to decline through the outlook period.
Australia and New Zealand continue to be the world’s largest sheep meat exporters, growing 1.9% p.a. over the projection period. Sheep meat exports from Australia are expected to grow faster than those from New Zealand. This growth will be driven by increasing demand from the expanding middle class in the Middle East and Asia, particularly China, which has now surpassed the United Kingdom as New Zealand’s number one market in terms of volume.
Main issues and uncertainties
The rate of growth in the meat sector differs by country and meat type, but at aggregate level the meat sector of developing countries is among the fastest growing of all major agricultural sectors. In developed countries, meat production is growing, but consumption per person, as well as the population growth rate is relatively stagnant, implying growing exports. Trade agreements have fostered increased trade by reducing tariff and non-tariff barriers, while global agreements have also improved the capacity to cope with animal disease outbreaks, which have often disturbed national and international markets unexpectedly as interdependence has increased with time. This stylistic portrayal of a globally growing sector also points to
- 750
- 250
250
750
1 250
1 750
Imports Exports Imports Exports Imports Exports Imports ExportsBeef Sheep Pork Poultry
kt
North America European Union and other Western Europe OceaniaEastern Europe North Africa Sub Saharan AfricaLatin America and Caribbean Asia Middle East

TAD/CA/APM/WP(2014)5/FINAL
80
the standard risks and uncertainties in the Outlook, whether they are higher or lower income growth, disease outbreaks or changes in trade policies.
The ever present risk to meat markets is the outbreak of animal diseases, which may be of two types. Those which may affect herd capital, forcing liquidation of existing animals, and those which may affect human health, and lead to suddenly reduced consumer demand. Both of these have domestic market implications, in addition to likely trade impacts that affect international markets. The ongoing challenge of Avian Influenza (H7N9), for example, is having a major impact on China’s meat complex, as consumers have reduced demand for poultry meat, resulting in increased demand for red meats. The ability to control the spread of this disease will have ramifications for the outlook, especially in the Asian region. Similarly, the current Porcine Epidemic Diarrhoea virus (PEDv) in North America will have repercussions for Pacific meat markets. In various regions, the ongoing effort to eliminate Foot and Mouth Disease (FMD) in cattle, pigs and sheep has had mixed success, and it continues to divide commercial markets and opportunities for the industry. African Swine Fever (ASF), which is endemic in parts of Africa and has spread at various times to other countries, could also potentially disrupt markets in the future.
The prospect of various trade agreements over the outlook period could increase meat trade substantially. In October 2013, the European Union signed a free trade agreement with Canada, which is likely to increase agricultural trade between the two and provide increased access to the pig and bovine meat sectors. The United States is currently discussing with the European Union the creation of the Transatlantic Trade and Investment Partnership (TTIP), which would reduce tariffs and trade restrictions and likely enhance trade between the two partners. Few analyses have tried to quantify the effect on the meat market of such trade agreement. Nevertheless, the TTIP would likely improve US exports of high quality beef to the European Union (Agri-Benchmark, 2013). The European Union is also negotiating with countries of the Mercado Común del Sur (MERCOSUR; Brazil, Argentina, Uruguay, Paraguay and Venezuela), and depending on the outcomes, an agreement could have a substantive impact on meat trade between these regions (Burrell et al., 2011). An outcome of the discussions for a Trans Pacific Partnership (TPP) Free Trade Agreement could also affect meat trade during the outlook period.
Environmental regulations and concerns continue to affect meat production. These imply higher costs of compliance, either by affecting the location of production, or in the form of specific requirements related to animal housing, waste disposal etc. Estimates of global animal numbers used in this Outlook indicate that in 2013 the inventory of cattle, pigs, sheep and poultry birds stood at 1.6 billion, 1.0 billion, 2.1 billion, and 22.6 billion respectively. From 1995 to 2013, the trend growth of cattle inventory was negligible, while for pigs, sheep and poultry it grew by 0.7%, 1.1%, and 2.8% p.a, respectively. For the outlook period, the rate of growth in herds for cattle (1.1%), pigs (0.6%), sheep (2.6%) and poultry (2.2%) are significant, and it indicates that further growth in farm animal herds will be required in order to meet the growing demand for meat, eggs and dairy products. Growing herd numbers further implies potentially higher environmental pressures and other externalities. These trends have caused policy makers to draw attention to the importance of improved animal efficiency/productivity in supplying market requirements (Box 7.3).
There are certain specific risks associated with the outlook. One is cattle herd rebuilding, which is projected to continue into the early years of the outlook period in North America, impacting significantly on Pacific meat markets. The current projection portrays Pacific bovine meat prices as peaking in 2015, and declining thereafter as supplies come on stream. However, the projection also includes a large margin between Pacific and Atlantic bovine meat markets which may not sustain if Atlantic market suppliers, particularly Brazil and Argentina, gain better access to the Pacific market. If this occurs, it would bring Pacific bovine meat prices down, limiting the resulting growth in both supply and exports from North America.
TAD/CA/APM/WP(2014)5/FINAL
81
The potential for increased meat imports by China is an important risk which could underpin higher prices in meat markets. As noted in the 2013 Outlook, whether China increases domestic meat production by growing or importing more feed grain, or alternatively imports more meat directly (or both), has implications for global markets of these commodities. In fact, the recent meat trade situation in China points to much higher meat imports than previously expected. If these were to rise more than projected, they could considerably impact markets. On a reverse perspective, India’s potential to increase bovine meat exports is substantial, given the low rate of commercial slaughter relative to the size of its buffalo cattle inventory. The projection indicates that bovine meat exports from India will exceed 2 Mt by 2023, while its slaughter remains only some 1% of inventory. Simulations using the Aglink-Cosimo model indicate that if that ratio increased to 1.5% by 2023, exports would increase to 3.5 Mt and depress Atlantic market prices by up to 8%.
Box 7.3. Global agenda for sustainable livestock
The livestock sector is vital to global nutrition and food security, provides livelihoods to an estimated one billion people, and delivers important products and services such as asset savings, traction, manure for fuel and fertilisers, and fibre. However, the sector is facing unprecedented challenges. By 2050, the demand for livestock products will grow by 70% driven by rising world population, increasing affluence, and urbanisation. This growth in demand is happening at a time when concerns about resource scarcity, climate change and the need for more equitable development are assuming ever greater importance.
Realizing that the complexity of the challenges facing the sector can be addressed only through concerted and collective action, stakeholders have formed a partnership to build a Global Agenda for Sustainable Livestock (www.livestockdialogue.org).The Agenda is a multi-stakeholder partnership committed to sustainable livestock sector development, whose purpose is to catalyse and guide the continuous improvement of livestock sector practices towards more efficient, safe, and responsible use of natural resources. Through a more efficient use of natural resources, the sector can enhance its environmental performance and generate significant economic and social benefits, contributing to food security, income generation and poverty reduction.
The partnership develops harmonised metrics and methodologies, conducts independent sector analyses and produces voluntary guidance and strategic recommendations to catalyse the continuous improvement of livestock sector resource use. Land, water, nutrients and greenhouse gas emissions are the initial focus, particularly on areas where large environmental, social and economic gains can be made:
a. Focus area: Closing the efficiency gap aims to stimulate the application of existing, but not widely used technologies, by the bulk of the world’s producers whose use of natural resources is often greatly inefficient.
b. Focus area: Restoring value to grasslands pursues better management of grazing land which contributes to carbon sequestration, protection of water resources and biodiversity, whilst enhancing productivity and livelihoods.
c. Focus area: Waste to worth aims to recover and recycle nutrients and energy contained in animal manure from intensive and confined livestock production operations.
The adoption of more efficient technologies and practices is the key to increased productivity and to mitigating emissions from livestock, and increasing the sector´s contribution to economic growth and poverty reduction. Possible interventions to improve productivity are generally those that improve efficiency at animal and herd levels. Feeding practices and feed additives, manure handling (treatment, storage, application, housing), and general animal husbandry practices (genetic selection, animal health, reduced mortality, reproductive management) all offer avenues for significant social, economic and environmental benefits.
Some examples of where productivity gains can be made and also result in simultaneous improvements of environmental performance include: (Gerber et al., 20131):
• Herd management and feed quality improvement in South Asia to produce same or even greater amounts of milk out of a reduced cattle and buffalo population;
• In South America, feasible improvements in grazing management and forage quality, and animal health and husbandry in beef production, could lead to a 19% to 30% reduction of CO2-equivalent emissions;
• In the West African small ruminant sector, emissions reductions and greater supply of beef and milk could potentially be achieved by improving forage digestibility, grazing management, and animal health, husbandry, and breeding;

TAD/CA/APM/WP(2014)5/FINAL
82
• Dairy systems in OECD countries could reduce their emissions by 14% to 17% through the adoption of improved pasture management, feed supplementation and energy saving equipment;
• Industrial pig production systems in East and Southeast Asia could, by improving manure management and adopting energy saving technologies (and using low carbon energy), reduce emissions by 16% to 25% and achieve further environmental benefits related to reduced nutrient losses into the environment.
1. FAO (2013), Tackling Climate Change Through Livestock, Food and Agriculture Organization of the United Nations, Rome http://www.fao.org/docrep/018/i3437e/i3437e.pdf.
References Agri-Benchmark (2013), Cost of production and competiveness of beef production in Canada, the US and EU,
Working Paper, 2013/5. www.agribenchmark.org/beefandsheep/publications.
Burrell, A., E. Ferrari, A. González Mellado, M. Himics, J. Michalek, S. Shrestha and B. Van Doorslaer (2011), Potential EU-Mercosur Free Trade Agreement Impact Assessment, Joint Research Centre, European Commission, Seville.
FAO (2013), Tackling Climate Change Through Livestock, Food and Agriculture Organization of the United Nations, Rome
Gerber, P.J., H. Steinfeld, B. Henderson, A. Mottet, C. Opio, J. Dijkman, A. Falcucci and G.Tempio (2013). Tackling climate change through livestock – A global assessment of emissions and mitigation opportunities. Food and Agriculture Organization of the United Nations, Rome.
TAD/CA/APM/WP(2014)5/FINAL
83
Chapter 8. Fish and seafood26
Abstract
This chapter illustrates the market situation and the latest set of quantitative medium-term projections for the fish sector for 2014-2023. The analysis of the market prospects for fish covers the developments expected in its prices, production, use (human consumption, fishmeal and fish oil) and trade (imports and exports). The quantitative projections are developed with the aid of the dynamic policy specific partial equilibrium fish model. At present, it is a stand-alone model using the same macroeconomic assumptions and the same feed and food prices employed or generated by the agricultural market model Aglink-Cosimo. The chapter also includes a box that discusses the recycling of fish residue in the fishmeal and oil market. The chapter concludes with a discussion of some main issues and uncertainties which might affect the medium-term outlook for fish. Major emphasis is given to fisheries policies, and specific constraints influencing capture and aquaculture production.
Market situation
The fish sector has been recently characterised by rather high and volatile prices. With the 2002-04 average price set to 100, the aggregate FAO Fish Price Index climbed steeply to a record high of 164 in December 2013. This growth reflects an inadequate supply that pushes prices upward for selected farmed species, e.g. salmon and shrimps/prawns that are two of the world’s major traded species, but also increases in prices for some wild species such as cod and certain pelagic species. In contrast, fishmeal prices, after having reached historic highs in January 2013, experienced a downward trend (minus 20% during January 2013-January 2014), but still remain on a high plateau.
After a period of instability, that started in the mid-end of 2012 and early 2013, fishery trade bounced back during the rest of 2013 and early 2014. In 2013 the overall exports of fish and fishery products peaked at over USD 136 billion, representing more than 5% increase compared with the previous year. This strengthening was in part a reflection of higher prices, but it was also stimulated by a recovery in high-income economies, which are the main importers of seafood commodities. Overall exports from developing countries increased partly because of this revitalised import demand but also because of flourishing demand for high value species such as salmon, tuna, bivalves and shrimp, by emerging economies.
Led by continued growth in aquaculture output, global fishery production (aquaculture plus capture) reached a new record in 2013, at more than 160 Mt. Per capita apparent27 fish consumption grew by more than 2%, compared to previous year, reflecting the increased availability of farmed products, which are in
26 The terms “fish and seafood” or simply “fish” indicate fish, crustaceans, molluscs and other aquatic
invertebrates but excludes aquatic mammals and aquatic plants. 27 The term apparent refers to the average food available for consumption, which is not equal to average food
intake or average food consumption for a number of reasons, e.g. food waste at household level.

TAD/CA/APM/WP(2014)5/FINAL
84
the process of overtaking capture fisheries as the main source of fish food supply, but also the growing volumes of wild species going to direct human consumption instead of being reduced into fishmeal/fish oil.
Projection highlights
• Despite the instability experienced in 2012 and part of 2013, the medium-term trend for the fish sector remains positive. Developing countries will drive major changes and expansion in fisheries and aquaculture production, trade and consumption.
• The outlook for fish in the next decade reflects the response to sustained high costs in a context of firm demand, in particular in developing countries. By 2023, fish prices in nominal terms are projected to be well above their historical average. In real terms, fish prices are expected to slightly decline, yet remaining above levels in previous decades.
• World fishery production is expected to be 17% higher by 2023. The growth will be primarily driven by gains in aquaculture output, which is projected to reach 49% of total fishery production in 2023. However, growth in aquaculture production is anticipated to slow down to 2.5% p.a., dampened by higher costs during the outlook period, which compares to 5.6% p.a. for the previous decade.
• Fish and fishery products will continue to be highly traded, but overall trade is projected to increase at a slightly slower pace than in the past due to higher transportation cost, slower output growth and weaker demand in selected importing countries.
• World per capita apparent fish food consumption is projected to reach 20.9 kg per capita in 2023, up from 19.2 kg per capita in 2011-13. Relative to the previous decade, fish consumption growth in the outlook period will decelerate due to high fish prices and slower population growth.
Market trends and prospects
Prices
Fishery prices are currently at very high levels, and little moderation is expected as long as production costs, in particular for feed and energy, remain high. The main drivers affecting world fish prices for capture, aquaculture and traded products will be income and population growth, limited growth of capture fisheries production, sustained demand for fish, increasing meat prices, and high costs for feed, energy and crude oil. All these factors will contribute to fish prices continuing to rally over the medium term (Figure 8.1) in nominal terms relative to the previous decade. In real terms, however, fish prices are assumed to slightly decline, but they will remain on an elevated plateau over the next decade. This decline can be explained by further productivity gains in aquaculture production and by a decline in real terms of some input prices.

TAD/CA/APM/WP(2014)5/FINAL
85
Figure 8.1. World prices in real terms expected to remain high
Nominal (left) vs real (right) fish prices
Note: Fish food traded: world unit value of trade (sum of exports and imports). Aquaculture: FAO world unit value of aquaculture fisheries production (live weight basis). Capture: FAO estimated value of world ex-vessel value of capture fisheries production excluding for reduction. Fishmeal: 64-65% protein, Hamburg, Germany. Fish oil: any origin, N.W. Europe.
Source: OECD and FAO Secretariats.
Capture fisheries are expected to remain under restrictive capture quotas, with its average price (excluding fish for reduction) projected to grow more than the one for aquaculture fish (31% compared to 15%) during 2014-23. However, the overall price of fish caught in the wild will remain lower than that for farmed fish. This is partially explained by the increasing share of lower value fish in overall catches. Both coarse grains and fishmeal will continue to be to be used as ingredients for raising fed aquaculture species As in the case of meats, the price ratio between aquaculture fish and coarse grains is expected to remain stable over next decade, at a higher level than during the 2006-12 period but at a much lower level than in the 1990s. The ratio of the price of fish raised in aquaculture to the fishmeal price will gradually stabilise over the projected period.
Starting from a high plateau, the average fishmeal price is projected to remain stable over the projection period. Since the demand for fishmeal from aquaculture is growing faster than supply, an increase in the price ratio between fishmeal and oilseed meal is expected due to the strong preference for fishmeal in certain stages of animal rearing (e.g. in the weaning stage for pigs and initial stages of salmon rearing). This will be more relevant in years of the El Niño phenomenon, affecting catches in South America, in particular anchoveta species in Peru and Chile, which are mainly used for reduction into fishmeal and fish oil. However, since fishmeal and protein meal prices are starting from very high levels, a small decline is expected in nominal terms over 2014-23.
Due to slower growth in supply than in demand, fish oil prices will increase in nominal terms by 14% between the 2011-13 base period and 2023. The popularity of the Omega-3 fatty acids in human diets and the growth of aquaculture production have both contributed to an increase in the fish to oilseed oil price ratio. The popularity of Omega-3, in particular, is the source of a structural change in the ratio of these two prices since 2012. The resulting ratio is assumed to be maintained over the medium-term except in the years where the El Niño, phenomenon occurs.
0
500
1 000
1 500
2 000
2 500
3 000
3 500
4 000USD/t
Fish food traded AquacultureFish oil CaptureFish meal
0
500
1 000
1 500
2 000
2 500
3 000USD/t
Fish food traded AquacultureFish oil CaptureFish meal

TAD/CA/APM/WP(2014)5/FINAL
86
The price of traded fish products in nominal terms will increase by 20% over the outlook period, though in real terms it is projected to stabilise at a slightly lower level than the recent peak reached in 2011, but below the levels reached at the beginning of the 1990s. For individual fishery commodities, price volatility could be more pronounced due to supply swings caused by changes in catch quotas, disease outbreaks in the aquaculture sector (for example, as the one affecting shrimps production in Mexico and Thailand at present) as well as fluctuations in feed costs.
Production
Stimulated by higher demand for fish and led by developing countries, world fishery production is projected to reach 186 Mt in 2023. This is about 17% higher than in the base period 2011-13, but it represents a slower annual growth compared to the previous decade (1.2% versus 2.1%). Notwithstanding the diminishing growth rate, the total amount of fisheries production will remain higher than that of the individual beef, pork or poultry outputs. About 89% of total fishery production, or 166 Mt, is estimated to be destined for direct human consumption. Developing countries are expected to account for about 96% of the projected production growth, and their share in total production will increase from 82% in the base period to 84% in 2023. A more marked expansion is expected in Asia, with its share in the total production going from 68% to 71% (Figure 8.2).
Figure 8.2. Asian countries dominate fisheries production
Fishery production in live weight equivalent for aquaculture (left) and capture (right)
Source: OECD and FAO Secretariats.
Capture production is projected to slightly increase by 2% over the projection period, from 92.6 Mt to about 95 Mt in 2023. This improvement is due to a combination of factors, including the recovery of certain catches resulting from progress in rebuilding fish stocks and establishing robust management regimes by some countries; some growth of catches in those few countries not subject to strict production quotas; and enhanced use of fishery production through reduced discards, waste and losses as required by changes in legislation or stimulated by higher fish prices (including for fishmeal and fish oil). Capture production is not expected to increase very much at the beginning of the outlook period due to announced restraining production quotas in Chile in 2014. The El Niño effect on catches by Peru and Chile could cause a 2% decline in world capture fisheries in years in which it occurs. As a periodical phenomenon and
0
20
40
60
80
100Mt
China Other Asia Rest of the World
0
20
40
60
80
100Mt
China Other Asia Rest of the World
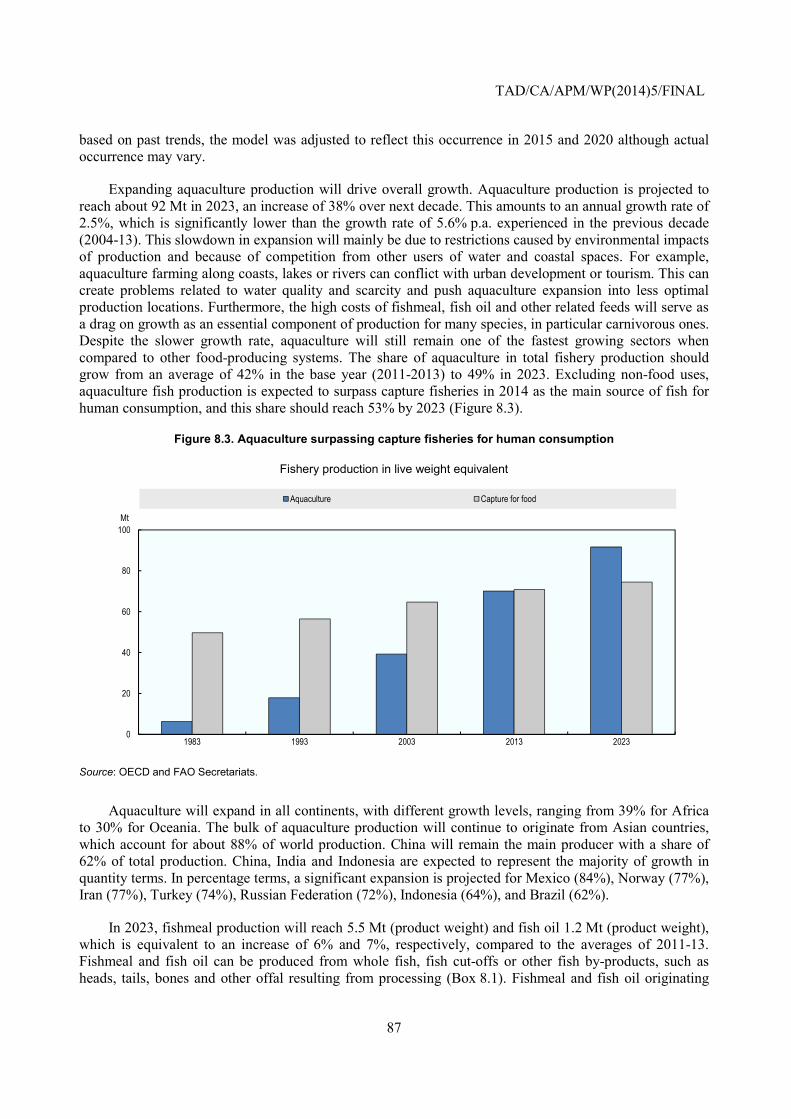
TAD/CA/APM/WP(2014)5/FINAL
87
based on past trends, the model was adjusted to reflect this occurrence in 2015 and 2020 although actual occurrence may vary.
Expanding aquaculture production will drive overall growth. Aquaculture production is projected to reach about 92 Mt in 2023, an increase of 38% over next decade. This amounts to an annual growth rate of 2.5%, which is significantly lower than the growth rate of 5.6% p.a. experienced in the previous decade (2004-13). This slowdown in expansion will mainly be due to restrictions caused by environmental impacts of production and because of competition from other users of water and coastal spaces. For example, aquaculture farming along coasts, lakes or rivers can conflict with urban development or tourism. This can create problems related to water quality and scarcity and push aquaculture expansion into less optimal production locations. Furthermore, the high costs of fishmeal, fish oil and other related feeds will serve as a drag on growth as an essential component of production for many species, in particular carnivorous ones. Despite the slower growth rate, aquaculture will still remain one of the fastest growing sectors when compared to other food-producing systems. The share of aquaculture in total fishery production should grow from an average of 42% in the base year (2011-2013) to 49% in 2023. Excluding non-food uses, aquaculture fish production is expected to surpass capture fisheries in 2014 as the main source of fish for human consumption, and this share should reach 53% by 2023 (Figure 8.3).
Figure 8.3. Aquaculture surpassing capture fisheries for human consumption
Fishery production in live weight equivalent
Source: OECD and FAO Secretariats.
Aquaculture will expand in all continents, with different growth levels, ranging from 39% for Africa to 30% for Oceania. The bulk of aquaculture production will continue to originate from Asian countries, which account for about 88% of world production. China will remain the main producer with a share of 62% of total production. China, India and Indonesia are expected to represent the majority of growth in quantity terms. In percentage terms, a significant expansion is projected for Mexico (84%), Norway (77%), Iran (77%), Turkey (74%), Russian Federation (72%), Indonesia (64%), and Brazil (62%).
In 2023, fishmeal production will reach 5.5 Mt (product weight) and fish oil 1.2 Mt (product weight), which is equivalent to an increase of 6% and 7%, respectively, compared to the averages of 2011-13. Fishmeal and fish oil can be produced from whole fish, fish cut-offs or other fish by-products, such as heads, tails, bones and other offal resulting from processing (Box 8.1). Fishmeal and fish oil originating
0
20
40
60
80
100
1983 1993 2003 2013 2023
Mt
Aquaculture Capture for food

TAD/CA/APM/WP(2014)5/FINAL
88
from whole fish are entirely produced from species caught in the wild. It is expected that the proportion of capture fisheries used to produce fishmeal will gradually decline to around 16% by 2023 from an average of about 19% in the period 2004-13. The decrease will be caused by a reduced availability of raw material due to limits set by government agencies based on stock assessments. It will also be caused by increased use of fish species for human consumption that were previously used for reduction as is already the case for some pelagic species in Norway and Iceland. The share of capture fisheries used for fishmeal will be slightly smaller in years of El Niño, owing to reduced anchoveta catches.
Sustained demand and high prices are expected to lead to more fishmeal and fish oil to be produced from fish waste and by-products obtained from the processing of fish into fillets, portions and similar forms. In 2023, fishmeal obtained from by-products is expected reach 36% of total production in 2023, up from 28% in 2011-13. For fish oil, this share could reach 41% of total production, compared with 33% in 2011-13. The use of fish by-products can affect the composition and quality of the resulting fishmeal/fish oil, because they contain, in general, less protein, more ash (minerals) and increased levels of small amino acids (such as glycine, proline, hydroxyproline) compared to fishmeal and fish oil obtained from whole fish. This difference in the composition may affect its potential for use aquaculture and livestock farming. However, this is not taken into consideration in the fish model and in the Outlook.
Box 8.1. Recycling fish residue in the fishmeal and oil market
The market for fishmeal and fish oil went through a revolution in the 1980s with the advent of aquaculture. Until aquaculture became a major outlet for fishmeal and fish oil, these products were predominantly parts of the larger protein meal and vegetable oil markets. They were both used in pigs and chicken feed ration. Fishmeal and fish oil are preferred feed inputs for aquaculture because of their unique ability to meet the nutritional needs of some fish species. Fishmeal is widely used in aquaculture while fish oil is primarily being used for carnivore finfish such as salmon, sea bass and sea bream.
From around 2000, there has been increasing pressure on fishmeal and fish oil prices due to strong demand from aquaculture and lower landings from the most significant reduction fisheries. The introduction of more stringent fisheries management practices first in Scandinavia and the United States, and then in Chile and Peru has led to lower landings. Moreover, a larger share of landings is being used for direct human consumption. In fact, captured fish used directly for reduction to fishmeal and fish oil dropped by 43% between 1992 and 2012.
More recently the increased awareness of the health benefits associated with Omega-3 consumption has led to a surge in the demand for fish oil for direct human consumption. According to IFFO, the Marine Ingredient Organisation, the share of fish oil in the Omega-3 market has increased from 5% in 1990 to 22% in 2012. While still 74% of the fish oil is going to aquaculture, fish farmers find themselves competing with a buyer that is able to pay substantially higher prices. Looking forward, aquaculture’s share of fish oil consumption is therefore likely to decline.
Higher prices for marine materials have produced new sources of supply. The fillet yield for most fish species varies between 30% and 65% of the mass of the fish. Trimmings and cut-offs that once were discarded are now being processed into fishmeal and fish oil. This development has been supported by the growth of more large scale processing facilities that provide enough waste to justify the investment in a fishmeal plant at the end of the processing line.
In most cases, official data do not directly break down fishmeal and fish oil production originating from reduction fisheries versus that obtained from fish residues. However, total production of these commodities and the quantity of fish reduced into fishmeal and fish oil are known. Combining this with an estimate of the fishmeal and oil yield from reduction fisheries, the quantity of fishmeal and oil produced from residues can be inferred. Data from Peru, where fishmeal and oil production is dominated by the reduction fishery, were used to estimate these yields.
In fact, yields will be smaller or higher in different countries because of differences in species used, but Peru seems to be a good representative of the global average. This is confirmed by the World Bank study “Fish to 2030: Prospects for Fisheries and Aquaculture”, based on the International Food Policy Research Institute (IFPRI)’s International Model for Policy Analysis of Agricultural Commodities and Trade (IMPACT model) which shows different yields by species and hence by countries, but arrives at a world average equal to the yields generated with the

TAD/CA/APM/WP(2014)5/FINAL
89
Peruvian data. Based on this approach, the share of world fish oil production originating from fish residue was estimated to have increased from 25% to 34% between 1995 and 2012. For fishmeal the same share has grown from 14% to 29% over the same period. Given the expected high prices over the next decade these shares should reach 40% and 35% respectively by 2023 according to the OECD/FAO Outlook.
A hypothetical scenario was studied with the FAO fish model, investigating the impact of a 25% reduction in the use of fish residues for oil and meal production in each country.
By 2023 that generates a 498 Kt and 120 Kt decline in fishmeal and fish oil production from fish residue respectively. This decline in supply leads to higher prices, by 16% and 18% respectively. Because of the fishing quotas, the resulting larger crushing margin only generates a small increase in fish reduction (0.9%). As a result, additional fishmeal and fish oil production from whole fish can only replace 50 Kt and 9 Kt of the assumed loss in production or 10% and 8% respectively. The decline in total fishmeal and fish oil production reaches 8% and 9.5% respectively in 2023. The resulting higher fishmeal and fish oil price reduces world aquaculture production by 0.66% in 2023 and capture, again because of the fishing quotas, can only replace 8% of the losses. The overall reduction in supply of fish leads to a 2% higher world price of fish in 2023.
This rather small impact is partly due to the fact that even though many aquaculture species use fishmeal only a limited number of species use large quantities in the compound feed ration. However, the impact is much stronger if the results of the agricultural scenario presented in the Box 4.2 “Structural changes in the feed market” are combined to the reduction in fishery recycling activities.
This is because many aquaculture species are fed with agricultural products or by-products. In the broader scenario, by 2023 the weighted average price of all feeds in China, the United States and the European Union increases by 15-17%. This leads to higher meat prices generating stronger fish demand. Consequently demand for fish and fishmeal is stronger and feed cost of producing aquaculture is larger. The world prices of fish and fishmeal in 2023 are therefore much stronger at 9.6% and 34% respectively compared to the baseline.
Consumption
Fish is expected to remain predominantly consumed as food. It is a valuable and nutritious contribution to diversified and healthy diets because it is a concentrated source of protein and of many other essential fatty acids and micronutrients. Fish that is not consumed as food is reduced into fishmeal and fish oil and serves other non-food uses, such as for ornamental fish, culturing, fingerlings and fry, bait, pharmaceutical inputs, and as direct feed for aquaculture, livestock and other animals. World per capita apparent fish consumption is projected to reach 20.9 kg in 2023, up from an average of 19.2 kg in 2011-13. The driving force behind this increase will be a combination of rising incomes and urbanisation, interlinked with the expansion of fish production, and improved distribution channels. However, the pace of this increase will slow in particular in the second half of the outlook period, when fish starts to become more expensive in comparison with meat. Overall, per capita apparent fish food consumption will increase by 0.5% p.a. during 2014-23, compared to 1.7% p.a. in 2004-13.
Despite the overall increase in the availability of fish to most consumers (Figure 8.4), growth patterns of apparent per capita fish consumption will be very uneven. For example, the most substantial rises will occur in Brazil (+45%, from 10.5 kg in the base period to 15.3 kg in 2023, mostly because of the significant expansion in domestic aquaculture production and of national initiatives to increase seafood consumption), Saudi Arabia (+37%, from 11.7 kg to 16 kg), other Eastern European countries (+29%, from 9.2 kg to 11.9 kg) and China (+ 23%, from 35 kg to 43 kg). Apparent fish consumption will remain static or decreasing in Japan (-5%, from 52.8 kg to 49.9 kg), in Canada (-7%), in selected Latin American countries and in Africa (-5%), in particular in Sub-Saharan Africa. Per capita apparent fish consumption in Africa is projected to decline during 2014-23, from 10.0 kg in 2011-13 to 9.5 kg in 2023. This decrease will be mainly caused by population growing more than supply. Between 2011-13 and 2023, the population in Africa is estimated to increase at 2.3% p.a., while the supply of fish for food consumption will increase by only 1.7% p.a. Projected production increases will be limited (+0.6% p.a.). In order to satisfy the growing demand, Africa is expected to become further dependent on fish imports (overall

TAD/CA/APM/WP(2014)5/FINAL
90
increase to 25%, at 2.5% p.a.), representing 38% of total fish consumed in Africa. The decline in per capita fish consumption in Africa can impact food security by reducing the intake of fish proteins and micronutrients. At present Africa has a higher proportion of fish to total animal protein intake compared to the world average.
Figure 8.4. Increase in fish consumption by region between the base period and 2023
Consumption growth of 30 Mt is projected by 2023; predominantly in Asia
Source: OECD and FAO Secretariats.
Disparities in fish consumption will continue to remain between developed and developing countries, with the latter having lower levels of consumption, though the gap is narrowing. In developing countries annual per capita fish consumption will rise from 18.4 kg in the base period to 20.4 kg in 2023. In the same period, per capita fish consumption in developed countries is estimated to increase from 22.6 kg to 23.2 kg. A sizeable and growing share of fish consumed in developed countries will be met by imports.
Population growth in the period 2014-23 is projected to be concentrated in urban areas, in particular in developing countries. In 2023, more than 57% of the world population will live in urban areas. The rural population is expected to decline in every continent except in Africa. Urbanisation will be one of the major driving forces that influence food consumption patterns including the demand for fishery products. City dwellers spend a higher proportion of their income on food purchases and change the composition of their food baskets towards more processed, convenience and higher value-added products that - like fish - contain high levels of proteins. However, marked differences exist, and will continue to remain, between and within countries and regions in terms of quantity and variety consumed per head and the subsequent nutritional contribution. These dissimilarities in consumption depend on the availability and cost of fish and other alternative foods, disposable incomes, and the interaction of several socio-economic and cultural factors. These factors include food traditions, tastes, demand, income levels, seasons, prices, health infrastructure and communication facilities.
Fishmeal and fish oil will be production constrained with risks of demand being higher than supply. Demand for fishmeal for high protein feed comes from both the aquaculture and livestock industries. Due to high prices and major innovation efforts, it is expected that the percentage of fishmeal and fish oil in compound feeds in aquaculture will continue its downward trend (Figure 8.5), and fishmeal and fish oil will be more frequently used as strategic ingredients to enhance growth at specific stages of fish
Africa9%
North America3%
Latin America and Caribbean6%
Asia81%
Oceania1%

TAD/CA/APM/WP(2014)5/FINAL
91
production, e.g. in fry. Fish oil is still expected to be used in the aquaculture industry, but will also be increasingly processed for direct human consumption. The reason for this is that fish oil - being rich in Omega-3 fatty acids - is considered to be beneficial for a wide range of human biological functions.
Figure 8.5. Reduction in the inclusion rate of fishmeal in animal feed rations
Ratio of fishmeal consumption to aquaculture production
Source: OECD and FAO Secretariats.
Trade
Fish and fishery products will continue to be highly traded fuelled by increasing consumption of fishery commodities, trade liberalisation policies, globalisation of food systems, and technological innovations in processing, preservation, packaging and transportation. About 37% of total fishery production is expected to be imported (32% excluding intra-EU trade)28 in the form of products for human consumption or for non-edible purposes by 2023. A share of this trade might consist of repeated trading of products in different processing stages among countries and regions. This practice of outsourcing processing activities at regional and world levels is expected to increase in the next decade, with raw material usually sent from European and North American markets to Asia (China in particular, but also in other countries such as India, Indonesia and Viet Nam) and Central and Eastern Europe for filleting and packaging, and then re-imported. This makes the fishery value chains complex and the sector highly globalised.
World trade of fish for human consumption is expected to reach 45 Mt in live weight equivalent in 2023, up 20% from the base period, but with the annual growth rate slowing from 2.7% in 2004-13 to 1.7% in 2014-23. This decline will be caused by increasing transportation costs, slower growth of fishery production and sustained domestic demand in some of the major exporting countries. Aquaculture will contribute to a growing share of the international trade in fishery commodities for human consumption with high-value species, such as salmon, sea bass, sea bream, shrimp and prawns, bivalves and other molluscs, but also relatively low-value species, such as tilapia, catfish (including Pangasius) and carps.
28 Including fishmeal converted into a live weight equivalent basis.
0
5
10
15
20
25
30
35
40
1993 1998 2003 2008 2013 2018 2023
%

TAD/CA/APM/WP(2014)5/FINAL
92
The next decade will be characterised by an increasing role played by developing countries in fishery trade (Figure 8.6) and the corresponding decline in the share of developed economies. Trade in fish is a significant source of foreign currency earnings, employment, income generation and food security for some developing countries. During next decade, developing countries will continue to lead fishery exports of fish for human consumption, slightly increasing their share in world trade from 67% to 68%. Due to their primary role in fishery production, 53% of world fish exports for human consumption will originate from Asia in 2023, with Asian countries being responsible for 62% of the overall growth of world exports. China will remain the major global exporter, accounting for over 22% of world trade and over 29% of all additional fishery exports by the close of the projection period. It is expected that Chinese exports will continue to be composed by goods produced from domestic and imported raw material. Among the non-Asian countries, Brazil and Mexico are projected to substantially increase their exports with growth rates of 66% and 44%, respectively.
Figure 8.6. Trade of fish for human consumption
Exports (left) and imports (right) of fish for human consumption in live weight equivalent
Source: OECD and FAO Secretariats.
Economic recovery in Europe and United States will revitalise demand for seafood while demand and consumption in Japan is projected to decline. Since production in Japan is not expected to fall, the decline in consumption will reduce imports of fish for human consumption by 16%. Limited growth prospects for domestic fishery production will mean that developed countries will remain highly dependent on external supplies to satisfy their domestic demand. Their imports are expected to increase by 13% over the outlook period. However, overall market growth will erode developed countries share in global imports from 55% in 2011-13 to 51% in 2023. Developing countries will increase imports for domestic consumption but also for raw material for processing and re-export, in particular for species not produced locally. Increasing imports are expected to be recorded by several Asian countries (including China, India, Indonesia and the Philippines), Brazil, selected countries in the Middle East and in Africa
Exports of fishmeal are projected to remain steady with 2.8 Mt product weight exported in 2014, increasing by only 2% in 2023. Developing countries led by Asia will remain the main exporters and importers of fishmeal, with a share of 76% and 72% of world trade, respectively. China alone should have a 35% share of world fishmeal imports in 2023, slightly declining from 38% in 2011-13. High international prices of fishmeal will push China’s domestic production of fishmeal to satisfy its aquaculture and
0
5
10
15
20
25
30
35Mt
Developed Developing
0
5
10
15
20
25
30
35Mt
Developed Developing

TAD/CA/APM/WP(2014)5/FINAL
93
livestock (in particular pigs) industries. Peru and Chile will continue to be leading exporters of fishmeal, but their combined share in total exports will decrease from 52% in 2011-13 to 46% in 2023. Fish oil exports are expected to increase by 6% over next decade, with developing countries exporting 65% of the total. Due to salmon farming and growing demand for fish to be consumed as food, European countries will represent the main importers with a 48% share of global fish oil imports, and with Norway alone accounting for 24% of the world imports in 2023.
Main issues and uncertainties
The fish projections reported in this chapter are based on specific assumptions. The future prospects of the fishery and aquaculture sector will depend on its capacity to deal with different challenges, both globally and locally. These include the allocation of fishing rights and the economic sustainability of the sector; multilateral trade negotiations within the World Trade Organization (WTO), including the focus on fishery subsidies; and economic crises, which can weaken the demand for fishery products and increase the risk of import barriers and tariffs. Market changes can also present a major challenge. The outsourcing of production and introduction of private standards, including for environmental and social purposes, their endorsement by major retailers, and their possible effect on market access for developing countries will challenge current approaches. More stringent rules for quality and safety of food products may also be expected. In this context, it is important to mention that the new EU Regulation 1169/2011 on the provision of food information to consumers will change the existing legislation on food labelling. Regulations on the sell-by/expiry dates of foodstuffs will come into effect on the 13 December 2014, while the articles regarding nutritional labelling will come into force on 13 December 2016. At present, there is no obligation to specify the sell-by/expiry dates of imported fishery products in fresh form into the European Union, but from December 2014 onwards countries exporting fresh fishery products to the European Union will have to bring their products into conformity with the new regulations. Exporters to the European Union will need to label the goods properly to avoid any alerts, rejections or blocks regarding the quality of their products. This might imply the need to conduct internationally certified and valid laboratory tests for knowing the shelf life of the various categories of their fishery products.
Model projections call for stable capture fisheries production over the next decade, with a slight increase by 2023. This reflects stable production trends since the 1990s, with production fluctuating around 90 Mt, but also the way the fish model is constructed.29 The effective prospects of capture fisheries are rather difficult to determine, because they depend on the natural productivity of fish stocks and ecosystems and are subject to many variables and uncertainties. According to FAO estimates30, the percentage of stock groups monitored by FAO which are underexploited is diminishing, with 30% at a biologically unsustainable level and therefore overfished. A share of current catches has also been obtained by fleets moving their operations from depleted areas to new areas, a practice which can cause a long term decline in global catches as overexploitation spreads. At the same time, owing to better resource management practices, some fisheries and stocks are showing signs of recovery, which could help to maintain and stabilise overall catches.
There is a risk that the effects of reduced ecosystem productivity and changing ecosystem structures can worsen, in particular in areas beyond national jurisdiction (ABNJs). The marine ABNJ are those areas of oceans for which no one nation has the specific or sole management responsibility. They comprise about 64% of the surface of the oceans and almost 95% of their volume but minority of the total catch. They 29 In the fish model, production of capture fisheries is kept exogenous for most countries as being tightly
managed, while it is endogenous responding to prices for other countries not subject to quotas and it is endogenous with no price elasticity for the South American countries affected by El Niño.
30 See sections on the Status of the Fisheries Resources, in part 1 of State of World Fisheries and Aquaculture (SOFIA) 2012 and 2014 available at http://www.fao.org/fishery/sofia/en.

TAD/CA/APM/WP(2014)5/FINAL
94
include complex ecosystems that are subject to impacts from a variety of sectors, including shipping, pollution and deep-sea mining. ABNJs are sometimes characterised by lack of institutional frameworks that regulate access. Sustainable management of fisheries resources and biodiversity conservation in those areas are difficult and challenging. Issues related to the conservation and sustainable management of biodiversity in ABNJ are currently being discussed by a dedicated UN Ad Hoc Open-ended Informal Working Group. In accordance with the RIO +20 declaration “The future we want”, a decision on whether to launch negotiations on an United Nations Convention on the Law of the Sea (UNCLOS) implementing agreement will be taken before the end of the United Nations General Assembly 69 session in 2015. Furthermore, the overcapacity of fishing fleets globally and illegal unreported and unregulated (IUU) fishing are other important threats affecting the sustainability of fisheries resources. They can be found in all types and dimensions of fisheries, including inland waters. They concern all aspects and stages of the harvest and utilisation of fish, and in some instances IUU fishing is associated with organised crime. These situations are also linked with, and exacerbated by, the poor governance characterising several fisheries activities. The fishery sector can also be affected by competition from other sectors over the use of natural resources and ecosystems, and by effects of climate change, pollution, and ocean acidification with resulting damage to habitats, ecological functions and biodiversity.
The projections indicate that majority of future growth in fish production will come from aquaculture. However, the prospects for this sector can be limited by concerns over the environmental, spatial or legal impacts and as competition for land, water, financial and other productive resources increase. In particular the growth will depend on several factors, including the availability and accessibility to technology, financial resources, and areas and water of good quality; availability, sustainability and cost of fishmeal and fish oil and of other alternative sources of feeding for fed species, in particular carnivorous ones; and the availability of fish seeds.31 The future of aquaculture also depends on environmental externalities including climate change, pollution and problems that can originate from not guided and monitored aquaculture practices such as degradation of land and marine habitats and pollution (as, for example, from discharges of organic wastes, nitrogen and phosphorous), endangered biodiversity through escapees and transfer of non-native and native diseases and parasites to surrounding production areas; inadequate biosecurity measures and disease outbreaks. In order to grow further, the aquaculture sector needs to address these environmental externalities it can cause. It also requires an accommodating governance framework that supports innovation in production and environmental prevention and mitigation. For example, the current limited aquaculture production of several OECD countries is not simply a question of competitiveness, but it is also caused by the regulatory framework. Governments can spur new growth in the sector by addressing the limitations of current approaches to unleash the potential of the sector. National development plans, institutional innovation, certification, aquaculture licencing systems, cooperation among the various stakeholders and spatial planning (including addressing user conflicts) have all been identified as ways to improve the prospects of aquaculture. Future growth of aquaculture will also depend on how the sector will invest to enhance productivity in a sustainable manner through technological development and better management practices. Improvements in genetics, breeding and nutrition are particularly important as well as progress in developing substitutes for fishmeal and fish oil in feeds used to farm aquaculture species.
To meet some of the challenges faced by the fisheries and aquaculture sectors and identified in the outcome document of the United Nations Conference on Sustainable Development (United Nations, 2012) and the post-2015 development agenda (United Nations, 2014), FAO has formulated the “Blue Growth” initiative as a coherent approach for the sustainable, integrated and socio-economically sensitive
31 Fish seeds indicate eggs, spawn, offspring, progeny or brood of the aquatic organism (including aquatic
plants) being cultured. At this infantile stage, seed may also be referred to or known as fry, larvae, postlarvae, spat, and fingerlings. They may originate from two principal sources: from captive breeding programmes or caught from the wild.

TAD/CA/APM/WP(2014)5/FINAL
95
management of oceans and wetlands focusing on four components: capture fisheries, aquaculture, ecosystem services, and trade and social protection of coastal communities. The initiative is grounded on the principles of the 1995 FAO Code of Conduct for Responsible Fisheries and its associated guidelines (FAO, 1995). The Blue Growth framework promotes responsible and sustainable fisheries and aquaculture by way of an integrated approach involving all stakeholders. Through capacity development, it will strengthen the policy environment, institutional arrangements and the collaborative processes that empower fishing communities, civil society organisations and public entities. To achieve its integrated approach to Blue Growth, FAO is collaborating with a wide array of other UN agencies, intergovernmental organisations and other initiatives or processes where synergies exist with the work of FAO.
The OECD Green Growth Strategy, based on the idea that it is both possible and necessary to achieve sustained economic growth while reducing the human impact on the environment, is also particularly relevant for fisheries and aquaculture that depend more than most economic sectors on environmental resources. Some potential avenues for growth have been investigated already by the OECD Committee for Fisheries in its work on Green Growth, including energy use, waste and governance, and there remain many other areas to be tackled in the future.
Fishery projections presented in this Outlook for the European Union do not take into consideration the effects that can be generated by the implementation of the new Common Fisheries Policy (CFP) which could increase EU capture fisheries and aquaculture production during the next decade. The CFP has been agreed by Council and Parliament and is effective from 1 January 2014.32 The main goals of the new CFP are to bring fish stocks back to sustainable levels (by setting fishing levels at maximum sustainable yield levels by 2015 where possible, and at the latest by 2020 for all fish stocks), put an end to wasteful fishing practices, and create new opportunities for jobs and growth in coastal areas. To achieve this CFP focuses on banning discards, empowering the sector and decentralising decision making, emphasising aquaculture, supporting small scale fisheries, improving the scientific knowledge on the state of stocks and taking responsibility in foreign waters through the EU's international agreements. The European Maritime and Fisheries Fund (EMFF) is the funding instrument that will support the implementation of the reformed CFP and should come into force during 2014. Through the new CFP, overall EU production from both capture fisheries as well as aquaculture could increase in the next decade.
Among policies introduced by the CFP, it is important to mention a landing obligation, with the scope to reduce the current high levels of unwanted catches and to gradually eliminate discards. An obligation to land all catches ("the landing obligation") of species which are subject to catch limits and, in the Mediterranean Sea, also catches of species which are subject to minimum sizes, has been established and will be gradually implemented. The landing obligation will be gradually introduced between 2015 and 2019 for different regions and different fisheries, starting with all pelagic fisheries and fisheries in the Baltic Sea. The Basic Regulation stipulates a clear timetable and a framework for implementing the landing obligation. However, this framework needs to be specified and operationalised on a regional level. Specific measures and rules of implementation avoiding unwanted catches could be for example more selective gear, restricting access to juvenile aggregation areas, exemption from the discard ban due to high survival, real time closures and rules on documentation.
References
United Nations (2012), “The future we want”, www.uncsd2012.org.
32 More information is available at http://ec.europa.eu/fisheries/reform/index_en.htm.

TAD/CA/APM/WP(2014)5/FINAL
96
United Nations (2014). “Millennium Development Goals and post-2015 Development Agenda”, www.un.org/en/ecosoc/about/mdg.shtml.
FAO (1995), Code of Conduct for Responsible Fisheries Rome, Food and Agriculture Organization, Rome.

TAD/CA/APM/WP(2014)5/FINAL
97
Chapter 9. Dairy
Abstract
This chapter describes the market situation and the latest set of quantitative medium-term projections for global and national dairy markets for the ten-year period, 2014-23. The discussion of the medium term market prospects for dairy covers the developments expected in national milk production, and world and national dairy product prices, production, food consumption and trade (imports and exports). The quantitative projections are developed with the aid of the partial equilibrium Aglink-Cosimo model of world agriculture. Included in the chapter are two boxes on i) challenges and opportunities facing China’s dairy sector and ii) milk and dairy products in human nutrition. The chapter concludes with a discussion of some main issues and uncertainties affecting the medium term outlook for dairy. These include dairy policies, and specific market development influencing production, consumption and trade in dairy.
Market situation
In early 2012, high returns and excellent pasture conditions in Oceania, and parts of South America, generated a supply response triggering a fall in milk and dairy prices. With demand continuing to expand, especially from China, prices bottomed out in mid-2012 at levels much higher than during the previous downturn in 2009. The decline in Chinese milk production by 5.7% in 2013 led to strong import demand for dairy products and to higher world dairy prices. Additionally, during the first half of 2013, major players on the world dairy market - the United States, the European Union, New Zealand and Australia - produced less milk than a year ago. The main reasons were high feed cost and adverse weather conditions in Oceania and parts of Europe. Prices for skim milk powder (SMP) and whole milk powder (WMP) reached a new peak in April 2013, above the level of the 2007/08 commodity boom. Production in the major dairy exporting countries started to increase in mid-2013, as feed prices declined and milk margins improved. Nevertheless, due to continued strong demand on the world market, prices of dairy products remain high into the year 2014.
Projection highlights
• World milk production is projected to increase by 180 Mt by 2023 when compared to the base years (2011-13), the majority of which (78%) is anticipated to come from developing countries. The average growth rate for the projection period is estimated at 1.9% which is below the 2.2% witnessed in the last decade. The slowdown in growth reflects growing shortages of water and suitable land in developing countries combined with a slow introduction of modern dairy production systems.
• Several dairy product prices reached new highs during 2013, and a correction is expected in the near future, followed by firming nominal prices over the medium term. Real prices are projected to decline slightly in the next decade, albeit remaining considerably above the pre-2007 levels.
• Per capita consumption of dairy products in developing countries is expected to increase by 1.2% to 1.9% p.a. The expansion in demand reflects robust income growth and further globalisation of

TAD/CA/APM/WP(2014)5/FINAL
98
diets. By contrast, per capita consumption in the developed world is projected to increase between 0.2% and 0.9% p.a.
• A general expansion of trade in dairy products is expected over the coming decade. Strong growth is expected for whey, cheese and SMP, at more than 2% p.a. Lower growth is expected for WMP, at 1.7% p.a., and especially butter at 0.7% p.a. The bulk of this growth will be satisfied by expanded exports from the United States, the European Union, New Zealand, Australia and Argentina.
Figure 9.1. World dairy prices in nominal terms
Source: OECD and FAO Secretariats.
Figure 9.2. World dairy prices in real terms (2005 USD)
Source: OECD and FAO Secretariats.
0
1 000
2 000
3 000
4 000
5 000
6 000
1993 1998 2003 2008 2013 2018 2023
USD/t
Butter Skim milk powder Whole milk powder Cheese
0
500
1 000
1 500
2 000
2 500
3 000
3 500
4 000
4 500
5 000
1993 1998 2003 2008 2013 2018 2023
USD/tButter Skim milk powder Whole milk powder Cheese

TAD/CA/APM/WP(2014)5/FINAL
99
Market trends and prospects
Prices
Milk and dairy product prices increased in 2013 due to a large production shortfall in China and increasing feed costs. Additionally, during the first half of 2013, major players on the world dairy market - the United States, the European Union, New Zealand and Australia - produced less milk than a year ago. Production in the major dairy exporting countries started to react to the price signals during 2013. In addition, starting mid-2013, prices for feed grains became considerably lower, compared to last year. Combined with an expected recovery of the domestic milk production in China, this will likely lead to declining dairy and milk prices in the near future (Figure 9.1).
Over the medium-term, increasing incomes and globalisation of diets are expected to raise the demand for milk and dairy products in developing countries. Most of the growth in demand will be satisfied domestically by increasing dairy herds and rising yields. The increasing import demand will support prices of dairy products during the next decade. Cheese prices are expected to develop the strongest over the outlook period. On the other hand, butter prices are expected to remain below SMP prices in the next decade.
Over the next ten years, it is expected that real dairy product prices will decline slightly. This is partly due to the current higher price levels but also to the expected continued productivity growth in the dairy sector (Figure 9.2). Nevertheless, real prices will be substantially higher than in the period before 2007.
The Outlook price projections reflect the usual assumptions of stability in weather and in economic and policy conditions. Under these “normal” conditions, prices are not expected to reach the peak levels of 2007/08, 2011 or 2013. However, actual price outcomes are likely to exhibit significant variations around the projection trend.
Production
World milk production growth is expected to decrease over the next decade, from 2.2% to 1.9% p.a. The growth in milk production originates to 78% from developing countries, where growth rates slowdown from 3.6% to 2.8% p.a. In developing countries, most of the production growth stems from an increase in the dairy herd (1.6% p.a.), compared to yield growth (1.2% p.a.), reflecting a slow introduction of modern dairy production systems; but especially the herd growth is limited due to constraints in water and land availability. In Asia, for example, the milk yield growth will contribute more to production increases in the coming decade as the environmental constraints are more binding than in Africa and Latin America.
India is expected to outpace the European Union and will become the largest milk producer in the world. Almost the entire Indian production, with a very high share of buffalo milk, is consumed fresh, and only very small amounts are further processed (Figure 9.3).
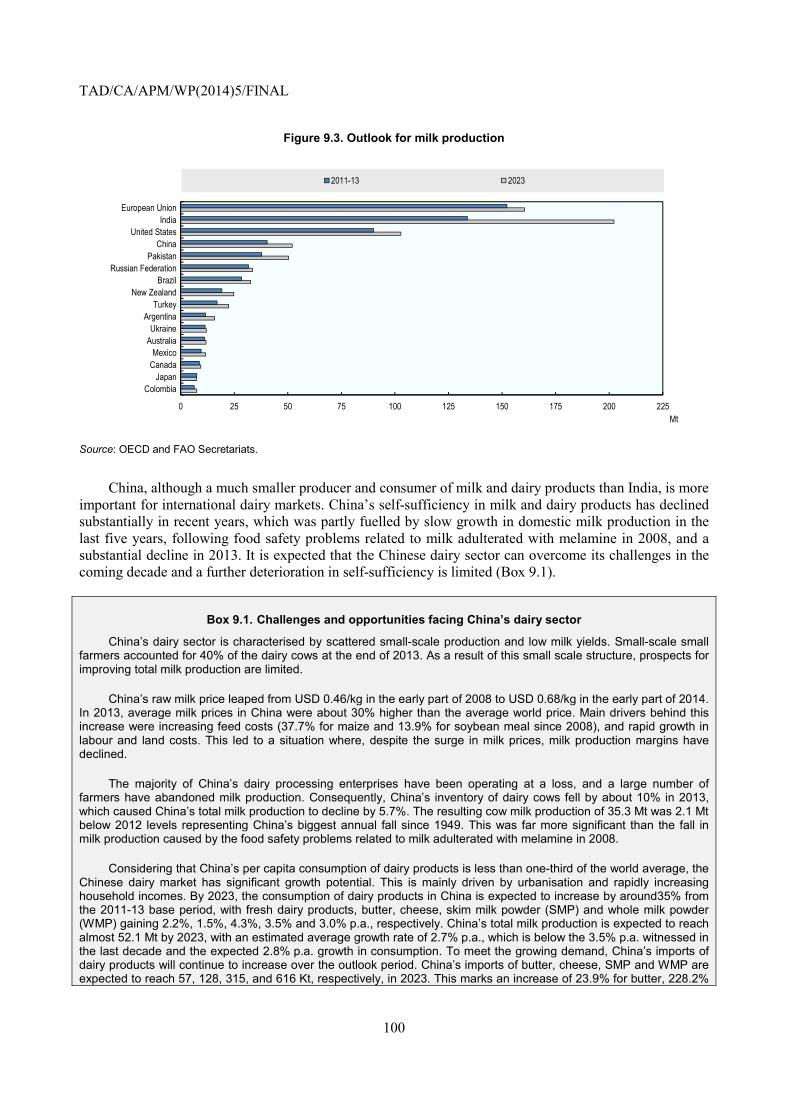
TAD/CA/APM/WP(2014)5/FINAL
100
Figure 9.3. Outlook for milk production
Source: OECD and FAO Secretariats.
China, although a much smaller producer and consumer of milk and dairy products than India, is more important for international dairy markets. China’s self-sufficiency in milk and dairy products has declined substantially in recent years, which was partly fuelled by slow growth in domestic milk production in the last five years, following food safety problems related to milk adulterated with melamine in 2008, and a substantial decline in 2013. It is expected that the Chinese dairy sector can overcome its challenges in the coming decade and a further deterioration in self-sufficiency is limited (Box 9.1).
Box 9.1. Challenges and opportunities facing China’s dairy sector
China’s dairy sector is characterised by scattered small-scale production and low milk yields. Small-scale small farmers accounted for 40% of the dairy cows at the end of 2013. As a result of this small scale structure, prospects for improving total milk production are limited.
China’s raw milk price leaped from USD 0.46/kg in the early part of 2008 to USD 0.68/kg in the early part of 2014. In 2013, average milk prices in China were about 30% higher than the average world price. Main drivers behind this increase were increasing feed costs (37.7% for maize and 13.9% for soybean meal since 2008), and rapid growth in labour and land costs. This led to a situation where, despite the surge in milk prices, milk production margins have declined.
The majority of China’s dairy processing enterprises have been operating at a loss, and a large number of farmers have abandoned milk production. Consequently, China’s inventory of dairy cows fell by about 10% in 2013, which caused China’s total milk production to decline by 5.7%. The resulting cow milk production of 35.3 Mt was 2.1 Mt below 2012 levels representing China’s biggest annual fall since 1949. This was far more significant than the fall in milk production caused by the food safety problems related to milk adulterated with melamine in 2008.
Considering that China’s per capita consumption of dairy products is less than one-third of the world average, the Chinese dairy market has significant growth potential. This is mainly driven by urbanisation and rapidly increasing household incomes. By 2023, the consumption of dairy products in China is expected to increase by around35% from the 2011-13 base period, with fresh dairy products, butter, cheese, skim milk powder (SMP) and whole milk powder (WMP) gaining 2.2%, 1.5%, 4.3%, 3.5% and 3.0% p.a., respectively. China’s total milk production is expected to reach almost 52.1 Mt by 2023, with an estimated average growth rate of 2.7% p.a., which is below the 3.5% p.a. witnessed in the last decade and the expected 2.8% p.a. growth in consumption. To meet the growing demand, China’s imports of dairy products will continue to increase over the outlook period. China’s imports of butter, cheese, SMP and WMP are expected to reach 57, 128, 315, and 616 Kt, respectively, in 2023. This marks an increase of 23.9% for butter, 228.2%
0 25 50 75 100 125 150 175 200 225
ColombiaJapan
CanadaMexico
AustraliaUkraine
ArgentinaTurkey
New ZealandBrazil
Russian FederationPakistan
ChinaUnited States
IndiaEuropean Union
Mt
2011-13 2023
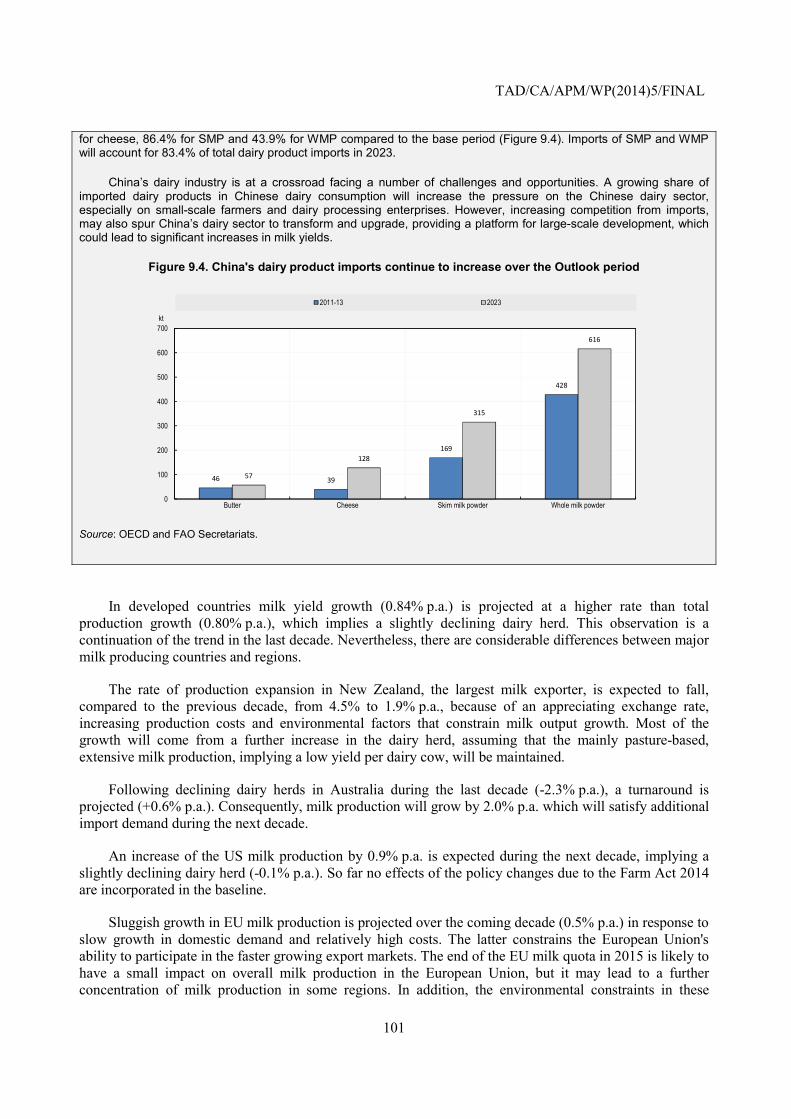
TAD/CA/APM/WP(2014)5/FINAL
101
for cheese, 86.4% for SMP and 43.9% for WMP compared to the base period (Figure 9.4). Imports of SMP and WMP will account for 83.4% of total dairy product imports in 2023.
China’s dairy industry is at a crossroad facing a number of challenges and opportunities. A growing share of imported dairy products in Chinese dairy consumption will increase the pressure on the Chinese dairy sector, especially on small-scale farmers and dairy processing enterprises. However, increasing competition from imports, may also spur China’s dairy sector to transform and upgrade, providing a platform for large-scale development, which could lead to significant increases in milk yields.
Figure 9.4. China's dairy product imports continue to increase over the Outlook period
Source: OECD and FAO Secretariats.
In developed countries milk yield growth (0.84% p.a.) is projected at a higher rate than total production growth (0.80% p.a.), which implies a slightly declining dairy herd. This observation is a continuation of the trend in the last decade. Nevertheless, there are considerable differences between major milk producing countries and regions.
The rate of production expansion in New Zealand, the largest milk exporter, is expected to fall, compared to the previous decade, from 4.5% to 1.9% p.a., because of an appreciating exchange rate, increasing production costs and environmental factors that constrain milk output growth. Most of the growth will come from a further increase in the dairy herd, assuming that the mainly pasture-based, extensive milk production, implying a low yield per dairy cow, will be maintained.
Following declining dairy herds in Australia during the last decade (-2.3% p.a.), a turnaround is projected (+0.6% p.a.). Consequently, milk production will grow by 2.0% p.a. which will satisfy additional import demand during the next decade.
An increase of the US milk production by 0.9% p.a. is expected during the next decade, implying a slightly declining dairy herd (-0.1% p.a.). So far no effects of the policy changes due to the Farm Act 2014 are incorporated in the baseline.
Sluggish growth in EU milk production is projected over the coming decade (0.5% p.a.) in response to slow growth in domestic demand and relatively high costs. The latter constrains the European Union's ability to participate in the faster growing export markets. The end of the EU milk quota in 2015 is likely to have a small impact on overall milk production in the European Union, but it may lead to a further concentration of milk production in some regions. In addition, the environmental constraints in these
46 39
169
428
57
128
315
616
0
100
200
300
400
500
600
700
Butter Cheese Skim milk powder Whole milk powder
kt
2011-13 2023

TAD/CA/APM/WP(2014)5/FINAL
102
regions might limit further growth. Overall, due to the shifts, a faster increase in average yields is expected during the outlook period (2.3% p.a.) than in the decade before (1.3% p.a.).
The processing of milk into the four main dairy products - butter, cheese, SMP and WMP - is increasing at world level at similar pace as milk production. In the outlook period it is expected that butter (2.1% p.a.), SMP (1.9% p.a.) and WMP (2.2% p.a.) increase slightly faster than world milk production (1.9% p.a.), whereas cheese (1.6% p.a.) grows slower. The growth rates also reflect that in the case of butter and WMP the majority of the production occurs in developing countries with a faster growth in milk production, whereas in the case of cheese and SMP it is in the developed ones.
Consumption
The largest share of milk and dairy product consumption is in the form of fresh dairy products, taking up about 70% of total milk production. This share continues to increase due to raising milk production in developing countries where this share is considerably higher. A publication by the FAO (2013) looks into milk and dairy products in human nutrition and assesses especially the situation in developing countries (Box 9.2).
Per capita consumption of dairy products in developing countries is expected to increase on average by 1.9% p.a. for cheese and butter and by 1.2% p.a. for SMP and WMP. The expansion in demand reflects robust income growth, expanding populations and a further globalisation of diets.
By 2023, per capita consumption of fresh dairy products in India is expected to increase to around 171 kg per capita, compared to per capita consumption of 104 kg in Australia, 93 kg in the European Union, 86 kg in New Zealand, 75 kg in Canada, 72 kg in the United States and 26 kg in China. Nevertheless, total consumption of dairy products in milk equivalent is considerably higher in developed countries than in developing ones (Figure 9.5). The difference stems mostly from the per capita consumption of cheese which is more than tenfold in developed countries compared to developing ones.
The high butter to vegetable oil price ratio is assumed to constrain demand for butter and milk fat. The increasing replacement of milk fat by vegetable oils occurs in food preparations, fat-filled powders, table spreads and cooking oil, exerting downward pressure on butter consumption and prices. Overall, the demand for milk protein is growing faster than the demand for milk fat over the next decade, which implies that the butter price will remain below the SMP price on the world market.
Figure 9.5. Major dairy product consumption (in milk equivalent
0
50
100
150
200
250
300
350
400
Europe North America North Africa Latin America andCaribbean
World Asia and Pacific Sub-Saharan Africa
kg/capita, milk equivalent
Per capita consumption (PCC), 2011-13 average Per capita consumption (PCC), 2023 level

TAD/CA/APM/WP(2014)5/FINAL
103
Note: The coefficients used to calculate the consumption in milk equivalent are: Fresh dairy products 1, butter 18.2, cheese 9.247, skim milk powder 11.944, and whole milk powder 8.37.
Source: OECD and FAO Secretariats.
Box 9.2. Milk and dairy products in human nutrition
Billions of people consume milk and dairy products every day. Not only are milk and dairy products a vital source of nutrition, they also present livelihood opportunities for farmers, processors, shopkeepers and others in the dairy value chain. The FAO has just published a book entitled Milk and Dairy Products in Human Nutrition1, which draws together information on nutrition, dairy farming and dairy-industry development from a wide range of sources and explores the linkages between them. An important focus is the development of dairy value chains, a key strategy for improving diets and raising income levels amongst the poorest segments of the world’s population.
With rising incomes and increased production, milk and dairy products have become an important part of the diet in some parts of the world where little milk was consumed in the 1970s - particularly in Asia. The interconnectivity between dairying, human nutrition and health are highlighted. While, growing consumption of dairy and livestock products brings important nutritional benefits to large segments of the population in developing countries, there are still many millions who cannot afford better-quality diets owing to the higher cost.
The report highlights the role of dairy-industry development programmes in promoting food and nutrition security and reducing poverty. Increasing demand and relatively high prices for milk and dairy products provide an opportunity for millions of smallholder dairy farmers to improve their livelihood. In many parts of the world, milk and dairy products are highly valued and have an important role in both household food security and income generation. Experience has shown that dairy-industry development projects often have a positive effect on household health and nutrition, in addition to providing employment and income, and can make a substantial and sustainable contribution to poverty reduction. In examining sustainable approaches, the report concludes that support to national or regional groupings, such as cooperatives or associations, assisted by the integrated supply of inputs and support services, can benefit tens of millions of farm families.
Dairying is important in agriculture in that it can provide not only daily food at the household level but also a regular income. Moreover, dairy animals may be used for traction and provide manure for use as both fertiliser and fuel. Strategic investment in, and promotion of, dairy farming can raise farm income, contribute to improved nutrition and create employment in the wider community via processing and distribution and related activities.
1 The book represents a revisiting of the subject by FAO, with the title first published in 1959 and a revised second edition released in 1972.
Trade
A general expansion in dairy trade is expected over the coming decade. The growth rates differ between dairy products at 0.7% annually for butter, cheese (2.4% p.a.), SMP (2.5% p.a.) and WMP (1.7% p.a.). The vast bulk of this growth will be met by increased exports from the United States, European Union, New Zealand and Australia. These four countries account jointly for 74% of world cheese, 74% of world WMP, 81% of world butter and 86% of world SMP exports in 2023 (Figure 9.6).
The European Union will remain the main cheese exporter (accounting for 39% of world exports in 2023), but its growth rate is below that of the other major cheese exporters, i.e. New Zealand, the United States and Australia. Several other countries like Saudi Arabia, Belarus, Ukraine, Egypt, Turkey and Argentina export considerable amounts of cheese predominantly to neighbouring markets. New Zealand remains the primary source for butter on the international market, at 47% market share, although losing some share to the other major exporters. In case of WMP, it is expected that New Zealand can increase its share in world trade over the next decade to 57% in 2023. Other important exporters are the European Union, Argentina and Australia. The United States is the largest source of SMP exports, at 34% in 2023, and is expected to expand more rapidly than the other major suppliers like the European Union, New Zealand and Australia. Considerable increases are expected for Indian SMP exports, to about 90 Kt

TAD/CA/APM/WP(2014)5/FINAL
104
by 2023. Country coverage of the whey powder market is limited, but trade is projected to increase considerably in the coming decade. Exports of the European Union, the United States and New Zealand are all expected to grow by more than 3% p.a. and will reach a combined 1.2 Mt of exports in 2023.
Figure 9.6. Dairy product exporter
Source: OECD and FAO Secretariats.
In recent years, considerable growth has occurred in fresh dairy trade, which is not incorporated in this Outlook. This comprises not only products like yogurts and cream but also liquid milk. One important trade flow is liquid milk exported from the European Union to China (100 Kt in 2013, up from 56 Kt in 2012). Nevertheless, this remains small in relation to the trade in the dairy products covered and might only be a temporary phenomenon.
In contrast to dairy exports, imports are much wider spread and generally the dominant destinations for dairy products are developing countries, especially in Asia and Africa. Only for cheese considerable imports occur in developed countries (Figure 9.7).
Cheese imports in developed countries are currently higher than in developing countries, but it is expected that cheese imports in developing countries will grow at a much faster rate (4.4% p.a.) than in developed countries (0.7% p.a.). The Russian Federation remains the primary importer followed by Japan. China is expected to overtake Mexico, the United States, Saudi Arabia and Korea, which are all projected to import more than 80 Kt (3% of world imports) by 2023. Butter imports by developed countries continue to decline (-2.3% p.a.). The Russian Federation remains the main destination of butter, but domestic production increases faster than consumption. Increases in butter imports are expected in developing countries. The two main destinations are Egypt and Saudi Arabia which are closing the gap on the Russian Federation. WMP imports skyrocketed in recent years in China, and a further continuation in growth is expected but at a much slower rate (0.6% p.a.). Other important destinations remain Algeria, Nigeria and Saudi Arabia. In the case of SMP, China will become the world’s major importer. Mexico, Indonesia, Algeria, Malaysia and Egypt are other important importers; all with continued growth but at a considerably slower pace than in the preceding decade.

TAD/CA/APM/WP(2014)5/FINAL
105
Figure 9.7. Major dairy product importers
Source: OECD and FAO Secretariats.
Main issues and uncertainties
The development of Chinese self-sufficiency in milk and dairy products is a main determinant of the future price development on world dairy markets. It is currently expected that the Chinese milk production will start to grow again from this year onwards. Any delay would result in higher dairy prices worldwide.
In 2015, the EU system of milk quotas is scheduled to end. The Outlook projects a smooth transition, because actual output remained well below EU quota levels in historic years for most EU member states. Other observers expect a strong supply reaction in the European Union to the end of quota which would increase exports and result in lower world market prices for dairy products. This may also cause higher volatility of milk production and dairy product supply from the European Union.
The US Farm Act 2014 redesigned the support to dairy in the United States. The new Margin Protection Program (MPP) makes payments to dairy producers when the difference between milk prices and feed costs falls below a minimum level. The differences will be calculated nationally on a rolling two-month’s average, and producers can opt to secure differences in the range from USD 4 to USD 8 per hundredweight (cwt) for 25% to 90% of their historic production. The baseline makes no assumption about the effect of the policy change. Nevertheless, it could result in increasing US output and exports.
As we have seen in recent years, unusual weather events can have a major impact on dairy markets through their impact on feed grains or pasture conditions. The Outlook assumes normal weather conditions from 2013 onwards. However, as climate change models increasingly predict an increase in the incidence and severity of extreme weather events, the probability of abnormal conditions may be increasing. The largest supplier of dairy exports, New Zealand, is weather dependent due to the predominantly pasture-based production.
Environmental legislation can have strong impacts on the future development of dairy production. The greenhouse-gas emissions from dairy activities make up a considerable share of the total emissions in some countries, and any changes in related policies could affect dairy production. Water access and manure management are additional areas where policy changes could have an impact on the dairy industry.

TAD/CA/APM/WP(2014)5/FINAL
106
Dairy demand and export opportunities could also be affected by the outcome of various Free Trade Agreements (FTA) and Regional Trade Agreements (RTA) agreements currently under discussion. These agreements could increase international dairy trade through specific market access changes and also by simplifying bilateral sanitary requirements. Another important point for international trade are applied tariffs among developing countries which are often set below their bound WTO levels and thus can be varied at short notice.
Underlying the outlook for international dairy prices is the assumption of continued strong growth in incomes among developing countries, especially in the Middle East, North Africa, South East Asia and China. Any slowdown in economic activity in any of these regions could trigger a significant downturn in dairy prices. It is also assumed that no major outbreaks of animal diseases occur during the outlook period, which could alter the setting rapidly.
References
FAO (2013), Milk and Dairy Products in Human Nutrition, FAO publications, Rome, http://www.fao.org/docrep/018/i3396e/i3396e.pdf
TAD/CA/APM/WP(2014)5/FINAL
107
Chapter 10. Cotton
Abstract
This chapter summarises the current situation and medium-term projections for world cotton markets during 2014-2023. Expected developments in national and global cotton prices, production, use, trade (imports and exports) and stocks, and the background to these developments, are discussed. The underlying quantitative projections are developed with the aid of the partial equilibrium Aglink-Cosimo model of world agriculture. A separate section examines China’s cotton policies, which are a significant source of variation and uncertainty during the outlook period. Other sources of uncertainty addressed include shifts in consumer demand and trends in both agricultural and industrial technology
Market situation
World cotton prices in 2013 were influenced by competing forces, with world demand again rising after a prolonged decline that began in 2007 and elevated stock levels creating uncertainty about future prospects. Falling prices for grains and oilseeds helped reduce cotton prices, but tight supplies of high quality cotton in the United States offset some of this impact. World cotton stocks rose for the fourth consecutive year, but again most of the increase was accounted for by official reserve building in China. Consumption continued to decline in China - the world’s largest industrial consumer by a large margin - but increased in a number of other countries as China’s yarn imports rose sharply. Steady to higher world production is widely foreseen in the coming year, with early reports indicating an intention of US farmers to plant 4.5 Mha, a 7% increase. China’s area is expected to decline, as the support for farmers in China’s eastern provinces is reduced.
Projection highlights
World cotton use is expected to grow at 2.4% p.a., a rate slightly above the long term average of 1.9% over the coming decade. In 2007, world consumption reached a peak of 26.7 Mt, and following significant declines during 2008-11 - and with a relatively slow recovery - this peak is not likely to be surpassed again until 2016.
• World production is expected to grow more slowly than consumption during the first years of the outlook period, reflecting the large global stocks that accumulated between 2010 and 2014. World cotton area grows throughout the projection period, finally surpassing in 2020 the recent peaks seen in 2004 and 2011. Yields rise around the world, but global average yield grows very slowly as global output switches from relatively high-yielding countries, like China, to relatively low-yielding ones in South Asia and Sub-Saharan Africa.
• World trade rises at a rate above its long-term average in the Outlook, with exports in 2023 12% above those in the base period. The United States retains its position as the world’s largest exporter accounting for 24% of world trade. India retains its position as the world’s second largest source of cotton while increasing its global share from 18% in the base period to 20% of exports by 2023.

TAD/CA/APM/WP(2014)5/FINAL
108
• China retains its position as the world’s largest import market for cotton throughout the outlook period. But, by 2023 China’s share of world trade is foreseen 16 percentage points below its base period 47% share. Bangladesh’s share rises more than any other importer, up from 8% to 12%. Viet Nam, Turkey, Pakistan, and Indonesia are also expected to realise larger shares.
Figure 10.1. Cotton prices rise between 2000-09 and 2014-23
Evolution of world cotton prices in nominal (left) and real terms (right) to 2023ª
Note: Cotlook Ltd A Index: ª) Real cotton prices are nominal world prices deflated by the US GDP deflator (2005=1).
Source: Cotlook Ltd and OECD and FAO Secretariats.
Market trends and prospects
Prices
The benchmark A Index measure of cotton prices delivered to Asian ports is expected to average below its 2012 level (USD 1 938/t) during 2013, despite a mid-season recovery (Figure 10.1). World cotton markets in 2013 continue to be indirectly influenced by the 2010 price spike, as the stock-building efforts begun by China in the wake of the price spike continue to support prices. After rising 78% in 2010, the A Index fell 28% in 2011 and is estimated down an additional 15% from that point in 2013. Variable prices are expected over the outlook, generally falling through 2016, but rising afterwards. While rising, prices remain below USD 2 200/t in every year of the projection period.
China’s efforts to ensure its producers receive about USD 3 200/t resulted in a significant accumulation of stocks starting in 2011. In addition to a significant share of the domestic crop, the reserve authorities have purchased cotton from outside of China. The withdrawal of millions of tons of cotton from world markets has supported world prices, particularly after December 2012, as the world economy strengthened. China has signalled its intention to reform its cotton support programme, and to move to reduce its stocks. The shift from building stocks to reducing them in China is one of the major factors behind a decline foreseen in world cotton prices during the early years of the outlook period.
The outlook period’s highest level for world cotton prices is 6% above the base period average. Cotton prices in 2014-24 are expected to be significantly higher than in previous decades. They are expected to average USD 1 835/t, 38% more than in 2000-09. However, this is a smaller long term gain
0
500
1 000
1 500
2 000
2 500
3 000
3 500USD/t
Cotton (nominal)
0
500
1 000
1 500
2 000
2 500
3 000USD/t
Cotton (real)

TAD/CA/APM/WP(2014)5/FINAL
109
compared with wheat and corn, which are forecast to average 40% and 68% higher than in 2000-09. Cotton prices shifted downward relative to a variety of other commodities during 2000-09, including crops that compete with cotton for planted area, like wheat, corn, and soybeans. Cotton prices are not expected to rise enough in the projection period to return to their earlier relative price levels.
Production of cotton
World cotton production is projected to grow 2.2% annually in the Outlook, reaching 31.0 Mt in 2023. This total is expected to be 15% higher than production in the base period. Following the 2008 global financial crisis and subsequent cotton price volatility, world cotton production starts from a relatively low level in 2013, and rises as world consumption rebounds. Cotton yields are expected to rise in most countries, but the simple global average yield is expected to rise only 4.6% over the projection period as global production becomes increasingly concentrated in countries with relatively low yields. In particular, the roles of India and China will switch, with India replacing China as the world’s largest producer starting in the first year of the outlook period.
Output is expected to fall in China, the world’s largest producer since 1982 (Figure 10.2). While achieving high per hectare yields, China’s cotton producers - particularly in its eastern provinces - utilise relatively labour-intensive technology. With a high share of labour in production costs, China’s steadily rising wages have constrained profits for cotton growers, while rising subsidies for grain production have further eroded the relative attractiveness of producing cotton. Fragmented land holdings limit the ability of cotton growers in the eastern provinces to adopt mechanised production, while demographic trends indicate continued declines in rural population and rising wages are likely in the future. Mechanisation has been more applicable for the larger producing units in China’s Xinjiang province, where per hectare yields are the highest of any province. China has indicated that 2014 will begin a period of reform for its cotton policy, beginning with a reduction of support to farmers in the eastern provinces (Box 10.1).
Figure 10.2. World cotton production by major producer
Source: OECD and FAO Secretariats.
0
5
10
15
20
25
30
35
2003 2004 2005 2006 2007 2008 2009 2010 2011 2012 2013 2014 2015 2016 2017 2018 2019 2020 2021 2022 2023
Mt
Rest of the World United States China India

TAD/CA/APM/WP(2014)5/FINAL
110
Box 10.1. China’s cotton policies drive large changes in world ending stocks
Between 2010 and 2013, China’s ending stocks of cotton rose by almost 350%. China’s share of world cotton stocks rose from 19% to 54% during this time, with government-owned reserves accounting for the entire increase. The size of global cotton ending stocks in 2013 and the share of these stocks held by a single country are unprecedented in at least the last 50 years. The rise of China’s official reserve stocks has noticeably affected world cotton supply and demand in recent years, and changes in China’s cotton policies are expected to continue influencing cotton markets in the forecast period.
The government significantly altered its cotton policy in 2011, announcing a fixed price below which it would purchase cotton for its reserve through the annual harvest. This price was set below peak levels that occurred in 2010, but significantly above the levels that have prevailed on world markets since then. China is expected to begin altering its policy in the 2014 marketing year (September-August), reducing the amount of support offered to farmers and the gap introduced between cotton prices in China and the rest of the world since 2011. The large size of official reserve stocks makes the evolution of China’s cotton policy in 2014 and beyond important to world cotton markets.
While China’s share of world cotton stocks rose, its share of world cotton consumption fell. The rise in the domestic price of cotton in China relative to the world market price significantly constrained the profitability of spinning cotton fibre in yarn. China’s trade deficit in cotton yarn rose significantly, and the textile industries of countries like India, Pakistan and others increased their consumption of cotton to meet this demand. One of the aims of China’s cotton policy reform will be to limit the distortionary impact of support for cotton farmers. If China’s domestic cotton prices can be returned to a level closer to world prices, the textile industry will probably be able to recover much of the share of world spinning lost during 2011-13. The appreciation of the Chinese Yuan Renminbi during this time, and steadily rising wages, will limit China’s ability to return to the peak share of 42% realised before 2011, but could be significantly higher than the 33% realised in 2013.
China indicated that support for cotton producers will shift to a more targeted, less distortionary policy in 2014. Cotton producers in Xinjiang province will be the only producers to receive new, target price based direct subsidies. Producers in other provinces can expect to receive lower returns, and lower cotton production in 2014 is expected as a result. Lower production, combined with higher consumption, will begin the process of lowering China’s reserve stocks. Other policy changes, likely in 2014 or in later years, include changes in trade policy and efforts to sell reserve stocks at lower prices. Production policy in 2014 is described as a pilot program, and the evolution of policies regarding cotton production, trade and management of official reserves will have potentially significant impacts on world markets for several years.
Figure 10.3. Cotton ending stocks rise sharply
Source: International Cotton Advisory Committee, Cotton: World Statistics, September 2013.
0
20
40
60
80
100
120
140
160
1994 1995 1996 1997 1998 1999 2000 2001 2002 2003 2004 2005 2006 2007 2008 2009 2010 2011 2012 2013
%
World China

TAD/CA/APM/WP(2014)5/FINAL
111
India is expected to replace China as the world’s largest cotton producer in 2014, and is expected to account for 30% of world output in 2023. As Indian farmers continue to apply new and existing technology to capture currently unrealised yield potential, rising relative cotton prices on world markets will add additional incentives for Indian farmers to increase planted area and output. While there is a scientific debate around the use of genetically modified (GM) crops, the adoption of GM cotton in India has been part of shift in practices and technology that led India’s cotton production to more than double between 2000 and the base period. While GM adoption there is nearly complete, yields are expected to continue to grow, albeit at far below the 7.7% annual rate realised during 2000-09. With cotton area in India also rising slightly faster than harvested area for all grains and oilseeds, India accounts for the largest share of the expected gain in world production through 2023 (Figure 10.4).
Pakistan accounts for the second largest share of increased global production, and like India is expected to realise slightly faster growth in cotton area than in total grains and oilseeds area. However, this growth over 2014-23 will begin at a relatively lower base than in India. Cotton accounts for a larger share of Pakistan’s planted area than in India, but this share fell after 2005 (Figure 10.4). Pakistan has lagged behind India considerably in the adoption of GM cotton, and cotton’s share of planted area in the base period is down 9% from the last half of the 1990s.
Figure 10.4. Cotton area relative to area for total grains and oilseeds in major producing countries
Index: 1995-99 average cotton share of cropland = 1.0 (actual shares projected in 2023, %, right axis)
Source: OECD and FAO Secretariats.
Globally, the area planted to cotton is equivalent to 3-4% of the area planted to grains, oilseeds, and sugar crops. Total global area planted to these crops is expected to grow slowly during 2014-23 (0.4% p.a.), well below the rate of cotton area’s expansion. However, cotton’s share of this area total is still foreseen to be only marginally higher in 2023 than in the base period, 3.7% compared with 3.5%. The volatility of cotton prices in recent years and China’s efforts to reduce its stocks mean that the early years of the projection are expected to be an unusually low point for cotton area, magnifying the growth rate expected during the outlook period. During the last half of the 1990s, cotton accounted for 3.8% of this global area total, but with substantial increases in productivity, a smaller share of crop area is now needed to sustain growing cotton production.
10%
18%
2%
3%
0
0.2
0.4
0.6
0.8
1
1.2
1.4
1.6
2000 2001 2002 2003 2004 2005 2006 2007 2008 2009 2010 2011 2012 2013 2014 2015 2016 2017 2018 2019 2020 2021 2022 2023
Index
India China United States Pakistan

TAD/CA/APM/WP(2014)5/FINAL
112
Consumption of cotton
Total demand for cotton is expected to reach 30.8 Mt in 2023, surpassing its previous record-high by 4.3 Mt. While cotton consumption is expected to grow slightly more rapidly than it has over the very long-term, it is expected to grow significantly more slowly than the 3% rate realised during 2000-09. While consumption grows faster than the world’s population in the Outlook, consumption on a per capita basis in 2023 is nonetheless expected to remain below the peaks seen in the last half of the 1980s and again during 2004-07 (Figure 10.5).
In recent years, cotton consumption has been disrupted by global economic volatility, an unprecedented price shock, and policy changes in China (Box 10.1). From a peak of 26.5 Mt in 2006 and 2007, world cotton consumption is estimated to have fallen 14% to 22.7 Mt in 2011. The outlook for world economic growth in the coming decade is more promising than during the base period and cotton prices have stabilised at more favourable levels relative to competing fibres. However, cotton prices are expected to remain high by historical standards and the global shift of textile production away from China’s highly developed infrastructure may raise the average cost of supplying textiles to importing countries.
Figure 10.5. World per capita consumption of cotton remains below peak
Source: OECD and FAO Secretariats.
China is expected to remain the largest consumer of cotton fibre, its position since the 1960s. But China’s share of world consumption is expected to decline, continuing a shift underway since 2007 (Figure 10.6). The age structure of China’s population points to a decline in new labour-force entrants in coming years. With wages already rising steadily, China’s comparative advantage is shifting away from labour-intensive industries like clothing. Government policies in minimum wages, pollution control, and investment will likely support this trend. Compounding this, the price of cotton in China has risen substantially relative to the world price since 2010 due to support policies for cotton farmers. While the reform of China’s cotton programme is expected to boost China’s share and level of cotton consumption early in the outlook period, China’s share of world cotton consumption in 2023 is projected at 32%, down from 36% in the base period.
India’s textile industry has been the largest beneficiary of China’s shift away from processing cotton fibre into textiles during 2011-13. India recently became the world’s largest exporter of cotton yarn, and by 2023 will be closing in on China to have the world’s largest domestic market in population terms. China’s
0
500
1 000
1 500
2 000
2 500
3 000
3 500
0
0.5
1
1.5
2
2.5
3
3.5
4
4.5
2003 2004 2005 2006 2007 2008 2009 2010 2011 2012 2013 2014 2015 2016 2017 2018 2019 2020 2021 2022 2023
USD/tkg/capita
Per capita consumption Nominal price (right axis) Real price (right axis)

TAD/CA/APM/WP(2014)5/FINAL
113
reforms starting in 2014 are expected to moderate India’s increased consumption between the base and the first few years of the outlook period. At 7.2 Mt expected in 2023, India’s cotton consumption continues on its trend of a growing world share, which rises from 20% to 23%.
The fastest growth among major consumers is expected in Bangladesh and Viet Nam. Consumption is expected to grow at a 4-5% rate in each country, as their textile industries continue the rapid expansion each has enjoyed since 2000. While Bangladesh had been widely expected to see a reduction in its textile exports after the phase-out of the Multi-fibre Arrangement (MFA) in 2005, its garment exports and cotton spinning have instead flourished. Cotton consumption in Bangladesh grew at a 6.6% rate during 2004-13, and at a 14.0% rate in Viet Nam.
Figure 10.6. World cotton consumption rebounds, but relatively slowly
Source: OECD and FAO Secretariats.
Cotton trade
Cotton trade is expected to grow relatively strongly during the outlook period. Trade will be boosted by China’s return to world markets in the latter part of the projection period and by the continued expansion of textile output in countries which are large net cotton importers. Traditionally, cotton has been a relatively highly trade-dependent crop, with a ratio of world trade to world consumption of 30-45%, compared with ratios below 20% for grains and below 30% for soybeans. In the Outlook, exports are expected to grow at above the rate of world consumption, reaching 10.6 Mt by 2023. The ratio of trade to consumption is expected to fall from a relatively high 41% in the base period, reaching 34% in 2023.
The leading exporter throughout the Outlook will be the United States, while India’s exports are expected to remain the world’s second largest (Figure 10.7). In the decades before its post-2000 surge in productivity and production, India was a minor factor on world markets. India frequently imposed export quotas to maintain low cotton prices for its textile industry, and it was a net importer for seven consecutive years between 1998 and 2004. But more recently, India has at times accounted for as much as 24% of the world’s cotton exports. By 2023, its share is forecast to be larger than in the base period, but only by a small margin as consumption gains begin to approach growth in output.
0
500
1 000
1 500
2 000
2 500
3 000
3 500
0
5
10
15
20
25
30
35
2003 2004 2005 2006 2007 2008 2009 2010 2011 2012 2013 2014 2015 2016 2017 2018 2019 2020 2021 2022 2023
USD/tMt
Rest of the World United States ChinaIndia Nominal price (right axis) Real price (right axis)

TAD/CA/APM/WP(2014)5/FINAL
114
Figure 10.7. World cotton trade shares by exporter, 2011-13 and 2023
Source: OECD and FAO Secretariats.
Least Developed (LDC) Sub-Saharan Africa is expected to see a recovery of its share of world trade by 2023, growing from 7% to 10%. However, the region’s share of world trade has been relatively variable in the last few decades, typically ranging between 7% and 13%. Cotton consumption is limited throughout Sub-Saharan Africa, and many countries export virtually all of their production. From a high of 926 000 t in 2004, LDC Sub-Saharan Africa’s production fell below 400 000 t by 2009 as relative cotton prices reached new lows. With the recovery of world cotton prices, and expected yield gains in the region, production, exports, and share of world trade are expected to rise through 2023.
Like exports, shifts in the composition of importers represent the continuation of recent trends in the world cotton economy. China is expected to retain the role as world largest importer that it has held since shortly after its World Trade Organization (WTO) accession drove its consumption up sharply, but at a reduced level (Figure 10.8). As China’s share of world imports falls from 47% in the base period to 31% in 2023, Bangladesh’s 2023 share of world trade is expected to be nearly 60% larger than in the base period, and gains are also expected for Viet Nam, Turkey, and Pakistan. As China’s role in world textile production diminishes, cotton consumption is expected to grow more rapidly in a variety of countries, most of which are significant net importers.
United States, 27%
Australia, 12%
Brazil, 10%
Other Asia Developed,
10%
Other Subsaharan,
3%
European Union, 3%
India, 18%
Rest of the World, 10%
2011-13
LDC SubsaharanAfrica, 7%
United States, 24%
Australia, 10%
Brazil, 12%Other Asia Developed,
7%
Other Subsaharan,
4%
European Union, 3%
India, 20%
Rest of the World, 10%
2023
LDC SubsaharanAfrica, 10%
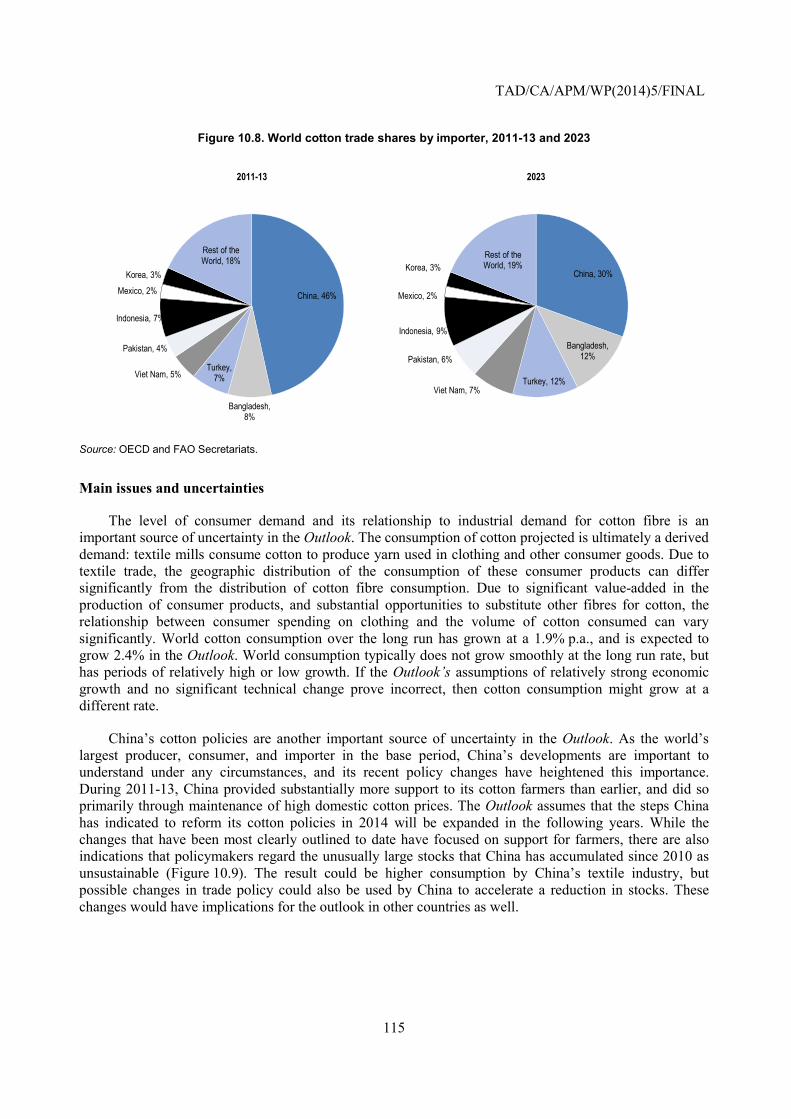
TAD/CA/APM/WP(2014)5/FINAL
115
Figure 10.8. World cotton trade shares by importer, 2011-13 and 2023
Source: OECD and FAO Secretariats.
Main issues and uncertainties
The level of consumer demand and its relationship to industrial demand for cotton fibre is an important source of uncertainty in the Outlook. The consumption of cotton projected is ultimately a derived demand: textile mills consume cotton to produce yarn used in clothing and other consumer goods. Due to textile trade, the geographic distribution of the consumption of these consumer products can differ significantly from the distribution of cotton fibre consumption. Due to significant value-added in the production of consumer products, and substantial opportunities to substitute other fibres for cotton, the relationship between consumer spending on clothing and the volume of cotton consumed can vary significantly. World cotton consumption over the long run has grown at a 1.9% p.a., and is expected to grow 2.4% in the Outlook. World consumption typically does not grow smoothly at the long run rate, but has periods of relatively high or low growth. If the Outlook’s assumptions of relatively strong economic growth and no significant technical change prove incorrect, then cotton consumption might grow at a different rate.
China’s cotton policies are another important source of uncertainty in the Outlook. As the world’s largest producer, consumer, and importer in the base period, China’s developments are important to understand under any circumstances, and its recent policy changes have heightened this importance. During 2011-13, China provided substantially more support to its cotton farmers than earlier, and did so primarily through maintenance of high domestic cotton prices. The Outlook assumes that the steps China has indicated to reform its cotton policies in 2014 will be expanded in the following years. While the changes that have been most clearly outlined to date have focused on support for farmers, there are also indications that policymakers regard the unusually large stocks that China has accumulated since 2010 as unsustainable (Figure 10.9). The result could be higher consumption by China’s textile industry, but possible changes in trade policy could also be used by China to accelerate a reduction in stocks. These changes would have implications for the outlook in other countries as well.
China, 46%
Bangladesh, 8%
Turkey, 7%Viet Nam, 5%
Pakistan, 4%
Indonesia, 7%
Mexico, 2%Korea, 3%
Rest of the World, 18%
2011-13
China, 30%
Bangladesh, 12%
Turkey, 12%Viet Nam, 7%
Pakistan, 6%
Indonesia, 9%
Mexico, 2%
Korea, 3%Rest of the World, 19%
2023

TAD/CA/APM/WP(2014)5/FINAL
116
Figure 10.9. World cotton stocks shift out of China
Ration stocks/use
Source: OECD and FAO Secretariats.
Prospects for productivity gains around the world are another uncertainty, particularly in India. The adoption of GM crops has been associated with an increase in total factor productivity in cotton in China, and significantly higher yields, area, and output in India. In the United States, GM adoption and boll weevil eradication have reduced the cost of growing cotton, and in Australia the adoption of GM varieties specific to Australia has also raised productivity. It is likely that these factors account for some of the downward shift of cotton prices relative to other commodity prices since 2000. Many countries have been more cautious in their approach to GM adoption, motivated in part by trade restrictions some countries maintain on imports of food and feed products based on GM crops. Similar restrictions are not applied to cotton fibre, yarn, or other textile products, but GM adoption has been slow in many countries nonetheless.
Future productivity gains are also possible through the adoption of other technologies and farming practices. Thus, the completion of GM adoption by India’s farmers in recent years does not necessarily mean that further significant yield gains are not possible. For example, newer GM traits have progressed to near-final approval stages. If the yield increases foreseen in this Outlook are not realised, cotton prices and cotton area in other countries would likely be higher.
0
5
10
15
20
25
30
35
2003 2004 2005 2006 2007 2008 2009 2010 2011 2012 2013 2014 2015 2016 2017 2018 2019 2020 2021 2022 2023
Mt
Rest of the World stocks China stocks Production Consumption
![Development of Agricultural Policies in Bangladesh[1] · 2019-03-11 · Agricultural Policies • Research and Development: The paradigm of agricultural research system needs to be](https://img.dokumen.tips/doc/110x75/5e818732f3e2174e900651c1/development-of-agricultural-policies-in-bangladesh1-2019-03-11-agricultural.jpg)