Embed Size (px)
Citation preview

Warsaw 2010
Working PapersNo. 14/2010 (37)
Enrico MarelliMarcello Signorelli
Joanna Tyrowicz
Crises and Joint Employment-Productivity Dynamics:
A Comparative Perspective for European Countries
Crises and Joint Employment-Productivity Dynamics:
A Comparative Perspective for European Countries
Enrico Marelli Marcello Signorelli
Faculty of Economics, Department of Economics,
University of Brescia
e-mail: [email protected]
Faculty of Political Sciences, Department of
Economics, Finance and Statistics,
University of Perugia
e-mail: [email protected]
Joanna Tyrowicz Faculty of Economic Sciences, University of Warsaw
National Bank of Poland
Rimini Centre for Economic Analysis
e-mail: [email protected]
[eAbstract
The aim of the paper is to investigate the short-term joint dynamics of productivity and
employment during the economic down cycles in the EU economies over the past 20 years.
Disentangling the shift in labour demand into a change of employment-productivity schedule
and a movement along it, we focus on the last 2-3 crises, highlighting the peculiarities of the last
recession. Namely, we demonstrate that many of the EU countries – unlike the United States –do
not follow the RBC pattern. We also suggest some possible institutional fundamentals that could
explain this phenomenon.
Keywords: recession, employment and productivity dynamics, RBC, labour hoarding
JEL: E32, J21, J23, O47, O52
Working Papers contain preliminary research results.
Please consider this when citing the paper.
Please contact the authors to give comments or to obtain revised version.
Any mistakes and the views expressed herein are solely those of the authors.

2
1. Introduction
The joint dynamics of employment and productivity are of crucial importance especially in the
short-term perspective. Reductions in labour demand which produce increases in unemployment lead
to political pressure frequently resulting in policy instruments designed to address the demands of the
voters. The timing between the processes and the policy measures of crisis management has been
changing over the past decades, with the attempt to devise and implement so-called pro-active
policies. The pressure is stronger if other countries already adopt similar policies (Mukand and Rodrik,
2005). However, in some cases such efforts may not only be premature but also useless, as the
employment response may differ, depending on the institutional design (including labour market
flexibility, active and passive labour market policies) as well as the depth and the duration of the down
cycle.
In this paper we shed some light on the short-run joint employment-productivity dynamics in
the EU economies. Analysing the period of the past two decades we follow the RBC-based approach of
Mulligan (2009). We decompose changes in employment into the shift of the labour demand schedule
and the movement along it. The actual combination of both types of adjustment – movement along the
schedule and the shift of the schedule – provides very characteristic adjustment for many of the EU
countries. On the basis of the institutional framework and the nature of economic slowdowns we are
able to provide economic justification to the emerging groupings of the EU economies. We document
the peculiarities associated with the recent global economic recession.
We identify three main groups of adjustments and countries (the fourth group consists of
countries that in fact have proven resistant to the recent recession). First, countries with internal
institutions fostering the stability of the enterprise sector are naturally more immune to externally
driven shocks and thus do not seem to require any dedicated instruments, at least in the recent
recession. In these countries companies can afford to initially follow “labour hoarding” patterns, and if
that does not prove to be a satisfactory strategy, reduction in employment is moderate and
productivity recovery follows. Second, in countries experiencing extremely strong negative shocks,
employment and productivity adjustments are considerable and cannot be contained under the fiscal
constraints. Such crises, however, do not follow a typical RBC pattern and consist of stark reductions in
both employment and productivity. In the third group of analysed cases, countries have adopted
policies intended to address the negative employment adjustments, but the subsequent productivity
loss has been substantial. Recovery is likely to be much slower in these cases.
The policy implications of this empirical exercise are clear. First, before any actual policy is
adopted, governments should identify the most probable type of adjustment the economy is expected
to follow and observe where the instruments already implemented are sufficient. Second, some long-
term stable solutions are more reliable than recently popular “crisis packages”. Whether they are
additional “automatic stabilisers” or pro-active safety nets, adverse labour market adjustments in such
environments are weaker on the employment side and less detrimental to productivity dynamics.
The paper is structured as follows. Section 2 briefly reviews the relevant literature. In Section 3
we discuss in detail the method and the data used, before analysing and discussing the main empirical
results. The concluding remarks are presented in Section 4.

3
2. Literature review
This review is articulated in three sub-sections. First we analyze the links between
employment and productivity, especially from a business cycle standpoint (2.1). Then we consider the
main features of business cycles in Europe (2.2). Lastly we illustrate the key characteristics and labour
market effects of the last global crisis (2.3).
2.1. Employment and productivity: key empirical studies
Many of the empirical studies concerning the links between economic dynamics and labour
market performance refer to the so-called Okun’s law (e.g. see Padalino and Vivarelli, 1997; Lee, 2000).
The intensity of the relation – i.e. the “Okun’s coefficient”1 – varies between countries and is unstable
over time, depending on structural conditions and the legislative framework (especially concerning
the labour market institutions), reflecting in particular the “labour hoarding” practices2. Moreover,
there are many difficulties in detecting a stable threshold of GDP growth rate that allows a decline in
unemployment and an increase in employment as opposed to so-called “jobless growth”.
The timing of the labour market response may also be relevant. For example, the IMF (2010,
chapter 3) shows that the responsiveness of the unemployment rate to changes in output has increased
over time in many countries, as a consequence of less strict employment protection and greater use of
temporary employment contracts. However, it has been estimated that in normal recessions it takes
three quarters after output has begun to recover for employment to start increasing and an additional
two quarters for the unemployment rate to peak. Thus, the evolutions of employment and
unemployment patterns are not necessarily alike. Unemployment can continue rising even after
employment growth has turned positive.
Another important factor concerns the symmetry of the response. If the adjustments in
employment or unemployment were symmetric in the response to the output growth changes, higher
responsiveness of unemployment to changes in output should help in the recovery subsequent to the
recession. However, Arpaia and Curci (2010) have detected an asymmetry over the cycle, with
recessions being characterised by more job destruction than by job creation in the following
recoveries.
Analysing the co-movement between output and employment yields, we can gain, at least
indirectly, some insights into productivity dynamics. Whenever “labour hoarding” practices prevail,
productivity may actually decline (or its growth rate decelerate) at least in the short run3. In the next
phase of the cycle, “labour hoarding” may result in a larger productivity gain. The causes of this
“productivity dividend” are suitably explained by Fulco (1984, p. 3): “When demand begins to revive,
output can often be boosted without causing commensurate increases in the payroll. Firms respond by
1 Note that during a recession a decline in (the growth of) GDP causes a decline in labour demand and
employment, hence an increase in unemployment (Keynesian unemployment due to a lack of aggregate
demand); the rise in unemployment can however be partly reinforced by "wage rigidities" (i.e. classical
unemployment). 2 Because of hiring and firing costs, the firms may be willing to hoard labour if the shock hitting the economy
appears to be transitory. However, as the recession deepens, firms may consider the shock to be more persistent
and may start to fire at a faster pace. 3 An indirect consequence is that nominal unit labour costs are bound to increase, despite a deceleration in wage
dynamics (compensations per employee will adjust, at least in the variable component), as shown by Arpaia and
Curci (2010). The resulting loss of competitiveness will dampen foreign demand and exports, especially in
countries – such as the European ones – that cannot benefit from large increases in domestic demand (because of
fiscal and macroeconomic adjustments). This in turn will deteriorate the recovery prospects.

4
using some idle plants and equipment and by redirecting existing labour to production-related tasks. This
results in the rapid productivity gains […].” Fulco also clarifies that "hoarded employees may be those
with the greatest seniority, experience, and training specific to the firm's needs”, which will further
contribute to increases in productivity.
It is also quite self-explanatory that this phenomenon is of a short-run nature (e.g. Beaudry and
Collard, 2002; Becker and Gordon, 2008). In particular, Pichelmann and Roeger (2008) consider this
potential trade-off within the Lisbon Strategy. Belorgey et al. (2006) show that employment rate
changes negatively affect the productivity growth rate, supporting the hypothesis of “diminishing
returns for the employment rate”. Moreover, Rutkowski (2006) highlights that low-productivity
employment in the CIS is a mirror image of unemployment in the European transition countries
(where a developed social safety net exists).
In the medium run, a trade-off between employment and productivity is just one possible
outcome, but other possibilities may occur. For example, Marelli and Signorelli (2010) identify four
different “models of growth” for EU countries in the last two decades: intensive, extensive, virtuous
and stagnant4. In Eastern Europe, all centrally planned economies followed an “extensive” model (high
employment rate and low productivity level/dynamics) before the beginning of transition in the early
1990s; rationalisations and the restructuring of their economies then significantly reduced
employment rates (often accompanied by an increase in the shadow economy and irregular
employment) but with (more or less) relevant productivity gains5. On the other hand, many “old EU”
countries have moved in the opposite direction since the mid 1990s: coming from two decades of
“jobless growth”, they have shifted to an “extensive” growth model. For instance, Italy and Spain,
following some reforms introducing greater flexibility in labour markets, benefited from a
considerable increase in employment rates6, but accompanied by a worsening of productivity (many
new jobs have been unskilled and low-wage, in many cases occupied by immigrant workers).
Finally, it is widely recognized that in the long run a sustained productivity growth is beneficial
also in preserving and expanding employment. “Growth accounting” approaches have tried to compute
the contribution of different resources (capital, labour, human capital, etc.) to growth. 7
2.2 Business cycles in the EU
A preliminary consideration is that, in the world, business cycles have been surprisingly
synchronised across countries over the past two decades. This fact, together with the “opening” of
countries and the increasing trade flows, is one of the most evident effects of globalization.8 Kose,
4 The paper has also provided econometric corroboration of the “diminishing returns for the employment rate”
hypothesis. 5 The employment rate inverted its tendency to decline only a few years after the huge "transitional recession" of
the early 1990s. It should be noted that, as for transition countries, the last 2007-08 crisis determined a second
negative "job shock" in less than a generation. 6 The “end of eurosclerosis” (see Boeri and Garibaldi, 2009) has however been unbalanced, because of the
diffusion of temporary contracts, the spreading of “dual labour markets” and the consequent effects on the
(differentiated) productivity and wage dynamics. 7 This approach is sometimes also followed in business cycle studies. For example, Chari, Kehoe and McGrattan
(2006) find that both in the Great Depression and in the 1982 recession the efficiency and labour wedges
together accounted for essentially all the fluctuations. 8 The clearest example is the “Great Recession” which in 2008-09– after the financial crisis – hit all countries in
the world (although for China, India and other emerging economies there was just a slight deceleration in their
previous growth rates).

5
Prasad and Terrones (2003) demonstrate that increasing trade intensity contributes to increasing the
transmission of both peaks and bottoms of the business cycles across the globe.
Studies on business cycles in the EU, conducted in the last decade, have focused on the degree
of synchronization, especially to ascertain whether the fundamental conditions for an effective
monetary union are satisfied by current Euro-zone members or will be satisfied by candidate
countries. The empirical investigations refer to correlations of output, GDP, industrial production or
employment; in some cases, correlations of exports, consumption and services are also investigated.
An intensifying correlation of real variables implies that the response to the shocks has become more
symmetric across European countries – a characteristic of “optimal currency areas” and a pre-
requisite for a successful currency zone.
The results of empirical studies on cycle correlation show that – despite the recent emergence
of a “world business cycle” due to globalisation – euro-area countries correlate amongst themselves
more than with the rest of the world. Empirical studies have shown that synchronicity has increased
not only within the euro-zone or the “old” EU countries, including some “peripheral” countries
(therefore making the concept of a “core” of European countries less meaningful), but also between
“old” and “new” Europe. As regards output correlations, Hungary, Poland and Slovenia seemed to be
the most correlated with the euro-area; the lowest correlations, close to zero, were found for the Baltic
states (Babetskii, 2005; Fidrmuc and Korhonen, 2006). More recently, Darvas and Szapary (2008)
argued that in terms of GDP (as well as imports and exports) the so-called New and Old Member States
have become more and more synchronised. However consumption and investment cyclical dynamics
remain unsynchronized.
2.3 Impact of the recent global crisis
The collapse of the Lehman Brothers bank in the fall of 2008 is widely recognised as the
highlight of the so-called “sub-prime crises” in the US. Actually, many of the weaknesses of the
financial system had been coming to the surface since the second half of 2007, but the process was
actually initiated by the increases in the Federal Fund rates in the USA as of late 2005. While the
chronology of the events is both known and has been widely discussed, the real effects are still largely
controversial.
Firstly, the business cycle peak in the USA – as well as in other leading global economies – had
come to a turn already in the second half of 2007. Thus, some real adjustment was to be expected even
without the financial tornado caused by the collapse of the Lehman Brothers and subsequent bailing
out of other financial institutions. Secondly, the magnitude of the real adjustments has been
surprisingly large, with unprecedented falls in production, income and international trade. In addition,
employment declined considerably and the unemployment rates gradually rose during 2009. USA has
noted the highest unemployment rate since the Great Depression9, while for example the Baltic States
– along with Ukraine – experienced a 20% annual GDP contraction, which cannot be compared even to
massive post-transition adjustments in these countries.
9 In the US, in March 2010 it stood at 9.7%. Total unemployment rate (UR) increased in the EU to 9.6% in March
2010 (vs. 7.1% in September 2008). The level of EU-27 unemployment reached 23.1 million in March 2010,
compared to 20.6 of 12 months before and 16.8 million (on average) in 2008. On the other hand, the employment
rate - the key labour market performance indicator of the European Employment Strategy - declined in 2009 (to
64.6% vs. 65.9% in 2008).

6
In fact, the real effects have been highly differentiated across countries. Naturally, the size of
the shock as well as the magnitude of adjustments depend upon various factors: e.g. country reliance
on international trade, dependence on natural resources, financial liberalization of the banking system,
fiscal resources at government disposal and so on (see, for example, European Commission, 2009a and
2009b). In terms of the labour market impact, the IMF (2009) investigates the different employment
adjustments and labour hoarding phenomena with respect to previous crises. A first general result is
that during the last crisis, there was in most countries (both advanced and emerging) a much bigger
(negative) impact on productivity (per worker), suggesting that labour hoarding has been much higher
(on average) during this recession10.
From the perspective of already 8-10 quarters after the peak of business cycle in most
developed economies, it can be observed that in some cases deterioration of the employment rate has
been slight, notwithstanding sometimes biggest output reductions. On the other hand, the recent
events show that “labour hoarding” incentives by the government are more common in countries
specialised in industrial activities, where income-support policies are also more common. These
countries frequently developed crisis-specific legislation (e.g. subsidies for part-time work in Germany
or extending income support for workers formally maintaining job contracts at reduced working-time
or at "zero-hours" in Italy). However, the fall in labour demand has been accompanied by either
labour-hoarding practices – with consequent reductions in productivity – or a fall in labour supply (the
“discouraged worker effect”) thus dampening down the impact on unemployment rates11.
The opposite cases include countries where employment has been heavily cut, yielding also
exceptionally high unemployment rates, but with smaller (or even nil) effects on productivity. The IMF
(2009) partly explains this heterogeneity in performances by considering the multifaceted dimensions
of labour market flexibility, such as employment protection legislation (EPL), the types of wage-
bargaining arrangements, the level and duration of unemployment benefits and the diffusion of
temporary contracts. The stronger employment response in low EPL economies with respect to
medium/high EPL economies is consistent with the literature suggesting that employment protection
reduces both inflows to and outflows from employment. For medium/high EPL countries, the
reduction in employment during this crisis has been similar to that during previous cycles despite
substantially bigger GDP declines, confirming the above-mentioned higher degree of labour hoarding.
The employment-productivity adjustments path was investigated also with reference to past
economic crises. Beegle (1999) analyses the feasibility of the intensive margins adjustment, instead of
the reduction in jobs and increase in unemployment rates. Moreover, sectoral and regional
reallocation of labour (e.g. workers move back to agriculture, i.e. from urban to rural areas) are usually
important, especially in developing countries, including movements into the informal sector and
toward subsistence activities. Analysing the real effects of the financial crises in East Asia and Mexico
10 The cyclical behaviour of unemployment during recessions and recoveries is also discussed in IMF (2010,
chapter 3). After the crisis, the highest increases of unemployment rates (UR) in the world were recorded in
developed economies, the EU and the remaining countries of Europe, while working poverty dramatically
increased in many regions (especially South East Asia and the Pacific, South Asia, North Africa, and Sub Sahara
Africa). 11 For the next years, a further rise in the unemployment rates during 2010 is expected for European countries. A
certain persistence of high unemployment rates, similarly to past crises, is also likely because of "hysteresis"
phenomena that cause an upward shift in the "structural unemployment". Of course, persistence and hysteresis
largely depend on the soundness of the recovery, also related to the adoption of macroeconomic policies and
specific labour market policies.
7
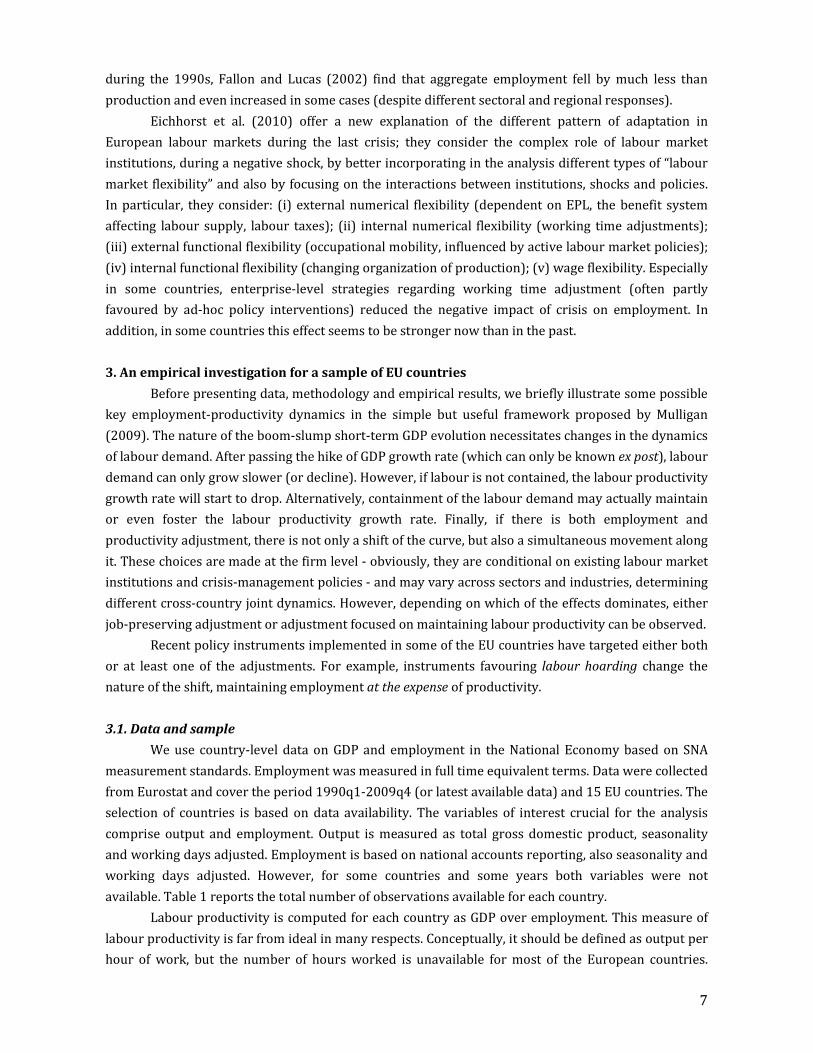
during the 1990s, Fallon and Lucas (2002) find that aggregate employment fell by much less than
production and even increased in some cases (despite different sectoral and regional responses).
Eichhorst et al. (2010) offer a new explanation of the different pattern of adaptation in
European labour markets during the last crisis; they consider the complex role of labour market
institutions, during a negative shock, by better incorporating in the analysis different types of “labour
market flexibility” and also by focusing on the interactions between institutions, shocks and policies.
In particular, they consider: (i) external numerical flexibility (dependent on EPL, the benefit system
affecting labour supply, labour taxes); (ii) internal numerical flexibility (working time adjustments);
(iii) external functional flexibility (occupational mobility, influenced by active labour market policies);
(iv) internal functional flexibility (changing organization of production); (v) wage flexibility. Especially
in some countries, enterprise-level strategies regarding working time adjustment (often partly
favoured by ad-hoc policy interventions) reduced the negative impact of crisis on employment. In
addition, in some countries this effect seems to be stronger now than in the past.
3. An empirical investigation for a sample of EU countries
Before presenting data, methodology and empirical results, we briefly illustrate some possible
key employment-productivity dynamics in the simple but useful framework proposed by Mulligan
(2009). The nature of the boom-slump short-term GDP evolution necessitates changes in the dynamics
of labour demand. After passing the hike of GDP growth rate (which can only be known ex post), labour
demand can only grow slower (or decline). However, if labour is not contained, the labour productivity
growth rate will start to drop. Alternatively, containment of the labour demand may actually maintain
or even foster the labour productivity growth rate. Finally, if there is both employment and
productivity adjustment, there is not only a shift of the curve, but also a simultaneous movement along
it. These choices are made at the firm level - obviously, they are conditional on existing labour market
institutions and crisis-management policies - and may vary across sectors and industries, determining
different cross-country joint dynamics. However, depending on which of the effects dominates, either
job-preserving adjustment or adjustment focused on maintaining labour productivity can be observed.
Recent policy instruments implemented in some of the EU countries have targeted either both
or at least one of the adjustments. For example, instruments favouring labour hoarding change the
nature of the shift, maintaining employment at the expense of productivity.
3.1. Data and sample
We use country-level data on GDP and employment in the National Economy based on SNA
measurement standards. Employment was measured in full time equivalent terms. Data were collected
from Eurostat and cover the period 1990q1-2009q4 (or latest available data) and 15 EU countries. The
selection of countries is based on data availability. The variables of interest crucial for the analysis
comprise output and employment. Output is measured as total gross domestic product, seasonality
and working days adjusted. Employment is based on national accounts reporting, also seasonality and
working days adjusted. However, for some countries and some years both variables were not
available. Table 1 reports the total number of observations available for each country.
Labour productivity is computed for each country as GDP over employment. This measure of
labour productivity is far from ideal in many respects. Conceptually, it should be defined as output per
hour of work, but the number of hours worked is unavailable for most of the European countries.

8
Resorting to total employment as a proxy is naturally a second-best option for two main reasons: (i) it
does not permit comparison of intensive versus extensive margin adjustments and (ii) in the case of
considerable changes in the number of hours worked (e.g. large-scale shorter working time
regulations implementation), the measure naturally underestimates the scale of adjustment. On the
other hand, in the approach followed in our study, the crucial element is to analyse changes in
productivity and demand for labour using the same categories for all countries.
Table 1. Size of sample by country
Country Beginning of sample End of sample Total no. of observations
Belgium 1990q1 2009q4 80
Czech Republic 1995q1 2009q4 60
Denmark 1990q1 2009q4 80
Estonia 1995q1 2009q3 59
Finland 1990q1 2009q4 80
France 1990q1 2009q3 79
Germany 1991q2 2009q4 75
Hungary 1995q1 2009q4 60
Italy 1990q1 2009q2 78
Latvia 1995q1 2009q4 60
Lithuania 1995q1 2009q4 60
Netherlands 1990q1 2009q3 79
Poland 1995q1 2009q4 58
Spain 1990q1 2009q4 80
United Kingdom 1992q2 2009q3 70
Source: Eurostat. Note: For the Czech Republic only data from the labour force survey were available. In the case
of France, employment based on System of National Accounts was no longer reported as of 2003, and we
therefore used the labour force survey data. Employment data is not available for 1999q2 and 1999q3 for
Poland. If seasonality and working days adjusted data were unavailable (three additional countries), the
procedure of adjusting for seasonality was implemented using Tramo/Seats procedure, with the assistance of
Demetra.
Moreover, the very way of defining labour productivity as a ratio between output and amount
of labour used is also controversial. There has been a long debate in empirical studies on the
alternative measures, cf. Bernard and Jones (1996). Some studies tend to suggest that either gross
value added or estimated marginal product of labour should be used instead. However, the very
estimation of MPL remains troublesome, with different functional forms yielding varied estimates of
MPL and MPL changes, as analysed in Growiec (2009). In addition, such applied definition of labour
productivity is widespread in the business cycle analyses.
3.2. Analytical strategy
To observe the nature of the adjustment in the selected EU countries, three necessary steps
had to be followed:
1. identify the “peak” quarters to determine the “anchor” location;
2. compute the “anchored” changes in labour productivity and employment for each of the
“peaks” and for each of the countries in the sample.
In order to identify the “peaks”, we have implemented Hodrick-Prescott filtering to logs of seasonally
adjusted GDP time series.
9
There is a long and heated debate in the literature on the use of the HP filter as opposed to
Baxter and King (1999) or Christiano and Fitzgerald (2003) filters, cf. Kaiser and Maravall (2001)12.
The Hodrick-Prescott filter is quite simple to implement; however, it also has potentially large
drawbacks, namely it significantly distorts the higher moments of the data – a point discussed by King
and Rebello (1993) and Cogley and Nason (1995). However, the actual reliability of filtering is of
secondary importance in our study as long as the timing of the events is not distorted. In recent Monte
Carlo simulation, Corbae and Ouiliaris (2006) have demonstrated that while the alternative filters
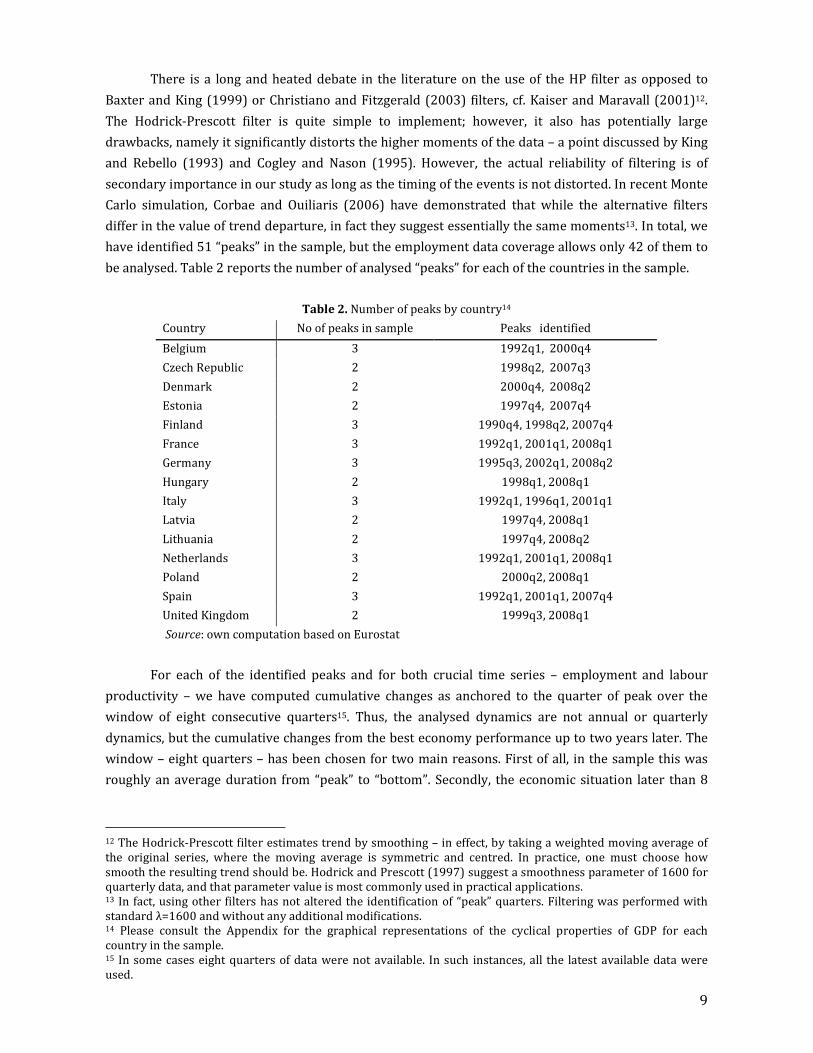
differ in the value of trend departure, in fact they suggest essentially the same moments13. In total, we
have identified 51 “peaks” in the sample, but the employment data coverage allows only 42 of them to
be analysed. Table 2 reports the number of analysed “peaks” for each of the countries in the sample.
Table 2. Number of peaks by country14
Country No of peaks in sample Peaks identified
Belgium 3 1992q1, 2000q4
Czech Republic 2 1998q2, 2007q3
Denmark 2 2000q4, 2008q2
Estonia 2 1997q4, 2007q4
Finland 3 1990q4, 1998q2, 2007q4
France 3 1992q1, 2001q1, 2008q1
Germany 3 1995q3, 2002q1, 2008q2
Hungary 2 1998q1, 2008q1
Italy 3 1992q1, 1996q1, 2001q1
Latvia 2 1997q4, 2008q1
Lithuania 2 1997q4, 2008q2
Netherlands 3 1992q1, 2001q1, 2008q1
Poland 2 2000q2, 2008q1
Spain 3 1992q1, 2001q1, 2007q4
United Kingdom 2 1999q3, 2008q1
Source: own computation based on Eurostat
For each of the identified peaks and for both crucial time series – employment and labour
productivity – we have computed cumulative changes as anchored to the quarter of peak over the
window of eight consecutive quarters15. Thus, the analysed dynamics are not annual or quarterly
dynamics, but the cumulative changes from the best economy performance up to two years later. The
window – eight quarters – has been chosen for two main reasons. First of all, in the sample this was
roughly an average duration from “peak” to “bottom”. Secondly, the economic situation later than 8
12 The Hodrick-Prescott filter estimates trend by smoothing – in effect, by taking a weighted moving average of
the original series, where the moving average is symmetric and centred. In practice, one must choose how
smooth the resulting trend should be. Hodrick and Prescott (1997) suggest a smoothness parameter of 1600 for
quarterly data, and that parameter value is most commonly used in practical applications. 13 In fact, using other filters has not altered the identification of “peak” quarters. Filtering was performed with
standard λ=1600 and without any additional modifications. 14 Please consult the Appendix for the graphical representations of the cyclical properties of GDP for each
country in the sample. 15 In some cases eight quarters of data were not available. In such instances, all the latest available data were
used.

10
quarters from the “peak” is only rarely driven by the same initial impulse resulting in real economy
adjustments.
3.3. Intuition Behind the Empirical Approach
Theory on business cycles (RBC) predicts that the adjustment should follow a backbone
pattern, with possibly initial continuation of the growing employment, but a fairly prompt transition
towards productivity increase and employment reduction should be expected16. On the other hand,
labour market rigidities are consistent with little initial adjustment in employment and thus obvious
productivity reductions (i.e. labour hoarding) followed only subsequently by a contraction in labour
demand.
In our sample, virtually all events of “peaks” overlap within the boundaries of one year (4
quarters). Thus, we restrain from identifying directly the “peaks” and “crises”, focusing rather on the
waves across Europe. These included the wave of the late 1990s (“peaks” within 1997q4 and 1998q4;
7 countries), early 2000s (“peaks” within 2000q1 and 2001q1; 10 countries) and the recent events
(“peaks” within 2007q1 and 2008q1; 14 countries). In addition, there were isolated cases of additional
shorter (and also smaller) cyclical departures in the case of Denmark, Finland and France. We thus
(mainly) focus on the following three cases: late 1990s, early 2000s and late 2000s.
We analyse the cumulated changes in employment and labour productivity, where the base for
comparison is always the “peak” quarter. In order to facilitate the comparisons across time and
countries, the series were additionally logarithmised. In the remainder of the paper we always portray
the most recent crisis in green, the crisis of the early 2000s (or the previous one, as indicated) in red
and earlier events in blue (or brown). Graphical representation permits comparison of both the type
and magnitude of the change.
The severity of the economic slowdown differs significantly across EU countries. While the
majority of EU Member States experienced negative GDP growth rates (with Poland being the only
exception so far), the Baltic countries experienced two-digit reductions in annual GDP growth, while
the EU-27 outcomes reached -4.1% in 2009 and are forecasted to increase to 0.7% in 2010. Since the
severity of the crisis differs across the countries - interacting with partly different labour market
institutions and policies - the scale and shape of employment-productivity adjustments were
significantly different (between countries or clusters of countries). Moreover, transition countries are
typically characterised by larger responses to the initial impulses (shock). Thus, the observed
adjustment patterns are likely to be diverse.
3.4 Empirical Results and Discussion
Analysis reveals that the EU countries more frequently corresponded to the "typical" real
business cycle (RBC) pattern in the 1990s (solid grey lines) as well as – for a majority of countries – in
the late 1990s or early 2000s (dashed black lines). However, more recent adjustments frequently
depart from this theoretical prediction (solid black lines). We can find four main patterns of
adjustments after the last crisis:
16 In fact, this is the pattern followed currently by the US economy, which suggests the observed slowdown –
irrespectively of the additional adverse contributions from the financial sector – was originally a real type
adjustment.
11
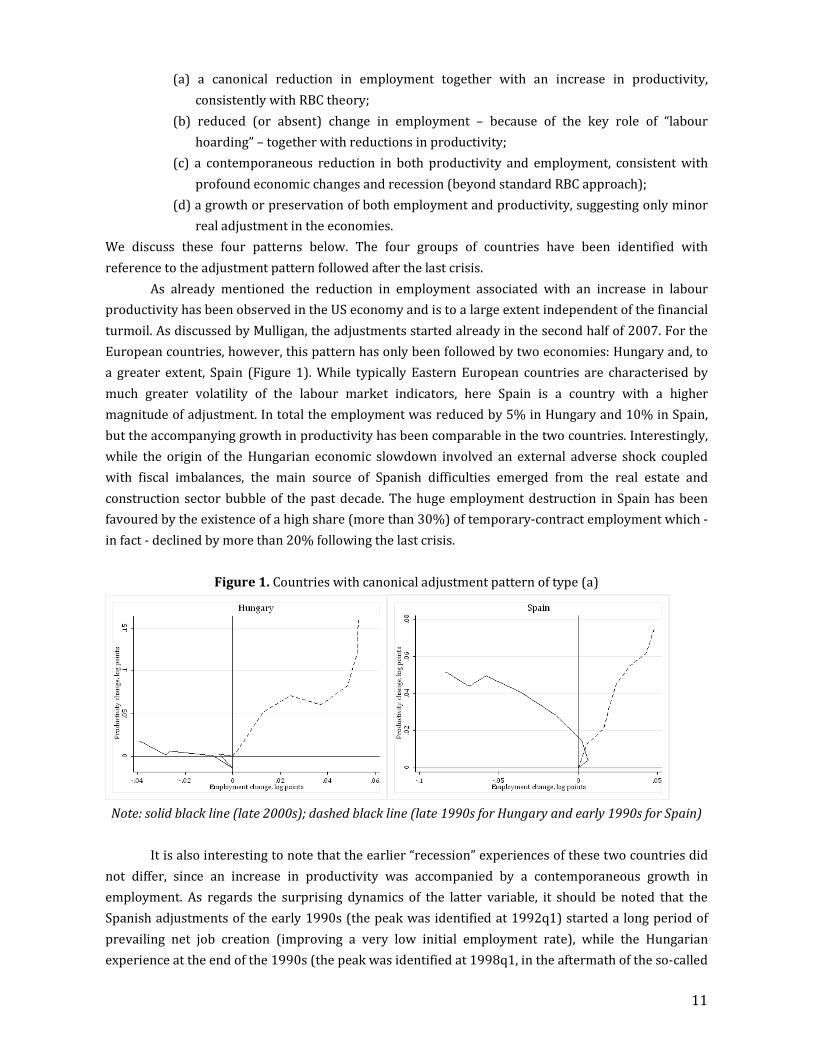
(a) a canonical reduction in employment together with an increase in productivity,
consistently with RBC theory;
(b) reduced (or absent) change in employment – because of the key role of “labour
hoarding” – together with reductions in productivity;
(c) a contemporaneous reduction in both productivity and employment, consistent with
profound economic changes and recession (beyond standard RBC approach);
(d) a growth or preservation of both employment and productivity, suggesting only minor
real adjustment in the economies.
We discuss these four patterns below. The four groups of countries have been identified with
reference to the adjustment pattern followed after the last crisis.
As already mentioned the reduction in employment associated with an increase in labour
productivity has been observed in the US economy and is to a large extent independent of the financial
turmoil. As discussed by Mulligan, the adjustments started already in the second half of 2007. For the
European countries, however, this pattern has only been followed by two economies: Hungary and, to
a greater extent, Spain (Figure 1). While typically Eastern European countries are characterised by
much greater volatility of the labour market indicators, here Spain is a country with a higher
magnitude of adjustment. In total the employment was reduced by 5% in Hungary and 10% in Spain,
but the accompanying growth in productivity has been comparable in the two countries. Interestingly,
while the origin of the Hungarian economic slowdown involved an external adverse shock coupled
with fiscal imbalances, the main source of Spanish difficulties emerged from the real estate and
construction sector bubble of the past decade. The huge employment destruction in Spain has been
favoured by the existence of a high share (more than 30%) of temporary-contract employment which -
in fact - declined by more than 20% following the last crisis.
Figure 1. Countries with canonical adjustment pattern of type (a)
Note: solid black line (late 2000s); dashed black line (late 1990s for Hungary and early 1990s for Spain)
It is also interesting to note that the earlier “recession” experiences of these two countries did
not differ, since an increase in productivity was accompanied by a contemporaneous growth in
employment. As regards the surprising dynamics of the latter variable, it should be noted that the
Spanish adjustments of the early 1990s (the peak was identified at 1992q1) started a long period of
prevailing net job creation (improving a very low initial employment rate), while the Hungarian
experience at the end of the 1990s (the peak was identified at 1998q1, in the aftermath of the so-called

12
“Russian” crisis) was conditioned by a dominant trend of net job creation after the huge negative
employment decline of the first years of transition.
In addition to Hungary and Spain, after the initial period of “labour hoarding”, the canonical
RBC pattern also occurred in Denmark, Finland, the Netherlands and the United Kingdom – they seem
to follow a typical adjustment pattern, but only after a few quarters. While the absolute recovery of
productivity is for the time being only observable in Denmark, the other three countries seem to have
entered the path of employment reduction and productivity growth.
It should be noted that huge differences with respect to previous crises for all countries of this
group emerge from the graphs: in fact, during past crises the well-known ability of these economies to
create jobs was maintained also in bad times, probably due to the positive role of their labour market
institutions. The worst impact of the last crisis, compared to previous crises, can be partly explained, at
least in some cases, by the different size of the downturn interacting with a low "internal" flexibility17.
Figure 2. Countries with adjustment eventually replicating the pattern of type (a)
Note: solid black line (late 2000s); dashed black line (early 2000s); grey dashed and solid lines (1990s)
As is well known, Denmark, Finland and the Netherlands are characterised by highly
innovative labour market institutions, including the advanced flexicurity instruments (especially
Denmark and the Netherlands) and additional, quasi-automatic stabilisers (as in the case of the Finish
Employment Fund). In the past, these countries were able to maintain employment constant or even
with a moderate growth, subsequent to the business cycle peak. The exceptional scale of employment
17 See Eichhorst et al. (2010) and section 2.3.

13
adjustment in Finland – but also in Denmark – seems to suggest that the current shock experienced by
these economies has been.
On the other hand, the UK was able to preserve employment levels in the past thanks to a
flexible labour market, characterised by relatively low constraints on firing and hiring; however, over
the past two decades it has also developed a wide system of “active” labour market instruments and
institutions, similarly to the Netherlands and Denmark.18 The case of the UK – where the cumulated
reduction in employment and productivity reaches roughly 2% - is in fact surprising. This country
should in principle follow closely the pattern observed in the US. A possible explanation is that over
the recent past both GDP and employment grew in the UK almost constantly. The employment level
has changed from roughly 21.5 mln to 25.5 mln (or over 25%) in only 15 years. At the same time, this
country has been characterised by relatively intense immigration and internationally open labour
market. The decrease in both productivity and employment may thus be explained by a combination of
the migration outflow and type (b) or very weak type (a) adjustment patterns.
Since the adjustments in Germany and the Netherlands are of relatively small magnitude, these
countries seem to be a border case between type (a) and type (b) adjustments. The typical examples of
the latter are France and Italy. The currently observed processes involve predominantly the
maintenance of employment, even at the expense of productivity. It should also be noted that this form
of adjustment is new for Germany, which previously followed a typical RBC pattern.
Figure 3. Countries with adjustment pattern of type (b)
Note: solid black line (late 2000s); dashed black line (early 2000s); grey line (1990s)
18 In fact, the UK followed a path similar to Spain and Hungary in the previous crisis (the peak was identified at
1999q3).

14
France and Italy are considered to constitute the examples of the so-called “Southern
European” labour market model. Namely, they are both characterised by relatively low participation
and employment rates and high entry barriers, especially for youth. At the same time, they are
relatively highly unionised. Observing the adjustment patterns in these two countries, it is surprising
to note that the relationship between productivity and employment has actually been quite similar in
these countries. In fact, the business cycles of both these countries are fairly synchronised (crises
occurring on roughly the same dates).
Germany, France and Italy used and increased their "internal flexibility" with significant
reductions in hours worked induced by policy interventions in the so-called “crisis packages” of these
countries. Aiming to minimize employment reductions, these policy instruments proved strongly
detrimental to productivity.
The third group consists of countries where adverse huge employment adjustment is
accompanied by a decrease in productivity. This group comprises the three Baltic countries – the most
heavily hit EU economies. Estonia, Latvia and Lithuania experienced a two-digit reduction in GDP,
which is by far the largest crisis since the onset of the economic transition. As a consequence of fairly
flexible labour markets, the impact on employment has also been considerable. It should be noted that
this huge job shock is the second one (the previous one occurred in the first years of transition) in less
than a generation.
Figure 4. Countries with adjustment pattern of type (c)
Note: solid black line (late 2000s); dashed black line (early 2000s); grey line (late 1990s)

15
As regards past crises, the Baltic States seem to have followed a typical neoclassical
adjustment. Estonia and Lithuania would classify as type (a) patterns, while the type (b) pattern in the
case of Latvia may be explained by relatively mild economic crises in previous years. However, the
observed puzzle may be justified by the following observation: the reduction in employment observed
in the Baltic States – in the strikingly high accumulated magnitude of 10%-20% in total – is a
consequence not so much of a recession, but rather of a collapse of the economy. For a relatively small
economy – the populations of these countries range between 2 and 4 million citizens – a drop in the
size of the economy by one fifth is a shock that cannot be absorbed without negative adjustments in
both productivity and employment.
Figure 5. Countries with adjustment pattern of type (d)
Note: solid black line (late 2000s); dashed black line (early 2000s)
The final type of adjustment involves contemporaneous increases in both productivity and
employment. This group – quite exotic in composition – comprises Belgium, Czech Republic and
Poland. In general, such behaviour is actually contrary to the predictions of any crisis theory – let alone
the RBC approach – and seems to suggest that there is no economic crisis. In fact, of these three
countries, Poland maintained positive GDP growth rates, while the recessions in both Belgium and
Czech Republic have been relatively moderate. Moreover, these three countries seem to conform to the
canonical RBC patterns in the periods of more pronounced economic slowdown. The earlier crises
demonstrated the increase of productivity and the reduction of employment, although the magnitude
of adjustment is much lower in the case of Belgium.

16
Summarising, although the adjustment patterns across countries seem to be highly
heterogeneous and even divergent, there appear to be four main adjustment patterns. In addition, it is
very interesting to highlight that the employment-productivity dynamics occurred in past crises often
differed from the dynamics during the last crisis.
4. Conclusions
The objective of this paper was to verify whether the current crisis has any peculiarities in the
way productivity-employment adjustments have taken place. The typical RBC approach suggests that
the post-peak adjustment should involve reductions in employment accompanied by increases in
productivity. Such a pattern was followed in the US over the recent crisis, which prompts some
researchers – among them Casey Mulligan – to claim that in fact the current economic recession is
rooted in real, rather than financial reasons.
We have produced empirical evidence on different adjustment patterns among the EU Member
States in terms of productivity-employment adjustment. In fact, the paper identifies highly diverse
adjustment paths. We analysed the first 6-8 quarters after the peak of the economic performance. We
considered the past two decades of data, identifying for each country between two and three such
events. In all of the identified countries the “peak” quarter happened before the collapse of Lehman
Brothers and the adjustment was not accompanied initially by any crisis-oriented policy packages.
This comparison permitted organisation of the adjustment paths into groups – coherent within
and different from each other. A comparison of adjustment patterns over time and across the
institutional frameworks highlights two types of peculiarity. The first is associated with the atypical
adjustments in many European countries over the recent crisis. The second encompasses the positive
or detrimental role the institutions and policies may play in absorbing the consequences of a global
economic crisis.
Our findings are consistent with the conclusions of Eichhorst et al. (2010) who use different
methodology, but also yield policy implications based on a cross-country comparison of the crisis
response and policy response among EU Members. Similarly to the US adjustment pattern, a reduction
in employment together with an increase in productivity, consistent with RBC theory, occurred only in
Hungary and Spain. France, Italy and Germany formed a second group, where the currently observed
processes involve predominantly maintenance of employment at the expense of productivity.
In a second group of countries consisting of Denmark, Finland, the Netherlands and the United
Kingdom, a short joint decline in both employment and productivity is followed by an adjustment
pattern of RBC type. Although the current employment response in these countries is unprecedented
in terms of magnitude, it can be partly explained by the severity of the current shock as well as the
historical evolution of employment.
The Baltic States – Estonia, Latvia and Lithuania – are the third group. An adverse huge
employment adjustment is accompanied by a very strong decrease in productivity. These economies
experienced a two-digit reduction in GDP during the last crisis while the recent major shock is the
second one within less than a generation.
For the rest of the countries analysed in our study – Belgium, Czech Republic and Poland – the
typical adjustment pattern in the case of the crisis is consistent with RBC, but currently both increase
in employment and productivity is observed. In fact, Poland maintains positive GDP growth rates,
while the recession in both Belgium and the Czech Republic is relatively moderate.

17
The employment-productivity adjustments in the countries adopting the "flexicurity model" –
based on "external flexibility" and effective active and passive labour policies – were every bit as
positive as in the past. Employment dynamics were more favourable in the countries taking advantage
of higher "internal flexibility" and related policies, which permitted a flexible reduction in hours
worked with minor job destructions, i.e. “labour hoarding”. However, the price paid in terms of
productivity reduction was very high, reaching 4-6 percentage points in just 6-8 quarters.
Consequently, it seems that accompanying the “external flexibility” measures with “internal flexibility”
practices offers greater chances for swift recovery of satisfactory labour market performances without
penalizing the productivity dynamics. It is also crucial, however, to design instruments in response to
the actually observed processes, suited to the country at hand.

18
References
Arpaia A. and Curci N. (2010), “EU labour market behaviour during the Great Recession”, European Economy,
Economic Papers 405, February.
Ayhan Kose, M., Eswar S. Prasad and Marco E. Terrones, 2003. How Does Globalization Affect the Synchronization
of Business Cycles? The American Economic Review, Vol. 93, No. 2, Papers and Proceedings of the One
Hundred Fifteenth Annual Meeting of the American Economic Association, 2003 (May, 2003), pp. 57-62.
Babetskii I. (2005), ‘Trade integration and synchronization of shocks: Implications for EU enlargement’,
Economics of Transition, 13, 105-138.
Baxter, M. and R.G. King 1999. Measuring business cycles: approximate bandpass filters for economic time series.
Review of Economics and Statistics 81, 575-593.
Beaudry P. and Collard F. (2002), "Why has the Employment-Productivity Trade-off among Industrialized
Countries been so Strong?", NBER Working Paper, n. 8754.
Becker I.D. and R. J. Gordon (2008), "The Role of Labor Market Changes in the Slowdown of European
Productivity Growth", CEPR Discussion Paper, n. 6722.
Beegle K., Frankenberg E. and Thomas D. (1999), "Measuring Change in Indonesia. Labor and Population
Program", Working Paper Series, 99–07, RAND, Santa Monica, CA.
Belorgey N., Lecat R. and Maury T.P. (2006), "Determinants of Productivity per Employees: An Empirical
Estimation Using Panel Data", Economics Letters, vol. 91, issue 2, pp. 153-157.
Bernard, Andrew B. and Charles I. Jones. 1996, Comparing Apples to Oranges: Productivity Convergence and
Measurement Across Industries and Countries, American Economic Review, Vol. 86, No. 5 (Dec., 1996), pp.
1216-1238.
Boeri T. and P. Garibaldi (2009) “Beyond Eurosclerosis”, Economic Policy, v. 24, n. 59.
Chari V., Kehoe P. and Mc Grattan E. (2006), “Business Cycle Accounting”, Federal Reserve Bank of Minneapolis,
Research Department Staff Report 328.
Choudhry M.T., Marelli E. and Signorelli M. (2010), “Financial Crises and Labour Market Performance”,
International Atlantic Economic Conference, Prague, 24-27 March 2010.
Christiano, L.J. and T.J. Fitzgerald 2003. The band pass filter. International Economic Review 44, 435-465.
Corbae, Dean and Sam Ourialis. 2006. Extracting Cycles from Nonstationary Data, in: Econometric theory and
practice : frontiers of analysis and applied research, P. C. Phillips, Dean Corbae, Steven N Durlauf; Bruce
E Hansen (eds), Cambridge (UK) ; New York : Cambridge University Press, 2006.
Darvas, Zsolt and Gyorgy Szapary. 2008. Business Cycle Synchronization in the Enlarged EU, Open Economies
Review, Volume 19, Number 1 / February, 2008, pp 1-19
Eichhorst W., Feil M. and Marx P. (2010), "Crisis, What Crisis? Patterns of Adaptation in European Labor
Markets", IZA Discussion Paper, n. 5045.
European Commission (2009a), Economic Forecast, November, Brussels.
European Commission (2009b), Employment in Europe 2009, November, Brussels.
Fallon P.R. and Lucas R.E.B. (2002), "The Impact of Financial Crises on Labor Markets, Household Incomes, and
Poverty: A Review of Evidence", World Bank Research Observer, Oxford University Press, 17, 1, 21-45.
Fidrmuc J. and Korhonen I. (2006), ‘Meta-analysis of the business cycle: Correlation between the Euro area and
the CEECs’, CESIFO Working Paper, 1693.
Fok, D., P.H. Franses, and R. Paap 2005. Comparing Seasonal Adjustment Methods. Palgrave Handbook of
Econometrics vol. 1, T.C. Mills and K. Patterson, eds. Palgrave-MacMillan, Ltd.
Frankel J., Rose A.K. (1998), ‘The endogeneity of Optimum Currency Area criteria’, Economic Journal, 108, 1009-
1025.
Fulco L. (1984), “Strong post-recession gain in productivity contributes to slow growth in labor costs”, Monthly
Labor Review, December.

19
Growiec, J. 2009, On the Measurement of Technological Progress Across Countries, MPRA Paper 19321, University
Library of Munich, Germany.
Hodrick, R.J. and Prescott, E. C. (1997), Postwar U.S. Business Cycles: An Empirical Investigation, Journal of Money,
Credit & Banking, Vol. 29, 1997
ILO (2010), Global Employment Trends, International Labour Organization, Geneva, January.
IMF (2009), World Economic Outlook. Sustaining the Recovery, Washington, October.
IMF (2010), World Economic Outlook. Rebalancing Growth, Washington, April.
Kaiser, R. and A.M. Maravall 2001. Measuring Business Cycles in Economic Time Series. New York: Springer-Verlag
Lee J. (2000), "The Robustness of Okun's Law: Evidence from OECD Countries", Journal of Macroeconomics, vol.
22, pp. 331-356.
Leser, C. E. V. 1961. A Simple Method of Trend Construction. Journal of the Royal Statistical Society. Series B
(Methodological), 23, 91–107.
Marelli E. (2000), “Progresso tecnico, occupazione e figure professionali”, chapter 4 in: Marelli E. and Porro G.
(eds.), Il lavoro tra flessibilità e innovazione. F. Angeli, Milano,
Marelli E. and Signorelli M. (2010), “Employment, Productivity and Models of Growth in the EU”, International
Journal of Manpower, n. 7.
Mukand S. and Rodrik D. (2005), “In Search of Holy Grail: Policy Convergence, Experimentation and Economic
Performance”, American Economic Review, Vol 95, Issue 1, March 2005, pp 374-383
Mulligan, C. (2009), What Caused The Recession Of 2008? Hints From Labor Productivity, NBER Working Papers
Series, No 14729, February, 2009
Padalino S. and Vivarelli M (1997), "The Employment Intensity of Economic Growth in the G-7 Countries",
International Labour Review, n. 136, pp. 191-213.
Pichelmann K. and Roeger W. (2008), "Employment and Labour Productivity in the EU: Reconsidering a Potential
Trade-off in the Lisbon Strategy", in Eichengreen, Landesmann, and Stiefel (eds.), The European Economy
in an American Mirror, Routledge, pp. 128-142.
Rose A. (2000) ‘One money, one market: the effect of common currencies on trade’, Economic Policy, 15, 7-45.
Rutkowski J. (2006), "Labour Market Developments During Economic Transition", World Bank Policy Research
Working Paper, n. 3894.
20
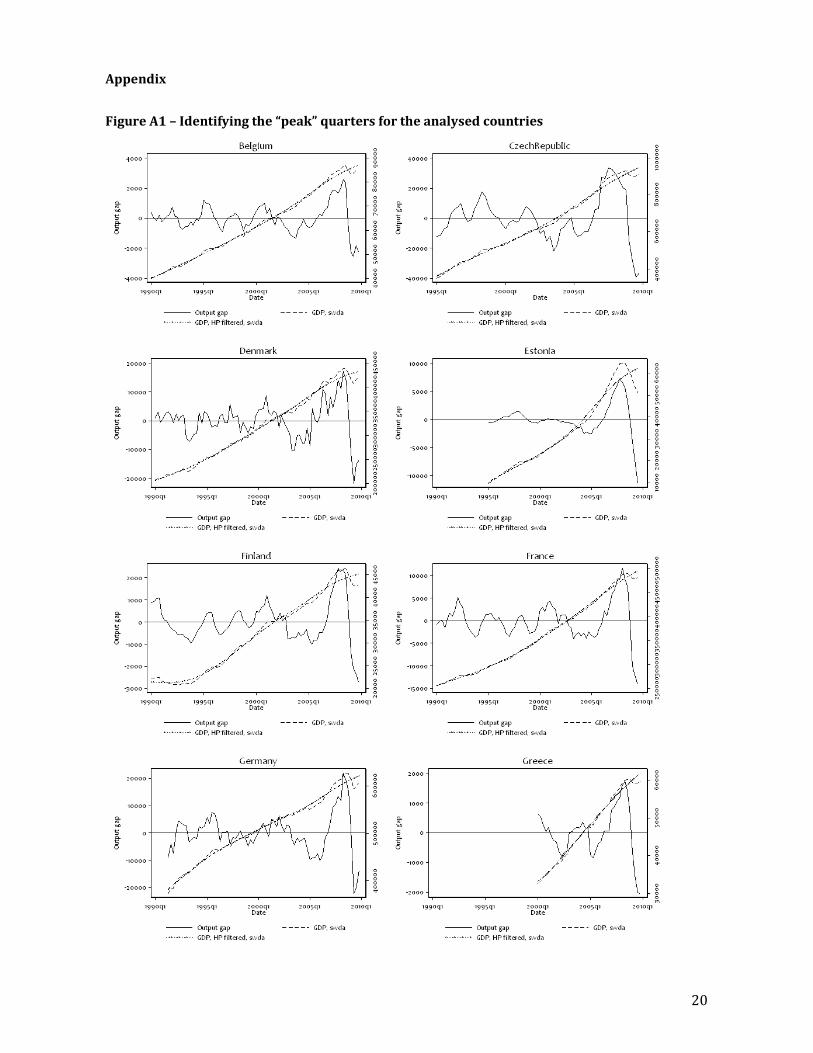
Appendix
Figure A1 – Identifying the “peak” quarters for the analysed countries

21

22
Note: Typically, series for GDP were longer than for employment. Thus, not all of the identified peaks could be
analysed.