Embed Size (px)
Citation preview
#2008-054
INTERNATIONALIZATION TRAJECTORIES - A CROSS-COUNTRY COMPARISON: ARE LARGE CHINESE AND
INDIAN COMPANIES DIFFERENT?
Fabienne Fortanier and Rob van Tulder
Working Paper Series
United Nations University - Maastricht Economic and social Research and training centre on Innovation and Technology Keizer Karelplein 19, 6211 TC Maastricht, The Netherlands
Tel: (31) (43) 388 4400, Fax: (31) (43) 388 4499, e-mail: [email protected], URL: http://www.merit.unu.edu

2
3
Internationalization Trajectories – a cross country comparison:Are Large Chinese and Indian Companies different?
Fabienne Fortanier* and Rob van Tulder**
* University of Amsterdam Business School** Rotterdam School of Management, Department of Business-Society Management
Corresponding author: Rob van Tulder,RSM Erasmus University Rotterdam
Burgemeester Oudlaan 50, Room T7-033062 PA Rotterdam, The Netherlands
Email: [email protected]: +31-10-4089012Tel: +31-10-4081923
AbstractThis paper explores whether the internationalization trajectories – patterns over time in the level, pace,variability and temporal concentration of international expansion – of large firms from China and Indiaare fundamentally different from those of developed country firms. A longitudinal cross-countrycomparative study of 256 large firms for the 1990-2004 period shows that, although internationalizationtrajectories of large and leading Chinese and Indian firms are indeed different, there are also considerablesimilarities between established developed country firms and the new firms from emerging markets, notin the least because they often interact within the same sector
Key words: Internationalization trajectories, Transnationality Index (TNI), longitudinal research, cross-country comparisonJEL codes: F21, F23, M19
UNU-MERIT Working PapersISSN 1871-9872
Maastricht Economic and social Research and training centre on Innovation and Technology,UNU-MERIT
UNU-MERIT Working Papers intend to disseminate preliminary results of research carriedout at the Centre to stimulate discussion on the issues raised.

4
5
Internationalization trajectories – a cross country comparison:Are large Chinese and Indian Companies different?
1. INTRODUCTION
Understanding the nature, characteristics and determinants of the internationalization strategies of large
corporations is one of the key research foci within the International Business domain. So far however,
only limited attention has been paid to the dynamic change in a firm’s overall extent of
internationalization, as research has concentrated either on ‘one-off’ foreign investment decisions (e.g.
studies on the determinants of FDI, or on entry-mode choice and the role of subsidiaries), or used the
degree of internationalization in a relatively static way. Most research has focused on cross-sectional
comparisons of determinants (Autio et al., 2000; Tihanyi et al., 2000) and performance implications (see
e.g. Lu and Beamish, 2004; Contractor et al., 2003) rather than changes over time within a framework of
long-term corporate strategy. Only a few recent studies (e.g. Maitland et al., 2005; Vermeulen and
Barkema, 2002) have explicitly and empirically addressed how, at the corporate level, firms expand (and
withdraw, see Benito and Welch, 1997) their international activities over time. Or, as Maitland et al.
(2005: 436) noted, there is still ‘limited understanding of how the multinational enterprise (MNE) is
created as an integrated system of strategically allocated resources, rather than a simple aggregation of
discrete affiliate or country level decisions.’
Especially, the lack of systematic, integrated and time-related empirical information on MNE strategies is
an important omission, as there are indications that dynamic differences in the internationalization process
and the resulting balance in sales and assets over time affect the extent to which firms are able to reap the
benefits from or handle the risks of international expansion (Vermeulen and Barkema, 2002; Ruigrok and
Wagner, 2003). In addition, a longitudinal analysis of growth across borders can shed light on the growth
of the firm in general (Jones and Khanna, 2004; Penrose, 1959), and allows for a study of the various
6
strategies that firms have used in driving economic globalization, hereby furthering our understanding of
this prominent process (Rugman and Verbeke, 2004).
The rise of large new multinational enterprises from big emerging market countries like China and India
gives further impetus to this research question, as a debate has sprung up on whether internationalization
strategies of emerging market MNEs (Luo and Tung, 2007) are fundamentally different from the
strategies of firms in developed country markets and the extent to which these companies and their
countries pose an opportunity or a threat to developed companies and countries (Sauvant, 2008). A
comparative study of the Boston Consulting Group (2006) on the ‘new global challenge’ identifies at least
one hundred companies based in rapidly developing economies, that will ‘radically transform industries
and markets around the world’ (BCG, 2006: 5). India (21) and China (44) alone account for 65 of these
emerging global players.
Existing research on emerging market MNEs suggests that the characteristics of these firms, their motives
for internationalization and the nature of their ownership advantages are fundamentally different from
those of developed country MNEs (Mathews, 2004; Luo and Tung, 2007; Buckley et al., 2007; Li, 2007).
The empirical basis of such comparisons can be problematic, however. The largest established MNEs
from developed countries – which to a large extent comprise also the largest domestic firms in developed
countries (cf. UNCTAD, 2007) – are compared with the frontrunner MNEs from developing countries –
which often represent much smaller companies. Sometimes, interesting insights have been obtained by
comparing the characteristics of emerging market MNEs with those of ‘yesterday’s’ developed country
MNEs (Dunning et al., 2008).
Hence, to what extent the above differences in characteristics, motived and ownership advantages
between developed and developing country firms really result in different paths of internationalization
expansion remains yet unknown. This paper aims to address this lacuna in existing research in general
and in specific regarding the ways in which large Chinese and Indian firms expand their activities across
7
borders over time by introducing the concept of internationalization trajectories. Building on Maitland et
al. (2005) and Vermeulen and Barkema (2002), internationalization trajectories are defined as distinct
patterns over time with respect to the level, pace, variability, and temporal concentration of international
expansion. The main research question of this paper is therefore whether the internationalization
trajectories of large Chinese and Indian firms are different from those of large developed country firms.
Answering this question requires more than a cross-sectional comparison of firms’ degrees of
internationalization: it necessitates longitudinal and cross-country comparative data. While such data are
notoriously difficult to gather and compare reliably over time (Vernon, 1999), we were able to collect this
data on the internationalization of sales and assets between 1990 and 2004 of a sample of 233 of the
largest developed country firms from the US, Europe and Asia from published corporate sources (annual
reports and SEC filings). Using factor analysis as well as hierarchical and non-hierarchical clustering
techniques, we identify six different ‘types’, or trajectories, of internationalization of sales and assets. The
trajectories of leading developed country MNEs are subsequently used as a benchmark against which the
strategies of the largest and/or most international Indian and Chinese firms are compared. This
comparison – still relatively qualitative in nature given that most large Indian and Chinese firms have
only very recently started to internationalize at a notable (strategically relevant) scale – is done for a
sample of 31 of the largest and most international Chinese and Indian firms and highlights differences but
also similarities in the internationalization trajectories of Chinese and Indian firms, and those from
developed country markets.
This paper is organized as follows. First in section 2, the relevance of studying internationalization
trajectories is further explained and positioned in the existing academic literature on international
business. In addition, the differences in the internationalization trajectories that can be expected from the
existing literature between firms from China and India will be explored. Section 3 details the
8
methodology that leads to the basic benchmark set of internationalization trajectories among developed
country firms, and the approach to comparing these to the firms from China and India. The results of the
quantitative analyses are presented in section 4 which identifies six different internationalisation
trajectories for assets and sales. Section 5 applies these findings to the patterns of internationalization
from MNEs from India and China, while section 6 draws conclusions and presents suggestions for
follow-up research.
2 INTERNATIONALIZATION STRATEGIES
2.1 Existing research
How the internationalization of firms actually comes about, and for what reasons, is a question that is
central in the area of International Business. Inspired by theoretical models like Dunning’s eclectic
paradigm (Dunning, 1988, 2000, 2001b) or the more process-oriented perspectives of the Uppsala school
(Johanson and Vahlne, 1977; Johanson and Wiedersheim-Paul, 1975), a large amount of empirical work
has already been conducted to answer this question.
Examples of such studies on the internationalization of firms include the work on the determinants of FDI
at the macro-level of analysis, in which for example the role of policy variables such as investment
incentives, performance requirements and taxes (Loree and Guisinger, 1995; Blonigen, 2005) are
highlighted. Also the role of institutional factors such as property rights and government quality
(Loungani et al., 2002; Biswas, 2002); geographical, cultural, administrative and economic proximity
between home and host country (Ghemawat, 2001; Van Tulder with Van der Zwart, 2006; Xu and
Shenkar, 2002); agglomeration effects (Porter, 1998) have received research attention, in addition to the
more traditional determinants of FDI (Nunnenkamp and Spatz, 2002).
At the micro-level, substantial research has focused on explaining the way in which international
expansion takes shape in studies on entry mode choice (Brouthers, 2002; Chang, 1995; Kogut and Singh,
9
1988; Makino and Neupert, 2000), including the identification of the determinants of such choices like
markets and investment risk, firm strategic factors and ownership advantages (Kim and Hwang, 1992;
Agarwal and Ramaswami, 1992), as well as their performance implications, that have been found to be
dependent upon host country context, firm-specific resources and organizational control (Woodcock et
al., 1994; Slangen, 2006; Siripaisalpipat and Hoshino, 2000), firm strategy (Busija et al., 1997) or entry
sequence (Pan et al., 1999).
Finally, in research on the determinants of internationalization strategies at the corporate level, country,
industry, and firm specific variables such as size, R&D intensity, and experience have been found to
affect the degree of internationalization of the firm (see for example Autio et al., 2000; Peng and Delios,
2006; Tihanyi et al., 2000; Hitt et al., 2006). Especially the effect of the degree of internationalization on
performance remains a much researched and fervently debated issue as theoretical explanations have
proposed different balances between the costs and benefits of internationalization and hence different
‘shapes’ of the relationship between internationalization and performance (compare e.g. Zaheer, 1995;
Ruigrok and Wagner, 2003; Geringer et al., 1989, Gomes and Ramaswamy, 1999; Lu and Beamish, 2004;
Contractor et al., 2003).
However, much research on internationalization (and its performance implications) has primarily
concentrated on individual or ‘one-off’ decisions (Fletcher, 2001). Though empirical studies often depart
from larger overarching theoretical frameworks (e.g., the eclectic paradigm, or the Uppsala model), the
actual empirical analyses centre on individual investment decisions (e.g. their entry modes and the role of
subsidiaries), or use aggregated national level data (FDI) rather than information at the organizational
level to analyze the determinants of internationalization. In the evaluation of the performance impact of
international expansion, internationalization is measured as a firm-wide construct – often as the ratio of
foreign to total sales or assets – but the analysis focuses primarily on the levels of internationalization, and
on the cross-sectional dimension, whereas only limited attention is paid to the time dimension and
patterns of dynamic change. An overall picture on the extent and way in which the largest firms

10
worldwide have recently expanded their international operations over a longer period of time is still
remarkably absent (Vernon, 1999; Maitland et al., 2005; Fletcher, 2001). This has also consequences for
an assessment and an understanding of the degree to which national economies as a whole participate in
the process of globalization.
This paper aims to contribute to the understanding of the international expansion of firms over time, by
building on the few studies that have taken a longitudinal perspective, notably Vermeulen and Barkema
(2002), and Maitland et al. (2005). Both groups of authors have developed measures to capture the
dynamics in the internationalization process, using information on individual investment projects by
subsidiaries. Maitland et al. (2005) examined the clustered versus non-clustered growth (in time) of firms
in the 1900-1975 period using a sample of 181 US-based multinationals from the HBS Multinational
Enterprise database. Vermeulen and Barkema (2002) analyzed the pace and rhythm of international
expansion of 22 Dutch firms between 1967 and 1992.
Combining these insights with the traditional analysis of levels (ratios) of internationalization, four main
characteristics of the internationalization process can be distinguished. First, the average level of
internationalization. This measure represents the overall extent to which a firm’s assets and sales are
located outside its home country. Secondly, the average pace of international expansion, or the growth
rate with which the level of international activities increases or decreases. The third dimension is the
variability of international expansion (and retreat), or the variability in growth rates. Finally, the fourth
dimension represents the temporal concentration of international expansion, or the extent to which the
expansion of internationalization activities is clustered in time, or occurs relatively gradually.
We define internationalization trajectories as distinct patterns over time with respect to these four
components, i.e. with respect to the level, pace, variability, and temporal concentration of international
expansion. By systematically classifying firms according to common characteristics in their patterns of
internationalization, we essentially build a typology of internationalization strategies. At present, no
11
typologies are yet available for internationalization strategies over time, although identifying typologies is
an important academic tool to enhance our understanding of these firms, to guide further research and
theory development, and to provide anchors for policy makers and managers (see e.g., the work on
organizational structure of Bartlett and Ghoshal, 1989).
2.2 MULTINATIONALS FROM EMERGING MARKETS
In this paper, the basic typologies or internationalization trajectories should help to assess whether the
description of emerging market MNEs requires indeed additional types of internationalization strategies
or whether these firms deploy (combinations of) already implemented strategies. Since the 1990s, MNEs
from emerging markets are rapidly increasing in size and number (cf Child and Rodrigues, 2005). The
Fortune Global 500 list of 2006 contained 57 of these companies as compared to 19 in 1990. The number
of multinationals from developing countries that appear in the annual Top100 listings of the most
internationalized firms in the UNCTAD World Investment Reports increased from zero in 1990 to seven
in 2005 (UNCTAD, 2007). Primarily from South-east Asia (notably China, and to a lesser extent India),
these ‘dragon multinationals’ (Mathews, 2002) or ‘emerging market MNEs’ (Luo and Tung, 2007) of the
late 1990s are often considered to adopt substantially different internationalization strategies from either
the latecomer developed country MNEs (Li, 2007), ‘Third World’ multinationals in the 1970s and 1980s
(Lecraw, 1993; Wells, 1981, Lall, 1983), the Newly Industrialising Economy (NIE) multinationals from
the 1990s, or the ‘born-globals’ that include smaller and medium sized corporations from developed
countries (UNCTAD, 2006).
The emerging market MNEs from India and China share a series of characteristics as uncovered by recent
studies. First of all, emerging market MNEs have been found to be more often family-owned. Family ties
and parental networks are important as determinant of international activity (Li, 2007; Lecraw, 1977;
Buckley et al., 2007; Lall, 1983; Elango and Pattnaik, 2007). Firms are also often affiliated with larger
12
business groups, an ownership advantage especially when internationalizing to other developing countries
(Garg and Delios, 2007; Lall, 1983).
Secondly, the role of the home country government is very important in determining firm strategy, for
example in regulating outward FDI from emerging markets. Government policies prohibited outward FDI
until recently. Nowadays outward FDI is actively stimulated with subsidies and other FDI policies (Luo
and Tung, 2007; Buckley et al., 2007), via state-owned companies (Li, 2007), and a general framework of
export orientation and (modest) domestic liberalization (UNCTAD, 2006). In addition, escape motives,
where firms invest abroad to avoid strict government policies in the domestic market (Wells, 1977) to e.g.
acquire foreign exchange and technology or avoid capital market imperfections in general (Buckley et al.,
2007), have received new attention in IB research (cf Witt, Lewin, 2007) following their role in outward
FDI by emerging market MNEs.
A third characteristic of emerging market MNEs is the experience of these firms in operating in less
developed markets (Wortzel and Wortzel, 1988), which gives them an ownership advantage in ‘managing
institutional voids’ (Li, 2007; Khanna and Palepu, 2006; Chittoor and Ray, 2007; Luo and Tung, 2007) in
other less developed countries as well. Finally, EM MNEs are often considered to suffer from late-comer
competitive disadvantages (Chittoor and Ray, 2007; Luo and Tung, 2007). This is one of the reasons why
recent investments (from approximately 2001 onward, see Buckley et al, 2007; Yiu et al.,2007; Li, 2007)
for FDI into developed markets has been of an opportunity and asset seeking rather than asset exploiting
nature.
These different characteristics have been suggested to result in internationalization strategies that are also
substantially different from those of developed country firms. Described as ‘springboarding’ (Luo and
Tung, 2007; Rui and Yip, 2007), the internationalization strategies of emerging market firms are
characterized by their high-risk, aggressive and ‘boom and bust’ or radical nature. Firms often target
developed countries in search of (strategic) assets (Li, 2007; Buckley, 2006; Luo and Tung, 2007), and

13
pursue many customers in many foreign markets at once in a strategy of entrepreneurial venturing (Yiu et
al., 2007). As they aim to catch up with western firms, emerging market MNEs continue to be strongly
home oriented; as internationalization occurs often through exports (Li, 2007; Chittoor and Ray, 2007).
Empirical research on emerging market MNEs that has resulted in the above conclusions has used a
variety of methods and measures to assess internationalization by these firms. Most research, however,
remains descriptive and is based on cases of a limited number of often frontrunner firms, as noted by
Aulakh, 2007 and Buckley et al., 2007). With a few exceptions – e.g. Elango and Pattnaik (2007) and
Buckley et al. (2007) who use quantitative analyses – studies only cover either very recent years or use
macro level instead of firm-level data. While a few studies have aimed at classifying or typifying MNEs
from emerging markets (e.g. Chittoor and Ray, 2007 for 40 Indian pharmaceutical firms; or Li (2007) for
three major Chinese firms), no studies have as of yet made a direct comparison between the
internationalization pattern over a comparable period of time of large firms from China and India with
those from developed countries (for a historical comparison, see Dunning et al, 2008).
Based on this particular literature, several expectations may be expressed for the internationalization
trajectories of large firms from India and China in comparison with firms from developed countries as
regards level, pace, rhythm and temporal concentration.
First, we would expect that the level of internationalization of large Indian and Chinese firms is still lower
than that of most developed country firms, because internationalization from emerging markets – and
China and India in particular – started only relatively recently. This is reflected also in the observation by
Li (2007) and Chittoor and Ray (2007) that Chinese and Indian firms are still characterized by a strong
home orientation.
Secondly, the pace of growth however can be expected to be much higher than that of developed country
MNEs, as a reflection of the ‘catch-up’ strategies (Li, 2007) of MNEs, the growth of entrepreneurial
venturing activities in which firms pursue many foreign markets at once (Yiu et al., 2007), and the
14
aggressive wholly-owned acquisitions that are made abroad in recent years (Buckley et al., 2007). In case
of state-owned firms, the pace of growth will be strongly influenced by government policies and their
perception of geo-political interests. In particular in the extractive industries, rapid internationalization is
needed to safeguard access to scarce resources for large economies like India and China.
Thirdly, the variability of expansion (rhythm) can also be expected to be higher than that of developed
country MNEs. Home government backing (Luo and Tung, 2007; Buckley et al., 2007) has induced
higher risk strategies, which may also fail again. The variability of expansion is also evident from Li’s
(2007) description of EM strategies as being of a boom and bust nature.
Finally, the fact that international activity from China and India has only seriously taken off since a few
years, will probably mean that these firms will have higher scores on temporal concentration as well.
3. METHODOLOGY
In order to assess to what extent internationalization trajectories of large Chinese and Indian firms differ
from those of developed country MNEs, we divide our empirical research into two components. First, we
identify the internationalization trajectories used by firms from developed countries, using quantitative
data. Second, we make a more qualitative assessment of the internationalization trajectories of the largest
and most international Chinese and Indian firms, and identify to what extent the developed country
trajectories apply.
3.1 Internationalization trajectories of firms from developed countries
For the first stage of the study, we developed a benchmark dataset on the internationalization of sales and
assets between 1990 and 2004 of a sample of the largest firms worldwide. The basis of the selection of
firms in the sample was the list of 300 largest non-financial firms worldwide in 1995 (based on sales,
from the Fortune Global 500 list of 1995), plus the top 50 largest firms from a selection of the most
important investor countries worldwide: the US and Japan (both Top 50s already included in the 300 from

15
Fortune), and the UK, France, Germany, and the Netherlands. These Top 50s ensured a wider coverage of
in particular European firms that would otherwise have been underrepresented in the sample. Taking 1995
as a benchmark year reduced the survivors-bias in our sample. The resulting sample consisted of 444
firms in 1995. Data were collected on the internationalization of these firms, following the firms
backwards in time until 1990, and forwards until 2004.
We measured firm internationalization by the foreign-to-total sales ratio (FSTS) and foreign-to-total
assets ratio (FATA). While a range of other indicators of internationalization has been developed (see e.g
Ietto-Gillies, 1998; Hitt et al., 1997), these two measures remain the most often used ones in IB research
to document the weighted corporate strategy in which the relative importance of subsidiaries is taken into
account in terms of their contribution to overall sales and assets (see e.g. Sullivan, 1994; 1996;
Ramaswamy et al., 1996; and UNCTAD’s TransNationality Index). Both variables do suffer from
measurement problems that become more pronounced in longitudinal research (especially if firms change
their method of reporting). For example, some assets (notably intangible assets) are not geographically
specified (often noted as ‘corporate’ assets) for certain firms, whereas foreign sales may or may not
include intra-firm sales. As a general rule, we calculate the FSTS and FATA ratio’s based solely on the
geographically specified sales and assets, without making assumptions on the geographical dispersion of those
assets or sales that were not geographically specified by the firm. In addition, we choose to exclude intra-firm
sales from our measurement of the FSTS ratio, so that the degree of internationalization of firms that belong to
a conglomerate are not overestimated. However, we – like all other researchers using these types of data –
remain dependent upon the figures reported by the firms themselves, which are not by definition exactly
comparable across all firms. This means that while we take care in interpreting our findings, there is always a
chance that measurement errors influence the results.
In gathering data on the internationalization of sales and assets, we were able to find such data for 233
firms for which at least one of the two variables (FSTS and FATA) was available for 10 or more years in
the 1990-2004 period. These long periods are necessary in order to be able to study patterns over time. In
16
sum, our dataset consists of 3495 (15*233) firm-year observations as a maximum, of which 3252 (93
percent) are available for FSTS and 2023 observations (58 percent) are available for FATA. These data
are summarized within time-series per firm, leading to a total of 231 (out of 233) time series for FSTS and
148 for FATA. The average number of observations per time-series is 14.1 and 13.7, respectively, out of a
maximum of 15.
Variable construction
Based on these time-series data on FATA and FSTS, we defined a range of variables in order to measure
the level and process of internationalization for the 1990-2004 period for each firm. Following our
definition of internationalization trajectories, we calculated eight variables for each firm, for both sales
and assets, calculated a range of variables to cover a total of four dimensions of internationalization. The
following variables were constructed per firm, for both sales and assets between 1990 and 2004:
• the average value of FSTS (or FATA) (MEAN);
• the maximum value of FSTS (or FATA) (MAX);
• the minimum value of FSTS (or FATA) (MIN);
• the average annual change in the value of FSTS (or FATA) (GROWTH);
• the average annual growth rate of domestic sales (or assets) (D GROWTH);
• the average absolute change in the value of FSTS (or FATA) (ABS GROWTH);
• the standard deviation of the average annual change in sales (or assets) (GROWTH SD);
• the clustering index by Maitland et al., (2005) (CLUSTER, explained below);
Of these variables in particular the variable CLUSTER requires some further explanation. In our paper,
we use the Clustering Index proposed by Maitland et al. (2005), but apply it to the Degree of

17
Internationalization (DOI) of firms, instead of to the number of international investments. The Clustering
Index is based on the number of ‘clustering points’ divided by the number of observations in the time-
series (in our sample, max 15). Clustering points are annually attributed to a firm for above or below
average (within the time-series) changes in internationalization. Additional points are awarded for serial
exceptional internationalization. The resulting measure indicates for each firm, whether its
internationalization in the 1990-2004 period has occurred relatively clustered in time, or was dispersed
over the entire period. Higher values indicate stronger clustering.
These eight variables were subsequently factor analyzed (for both FATA and FSTS) using the principle
component method with varimax rotation, to reduce the number of variables and to see if the four
dimensions we identified were indeed present in our data. The results indicated that for each set of
variables (assets and sales) 4 factors could be identified with Eigenvalues higher than 1. The results of the
factor analyses are presented in table 1. The four factors extracted explain for a total of 91 percent of the
variance in the sales variables, and for 89 percent of the variance in the assets variables. Factor 1
represents the level of internationalization, and is named Level. Factor 2 represents the variability in
expansion, and is called Variability. Factor 3 represents a combination of DOI growth and domestic
decline, and is called Pace. Finally, factor 4 solely represents the temporal clustering of
internationalization, and is called Cluster.
[table 1 approximately here]
Analytical approach
With the factor scores as variables, the firms can be classified into distinct groups of firms that are
relatively similar in their internationalization strategies by using hierarchical and non-hierarchical
clustering techniques. This sequence of factor and cluster analysis is common for example in marketing
research that looks to identify different segments of consumers (Kwon et al., 1999; Merrilees and Bentley,
18
1999). These clusters represent what we defined as ‘trajectories’: distinct patterns over time with respect
to the level, pace, variability and temporal concentration of international expansion.
3.2 Trajectories of Indian and Chinese firms
More so than for developed country MNEs, reliable empirical data on internationalization for large
Chinese and Indian firms remains lacking. As the OECD (2006) observed, the empirical literature on
MNEs from emerging markets generally represented anecdotal evidence and “deduction and inference
from the history of North-South capital flow”. Although the empirical basis for the systematic study of
emerging MNEs is rapidly expanding, it continues to be extremely difficult to find more quantitative firm
level data on internationalization for firms from India and China that is in any way comparable to the
evidence presented in the previous section. See for instance the articles in the special 2007 issues
dedicated to this topic in the Journal of International Business Studies and the Journal of International
Management.
Therefore, the second stage of this empirical study involved the comparison of the internationalization
trajectories of developed country firms with those of Chinese and Indian firms in a more qualitative
manner. We first selected all the non-financial Chinese and Indian firms from the Fortune Global 500 in
2007, and combined these with the most international Chinese and Indian firms that were listed in the
recent World Investment Report by UNCTAD (2007). Hence, we included the largest and most
international Indian and Chinese firms. This resulted in an initial set of 21 firms, of which 16 are Chinese
and 5 Indian. In order to add sufficient Indian firms to the sample and cover a larger number of sectors,
we also used the 2007 listing of the 20 Indian firms with the highest market capitalisation (according to
Forbes). This added an additional six non-financial companies to the list and broadened the sector
composition of the sample to include utilities, telecommunications and materials (inc. steel). The Tata
steel company is one of those firms. Next to the Tata Group as whole – representing the second largest
corporation in India- Tata Steel was chosen because it figures prominently as exemplary emerging market

19
MNE and can give a first indication on how deconsolidated internationalization trajectories compare to
the overall conglomerate. The Indian sample, finally, was completed with three companies that are
generally considered to represent India’s frontrunner internationalizers: Infosys, Wipro and Dr. Reddy’s.
They add software services and pharmaceutics to the analysis. As a result of this selection process, each
sample contains six companies that the Boston Consulting Group (2006) characterised as ‘emerging
global challengers’ (bold companies in Table 4), The final set of Chinese and Indian firms hence exists of
31 firms (16 Chinese and 15 Indian).
We used UNCTAD data on TNI to assess the degree of internationalization of assets and sales,
supplemented with data from annual reports as far as available and accessible. These data were
complemented with more qualitative information from websites, company statements, and existing
literature where appropriate and available, in order to provide estimates for some when quantitative data
were not available.
4. EMPIRICAL RESULTS FOR DEVELOPED COUNTRIES: INTERNATIONALIZATION TRAJECTORIES
1990-2004
Using the factor scores generated in the factor analysis as input variables, we first aimed to establish
clusters of developed country firms that scored in similar ways on the four factor scores. We applied a
hierarchical clustering procedure in order to determine the number of clusters in the dataset, using the
squared Euclidean distance as a distance measure. Based on a scree-plot of the agglomeration
coefficients, six clusters were found for sales and assets. The cluster centres of the hierarchical clustering
procedure were used as seeds in the non-hierarchical cluster analysis. Such a non-hierarchical cluster
analysis avoids that individual cases continue to be part of a cluster due to early combinations with other
cases, whereas they would fit better with other groups of firms.
20
The results of the cluster analysis are displayed in tables 2 and 3. Each of the tables shows the averages
for each cluster of the variables (the factor scores) on which the cluster analysis is based. These values
have been used to develop names for the various clusters.
Internationalization trajectories: Sales
For sales, six different strategies or trajectories could be distinguished, as displayed in table 2. First of all,
60 firms were characterized as ‘home oriented’. These firms scored very low in terms of the overall level
of internationalization of sales, and also over time, only expanded their international sales very gradually
(hence low variability and cluster scores), and only to a very limited extent (as indicated by the relatively
low value for international expansion). A typical example of a firm in this cluster is the American retail
chain Safeway. With an average 17 percent of their sales outside the USA, Safeway’s international
turnover actually decreased over the 1990s, in a very gradual way with on average 1 percent per year.
[table 2 approximately here]
The second category involves firms that have seen a ‘strong expansion’ of their foreign sales in the 1990-
2004 period. Although their average level of internationalization is relatively low, these 32 firms have
greatly expanded their international activities, as shown by the high score on that factor. This expansion
occurred relatively gradually and not clustered in time, although the speedy changes did increase overall
variability. A key example of a firm that has rapidly expanded its international sales is France Télécom.
From having no international sales in the early 1990s, the firm strongly expanded the share of its
international revenues to a total of 40 percent in the early 2000s. With the exception of a relatively large
increase in 1999, this increase was quite gradual.
A total of 18 firms in our sample showed clear ‘home reorientation’ strategies away from international
markets, as indicated by the very low value on the international expansion factor. These firms had quite
substantial degrees of international sales, but reduced the foreign component of their sales in one or more
21
relatively large steps (see the high value for ‘cluster’). British American Tobacco is one of these firms.
After a period in the 1990s where between 70 percent and 80 percent of BAT’s sales came from non-
British countries, the FSTS ratio was reduced in only a few years to 55 percent in 2004. This decline was
associated with an increase in domestic sales, but not a reduction in foreign sales.
The 45 firms that were named ‘clustered’ are primarily characterized by the high values for the associated
factor. Scoring more or less on average with respect to the overall level of internationalization; slightly
higher for expansion and lower for variability, many of these firms increased their international presence
with a ‘bang’. An example of this category of firms is Otto Versand, which increased its foreign share of
sales from around a stable 30 percent in the early 1990s, to 50 percent in the four-year period between
1997 and 2001, after which the FSTS ratio remained stable again.
15 so-called ‘Stable-volatile’ firms are characterized by their high variability in growth rates of
international sales, although these changes occur around a relatively stable mean, as shown by the
relatively low scores on expansion and cluster. These firms have average degrees of internationalization.
ThyssenKrupp provides a good illustration of these types of firms: comparing the FSTS ratio at the
beginning and end of the 1990-2004 period, the difference is minimal: 47 percent versus 44 percent. But
the time in between is characterized by a rapid sequence of highs and lows, as the FSTS ratio oscillated
from 47 percent in 1990 to a peak of 52 percent 1997, then declined to 38 percent in 1999, jumped back
again to 60 percent in 2001, to end at 44 percent in 2004.
The final set of firms has ‘comprehensive’ international sales. This group of 61 firms has the highest
levels of international sales among all firms, and has seen a slow but steady increase in the FSTS ratio in
the 15 years under investigation, as indicated by the relatively low values for variability and cluster for
these firms, and the slightly above average score on international expansion. Dow Chemical is a typical
example of this category of firms: it gradually increased its (already above average) 52 percent of foreign
22
sales in 1990 to 62 percent in 2004. Figure 1 graphically displays the archetypical examples of these six
internationalization trajectories in the 1990-2004 period.
[Figure 1 approximately here]
Internationalization trajectories: Assets
Similar to the six different internationalization trajectories for sales, six trajectories can be identified that
characterize the expansion and retreat of firms with respect to their international assets (Table 3). Where
the sales dimension is primarily market related, the asset dimension reflects the internationalization of
production. Some of the trajectories that have been identified for the internationalization of sales, have
parallels with the trajectories of asset internationalization (although this by no means implies that these
involve also the same firms), others are slightly different.
As with the sales trajectories, a first set of 35 firms has been dubbed as having followed a ‘home-based’
trajectory between 1990 and 2004. These firms are characterized by very low levels of asset
internationalization, and score also low on variability, expansion, and cluster. The Japanese construction
and engineering firm Kajima exemplifies this trajectory, with the FATA ratio hovering around 10 percent
throughout the period under investigation.
[table 3 approximately here]
The second cluster of firms has followed a trajectory of asset internationalization that can be called
‘strong expansion’. These 32 firms pair substantial levels of internationalization with a large increase in
the share of foreign assets throughout the 1990s, as witnessed by the high value on international
expansion for these firms. This expansion occurs relatively gradually, without major clusters over time.
An example is Asahi Glass, the Japanese glass manufacturer, which expanded its international production
from 36 to 56 percent between 1995 and 2004 in large but relatively equally sized steps.
23
The 36 firms that followed a ‘clustered’ internationalization trajectory with respect to assets have
expanded their international production in either one or several large steps, with periods of relative
stability in between. An illustration of this trajectory is Associated British Foods, which increased its
FATA ratio from just over 10 percent in the early 1990s, to 44 percent in 2004, with a particular strong
increase in the late 1990s.
Similar to the sales trajectories, there is also a cluster of firms that follows a comprehensive asset
internationalization trajectory. A total of 31 firms can be characterized as being already very international,
with relatively few changes throughout the period under investigation (as indicated by the relative low
scores for the variability, expansion, and cluster factors). A good example of this fourth group of firms is
Akzo Nobel, the Dutch chemicals company, which had an average of around 70 percent of its assets
outside the Netherlands, growing only slightly throughout the 1990s and 2000s.
In comparison to the previous clusters, a slightly smaller set of firms can be characterized as ‘dynamic-
volatile’. These 12 firms score high on variability, but are also characterized by strong expansion, hence
they are dynamic rather than static as was the case for the sales trajectory. The internationalization of
Rolls-Royce is illustrative for this trajectory. Increasing its share of foreign assets from 11 to 33 percent
between 1990 and 2004, it did so in a very changeable path. Its FATA ratio moved from 11 percent to 16
percent in 1993, was reduced to 4 percent in 1997 to increase in two years time to 40 percent, and in
2002, to 55 percent, to rapidly decline again in the two years to 2004 (33 percent).
The final set of firms, which we called ‘contraction’ includes only 2 MNEs; Bull, the French electronics
firm, and Booker, the British retailer. Bull’s is a story of restructuring, debt, government support, little if
any profit, and a strong retreat from international markets since the year 2000. Booker, prior to its
acquisition by the Big Food Group in 2002, also experienced several major restructuring operations in the
late 1990s, and was characterized by large debt and sluggish sales. These troubles are reflected in an
extremely high variability of international presence – Bull’s FATA ratio ranged between 0 percent and 56
24
percent in the period under investigation, Booker’s between 0 percent and 42 percent. Both firms also
stand out from the other firms because of their low scores on average levels of internationalization and for
international expansion. Indeed, both firms have (nearly) completely retreated from producing overseas,
Booker between 1997 and 1999; and Bull between 2001 and 2004.
Sector specific trajectories
It is beyond the scope of this paper to explore the determinants of internationalization in detail, but we
would expect that the trajectories of sales and asset internationalization vary across industries. Given that
we have a maximum of 231 firms with trajectories over fifteen broadly defined industry groups, we used
simple counts to make some initial inferences (only for the industries with a minimum of 15 trajectories).
First of all, in the chemicals and pharmaceuticals sectors, most firms can be characterized as following a
comprehensive trajectory, both with respect to sales and assets. Oil companies are quite prominent among
the firms that took a home reorientation trajectory in terms of sales, paired with a strong expansion
trajectory of international assets. Computer and electronics firms are more inclined to follow a home
oriented sales and asset trajectory, although a substantial number of firms also can be characterized as
stable-volatile with respect to sales and clustered with respect to assets. The food, beverages and tobacco
industry more or less mirrors the overall distribution of internationalization strategies, although firms in
this sector seem to have a slight preference for comprehensive trajectories as regards assets. Automotive
firms have shown a distinct comprehensive international sales trajectory, and a similar comprehensive, or
else strongly expanding, trajectory of international production. Telecom and utilities can be characterized
as home market oriented, while assets are also often home-based, or else follow a dynamic volatile
international trajectory. Wholesale and retail have also been strongly home-based in the 1990s. Yet even
though there appear to be ‘dominant’ strategies of internationalization in most sectors, examples of nearly
each approach could be found in each sector. This means that although the sector of activity influences a
firm’s internationalization strategy and trajectory, there is still important firm-specific variation, which re-
25
iterates the observations of Rugman on the relevance of firm-specific advantages in internationalization
strategies (Cf. Rugman and Verbeke, 2004).
5. TRAJECTORIES OF CHINESE AND INDIAN FIRMS
The quantitative analysis reported above identified a total of six asset and six sales trajectories that have
been prevalent by developed country MNEs in the period since 1990. Are the ‘springboard’ strategies of
emerging market MNEs fundamentally different from those of developed countries, or do they represent
combinations of the various trajectories of developed country MNEs? Our expectations based on existing
literature has been that the trajectories of Chinese and Indian firms are characterized by lower levels of
internationalization, but that they show higher growth rates, more volatility, and more temporal
concentration as compared to developed country firms.
The data that we were able to collect on the extent of internationalization of Chinese and Indian firms are
displayed in table 4. From the table, several main conclusions can be drawn. First of all, the extent of
quantitative information is yet very scarce: only for 16 out of our sample of 23 firms, 3 or more years of
internationalization data is available. Sometimes, this hints at the late date that actual internationalization
process (at any scale) started. The missing information in the table, therefore, often implies a very low
level of internationalization. This is the case for the large state-owned companies in both countries, that
were only allowed to internationalize relatively recently. For 13 out of 31 firms, one or both variables
were not available and had to be estimated on the basis of qualitative information (figures are designated
by either < (less than) or ~ (approximately) signs) from annual reports or other company information
(press clippings or websites). Often, these were also firms that hardly had any international activities at all
in the period we studied.
The trajectory of internationalization that we expected among Chinese and Indian firms based on existing
literature, can only partly be confirmed. Importantly, with a few exceptions, the really large Chinese and

26
Indian firms are not multinational at all (certainly in comparison with their western counterparts). This
supports our expectation that the trajectories of Chinese and Indian firms would be characterized by
relatively low levels of internationalization. It is important to note that also some of the firms with quite
high levels of internationalization of sales, are in fact primarily exporters and not – or to a much smaller
extent – engaged in international production activity. Seven Chinese firms were not or barely
internationalized, with FATA and FSTS ratio’s of less than 10%, and an 8th – Lenovo – only took off in
2004 after a very specific and highly publicized international acquisition. Also, 8 out of 15 Indian firms
have a very strong domestic orientation.
[table 4 approximately here]
Secondly, high growth, ‘springboard’ and ‘catch-up’ strategies were expected. Focusing on those firms
that showed >10% DOI in the latest year of data available, we see that while in absolute numbers, the
international activities of Chinese and Indian firms may have indeed increased substantially (as witnessed
e.g. by the increased outward FDI from these countries), the growth of the relative importance of these
activities in the total extent of activities of leading Chinese and Indian firms appears not necessarily
equally high. For the eight Chinese firms with >10% DOI, five showed decreases in internationalization
of assets (China Ocean, TCL), sales (COFCO) or both (CITIC, China MinMetals) in the past 2-3 years for
which we have data. The data in any case do not seem to support the conclusion of high growth of the
degree of internationalization: it is rather the high growth of firms as such – both domestically and abroad
– that seems to be driving international expansion. Still, when we select those Chinese firms that did show
an increase in foreign activity (sales or assets), they grew very rapidly with an average annual growth rate
of 21,3%. For the 8 Indian firms with a non-domestic orientation (Reliance, Oil&Natural Gas; Tata group,
Tata Steel, Sterlite Industries, Infosys, Wipro and Dr. Reddy’s), the growth is 19,1%. Comparing that to
the average growth of internationalization of 1% for the developed country firms, this is indeed (very)
high. Interestingly, some of the frontrunner internationalizers from India and China (Sinochem, Cofco,
27
Infosys, Dr. Reddy’s) experienced much lower growth rates in their internationalization trajectories which
therefore were classified as ‘comprehensive’. Strong expansion primarily appeared in sales, in many
instances assets were seriously trailing behind. We can conclude that a very select set of large Chinese
and Indian firms indeed shows higher growth in their internationalization strategies than firms from
developed countries, as expected from the existing literature.
Thirdly, the very recent rise of international activities by Chinese and Indian firms has been expected to
translate to very volatile trajectories: the ‘boom and bust’ strategies where high-risk investments may not
necessarily pay of. The ratios of foreign-to-total sales do indicate strong volatility for e.g. China Ocean
Shipping, China State Construction Engineering, Bharat Heavy and Tata Steel (in the period observed).
This represents a typical pattern, however, for the heavy industries which can be found in developed
countries as well. The final expectation involved stronger temporal concentration as a result of
springboard and catch-up strategies, and as a result of government policy that only recently allowed
Chinese and Indian firms to internationalize at a substantial scale. For a few firms, notably Lenovo, TCL,
Tata, Sterlite and Wipro in an earlier phase, patterns of strong temporal concentration in international
expansion could indeed be observed. For most firms, however, including many of the ‘frontrunner’
examples, temporal concentration seemed not to be a defining characteristic.
The last column of table 4 tries to provide a first indication of internationalization trajectories of leading
Chinese and Indian firms to date. These reflect the strong home-orientation of a substantial set of Chinese
and Indian firms in both sales and assets. So, internationalization is certainly not a characteristic of all
large Chinese and Indian firms: often international expansion seems to go hand in hand with domestic
expansion. Strong sales internationalization is often accompanied by solid home-based assets. Those
firms that have substantial international activities do show some remarkable traits that seem to support the
idea that Chinese and Indian firms are indeed different from their developed country counterparts in terms
of their internationalization trajectories. Growth rates of the share of international activities are larger
when compared to those of developed country MNEs, and also volatility of expansion (the ‘boom and
28
bust’ pattern) and temporal concentration are higher on average. However, some developed country firms
– in particular in recently liberalized industries – show similar patterns. This indicates that regulatory
factors have indeed a strong influence on internationalization trajectories, but this is true for both
developing and developed country MNEs.
[table 5 approximately here]
What industry dynamics can explain for these strategies? Table 5 shows the ‘dominant’ trajectories
amongst the basic sample of developed country firms that developed over the 1995-2004 period. Not all
sectors in which the largest developed country MNEs dominate are matched by firms from India and
China at any comparable size. This is for instance the case with the automotive, the food and beverages
and retail industry (which are therefore not listed). The 31 Indian and Chinese firms show a considerable
variance of internationalization trajectories, but it is very likely that their strategic orientation and
internationalization is strongly influenced by the trajectories of the dominant (developed) players in the
same sector – many of which are characterized by oligopolistic international competition. The table can
therefore also be interpreted as giving an impression of the strategic responses by large Indian and
Chinese companies to established developed country firms in the industry.
The largest industry among the developing country firms is the petroleum industry. This industry
generally consists of home based firms, with a few rare exceptions like CNOOC, Reliance, or Oil &
Natural Gas Corp. This appears to match the home reorientation strategy of some of the developed
country firms, though these have on average a much higher level of internationalization. The response of
the Indian and Chinese oil industry seems particularly strategic: first and foremost build up (or even
defend) the home market before expanding abroad. The large oil firms – except for some smaller firms
that have been appointed to acquire international assets - do not (yet) show the strong expansion of assets
that developed country firms did. Most of the firms that do show degrees of internationalization that come
close to those of developed country MNEs, like Infosys, Dr. Reddy’s and Wipro in India, or Lenovo and
29
TCL in China are still much smaller in terms of size than developed country firms, and also compared to
other firms in India and China. The response of the computer and software industry of India and China to
the relatively stagnant internationalization strategies of developed country firms, has been aggressive, and
appears to aim at seizing important international markets The sector dynamics of the telecom and utilities
sector reveal largely home-oriented activities at both ends of the equation. There were too few developed
country firms in heavy industries like shipping, construction and steel to reliably identify a distinctive
internationalization trajectory for this sector. The degree of volatility in the internationalization
trajectories of Indian and Chinese firms hints however at sizeable barriers to internationalize. In
chemicals and pharmaceutical, finally, the comprehensive internationalization strategy of the dominant
players is partly mirrored by the Chinese and Indian companies, but often at a lower segment of the
market (generics versus prescription medicine for instance).
6. CONCLUSION AND DISCUSSION
The debate on why and how firms invest abroad and their consequences on the globalization of national
economies is central to international business studies, and has generated a wide range of theoretical and
empirical contributions. However, it remains remarkably unclear how, at the corporate level, firms
expand and withdraw their international activities over time, and to what extent different patterns or
clusters of strategies can be distinguished among such processes and between sectors. The rise of so
called ‘emerging market MNEs’ – especially those from China and India – further highlighted the
importance of answering this question, as questions are being asked as to whether, and how, these firms
differ from ‘established MNEs’ from developed countries.
An important reason for this deficiency in the existing literature has been the difficulty in obtaining
reliable and comparable time series of internationalization strategies at the corporate level. In this paper,
we aimed to address this issue by exploring to what extent the internationalization of sales and assets
between 1990 and 2004 of a sample of 233 of the largest firms worldwide could be classified into distinct

30
trajectories - patterns over time with respect to the level, pace, variability, and temporal concentration of
international expansion. Based on a total of 3252 firm-year observations for sales internationalization, and
2023 firm-year observations for asset internationalization, the various dimensions of internationalization
trajectories were measured and clustered. A total of 6 different trajectories were identified for both sales
and asset internationalization, ranging from home orientation to comprehensive multinationals, and from
strong expansion strategies to de-internationalization (home re-orientation).
Using these trajectories as a benchmark, we also analysed the internationalization patterns of 31 of the
largest and most international Chinese and Indian firms, which added 96 firm-year observations on sales
internationalization and 83 firm-year observations on asset internationalization. While existing literature
would point at the strong growth, volatility and temporal (recent) clustering of expansion, the empirical
evidence that was presented in table 4 primarily emphasised the remarkably strong home-orientation of
most Chinese and Indian firms. Only a limited number of the largest and most international Chinese and
Indian firms follow the paths as predicted in the literature. For many Chinese and Indian firms,
investments abroad go hand in hand with investments at home, resulting in foreign-to-total asset and sales
ratio’s that are not (yet) particularly high for most firms.
These findings suggest several main conclusions. First of all, it is shown that while the average trend is
for firms to engage in more foreign activities, more internationalization, and hence in the end, more
‘globalization’, the exact form and pace of insertion in the world economy differs strongly across firms
and across different types of activities within firms (sales versus assets). ‘Globalization’, often presented
as a homogeneous or at least homogenizing process, has in fact many faces, and follows many different
paths. The predicted Indian and Chinese inclusion in the world economy will not necessarily be carried by
their largest firms. Since these firms have considerable influence over national policies, we can expect
that the process of ‘globalization’ will not represent a smooth trajectory of firms from India and China
emulating the strategies of their peers. It makes it also not very likely, as the BCG (2006) predicted that
(frontrunner) Indian and Chinese firms in the short-run will ‘radically transform industries and markets

31
around the world’ (BCG, 2006). This finding alone is already an important result, as it calls for
substantial nuances to the sometimes wide-sweeping statements and conclusions that are often made
regarding ‘globalization’.
Furthermore, the results call for a more nuanced discussion of the role of the home country in firm
internationalization. Evidence in this paper from China and India shows that there are indeed important
differences across firms from various home countries, but also important similarities. The disparities
between Chinese and Indian firms on the one hand, and developed country firms on the other hand, seem
to be differences of degree and not of kind. While home country regulation and institutions clearly
influence firms’ internationalization trajectories, they do not fully determine them. An interesting
question for further research would be to what extent these home country influences change over time,
resulting in convergence or divergence in firm strategy across geographical regions. The exploration of
sector patterns in internationalization trajectories in this article provided a first basis for understanding the
global dynamics in a number of sectors, interpreted as the outcome of the interaction between large
established MNEs from developed and large firms from developing countries. This dimension deserves
more research.
The implications of these for theory building of MNEs are also substantial: rather than treating Chinese
and Indian firms as an entire new species of firms that requires new theory, existing theories may be
modified and forgotten dimensions of these theories that were introduced in the 1950s and 1960s (such as
Vernon’s obsolescing bargain model applied to the home country, country-of-origin effects, Hymer’s
market power, and escape models (Cf. Witt and Lewin, 2007)) may receive new attention, not only to
explain for the internationalization of Chinese and Indian firms, but also to gain further understanding in
the internationalization of developed country MNEs.
Further research in this area is necessary however. This paper has addressed internationalization primarily
as a matter of degree, and has not dealt with the geographical scope or spread of international expansion.

32
While we choose to focus on identifying the process dimensions (trajectories) in what has become the key
measure of international expansion in IB research, the FATA and FSTS ratios, other dimensions of
internationalization are important as well and analysing trends and trajectories in such dimensions over
time would be a good way to take this point further.
More research is also necessary to check the robustness of the cluster analysis that identified the six
trajectories in our sample. While the fact that we find nearly identical clusters in both sales and asset
internationalization would be an indication of the robustness of the classification, there may be additional
trajectories of firms not in our sample. The relative lack of data for Chinese and Indian firms may have
obscured the existence of alternative trajectories for firms from these two countries.
Finally, the exact determinants of the various trajectories, and into their performance implications – for
both the firms themselves, and for the countries from which these firms originate and in which they
invest, are a key area of further study. An in-depth analysis of such determinants and performance
implications was beyond the scope of this paper, but the findings of this study form a basis for further
research on the determinants and effects of firm specific trajectories, that may have important managerial
and policy implications. For example, exploring differences in internationalization trajectories between
firms with different characteristics (for example R&D intensity, size, but perhaps also top management
team composition and international orientation) can yield information on the role of ownership or firm-
specific advantages that influence firm strategy. Furthermore, by analysing profitability differences – or
any other type of performance measure – among firms that started internationalization relatively early, we
can derive recommendations for managers that find themselves in a similar situation at present. As a final
example, an in-depth understanding of internationalization trajectories and past path dependencies could
also help predict the direction of future internationalization. All such studies would help our
understanding of the international strategies of the largest firms worldwide, and hence of the nature and
direction of globalization in general.

33
REFERENCES
Agarwal, S. and Ramaswami, S. (1992) ‘Choice of foreign market entry mode: impact ofownership, localization and internalization factors’, Journal of International BusinessStudies, 23(1):1-27.
Aulakh, P. (2007) ‘Emerging multinationals from developing economies: Motivations, paths andperformance’, Journal of International Management, vol. 13, 3: 235-240
Autio, E., Sapienza, H. and Almeida, J. (2000) ‘Effects of age at entry, knowledge intensity, andimitability on international growth’, Academy of Management Journal, 43(5): 909-924.
Bartlett, C. and Ghoshal, S. (1989) Managing Across Borders: The Transnational Solution,Boston: Harvard Business School Press.
Benito, G. and Welch, L. (1997) ‘De-internationalisation’, Management International Review, 37(special issue): 7-25.
Biswas, R. (2002) ‘Determinants of Foreign Direct Investment’, Review of DevelopmentEconomics, 6(3): 492-504.
Blonigen, B. (2005) ‘A review of the empirical literature on FDI determinants’, AtlanticEconomic Journal, 33(4): 383-404.
Boston Consulting Group (2006) The New Global Challengers. How 100 Top Companies fromRapidly Developing Economies are Changing the World, Boston: BCG Report
Brouthers, K. (2002) ‘Institutional, Cultural and Transaction Cost influences on entry modechoice and performance’, Journal of International Business Studies, 33(2): 203-222.
Buckley, P, Clegg, J. Cross, A, Liu, X, Voss, H. and Zheng.P (2007) ‘The determinants ofChinese outward foreign direct investment’, Journal of International Business Studies,38, 499-518
Busija, E., O’Neill, H. and Zeithaml, C. (1997) ‘Diversification Strategy, Entry Mode, andPerformance: Evidence of Choice and Constraints’, Strategic Management Journal,18(4): 321-328.
Chang, S. (1995) ‘International Expansion Strategy of Japanese Firms: Capability BuildingThrough Sequential Entry’, Academy of Management Journal, 38(2): 383-407.
Child, J. and Rodrigues, S. (2005) ‘the internationalization of Chinese firms: a case fortheoretical extension?’Management and Organization Review 1(3): 381-410
Chittoor, R. and Ray, S. (2007) ‘Internationalization paths of Indian pharmaceutical firms – astrategic group analysis’, Journal of International Management, 13, 338-355
Contractor, F., Kundu, S. and Hsu, C-C. (2003) ‘A three-stage theory of international expansion:the link between multinationality and performance in the service sector’, Journal ofInternational Business Studies, 34(1): 5-18.
Dunning, J.H. (1988) ‘The eclectic paradigm of international production: a restatement and somepossible extentions’, Journal of International Business Studies, 19(1): 1-31.
Dunning, J.H. (2000) The eclectic paradigm of international production: Past, Present andFuture, International Journal of the economics of business. Vol 9(2):163-190
Dunning, J.H. (2001) The eclectic paradigm as an envelope for economic and business. theories ofMNE activity, International Business Review, 9: 163-190.
Dunning, J. Kim, C. and Park, D. (2008) ‘Old wine in new bottles: a comparison of emerging-market TNCS today and developed-country TNCS thirty year ago’, in: Sauvant (ed) (2008)158-180

34
Elango, B. and Pattnaik, C. (2007) ‘Building capabilities for international operations throughnetworks: a study of Indian firms’,Journal of International Business Studies, 38(4):541-555.
Fletcher, Richard (2001) A holistic approach to internationalization. International BusinessReview,10(1): 25-49.
Garg, M. and Delios, A. (2007) “Survival of the foreign subsidiaries of TMNCs: The influenceof business group affiliation’, Journal of International Management, 23, 3:278-295
Geringer, J.M., Beamish, P.W. and DaCosta, R.C. (1989) ‘Diversification strategy andinternationalization: implications for MNE performance’, Strategic Management Journal,10(2): 9-119.
Ghemawat, P. (2001) ‘Distance still matters: The hard reality of global expansion’, HarvardBusiness Review, September: 137-147.
Gomes, L.K. and Ramaswamy, K. (1999) ‘An empirical examination of the form of therelationship between multinationality and performance’, Journal of International BusinessStudies, 30(1): 173-188.
Hitt, M., Hoskisson, R. and Kim, H. (1997) ‘International diversification: effects on innovationand firm performance in product-diversified firms’, Academy of Management Journal, 40:767-798.
Hitt, M., Tihanyi, L. Miller, T. and Connelly, B. (2006) ‘International diversification:Antecedents, Outcomes and Moderators’, Journal of Management, 32(6): 831-867.
Ietto-Gilles, G. (1998) ‘Different conceptual frameworks in the assessment of the degree ofinternationalization: empirical analysis of various indices for the top 100 TNCs’TransnationalCorporations 7(1):17-40.
Johanson, J. and Vahlne, J.-E. (1977) ‘The internationalisation process of the firm – a model of knowledgedevelopment and increasing foreign market commitments’, Journal of International Business Studies,8(1):23-32.
Johanson, J. and Wiedersheim-Paul, F. (1975) ‘The internationalisation of the firm – fourSwedish cases’, Journal of Management Studies, 12(3): 305-22.
Jones, G and Khanna, T. (2006) ‘Bringing History (back) into International Business’, Journal ofInternational Business Studies, 37 (4): 453-468
Kim, W.C., Hwang, P. and Burgers, W. (1989) ‘Global diversification strategy and corporateprofit performance’, Strategic management journal, 10(1): 45-57.
Kogut, B. and Singh, H. (1988) ‘The effect of national culture on the choice of entry mode’,Journal of International Business Studies, 19(3): 411-432.
Kwon, J., Wirtz, J., Tan, S. and Kau, A. (1999) ‘The Seven Faces of Singaporeans: a Typologyof Singapore consumers and their aspirations and life satisfaction’, Asia PacificManagement Journal, 16(2): 229-248.
Lall, S. (1983). The New Multinationals : the Spread of Third World Enterprises. Chichester,John Wiley.
Lecraw, D. (1977) ‘Direct investment by firms from less developed countries’, Oxford EconomicPapers, 29, 3\; 442-457
Lecraw, D. (1993) “Outward Direct investment by Indonesian firms: motivations and effects”,Journal of International Business Studies, 24, 3: 589-600
Li, P. (2007) ‘Towards an integrated theory of multinational evolution: the evidence of Chinesemultinational enterprises as latecomers’, Journal of International Management, 13, 296-318

35
Loree, D.W. and Guisinger, S. (1995) ‘Policy and non-policy determinants of US equity foreigndirect investment’, Journal of International Business Studies, 26(2): 281-299.
Loungani, P. Mody, A. and Razin, A. (2002) ‘What Drives FDI? The Role of Gravity and OtherForces’, Paper presented at the ‘mini-conference on FDI: theory and evidence’, SapirCenter for development, May 11.
Lu, J. and Beamish, P. (2004) ‘International diversification and firm performance: the S-curvehypothesis’, Academy of Management Journal, 47: 598-609
Luo, Y and R. Tung (2007) ‘ International expansion of emerging market enterprises: aspringboard perspective’, Journal of International Business Studies (2007) 38,481-498
Maitland, E., Rose, E., and Nicholas, S. (2005) ‘How firms grow: clustering as a dynamic modelof internationalization’, Journal of International Business Studies, 36: 435-541.
Makino, S. and Neupert, K. (2000) ‘National Culture, Transaction Costs, and the Choicebetweeen Joint ventures and Wholly-owned subsidary’, Journal of International BusinessStudies, 31(4): 705-713.
Mathews, J. (2002) Dragon Multinationals, Oxford: Oxford University PressMerrilees, B. and Bentley, R. (1999) ‘Business service market segmentation: the case of
electrical and mechanical building maintenance’, Journal of Business and IndustrialMarketing, 14(2): 151-161.
Nunnenkamp, P. and Spatz, J. (2002) ‘Determinants of FDI in Developing Countries: HasGlobalization Changed the Rules of the Game?’, Transnational Corporations, 11(2): 1–34.
OECD (2006) Summary Experts’ meeting organized by the OECD Development Centre:“Emerging Multinationals: who are they? What do they do? What is at stake?, Paris, 27March
Pan, Y., Li, S. and Tse, D. (1999) ‘The impact of order and mode of market entry on profitabilityand market share’, Journal of International Business Studies, 30(1): 81-103.
Peng, M. and Delios, A. (2006) ‘What determines the scope of the firm over time and around theworld? An Asia Pacific perspective’, Asia Pacific Journal of Management, 33(4): 385-406.
Penrose, E. (1959) The Theory of the Growth of the Firm, Oxford: Basil BlackwellPorter, M.E. (1998) Michael Porter on competition, Boston: Harvard Business School Press.Ramaswamy, K., Kroeck, K. and Renforth, W. (1996) ‘Measuring the Degree of
internationalization of a firm: a comment’, Journal of international Business Studies, 27(1):167-177
Rugman. A. and Verbeke, A. (2004) ‘A perspective on regional and global strategies ofmultinational enterprises’, Journal of International Business Studies, 35(1): 3-18.
Rui and Yip, 2007 (working paper; see this special issue)Ruigrok, W. and Wagner, H. (2003) ‘Internationalization and performance: an organizational
learning perspective’, Management International Review, 43: 63-83.Sauvant, K. (ed) (2008) The Rise of Transnational Corporations from Emerging Markets: Threat
or Opportunity? Cheltenham: Edward ElgarSiripaisalpipat, P. and Hoshino, Y. (2000) ‘Firm-specific advantages, entry modes and
perforamnce of Japanese FDI in Thailand’, Japan and the World Economy, 12:33-48Slangen, A. (2006) ‘National Cultural Distance and Initial foreing acquisition performance: the
moderating effect of integration’, Journal of World Business, 41(2): 161-170.Sullivan, D. (1994) ‘Measuring the degree of internationalization of a firm’, Journal of
International Business Studies, 24: 325-342.

36
Sullivan, D. (1996) ‘Measuring the Degree of internationalization of a firm: a reply’, Journal ofinternational Business Studies, 27(1): 179-192.
Tihanyi, L., Ellstrond, A., Daily, C. and Dalton, D. (2000) ‘Composition of the top managementteam and firm international diversification’, Journal of Management, 26(6): 1157-1178.
UNCTAD (2006) World Investment Report 2006: FDI from developing and TransitionEconomies- Implications for Development, Geneva: UNCTAD
UNCTAD (2007) World Investment Report, Geneva: UNCTADVan Tulder, R. with Van der Zwart, A. (2006) International Business-Society Management,
London: Routledge.Vermeulen, F. and Barkema, H.(2002) ‘Pace, Rhythm, and Scope: Process Dependence in
Building a Profitable Multinational Corporation’, Strategic Management Journal, 23(7):637-654.
Vernon, R. (1999) ‘The Harvard Multinational Enteprise Project in Historical Perspective’,Transnational Corporations, 8 ()2): 35-50
Wells, L. T. (1983). Third World Multinationals: The Rise of Foreign Investment fromDeveloping Countries. Cambridge, Mass., MIT Press.
Wells, L.T. (1977) ‘The internationalization of firms from developing countries’, in: Agmon, T.and Kindleberger, C. (eds) Multinationals from small countries, Cambridge, MA: MITPress
Witt, M. and Lewin, A. (2007) ‘Outward foreign direct investment as escape response to homecountry institutional constraints’, Journal of International Business Studies, 38(4): 579-594.
Woodcock, C., Beamish, P. and Makino, S. (1994) ‘Ownership-based entry mode strategies andinternational performance’, Journal of international business studies, 25(2): 253-273.
Wortzel, H.V. and L.H. Wortzel (1988), “Globalizing strategies for multinationals fromdeveloping countries”, Columbia Journal of World Business, 23(spring): 27-35.
Xu, D. and Shenkar, O. (2002) ‘Institutional distance and the multinational enterprise’, Academyof Management Review, 27: 608-618.
Yiu, D., Lau, C. and Bruton, G. (2007) ‘International Venturing by emerging economy firms: theeffects of firm capabilities, home country networks, and corporate entrepreneurschip’,Journal of International Business Studies, 38(4):
Zaheer S. (1995) ‘Overcoming the liability of foreignness’, Academy of Management Journal,38: 341-363.
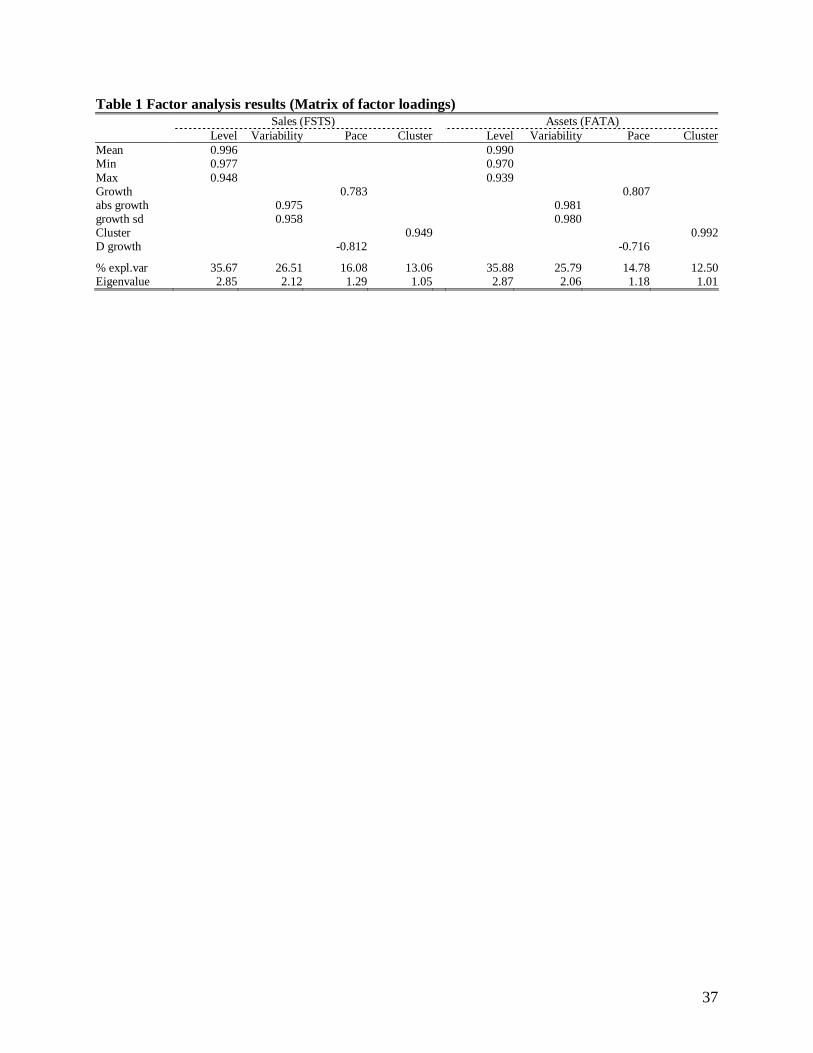
37
Table 1 Factor analysis results (Matrix of factor loadings)Sales (FSTS) Assets (FATA)
Level Variability Pace Cluster Level Variability Pace ClusterMean 0.996 0.990Min 0.977 0.970Max 0.948 0.939Growth 0.783 0.807abs growth 0.975 0.981growth sd 0.958 0.980Cluster 0.949 0.992D growth -0.812 -0.716
% expl.var 35.67 26.51 16.08 13.06 35.88 25.79 14.78 12.50Eigenvalue 2.85 2.12 1.29 1.05 2.87 2.06 1.18 1.01

38
Table 2 Cluster analysis results: the internationalization of salesHome-oriented Strong
expansionHome-
reorientation Clustered Stable-volatile Compre-hensive
Level -1.000 -.258 .469 -.006 .008 .983Variability -.478 .727 .268 -.311 2.560 -.391Pace -.227 1.459 -1.958 .116 -.583 .093Cluster -.464 -.085 .479 1.359 -.295 -.571
N 60 32 18 45 15 61
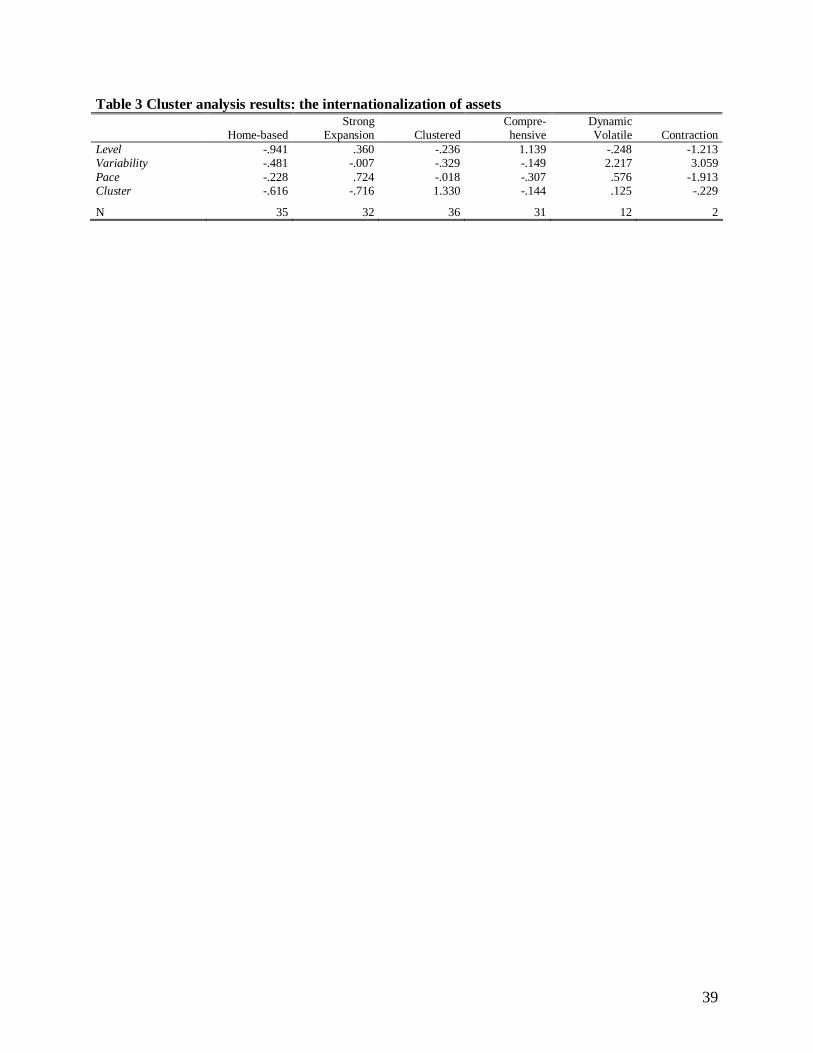
39
Table 3 Cluster analysis results: the internationalization of assets
Home-basedStrong
Expansion ClusteredCompre-hensive
DynamicVolatile Contraction
Level -.941 .360 -.236 1.139 -.248 -1.213Variability -.481 -.007 -.329 -.149 2.217 3.059Pace -.228 .724 -.018 -.307 .576 -1.913Cluster -.616 -.716 1.330 -.144 .125 -.229
N 35 32 36 31 12 2

40
Table 4 Internationalization Trajectories of Chinese and Indian firmsPercentage of foreign to total assets or salesSales
(2005) 2005 2004 2003 2002 2001 2000 1997 1996 TrajectoryChina (16) Sinopec 98,784 FATA <5 .. .. .. .. .. .. .. Home based
FSTS <5 .. .. .. .. .. .. .. Home oriented Stategrid 86,984 FATA <5 .. .. .. .. .. .. .. Home based
FSTS <5 .. .. .. .. .. .. .. Home oriented China National Petroleum Co. 83,556 FATA 3.0 3.7 4.2 <5 .. .. .. .. Home based
FSTS 7.6 7.6 9.1 <5 .. .. .. .. Home oriented China Mobile Comm.* 28,778 FATA <5 .. .. .. .. .. .. .. Home based
FSTS <5 .. .. .. .. .. .. .. Home oriented China Southern Power Grid 23,105 FATA <5 .. .. .. .. .. .. .. Home based
FSTS <5 .. .. .. .. .. .. .. Home oriented Sinochem* 22,646 FATA 57.6 54.1 .. 56.6 55.4 .. .. .. Comprehensive
FSTS 82.6 66.9 .. 56.6 59.6 .. .. .. Strong expansion China Telecommunications 22,537 FATA <5 .. .. .. .. .. .. .. Home based
FSTS <5 .. .. .. .. .. .. .. Home oriented Baosteel 21,501 FATA <5 .. .. .. .. .. .. .. Home based
FSTS .. .. .. .. .. .. .. .. .. China Ocean Shipping 15,229 FATA 58.9 60.2 47.0 .. .. .. .. .. Strong expanson
FSTS 55.6 42.7 66.3 .. .. .. .. .. Volatile China MinMetals* 14,540 FATA 16.4 23.6 21.5 .. .. 27.2 .. .. Volatile
FSTS 17.3 18.8 .. .. 59.2 .. .. Volatile China State Construc. Eng. 14,338 FATA 42.6 39.1 35.3 .. .. .. 51.6 49.0 Strong expansion
FSTS 23.6 22.4 29.7 .. .. .. 28.2 31.3 Home reorientation Lenovo Group* 13,357 FATA 62.1 <5 .. .. .. .. .. .. Strong expansion
FSTS 63.3 <5 .. .. .. .. .. .. Strong expansion CNOOC* 8,606 FATA 19.1 12.3 10.1 17.1 .. .. .. .. Home oriented
FSTS 43.9 34.9 28.8 13.6 .. .. .. .. Strong expansion CITIC group 8,042 FATA 15.0 17.1 .. .. .. .. .. .. Home reorientation
FSTS 26.2 27.2 .. .. .. .. .. .. Home reorientation TCL* 6,402 FATA 57.8 72.3 .. .. .. .. .. .. Home reorientation
FSTS 66.9 49.4 .. .. .. .. .. .. Strong expansion Cofco 2,179 FATA 98.0 83.3 .. .. .. .. .. .. Strong expansion
FSTS 92.0 93.2 .. .. .. .. .. .. ComprehensiveIndia (15) Indian Oil 36,537 FATA <5 <5 .. .. .. .. .. .. Home based
FSTS 5.4 3.9 .. .. .. .. .. .. Home oriented Tata group ~22,000 FATA .. .. <5 .. .. .. .. .. Home based
FSTS ~30 .. ~20 .. .. .. .. .. Strong expansion Reliance Industries* 18,773 FATA 5.0 3.6 1.7 2.1 2.3 <5 .. Home based
FSTS 36.5 33.7 21.8 21.7 23.6 ~10 ~8 .. Strong expansion Bharat Petroleum 17,613 FATA <5 .. .. .. .. .. .. .. Home based
FSTS <5 .. .. .. .. .. .. .. Home oriented Hindustan Petroleum 17,106 FATA <5 .. .. .. .. .. .. .. Home based
FSTS 4.5 4.1 .. .. .. .. .. .. Home oriented Oil and Natural Gas Corp.* 16,609 FATA 26.4 21.6 15.3 .. .. .. .. .. Strong expansion
FSTS 9.7 8.7 6.9 .. .. .. .. .. Home oriented NTPC 7,893 FATA <5^ Home based
FSTS <5 Home oriented Steel Authority of India/SAIL 7,881 FATA <10 <10 <10 0 0 0 0 0 Home based
FSTS 3.3 4.2 1.3 1.8 2,6 .. .. .. Home oriented Tata Steel * 5,829 FATA 2 5 0.5 0 0 0 .. .. Home based
FSTS 13 15.0 15.7 15.3 9.6 <5 .. .. Volatile Bharti Airtel 4,262 FATA 2.8 1.6 1.7 1.7 Home based
FSTS 9.1 9.4 9.7 8.8 Home oriented Sterlite Industries 5,643 FATA 2.1 Home based
FSTS 43.9 33.7 26.0 .. .. .. .. .. Strong expansion Bharat Heavy Electricals 3.196 FATA 2.1 4.5 1.9 2.3 0.1 Home based
FSTS 4.8 7.6 5.3 5.9 13.0 Volatile Infosys* ~3,100 FATA .. .. .. .. .. .. .. .. ..
FSTS 98.1 98.1 98.6 97.8 98.0 95.7 .. .. Comprehensive Wipro* 3.471 FATA .. .. ..
FSTS 79.5 76.2 74.8 71.8 67.1 59.8 30.6 .. Strong expansion Dr. Reddy’s Laboratories* 1.500 FATA 23 4.8 5.3 5.3 2 1.4 0.7^ Late expansion
FSTS 66 65.6 64 65 63 49 44.3^ ComprehensiveSources: Sales data are in US$, from Fortune, annual reports and UNCTAD. “..” indicates missing information.

41
FATA and FSTS data from UNCTAD or company annual reports. FATA and FSTS data preceded by ~ or < are author estimates based onqualitative information/statements on internationalization in annual reports.* Company is included in the BCG list of 100 ‘new global challengers’.
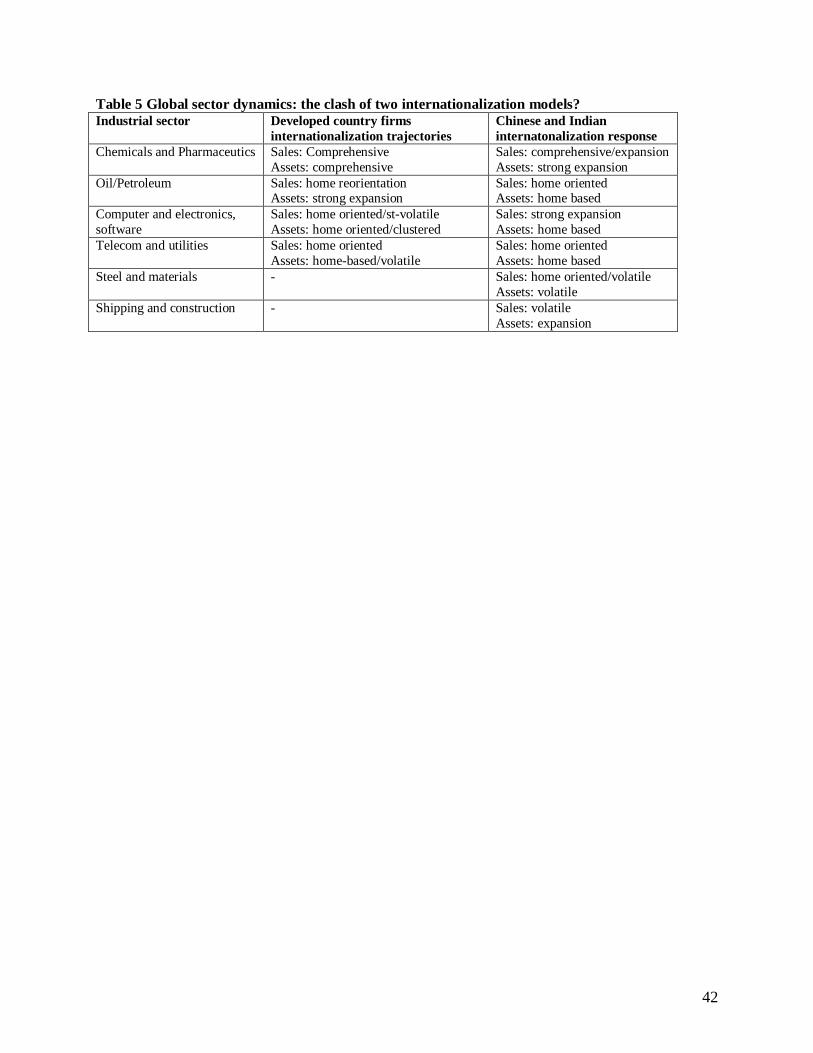
42
Table 5 Global sector dynamics: the clash of two internationalization models?Industrial sector Developed country firms
internationalization trajectoriesChinese and Indianinternatonalization response
Chemicals and Pharmaceutics Sales: ComprehensiveAssets: comprehensive
Sales: comprehensive/expansionAssets: strong expansion
Oil/Petroleum Sales: home reorientationAssets: strong expansion
Sales: home orientedAssets: home based
Computer and electronics,software
Sales: home oriented/st-volatileAssets: home oriented/clustered
Sales: strong expansionAssets: home based
Telecom and utilities Sales: home orientedAssets: home-based/volatile
Sales: home orientedAssets: home based
Steel and materials - Sales: home oriented/volatileAssets: volatile
Shipping and construction - Sales: volatileAssets: expansion

43
Figure 1 Examples of FSTS Internationalization trajectories
0%
10%
20%
30%
40%
50%
60%
70%
80%
90%
1990 1991 1992 1993 1994 1995 1996 1997 1998 1999 2000 2001 2002 2003 2004
Home-oriented(Safeway)
Strong expansion(France Telecom)
Home-reorientation(BAT)
Clustered(Otto Versand)
Stable-volatile(ThyssenKrupp)
Comprehensive(Dow Chemical)

44
The UNU-MERIT WORKING Paper Series
2008-01 Science, Technology and Development: Emerging concepts and visions by Luc Soete
2008-02 Reframing technical change: Livestock Fodder Scarcity Revisited as Innovation CapacityScarcity. Part 1. A Review of Historical and Recent Experiences by Andy Hall, RasheedSulaiman V., Mona Dhamankar, Peter Bezkorowajnyj & Leela Prasad
2008-03 Reframing technical change: Livestock Fodder Scarcity Revisited as Innovation CapacityScarcity. Part 2. A Framework for Analysis by Andy Hall, Rasheed Sulaiman, V. and PeterBezkorowajnyj
2008-04 Reframing technical change: Livestock Fodder Scarcity Revisited as Innovation CapacityScarcity.Part 3. Tools for Diagnosis and Institutional Change in Innovation Systems by AndyHall, Rasheed Sulaiman and Peter Bezkorowajnyj
2008-05 Is Inter-Firm Labor Mobility a Channel of Knowledge Spillovers? Evidence from a LinkedEmployer-Employee Panel by Mika Maliranta, Pierre Mohnen & Petri Rouvinen
2008-06 Financial Constraints and Other Obstacles:Are they a Threat to Innovation Activity? By P.Mohnen, F.C. Palm, S. Schim van der Loeff and A. Tiwari
2008-07 Knowledge-based productivity in ‘low-tech’ industries: evidence from firms in developingcountries by Micheline Goedhuys, Norbert Janz and Pierre Mohnen
2008-08 The Voyage of the Beagle in Innovation Systems Land.Explorations on Sectors, Innovation,Heterogeneity and Selection by Martin Srholec & Bart Verspagen
2008-09 Crafting Firm Competencies to Improve Innovative Performance by Boris Lokshin, Anita vanGils & Eva Bauer
2008-10 The Economics and Psychology of Personality Traits by Lex Borghans, Angela Lee Duckworth,James J. Heckman & Bas ter Weel
2008-11 Embedding Research in Society: Development Assistance Options for Supporting AgriculturalInnovation in a Global Knowledge Economy by Andy Hall
2008-12 Playing in Invisible Markets: Innovations in the Market for Toilets to Harness the EconomicPower of the Poor by Shyama V. Ramani
2008-13 Explaining Success and Failure in Development by Adam Szirmai
2008-14 Running The Marathon by William Cowan, Robin Cowan and Patrick Llerena
2008-15 Productivity effects of innovation, stress and social relations by Rifka Weehuizen, BulatSanditov and Robin Cowan
2008-16 Entrepreneurship and Innovation Strategies in ICT SMEs in Enlarged Europe (EU25) byKaushalesh Lal and Theo Dunnewijk

45
2008-17 Knowledge Transfers between Canadian Business Enterprises and Universities: Does DistanceMatter? By Julio M. Rosa & Pierre Mohnen
2008-18 Multinationals are Multicultural Units: Some Indications from a Cross-Cultural Study byNantawan Noi Kwanjai & J. Friso den Hertog
2008-19 The Innovativeness of Foreign Firms in China by Branka Urem, Ludovico Alcorta andTongliang An
2008-20 Beyond the emission market: Kyoto and the international expansion of waste management firmsby Ionara Costa, Asel Doranova and Geert-Jan Eenhoorn
2008-21 The ‘making of’ national giants: technology and governments shaping the internationalexpansion of oil companies from Brazil and China by Flavia Carvalho and Andrea Goldstein
2008-22 If the Alliance Fits . . . : Innovation and Network Dynamics by Robin Cowan & Nicolas Jonard
2008-23 Facing the Trial of Internationalizing Clinical Trials to Developing Countries: With SomeEvidence from Mexico by Fernando Santiago-Rodriguez
2008-24 Serving low-income markets: Rethinking Multinational Corporations’ Strategies by ShuanSadreGhazi and Geert Duysters
2008-25 A percolation model of eco-innovation diffusion: the relationship between diffusion, learningeconomies and subsidies by Simona Cantono and Gerald Silverberg
2008-26 New Europe’s Promise for Life Sciences by Sergey Filippov and Kálmán Kalotay
2008-27 A closer look at the relationship between life expectancy and economic growth by Théophile T.Azomahou, Raouf Boucekkine, Bity Diene
2008-28 Regional Capital Inputs in Chinese Industry and Manufacturing, 1978-2003 by Lili Wang &Adam Szirmai
2008-29 Worker remittances and government behaviour in the receiving countries by Thomas Ziesemer
2008-30 Strategic motivations for Sino-Western alliances: a comparative analysis of Chinese andWestern alliance formation drivers by Tina Saebi & Qinqin Dong
2008-31 Changing Configuration of Alternative Energy Systems by Radhika Bhuyan and Lynn Mytelka
2008-32 Promoting clean technologies: The energy market structure crucially matters by Théophile T.Azomahou, Raouf Boucekkine, Phu Nguyen-Van
2008-33 Local Knowledge Spillovers, Innovation and Economic Performance in Developing Countries:A discussion of alternative specifications by Effie Kesidou and Adam Szirmai
2008-34 Wage effects of R&D tax incentives: Evidence from the Netherlands by Boris Lokshin and PierreMohnen
46
2008-35 Cross-border Investment and Economic Integration: The Case of Guangdong Province andHong Kong SAR by Naubahar Shari and Can Huang
2008-36 Radical versus non-radical inventions by Wilfred Schoenmakers, Geert Duysters & WimVanhaverbeke
2008-37 Localized Innovation, Localized Diffusion and the Environment: An Analysis of CO2 EmissionReductions by Passenger Cars, 2000-2007 by Bart Los and Bart Verspagen
2008-38 The economic impact of AIDS in sub-Saharan Africa by Théophile T. Azomahou, RaoufBoucekkine, Bity Diene
2008-39 Further results on bias in dynamic unbalanced panel data models with an application to firmR&D investment by Boris Lokshin
2008-40 A multilevel analysis of innovation in developing countries by Martin Srholec
2008-41 Experimentation with strategy and the evolution of dynamic capability in the IndianPharmaceutical Sector by Suma Athreye, Dinar Kale & Shyama V. Ramani
2008-42 The Impact of Social Capital on Crime: Evidence from the Netherlands by I.Semih Akcomakand Bas ter Weel
2008-43 Portrait of an Odd-Eyed Cat: Cultural Crossing as a Trademark for a Dutch-Thai StrategicAlliance by Nantawan Noi Kwanjai & J Friso den Hertog
2008-44 The challenge of measuring innovation in emerging economies’ firms: a proposal of a new setof indicators on innovation by Luciana Manhães Marins
2008-45 Intra-firm Technology Transfer and R&D in Foreign Affiliates: Substitutes or Complements?Evidence from Japanese Multinational Firms by Rene Belderbos, Banri Ito, Ryuhei Wakasugi
2008-46 To Be or Not to Be at the BOP: A One-North-Many-Souths Model with Subsistence and LuxuryGoods by Adriaan van Zon and Tobias Schmidt
2008-47 Habit Formation, Information Exchange and the Social Geography of Demand by ZakariaBabutsidze and Robin Cowan
2008-48 Agenda Disputes and Strategic Venue Preferences: The Doha Crisis and Europe’s Flight toRegionalism by Francisco P. Toro
2008-49 The determinants of the outward foreign direct investment of China and India: Whither thehome country? by Paz Estrella Tolentino
2008-50 Comparing Chinese and the Indian Software MNCs: Domestic and Export Market Strategiesand their Interplay by Jorge Niosi and F. Ted Tschang
2008-51 Internationalising to create Firm Specific Advantages: Leapfrogging strategies of U.S.Pharmaceutical firms in the 1930s and 1940s & Indian Pharmaceutical firms in the 1990s and2000s by Suma Athreye and Andrew Godley

47
2008-52 Internationalization and Technological Catching Up of Emerging Multinationals: A Case Studyof China’s Haier Group by Geert Duysters, Jojo Jacob and Charmianne Lemmens
2008-53 India’s Outward Foreign Direct Investments in Steel Industry in a Chinese ComparativePerspective by Nagesh Kumar and Alka Chadha
2008-54 Internationalization Trajectories – a cross country comparison: Are Large Chinese and IndianCompanies different? By Fabienne Fortanier and Rob van Tulder