Embed Size (px)
Citation preview

Frequency Response
Technical Sub Group
15 November 2011
Version 1.0
Page 1
Frequency Response Technical Sub-Group Report
This report provides a technical assessment and recommendations relating to the management of frequency response and synthetic inertia
This document contains the findings of the Technical Sub Group which formed on 15 November 2010 and concluded on 7 November 2011. Published on: 15 November 2011
The Technical Sub Group recommends: A Faster Frequency Response capability should be considered and that clearer Primary Response Requirements should be developed.
High Impact: Frequency Response Providers
Medium Impact:
Low Impact:
What stage is this document at?
Stage 01: Working Group Report Grid Code and BSSG
01 Working Group Report
02 Industry Consultation
03 Report to the Authority

Frequency Response
Technical Sub Group
15 November 2011
Version 1.0
Page 2
Contents 1 Executive Summary............................................................................ 3 2 Background......................................................................................... 5 3 Purpose & Scope of the Working Group .......................................... 6 4 Working Group Discussions ............................................................. 7 5 Working Group Recommendations................................................. 28
About this document This document contains the discussions and findings of a Technical Sub Group that has been tasked to investigate an issue within the Grid Code and the Connection and Use of System Code (CUSC). The Technical Sub Group was established by the Frequency Response Working Group, which is a joint group under the Grid Code Review Panel and Balancing Services Standing Group. This report outlines the background to the issue, how to address it, any impacts it may have on the industry and recommendations for the Frequency Response Working Group to consider prior to concluding its own work. The Working Group’s conclusions may include the drafting of Industry Consultations in order to modify industry codes which would then be considered by the Grid Code and CUSC Panels. The Frequency Response Working Group, based on the Technical Sub Group Report, will determine if any further work or debate is required. If this Working Group feels that the issue has already been investigated thoroughly and a robust solution has been developed, the Modification Proposal may agree for the recommendations to progress to the GCRP or CUSC Panels in order to approve Industry Consultation phases.
Any Questions? Contact: Tom Ireland Code Administrator
+ (44)1926 656152 Proposer: Graham Stein National Grid

Frequency Response
Technical Sub Group
15 November 2011
Version 1.0
Page 3
1 Executive Summary
1.1 In September 2010, National Grid presented paper PP01/21 to the Grid Code Review Panel (GCRP) entitled “Future Frequency Response Services”. This paper summarised the issues associated with meeting the requirements for frequency response arising from significant changes to the generation background. These changes include:
• Substantial increases in Renewable Generation; • Installed Wind Generation capacity potentially exceeding minimum
demand; • Substantial changes in non renewable generation including (new
Nuclear, Supercritical Coal and Gas); and • A change to the security and Quality of Supply Standard (SQSS)
resulting in an increase to the infrequent infeed loss to 1,800MW from 2014.
1.2 In response to these issues National Grid recommended the establishment of a working group to:
• Determine the technical need for frequency response services including a review of the minimum primary frequency response requirements;
• Work with manufacturers on the development of a synthetic inertia requirement or equivalent; and
• Advise the Distribution Code Review Panel of the issues associated with the rate of Change of Frequency and the implications for Embedded Generation.
1.3 To assess these issues, a Frequency Response Technical Sub Group was established in November 2010. The aim of which was to complement and extend the technical work initiated by the Balancing Services Standing Group (BSSG) and Frequency Response Working Group (a joint BSSG and GCRP working group), and in particular investigate issues such as the ability of variable speed wind turbines to contribute to system inertia against a likely future generation background.
1.4 Representatives of wind turbine manufacturers have attended the Frequency Response Technical Sub Group meetings. National Grid have also held individual meetings with a number of manufacturers to further understand their ability to develop a synthetic inertia requirement in addition to other alternatives such as the provision of a fast Primary Response capability.
1.5 In order to quantify the future frequency response requirements, National Grid has evaluated requirements by using the Gone Green Scenario to develop a set of generation backgrounds at demand levels between 20GW and 65GW in 5GW intervals. Each scenario considers a High, Average and Low Wind condition and has been studied using Digsilent Power Factory in order to ensure that following the largest loss (1,800MW) and indeed the infrequent loss of 1,320MW, frequency limits as defined in the SQSS from 1st April 2014 onwards can be satisfied.
1.6 The following conclusions and recommendations have been drawn from this work:
• With a large penetration of wind generation, management of system frequency within SQSS limits can only be achieved if variable speed wind turbines and other decoupled generating plant such as HVDC schemes are equipped either with a synthetic inertia capability or a fast Primary Response capability where the full primary frequency response is delivered in less than 10 seconds;

Frequency Response
Technical Sub Group
15 November 2011
Page 4
• Frequency Response requirements, and hence the volume of curtailment, can be significantly reduced if generation can provide faster frequency response;
• In view of the research undertaken, it is recommended that the Fast Frequency Response Capability is developed as it is less challenging to implement than the alternatives, reduces the risk of further power reductions from wind turbines in the recovery period and avoids complications with df/dt sampling; and
• There is a need to clarify current Primary Response requirements to encompass delivery delay times and ramp rates to provide some assurance that frequency containment is achievable.
.

Frequency Response
Technical Sub Group
15 November 2011
Version 1.0
Page 5
2 Background
2.1 A major element of this study work is to establish the effect on System Frequency of the increasing volume of variable speed wind turbines and HVDC Convertor technology. Whilst these issues are now well known, and set out in Appendix A of Reference [1], it is worth briefly summarising the potential concerns.
2.2 Conventional synchronous generation which currently contributes to the majority of the Transmission System load is sensitive to changes in system frequency. In the event of the loss of a generating unit, the remaining synchronous plant will supply an injection of active power into the network through the stored energy in the rotating masses. This natural phenomena greatly assists in limiting the rate of change of system frequency.
2.3 Unfortunately variable speed wind turbines or other static devices which utilise power electronic converters such as HVDC converters are insensitive to frequency changes and therefore do not behave in the same way as synchronous machines resulting in a diminution in the system frequency. This issue is illustrated in Figure 1 below.
2.4 As can be seen in the red curve of Figure 1, for the same generation loss it is not possible to maintain the System Frequency above 49.2Hz when a high volume of asynchronous generation is connected to the system and unable to contribute to system inertia. This results from the lack of Active Power (shown by the red line) injected from the asynchronous generation as shown in the lower graph.
Figure 1: The effect of reduced system inertia on the management of a large infeed loss

Frequency Response
Technical Sub Group
15 November 2011
Version 1.0
Page 6
3 Purpose & Scope of the Working Group
Grid Code Frequency Response Technical Sub Group
Terms of Reference – dated November 2010
It was agreed at the 14th Frequency Response Working Group meeting to establish a Technical Sub Group. The Technical Sub Group would be tasked with assessing the volume of frequency response and inertial requirement for the transmission network. Objectives The Technical Sub Group will:
I. To determine the total volume of Transmission System Frequency Response and
Synthetic Inertial requirements II. Consider a largest secured loss of both 1320MW and 1800MW for the scenarios
described in I) above III. The initial assumption is that obligations are mandatory and equal. IV. Final proposals will be for the end of February 2011 (this will allow the Working
Group to report to the September 2011 meeting) V. Three meetings are anticipated
VI. Membership will be invited from relevant manufacturers, National Grid, Generators and a representative will be requested from the DCRP
VII. A technical report will be delivered with the findings and a summary of discussions. Deliverables and timescales The Technical Sub Group will produce a technical report outlining its analysis, findings and recommendations which will be submitted to the Working Group by the end of February 2011.

Frequency Response
Technical Sub Group
15 November 2011
Version 1.0
Page 7
4 Working Group Discussions
4.1 Initial Discussion
4.1.1 The Working Group discussions focussed on two approaches to managing large frequency deviations on systems where a lack of 'natural' inertia meant that the system frequency may not be contained within satisfactorily limits.
4.1.2 The first approach considered was to investigate the option of equipping variable speed wind turbines and other asynchronous sources with a synthetic inertia capability. This capability has the potential to improve frequency control without needing to curtail the power output of the wind turbine generating units prefault. This option was investigated at length and detailed discussions where held with a number of the major wind turbine manufacturers.
4.1.3 A number of manufacturers have indicated an ability to provide a synthetic inertia capability and have published papers and information on their capabilities - see references [1] – [4] in Appendix A. These controllers aim to inject power to the network in a similar way to that of a synchronous machine, but through controlled action.
4.1.4 As part of a control strategy it is important to ensure sufficient active power is injected into the network, to balance the loss of generation. Clearly too much active power injected into the network could potentially result in temporary over frequencies occurring before governor action provides adequate downward regulation. For example for a loss of generation of less than 300MW, only a small amount of active power would be required where as a larger injection would be required for the maximum loss of 1,800MW.
4.1.5 A good measure of the required level of active power injection can be obtained from a measure of the rate of change of system frequency (df/dt) (ie the smaller the value of df/dt the lower the initial injection of active power required).
4.1.6 National Grid modelled two controllers both using df/dt functionality. One was based on an initial injection and fixed decay based on the rate of change of system frequency. The second was based on a continuously acting df/dt controller which would operate throughout the entire disturbance, and in doing so regulating the active power injection to the network continuously. Based on the results, both controllers were able to inject sufficient active power to the network to ensure the maintenance of system frequency above SQSS limits. These are described in more detail in Appendix A.
4.1.7 Whilst system studies confirmed that both controllers could be used as a basis to resolve the issue of retaining frequency standards, further discussion identified two critical issues. These being:
• df/dt controllers are noise amplifying and can, even with appropriate filtering, fail to operate in the appropriate manner, particularly where small time constants are involved; and
• The recovery period for wind turbines operating at just below rated wind speed can result in substantial reductions in their active power output, resulting in a system frequency collapse some 10 to 15 seconds after the initial generation loss.
4.1.8 With regard to the df/dt issue, National Grid held extensive discussions with manufactures to examine the df/dt controller and how it could be improved. National Grid amended their own models and identified that even with slower response times the controller could still aid frequency containment.

Frequency Response
Technical Sub Group
15 November 2011
Page 8
4.1.9 It was also suggested that the controller should not only rely on a df/dt input but should also incorporate a frequency trigger. Consideration was also given to a simple 'one-shot' control which would deliver a fixed volume of energy with a defined ramp and decay period when frequency reached a pre-defined setting.
4.1.10 The simple 'one-shot' control would not have the control complexities of a df/dt trigger but would not adapt to a specific frequency event after the initial frequency disturbance, potentially resulting in an uncontrolled response.
4.1.11 With regard to recovery periods, concerns were raised relating to the potential reduction in power output from wind turbines following the provision of increased active power output in response to a frequency fall.
4.1.12 A variable speed wind turbine relies on operating at the optimum point on the Cp - λ curve in order to extract the maximum available power from the wind. This is a complex non linear function and becomes a significant issue when the wind turbine is operating just below rated wind speed. In the event that the wind turbines are operating at just below their rated wind speed and at the same time, activation of the synthetic inertia control is required, then once the additional active power has been injected into the network, the recovery period can result in a drop in power output of up to 30% of its pre fault output, resulting in a frequency collapse after the event.
4.1.13 Figure 2 below shows an illustrative frequency trace using a power injection equivalent to 10% of non-responsive wind generation, with a 10% loss of output from the same plant after 10 seconds.
Frequency for 1,800MW Infeed Loss, 'High Wind', Synthetic Inertia Injection and Recovery
48.8
49
49.2
49.4
49.6
49.8
50
50.2
0 5 10 15 20
Time (s)
Freq
uenc
y (H
z)
Figure 2: The effect of loss of active power output during the wind turbine 'recovery period'
4.1.14 In investigating this issue, a range of wind statistics was examined to
determine the likelihood of a large volume of wind generation across the country operating at a similar wind speed. Data was also obtained to examine the effect of how wind speed varied within the wind farm.
4.1.15 The results of this analysis demonstrated that there was potentially a serious risk that a significant volume of geographically dispersed generation could be operating at a similar wind speed. The only guaranteed solution to this would be for the wind generation to be curtailed pre-fault, reducing the rate at which emission savings can be delivered.

Frequency Response
Technical Sub Group
15 November 2011
Page 9
4.1.16 An alternative approach to a synthetic inertia requirement would be to consider a method of rapidly injecting active power into the system following the loss of a generating unit by adopting a conventional proportional governor control.
4.1.17 This second approach was investigated using a response characteristic on frequency responsive wind generation that provided full primary frequency response within 5 seconds, being sustained for a further 25 seconds, rather than the current Grid Code requirement of delivery in 10 seconds and sustainable for a further 20 seconds.
4.1.18 The results of these studies demonstrated that the system frequency deviations could also be contained when fast frequency response was installed and that significant reductions in response requirements could also be achieved.
4.1.19 Discussions also highlighted concerns over the ability to deliver a synthetic inertia capability and conventional Primary Response from the same machines at the same time. It is therefore necessary to consider the likely generation patterns more carefully to check whether there is a sufficient amount of synthetic inertia capable plant which isn’t already required to manage system frequency in Primary and Secondary response timescales.
4.1.20 In assessing the materiality of the issue, it is also important to consider the proportion of the time where a synthetic inertia requirement may be needed to allow National Grid to meet the frequency containment requirements of the SQSS. Initial simulations highlighted that achieving frequency containment was significantly more challenging at transmission system demands of 35GW and less. A review of transmission system demands for 2008 to 2010 suggests that this represents approximately 50% of the time.
Transmission System Demand (INDO) Distribution Curve January 2008 to December 2010
47,500
37,000
25,500
0
10,000
20,000
30,000
40,000
50,000
60,000
70,000
0% 10% 20% 30% 40% 50% 60% 70% 80% 90% 100%
Percentage of Time
Dem
and
(MW
)
Figure 3: Transmission System Demand distribution curve
4.1.21 The next stage of analysis therefore needed to be based on clear
demand and generation assumptions which are discussed in the following section of this report.

Frequency Response
Technical Sub Group
15 November 2011
Page 10
4.2 Generation and Demand Scenarios
4.2.1 This section of the report outlines how generation and demand scenarios were derived from which the final set of simulations could be based.
4.2.2 The starting point was to consider National Grid's Gone Green Scenario for the year 2020. Gone Green for 2020 embodies a generation capacity of 100GW, made up of 11GW nuclear, 27GW of wind, 50GW of fossil fuelled plant, 3GW of Pumped Storage, 6GW of Interconnectors, and 3GW of other renewables.
4.2.3 An individual generation pattern was developed for each demand level, and with a High, Average and Low wind resource. The wind resource levels incorporated in the scenarios were less at the lower demand levels than at the high, in line with observed wind load factors which are on average greater at high demand levels, and lesser at lower demand levels.
4.2.4 It is recognised that these wind resource assumptions do not capture the full range of possible wind conditions, but they do allow simulations to be constructed which illustrate how wind output assumptions impact on the generation mix and hence frequency response.
4.2.5 Each individual generation scenario was constructed by first examining the amount of generation which was likely to make the commercial decision to run at base load, a category made up mainly of nuclear and wind generation.
4.2.6 Next, a Primary Response requirement was estimated, including an assumed contribution to Primary Response from Low Frequency Relay triggered demand. The generator response volumes assumed in this exercise are given in Table 1.
4.2.7 The net response requirement was then apportioned to the available generation in the following order:
• Response was first allocated to fossil fuelled synchronous generation at a loading level of 85%, the loading point where, on average, the most effective ratio of response to deload is delivered. For demand scenarios above 35GW, this generation is generally already required to meet demand.
• Where the estimated response requirement could not be met on synchronous generation at 85% (ie generation exceeded demand), then plant was loaded at lower levels, giving more response per machine.
• If the response requirement could not be met using synchronous generation alone, response was allocated to asynchronous generation starting at 85%, with load reduced as necessary.
4.2.8 Additional balancing actions (such as synchronising additional generation) were also considered if necessary.
4.2.9 The generation scenarios constructed using this process were then used as a basis for individual simulations for each system demand level and wind resource assumption. The scenarios were then adjusted until the resulting simulated frequency trace was satisfactorily close to the target frequency of 49.2Hz when the system was subject to its largest loss.
4.2.10 All scenarios were derived as a single snapshot in time, and did not take into account any other system issues such as network constraints. Some of the approaches used to solve the Primary Response requirement problem may not be achievable in practice.
4.2.11 The spreadsheet used to represent the plant mix and generation background is shown in Appendix B.

Frequency Response
Technical Sub Group
15 November 2011
Page 11
4.2.12 Response volume assumptions were derived from information on recently commissioned generation. Ramp rate assumptions were then derived by calculating the rates necessary to achieve the required volumes. These are shown in Table 1.
Load Point (pu wrt Active Power)
Response Delivered (pu)
Response/ Deload
10 Second Ramp Rate (pu/s)
5 Second RampRate (pu/s)
0.55 0.125 28% 0.0139 0.0313
0.65 0.125 36% 0.0139 0.0313
0.75 0.125 50% 0.0139 0.0313
0.85 0.082 55% 0.0091 0.0205
1.00 0 0% 0.0000 0.0000
Table 1: Frequency Response volume, delay and ramp rate assumptions

Frequency Response
Technical Sub Group
15 November 2011
Page 12
4.3 System Models to assess Frequency Response Requirements
4.3.1 In order to assess the future frequency response requirements, the following model shown in Figure 4 was constructed in Digsilent Power Factory.
Figure 4: Model used to assess Frequency Response requirements
4.3.2 The model comprises of non frequency responsive synchronous and
asynchronous generation together with frequency responsive synchronous and asynchronous generation.
4.3.3 The governor models used on the synchronous plant are generic but provide a representative reflection of aggregated plant behaviour. The models incorporate a droop characteristic, a ramp rate limit, amplitude limit and delay. The same parameters were used to represent both synchronous and asynchronous plant following a review of current plant capability.
4.3.4 The load was segregated into two components, namely a dynamic element (including a linear component and damping component) and a static element. These are important as some load relief will be realised as the frequency changes. The maximum generation loss was initially set at 1,800MW to reflect the increased loss in the SQSS but could be varied.
4.3.5 This single busbar, lumped machine model was considered adequate for the simulations required to investigate system wide synthetic inertia and Primary Response requirements. Local and distributed effects could not be investigated using this model and should be examined more carefully in future work.

Frequency Response
Technical Sub Group
15 November 2011
Page 13
4.4 Evaluating Primary Response Requirements
4.4.1 As described above, simulations were conducted for each demand and generation pattern and adjusted until the resulting simulated frequency trace was satisfactorily close to the target frequency of 49.2Hz when the system was subject to its largest loss. Figure 5 below illustrates how the time of the frequency minimum reduces as demand and hence inertia reduces.
Changing Rate of Simulated Frequency Fall for 1,800MW Infeed Loss - Low Wind
49
49.2
49.4
49.6
49.8
50
50.2
0 2 4 6 8 10 12 14 16 18 20
Time (s)
Freq
uenc
y (H
z)
Frequency (Hz - 20GW Demand) Frequency (Hz - 25GW Demand)Frequency (Hz - 30GW Demand) Frequency (Hz - 35GW Demand)
Figure 5: Changing rate of frequency fall with reducing demand
4.4.2 Where the frequency minimum point falls before 10 seconds after the
infeed loss event (which occurs at one second in these simulations) care needs to be taken when deriving the Primary Response required to achieve containment. Rather than simply looking at the response delivered, it is necessary to back-calculate the response scheduled by referencing the machine loading point against the response that would have been delivered at the 10 second point.
4.4.3 Figure 6 below shows the response delivered by synchronous generators in the 20, 25 and 35GW simulations for Low Wind conditions. In these examples, the responsive generators (in the case of the 25 and 35 GW simulations) are loaded at 85% of their active power capability, and 75% (in the case of the 20 GW simulation).
4.4.4 The scheduled response is therefore equivalent to the value given in Table 1 multiplied by the active power rating of the machine. In the case of the 25GW and 35GW simulations, this is 8.2% of the loading point divided by 0.85. In the 20GW simulation, the loading point is reduced to 75% to get the additional response required, therefore the response scheduled is 12.5% of rating, which is equivalent to the machine loading divided by 0.75.

Frequency Response
Technical Sub Group
15 November 2011
Page 14
Primary Response Delivered as System Frequency Falls and Recovers
49
49.2
49.4
49.6
49.8
50
50.2
0 2 4 6 8 10 12 14 16 18 20
Time (s)
Freq
uenc
y (H
z)
Frequency (Hz) for 35GWDemand Study
Frequency (Hz) for 25GWDemand Study
Frequency (Hz) for 20GWDemand Study
9,000
10,000
11,000
12,000
13,000
14,000
15,000
0 2 4 6 8 10 12 14 16 18 20
Time (s)
Resp
onsi
ve G
ener
ator
Out
put (
MW
)
Output from Responsive Generators (MW) for 25GW Demand StudyOutput from Responsive Generators (MW) for 20GW Demand StudyOutput from Responsive Generators (MW) for 35GW Demand Study
25GW SimulationPrimary Response Delivered = 1,260MW, Scheduled = 1,300MW
35GW SimulationPrimary Response Delivered = 960MW Scheduled =960MW
20GW Simulation Primary Response Delivered = 1,600MW, Scheduled = 1,900MW
10 seconds
Figure 6: Primary Response Delivery Profile
4.4.5 As the rate of frequency fall increases, the discrepancy between the
amount of response scheduled and the response that is delivered at the time required increases. This means that as the rate of frequency fall increases such that it interacts with responsive generators ramping, the requirement for primary frequency response increases in line with the assumed ramp rate as well as with the change in system characteristics.

Frequency Response
Technical Sub Group
15 November 2011
Page 15
4.5 Sensitivity to Primary Response Assumptions
4.5.1 Simulations were carried out using a governor characteristic where the expected volume of Primary Response was delivered over 10 seconds, with a delay of 1 second before frequency response was initiated. A linear ramp over the next 9 seconds was assumed. Figure 7 below shows how changing the delay assumption to 3 seconds (with ramping over 6 seconds) results in the non-compliant frequency trace shown in red.
4.5.2 In this example, additional response of 500MW had to be scheduled in order to achieve compliance with a 3 second delay.
Comparison of Different Simulated Response Delay Periods - (25GW Low Wind Conditions)
48.2
48.4
48.6
48.8
49
49.2
49.4
49.6
49.8
50
50.2
0 2 4 6 8 10 12 14 16 18 20
Time (s)
Freq
uenc
y (H
z)
0
500
1,000
1,500
2,000
2,500
3,000
3,500
4,000
Gen
erat
or R
espo
nse
(MW
)
Frequency (1s Delay Base Case)
Frequency (3s Delay Without Additional Response - non-compliant)
Frequency (3s Delay with Additional Response)
Generator Response (1s Delay - Base Case)
Generator Response (3s Delay)
Generator Response (3s Delay with Additional Response)
Figure 7: Comparison of Response Delay Periods

Frequency Response
Technical Sub Group
15 November 2011
Page 16
4.6 Frequency Response Erosion
4.6.1 The historic approach to setting Primary Response requirements is to check compliance for a frequency deviation to 49.2Hz, with a starting frequency of 50Hz. In practice, it is necessary to take account of uncertainties in the simulation and also to consider the effects of starting at frequencies lower than 50Hz. A margin is then added to the requirements to reflect this. This effect becomes more important as larger volumes of dynamic response are scheduled.
4.6.2 Figure 8 below shows the impact of a large infeed loss when the initial frequency is low. An imbalance was introduced to the simulation to set the initial frequency at approximately 49.9Hz before the large infeed loss occurred. In this case, an additional 200MW had to be scheduled (on top of the ~1,000MW required in the base case simulation) to ensure that the region in which there is a risk of Low Frequency Demand Disconnection of operating was not encroached upon.
Frequency Response Erosion (1,800MW Infeed Loss, 35GW, Low Wind)
48.6
48.8
49
49.2
49.4
49.6
49.8
50
50.2
0 10 20 30 40 50 60 70 80
Time (s)
Feqe
uenc
y (H
z)
Frequency Deviation with Lower Starting FrequencyFrequency Trace with Additional Response Scheduled
LFDD Trip Risk Limit
Figure 8: Frequency Response Erosion
4.6.3 Therefore, in order to cater for the erosion risk, a factor of 20% has been
applied to the requirements presented in this report where these are met by 'dynamic' response sources (ie not 'static' frequency triggered demand control). Further work is required to derive a margin which is robust in all relevant cases.

Frequency Response
Technical Sub Group
15 November 2011
Page 17
4.7 Response Requirements
4.7.1 This section sets out the Primary Response volume requirements that have been derived by simulation for an 1,800MW infeed loss and for a 1,320MW infeed loss. Requirements are given for the demand and generation backgrounds described in section 4.2 above and detailed in Appendix B up to a transmission system demand of 55GW. At demands higher than 55GW, the simulated rate of frequency fall was such that containment was required in secondary response timescales only.
4.7.2 1,800MW Infeed Loss
Low Wind
4.7.2.1 Figure 9 below shows the simulated Primary Response requirements for an 1,800MW Infeed Loss under Low Wind conditions. At low system demands the Primary Response requirement is seen to increase noticeably. This is caused by the frequency fall coinciding with frequency responsive generation ramping.
4.7.2.2 Low frequency triggered response of 200MW was incorporated in all simulations with the balance of Primary Response coming from synchronous generation and delivered in 10 seconds. It should be noted that the effect of low frequency triggered response was very effective at arresting the fall in system frequency.
Simulated Primary Response Requirements for 1,800MW Infeed Loss for Low Wind Conditions
0
500
1,000
1,500
2,000
2,500
3,000
3,500
4,000
20 25 30 35 40 45 50 55
Transmission System Demand (GW)
Resp
onse
(MW
)
LF Trip Synchronous Plant Margin Secondary Response Figure 9: Primary Response Requirements, 1,800MW Loss, Low Wind
4.7.2.3 The secondary response requirement is also shown. In general terms,
where the Primary response requirement is higher, this means that additional balancing actions need to be taken purely to meet the Primary Response requirement.
Average Wind
4.7.2.4 Figure 10 below shows the simulated Primary Response requirements for an 1,800MW Infeed Loss under Average Wind conditions. Again, the increased requirement can be seen at lower system demands.
4.7.2.5 Low frequency triggered response of 200MW was incorporated in all simulations with the balance of Primary Response coming from synchronous generation and delivered in 10 seconds, apart from the 20GW simulation. In this case, asynchronous generation was used to make up the balance of the response requirement.

Frequency Response
Technical Sub Group
15 November 2011
Page 18
Simulated Primary Response Requirements for 1,800MW Infeed Loss for Average Wind Conditions
0
500
1,000
1,500
2,000
2,500
3,000
3,500
4,000
20 25 30 35 40 45 50 55
Transmission System Demand (GW)
Resp
onse
(MW
)
LF Trip Synchronous Plant Asynchronous PlantMargin Without Faster Response Secondary Response
Figure 10: Primary Response Requirements, 1,800MW Loss, Average Wind
4.7.2.6 Two approaches were applied, one with asynchronous response
delivered in 5 seconds (ie fast response) and one in 10 seconds. The difference between the two was equivalent to approximately 400MW of Primary Response.
High Wind
4.7.2.7 Figure 11 shows the simulated Primary Response requirements for an 1,800MW Infeed Loss under High Wind conditions. Again, the larger requirement can be seen at lower system demands. Low frequency triggered response of 200MW was again incorporated in all simulations apart from the 20GW simulation where 350MW was utilised. The balance of Primary Response came from synchronous generation, delivered in 10 seconds, for simulations at 40GW and above. In the other cases, asynchronous generation was used make up the balance of the response required.
Simulated Primary Response Requirements for 1,800MW Infeed Loss for High Wind Conditions
0
500
1,000
1,500
2,000
2,500
3,000
3,500
4,000
20 25 30 35 40 45 50 55
Transmission System Demand (GW)
Resp
onse
(MW
)
LF Trip Synchronous Plant Asynchronous PlantMargin Without Faster Response Secondary Response
Compliance not achieved w ithout Faster Response
Figure 11: Primary Response Requirements, 1,800MW Loss, High Wind
4.7.2.8 Again, two approaches were applied, one with asynchronous response
delivered in 5 seconds and one in 10 seconds. The difference between the two was equivalent to between 450MW and 900MW of Primary Response.
4.7.2.9 Frequency containment could not be achieved for the 20GW simulation in the absence of fast frequency response. The frequency trace is shown in Figure 12.

Frequency Response
Technical Sub Group
15 November 2011
Page 19
4.7.2.10 The 20GW simulation also yielded the highest rate of change of frequency at -0.68Hz/s. Further work is required to assess whether this has any impact on the deployment of Rate of Change of Frequency based protection for the purposes of loss of mains protection.
Frequency for 1,800MW Infeed Loss with Demand of 20GW, 'High Wind'
48.8
49
49.2
49.4
49.6
49.8
50
50.2
0 5 10 15 20
Time (s)
Freq
uenc
y (H
z)
Using Faster Response Using Primary Response Delivered in 10 seconds
Figure 12: Frequency for 1,800MW Loss at 20GW, High Wind
4.7.3 1,320MW Infeed Loss
4.7.3.1 A similar process was followed to examine the primary frequency response requirement for a 1320MW infeed loss. In this case the SQSS stipulates that frequency should be contained to 49.5Hz rather than 49.2Hz.
Low Wind
4.7.3.2 The simulated Primary Response requirements for a 1,320MW Infeed Loss under Low Wind conditions are shown in Figure 13.
4.7.3.3 Low frequency triggered response of 200MW was incorporated in all simulations with the balance of Primary Response coming from synchronous generation and delivered in 10 seconds.
Simulated Primary Response Requirements for 1,320MW Infeed Loss for Low Wind Conditions
0
500
1,000
1,500
2,000
2,500
3,000
3,500
4,000
20 25 30 35 40 45 50 55
Transmission System Demand (GW)
Resp
onse
(MW
)
LF Trip Synchrounous Plant Margin Secondary Response Figure 13: Primary Response Requirements, 1,320MW Loss, Low Wind

Frequency Response
Technical Sub Group
15 November 2011
Page 20
Average Wind
4.7.3.4 Figure 14 shows the simulated Primary Response requirements for a 1,320MW Infeed Loss under Average Wind conditions.
4.7.3.5 Low frequency triggered response of 200MW was incorporated in all simulations with the balance of Primary Response coming from synchronous generation and delivered in 10 seconds, apart from the 20GW simulation. In this case, asynchronous generation was used make up the rest of the response requirement.
Simulated Primary Response Requirements for 1,320MW Infeed Loss for Average Wind Conditions
0
500
1,000
1,500
2,000
2,500
3,000
3,500
4,000
20 25 30 35 40 45 50 55Transmission System Demand (GW)
Resp
onse
(MW
)
LF Trip Synchronous Plant Asyncnronous PlantMargin Without Faster Response Secondary Response
Figure 14: Primary Response Requirements, 1,320MW Loss, Average Wind 4.7.3.6 As in the case of the 1,800MW infeed loss, two approaches were applied,
one with asynchronous response delivered in 5 seconds (ie fast response) and one in 10 seconds. The difference between the two was equivalent to approximately 500MW of Primary Response.
High Wind
4.7.3.7 The simulated Primary Response requirements for an 1,320MW Infeed Loss under High Wind conditions are illustrated in Figure 15.
4.7.3.8 Low frequency triggered response of 200MW was incorporated in all simulations apart from the 20GW simulation where 350MW was utilised. Primary Response synchronous generation, delivered in 10 seconds, was sufficient to contain the frequency deviation for simulations at 40GW and above. In the other cases, asynchronous generation was used make up the rest of the response requirement.
Simulated Primary Response Requirements for 1,320MW Infeed Loss for High Wind Conditions
0
500
1,000
1,500
2,000
2,500
3,000
3,500
4,000
20 25 30 35 40 45 50 55
Transmission System Demand (GW)
Res
pons
e (M
W)
LF Trip Synchronous Plant Asyncnronous PlantMargin Without Faster Response Secondary Response
Compliance not achieved w ithout Faster Response
Figure 15: Primary Response Requirements, 1,320MW Loss, Low Wind

Frequency Response
Technical Sub Group
15 November 2011
Page 21
4.7.3.9 Again, two approaches were applied, one with asynchronous response
delivered in 5 seconds and one in 10 seconds. The difference between the two was equivalent to between 300MW and 950MW of Primary Response. Containment could not be achieved in the 20GW simulation without fast response.
4.7.4 Summary of Low Frequency Response Requirements
4.7.4.1 Table 2 and Figure 16 provide an overall summary of the response requirement derived by simulation for Low, Average and High Wind conditions.
Future Response Requirements
0
500
1,000
1,500
2,000
2,500
3,000
3,500
4,000
20 25 30 35 40 45 50 55
Transmission System Demand (GW)
Prim
ary
Resp
onse
Req
uier
men
ts (M
W)
0
500
1,000
1,500
2,000
2,500
3,000
3,500
4,000
Sec
onda
ry R
espo
nse
Requ
irem
ents
(MW
)
1,800 MW Low Wind 1,800 MW Average Wind 1,800 MW High Wind1,320 MW Low Wind 1,320 MW Average Wind 1,320 MW High WindSecondary Response - 1,800 MW Secondary Response - 1,320MW
Figure 16: Future Low Frequency Response Requirements
System Demand (GW)
20 25 30 35 40 45 50 55
Primary Response Requirement
1,800 MW 2,520 1,800 1,680 1,380 1,260 1,140 1,020 900 Low Wind
1,320 MW 2,220 1,620 1,500 1,140 1,020 900 840 810
1,800 MW 2,880 2,460 2,160 1,680 1,260 1,140 1,020 900 Average
Wind 1,320 MW 2,700 2,160 2,040 1,500 1,140 960 840 810
1,800 MW 3,480 2,580 2,520 2,040 1,680 1,380 1,020 900 High
Wind 1,320 MW 3,240 2,400 2,340 2,040 1,560 1,320 900 810
Secondary Response Requirement
1,800 MW 2000 1950 1850 1750 1700 1600 1550 1450
1,320 MW 1400 1300 1200 1150 1050 1000 900 800
Table 2: Future Low Frequency Response Requirements
4.8 High Frequency Response Requirements
4.8.1 A range of simulations were carried out to examine High Frequency response requirements. Volumes have not been calculated for the purposes of this report. However, many of the issues highlighted for Primary Response above are the same for High Frequency response.

Frequency Response
Technical Sub Group
15 November 2011
Page 22
4.8.2 Figure 17 shows a simulated frequency trace for a 1,400MW demand loss which shows that the maximum frequency point occurs at less than 10 seconds. This highlights that the issues of ramp rate, delay and response volume discussed above in relation to Primary Response are equally valid for High Frequency response.
Frequency for 1,400MW Demand Loss with Demand of 25GW, Low Wind
49.9
50
50.1
50.2
50.3
50.4
50.5
50.6
0 5 10 15 20
Time (s)
Freq
uenc
y (H
z)
Figure 17: Frequency for 1,400MW Demand Loss
4.9 Impact of Varying Primary Response Timescales
4.9.1 The Primary Reponses requirements outlined above enable comparison to be made between requirements derived where response from asynchronous plant is delivered within 5 seconds and the requirements where all primary response from generation is delivered in 10 seconds.
4.9.2 The 5 second delivery time was initially selected based on the time that system frequency reached its minimum in simulations for the 20GW demand scenario. Further simulations were performed to investigate the benefit delivered as Primary Response timescales are reduced from 10 seconds.
4.9.3 Figures 18 and 19 show how the Primary Response requirement reduces as delivery timescales on asynchronous plant are reduced, using a 25GW and 35GW 'High Wind' generation and demand pattern.
4.9.4 The Primary Response requirement is shown at varying response delivery timescales alongside the reduction in requirement compared to the current 10 second criteria.
4.9.5 The incremental reduction (the reduction in requirement achieved by speeding response up by one second) is shown in the line plot on the secondary axis. In the cases investigated here, the incremental improvement reaches its peak value where response is delivered in 4 or 5 seconds.
4.9.6 Response rates of less than 5 seconds deliver less incremental benefit under these simulated conditions and would be expected to be more challenging to implement. Note that the 20% margin applied to the requirements in the sections above has not been applied in this analysis.

Frequency Response
Technical Sub Group
15 November 2011
Page 23
Primary Response Requirements for Varying Primary Response Timescales, 25GW 'High Wind'
0
500
1,000
1,500
2,000
2,500
3,000
2 3 4 5 6 7 8 9 10
Primary Response Delivery Timescales (s)
Res
pons
e (M
W)
0
50
100
150
200
250
300
Incr
emen
tal R
educ
tion
(MW
)
Total Response Reduction in Requirement wrt 10seconds Incremental Reduction in Requirement
Figure 18: Varying Primary Response Timescales at 25GW system demand
Primary Response Requirements for Varying Primary Response Timescales, 35GW 'High Wind'
0
500
1,000
1,500
2,000
2,500
3,000
2 3 4 5 6 7 8 9 10
Primary Response Delivery Timescales (s)
Res
pons
e (M
W)
0
50
100
150
200
250
300
Incr
emen
tal R
educ
tion
(MW
)
Total Response Reduction in Requirement wrt 10seconds Incremental Reduction in Requirement
Figure 19: Varying Primary Response Timescales at 35GW system demand

Frequency Response
Technical Sub Group
15 November 2011
Page 24
4.10 Manufacturer Feedback
4.10.1 Wind turbine manufacturers played an active role in Working Group discussions, providing a great deal of useful guidance to the group. A number of points were raised within working group discussions including:
• The need for clarity and uniformity in requirements; • Timescales to develop equipment to meet new requirements; and • The need to consider local and distributed system issues when
specifying control system requirements.
4.10.2 The Working Group also discussed the synthetic inertia requirement developed in Canada which was understood to be similar to the 'one-shot' option discussed (with a power delivery profile thought to be suited to the Canadian system). Frequency response requirements in Ireland were also debated. These were understood to focus on faster delivery of Primary response, similar to the 5 second criteria already being discussed in the Working Group.
4.10.3 It should however be noted that some areas of equipment capability could not be discussed fully within the Working Group. National Grid therefore sought confidential feedback on a range of questions relating to Synthetic Inertia and Fast Frequency Response. Replies were received from 5 wind turbine manufacturers and one HVDC manufacturer.
4.10.4 All of the replies from wind turbine manufacturers stated that fast frequency response (in 5 seconds) could be delivered by wind turbines with the exception of one, who stated it was not possible to confirm this at this time.
4.10.5 A number of replies highlighted that the delivery of frequency response by wind turbines was dependant on the wind resource available.
4.10.6 No specific implementation costs were provided but a number of the replies stated that development costs for them were likely to be associated with software and control systems rather than in turbine hardware.
4.10.7 Some replies indicated an implementation time, with the minimum quoted at 18 months, maximum at 2 years.
4.10.8 A number of replies also highlighted a desire to continue development work on a synthetic inertia. One also highlighted the potential benefits of synthetic inertia where its provision could mean that curtailment of wind would be minimised.
4.10.9 None of the respondents felt able to make specific comment on the provision of synthetic inertia or fast primary response on offshore networks connected via HVDC. However, one reply stated that the desired response timescales were well within the capabilities of current HVDC technology, providing an energy source was available.

Frequency Response
Technical Sub Group
15 November 2011
Page 25
4.11 Conclusions
4.11.1 In order to manage the Transmission System in the future and ensure system frequency can be managed to the criteria set out in the SQSS, there will be a requirement to mitigate the reduced contribution to system inertia from decoupled generation plants such as variable speed wind turbines and other static plant such as HVDC Converters.
4.11.2 The following conclusions were drawn from National Grid's simulations based on a 'Gone Green' generation scenario for the year 2020:
• A supplementary frequency control facility can deliver significant benefits in managing the 1,800MW and 1,320MW infeed risk at system demand levels of 35GW and below under all but "Low Wind" conditions.
• The measures needed to ensure compliance with the SQSS, and avoid impacting on system security, become more severe and more significant in volume as system demand, and the capacity of any synchronous generation meeting it, decreases;
• Additional low frequency relay triggered demand response was required as well as supplementary frequency control capability to achieve frequency containment at system demands of 20GW under 'High Wind' conditions;
• These factors suggests that both a supplementary frequency control capability and alternative actions will be required to ensure frequency containment can be achieved at demands of less than 25GW. Further alternative actions include:
o Curtailment of the largest infeed loss; and o Additional balancing actions, such as
curtailment of interconnectors or inflexible plant; displacement using plant with additional response
capability; fast acting low frequency relay triggered response;
and Addition of inertia, by 'low load operation' on
synchronous generation for example.
4.11.3 It should be noted that the simulations were based on an interconnector position of 'float' (ie no import/export) and that any net interconnector import has the effect of displacing synchronous plant. There is currently 3.5 GW of interconnector capacity on the transmission system, a variability of 7GW. It should however be noted that the volume of interconnectors to Great Britain may increase in the future.
4.11.4 A number of supplementary frequency control capability options were investigated, including a pure 'df/dt' driven fast acting control on un-curtailed asynchronous plant which is intended to mimic the inertia capability of a synchronous machine. This form of control provides an ideal solution, as it helps solve the frequency control problem without the need to curtail wind. However, there are a number of issues associated with it:
• Any control system will incorporate a processing delay which needs to be limited to ensure the desired effect is achieved;
• Rate of change of frequency as an input parameter is inherently noise amplifying leading to unpredictability of response;
• Care needs to be taken not to extract too much energy from wind turbines as this can lead to an extended and detrimental recovery period, particularly at specific points on the wind turbine operating curve. This leads to some uncertainty over the volume and timescales of energy available; and

Frequency Response
Technical Sub Group
15 November 2011
Page 26
• Discussions suggest that wind based Power Park Modules will find it difficult to deliver both a 'df/dt' driven fast acting control and Primary Response consecutively with the volumes required. This issue is critical as work to date suggests that both are required under most of the relevant system scenarios.
4.11.5 Alternative synthetic inertia controllers based on rate of change of frequency, using fixed and variable volumes were investigated. It was demonstrated that these options provided a potential solution to the frequency containment problem, provided that the correct volumes and characteristics could be specified. These would need to be validated for the full range of possible future system conditions.
4.11.6 Finally, the option of using faster acting proportional frequency control was investigated by taking a conventional Primary Response characteristic and adapting it to deliver response within 5 seconds rather than 10. This characteristic was applied to wind generation which was already curtailed in order to provide conventional Primary Response within the simulations described in this report.
4.11.7 This capability had the effect of reducing the Primary Response requirement and hence the need to curtail renewable generation significantly. A benefit of between 400MW and 950MW was observed in the simulations presented in this report. If one assumes that this benefit applies for 10% of the year at an average of 500MW and response price of 30 £/MW/h, a benefit of £13m per year in balancing cost could be attributed to this capability. There would be an additional carbon benefit for the wind curtailment avoided.
4.11.8 Based on the analysis conducted, it has been concluded that the single change to response provision that would yield the most significant benefit is through the introduction of a fast primary frequency response capability applicable to all decoupled generation sources which do not naturally provide an inertial contribution.
4.11.9 Such generating plant should have the capability to provide 10% or more of its registered capacity as primary frequency response which should be delivered linearly over a 5 second period from the inception of the generation loss or load change and an initial delay of no more than 1 second from the inception of the frequency change.
4.11.10 It is recognised that this specification may present a challenge to technology providers and manufacturers. However, it is believed that this specification is more achievable, at an earlier implementation date, than the df/dt triggered control option discussed above.
4.11.11 Simulations also showed a high degree of sensitivity to the ramp rate assumptions for Primary Response. It is recommended that these are specified explicitly within the Grid Code by setting out a maximum response delay of 1 second and specifying that response should be delivered linearly up to 10 seconds or 5 seconds as appropriate.
4.11.12 Whilst it is acknowledged that these proposals could resolve the issue for Plant in excess of 50MW, some consideration will still be required as to how this issue will be addressed in respect of Small Embedded Power Stations as this segment of the market is expected to grow in the future
4.11.13 The studies have also demonstrated the effect on rate of change of system frequency against a credible set of future generating scenarios. As a conclusion it is seen that this will impact on Embedded Generation, in particular the effect on protection settings. It is therefore suggested that this report is highlighted to the Distribution Code Review Panel for further consideration in respect of Embedded Generation.

Frequency Response
Technical Sub Group
15 November 2011
Page 27
4.11.14 A final point to note is the extent of reliance on wind generation to deliver frequency control in the analysis performed in this report. Operators have little experience of this to date and it may be necessary to revisit the technical and commercial arrangements for the provisions of frequency response for asynchronous generators as more experience is gained.
.

Frequency Response
Technical Sub Group
15 November 2011
Version 1.0
Page 28
5 Working Group Recommendations
5.1 The following recommendations are presented for the attention of the Frequency Response Working Group and for the consideration of the Grid Code Review Panel.
5.2 Faster Frequency Response
5.2.1 Faster Frequency Response capability delivered within 5 seconds, for low and high frequencies, on users bound by the provisions of the Grid Code allows frequency response volumes to be reduced significantly in the situations analysed in this report.
a) The value of faster frequency response should be assessed, taking into consideration the costs of implementation and the benefits in reduced curtailment of generation from renewable sources and other balancing costs; and
b) Subject to this assessment, proposals should be developed for the appropriate obligations and/or market arrangements to ensure sufficient frequency response capability is available to maintain system security for anticipated future generation and demand patterns.
5.3 Clearer Primary Response Requirements
5.3.1 The simulations conducted for this report demonstrated the sensitivity of frequency response requirements to the ramping capability of responsive generation. The Grid Code requirements for frequency response should be reviewed with the aim of clarifying the ramping capability required from responsive generation in terms of:
a) Adequacy of information provided on performance; and
b) The need to stipulate minimum delay times and ramping capability for new providers.
5.4 Response Volumes
5.4.1 The Grid Code Review Panel is invited to note the response volumes derived for this report.
5.5 Rate of Change of Frequency
5.5.1 The simulations performed in this report give some indication to the potential change in the maximum rate of change of frequency settings which needs to be considered in the context of the loss of mains protection deployed on embedded generation.

Frequency Response
Technical Sub Group
15 November 2011
Page 29
APPENDIX A
1.0 Synthetic Inertia Models
1.1 Two controllers were considered and tested. These being a one shot df/dt controller and a continuously acting df/dt controller. Both designs relied on rate of change of frequency as a trigger signal. The reason being that rate of change of frequency is a good measure as to the volume of generation lost. Clearly for the controller to work effectively it needs to know that the frequency has fallen and equally the rate of change of system frequency. For example, it would not appropriate to require the controllers to inject a fixed volume of active power irrespective of the generation loss as small generation losses could potentially result in temporary over frequencies and large generation losses could result in a risk of breaching the lower frequency limit. Both of these are controllers are described in detail below.
2.0 The One Shot df/dt Controller 2.1 The one shot df/dt controller is designed to inject an initial increase in
active power following a frequency change in proportion to the rate of change of frequency. The full active power injection should be available within 200ms and then decay exponentially over a period of Ts seconds. A small power recovery period of up to 5% of nominal power is permitted but limited to prevent the risk of subsequent frequency deviations following the initial generation loss or load change. An illustration of the control strategy is shown in Figure A1.0.
Figure A1.0 2.2 This control scheme was found to work well however, as the decay was
exponential, ie generated by a mathematical function there was always a risk that the intended response would not be guaranteed if a subsequent event were to occur in the period between 0 – Ts seconds. For the purposes of the studies, a figure of 10 seconds was used although this was changed as a sensitivity. In addition, following discussions with manufacturers, the rise time of 200ms was debated as an issue as it would be difficult to implement using a df/dt controller. In respect of this, a
Frequency Response
Technical Sub Group
15 November 2011
Page 30
number of sensitivity studies were run with different rise times to establish the effect on overall system frequency.
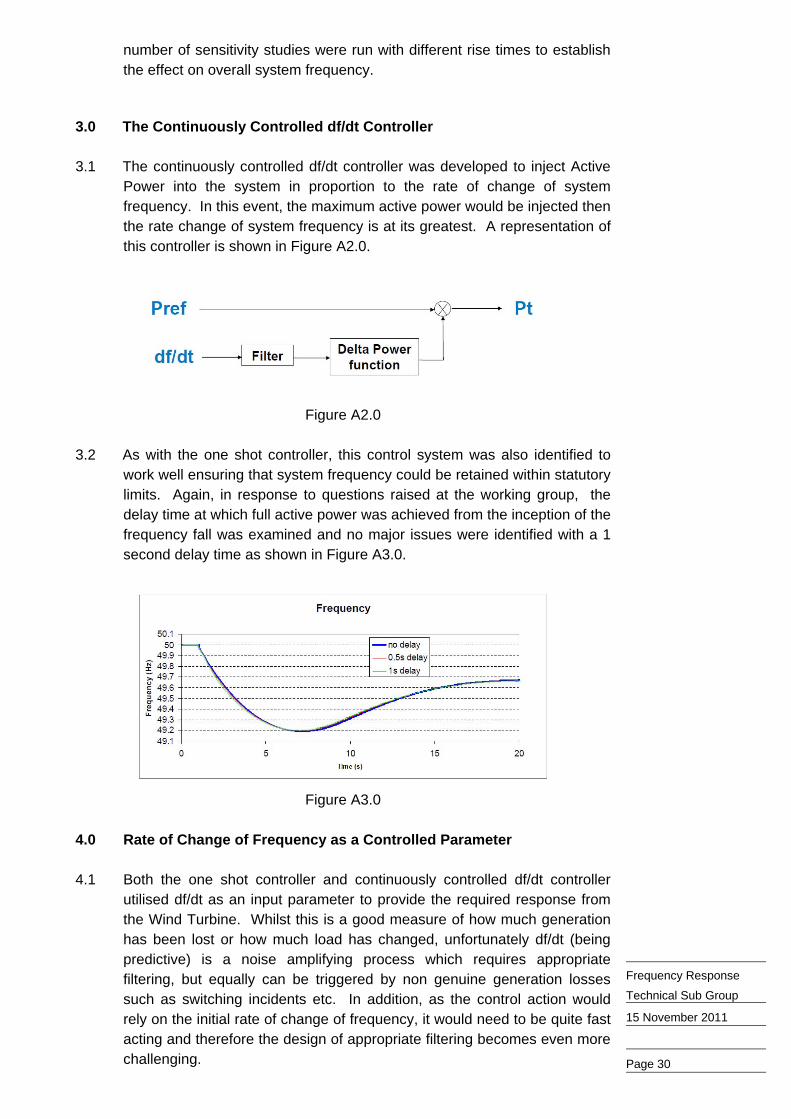
3.0 The Continuously Controlled df/dt Controller 3.1 The continuously controlled df/dt controller was developed to inject Active
Power into the system in proportion to the rate of change of system frequency. In this event, the maximum active power would be injected then the rate change of system frequency is at its greatest. A representation of this controller is shown in Figure A2.0.
Figure A2.0
3.2 As with the one shot controller, this control system was also identified to
work well ensuring that system frequency could be retained within statutory limits. Again, in response to questions raised at the working group, the delay time at which full active power was achieved from the inception of the frequency fall was examined and no major issues were identified with a 1 second delay time as shown in Figure A3.0.
Figure A3.0
4.0 Rate of Change of Frequency as a Controlled Parameter 4.1 Both the one shot controller and continuously controlled df/dt controller
utilised df/dt as an input parameter to provide the required response from the Wind Turbine. Whilst this is a good measure of how much generation has been lost or how much load has changed, unfortunately df/dt (being predictive) is a noise amplifying process which requires appropriate filtering, but equally can be triggered by non genuine generation losses such as switching incidents etc. In addition, as the control action would rely on the initial rate of change of frequency, it would need to be quite fast acting and therefore the design of appropriate filtering becomes even more challenging.

Frequency Response
Technical Sub Group
15 November 2011
Page 31
4.2 In addition to the problems of df/dt as a control function, the problem of the
recovery period as explained in references [1], [2] and [3] of this Appendix caused serious concerns to the adoption of a synthetic inertia controller. Since the issue could be resolved by the action of fast acting response, it was suggested that this would provide a better solution.
5.0 References [1] Grid Code Review Panel Paper Reference PP01/21, Future Frequency
Response requirements, dated September 2010. [2] Contribution of Wind Energy Converters with Inertia Emulation to frequency
control and frequency stability in Power Systems – Stephan Wachtel and Alfred Beekmann – Enercon – Presented at the 8th International Workshop on Large Scale Integration of Wind Power into Power Systems as well as on Offshore Wind Farms, Bremen Germany, 14 – 15 October 2009.
[3] Variable Speed Wind Turbines Capability for Temporary Over-Production –
German Claudio Tarnowski, Philip Carne Kjaer, Poul E Sorensen and Jacob Ostergaard
[4] Study on Variable Speed Wind Turbine Capability for Frequency Response
- German Claudio Tarnowski, Philip Carne Kjaer, Poul E Sorensen and Jacob Ostergaard

Frequency Response
Technical Sub Group
15 November 2011
Page 32
APPENDIX B Generation Scenarios
GG
Yea
r:20
20
Gen
erat
ion
Sum
mer
Sum
mer
Sprin
g/Au
tum
nSp
ring/
Autu
mn
Sprin
g/Au
tum
nW
inte
rW
inte
rW
inte
rC
apac
ities
20G
W25
GW
30G
W35
GW
40G
W45
GW
50G
W55
GW
Hig
h W
ind
Aver
age
Win
dLo
w W
ind
Hig
h W
ind
Aver
age
Win
dLo
w W
ind
Hig
h W
ind
Aver
age
Win
dLo
w W
ind
Hig
h W
ind
Aver
age
Win
dLo
w W
ind
Hig
h W
ind
Aver
age
Win
dLo
w W
ind
Hig
h W
ind
Aver
age
Win
dLo
w W
ind
Hig
h W
ind
Aver
age
Win
dLo
w W
ind
Hig
h W
ind
Aver
age
Win
dLo
w W
ind
Dem
and
2020
2025
2525
3030
3035
3535
4040
4045
4545
5050
5055
5555
Add
ition
al D
eman
d (ie
Pum
ping
)2
22
22
2To
tal D
eman
d22
2222
2727
2730
3030
3535
3540
4040
4545
4550
5050
5555
55
Gen
erat
ion
"Mus
t Run
" gen
erat
ion
Bas
eloa
d S
ynch
rono
us11
.86.
76.
76.
76.
76.
76.
77.
67.
67.
68.
28.
28.
28.
78.
78.
710
.110
.110
.110
.110
.110
.110
.110
.110
.1W
ind
26.8
16.1
8.0
.016
.18.
0.0
20.1
9.4
1.3
20.1
9.4
1.3
20.1
9.4
1.3
24.1
10.7
1.3
24.1
10.7
1.3
24.1
10.7
1.3
Tota
l "M
ust R
un"
38.6
22.8
14.8
6.7
22.8
14.8
6.7
27.7
17.0
8.9
28.2
17.5
9.5
28.8
18.1
10.1
34.2
20.8
11.5
34.2
20.8
11.5
34.2
20.8
11.5
Tota
l Gen
erat
ion
Cap
acity
100.
0
Prim
ary
Res
pons
eR
equi
rem
ent
2.9
2.4
2.0
2.2
1.8
1.5
2.1
1.8
1.4
1.8
1.4
1.2
1.4
1.1
1.1
1.1
1.0
1.0
0.9
0.9
0.9
0.8
0.8
0.8
Sta
tic R
espo
nse
0.4
0.2
0.2
0.2
0.2
0.2
0.2
0.2
0.2
0.2
0.2
0.2
0.2
0.2
0.2
0.2
0.2
0.2
0.2
0.2
0.2
0.2
0.2
0.2
Net
Res
pons
e R
eq2.
62.
21.
82.
01.
61.
31.
91.
61.
21.
61.
21.
01.
20.
90.
90.
90.
80.
80.
70.
70.
70.
60.
60.
6R
espo
nse
on S
ynch
rono
us P
lant
0.5
1.5
1.8
1.0
1.6
1.3
0.8
1.6
1.2
1.1
1.2
1.0
1.2
0.9
0.9
0.9
0.8
0.8
0.7
0.7
0.7
0.6
0.6
0.6
Res
pons
e on
Asy
nchr
onou
s Pl
ant
2.0
0.8
0.0
1.0
0.0
0.0
1.2
0.0
0.0
0.5
0.0
0.0
0.0
0.0
0.0
0.0
0.0
0.0
0.0
0.0
0.0
0.0
0.0
0.0
Res
pons
e on
Syn
chro
nous
Pla
ntA
ssum
ed L
oadi
ng P
oint
75%
75%
75%
75%
75%
85%
75%
75%
85%
75%
85%
85%
75%
85%
85%
75%
85%
85%
85%
85%
85%
85%
85%
85%
Ass
umed
Del
oad/
Res
pons
e R
atio
50%
50%
50%
50%
50%
55%
50%
50%
55%
50%
55%
55%
50%
55%
55%
50%
55%
55%
55%
55%
55%
55%
55%
55%
Res
pons
ive
Plan
t Del
oad
1.1
2.9
3.6
2.0
3.2
2.4
1.5
3.2
2.2
2.2
2.2
1.7
2.4
1.6
1.6
1.7
1.4
1.4
1.2
1.2
1.2
1.0
1.0
1.0
Pow
er O
utpu
t on
Res
pons
ive
Plan
t3.
28.
710
.86.
09.
613
.54.
59.
612
.46.
612
.49.
87.
28.
88.
85.
17.
87.
86.
76.
76.
75.
75.
75.
7
Res
pons
e on
Asy
nchr
onou
s Pl
ant
Ass
umed
Loa
ding
Poi
nt75
%75
%85
%85
%85
%85
%75
%85
%85
%85
%85
%85
%85
%85
%85
%85
%85
%85
%85
%85
%85
%85
%85
%85
%A
ssum
ed D
eloa
d/R
espo
nse
Rat
io50
%50
%55
%55
%55
%55
%50
%55
%55
%55
%55
%55
%55
%55
%55
%55
%55
%55
%55
%55
%55
%55
%55
%55
%R
espo
nsiv
e Pl
ant D
eloa
d4.
01.
50.
01.
70.
00.
02.
30.
00.
00.
90.
00.
00.
00.
00.
00.
00.
00.
00.
00.
00.
00.
00.
00.
0P
ower
Out
put o
n R
espo
nsiv
e Pl
ant
12.1
4.5
0.0
9.8
0.0
0.0
6.9
0.0
0.0
5.2
0.0
0.0
0.0
0.0
0.0
0.0
0.0
0.0
0.0
0.0
0.0
0.0
0.0
0.0
Add
ition
al B
alan
cing
(Pul
lbac
k)0.
00.
00.
00.
00.
00.
00.
00.
00.
00.
00.
00.
00.
00.
00.
00.
00.
00.
00.
00.
00.
00.
00.
00.
0P
ower
Out
put o
n N
on-re
spon
sive
Pla
nt0.
02.
00.
04.
58.
00.
010
.99.
41.
314
.09.
41.
320
.19.
41.
324
.110
.71.
324
.110
.71.
324
.110
.71.
3
Agg
rega
te R
espo
nse
Pow
er O
utpu
t on
Res
pons
ive
Plan
t15
.313
.210
.815
.89.
613
.511
.49.
612
.411
.812
.49.
87.
28.
88.
85.
17.
87.
86.
76.
76.
75.
75.
75.
7R
espo
nsiv
e Pl
ant D
eloa
d5.
14.
43.
63.
73.
22.
43.
83.
22.
23.
12.
21.
72.
41.
61.
61.
71.
41.
41.
21.
21.
21.
01.
01.
0
Addi
tiona
l Out
put R
eqd
0.0
0.0
4.5
-0.1
2.6
6.8
0.1
3.4
8.6
1.1
5.0
15.7
4.0
13.1
21.1
5.7
16.4
25.8
9.1
22.4
31.8
15.1
28.5
37.8
Addi
tiona
l Bal
anci
ng (P
ullb
ack)
0.
00.
00.
00.
00.
00.
00.
00.
00.
00.
00.
00.
00.
00.
00.
00.
00.
00.
00.
00.
00.
00.
00.
00.
0
Tota
l Gen
erat
ion
22.0
22.0
22.0
27.1
27.0
27.0
30.0
30.0
30.0
35.0
35.0
35.0
40.0
40.0
40.0
45.0
45.0
45.0
50.0
50.0
50.0
55.0
55.0
55.0
Low
Dem
and
Low
Dem
and
Med
ian
Dem
and
Med
ian
Dem
and
Med
ian
Dem
and
Hig
h D
eman
dH
igh
Dem
and
Hig
h D
eman
d20
GW
25G
W30
GW
35G
W40
GW
45G
W50
GW
55G
W
Hig
h W
ind
Aver
age
Win
dLo
w W
ind
Hig
h W
ind
Aver
age
Win
dLo
w W
ind
Hig
h W
ind
Aver
age
Win
dLo
w W
ind
Hig
h W
ind
Aver
age
Win
dLo
w W
ind
Hig
h W
ind
Aver
age
Win
dLo
w W
ind
Hig
h W
ind
Aver
age
Win
dLo
w W
ind
Hig
h W
ind
Aver
age
Win
dLo
w W
ind
Hig
h W
ind
Aver
age
Win
dLo
w W
ind
Nuc
lear
60%
60%
60%
60%
60%
60%
65%
65%
65%
70%
70%
70%
75%
75%
75%
85%
85%
85%
85%
85%
85%
85%
85%
85%
Win
d60
%30
%0%
60%
30%
0%75
%35
%5%
75%
35%
5%75
%35
%5%
90%
40%
5%90
%40
%5%
90%
40%
5%C
CS
0%0%
0%0%
0%0%
50%
50%
50%
50%
50%
50%
50%
50%
50%
100%
100%
100%
100%
100%
100%
100%
100%
100%
Oth
er75
%75
%75
%75
%75
%75
%80
%80
%80
%80
%80
%80
%80
%80
%80
%90
%90
%90
%90
%90
%90
%90
%90
%90
%
Frequency Response
Technical Sub Group
15 November 2011
Page 33
APPENDIX C Code Drafting For Fast Response
1.0 General 1.1 The proposals below set out the very high level principles in addressing the need
for a fast frequency response in order to address the issue of a diminishing contribution to system inertia from generating plants which are insensitive to changes in system frequency.
1.2 For illustrative purposes only, the proposals have been drafted in the style of a
Grid Code change. It is envisaged that the major changes would relate to the Glossary and Definitions, CC.6.3.7 and CC.A.3.
2.0 High Level Proposals for Primary Response 2.1 In order to limit the rate of change of frequency following a generation loss or load
change, each Generating Unit, Power Park Module (including Power Park Units thereof) or DC Converters which are insensitive to changes in system frequency and do not inherently contribute to system inertia shall be required to provide a Fast Primary Frequency Capability in addition to the requirements of CC.6.3.7 and CC.A.3.
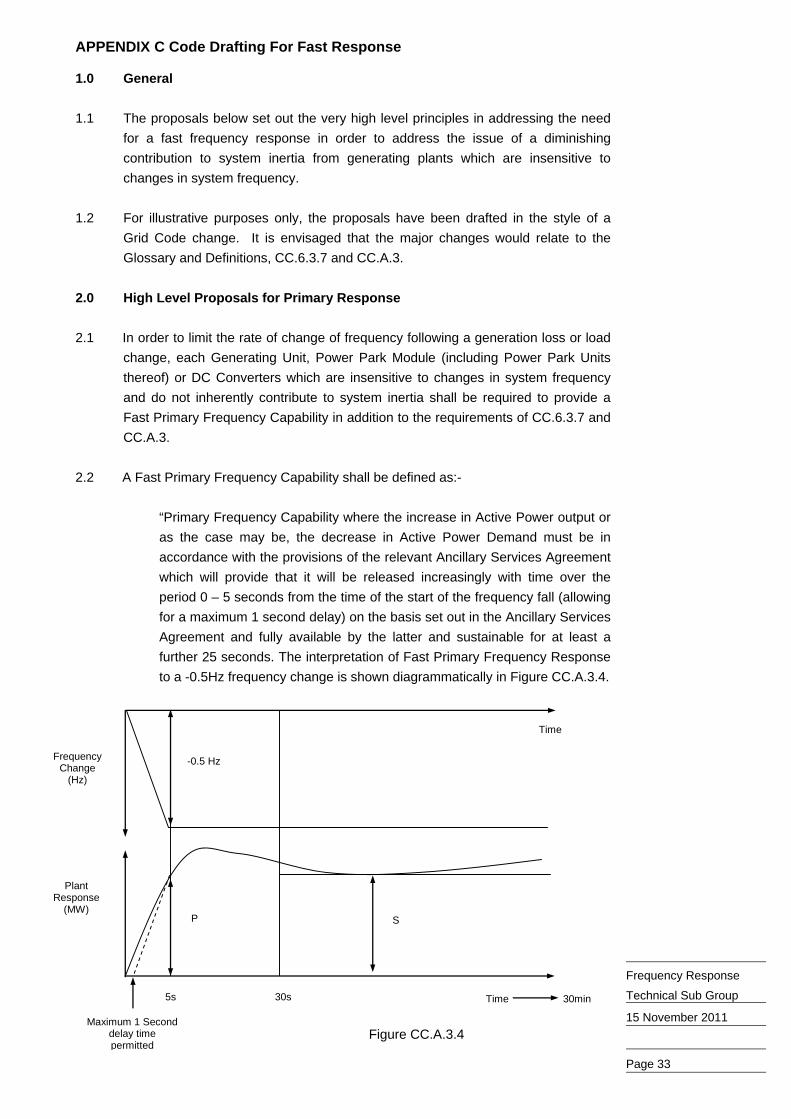
2.2 A Fast Primary Frequency Capability shall be defined as:-
“Primary Frequency Capability where the increase in Active Power output or as the case may be, the decrease in Active Power Demand must be in accordance with the provisions of the relevant Ancillary Services Agreement which will provide that it will be released increasingly with time over the period 0 – 5 seconds from the time of the start of the frequency fall (allowing for a maximum 1 second delay) on the basis set out in the Ancillary Services Agreement and fully available by the latter and sustainable for at least a further 25 seconds. The interpretation of Fast Primary Frequency Response to a -0.5Hz frequency change is shown diagrammatically in Figure CC.A.3.4.
Time 30min
Time
30s 5s
-0.5 Hz
P
Plant Response
(MW)
Frequency Change
(Hz)
S
Maximum 1 Second delay time permitted
Figure CC.A.3.4

Frequency Response
Technical Sub Group
15 November 2011
Page 34
3.0 High Level Proposals for High Frequency Response 3.1 In order to limit the rate of change of frequency following a demand loss or load
change, each Generating Unit, Power Park Module (including Power Park Units thereof) or DC Converters which are insensitive to changes in system frequency and do not inherently contribute to system inertia shall be required to provide a Fast High Frequency Response Capability in addition to the requirements of CC.6.3.7 and CC.A.3.
3.2 A Fast High Frequency Response Capability shall be defined as:
“High Frequency Response where the reduction in Active Power output in response to an increase in System Frequency above the Target Frequency (or such other level Frequency as may have been agreed in an Ancillary Services Agreement). This reduction in Active Power output must be in accordance with the provisions of the relevant Ancillary Services Agreement which will provide that it will be released increasingly with time over the period 0 – 5 seconds from the time of the start of the frequency increase (allowing for a maximum 1 second delay) on the basis set out in the Ancillary Services Agreement and fully achieved within 5 seconds of the time of the start of the Frequency increase and it must be sustained at no lesser reduction thereafter. The interpretation of Fast High Frequency Response to a +0.5Hz frequency change is shown diagrammatically in Figure CC.A.3.5”.
Time
Time
5s
-0.5 Hz
P
Plant Response
(MW)
Frequency Change
(Hz)
Maximum 1 Second delay time permitted
Figure.CC.A.3.5