Embed Size (px)
Citation preview
Working Group Reports
2004 Planning MeetingApril 23 & 24, 2003
University of New Hampshire
• Overview
• Aircraft and Ship Coordination
• Surface Networks
• Measurement Comparison
• Modeling and Forecasting
• International Coordination

Overview

Planning Timeline
• April 2003 - Planning Meeting
• April - June 2003 Individual science plans developed
• September/ October 2003 - Project Management Team Meeting
• November /December 2003 - Implementation plan for field study collaboration
• February / March 2004 - Gathering of the Clans
• May 2004 - Project Management Team Meeting
• July / August 2004 - FIELD STUDY
• February 2005 - First Look Data
• April 2005 - Data workshop
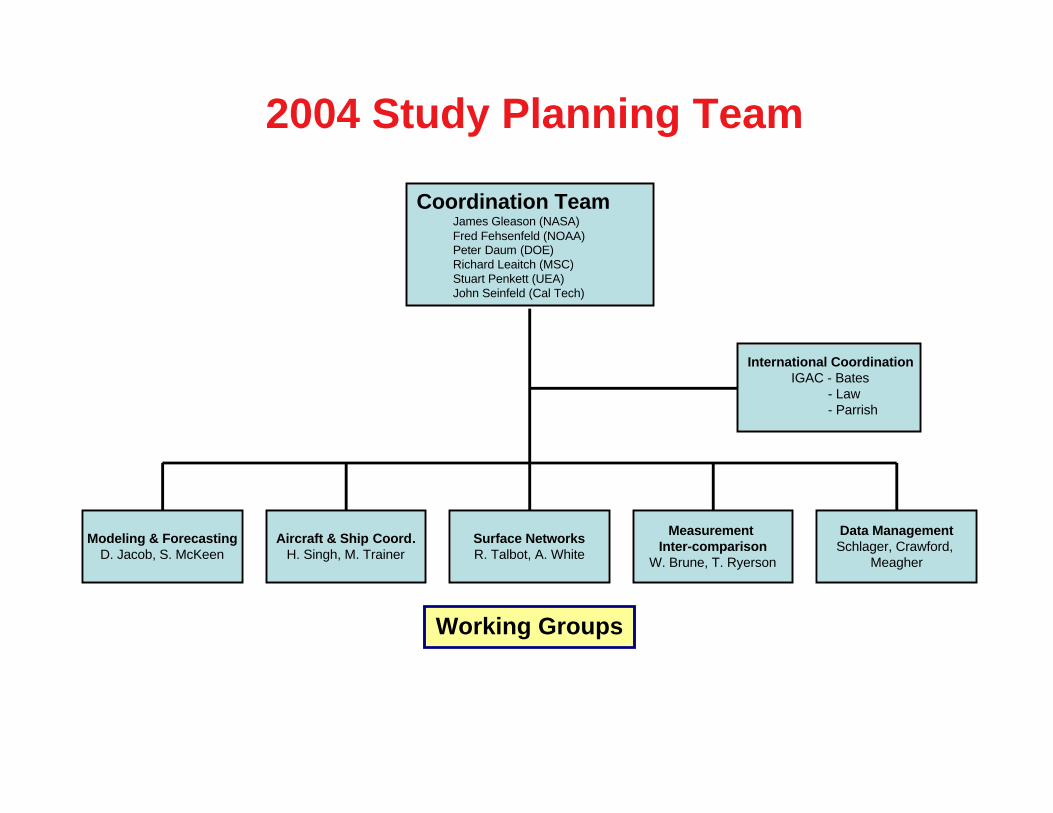
Coordination Team James Gleason (NASA) Fred Fehsenfeld (NOAA) Peter Daum (DOE) Richard Leaitch (MSC) Stuart Penkett (UEA) John Seinfeld (Cal Tech)
Modeling & ForecastingD. Jacob, S. McKeen
Aircraft & Ship Coord.H. Singh, M. Trainer
Surface NetworksR. Talbot, A. White
Measurement Inter-comparison
W. Brune, T. Ryerson
Data ManagementSchlager, Crawford,
Meagher
International Coordination IGAC - Bates - Law - Parrish
Working Groups
2004 Study Planning Team

Breakout Sessions
• Decide some issues
• Set some ground rules
• Develop a plan and timeline for planning

Modeling
Jacob/McKeen
• Catalog of forecast products
• Common modeling needs
• Expectations from the forecasts
• Forecast evaluation
• Access to data in the field
• Pre-mission planning meeting for LS models
• Other issues
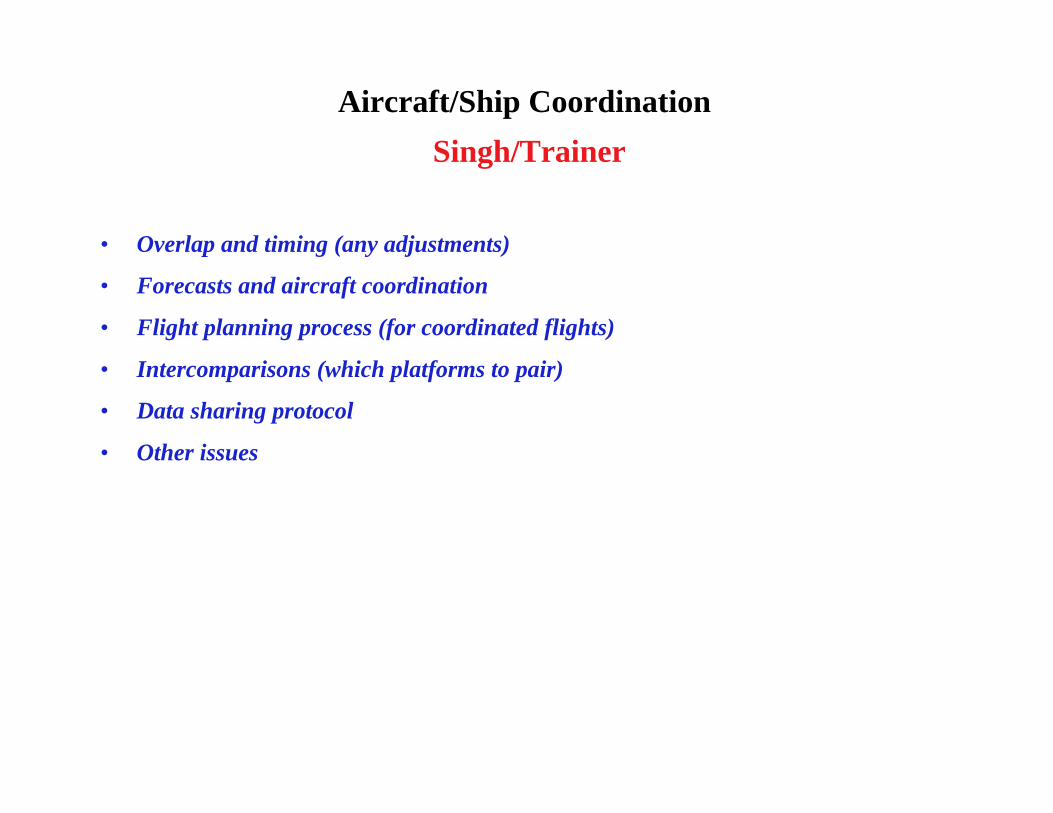
Aircraft/Ship Coordination
Singh/Trainer
• Overlap and timing (any adjustments)
• Forecasts and aircraft coordination
• Flight planning process (for coordinated flights)
• Intercomparisons (which platforms to pair)
• Data sharing protocol
• Other issues

Surface NetworksTalbot/White
• Science Objectives
• What’s Being Measured and Where
• Coordination
• Data Access
• Timing
• Measurement Locations
• Logistics
• Other issues
Measurement intercomparisons
Brune/Ryerson
• Which intercomparisons
• Which species
• How many flight segments
• What conditions
• How formal
• How to organize
• Other issues

Aircraft and ShipCoordination

Overlap Timing
• 1 July - 15 August 2004
• Transatlantic 15 July - 15 August 2004
• ITOP 12 July - 4 August 2004
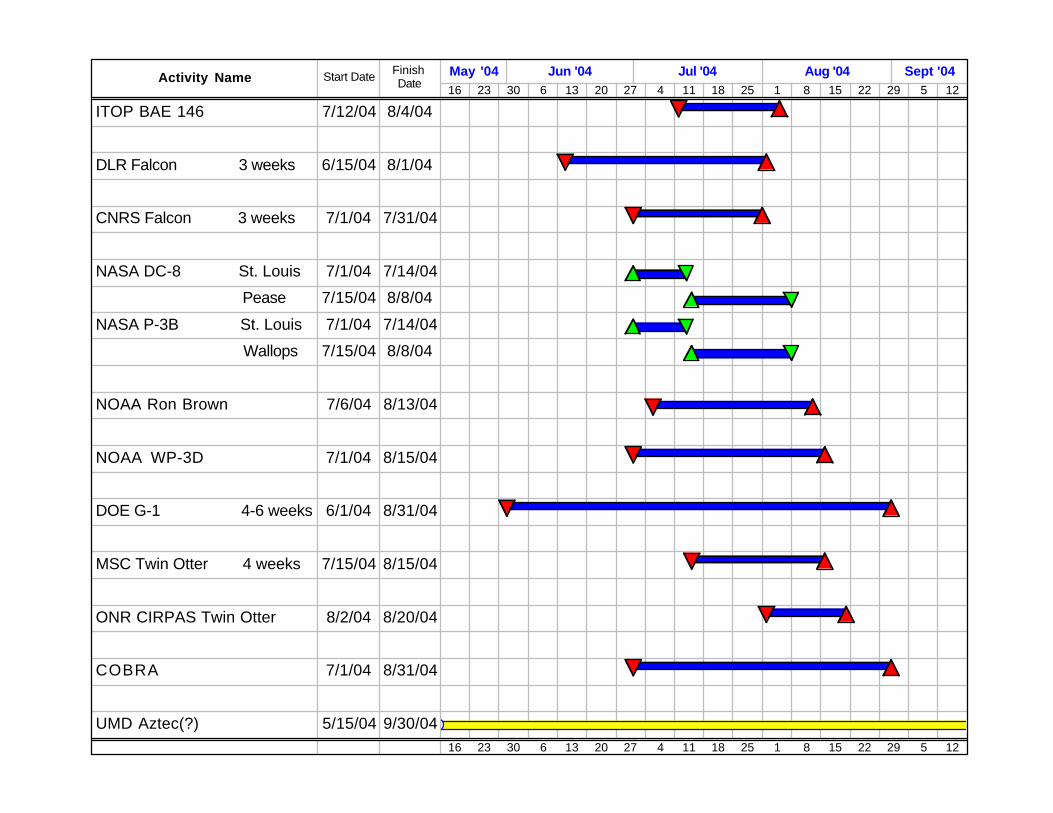
Activity Name Start Date Finish Date 16 23 30 6 13 20 27 4 11 18 25 1 8 15 22 29 5 12
May '04 Jun '04 Jul '04 Aug '04 Sept '04
16 23 30 6 13 20 27 4 11 18 25 1 8 15 22 29 5 12
ITOP BAE 146 7/12/04 8/4/04
DLR Falcon 3 weeks 6/15/04 8/1/04
CNRS Falcon 3 weeks 7/1/04 7/31/04
NASA DC-8 St. Louis 7/1/04 7/14/04
Pease 7/15/04 8/8/04
NASA P-3B St. Louis 7/1/04 7/14/04
Wallops 7/15/04 8/8/04
NOAA Ron Brown 7/6/04 8/13/04
NOAA WP-3D 7/1/04 8/15/04
DOE G-1 4-6 weeks 6/1/04 8/31/04
MSC Twin Otter 4 weeks 7/15/04 8/15/04
ONR CIRPAS Twin Otter 8/2/04 8/20/04
COBRA 7/1/04 8/31/04
UMD Aztec(?) 5/15/04 9/30/04
Forecast/Aircraft Coordination
• Lagrangian flights - Major objective forEuropean groups
• Andreas Stohl calls for best opportunities
• Look at past experience of best opportunities(homework)
• All forecasts on the web
• Communications/model features/disagreements
• Modelers to point out main opportunities
Flight Planning Process(Standard)
• File day before
• File at least two flight plans
• ATC coordination
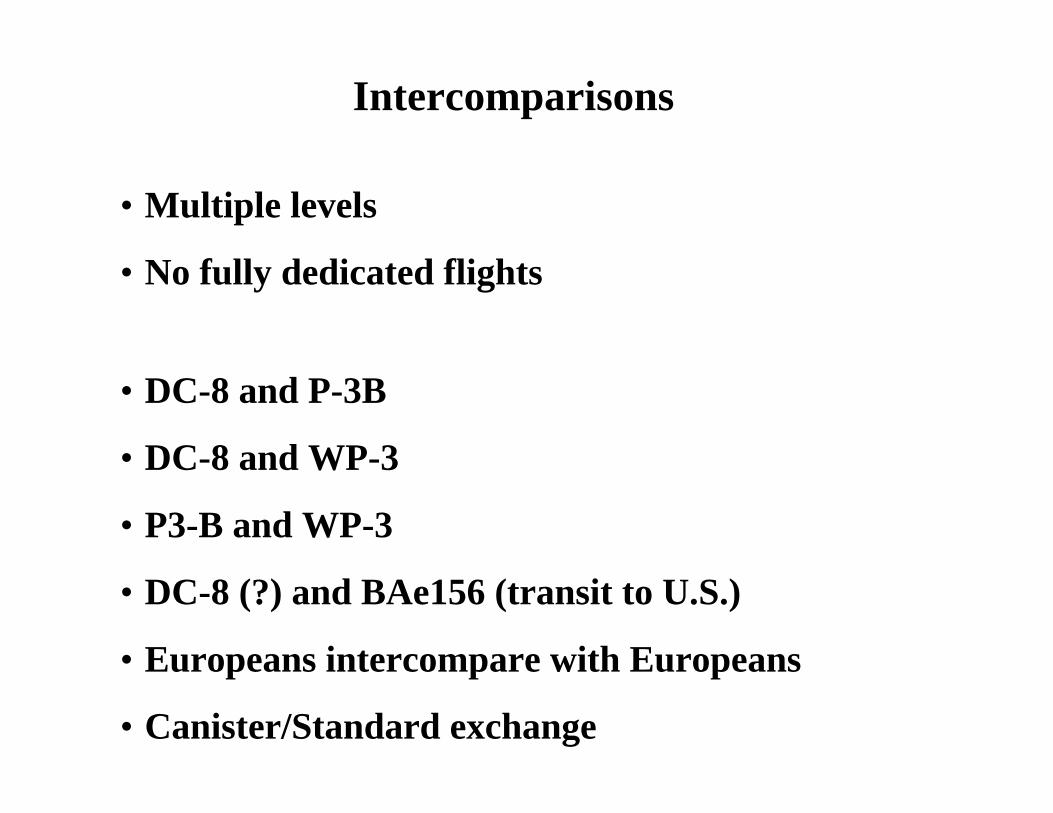
Intercomparisons
• Multiple levels
• No fully dedicated flights
• DC-8 and P-3B
• DC-8 and WP-3
• P3-B and WP-3
• DC-8 (?) and BAe156 (transit to U.S.)
• Europeans intercompare with Europeans
• Canister/Standard exchange
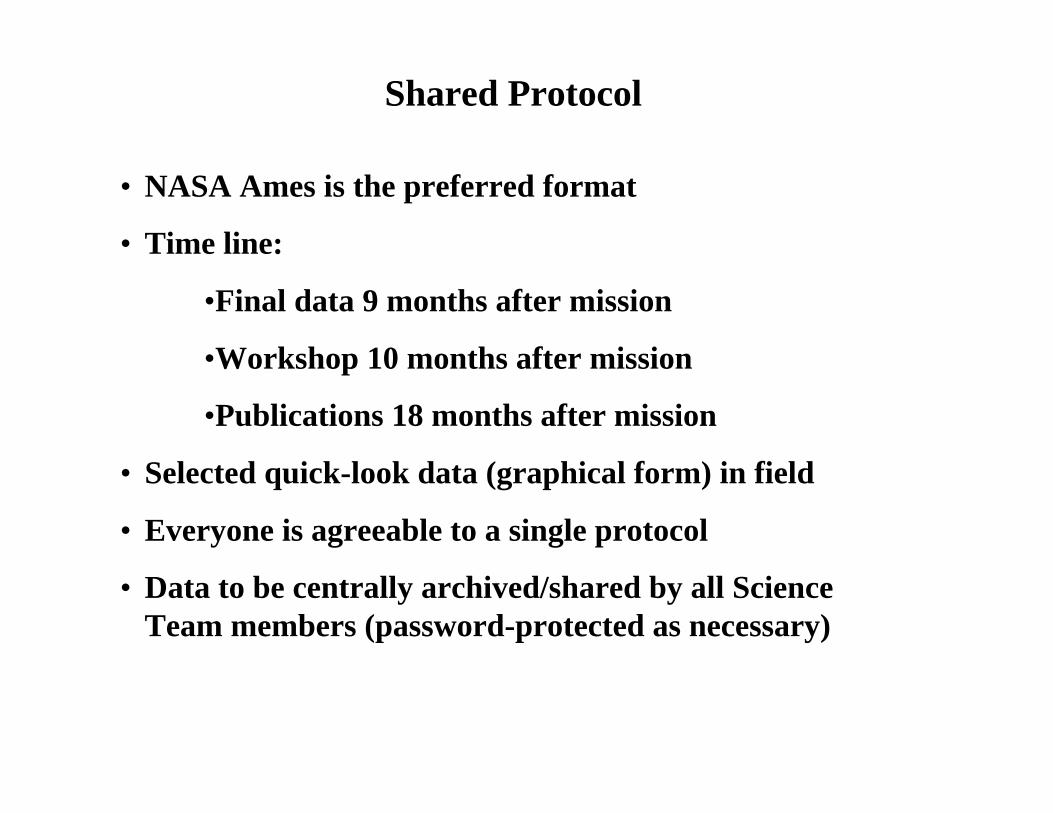
Shared Protocol
• NASA Ames is the preferred format
• Time line:
•Final data 9 months after mission
•Workshop 10 months after mission
•Publications 18 months after mission
• Selected quick-look data (graphical form) in field
• Everyone is agreeable to a single protocol
• Data to be centrally archived/shared by all ScienceTeam members (password-protected as necessary)

Augmentation
• In-flight web access for NASA
• Aircraft-to-aircraft communication for all
• Falcon - 20 NMHC (tentative solution)
• Ship overfly - only P-3
• ‘Optical depth’ on P-3
• Indirect forcing studies - CIRPAS Twin Otter/Convair/Ship/NOAA P-3
•Others concerned with direct forcing only
• Communicate regularly between now andcampaign

Surface Networks
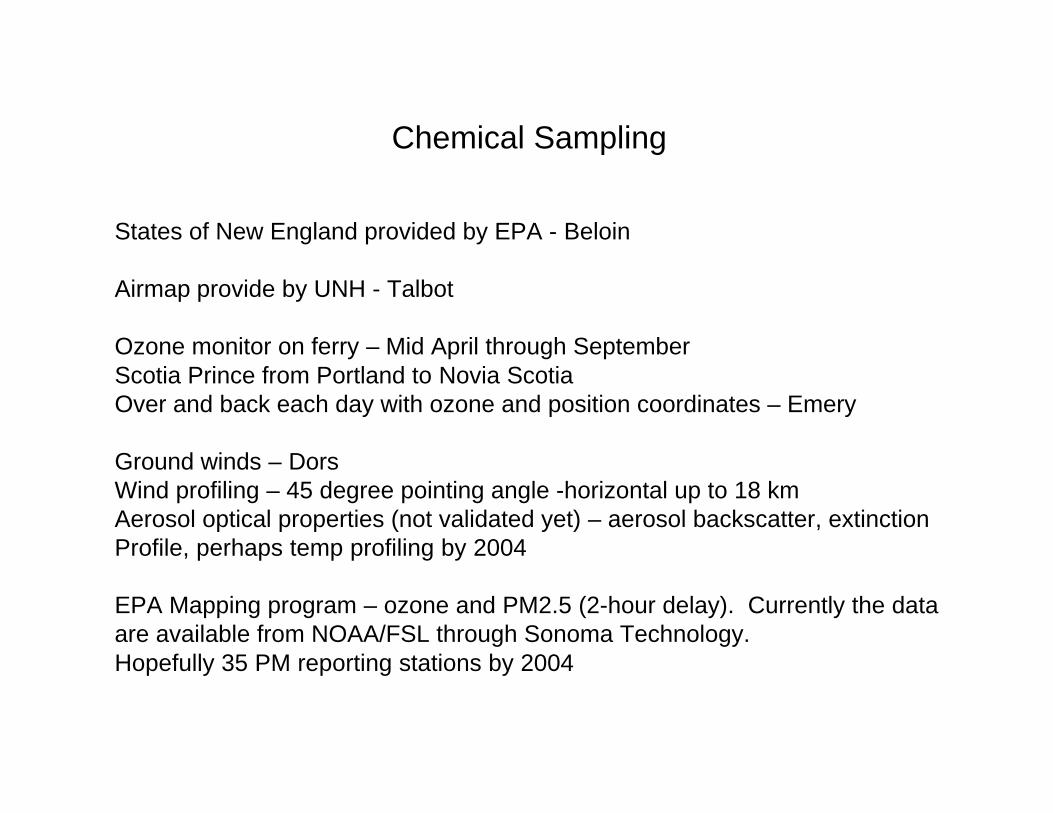
Chemical Sampling
States of New England provided by EPA - Beloin
Airmap provide by UNH - Talbot
Ozone monitor on ferry – Mid April through SeptemberScotia Prince from Portland to Novia ScotiaOver and back each day with ozone and position coordinates – Emery
Ground winds – DorsWind profiling – 45 degree pointing angle -horizontal up to 18 kmAerosol optical properties (not validated yet) – aerosol backscatter, extinctionProfile, perhaps temp profiling by 2004
EPA Mapping program – ozone and PM2.5 (2-hour delay). Currently the data are available from NOAA/FSL through Sonoma Technology.Hopefully 35 PM reporting stations by 2004
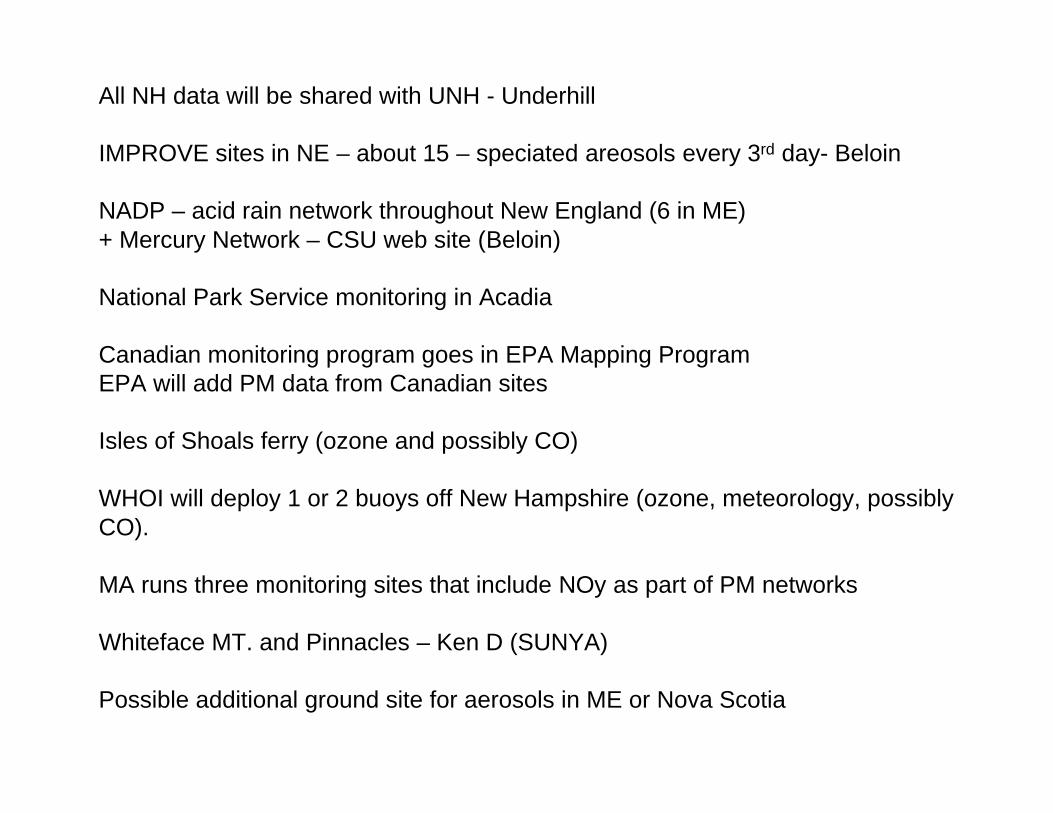
All NH data will be shared with UNH - Underhill
IMPROVE sites in NE – about 15 – speciated areosols every 3rd day- Beloin
NADP – acid rain network throughout New England (6 in ME)+ Mercury Network – CSU web site (Beloin)
National Park Service monitoring in Acadia
Canadian monitoring program goes in EPA Mapping ProgramEPA will add PM data from Canadian sites
Isles of Shoals ferry (ozone and possibly CO)
WHOI will deploy 1 or 2 buoys off New Hampshire (ozone, meteorology, possiblyCO).
MA runs three monitoring sites that include NOy as part of PM networks
Whiteface MT. and Pinnacles – Ken D (SUNYA)
Possible additional ground site for aerosols in ME or Nova Scotia
Appledore Is. – ozone, CO, possibly DOAS system from UCLA
Mt. Manadnock – More room for additional measurements (Underhill)
Rye ozone monitor slated to shut down in 2004- This year Rye and Odiorne (?) will be compared.
Unattended ozone lidars at two sites (perhaps TF and upwind site). Micropulseaerosol lidar will also be deployed at TF.
Harvard Forrest – chance for aerosols, CO2 flux, energy flux, CO, NO, NO2, NOy, PAN and Halocarbons
Holland, ME - tall tower added with CO and CO2, met. , Doppleracoustic sounder, surface energy balance fluxes, CASTnet – Munger
MANE-VU upgrades (G. Allen)

Meteorological Sampling
Profiler network – wind and temperature profiles, surface met. – White
CRN at TF, and Kingman Farm (also in Durham), URI (southern NE)
Mesoscale network (15 stations – WS, Dir., Temp, RH) - Contorno
AIRMAP stations (surface met.)
NH Fire towers through DES – partial surface met.
Plymouth SC will get a portable met station with radiation, and a portableGPS rawinsonde system (100 sondes)
Mt. Washington - string of Temp sensors at 500 ft intervals along auto road
NWS modernizing COOP network in NE (temp and precip) - may not beavailable by 2004.
NOS has Ports system in Narragansett Bay for tidal weather
GPS Sondes (2 to 4 daily) from Bartlett
NWS coordination will involve telemetry of sites that are not alreadyavailable and modernization of existing networks
NOAA energy and radiation fluxes at selected site
Other agency profilers (5)
Archiving of ASOS sites – Plymouth SC

Logistics
NOAA needs to establish 4 new profiler sites
Housing for personnel for Plymouth SC – students to run portable met equipment
Science Objectives
Summer is not only poor air quality season – maintaining monitoring networksthroughout the year should be a priority
Long-term surface monitoring networks put episodes and field campaigns intoclimatological context.
ITCT-2K4 objectives were well defined at meeting. Group will work to priortize.

Coordination
• Group will produce master spreadsheet withmeasurements, locations, PI’s, data collection periods,start end dates for campaign, etc. – 1 July
• Web-based layered, mapping system to show allmeasurement sites that are available (could learn fromFSL and EPA experience) – 1 September
• Email traffic among team and conference call ifnecessary.
MeasurementComparison
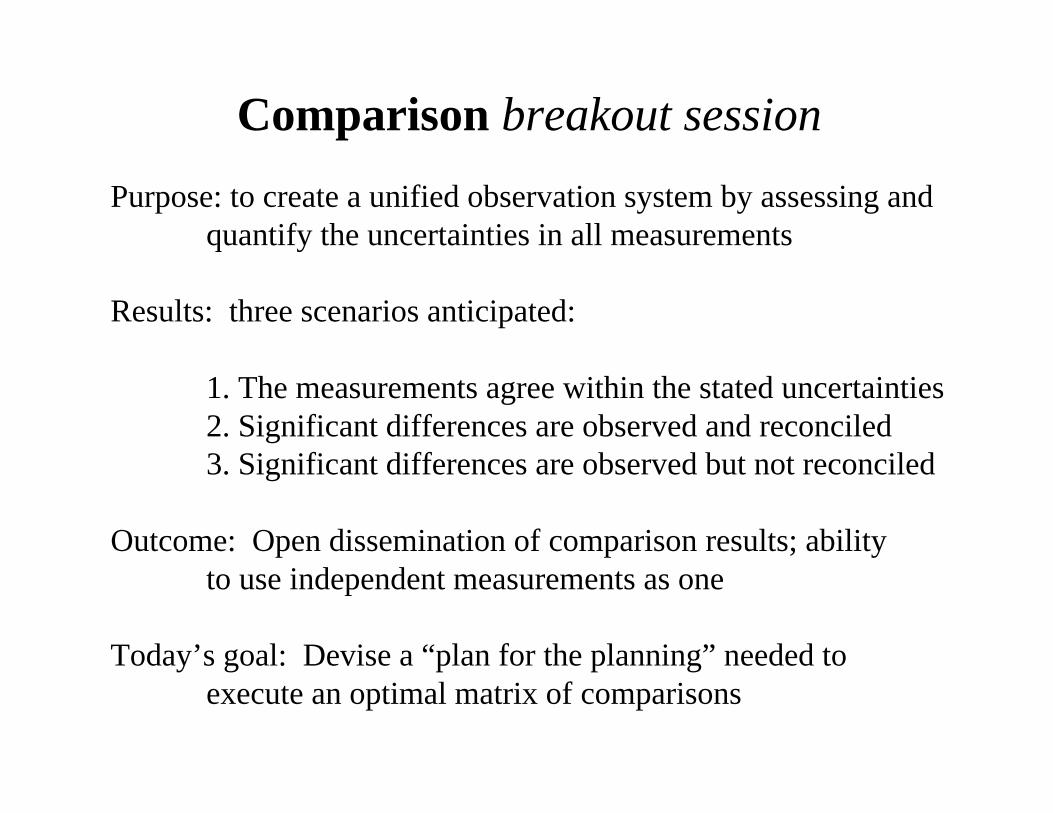
Comparison breakout session
Purpose: to create a unified observation system by assessing andquantify the uncertainties in all measurements
Results: three scenarios anticipated:
1. The measurements agree within the stated uncertainties2. Significant differences are observed and reconciled3. Significant differences are observed but not reconciled
Outcome: Open dissemination of comparison results; ability to use independent measurements as one
Today’s goal: Devise a “plan for the planning” needed toexecute an optimal matrix of comparisons

Comparison platforms
Satellites Aircraft Ship Surface SondesTES (Aura) NASA DC-8* Ron Brown* Chemistry: Trinidad HeadGOME (ERS-2) NASA P-3 Mt. Washington BoulderMoppitt (Terra) NOAA P-3 Castle Springs HuntsvilleScia. (Envisat) NOAA DC-3* Thompson Farm Wallops
DOE G1 Appledore Is.*FAAM Bae 146 Harvard Forest
NRL Twin Otter WhitefaceHarvard King Air Pico (Azores)UMD ProphetEnvCan Convair 580 Bar Harbor*DLR FalconCNRS Falcon Remote sensing:
Plymouth(*) has remote sensing capacity Pease
ConcordSable Is.
• which subset of all possible comparisons will be most useful?

Comparison primary issues
• Which comparisons of all possible will be most useful?
• Are comparisons of some species more crucial than others?
• How many flight segments should be allocated to comparisons?
• What range of what conditions are desirable for the comparisons?(i.e., pollution levels, altitude, time-of-day)
• What level of formality should be used? Data exchanges? Referees? Interactions?
• Should early preliminary comparisons guide later comparisons?
• What organizational structure is needed to do good comparisons?

Comparison details
• coordination of platforms for direct comparisons
• maximizing data coverage during comparisons
• reconciling in-situ with remotely-sensed or column data
• aerosol sampling details of RH dependence and size cuts
• comparison of satellite footprints to in-situ data
• Circulation of standards - prior to, during, and/or post-missionboth gas-phase and aerosol (size, simple composition)requires active orchestration

Comparison break-out goals
• agree on an organizational structure
• agree on the formality and data handling
• agree on overall comparison strategy
• begin the outline the most valuable comparisons
• begin to outline the desirable conditions for comparisons
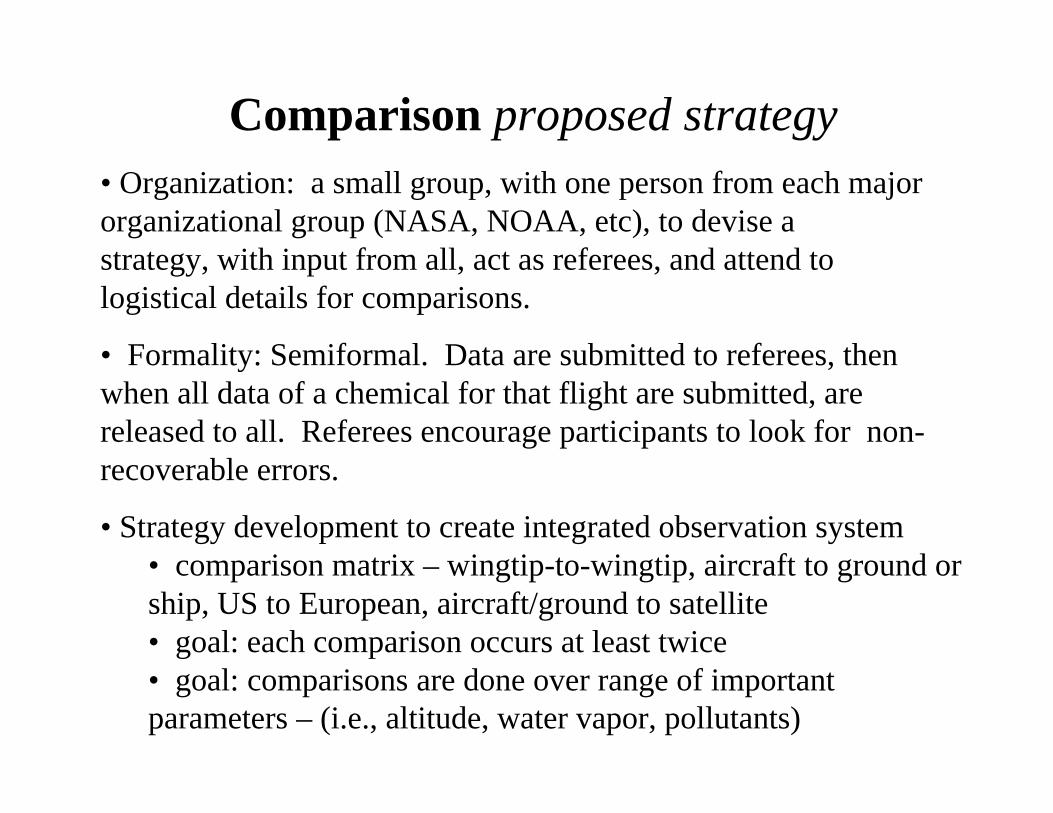
Comparison proposed strategy• Organization: a small group, with one person from each major organizational group (NASA, NOAA, etc), to devise a strategy, with input from all, act as referees, and attend to logistical details for comparisons.
• Formality: Semiformal. Data are submitted to referees, then when all data of a chemical for that flight are submitted, are released to all. Referees encourage participants to look for non-recoverable errors.
• Strategy development to create integrated observation system• comparison matrix – wingtip-to-wingtip, aircraft to ground orship, US to European, aircraft/ground to satellite• goal: each comparison occurs at least twice• goal: comparisons are done over range of important parameters – (i.e., altitude, water vapor, pollutants)
Modeling andForecasting
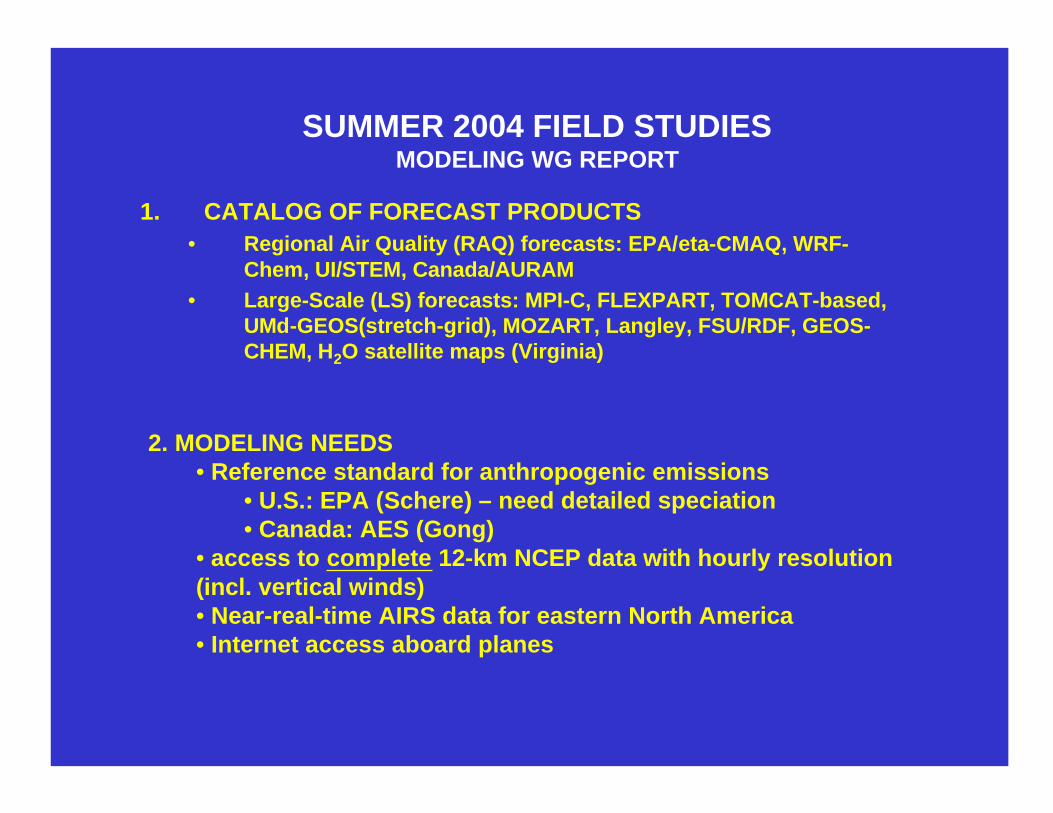
SUMMER 2004 FIELD STUDIESMODELING WG REPORT
1. CATALOG OF FORECAST PRODUCTS• Regional Air Quality (RAQ) forecasts: EPA/eta-CMAQ, WRF-
Chem, UI/STEM, Canada/AURAM
• Large-Scale (LS) forecasts: MPI-C, FLEXPART, TOMCAT-based,UMd-GEOS(stretch-grid), MOZART, Langley, FSU/RDF, GEOS-CHEM, H2O satellite maps (Virginia)
2. MODELING NEEDS• Reference standard for anthropogenic emissions
• U.S.: EPA (Schere) – need detailed speciation• Canada: AES (Gong)
• access to complete 12-km NCEP data with hourly resolution(incl. vertical winds)• Near-real-time AIRS data for eastern North America• Internet access aboard planes

SUMMER 2004 FIELD STUDIESMODELING WG REPORT (cont.)
3. EXPECTATIONS FROM THE FORECASTS• Different modes of operation for INTEX and ITCT
• ITCT: would a limited set of standard forecast productsbe useful?• INTEX: individual groups to examine their forecasts,make recommendations.
4. FORECAST EVALUATION• Formal intercomparison of RAQs – comparison variables tobe finalized• Ship, surface data – what about aircraft data? (how fast can itbe made accessible?)• Central data archive (NOAA) accessible by Science Team

SUMMER 2004 FIELD STUDIESMODELING WG REPORT (cont.)
5. ACCESS TO DATA IN FIELD• Forecast products posted on web
6. PRE-MISSION PLANNING MEETING• Hindcast simulations -> identification of ventilation/outflowpathways, coordination between aircraft, fine-tuning of flightscheduling• To involve modeling groups, mission scientists, interestedScience Team members• January 2004

InternationalCoordination

ITCT-Lagragian-2K4
An IGAC task focused on ITCT (Intercontinental Transport and Chemical Transformation)
Today Introduce (briefly):
• ITCT-Lagragian-2K4 Concept
• Constituent Field Programs
• Research Plan and Timetable
• Task Coordinators and Steering Group
• ITCT-Lagragian-2K4 Goals

ITCT-Lagragian-2K4 ConceptIn summer 2004 several North American and European agencies will conduct research programs on both sides of the Atlantic.
ITCT-Lagrangian goal: Coordinate studies to maximize the insight into ITCT
International status of IGAC provides an ideal forum for this coordination.
Approach: Create a “pseudo-Lagrangian” framework.
North Atlantic
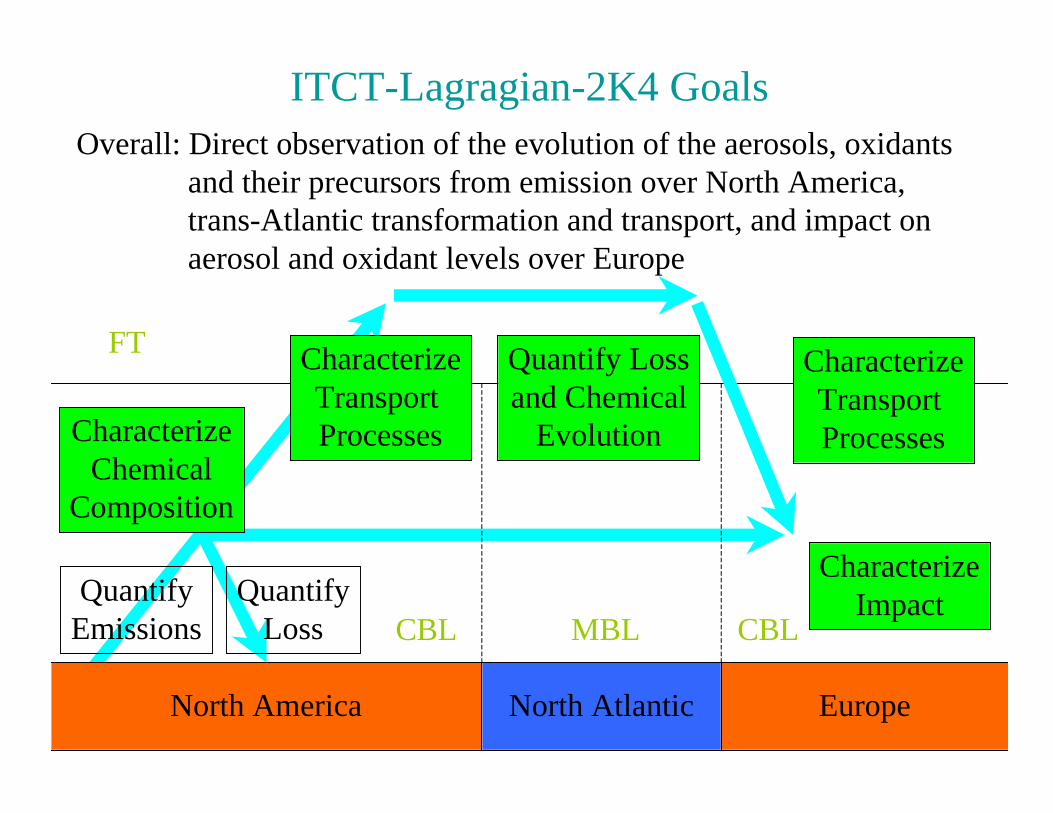
Overall: Direct observation of the evolution of the aerosols, oxidants and their precursors from emission over North America, trans-Atlantic transformation and transport, and impact on aerosol and oxidant levels over Europe
ITCT-Lagragian-2K4 Goals
North America Europe
CharacterizeChemical
Composition
QuantifyLoss
QuantifyEmissions
Quantify Lossand Chemical
Evolution
CharacterizeTransport Processes
CharacterizeImpact
MBL CBL
FTCharacterizeTransport Processes
CBL
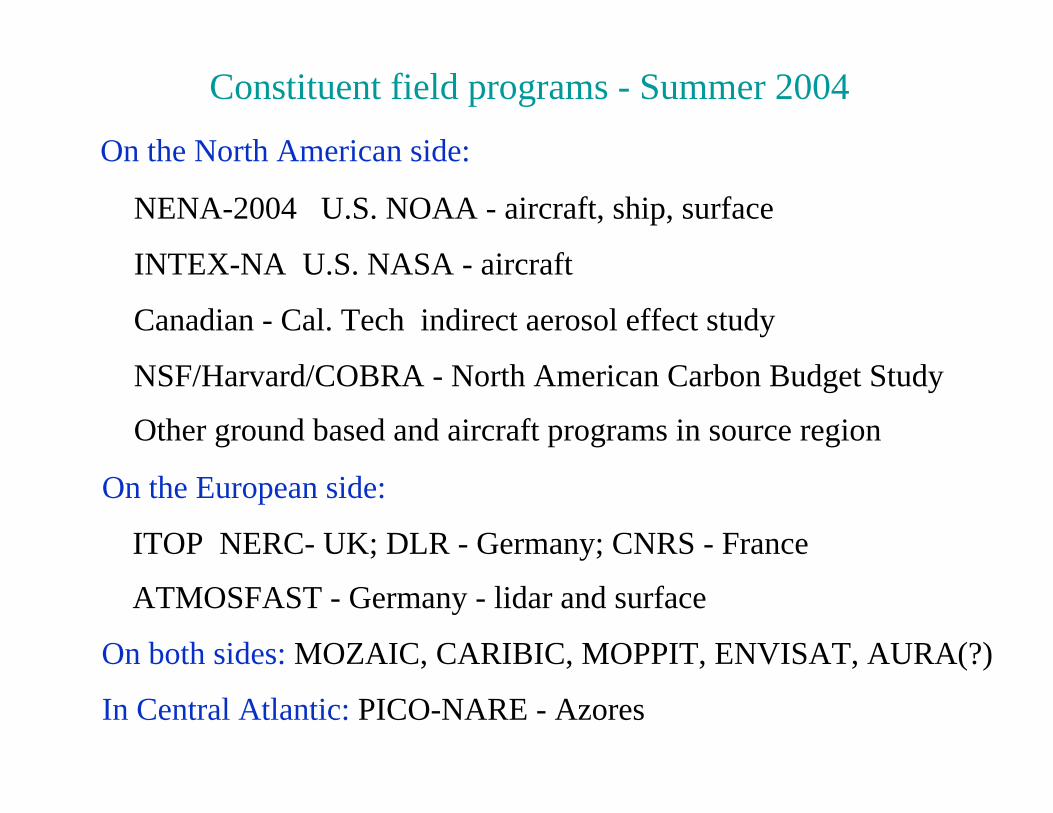
Constituent field programs - Summer 2004
NENA-2004 U.S. NOAA - aircraft, ship, surface
INTEX-NA U.S. NASA - aircraft
On the North American side:
On the European side:
ITOP NERC- UK; DLR - Germany; CNRS - France
On both sides: MOZAIC, CARIBIC, MOPPIT, ENVISAT, AURA(?)
In Central Atlantic: PICO-NARE - Azores
Canadian - Cal. Tech indirect aerosol effect study
NSF/Harvard/COBRA - North American Carbon Budget Study
ATMOSFAST - Germany - lidar and surface
Other ground based and aircraft programs in source region

ITCT-Lagragian-2K4 Science Plan
1. Retrospective Analysis of Previous Pseudo-Lagrangian Results.During the NARE 1993 and NARE 1997 studies aircraft were operated on both theNorth American and European sides of the Atlantic. Two possible psuedo-Lagrangian events have been identified. More extensive analysis of these data will beconducted, partially as a guide to the field implementation during 2004.
2. Instrument Comparison Activities. For the pseudo-Lagrangian approachto be successful, it is essential that the aircraft involved make measurements that areequivalent within quantified uncertainties. ITCT-Lagragian-2K4 will coordinatecomparison activities designed to quantify measurement uncertainty. This willestablish an objective, defensible basis upon which the pseudo-Lagrangian analysiscan be based. In effect, a unified observation system is created.• Evaluation of standards• Direct comparison of measurements• Indirect comparison of measurements
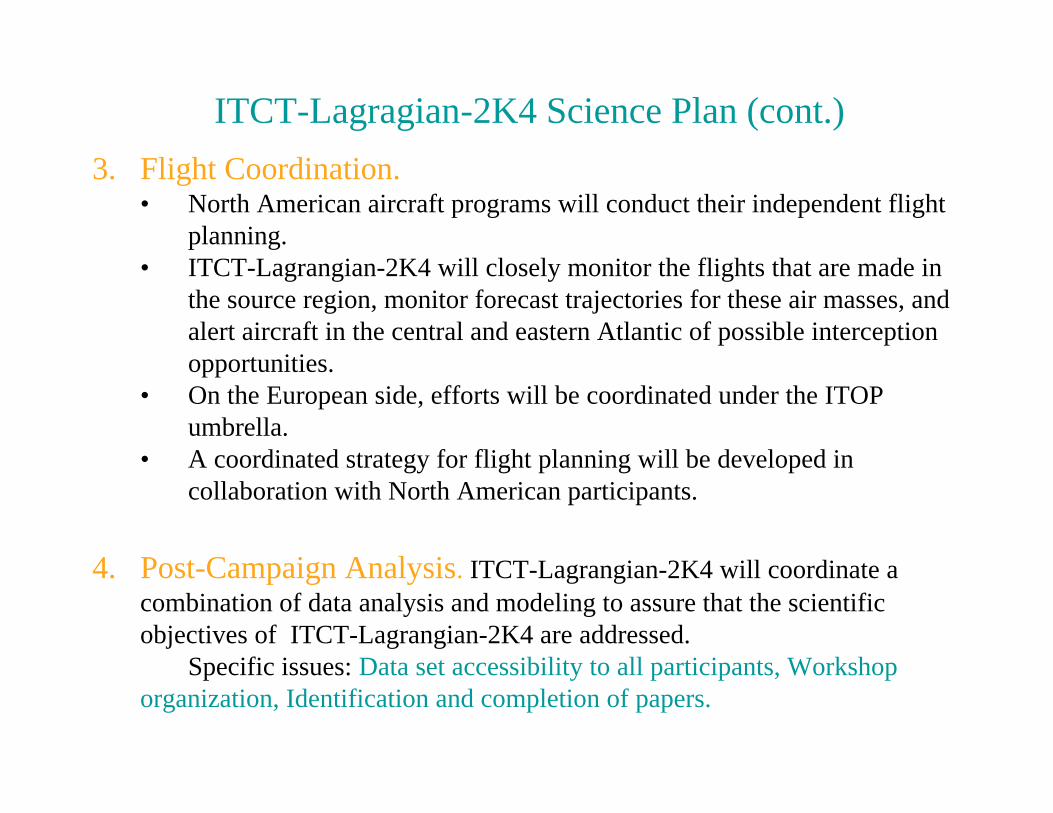
ITCT-Lagragian-2K4 Science Plan (cont.)
3. Flight Coordination.• North American aircraft programs will conduct their independent flight
planning.• ITCT-Lagrangian-2K4 will closely monitor the flights that are made in
the source region, monitor forecast trajectories for these air masses, andalert aircraft in the central and eastern Atlantic of possible interceptionopportunities.
• On the European side, efforts will be coordinated under the ITOPumbrella.
• A coordinated strategy for flight planning will be developed incollaboration with North American participants.
4. Post-Campaign Analysis. ITCT-Lagrangian-2K4 will coordinate acombination of data analysis and modeling to assure that the scientificobjectives of ITCT-Lagrangian-2K4 are addressed.
Specific issues: Data set accessibility to all participants, Workshoporganization, Identification and completion of papers.

ITCT-Lagragian-2K4 Timetable
• The planning for the study began in early 2002 and is ongoing.• Review of previous results will be completed before
field deployment.• Planning for coordinated field activities during coming year
(tools, modeling, flight strategy etc.)• Field deployment will be conducted in July and August, 2004.• Workshop(s) to discuss results and outline possible manuscripts.• Manuscripts will be submitted for publication within
18 months after the completion of the field deployment.• The completion date for the task will be at the publication of the
special journal section(s) describing the results of the study.
ITCT-Lagragian-2K4Task Coordinators and Steering Group
David Parrish (IGAC, NOAA) - U.S. Kathy Law (IGAC, CNRS) - France
Coordinators:
Steering Group:
Daniel Jacob (NASA) - U.S. Claire Reeves (ITOP) - UK Hans Schlager (DLR) - Germany Andreas Stohl (NOAA NENA - Multinational) Valerie Thouret (MOZAIC) - France