Embed Size (px)
Citation preview

Proceedings of the 27th Meeting
WORKING GROUP on PROLAMIN ANALYSIS and TOXICITY
Edited by Peter Koehler
German Research Centre for Food Chemistry, Freising
Verlag Deutsche Forschungsanstalt für Lebensmittelchemie 2014

Impressum Proceedings of the 27th Meeting
WORKING GROUP
on PROLAMIN ANALYSIS and TOXICITY
October 10 - 12, 2013 Darmstadt, Germany
This work including all parts is subject to copyright. All rights are reserved and any
utilisation is only permitted under the provisions of the German Copyright Law. Permissions for use must always be obtained from the publisher. This is in particular
valid for reproduction, translation, conversion to microfilm and for storage or processing in electronic systems.
Scientific Organisation Prof. Dr. Peter Koehler
Deutsche Forschungsanstalt für Lebensmittelchemie Lise-Meitner-Str. 34, 85354 FREISING, GERMANY
Phone: +49 8161 712928; Fax: +49 8161 712970 Email: [email protected]
Host
Dr. Sigrid Haas-Lauterbach R-Biopharm AG
An der neuen Bergstraße 17, 64297 DARMSTADT, GERMANY Phone: +49 6151 81023; Fax: +49 6151 810240
[email protected] / www.r-biopharm.com/
Cover picture and picture of participants Thomas Mothes
© Verlag Deutsche Forschungsanstalt für Lebensmittelchemie (DFA) Lise-Meitner-Strasse 34, 85354 Freising
Phone: +49 8161 712928; Fax: +49 8161 712970 dfa@lrz. tum.de / www.dfal.de
ISBN: 978-3-938896-78-5

Preface
The 27th meeting of the Working Group on Prolamin Analysis and Toxicity (PWG) took place in Darmstadt, Germany, from 10th to 12th October, 2013. The PWG was hosted by R-Biopharm AG with Sigrid Haas-Lauterbach and Stella Lindeke as main organisers who were present throughout the meeting. They were assisted by Judith Glöggler of the German Coeliac Society (DZG) who managed the registration of the participants. Apart from the group members the audience comprised invited speakers as well as guests from academia, industry, and international coeliac societies. Representatives from cereal starch producers, producers of gluten-free foods, as well as manufacturers of kits for gluten analysis and of kits for antibody tests in the serology of coeliac disease participated from industry.
The 2013 meeting focused on the new guidelines of the European Society for Paediatric Gastroenterology, Hepatology and Nutrition (ESPGHAN) for the diagnosis of coeliac disease. A symposium with presentations looking at the issue from different perspectives was organised. The analytical session was a broad selection of topics covering all aspects of gluten analysis and toxicity. The clinical session was a selection of aspects starting with T cell receptors in coeliac disease and ending with new mouse intestinal models for the evaluation of toxic effects of gluten and cereal proteins.
I am grateful to all participants for their active contributions as presenters as well as during the discussions. This made the 2013 meeting a great success. I would like to express my special thanks to Sigrid Haas-Lauterbach and Stella Lindeke for being perfect hosts as well as to Judith Glöggler of DZG for her professional help in the organisation of the meeting. Special thanks go to Thomas Mothes for his flexibility in replacing a speaker who was not able to make it to the meeting and to Katharina Konitzer for her invaluable help in editing the contributions of this book. Finally, I express my gratitude to all friends, colleagues, sponsors and participants for their inspiration and continuing support of the PWG.
Freising, April 2014 Peter Koehler


Table of contents 5
Table of Contents
1 Executive Summary ............................................................................................... 7
2 List of Participants ................................................................................................. 9
3 Programme ........................................................................................................... 15
4 Analytical research reports ................................................................................... 17
4.1 Collaborative study on the immunochemical determination of intact gluten in rice flour and rice based products by G12 sandwich ELISA - progress report ... 17 Clyde Don, Elisabeth Halbmayr-Jech, Adrian Rogers, Peter Koehler
4.2 Quantitation of gluten in wheat starch by gel permeation chromatography with fluorescence detection .................................................................................. 23 Katharina Konitzer, Herbert Wieser, Peter Koehler
4.3 Comparison of extraction methods for gluten analysis ........................................ 29 Thomas Weiss, Christian Gößwein, Tina Dubois, Ulrike Immer
4.4 The oats mystery - Are they gluten free? ............................................................. 37 Elisabeth Halbmayr-Jech, Lukas Frank, Adrian Rogers, Michael Prinster
4.5 Quantitation of coeliac toxicity in wheat using genomics and proteomics ......... 45 Luud J.W.J. Gilissen, Elma M.J. Salentijn, Hetty C. van den Broeck, Jan H.G. Cordewener, Twan H.P. America, Jan G. Schaart, Ingrid M. van der Meer, Marinus J.M. Smulder
4.6 Estimated quantities of gluten peptides arriving at the intestinal brushborder .... 53 Katharina Konitzer, Herbert Wieser, Peter Koehler
4.7 Studies on the degradation of gluten with peptidases from different sources ..... 59 Theresa Walter, Herbert Wieser, Peter Koehler
5 Clinical research reports ....................................................................................... 63
5.1 Biased T cell receptor usage in coeliac disease ................................................... 63 Frits Koning
5.2 Differential expression of Fatty Acid Binding Proteins (FABPs) in coeliac disease .................................................................................................. 67 Marina Garcia, Natalia Bottasso-Arias, Constanza Bondar, Betina Corsico, Fernando Chirdo

6 Table of contents
5.3 Potential role for intestinal myofibroblasts in coeliac disease ............................. 73 Jean Dunne, James de Boisanger, Sarah Cooper, Louise Elliott, Greg Byrne, Conleth Feighery
5.4 Gluten challenge in coeliac disease and non-coeliac gluten sensitivity .............. 79 Margit Brottveit, Knut E.A. Lundin
5.5 Alpha-Amylase/Trypsin Inhibitors elicit innate immune activation in murine and human intestinal tissue explants .................................................................... 85 Victor Zevallos, Peter Olinga, Phan Bao Tung, Detlef Schuppan
6 New guidelines of the ESPGHAN for the diagnosis of coeliac disease .............. 89
6.1 Defining thresholds of antibody levels for the diagnosis of coeliac disease ....... 89 Thomas Mothes, Johannes Wolf
6.2 A critical appraisal of the ESPGHAN guidelines for the diagnosis of coeliac disease ...................................................................................................... 93 Martin Stern
6.3 ESPGHAN Guidelines - A gastroenterologists's view ........................................ 99 Paul Ciclitira, Ikram Nasr
6.4 Evaluation of serology in coeliac disease .......................................................... 103 Johannes Wolf, David Petroff, Dirk Hasenclever, Thomas Mothes
7 Statements by participating organisations, representatives from industry and guests ............................................................................................. 107
7.1 Call for experts in order to set an Expert Working Group on Wheat Quality under the International Wheat Iniative ............................................................... 107 Angela Juhasz, W. John Rogers, Gerard Branlard, Tatsuya M. Ikeda
8 Perspectives and action plan of the PWG .......................................................... 111 Peter Koehler

1 Executive Summary 7
1 Executive Summary
The meeting focused on the new guidelines of the ESPGHAN for the diagnosis of coeliac disease. Beside this, quantitative gluten analysis by immunological and instrumental methods was covered. Novel aspects of the biochemistry and pathophysiology of coeliac disease were addressed in the clinical session.
Analytical reports
Eight analytical research reports were presented. Three of them focused on immunochemical methods for the quantitation of gluten and two looked at chromatographic and mass-spectrometric methods. Two presentations described the use of prolyl endopeptidases for gluten degradation in foods and as oral therapy of coeliac disease. Finally, one presentation considered quantitative aspects of gluten digestion by looking at theoretical quantities of coeliac-active peptides arriving in the small intestine.
Clinical reports
Seven clinical reports dealt with diverse topics such as T cell receptors, fatty acid binding proteins, gluten and non-gluten proteins in coeliac disease and related conditions as well as on mouse models for the evaluation of toxicity in coeliac disease. The symposium covered all aspects of the new guidelines of the ESPGHAN for the diagnosis of coeliac disease. Lively discussions evolved showing the importance of this topic in the field of coeliac disease.
Other statements
A statement from the Expert Working Group on Wheat Quality under the International Wheat Initiative was given. This initiative is looking for experts in the field of wheat intolerances. The PWG and PWG group members were invited to participate in this initiative.

27th
Mee
ting
Wor
king
Gro
up o
n P
rola
min
Ana
lysi
s an
d T
oxic
ity
(PW
G),
Dar
mst
adt,
Ger
man
y O
ktob
er 1
0 –
12, 2
013

2 List of Participants 9
2 List of Participants
GROUP MEMBERS
Prof. Dr. Carlo Catassi (not attending) Università Politecnica delle Marche Facoltà di Medicina e Chirurgia Istituto di Clinica Pediatrica Via Corridoni 11 60123 ANCONA, ITALY Phone: +39 349 2235 447 Fax: +39 071 36281 Email: [email protected]
Prof. Dr. Fernando G. Chirdo Laboratorio de Investigación en el Sistemma Immune (LISIN) Facultad de Ciencias Exactas Universidad Nacional de La Plata cc 711 (1900) LA PLATA, ARGENTINA Phone: +54 221 421 0 497, 423 0121, 423 5 333 (Int 45) Fax: +54 221 422 6947 Email: [email protected]
Prof. Dr. Paul J. Ciclitira King´s College London (Division of Diabetes and Nutritional Sciences) The Rayne Institute (KCL) St Thomas´ Hospital Westminster Bridge Road LONDON SE1 7EH, UK/ENGLAND Phone: +44 207 620 2597; 207 188 2494 Fax: +44 207 261 0667 Email: [email protected] (secretary) Email: [email protected]
Prof. Dr. Conleth Feighery, MD University of Dublin Department of Immunology, St. James´s Hospital James´s Street DUBLIN 8, IRELAND Phone: +353 1 896 3432 Fax: +353 1 454 5609 Email: [email protected]
Dr. Luud Gilissen Plant Research International (PRI) Wageningen University Droevendaalsesteeg 1 6708 PB WAGENINGEN THE NETHERLANDS Phone: +31 317 480983 Fax: +31 317 418094 Email: [email protected]
Prof. Dr. Peter Koehler Deutsche Forschungsanstalt für Lebensmittelchemie Lise-Meitner-Straße 34 85354 FREISING, GERMANY Phone: +49 8161 712928 Fax: +49 8161 712970 Email: [email protected]
Prof. Dr. Frits Koning Leiden University Medical Centre, E3-Q Department of Immunohaematology and Bloodbank Albinusdreef 2 2333 ZA LEIDEN, THE NETHERLANDS Phone: +31 715 266673 Fax: +31 715 265267 Email: [email protected]

10 2 List of Paritcipants
Prof. Dr. Knut Lundin Oslo Universitetssykehus HF Rikshospitalet Postboks 495 N-0424 OSLO, NORWAY Phone: + 47 909 80325 Fax: +47 2307 2410 Email: [email protected]
Prof. Dr. Thomas Mothes Universitätsklinikum Leipzig A.ö.R. Institut für Laboratoriumsmedizin, Klinische Chemie und Molekulare Diagnostik Liebigstraße 27 04103 LEIPZIG, GERMANY Phone: +49 341 97 22251 Fax: +49 341 97 22379 Email: [email protected]
Prof. Dr. Dr. Detlef Schuppan I. Medizinische Klinik und Poliklinik Universitätsmedizin der Johannes Gutenberg-Universität Mainz Institut für Translationale Medizin Langenbeckstraße 1 55131 MAINZ, GERMANY Phone: +49 6131 177355/ 177356/177104 Fax: +49 6131 177357 Email: [email protected]
Prof. Dr. Martin Stern Universitätsklinik für Kinder- und Jugendmedizin Hoppe-Seyler-Straße 1 72076 TÜBINGEN, GERMANY Phone: +49 7071 2983781 Fax: +49 7071 295477 Email: [email protected]
Prof. Dr. Riccardo Troncone (not attending) Department of Pediatrics and European Laboratory for the Investigation of Food-Induced Diseases University of Naples “Federico II” Via Pansini, 5 80131 NAPLES, ITALY Phone: +39 081 7463383 Fax: +39 081 5469811 Email: [email protected]
Dr. Renate van Eckert (not attending) Victoria University of Wellington Centre of Biodiscovery and School of Biological Sciences P.O. Box 600 WELLINGTON, NEW ZEALAND Phone: +64 4 463 6092 Fax: +64 4 463 5331 Email: [email protected]
HOSTS
Dr. Sigrid Haas-Lauterbach R-Biopharm AG An der neuen Bergstrasse 17 64297 DARMSTADT, GERMANY Phone: +49 6151 810225 Fax: +49 6151 810240 Email: [email protected]
Mrs. Stella Lindeke R-Biopharm AG An der neuen Bergstraße 17 64297 DARMSTADT, GERMANY Phone: +49 6151 810292 Fax: +49 6151 810240 Email: [email protected]

2 List of Participants 11
INVITED SPEAKER
Prof. Dr. Steffen Husby (not attending) Hans Christian Andersen Children´s Hospital Odense C DK-5000 ODENSE, DENMARK Phone: +45 65 412090 Fax: +45 65 911862 Email: [email protected]
GUESTS
Mr. Gunnar Adas Fria Gluten Free Fältspatsgatan 12 42130 VÄSTRA FRÖLUNDA, SWEDEN Phone: +46 708684852 Fax: +46 317341335 Email: [email protected]
Mrs. Sofia Beisel Deutsche Zöliakie Gesellschaft eV Kupferstr 36 70565 STUTTGART, GERMANY Phone: +49 711 45998115 Fax: 49 711 45998150 Email: [email protected]
Mrs. Ilona Bruins Slot RIKILT Wageningen UR Institute of Food Safety Akkermaalsbos 2 6708 WB WAGENINGEN THE NETHERLANDS Phone: +31 317 481657 Email: [email protected]
Dr. Johan De Meester Cargill R&D Centre Europe Havenstraat 84 B-1800 VILVOORDE, BELGIUM Phone: +32 2257 0733 Fax: +32 2257 0675 Email: [email protected]
Mrs. Hertha Deutsch AOECS - Association of European Coeliac Societies Codex and Regulatory Affairs Anton Baumgartner Straße 44/C5/2302 1230 VIENNA, AUSTRIA Phone: +43 166 71887 Fax: +43 166 71887 Email: [email protected]
Mr. Elias Diaz Ramiro Instituto Nacional des Consumo Centro de Investiagción y Control de la Calidad Avenida Cantabria, 52 28042 MADRID, SPAIN Phone: +34 918224744 Email: [email protected]
Dr. Clyde Don Foodphysica Vogelwikke 12 6665 HP DRIEL, THE NETHERLANDS Phone: +31 622 543047 Email: [email protected]
Dr. Jean Dunne University of Dublin Department of Immunology, St. James´s Hospital James´s Street DUBLIN 8, IRELAND Phone: +353 1 416 2921 Fax: +353 1 454 5609 Email: [email protected]

12 2 List of Paritcipants
Mr. Lukas Frank Romer Labs Divison Holding GmbH Technopark 1 3430 TULLN, AUSTRIA Tel: +43 2272 615 3310 Fax: +43 2272 615 3313111 Email: [email protected]
Mr. Christian Gösswein R-Biopharm AG An der neuen Bergstrasse 17 64297 DARMSTADT, GERMANY Phone: +49 6151 810238 Fax: +49 6151 8102734 Email: [email protected]
Dr. Thomas Grace CEO Bia Diagnostics 294 N. Winooski Ave, Ste 116A VT 05401 BURLINGTON, USA Phone: +1 802 5400148 Fax: +1 802 5400147 Email: [email protected]
Mrs. Robin Grace CEO Bia Diagnostics 294 N. Winooski Ave, Ste 116A VT 05401 BURLINGTON, USA
Mrs. Gertrud Granel Association of German Cereal Proces- sors and Starch Producers (VDGS) Johannesstraße 37 53225 BONN, GERMANY Phone: +49 30 8871 3398 15 Fax: +49 30 8871 3398 19 Email: [email protected]
Mrs. Elisabeth Halbmayr-Jech ROMER Labs Division Holding GmbH Technopark 1 3430 TULLN, AUSTRIA Phone: +43 2272 615 3310 Fax: +43 2272 615 3313111 [email protected]
Dr. Ulrike Immer R-Biopharm AG An der neuen Bergstrasse 17 64297 DARMSTADT, GERMANY Phone: +49 6151 810238 Fax: +49 6151 8102734 Email: [email protected]
Dr. Angéla Juhász Department of Applied Genomics Agricultural Institute Centre for Agricultural Science HAS H-2462 MARTONVASAR, HUNGARY Phone: +36 225 69531 Fax: +36 225 69514 Email: [email protected]
Mrs. Verena Kirste Working Group Prof. Dr. Schuppan Weidachweg 88/4 89081 ULM, GERMANY Phone: +49 176 78348760 Email: [email protected]
Mrs. Katharina Konitzer Deutsche Forschungsanstalt für Lebensmittelchemie Lise Meitner-Strasse 34 85354 FREISING, GERMANY Phone: +49 8161712927 Fax: +49 8161712970 Email: [email protected]
Dr. Götz Kröner Hermann Kröner GmbH & Co KG Lengericher Str. 158 49479 IBBENBÜREN, GERMANY Phone: +49 5451 944711 Fax: +49 5451 9447811 Email: [email protected]

2 List of Participants 13
Dr. Luisa Novellino Associazione Italiana Celiachia Via Caffaro, 10 16124 GENOVA, ITALY Phone: +39 010 3012747 Fax: +39 010 8449404 Email: [email protected]
Mrs. Ombretta Polenghi Ombretta Polenghi Dr. Schär R&D Centre c/o AREA Science Park Padriciano, 99 I-34149 TRIESTE, ITALY Phone: +39 040 3755 382 Fax: +39 040 3755 385 Email: [email protected]
Prof. Dr. Roland Poms International Association for Cereal Science and Technology and MoniQA Association Marxergasse 2 1030 VIENNA, AUSTRIA Phone: +43 170 772020 Fax: +43 170 772040 Email: [email protected]
Mrs. Catherine Remillieux-Rast Association Française des Intolérants au Gluten (AFDIAG) Rue de Venise 23 78740 VAUX-SUR-SEINE, FRANCE Phone: +33 681270911 Fax: +33 130993668 Email: [email protected]
Dr. Adrian Rogers Romer Labs UK Ltd. The Health Gbusiness and Technical Park WA74QX RUNCORN, CHESHIRE, UK Phone: +44 845519 0510 Email: [email protected]
Mr. Nermin Sajic EuroProxima B.V. Beijerinckweg 18 6827 BN ARNHEM, THE NETHERLANDS Phone: +31 26 3630364 Fax: +31 263645111 Email: [email protected]
Dr. Martin Salden EuroProxima B.V. Beijerinckweg 18 6827 BN ARNHEM, THE NETHERLANDS Phone: +31 26 3630364 Fax: +31 263645111 Email: [email protected]
Dr. Juan Ignacio Serrano-Vela Asociacion de Celiacos de Madrid Calle Lanuza 19-bajo 28028 MADRID, SPAIN Phone: +34 690202696 Fax: +34 917258059 Email: [email protected]
Mrs. Susanne Siebeneicher R-Biopharm AG An der neuen Bergstraße 17 64297 DARMSTADT, GERMANY Phone: +49 6151 8102875 Fax: +49 6151 8102734 Email: [email protected]
Dr. Tuula Sontag-Strohm Department of Food and Environmental Sciences University of Helsinki Agnes Sjöbergin katu 2 P.O. Box 66 FIN-00014, HELSINKI, FINLAND Phone: 358 9 19158230 Fax: +358 9 191 58475 Email: [email protected]

14 2 List of Paritcipants
Dr. Bharani Srinivasan Institute for Pathophysiology and Allergy Research Medical University of Vienna Währinger Gürtel 18-20 01090 VIENNA, AUSTRIA Phone: +43 1404005111 Email: bharani.srinivasan@ meduniwien.ac.at
Mrs. Pauline Titchener Neogen Europe ltd The Dairy School, Auchincruive KA6 5HW AYR, SCOTLAND, UK Phone: +44 1292 525 610 Fax: +44 1292 525 602 Email: [email protected]
Dr. Sandor Tömösközi Budapest University of Technology and Economics Szent Gellért tér 4 1111 BUDAPEST, HUNGARY Phone: +36 1 4631419 Fax: +36 1 4633855 Email: [email protected]
Prof. Dr. Franz Ulberth European Commission Joint Research Centre -IRMM Retieseweg, 111 B-2440 GEEL, BELGIUM Phone: +32 14 571 316 Fax: +32 14 571 7 87 Email: [email protected]
Mrs. Theresa Walter Deutsche Forschungsanstalt für Lebensmittelchemie Lise-Meitner-Str. 34 85354 FREISING, GERMANY Phone: +49 8161 9868430 Fax: +49 8161 712970 Email: [email protected]
Dr. Thomas Weiss R-Biopharm AG An der neuen Bergstrasse 17 64297 DARMSTADT, GERMANY Phone: +49 6151 8102 186 Fax: +49 6151 8102734 Email: [email protected]
Mrs. Maren Wiese Hermann Kröner GmbH & Co KG Lengericher Str. 158 49479 IBBENBÜREN, GERMANY Phone: +49 5451 944712 Fax: +49 5451 9447812 Email: [email protected]
Mr. Johannes Wolf Universitätsklinikum Leipzig A.ö.R. Institut für Laboratoriumsmedizin, Klinische Chemie und Molekulare Diagnostik Liebigstraße 27 04103 LEIPZIG, GERMANY Phone: +49 341 97 22251 Fax: +49 341 97 22379 Email: [email protected]
Dr. Victor Zevallos I. Medizinische Klinik und Poliklinik Universitätsmedizin der Johannes Gutenberg-Universität Mainz Institut für Translationale Medizin Langenbeckstraße 1 55131 MAINZ, GERMANY Phone: +49 6131 177355 Fax: +49 6131 177357 Email: [email protected]

3 Programme 15
3 Programme
THURSDAY, October 10, 2013
20:00 Arrival of Prolamin Group and all participants Informal get-together Welcome by Sigrid Haas-Lauterbach (R-Biopharm) Location: Restaurant CALLA, Darmstadt
FRIDAY, October 11, 2013
09:00 Opening of the meeting (Peter Koehler)
SYMPOSIUM
New guidelines of the ESPGHAN for the diagnosis of coeliac disease
(Chair: Prof. Dr. Detlef Schuppan, Mainz, Germany)
09:15 Defining Thresholds of Antibody Levels for the Diagnosis of Coeliac Disease(Prof. Dr. Thomas Mothes, Leipzig, Germany)
10:05 A Critical Appraisal of the ESPGHAN Guidelines for the Diagnosis of Coeliac Disease (Prof. Dr. Martin Stern, Tübingen, Germany)
10:30 ESPGHAN Guidelines – A Gastroenterologist’s View (Prof. Dr. Paul Ciclitira, London, U.K.)
11:00 Evaluation of Serology in Coeliac Disease (Prof. Dr. Thomas Mothes, Leipzig, Germany)
11:30 Coffee break
12:00 THE PROLAMIN WORKING GROUP RESEARCH REPORTS
Analytical reports (Chirdo, Ciclitira, Feighery, Gilissen, Koehler, Koning, Lundin, Mothes, Schuppan, van Eckert; guests)
13:15 Lunch
14:15 THE PROLAMIN WORKING GROUP RESEARCH REPORTS
Analytical reports (continued)
16:00 Coffee break
16:30 THE PROLAMIN WORKING GROUP EXECUTIVE MEETING (members only)
20:00 Joint dinner of all participants Location: Darmstädter Ratskeller, Marktplatz 8, 64283 Darmstadt
16 3 Programme
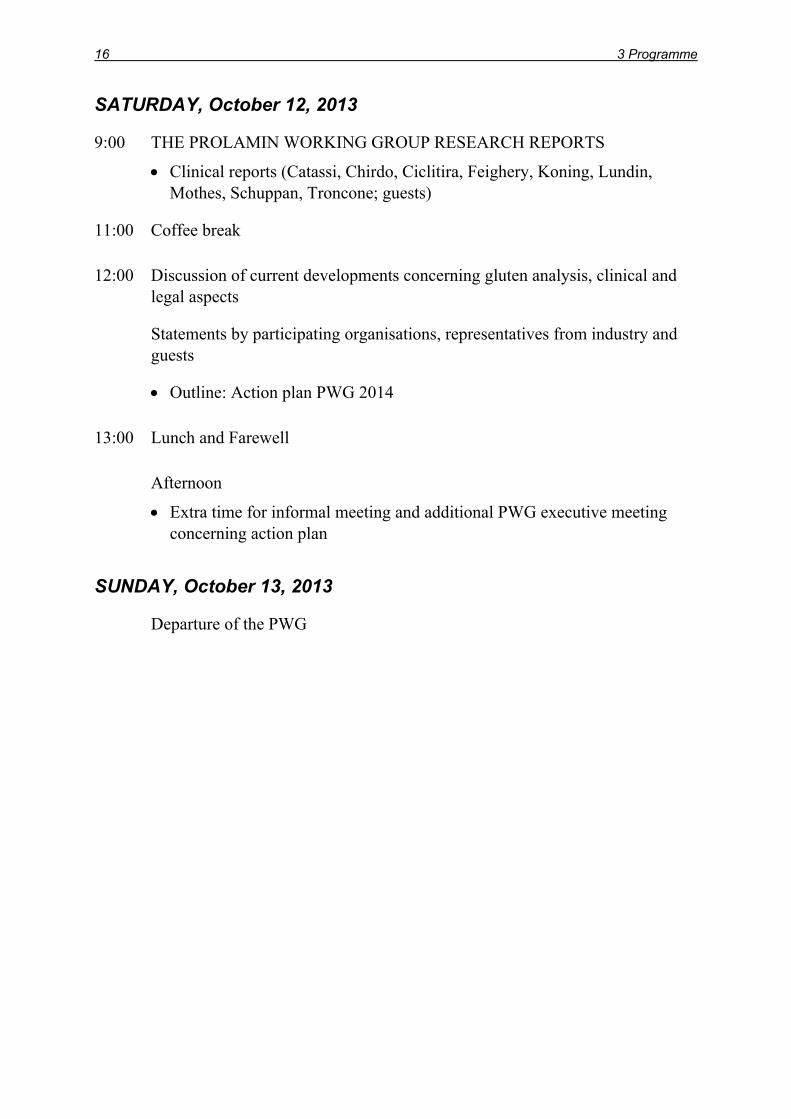
SATURDAY, October 12, 2013
9:00 THE PROLAMIN WORKING GROUP RESEARCH REPORTS
Clinical reports (Catassi, Chirdo, Ciclitira, Feighery, Koning, Lundin, Mothes, Schuppan, Troncone; guests)
11:00 Coffee break
12:00 Discussion of current developments concerning gluten analysis, clinical and legal aspects
Statements by participating organisations, representatives from industry and guests
Outline: Action plan PWG 2014
13:00 Lunch and Farewell
Afternoon
Extra time for informal meeting and additional PWG executive meeting concerning action plan
SUNDAY, October 13, 2013
Departure of the PWG
4 Analytical research reports 17
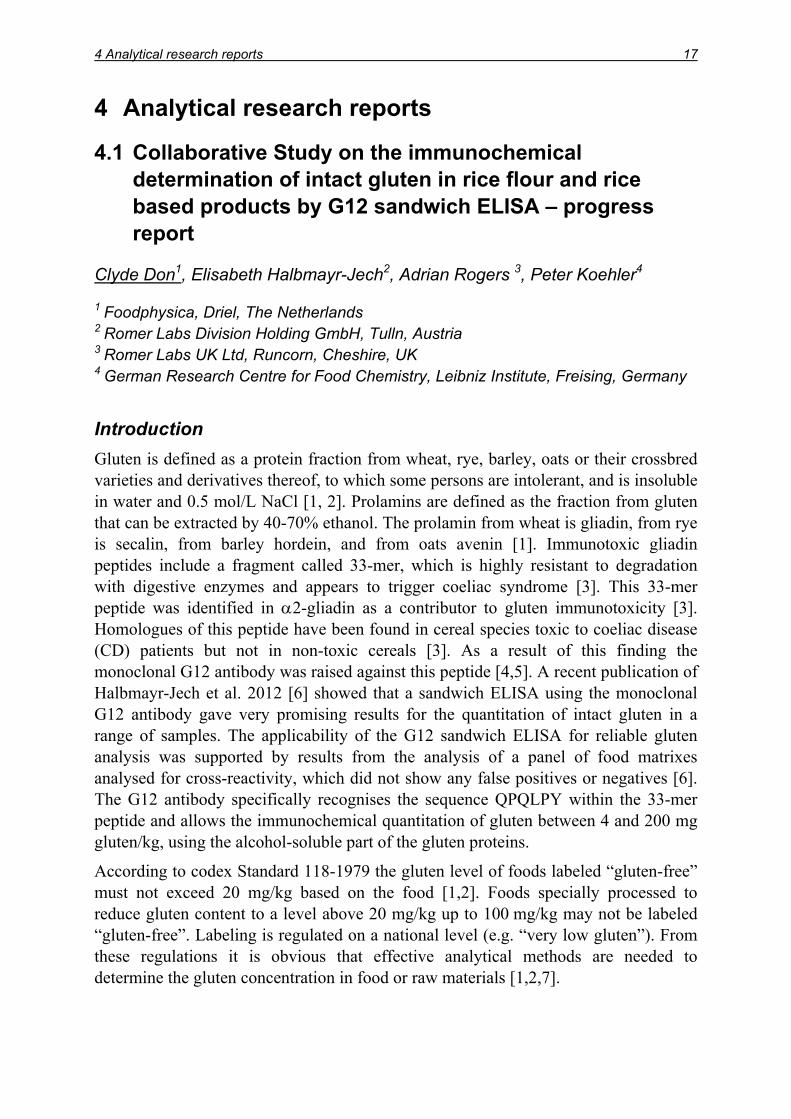
4 Analytical research reports
4.1 Collaborative Study on the immunochemical determination of intact gluten in rice flour and rice based products by G12 sandwich ELISA – progress report
Clyde Don1, Elisabeth Halbmayr-Jech2, Adrian Rogers 3, Peter Koehler4
1 Foodphysica, Driel, The Netherlands 2 Romer Labs Division Holding GmbH, Tulln, Austria 3 Romer Labs UK Ltd, Runcorn, Cheshire, UK 4 German Research Centre for Food Chemistry, Leibniz Institute, Freising, Germany
Introduction
Gluten is defined as a protein fraction from wheat, rye, barley, oats or their crossbred varieties and derivatives thereof, to which some persons are intolerant, and is insoluble in water and 0.5 mol/L NaCl [1, 2]. Prolamins are defined as the fraction from gluten that can be extracted by 40-70% ethanol. The prolamin from wheat is gliadin, from rye is secalin, from barley hordein, and from oats avenin [1]. Immunotoxic gliadin peptides include a fragment called 33-mer, which is highly resistant to degradation with digestive enzymes and appears to trigger coeliac syndrome [3]. This 33-mer peptide was identified in 2-gliadin as a contributor to gluten immunotoxicity [3]. Homologues of this peptide have been found in cereal species toxic to coeliac disease (CD) patients but not in non-toxic cereals [3]. As a result of this finding the monoclonal G12 antibody was raised against this peptide [4,5]. A recent publication of Halbmayr-Jech et al. 2012 [6] showed that a sandwich ELISA using the monoclonal G12 antibody gave very promising results for the quantitation of intact gluten in a range of samples. The applicability of the G12 sandwich ELISA for reliable gluten analysis was supported by results from the analysis of a panel of food matrixes analysed for cross-reactivity, which did not show any false positives or negatives [6]. The G12 antibody specifically recognises the sequence QPQLPY within the 33-mer peptide and allows the immunochemical quantitation of gluten between 4 and 200 mg gluten/kg, using the alcohol-soluble part of the gluten proteins.
According to codex Standard 118-1979 the gluten level of foods labeled “gluten-free” must not exceed 20 mg/kg based on the food [1,2]. Foods specially processed to reduce gluten content to a level above 20 mg/kg up to 100 mg/kg may not be labeled “gluten-free”. Labeling is regulated on a national level (e.g. “very low gluten”). From these regulations it is obvious that effective analytical methods are needed to determine the gluten concentration in food or raw materials [1,2,7].

18 Collaborative study on the immunochemical determination of intact gluten
The Codex Standard 118-1979 [1] gives criteria that methods for gluten quantitation have to fulfil. Key elements are that (1) the method is an immunochemical method or a non-immunochemical method with equal specificity and sensitivity, and that (2) the limit of detection is 10 mg/kg or below. This means that immunochemical methods [8] meeting these requirements comply with the Codex Standard 118-1979. Further guidance for ELISA methods for gluten/allergen quantitation, e.g. recovery ranges, is given by Abbott et al. [9] and Koerner et al. [10].
Therefore, the aim of this study was to show the suitablility of the G12 sandwich ELISA for reliable gluten quantitation in cereal products by means of an international collaborative study, which was carried out by the PWG in close collaboration with the Protein & Enzymes Technical Committee of AACC International. This progress report shows the results obtained at the time of the 2013 PWG Meeting. It is planned to get the method accepted as an AACC International and an AOACI approved method.
Materials and methods
The twelve samples shown in Table 1 were prepared for the collaborative study. All ingredients except wheat flour were confirmed to be free of gluten contamination before use by means of the G12 sandwich ELISA, which was also used in this collaborative study.
Table 1. Samples prepared for the collaborative study using the G12 antibody.
No. Sample No Sample 1 Gluten-free rice flour 7 Chocolate cake, 20 mg gluten/kg 2 Rice flour, 10 mg gluten/kg 8 Chocolate cake, 100 mg gluten/kg 3 Rice flour, 20 mg gluten/kg 9 Crisp bread, 4.5 mg gluten/kg* 4 Rice flour, 100 mg gluten/kg 10 Crisp bread, 15 mg gluten/kg* 5 Gluten-free chocolate cake 11 Crisp bread, 24 mg gluten/kg* 6 Chocolate cake, 10 mg gluten/kg 12 Crisp bread, 102 mg gluten/kg*
* a small gluten contamination was present in the crisp bread. Initial target concentrations had been 0, 10, 20, 100 mg/kg
ELISA Kit, Excel calculator and participating laboratories
The G12 Sandwich ELISA kit (AgraQuant Gluten G12 COKAL0200) for the quantitation of gluten in raw and processed food typically contained a 96 well G12 antibody-coated break apart micro well plate, five ready-to-use gluten standards prepared from vital wheat gluten (ex. Roquette) at 0, 4, 20, 80 and 200 mg/kg concentrations, G12 antibody conjugate, substrate solution, stop solution, concentrated diluent buffer, concentrated wash solution, ready-to-use extraction solution, a sachet of powdered fish gelatin, a certificate of analysis and kit instructions.
To calculate the gluten concentration (mg/kg) from the optical density (OD) of the assay a calibration of the response versus a set of calibrators with known amounts of gluten (0, 4, 20, 80, 200 mg/kg) was used. The calibration model used a simple linear

4 Analytical research reports 19
point-to-point curve fit. With this calibration the Excel calculator sheet provided with the method, reported the gluten content of the analysed sample. The conversion of prolamin to gluten (gluten = 2 x prolamin) was already included in the calculation.
All laboratories were required to be familiar with immunological tests, and if possible, with the G12 Gluten ELISA. They were advised to use a separate test room for the collaborative study due to the low detection limit and the possibility of contamination. A pre-collaborative study with four laboratories within Europe was completed before the full collaborative study to check the samples, test requirements, documentation and to identify critical points. Encouraging results were obtained in the pre-study, only minor changes of the study design were required, and the full collaborative study went on as scheduled. The time period was six weeks to perform the analyses (29th of July till 9th of September 2013). Twenty one laboratories designated A to U were selected, representing various countries such as Australia, Austria, Canada, Germany, Hungary, New Zealand, Spain, UK, and USA.
Results and discussion
Twenty one laboratories received a package with the G12 test-kit, samples, method protocol, and result sheet. One laboratory did not return a result sheet, and two laboratories returned result sheets that could not be used. This was due to calibration mistakes (high coefficient of variation (CV) in calibration duplicates) combined with reporting for example data below the limit of detection (LOD) for samples with a known content of 100 mg gluten/kg and/or incomplete result sheets. The Excel calculator sheet reported the negative samples as < LOD. For some laboratories the negative result was calculated by a linear back-extrapolation method using a linear regression curve fit for lower calibrators (0, 4, 20 mg/kg). Outliers were identified by using the Cochran and the Grubbs tests according to AOAC guidelines [11]. After removal of the outliers the statistical performance was calculated. The summarised data is shown in Table 2.
According to Abbott et al. [9] recoveries between 80 and 120% are ideal for ELISA methods. Recoveries in a range between 50 and 150% are acceptable for incurred samples and/or difficult matrices. For the present study, a recovery range of 101 - 135% (lowest - highest), was calculated for the spiked rice flour and the recovery for the rice based crisp bread was 91 - 111%. For low levels of spiked gluten (10 mg/kg) the G12 method is sensitive to a gluten spike (~130% recovery). With the gluten incurred chocolate cake the recovery was 62% - 66%. This is at the lower side of the acceptable recovery.
The cake recipe contained eggs, fat, chocolate and hydrocolloid (guar gum). Ingredients such as egg proteins are strong thermal aggregators possibly resulting in highly insoluble covalently bonded (S-S) and non-covalently bonded aggregates with incorporated gluten proteins. The reducing agent in the extraction medium can deal in many cases with covalently aggregated cereal proteins, this has been shown for the

20 Collaborative study on the immunochemical determination of intact gluten
Sam
ple
ID
a
Par
amet
er
Sym
bol
1
2 3
4 5
6 7
8 9
10
11
12
Tot
al n
umbe
r of
la
bora
tori
es
P 17
18
18
18
16
18
18
16
17
18
18
18
Tot
al n
umbe
r of
re
plic
ates
Su
m(n
(L))
34
36
36
36
32
36
36
32
34
36
36
36
Ove
rall
mea
n
[mg/
kg]
XB
AR
BA
R
1.6
13.5
26
.2
101.
2 0.
1 6.
2 13
.1
63.5
4.
1 14
.9
26.6
11
2.7
Rep
eata
bili
ty s
td.
devi
atio
n [m
g/kg
] s r
0.
8 2.
5 8.
1 14
.8
1.2
1.2
1.3
5.1
1.9
1.5
4.3
20.4
Rep
rodu
cibi
lity
std.
de
viat
ion
[mg/
kg]
s R
1.9
4.0
11.6
31
.8
1.2
1.8
2.5
13.5
2.
8 4.
5 8.
9 33
.2
Rep
eata
bili
ty r
el.
std.
dev
iati
on [
%]
RS
Dr
48.2
18
.5
30.7
14
.7
2348
19
.2
10.2
8.
0 46
.2
10.4
16
.2
18.1
Rep
rodu
cibi
lity
rel.
std.
dev
iati
on [
%]
RS
DR
115.
8 29
.6
44.2
31
.4
2348
28
.3
19.1
21
.2
69.0
30
.3
33.6
29
.4
Bia
s [m
g/kg
] =
ob
serv
ed-n
omin
al
1.
6 3.
5 6.
2 1.
2 0.
1 -3
.8
-6.9
-3
6.5
-0.4
-0
.1
2.6
10.7
Rec
over
y [%
) =
ob
s./n
omin
al*1
00
135.
0 13
1.0
101.
2
62.0
65
.5
63.5
91
.1
99.3
11
0.8
110.
5
a 1: g
lute
n-fr
ee r
ice
flou
r; 2
: ric
e fl
our
10 m
g gl
uten
/kg;
3: r
ice
flou
r 20
mg
glut
en/k
g; 4
: ric
e fl
our
100
mg
glut
en/k
g; 5
: glu
ten-
free
cho
cola
te c
ake;
6:
choc
olat
e ca
ke 1
0 m
g gl
uten
/kg;
7: c
hoco
late
cak
e 20
mg
glut
en/k
g; 8
: cho
cola
te c
ake
100
mg
glut
en/k
g; 9
: cri
sp b
read
4.5
mg
glut
en/k
g; 1
0: c
risp
br
ead
15 m
g gl
uten
/kg;
11:
cri
sp b
read
24
mg
glut
en/k
g; 1
2: c
risp
bre
ad 1
02 m
g gl
uten
/kg
Table 2. Performance statistics for the G12 sandwich ELISA results.

4 Analytical research reports 21
rice cracker here and for example a snack sample in a previous study [12]. To overcome non-covalent interactions aqueous ethanol is the best solvent for prolamins, which are the target of all ELISA tests. However, aqueous ethanol is less effective as a solvent for aggregated egg proteins. The high fat content of more than 20% based on dry mass, as well as the presence of polyphenols from chocolate might have promoted interactions with gluten proteins affecting gluten recovery. Furthermore, guar gum acted as a thickener during extraction and strongly increased the viscosity of the extract. Hence, it was more difficult to obtain a clear separation of extract and residue with this matrix as compared to the others. These interactions of egg, fat and hydrocolloid are plausible factors making this matrix more difficult than other heat processed food products. A single laboratory check with an R5 sandwich ELISA confirmed the low recovery of 60 - 70% for the chocolate cakes. This gives further evidence for the assumption that the chocolate cake can be considered a more difficult matrix for ELISA than flour or bread, and it justifies the evaluation by using the extended recovery range given by Abbott et al. [9].
Using the lowest reproducibility standard deviation of an incurred zero sample (Table 2, sample 5) resulted in a quick estimate of the LOD of 4 mg gluten/kg (LOD = 3.3 x 1.2 mg/kg). This is in agreement with the method cut-off given by the manufacturer. It further shows that the method is able to detect and quantitate gluten in a concentration below 10 mg/kg, which would be the maximal allowable detection limit according to CODEX 118-1979 [1].
Conclusions
Looking at these recent results so far, it appears that the G12 sandwich ELISA is capable of quantitating low levels of gluten in spiked and incurred rice-based matrices. For 5 of the 7 flour and crisp breads, recoveries are in the ideal range (80 - 120%), the method is sensitive to a gluten spike in rice flour. As plausible reasons are present for the low recoveries of the chocolate cake samples (extended recovery range, 50 - 150%), the method showed sufficient performance within the extended recovery range. Next to recovery, the LOD is an important criterion for the the method. The LOD of 4 mg gluten/kg is well below 10 mg/kg, the upper detection limit suggested by Codex Standard 118-1979. The results so far give good reasons to submit the report to AACC International and AOACI for evaluation and method approval.
References
1. Codex Standard for Foods for Special Dietary Use for Persons Intolerant to Gluten - CODEX STAN 118 – 1979, adopted in 1979; amended 1983; revised 2008, Codex Alimentarius, International Food Standards: Rome, 2008.
2. Commission Regulation (EC) No 41/2009 of 20 January 2009 concerning the composition and labelling of foodstuffs suitable for people intolerant to gluten.

22 Collaborative study on the immunochemical determination of intact gluten
3. Shan L, Molberg Ø, Parrot I et al. Structural basis for gluten intolerance in celiac sprue. Science 2002, 297: 2275-2279.
4. Morón B, Bethune MT, Comino I et al. Toward the assessment of food toxicity for celiac patients: Characterization of monoclonal antibodies to a main immunogenic gluten peptide. PLoS ONE 2008, 3(5): e2294.
5. Morón B, Cebolla A, Manyani H et al. Sensitive detection of cereal fractions that are toxic to celiac patients by using monoclonal antibodies to a main immunogenic wheat peptide. Am J Clin Nutr 2008, 87: 405-414.
6. Halbmayr-Jech E, Hammer E, Fielder R et al. Characterization of G12 sandwich ELISA, a next-generation immunoassay for gluten toxicity. J AOAC Int 2012, 95: 372-376.
7. Codex Standard 234 (1999, amended 2011) – Recommended Methods of Analysis and Sampling: Enzyme-Linked Immunoassay R5 Mendez (ELISA) Method, p. 16
8. Report of the twenty-seventh session of the Codex Committee on the Methods of Analysis and Sampling (CCMAS), Budapest, Hungary, 15 - 19 May 2006, Codex Alimentarius Commission, Rome, 2006.
9. Abbott M, Hayward, S, Ross W et al. Validation procedures for quantitative food allergen ELISA methods: community guidance and best practices. J AOAC Int 2010, 93: 442-450.
10. Koerner TB, Abbott M, Godefroy SB et al. Validation procedures for quantitative gluten ELISA methods: AOAC Allergen Community guidance and best practices. J. AOAC Int. 2013, 96: 1033-1040.
11. AOAC International, Appendix D: Guideline for collaborative study procedures to validate characteristics of a method of analysis. In: AOAC Official methods of analysis, 2002.
12. Koehler P, Schwalb T, Immer U et al. AACCI approved methods technical committee report: collaborative study on the immunochemical determination of intact gluten using an R5 sandwich ELISA. Cereal Foods World 2013, 58: 36-40.

4 Analytical research reports 23
4.2 Quantitation of gluten in wheat starch by gel permeation chromatography with fluorescence detection
Katharina Konitzer, Herbert Wieser, Peter Koehler
German Research Centre for Food Chemistry, Leibniz Institute, Freising, Germany
Introduction
Currently used immunochemical methods (enzyme-linked immunosorbent assays, ELISA) for gluten quantitation require no specialised laboratory equipment, offer sufficient sensitivity with limits of detection (LOD) of 1.5 - 3 mg gliadin/kg, and have been performance-tested in collaborative studies [1]. The Mendéz method based on the R5 monoclonal antibody is currently endorsed as a Type 1 Method by the Codex Alimentarius. However, ELISA results depend on the type of antibody, the reference protein used for calibration and the cereal species. Since only specific amino acid sequences from prolamins are detected, the gluten content is calculated from the prolamin content assuming a prolamin/glutelin ratio of one. Non-immunochemical methods include real-time PCR and liquid chromatography (LC). While DNA-based PCR enables the specific detection of wheat, rye, barley, and oats with a sensitivity comparable to ELISA [2], it does not directly detect gluten proteins and is unsuitable for partially hydrolysed foods, starch, and vital gluten used as an additive. The detection of selected peptides from enzymatic digests of gluten proteins by LC-MS/MS offers very low LODs and may be used as a promising tool for verification purposes [3]. Even so the lack of a comprehensive method for wheat, rye, and barley, the cost of equipment, and the difficult calculation of gluten content from the measured amounts of peptides limit its application. Gel permeation high-performance liquid chromatography with UV detection (GP-HPLC-UV) allows the determination of prolamins and gluten in starch samples, but its applicability is restricted due to high LODs [4]. Therefore, the use of fluorescence (FLD) instead of UV detection may enhance its sensitivity and enable the detection of very low amounts of gluten that are present in wheat starch samples.
Wheat starch may be rendered gluten-free during processing by repetitive washing steps. Due to its favourable textural properties gluten-free wheat starch is used for the production of gluten-free foods in many European countries. It is generally well-accepted in these countries and the dietary response to a wheat-starch based gluten-free diet was as good as that to a naturally gluten-free diet [5]. However, doubts about its safety for coeliac patients remain especially in the U.S. and Canada [6]. There is little information about the amounts of associated gluten proteins and in addition to starch synthase, other enzymes and stress/defence proteins, LMW and HMW glutenin subunits as well as gliadins were identified on the surface of starch granules [7].

24 Quantitation of gluten in wheat starch
Materials and methods
Wheat starch extraction
Gliadin and gluten (= gliadin + glutenin) extracts were obtained from 1 g wheat starch each after a twofold pre-extraction with 0.4 mol/L NaCl in 0.076 mol/L Na2HPO4/ NaH2PO4-buffer (pH 7.6). Then 5 mL 60% aqueous ethanol (v+v) was added for the gliadin extract or 5 mL K2HPO4/KH2PO4-buffer (pH 7.6)/2-propanol (1+1; v+v) containing 5 mg dithiothreitol/mL for the gluten extract. Both samples were homogenised for 15 min at 22 °C in a multi-vortex mixer and stirred for 30 min at 22 °C for the gliadin extract and at 60 °C in a water bath for the gluten extract. After centrifugation (3750 g, 25 min, 22 °C) the supernatant was filtered (0.45 µm) and analysed by gel permeation HPLC with fluorescence detection (GP-HPLC-FLD).
GP-HPLC-FLD
The autofluorescence of gluten proteins was measured at the excitation/emission wavelengths of 277/345 nm after separation according to molecular weight on a Phenomenex BioSep SEC s3000, 300 × 4,6 mm column using an isocratic eluent with 50% (v+v) acetonitrile in water containing 0.1% (v+v) trifluoroacetic acid (TFA). Quantitation was done by matrix-calibration with gluten-free wheat starch (GfW5) spiked with wheat flour (cv. Akteur) to obtain 10, 20, 50, 100, and 200 mg gliadin/kg.
Crude protein content, R5 Sandwich ELISA, and R5 competitive ELISA
The Dumas method was used to determine the nitrogen content of 150 mg of the wheat starch samples (N × 5.7 = crude protein content). The gliadin content was measured by ELISA using the Ridascreen® Gliadin and the Ridascreen® Gliadin competitive assays according to the instructions provided by the manufacturer (R-Biopharm).
Results and discussion
Compared to UV detection of proteins at 210 nm using a diode-array detector, detection of protein autofluorescence at 277/345 nm offered a 36-fold increase in sensitivity for linear dilutions of PWG gliadin [8] and a 113-fold increase in sensitivity for linear dilutions of vital wheat gluten (Sonneveld, Papendrecht, The Netherlands). Gel permeation chromatography was used instead of reversed-phase separation to eliminate peak interference in wheat starch extracts. One sample of wheat starch labelled as gluten-free (GfW5) was confirmed to contain less than 20 mg gluten/kg by both ELISA methods. This matrix was spiked with previously characterised wheat flour (cv. Akteur) at levels of 10, 20, 50, 100, and 200 mg gliadin/kg. After thorough shaking and confirmation of homogeneity by analysing ten samples from different parts of the container, these spiked starches were treated analogously to the samples (Figure 1). The calibration functions for gliadin and gluten obtained from the peak areas of the spiked samples showed good repeatability and linearity with R2 > 0.997 for gliadin and R2 > 0.992 for gluten extracts.

4 Analytical research reports 25
Figure 1. GP-HPLC-FLD chromatograms (Phenomenex Biosep SEC s3000, water/ acetonitrile with 0.1% trifluoroacetic acid 1+1, v+v) of gliadin (left) and gluten (right) extracts of gluten-free wheat starch (GfW5) and GfW5 spiked with wheat flour (cv. Akteur) to obtain 50 mg gliadin/kg (equivalent to 83 mg gluten/kg) observed at 277/345 nm
The correlation between the gluten and the crude protein contents of all 22 wheat starch samples was very good with r = 0.924 and p < 0.001 (Figure 2A). However, this was primarily due to three samples with high gluten and crude protein contents. When these three samples were excluded, the correlation was much weaker (r = 0.572, p = 0.011) for the samples with < 0.6% crude protein and < 250 mg gluten/kg (Figure 2 B). Therefore, the amount of gluten in wheat starch cannot be derived from the protein content.
Figure 2. Correlation between crude protein content (Dumas method, n = 6) and gluten content (GP-HPLC-FLD, n = 3) for all 22 wheat starch samples (A) and for the 19 wheat starch samples with < 0.6% crude protein and < 250 mg gluten/kg (B)
The contents of gliadin and gluten in the 22 wheat starch samples were highly variable and ranged from less than 5 up to over 7700 mg gliadin/kg and from less than 5 up to over 10100 mg gluten/kg (Table 1). The amounts of glutenin were calculated from the difference between gluten and gliadin contents and the resulting gliadin to glutenin ratios also showed high variability with values from 0.31 to 3.19. The occurrence of

26 Quantitation of gluten in wheat starch
gliadin to glutenin ratios < 1 in wheat starch samples is in agreement with earlier findings where ratios between 0.17 and 4.86 were observed [9].
Table 1. Quantitative data of 22 wheat starch samples: n = 3 (GP-HPLC-FLD), n = 2 (R5-ELISA Sandwich), n = 2 (R5-ELISA competitive).
Gliadin Gluten Gliadin/ Gliadin Gliadin Sample HPLC-FLD HPLC-FLD Glutenin ELISA Sand. ELISA comp. [mg/kg] [mg/kg] [mg/kg] [mg/kg]
GfW1(f) 6.5 ± 1.3 6.6 ± 0.5 n.c.* 4.3 ± 1.0 7.7 ± 1.5 GfW2(f) < 5.0 5.5 ± 0.1 n.c.* 7.4 ± 3.7 6.5 ± 0.1 GfW3(f) 13.5 ± 0.5 43.3 ± 0.4 0.45 7.4 ± 1.2 16.1 ± 2.0 GfW4(f) 15.3 ± 0.3 44.9 ± 0.9 0.52 6.1 ± 1.1 16.9 ± 0.9 GfW5(f) < 5.0 25.6 ± 4.6 n.c.* < 2.5 5.2 ± 0.1 GfW6(f) < 5.0 152.1 ± 42.6 n.c.* 4.3 ± 0.7 < 5.0 W1(t) 13.3 ± 0.4 26.4 ± 1.3 1.02 8.1 ± 0.1 22.7 ± 2.4 W2(f) < 5.0 19.0 ± 2.5 n.c.* 3.1 ± 0.2 6.1 ± 0.4 W3(f) 12.3 ± 0.2 51.5 ± 5.7 0.31 10.1 ± 0.3 11.2 ± 0.5 W4(f) 68.8 ± 1.1 249.7 ± 17.5 0.38 23.4 ± 0.8 52.4 ± 3.2 W5(f) 14.7 ± 0.6 30.9 ± 1.2 0.91 8.2 ± 0.1 10.4 ± 0.1 W6(f) 51.8 ± 1.1 103.6 ± 1.0 1.00 41.3 ± 0.1 67.5 ± 12.8 W7(f) 30.3 ± 0.8 43.1 ± 4.3 2.37 32.9 ± 3.9 84.5 ± 10.7 W8(f) 7757 ± 176 10189 ± 293 3.19 5952 ± 570 6522 ± 314 W9(t) < 5.0 < 5.0 n.c.* < 2.5 < 5.0 W10(t) 24.0 ± 1.1 37.0 ± 1.9 1.85 24.2 ± 0.7 51.0 ± 7.2 W11(t) 415.8 ± 14.7 800.0 ± 66.5 1.08 212.2 ± 6.1 148.7 ± 7.1 W12(f) 20.9 ± 1.5 58.8 ± 3.5 0.55 34.1 ± 0.4 35.4 ± 1.6 W13(f) 68.3 ± 1.6 195.9 ± 13.7 0.54 44.2 ± 0.3 88.2 ± 2.6 W14(f) 147.6 ± 18.5 197.0 ± 13.2 2.99 26.8 ± 0.1 30.2 ± 0.8 W15(f) 4572 ± 307 6544 ± 205 2.32 3511 ± 60 1841 ± 32 W16(f) < 5.0 11.0 ± 1.2 n.c.* 4.6 ± 0.3 16.1 ± 4.5 * not calculable; (f) = food grade; (t) = technical; GfW = wheat starch labelled as gluten-free; W =
wheat starch with no specification of gluten content
The values for gliadin obtained by GP-HPLC-FLD were additionally compared to those measured by a Sandwich and by a competitive ELISA (Table 1). Both ELISA methods showed a good agreement in only 6 out of 22 samples. In contrast, in 14 out of 22 samples, the Sandwich assay gave lower amounts for gliadin than the competitive assay, which is recommended for starch samples. Gluten may be partially degraded during the manufacturing process of starch which could lead to a loss of the second epitope required for antibody recognition in the Sandwich assay. In many cases, the HPLC-FLD results were consistent with the competitive ELISA results for

4 Analytical research reports 27
gliadin (e.g. GfW1, W3, W9), but in others (e.g. W7, W11, W14) the results showed larger differences. Due to the variable gliadin to glutenin ratios, only the values for gliadin were compared, because the R5 antibody used in the ELISA assays only recognises prolamins from wheat, rye, and barley and fails to detect glutelins. The gluten content is calculated from the prolamin content by multiplication by a factor of two based on the assumption that the prolamin to glutelin ratio is one. However, this calculation may lead to a clear underestimation of the true gluten content, especially in starch samples were ratios < 1 were determined [9]. Seven out of 15 samples, where the gliadin to glutenin ratios could be calculated after GP-HPLC analysis, had ratios < 1. Duplication of the gliadin content would therefore lead to a substantial underestimation (up to 69%) of the true gluten content.
Of the six wheat starch samples that were labelled as gluten-free, two samples contained less than 10 mg gliadin or gluten/kg, respectively (HPLC-FLD), and were thus definitely gluten-free. Two more samples had less than 5 mg gliadin/kg, but 26 and 152 mg gluten/kg, respectively (HPLC-FLD). These samples would be deemed gluten-free by duplicating the gliadin content, whereas they contained more than 20 mg gluten/kg in reality. The remaining two samples contained more than 10 mg gliadin/kg and more than 40 mg gluten/kg (HPLC-FLD) and should therefore not have been declared gluten-free. Quantitation of gliadin by competitive ELISA confirmed the gliadin content of more than 10 mg/kg, whereas the Sandwich assay gave a value below 10 mg/kg.
Conclusions
The developed GP-HPLC method in combination with detection of protein autofluorescence at 277/345 nm offered a 110-fold increase in sensitivity. This allowed the direct quantitation of gliadin and gluten in extracts of 22 wheat starch samples. The considerable variation of gliadin to glutenin ratios confirmed the need for a reliable, non-immunochemical analytical method capable of accurately quantitating both gliadin and gluten in wheat starch samples to ensure the safety of gluten-free foods for coeliac disease patients.
References
1. Immer U, Haas-Lauterbach S. Gliadin as a measure of gluten in foods containing wheat, rye, and barley – enzyme immunoassay method based on a specific monoclonal antibody to the potentially celiac toxic amino acid prolamin sequences: collaborative study. J AOAC Int 2012, 95: 1118-1124.
2. Zeltner D, Glomb MA, Maede D. Real-time PCR systems for the detection of the gluten-containing cereals wheat, spelt, kamut, rye, barley and oat. Eur Food Res Technol 2009, 228: 321-330.
28 Quantitation of gluten in wheat starch
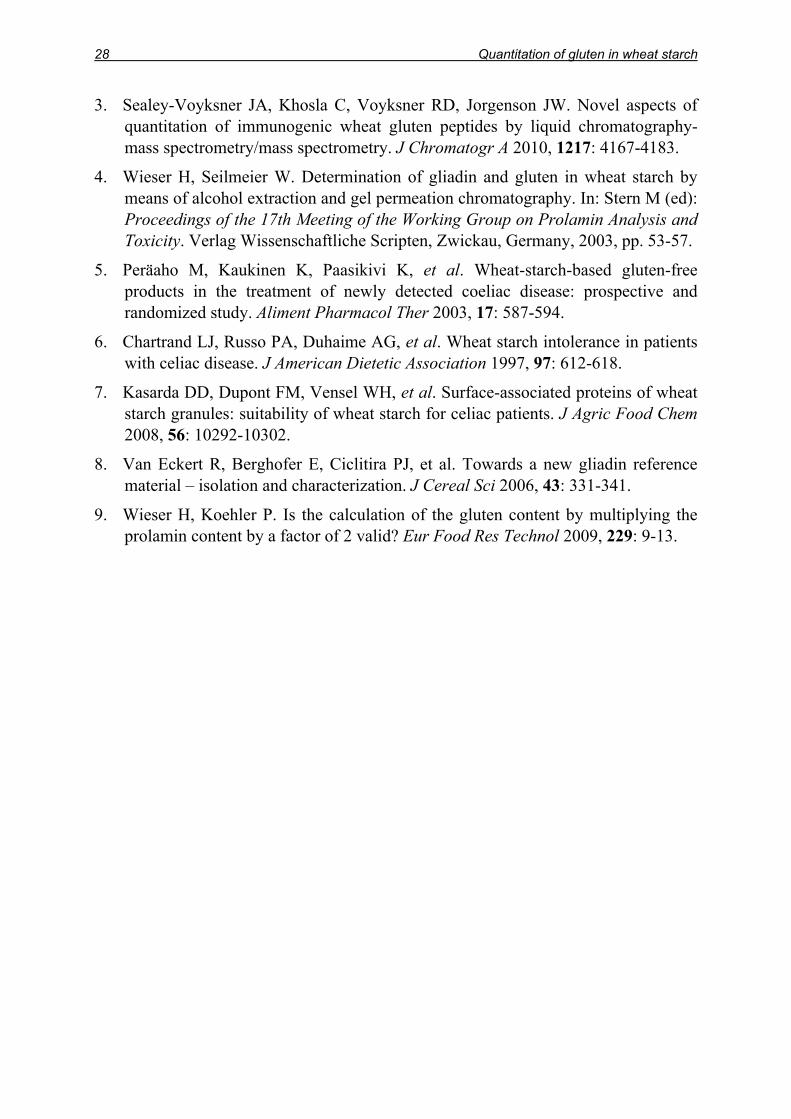
3. Sealey-Voyksner JA, Khosla C, Voyksner RD, Jorgenson JW. Novel aspects of quantitation of immunogenic wheat gluten peptides by liquid chromatography-mass spectrometry/mass spectrometry. J Chromatogr A 2010, 1217: 4167-4183.
4. Wieser H, Seilmeier W. Determination of gliadin and gluten in wheat starch by means of alcohol extraction and gel permeation chromatography. In: Stern M (ed): Proceedings of the 17th Meeting of the Working Group on Prolamin Analysis and Toxicity. Verlag Wissenschaftliche Scripten, Zwickau, Germany, 2003, pp. 53-57.
5. Peräaho M, Kaukinen K, Paasikivi K, et al. Wheat-starch-based gluten-free products in the treatment of newly detected coeliac disease: prospective and randomized study. Aliment Pharmacol Ther 2003, 17: 587-594.
6. Chartrand LJ, Russo PA, Duhaime AG, et al. Wheat starch intolerance in patients with celiac disease. J American Dietetic Association 1997, 97: 612-618.
7. Kasarda DD, Dupont FM, Vensel WH, et al. Surface-associated proteins of wheat starch granules: suitability of wheat starch for celiac patients. J Agric Food Chem 2008, 56: 10292-10302.
8. Van Eckert R, Berghofer E, Ciclitira PJ, et al. Towards a new gliadin reference material – isolation and characterization. J Cereal Sci 2006, 43: 331-341.
9. Wieser H, Koehler P. Is the calculation of the gluten content by multiplying the prolamin content by a factor of 2 valid? Eur Food Res Technol 2009, 229: 9-13.

4 Analytical research reports 29
4.3 Comparison of extraction methods for gluten analysis
Thomas Weiss, Christian Gößwein, Tina Dubois, Ulrike Immer
R-Biopharm AG, Darmstadt, Germany
Introduction
In order to control the Codex Alimentarius threshold of 20 mg gluten proteins per kg food, the Codex Alimentarius Commission endorsed the ELISA R5 Mendez Method as Type I method [1]. The Mendez method includes - in addition to analysis with the monoclonal R5 antibody - also the so called Cocktail (patented) extraction ensuring a very good recovery of gluten-proteins also from heat-treated food. Non-heated food contains gluten proteins in their native form, in which the prolamins are monomeric proteins with intramolecular disulphide bonds only, whereas the glutelins form huge protein aggregates by intermolecular disulphide bonds. Therefore, only the prolamins can be extracted with 60% ethanol [2-4]. Upon heating, disulphide bonds get rearranged and prolamins are incorporated into the glutelins-aggregates, leading to incomplete extraction with 60% ethanol. The reducing agents in the Cocktail (patented) break up the disulphide bonds and denaturing agents further enhance the solubility of the prolamins leading to efficient extraction from heat-treated foods [2].
However, a recent paper by Grace et al. [5] suggested an ethanol/gelatin extraction (so called GEB extraction) as more efficient extraction method for R5 ELISA. From a total number of 30 samples, 17 samples showed higher results with the GEB extraction compared to Cocktail (patented) extraction (oats fibre, base de crème, caramel apple bar, FAPAS sample, cookie mix, spice, three dehydrated soup samples, four buckwheat samples and four cereals samples), eight samples showed comparable results with both extraction methods and five samples showed higher results with the Cocktail (patented) extraction than with the GEB extraction (two tortilla samples, bread, chips and snack). In order to reassess these findings, a comparison of the Cocktail (patented) extraction, the GEB extraction and a simple ethanol extraction was conducted at R-Biopharm AG using the R5 ELISA RIDASCREEN® Gliadin (produced by R-Biopharm AG). In addition, the AgraQuant® Gluten G12 ELISA (produced by Romer Labs GmbH) was included in the comparison, using the extraction solution provided in the test kit.
Materials and Methods
Test kits
The RIDASRCEEN® Gliadin R7001 (R-Biopharm AG) is a 96 well R5 sandwich ELISA with a calibrator range between 5 and 80 ng/mL gliadin. A final dilution factor of 500 is used. The test kit complies with the requirements for a Codex Alimentarius

30 Comparison of extraction methods for gluten analysis
Type I method and was also tested in two international collaborative studies [6,7]. Furthermore, the RIDASCREEN® Gliadin has been granted the status of an AOAC Official Method of Analysis 2012.01 (first action status) and is also a recommended method by the AACC International.
The AgraQuant® Gluten G12 Assay (4 - 200 ppm) is a 96 well G12 sandwich ELISA with a calibrator range between 4 and 200 mg gluten/kg (ppm) including a final dilution factor of 400. The test kit is currently completing an international collaborative study.
Sample material
A wide variety of samples were used including zero samples and samples containing non-fragmented gluten proteins. Most samples were commercially available and were bought in supermarkets. Additionally, some samples from proficiency tests were included. The real gluten content of these samples was unknown. Therefore, some samples of the collaborative study with the RIDASCREEN® Gliadin were also included [7]. These samples contained a defined amount of gluten proteins, which is stated in Table 3 in brackets. Additionally, some of the zero samples were spiked with an ethanolic solution of PWG gliadin to obtain a sample concentration of 10 mg/kg PWG gliadin before extraction with the respective method.
Sample preparation
Cocktail extraction (for analysis with the RIDASCREEN® Gliadin) according to the test kit manual: 2.5 mL of Cocktail (patented) were added to 0.25 g of sample. In case of polyphenol containing samples or samples likely to contain polyphenols, 0.25 g of skim milk powder (food quality) was added prior to addition of Cocktail (patented). The samples were incubated in a water bath (50 °C / 40 min). Afterwards, 7.5 mL of 80% ethanol were added and the samples were rotated upside-down for 60 min at room temperature [8].
Ethanol extraction (for analysis with the RIDASCREEN® Gliadin according to application note: 10 mL of 60% ethanol were added to 1 g of sample. In case of polyphenol containing samples or samples likely to contain polyphenols, 1 g of skim milk powder (food quality) was added prior to addition of ethanol. The samples were rotated upside-down for 10 min at room temperature.
GEB extraction (for analysis with the RIDASCREEN® Gliadin): The GEB was prepared with a mixture of 54% ethanol, 3% methanol, 3% isopropanol, 2% polyvinylpyrrolidone and 5% fish gelatin (Serva liquid fish gelatin product number 22156.02; solid content: 45.1%). 10 mL of GEB buffer was added to 1 g of sample. The samples were incubated in a water bath (10 min / 60 °C with manual shaking every minute). Afterwards, samples were shaken using a microtiterplate shaker with 550 rpm (35 min / 60 °C; similar to [4] with regard to available laboratory equipment).
Extraction solution (Romer Labs) extraction (for analysis with the AgraQuant® Gluten G12 assay) according to the test kit manual: 2.5 mL of extraction solution were added

4 Analytical research reports 31
to 0.25 g of sample. In case of chocolate, 0.25 g of fish gelatin powder was added prior to addition of extraction solution. The samples were incubated in a water bath (40 min / 50 °C). Afterwards, 7.5 mL of 80% ethanol were added and the samples were rotated upside-down for 60 min at room temperature [9].
Final steps for all extraction procedures: Samples were centrifuged at 2500 g for 10 min and the supernatants were transferred to new vials. The supernatants were diluted with respective sample dilution buffer to a final dilution factor of 500 for RIDASCREEN® Gliadin analysis and 400 for AgraQuant® Gluten G12 assay. Further dilutions with the respective sample dilution buffer were performed for some samples.
ELISA procedure
ELISAs were performed as stated in the test kit manuals of RIDASCREEN® Gliadin and AgraQuant® Gluten G12 assay [8,9].
Data calculation
Data calculation was performed with the RIDA®SOFT Win from R-Biopharm AG using a cubic spline function. The primary result of the RIDASCREEN® Gliadin is given in mg gliadin/kg. The primary result of the AgraQuant® Gluten G12 assay is given in mg gluten/kg, which was divided by two [1] to convert it to gliadin and to be able to compare it with the result of the RIDASCREEN® Gliadin. Concentrations below the limit of quantitation (LOQ) were not extrapolated. The LOQ is 2.5 mg gliadin/kg for the RIDASCREEN® Gliadin and 4 mg gluten/kg (= 2 mg gliadin/kg) for the AgraQuant® Gluten G12 assay, respectively.
Results and Discussion
Table 1 to Table 3 show the results of the comparison of the different extraction methods. The measured concentrations for the following assumed negative samples were below the LOQ for all extraction methods and are not shown in Table 1: soy flour, quinoa flour, chestnut flour (with added skim milk powder), cocoa powder (with added skim milk powder or gelatin, respectively), rice flour, lupine flour, teff flour, amaranth flour, maize flour, apricot biscuit, bread, bread with kernels and blank custard powder. In general, the assumed negative samples were tested negative regardless of the extraction method and ELISA kit used. However, the corn snack, the buckwheat flour and the millet flour were tested significantly above the LOQ when using the extraction solution (Romer Labs) and the AgraQuant® Gluten G12 assay (see Table 1).
There are several possible explanations. (i) Contamination of the samples with oats (the R5 does not react with oats whereas the G12 antibody detects some oat varieties when present in very high concentrations [10-12]). (ii) Contamination with a gluten fraction which is recognised by the G12 antibody but not by the R5 antibody (false negative in RIDASCREEN® Gliadin). This is very unlikely, as contamination of such

32 Comparison of extraction methods for gluten analysis
samples is likely to occur with wheat, rye or barley flour containing all gluten fractions. (iii) Substances interfering with RIDASCREEN® Gliadin detection (false negative). This can be practically ruled out, as spiking experiments were performed with some of these matrices working well (Table 3). (iv) False positive result using the extraction solution (Romer Labs) and the G12 assay due to interfering substances. This explanation is supported by the unusual behaviour of the samples after further dilution.
Table 1. Assumed negative samples. Gliadin concentrations [mg/kg] measured after extraction and analysis with stated solution and ELISA, respectively. If samples were diluted further than the standard dilution factor of 500 for RIDASCREEN® Gliadin analysis and 400 for AgraQuant® Gluten G12 assay analysis, the final dilution factors are stated below the measured concentrations in brackets and italics.
RIDASCREEN® Gliadin AgraQuant® Gluten
G12 assay
Sample 60%
ethanol GEB
Cocktail (patented)
Extraction solution (Romer Labs)
Oats cultivar 1 < LOQ 2.8 < LOQ 2.2
Corn Snack < LOQ < LOQ < LOQ 15.4 / 42.7
(400 / 2000)
Buckwheat flour < LOQ* < LOQ < LOQ* 5.3 / 8.5 / 9.1
(400 / 800 / 1600)
Millet flour < LOQ* < LOQ < LOQ* 2.2 / 5.4
(400 / 800) * skim milk powder was added
For the assumed contaminated samples, the Cocktail (patented) extraction showed in general the highest measured gliadin concentrations (Table 2). The GEB concentration values usually were between the ethanol extraction and the Cocktail extraction, showing improved extraction efficiency compared to the ethanol extraction. However, compared to the Cocktail extraction, the GEB usually showed lower extraction efficiency. This is probably due to contamination with heated gluten proteins. Since the GEB lacks an agent able to break up disulphide bonds, inefficient extraction of cross-linked gluten proteins is likely to occur. The Cocktail (patented) contains a high concentration of β-mercaptoethanol able to break up the disulphide bonds leading to increased extraction efficiency [2].
The higher extraction efficiency of the GEB compared to the ethanol extraction is probably due to the higher extraction temperature and longer incubation, which might in general increase extraction and in addition might lead to some rearrangement of disulphide bonds. The AgraQuant® Gluten G12 assay (using the kit extraction solution) showed usually about half the value of the Cocktail (patented) value. Since the extraction solution (Romer Labs) contains most likely a thiol group-containing reducing agent as well, the extraction efficiency is probably comparable to the Cocktail (patented). Thus, the lower concentrations might be due to different

4 Analytical research reports 33
standardisation or recognition of the G12 ELISA. The inconsistent dilution series might also indicate some interfering substances.
Table 2. Assumed contaminated samples. For general table explanation please refer to Table 1.
RIDASCREEN® Gliadin AgraQuant® Gluten
G12 assay
Sample 60%
ethanol GEB
Cocktail (patented)
Extraction solution (Romer Labs)
Millet flour, cont. 10.5* 18.4 22.9* 46.9 Buckwheat, cont. 21.1* 24.9 20.6* 7.9 Lupine flour, cont. < LOQ < LOQ 3.1 2.0
Rice flour, cont. 56.3
(1000) 62.4
(1000) 83.3 / 77.4
(1000 / 4000) 45.0 / 130.0 (400 / 4000)
Teff flour / wheat flour mixture
45.2 (1000)
58.0 (1000)
56.7 / 66.4 (1000 / 4000)
37.6 / 54.4 (400 / 4000)
Maize flour A, cont. 79.0
(2000) 101.0 (2000)
118.0 / 113.4 (2000 / 4000)
28.9 / 56.0 (400 / 4000)
Maize flour B, cont. 19.2 19.1 17.2 7.0
Maize flour C, cont. 42.2
(2000) 65.2
(2000) 97.7
(2000) 25.3
Oats cultivar 2, cont. 2.6 3.3 3.7 < LOQ FAPAS 2777 B 62.7 86.4 83.0 36.4 FAPAS 2792 A 77.2 70.0 87.7 37.2 FAPAS 2739 A 23.6 31.6 36.0 19.5 LVU sample 5 83.5 100.1 109.6 45.2 LVU sample 6 48.8 54.1 53.2 19.2
* skim milk powder was added; Cont.: contaminated with gluten proteins containing material
For the spiked samples, GEB extraction and Cocktail (patented) extraction showed results very close to the spike level (Table 3). The ethanol extraction led for some matrices to a significantly lower concentration, which might be due to matrix effects. In comparison, the AgraQuant® Gluten G12 assay (extraction solution) showed mostly a result half of the Cocktail (patented) result using the RIDASCREEN® Gliadin. Interestingly, an overestimation of approx. 130% was obtained for spiked millet and rice flour, which corresponds very well to the preliminary data from the collaborative study with the AgraQuant® Gluten G12 assay presented during the meeting by Clyde Don (chapter 4.1).
The results for the heat-treated samples showed a larger difference between the Cocktail (patented) and the ethanol and GEB extraction than the differences already observed in Table 2. This is probably due to the lack of ability to break up disulphide

34 Comparison of extraction methods for gluten analysis
bonds leading to reduced extraction efficiency. The snack (50), the elbow pasta, the spaghetti and the contaminated corn flour C were also extracted in five replicates each with GEB and Cocktail (patented) (data not shown), confirming the results shown below. The extraction solution (Romer Labs) and AgraQuant® Gluten G12 assay showed again some dilution inconsistencies and led mainly to lower results than the Cocktail (patented) extraction in combination with the RIDASCREEN® Gliadin. The best recoveries for the samples with known gluten content were also obtained when using the Cocktail (patented) extraction.
Table 3. Spiked samples and heat-treated samples. Spiked samples (SP marked) were spiked with 10 mg/kg PWG gliadin. The target values (mg/kg gliadin) for samples from the RIDASCREEN® Gliadin collaborative study [7] (CS marked) are shown in brackets. For general table explanation please refer to Table 1.
RIDASCREEN® Gliadin AgraQuant® Gluten
G12 assay
Sample 60%
ethanol GEB
Cocktail (patented)
Extraction solution (Romer Labs)
SP Spike control 9.5 10.2 10.4 4.7 SP Soy 8.9 10.4 13.0 3.2 SP Millet 5.8* 7.4 12.2* 14.7 SP Buckwheat 7.3* 10.0 11.2* 4.9 SP Chestnut flour 8.1* 9.7 11.7* 4.8 SP Cocoa 6.0* 9.9 10.7* 4.7# SP Rice flour 7.0 8.7 11.3 13.4 SP Maize flour 9.7 10.0 11.2 4.7 SP Curcuma 5.3 9.2 10.6 4.9 SP Herbal tablets < LOQ* 10.4 10.9* < LOQ
CS Snack (50) 10.8 15.2 54.5 / 53.4
(1000 / 4000) 21.8 / 60.8
(400 / 4000) CS Bread A (10) 4.6 6.9 9.3 3.6 CS Bread B (20) 7.2 10.9 16.6 7.5
CS Bread C (50) 17.8 30.3 39.0 / 38.9 / 46.6
(500 / 1k / 2k) 19.2 / 28.2 / 36.9 (400 / 800 / 6400)
Elbow pasta (corn) 5.4 11.9 22.3 25.0 Spaghetti (corn) 4.1 9.8 27.1 24.2 Custard powder +10 mg/kg gliadin
8.4 10.4 11.5 5.3
Crispy bread 4.1 6.8 15.7 8.4 * skim milk powder was added # fish gelatin was added

4 Analytical research reports 35
Four of the samples (base de crème, caramel apple bar, spice and buckwheat) from his publication [5] were brought to the meeting by Thomas Grace and were analysed together with the snack (50), the elbow pasta, the spaghetti and the contaminated corn flour C in the laboratory at R-Biopharm AG in cooperation with Thomas Grace. The results for the latter four could be reproduced as stated above. The spice and bar sample showed similar results for GEB and Cocktail (patented) extraction (with skim milk powder). For the buckwheat and base de crème, a lower result for Cocktail (patented) extraction was observed, similar to the publication [5]. The reason for this reduced result is unknown and will be further investigated. Since the target values for these two samples are unknown, it is not clear which result is true.
Conclusions
The re-evaluation of the Cocktail (patented) extraction showed that it is the best extraction method for the vast majority of samples, since it has the ability to break up disulphide bonds leading to an efficient extraction of gluten proteins [2]. The GEB showed extraction efficiencies between a simple ethanol extraction and the Cocktail (patented) extraction, which might be due to the suppression of some interfering effects (gelatin and polyvinylpyrrolidone containing buffer) as well as to some disulphide bond rearrangement (higher extraction temperature and longer incubation) compared to the ethanol extraction.
The extraction solution (Romer Labs) in combination with AgraQuant® Gluten G12 assay showed in general lower concentrations than the Cocktail (patented) extraction, also for samples with a known gluten protein content (spiked samples and defined samples from the collaborative study). Since there was no distinction in this validation between extraction efficiency and ELISA performance, it can be only speculated about the reasons for these discrepancies. Possible explanations might be some interfering effects from the food matrices as indicated by the dilution inconsistencies or a different standardisation of the G12 ELISA. However, more samples and a distinction between extraction and ELISA performance are necessary for a final conclusion.
References
1. Codex Stan 118 - 1979. Codex standard for foods for special dietary use for persons intolerant to gluten. Adopted 1979, amended 1983, revised 2008.
2. Garcia E, Llorente M, Hernando A, et al. Development of a general procedure for complete extraction of gliadins for heat processed and unheated foods. Eur J Gastro Hep 2005, 17: 529-539.
3. Belitz HD, Grosch W and Schieberle P. Cereal proteins in Food Chemistry, Springer Verlag, 2009, 4th edition, pp 697-716 (German edition).
4. Wieser H. Chemistry of gluten proteins. Food Microbiology 2007, 24: 115-119.

36 Comparison of extraction methods for gluten analysis
5. Grace T, Emerson-Mason L, Massey T, et al. More efficient extraction procedure for gluten using the R5 ELISA method. www.biadiagnostics.com.
6. Méndez E, Vela C, Immer U, et al. Report of a collaborative trial to investigate the performance of the R5 enzyme linked immunoassay to determine gliadin in gluten-free food. Eur J Gastro Hep 2005, 17: 1053-1063.
7. Koehler P, Schwalb T, Immer U, et al. AACCI approved methods technical committee report: collaborative study on the immunochemical determination of intact gluten using an R5 sandwich ELISA. Cereal Foods World 2013, 58: 36-40.
8. RIDASCREEN® Gliadin test kit manual, R-Biopharm AG, 2012; version 12-04-18
9. AgraQuant® Gluten G12 Assay (4 – 200 ppm) test kit manual, Romer Labs GmbH 28 Nov 2011; version PI_COKAL0200_ARG_EN_v10.
10. Valdes I, Garcia E, Llorente M, et al. Innovative approach to low-level gluten determination in foods using a novel sandwich enzyme-linked immunosorbent assay protocol. Eur J Gastro Hep 2003, 15: 465-474.
11. Moron B, Cebolla A, Manyani H, et al. Sensitive detection of cereal fractions that are toxic to celiac disease patients by using monoclonal antibodies to a main immunogenic wheat peptide. Am J Clin Nutr 2008, 87: 405-414.
12. Comino I, Real A, Lorenzo L, et al. Diversity in oat potential immunogenicity: basis for the selection of oat varieties with no toxicity in celiac disease. Gut 2012, 60: 915-922.

4 Analytical research reports 37
4.4 The oats mystery – Are they gluten-free?
Elisabeth Halbmayr-Jech1, Lukas Frank1, Adrian Rogers2, Michael Prinster3
1 Romer Labs Division Holding GmbH, Tulln, Austria 2 Romer Labs UK Ltd, Runcorn, Cheshire, UK 3 Romer Labs Inc, Union, MO, USA
Introduction
The global use of oats for food products has increased by 10 percent over the last 30 years. About one quarter of the world’s oats production is used in food. They have a high nutritional value, as they are high in protein and oil, but low in starch. Oats are not only processed to oat meal, flour, muesli or granola bars, but also serve as stabilisers, emulsifiers and food extenders in industrial food processing.
People suffering from coeliac disease need to follow a life-long, strict, gluten-free diet, where they need to avoid gluten containing cereals like wheat, rye, barley and their crossbred varieties. Whether coeliacs can also eat oats is an ongoing debate.
Production of gluten-free oats
The main problem with oat production is cross-contamination with other gluten containing grains, as they are planted in the same fields, harvested with the same equipment, stored and transported together. In the case of regular oats, contamination of 1% with other grains is allowed and common.
If gluten-free oats are to be produced, special care has to be taken. One example is the production of a certain type of proprietary, gluten-free oats. The requirements are that these oats need to be planted on ground that did not have gluten containing cereals for the last four years. Near harvest time, the grower walks through the fields and pulls out any stray of gluten grains. This is feasible because of the short stature of this proprietary oat variety. Wheat, rye and barley are much taller and easy to see. Afterwards, a gluten-free inspector walks around the field and certifies that it is clean. Harvesting is done with certified gluten-free combines, which are only used for gluten-free oat production. These oats are stored in new bags or certified clean bins to avoid another source of cross-contamination. Production of gluten-free oats can only take place in fields and not by post-harvest cleaning.
Further processing of gluten-free oats has to follow strict gluten-free management to avoid any sort of cross-contamination.
Clinical aspects
On the one hand, there are several studies demonstrating that oats are safe to be consumed by coeliacs [1-5], but on the other, certain studies show that oat sensitivity in coeliacs does exist [6-11]. One problem is a high drop-out rate for oat studies but
38 The oats mystery – Are they gluten free?
still show that about 5% of patients show coeliac symptons when gluten-free oats are consumed. Up to now, there has been no clinical consensus if gluten-free oats are safe for coeliacs to eat.
Labelling regulations for gluten-free oats
In Canada, it is not allowed to label oats as gluten-free as the Canadian Labelling Regulation for Food Allergen and Gluten Sources states that gluten means any gluten protein from the grain of barley, oats, rye, triticale and wheat [12]. Oats can only be labelled as “pure and uncontaminated”. Additionally, there is Health Canada’s position on oat safety for coeliacs [13], which says that moderate amounts of oats (50 - 70 g/day and 20 - 25 g/day for children) can be well tolerated by the majority of coeliacs. It is also requested to have a further definition of the terms “pure and uncontaminated,” in terms of production, sampling and testing of oats. According to Health Canada, the fact that about 5% of coeliacs cannot tolerate even pure oats needs further investigation.
In 2013, the US FDA published the Gluten-Free Rule [14], which states that any grain other than gluten containing wheat, rye, barley or their crossbred hybrids like triticale can be labeled gluten-free if the presence of any unavoidable gluten due to cross-contact situation is less than 20 mg/kg. Therefore, oats that are labeled gluten-free must contain less than 20 mg gluten/kg.
In addition to the FDA Rule, several local certification bodies give their approval for gluten-free products that fulfill specific requirements. To meet criteria for Coeliac Sprue Association (CSA), the product needs to contain less than 5 mg gluten/kg. Gluten Interance Group (GIG) with its Gluten Free Certification Organization (GFCO) sets their limit at 10 mg gluten/kg.
European Regulation EC 41/2009 [15] states that gluten means a protein fraction from wheat, rye, barley and oats or their crossbred varieties. But there are further definitions for oats, saying that oats contained in foodstuffs for people intolerant to gluten must have been specially produced, prepared and/or processed in a way to avoid contamination by wheat, rye, barley, or their crossbred varieties and the gluten content of such oats must not exceed 20 mg/kg.
Association of European Coeliac Society (AOECS) certifies products containing oats to be gluten-free when their gluten content is below 20 mg/kg. These products containing oats must clearly be labeled with the capital letters “OATS” followed by the certification number of these products given by the AOECS.
Analytical aspects of gluten detection in oats
Oats contain one family of prolamins, so-called avenins. They make up to 10 - 15% of total seed protein compared to up to 80% total seed content of prolamins in other gluten-containing grains. Avenins show high proline and glutamin content, low lysine and are insoluble in water. Two coeliac disease relevant T cell epitopes have been defined in oats (Figure 1) [8,16], but the structure of prolamins from oats differs from

4 Analytical research reports 39
other gluten-containing cereals. The two epitopes shown in Figure 1 have been found in each of 13 oat species studied by Londono et al. [17]. Comino et al. [18] showed a correlation of the reactivity of the monoclonal G12 antibody with the immunogenicity of prolamin extracts from different oat varieties.
Figure 1. Coeliac disease (CD) releveant T cell epitopes. E, Glutamate residues formed by tissue-transglutaminase- (tTG) mediated deamidation, which are important for recognition by T cells are shown in bold
Material and methods
Romer Labs conducted a preliminary study on its AgraQuant® Gluten G12 Sandwich ELISA and different oat varieties to clarify the situation on the detection of gluten in oats using the G12 antibody. The objectives of the study were to find out if the AgraQuant® Gluten G12 ELISA test kit can detect gluten in pure oats and if there is a difference in the gluten level of different varieties. The results of the AgraQuant® Gluten G12 ELISA have also been compared to the R5 Sandwich ELISA.
More than 80 pure, uncontaminated oat varieties from the USA, Canada and Europe were collected. Most samples were from seed banks and, therefore, proven to be pure and uncontaminated. Samples which were not obtained from seed banks were hand selected to prove their pureness. The lab mill was cleaned extensively between the milling of each variety. The oat varieties were extracted according to AOACI Official Method 2012.01 [19], with reducing agents and analysed with the AgraQuant® Gluten G12 Sandwich ELISA test kit (Limit of Detection 4 mg gluten/kg). Several varieties were also analysed with the R5 Sandwich ELISA test kit (Limit of Detection 5 mg gluten/kg; AOAC Official Method 2012.01 [19]).
Results and discussion
Detailed results of oat varieties analysed by AgraQuant® Gluten G12 Sandwich ELISA and R5 Sandwich ELISA are shown in Tables 1 - 5. About half of the oat varieties analysed showed gluten levels below 5 mg/kg when analysed with G12 and R5 Sandwich ELISA test kits. About one third of the oat varieties gave low positive results, between 6 and 10 mg/kg of gluten analysed with the monocolonal G12 antibody, but below 5 mg gluten/kg analysed with R5 Sandwich ELISA test kit.
Slightly more than ten percent of the collected oat varieties showed clear positive results of between 10 and 20 mg gluten/kg when tested with the AgraQuant Gluten G12 Sandwich ELISA, but still below the limit of detection when analysed with the R5 ELISA.
DQ2.5-ave-1a PYPEQEEPF (Av-α9A)
DQ2.5-ave-1b PYPEQEQPF (Av-α9B)

40 The oats mystery – Are they gluten free?
Table 1. Oat varieties analysed by AgraQuant® Gluten G12 Sandwich ELISA and R5 Sandwich ELISA with gluten concentrations below 5 mg/kg.
Oat Variety AgraQuant® Gluten G12
Sandwich ELISA [mg gluten/kg]
R5 Gluten Sandwich ELISA
[mg gluten/kg] Bastion <5 <5
04-704-Cn 7/2 <5 <5 Chris <5 <5
Gerald <5 <5 Brachan <5 <5 Tardis <5 <5
Dalguise <5 <5 Balado <5 <5
Table2. Oat varieties analysed by AgraQuant® Gluten G12 Sandwich ELISA with gluten concentrations below 5 mg/kg.
Oat Variety
AgraQuant® GlutenG12 Sandwich
ELISA [mg gluten/kg]
Oat Variety
AgraQuant® GlutenG12 Sandwich
ELISA [mg gluten/kg]
Classic <5 AC Aylmer <5 Dallas <5 Furlong <5
Jim <5 Shadow <5 AC Juniper <5 Turcotte <5
Aarre <5 Alcyon <5 Roope <5 Oscar <5 Riser <5 Leggett <5 Sisko <5 Proprietary Oat 1 <5 Solva <5 Veli <5 Lustre <5 Hakea <5
AC Mustang <5 Pallinup <5 Chairman <5 Burton <5
Florida 502 <5 Cevamex <5 Prairie <5 NC Hulless <5
INO9201 <5 AC Morgan <5 SSH 423 <5 Glider <5 Brawn <5 Quoll <5 Brawn <5 Excel <5
Unregistered Hulless ID #02 ANS 68
<5 Gehl <5

4 Analytical research reports 41
Table 3. Oat varieties analysed by AgraQuant® Gluten G12 Sandwich ELISA and R5 Sandwich ELISA with gluten concentrations of 6 - 10 mg/kg (G12) and below 5 mg/kg (R5), respectively.
Oat Variety AgraQuant® Gluten G12
Sandwich ELISA [mg gluten/kg]
R5 Gluten Sandwich ELISA
[mg gluten/kg] Buffalo 6 - 10 <5 Husky 6 - 10 <5
Mascani 6 - 10 <5 Mason 6 - 10 <5 Becon 6 - 10 <5
Hendon 6 - 10 <5 Canyon 6 - 10 <5 Zuton 6 - 10 <5
03-36Cn 6 - 10 <5 05-82ACn19 6 - 10 <5
Rhapsody 6 - 10 <5 03AW24 6 - 10 <5 03-37Cn 6 - 10 <5
Unknown - from Sunburst, MT 6 - 10 <5 Summit 6 - 10 <5
00-61 Cn 6 - 10 <5 Lenon 6 - 10 <5
04-66Cn7 6 - 10 <5
Table 4. Oat varieties analysed by AgraQuant® Gluten G12 Sandwich ELISA with gluten concentrations of 6 - 10 mg/kg.
Oat Variety AgraQuant® Gluten G12
Sandwich ELISA [mg gluten/kg]
Karma 6 - 10 Possum 6 - 10
Proprietary oat 2 6 - 10 Wintaroo 6 - 10
Katri 6 - 10 Lisbeth 6 - 10
Riel 6 - 10 Euro 6 - 10
Numbat 6 - 10 Bulwark 6 - 10

42 The oats mystery – Are they gluten free?
Table 5. Oat varieties analysed by AgraQuant® Gluten G12 Sandwich ELISA with gluten concentrations of 10 - 20 mg/kg (G12) and below 5 mg/kg (R5), respectively.
Oat Variety AgraQuant® Gluten G12
Sandwich ELISA [mg gluten/kg]
R5 Gluten Sandwich ELISA
[mg gluten/kg]
Nusso 10 - 20 <5 Maverick 10 - 20 <5 Monico 10 - 20 <5
Unknown - from Lakewood, NJ 10 - 20 <5 Rhiannon 10 - 20 n.d. Lamont 10 - 20 n.d. Powell 10 - 20 n.d.
SSH 421 10 - 20 n.d. Miku 10 - 20 n.d.
Bates 89 10 - 20 n.d. Provena 10 - 20 n.d.
n.d., not determined
Conclusion
The positive results from the monoclonal G12 antibody appear to be a specific reaction of the antibody to the toxic fragment, rather than a non-specific response. All pure oat varieties analysed gave results below 20 mg gluten/kg and, thus, are below the legal threshold of 20 mg/kg for gluten-free labelling in Europe and the USA. According to Comino et al. [18], the cross-reactivity of the monoclonal G12 antibody for certain oat varieties shows higher results than confirmed in our study. This is due to the fact that a competitive assay was used for determination of cross-reactivities in Comino et al. [18] compared to Sandwich assays in our study. It can be said that CD relevant T cell epitopes are found in several oats [17] but the prolamin (avenin) content in oats is much lower (about 10-15%) than compared to other gluten containing grains (80%). Our study gave further indications that there is a difference in oat varieties in terms of the gluten content. Due to the different structure and sequence of avenins, a competitive ELISA assay would probably be more suitable for the determination of the gluten content in pure oats. In general, more research on peptide sequences of avenins is necessary. Furthermore, an independent external study on pure oats will be conducted with AgraQuant® Gluten G12 and other Gluten ELISA test kits.
Acknowledgements
We would like to thank the suppliers of the oat samples: Harold E. Bockelman, National Small Grain Collection, U.S. Department of Agriculture – Agricultural Research Service, Dr. Athole Marshall, IBERS, Aberystwyth University UK, Cream Hill Estates, Canada

4 Analytical research reports 43
We would like to thank following people for providing us information on this topic: Gary Iverson, Montana Gltuen Free US, Beth Armour, Cream Hill Estates, Hertha Deutsch, AOECS
References
1. Srinivasan U, Jones E, Carolan J, et. al. Immunohistochemical analysis of coeliac mucosa following ingestion of oats. Clin Exp Immunol 2006, 144: 197-203.
2. Högberg L, Laurin P, Fälth-Magnusson K, et al. Oats to children with newly diagnosed coeliac disease: a randomized double blind study. Gut 2004, 53(5): 649-654.
3. Kilmartin C, Lynch S, Abuzakouk M, et al. Avenin fails to induce a Th1 response in coeliac tissue following in vitro culture. Gut 2003 Jan, 52: 47-52.
4. Srinivasan U, Leonard N, Jones E, et al. Absence of oats toxicity in adult coeliac disease. BMJ 1996, 313: 1300-1301.
5. Janatuinen EK, Pikkarainen PH, Kemppainen TA, et al. A comparison of diets with and without oats in adults with celiac disease. N Engl J Med 1995, 333: 1033-7.
6. Silano M, Di Benedetto R, Maialetti F, et al. Avenins from different cultivars of oats elicit response by coeliac peripheral lymphocytes. Scand J Gastroenterol 2007, 42: 1302-1305.
7. Hollén E, Holmgren Peterson K, Sundqvist T, et al. Coeliac children on a gluten-free diet with or without oats display equal anti-avenin antibody titres. Scand J Gastroenterol 2006, 41: 42-47.
8. Arentz-Hansen H, Fleckenstein B, Molberg Ø, et al. The molecular basis for oat intolerance in patients with celiac disease. PLoS Med 2004 Oct, 1(1): e1. Epub 2004 Oct 19.
9. Peräaho M, Kaukinen K, Mustalahti K, et al. Effect of an oats-containing gluten-free diet on symptoms and quality of life in coeliac disease. A randomized study. Scand J Gastroenterol 2004a, 39: 27-31.
10. Peräaho M, Collin P, Kaukinen K, et al. Oats can diversify a gluten-free diet in celiac disease and dermatitis herpetiformis. J Am Diet Assoc 2004b, 104: 1148-1150.
11. Lundin KE, Nilsen EM, Scott HG, et al. Oats induced villous atrophy in coeliac disease. Gut 2003, 52: 1649-1652.
12. Regulations Amending the Food and Drug Regulations (1220 – Enhanced Labelling for Food Allergen and Gluten Sources and added Sulphites). Canada Gazette, Part II (CGII), 2011.
13. Celiac Disease and the Safety of Oats: Health Canada’s Position on the Introduction of Oats to the Diet of Individuals Diagnosed with Celiac Disease

44 The oats mystery – Are they gluten free?
(CD). 2007. Cat.: H164-51/2007E-PDF; ISBN: 978-0-662-46940-7 http://www.hc-sc.gc.ca/fn-an/alt_formats/hpfb-dgpsa/pdf/securit/oats_cd-avoine-eng.pdf.
14. Food and Drug Administration, 21 CFR Part 101 [Docket No. FDA–2005–N–0404] Gluten-Free Labeling of Foods.
15. Comission Regulation (EC) No 41/2009 of 20 January 2009 concerning the composition and labelling of foodstuffs suitable for people intolerant to gluten.
16. Sollid LM, Qiao SW, Anderson RP, et al. Nomenclature and listing of celiac disease relevant gluten T-cell epitopes restricted by HLA-DQ molecules. Immunogenetics 2012, 64: 455-460.
17. Londono DM, Van’t Westende WPC, Goryunova S, et al. Avenin diversity analysis of the genus Avena (oat). Relevance for people with celiac disease. J of Cereal Science 2013, 58: 170-177.
18. Comino I, Real A, De Lorenzo L, et al. Diversity in oat potential immunogenicity: basis for the selection of oat varieties with no toxicity in coeliac disease. Gut 2011, 60: 915-922.
19. AOAC Official Method 2012.01 Gliadin as a Measure of Gluten in Foods Containing Wheat, Rye, and Barley. Enzyme Immunoassay Method Based on a Specific Monoclonal Antibody to the Potentially Celiac Toxic Amino Acid Prolamine Sequences. First Action 2012.

4 Analytical research reports 45
4.5 Quantitation of coeliac toxicity in wheat using genomics and proteomics
Luud J.W.J. Gilissen, Elma M.J. Salentijn, Hetty C. van den Broeck, Jan H.G. Cordewener, Twan H.P. America, Jan G. Schaart, Ingrid M. van der Meer, Marinus J.M. Smulders
Wageningen University and Research Centre, Wageningen, The Netherlands
Introduction
Several tests are currently marketed for measuring the amount of gluten in food products and to determine whether products are gluten-free. Of these tests, the Codex Alimentarius approved the R-Biopharm R5 ELISA as the gluten detection standard. This test is based on recognition by a monoclonal antibody (mAb) of five amino acid-long peptide sequences, which are abundantly present in the gliadin proteins of wheat gluten. Another mAb-based test recognises specific peptide sequences of six amino acids (G12 ELISA, Romer Labs). Both tests enable estimating the total amount of gluten (gluten = gliadin x 2) in a wheat product. As the number and composition of coeliac disease (CD) epitopes vary between gliadins and glutenins, among varieties, and between wheat, rye and barley, there is no direct relationship between the estimated gluten content and the presence of CD epitopes.
Many research groups have raised epitope-specific T cell clones (TCCs) from patient biopsies that can be used for detection of specific CD-immunogenic gluten epitopes. Such CD epitopes are specific nine amino acid-long peptide sequences rich in prolamin (P) and glutamin (Q) residues. Recently, a list of internationally agreed CD epitopes has been published [1]. Unfortunately, T cell-based tests are mostly qualitative, indicating the presence or absence of a particular epitope, and they are unable to quantitate the overall CD-immunogencity of a given wheat variety.
Proper quantitation of CD epitopes is relevant because the amount of non-CD-immunogenic gluten proteins can differ among wheat varieties and genomes (ploidy levels) [2], and the CD-immunogenicity of individual epitopes can be different according to the patient’s sensitivity profile [3,4]. Already a single amino acid substitution in a T cell epitope, especially from proline (P) to serine (S), may abolish T cell binding and thus eliminate the epitope’s CD-immunogenicity [5]. Therefore, gluten detection in the context of coeliac disease should be in line with the internationally agreed list of CD-relevant epitopes. To overcome the shortcomings of mAb-based and T cell-based tests, new approaches are now under development, especially based on genomic and proteomic analysis, aiming at the identification of the profile of CD-immunogenic epitopes of individual wheat species and varieties (for breeding and selection), and at quantitation of CD epitope-containing gluten proteins or fragments in foods (for food diagnostics).

46 Quantitation of coeliac toxicity in wheat
Results
Genomic analysis
Salentijn et al. [6] applied pyrosequencing to quantitatively study the gluten gene family-specific transcriptome profile at the mRNA level and detected large differences in the transcript frequencies of -gliadins among various hexaploid and tetraploid wheat varieties. This work has recently been extended with deep sequencing of cDNA in developing grains to (1) classify wheat lines (i.e. 61 tetraploid durum wheat varieties and accessions) with regard to their genetic variation in gliadin mRNA expression, and (2) to identify wheat plants with potentially reduced CD-immunogenicity according to their overall CD epitope mRNA load. From the sequence data the deduced unique -gliadin protein fragments (UPFs) enabled clustering plants hierarchically. In total, about 170 UPFs were found leading to ten different expression profile types (Figure 1).
This type of screening appeared useful to identify durum wheat plants that are potentially less CD-immunogenic. A few plant lines showed a significantly lower fraction of CD epitope-encoding -gliadin transcripts, but none were free of CD epitopes. For some of these plant lines the results confirmed those obtained earlier with mAbs against CD-specific epitopes [7]. For example, the landrace Dibilik Sinde (CGN08006) and some other potential low CD-immunogenic lines revealed a profile with a high level of mRNA of -gliadins with a proline (P) to serine (S) substitution on position p8, which abolishes T cell binding [5,8]. Not all lines identified with these mAbs by Van den Broeck et al. [7] were confirmed by deep sequencing of cDNA of immature seeds [9]. This could indicate the limited accuracy of mAbs in the evaluation of CD immunogenicity. At the same time it is generally known that the levels of mRNA and the related protein may differ. This requires the mRNA levels, measured at two stages of development of the seed endosperm, to be compared with the amounts of the corresponding proteins in the mature grains.
The deep transcript sequencing method is well-suited to study the genetic variation in -gliadin transcripts, and to obtain an overview of epitopes and variants thereof that exist in the germplasm, as it is an excellent method to obtain exact information on all qualitative differences in epitope content between varieties. The information can then be used to screen for plants that are potentially less CD-immunogenic. This research is currently being extended to einkorn (A genome) and spelt varieties (spelt is a hexaploid wheat species that is different from bread wheat), and to the wild ancestor of the D genome of bread wheat, Aegilops tauschii [10].
Figure 1 demonstrates the hierarchical clustering of -gliadin expression profiles of durum wheat plants into ten profile groups (according to the cDNA-deduced proteins). The main unique -gliadin protein fragments in these profile groups containing the DQ2.5-glia-α1, α2 and α3 natural variants have been further quantitated (not shown here): The canonical DQ2.5-glia-α1 sequence PFPQPQLPY was found to be most abundant in all profiles [9].

4 Analytical research reports 47
Figure 1. Hierarchical clustering of -gliadin expression profiles of 61 durum wheat varieties and accessions (samples). The unique -gliadin protein fragments (UPFs) are deduced from cDNA sequence data. The UPFs are differentially present among the sample clusters. The color scale range indicates the normalised expression level ranging from zero (light grey) to >20% (dark red) (source: [9])
Proteomic analysis
Due to the limited selectivity of mAbs for unambiguous identification of CD-immunogenic epitopes, and the fact that mRNA transcript sequencing is qualitatively very accurate but the relative numbers of transcripts during endosperm development do not necessarily correspond to the amounts of protein accumulated in the mature grains, there is a need for a new, sensitive method for gluten protein identification and quantitation based on mass spectrometry (MS) [11,12,13]. We have developed an LC-MS method for non-targeted label-free comparative analysis of gluten proteins present in different wheat varieties and species enabling relative quantitation of CD-immunogenic epitope-containing gluten fragments. The non-targeted LC-MS analysis further allowed us the design of a fast quantitative method for targeted analysis of specific CD-toxic sequences in gluten proteins. This so-called LC-MRM (Multiple

48 Quantitation of coeliac toxicity in wheat
Reaction Monitoring) analysis is both highly selective and sensitive, and the used triple quadrupole (QQQ) mass spectrometer can be fine-tuned to specifically quantitate peptides of interest in a complex protein digest. Six peptides containing highly immunogenic Glia-α2/α9 CD epitopes present in natural gliadin proteins were synthesised and used to optimise the LC-MRM method. For these peptides, calibration curves were made to enable quantitation of the absolute concentration of the corresponding peptides in different wheat varieties (Figure 2). This method is being extended towards further identification and quantitation of a larger set of epitope-containing sequences from other gluten proteins (gliadins and glutenins) (Van den Broeck et al., in preparation).
Figure 2 shows quantitative data of six peptides containing (overlapping) CD epitopes in two wheat varieties using LC-MRM. The tetraploid variety contains only two (P5 and P6) out of the six peptides because this variety lacks the D-genome that codes for the peptides P1 to P4 (Van den Broeck et al., in preparation).
Figure 2. Quantitation using LC-MRM of six CD-toxic epitope-containing gluten peptides in two wheat varieties (Van den Broeck et al., in preparation)

4 Analytical research reports 49
Discussion
Major CD-immunogenic epitopes (e.g. DQ2.5-glia-α1, α2 and α3) occur in the first variable domain of wheat -gliadins. Deep sequencing has focused on this domain. The use of mRNA transcripts, and not genomic DNA, circumvented the problem of analysing sequences from pseudo-genes, which occur at high frequency in the -gliadins of wheat [2]. Figure 1 shows the deduced proteins from the expressed gliadin genes in developing seeds. Some early or late expressed -gliadins may have been missed or may be underrepresented, because mRNA was collected from developing seeds at 21 days after anthesis. It can also not be ruled out that the amounts of gliadin proteins, suggested to be present on the basis of the mRNA expression profiles, are not realistic because of the fact that amounts of mRNA and amounts of corresponding protein might not correlate in a 1:1 ratio. This aspect needs further mRNA analysis from younger developing seed stages and at maturation, and should be compared to quantitative proteomics data from ripe seeds. Nevertheless, the resulting gluten epitope expression profiles as well as the individual gluten gene sequences collected in the gluten database will be useful, both as a rapid screening test to estimate the CD toxicity of an individual wheat variety, and as an essential reference for validation and interpretation of the quantitative proteomics analysis. The accuracy of such estimations will appear soon from experience obtained from the combined genomic and proteomic analyses. In conclusion, integration of seed transcriptomic and proteomic data will provide the ultimate tool for determining and quantitating the CD epitope load.
Vader et al. [2] and Camarca et al. [4] clearly demonstrated the existence of different epitope-sensitivity profiles among patients. Therefore, knowledge on the epitope profile of individual wheat varieties may become useful in designing wheat food products from varieties with epitope profiles that fit to the epitope-sensitivity profile of individual patients. In this context, the genomic data open the possibility for breeding of wheat varieties with reduced CD toxicity or with specific gluten-epitope composition. Next to such controlled elimination of genes expressing gluten proteins with specific epitope composition, down-regulation of gliadin expression through RNA interference has now also been shown to be an effective strategy [14,15].
The interest in gluten-free products is growing world-wide. The number of consumers embracing a gluten-free diet is going far beyond the prevalence of CD of 1% in the population. It is not clear from medical observations whether these consumers need a gluten-free diet for medical reasons. However, a correlation seems to exist with the occurrence of irritable bowel syndrome (IBS), suggesting that 5 - 10% of the population may improve their quality of life and their health situation by adhering to a gluten-free (wheat-free) diet [16]. It has been suggested that other wheat proteins might be involved, such as amylase trypsin inhibitors (ATI) [17]. Also in this case, the integrated transcriptomics-proteomics approaches will be useful in further identification and characterisation.

50 Quantitation of coeliac toxicity in wheat
Acknowledgements
This research was funded by the Coeliac Disease Consortium, an Innovative Cluster approved by the Netherlands Genomics Initiative and partially funded by the Dutch Government (BSIK03009), and by the DLO program ‘Plant and Animal for Human Health’ (KB-05-001-019-PRI; KB-15-001-007).
References
1. Sollid LM, Qiao SW, Anderson RP, et al. Nomenclature and listing of celiac disease relevant gluten T-cell epitopes restricted by HLA-DQ molecules. Immunogenetics 2012, 64: 455–460.
2. Van Herpen TWJM, Goryunova SV, van der Schoot J, et al. Alpha-gliadin genes from the A, B, and D genomes of wheat contain different sets of celiac disease epitopes. BMC Genomics 2006, 7: 1.
3. Vader W, Kooy Y, Van Veelen P, et al. The gluten response in children with celiac disease is directed toward multiple gliadin and glutenin peptides. Gastroenterology 2002, 122: 1729-1737.
4. Camarca A, Anderson RP, Mamone G, et al. Intestinal T cell responses to gluten peptides are largely heterogeneous: implications for a peptide-based therapy in celiac disease. J Immunol 2009, 182: 4158-4166.
5. Mitea C, Salentijn EMJ, van Veelen P, et al. A universal approach to eliminate antigenic properties of alpha-gliadin peptides in celiac disease. PLoS ONE 2012, 5(12): e15637.
6. Salentijn EMJ, Goryunova SV, Bas N, et al. Tetraploid and hexaploid wheat varieties reveal large differences in expression of alpha-gliadins from homoeologous Gli-2 loci. BMC Genomics 2009, 10: 48.
7. Van den Broeck HC, de Jong HC, Salentijn EMJ, et al. Presence of celiac disease epitopes in modern and old hexaploid wheat varieties. Wheat breeding may have contributed to increased prevalence of celiac disease. Theor Appl Genet 2010, 121: 1527-1539.
8. Salentijn EMJ, Mitea DC, Goryunova SV, et al. Celiac disease T cell epitopes from gamma-gliadins: immunoreactivity depends on the genome of origin, transcript frequency, and flanking protein variation. BMC Genomics 2012, 13: 277.
9. Salentijn EMJ, Esselink DG, Goryunova SV, et al. Quantitative and qualitative differences in celiac disease epitopes among durum wheat varieties identified through deep RNA-amplicon sequencing. BMC Genomics 2013, 14: 905.
10. Jones H, Gosman N, Horsnell R, et al. Strategy for exploiting exotic germplasm using genetic, morphological, and environmental diversity: the Aegilops tauschii Coss. Example. Theor Appl Genet 2013, 126: 1793-1808.

4 Analytical research reports 51
11. Sealey-Voyksner JA, Khosla C, Voyksner RC, et al. Novel aspects of quantification of immunogenic wheat gluten peptides by liquid chromatography-mass spectrometry. J Chromatogr A 2010, 1217: 4167-4183.
12. Tanner GJ, Colgrave ML, Blundell MJ, et al. Measuring hordein (gluten) in beer – A comparison of ELISA and mass spectrometry. PLoS ONE 2013, 8: e56452.
13. Konitzer K, Wieser H, Koehler P. Development of a non-immunogenical method for gluten quantification. In: Koehler P (ed) Proceedings of the 26th Meeting of the Working Group on Prolamin Analysis and Toxicity. Verlag Deutsche Forschungsanstalt für Lebensmittelchemie (DFA), 2013, pp. 51-56.
14. Gil-Humanes J, Pistón F, Tollefsen S, et al. Effective shutdown in the expression of celiac disease-related wheat gliadin T-cell epitopes by RNA interference. In: Proc Natl Acad Sci USA, 2010, 107: 17023-17028.
15. Becker D, Wieser H, Koehler P, et al. Protein composition and techno-functional properties of transgenic wheat with reduced α-gliadin content obtained by RNA interference. J Appl Bot Food Qual 2012, 85: 23-33.
16. Gilissen LJWJ, van der Meer IM, Smulders MJM. Reducing the incidence of allergy and intolerance to cereals. J Cereal Sci 2014, http://dx.doi.org/10.1016/ j.jcs.2014.01.005.
17. Junker Y, Zeissig S, Kim SJ, et al. Wheat amylase trypsin inhibitors drive intestinal inflammation via activation of toll-like receptor 4. J Exp Med 2012, 209: 2395-2408.

52 Quantitation of coeliac toxicity in wheat

4 Analytical research reports 53
4.6 Estimated quantities of gluten peptides arriving at the intestinal brushborder
Katharina Konitzer, Herbert Wieser, Peter Koehler
German Research Centre for Food Chemistry, Leibniz Institute, Freising, Germany
Introduction
The storage proteins (gluten) of wheat, rye, barley, their crossbred varieties, and possibly oats are the triggering factor of coeliac disease (CD). Currently, over 1000 CD-specific, immunogenic peptides from all storage protein types of wheat, rye, barley, and oats have been identified [1]. After ingestion, dietary proteins are initially proteolysed in the stomach by pepsin and further on in the duodenum by pancreatic proteases. The resulting oligopeptides are processed by exo- and endopeptidases on the brushborder surface of the jejunum to amino acids, di- and tripeptides, which can be transported across the epithelial cells into the lamina propria prior to distribution throughout the body. Immunogenic oligopeptides such as the 33mer from α2-gliadins (56-88, LQLQPFPQPQLPYPQPQLPYPQPQLPYPQPQPF) and the 26mer from γ-gliadins (26-51, FLQPQQPFPQQPQQPYPQQPQQPFPQ) [2] are almost exclusively derived from the repetitive domains of proteins. Due to their high proline (P) and glutamine (Q) contents, gluten proteins are fairly resistant to cleavage by gastric, pancreatic and brushborder enzymes. This leads to an increased presence of oligopeptides with at least nine amino acids, which is the minimum length required for binding by HLA-DQ2/8 expressed on the cellular surface of antigen-presenting cells.
It has been proposed that the likelihood for CD development is dependent on the efficiency of gluten presentation by antigen-presenting cells to CD4+ T cells [3]. The major factors influencing this efficiency are the amount of oral gluten intake, the degree of gastrointestinal digestion, the rate of trans- or paracellular epithelial passage, the degree of deamidation by transglutaminase 2, the gene dose of HLA-DQ2/8, and the proportion of stimulated HLA-DQ2/8 - T cell receptor complexes. This threshold model implies that the development of CD becomes more likely if more T cells are exposed to gluten peptides.
Despite being a critical parameter for CD development, there is no information available about the quantities of gluten peptides arriving at the intestinal brushborder. Therefore, a quantitative estimation of gluten peptides was established based on an oral intake of 100 g whole grain of wheat, rye, barley, or oats. Taking enzymatic cleavage in the gastrointestinal tract into account, the amounts of peptides with at least nine amino acids from all storage protein types were calculated.

54 Estimated quantities of gluten peptides arriving at the intestinal brushborder
Results and discussion
Protein and gluten content
Wheat, rye, barley, and oats vary in their protein content based on 100 g whole grain [4], with rye having the lowest protein content (Table 1). Since the gluten (sum of prolamins and glutelins) content in wheat, rye, and barley is typically in a range of 70 - 80% of total protein, 75% of total protein was taken to be gluten. In oats, only 14% of total protein is avenin [5], so that the gluten content is considerably lower.
Table 1. Contents of protein and gluten based on 100 g whole grain [4,5].
mg/100 g Whole grain Wheat Rye Barley Oats
Protein 10600 8800 10400 9900 Gluten 7950 6600 7800 1386
Content of Pooideae storage protein types
Gluten proteins are a complex mixture of different protein types which can be classified into a high molecular weight (HMW, Mr: 75000 - 90000), a medium molecular weight (MMW, Mr: 36000 - 46000), and a low molecular weight (LMW, Mr: 22000 - 34000) group. Each group comprises one or more protein types with different proportions (Table 2). The protein types from wheat, rye, barley, and oats share homologous amino acid sequences and can be aligned accordingly. This arrangement shows that ω5- and α-gliadins are unique to wheat.
Table 2. Classification and proportions of Pooideae storage protein types [6,7,8].
Group Wheat Rye Barley Oats
HMW HMW-glutenins (p) HMW-secalins (p) D-hordeins (p) - 11% 9% 5%
MMW ω1,2-gliadins (m) ω-secalins (m) C-hordeins (m) - 4% 18% 36% ω5-gliadins (m) - - - 3%
LMW LMW-glutenins (p) γ-75k-secalins (p) B-hordeins (p) - 22% 48% 27% γ-gliadins (m) γ-40k-secalins (m) γ -hordeins (m) avenins 27% 25% 32% 100% α-gliadins (m) - - - 33%
HMW: high molecular weight, MMW: medium molecular weight, LMW: low molecular weight, m: monomeric, p: polymeric

4 Analytical research reports 55
Considering the different amounts of storage protein types, the gluten content was subdivided into the respective protein types (Figure 1). Based on 100 g whole grain, γ-75k-secalins, C-hordeins, and α-gliadins provided the highest and ω5-gliadins, ω1,2-gliadins and D-hordeins the lowest amounts.
Content of repetitive domains
It is known that immunogenic peptides are almost exclusively derived from the repetitive protein domains [1]. Depending on the protein type, protein lengths range from 637 to 815 amino acids in the HMW group, from 328 to 420 amino acids in the MMW group, and from 203 to 436 amino acids in the LMW group. Generally, these proteins can be divided into an N-terminal domain, a repetitive domain, and a C-terminal domain. The respective percentages of the length of the repetitive domain within the protein to the length of the entire protein are also highly variable and range from 30% (B-hordeins) to 96% (ω-secalins). Taking only the contents of repetitive domains into account, C-hordeins, γ-75k-secalins, γ-hordeins, and ω-secalins provided the highest and ω5-gliadins, ω1,2-gliadins and D-hordeins the lowest amounts based on 100 g whole grain (Figure 1).
In silico enzymatic digestion
Then the repetitive domains were subjected to an in silico enzymatic digestion taking one protein representing one protein type each [9]. The enzymes used were pepsin (pH > 2, cleavage before and after hydrophobic amino acids, e.g. X┼L┼X, X┼F┼X), chymotrypsin (high specificity, cleavage after aromatic amino acids, e.g. F┼X, Y┼X), and trypsin (cleavage after basic amino acids, e.g. K┼X, R┼X) with X representing any amino acid except proline, because no cleavage before or after proline was allowed. From the resulting peptides, only peptides with a length of at least nine amino acids were included.
Content of peptides with at least nine amino acids
The numbers and lengths of peptides were also highly variable depending on the repetitive section of the protein type they were derived from. Whereas only one peptide with a length of 10 amino acids was generated from avenins, 33 peptides were formed from x-type HMW-glutenins and 32 from x-type HMW-secalins. The maximum lengths of peptides were 167, 120, and 97 from γ-75k-secalins, D-hordeins, and C-hordeins, respectively. Compared to the length of the original repetitive domains, the sum of peptide lengths covered 100% of the repetitive domains for ω5-gliadins and γ-75k-secalins and 80 to 90% of the repetitive domains for the other protein types. The only exception was oat avenins with the single, 10 amino acid peptide (QPYPEQQEPF) covering only 11% of the repetitive avenin sequence. The amounts of peptides based on 100 g whole grain showed considerable variation (Figure 1). The highest amounts were again derived from C-hordeins, γ-75k-secalins, γ-hordeins, and ω-secalins and the lowest amounts from avenins, ω5-gliadins, ω1,2-gliadins and D-hordeins. While the amounts of peptides compared to the amounts of

56 Estimated quantities of gluten peptides arriving at the intestinal brushborder
protein types decreased by 95% for avenins, by 76% for LMW-glutenins and by 72% for α-gliadins and B-hordeins, they only decreased by 11% for ω5-gliadins, by 13% for ω-secalins, and by 15% for ω1,2-gliadins. Therefore high amounts of protein types do not necessarily result in high amounts of peptides with at least nine amino acids.
Figure 1. Contents of protein types, repetitive protein domains and peptides with at least nine amino acids based on 100 g whole grain of wheat, rye, barley, or oats [mg/100 g whole grain]
Further steps of peptide metabolism
The steps following the arrival of gluten peptides at the intestinal brushborder are only partly known. Depending on their length, gluten peptides may be partially degraded by brushborder enzymes such as aminopeptidase and dipeptidyl peptidase IV, but the 33mer and the α31-49 peptide were resistant to cleavage [10].
Prior to interacting with the immune cells of the lamina propria, gluten peptides have to pass the epithelial barrier either by transcellular passage or by the paracellular pathway through the tight junctions. During transcellular, nonspecific endocytosis peptides may be degraded through the acidic endosomal/lysosomal compartments of enterocytes. While the degree of degradation of the 33mer was 90% for controls and patients with treated CD, it was only 50% for patients with active CD [10]. Whereas the barrier function of the tight junctions is intact in healthy individuals, CD patients show increased intestinal permeability due to upregulation of zonulin. Gluten peptides passing through this paracellular route may reach the lamina propria unmodified and interact with macrophages resulting in the creation of a proinflammatory milieu [11].
Once gluten peptides have arrived at the lamina propria, they may be either deamidated or transamidated by transglutaminase 2 (tTG) [12,13]. Deamidation of specific glutamine residues to glutamic acid results in a higher binding affinity of gluten peptides to HLA-DQ2/8. Transamidation leads to crosslinking of gluten peptides either to tTG or to other extracellular matrix proteins so that gluten peptides
0
500
1000
1500
2000
2500
3000
3500
ω5 ω1,2 α γ HMW LMW ω γ-40kHMWγ-75k C γ D B AVE
[mg/
100
g w
hole
gra
in]
Protein types Protein domain Peptides
Gliadins HordeinsSecalinsGlutenins Avenins

4 Analytical research reports 57
accumulate in the lamina propria. Conjugates between tTG and gluten peptides activate the production of anti-transglutaminase antibodies.
The respective contributions of each peptide arriving at the brushborder membrane in triggering the innate and adaptive immune responses in CD still have to be elucidated. Most studies were performed with exemplary peptides that were derived from α-gliadins in the majority of cases. The role of peptides from glutenins and from rye or barley has rarely been studied so far. Therefore, no information on the content of immunogenic peptides can be derived from the estimated contents of gluten peptides per 100 g whole grain.
Conclusions
After the in silico peptic-tryptic-chymotryptic digest of the repetitive domains from all gluten protein types long peptides with up to 167 amino acids remained. These peptides are presumably too long for cleavage by brushborder enzymes and may survive the epithelial passage. The identified peptide QPYPEQQEPF from oat avenins is part of the T cell stimulatory peptide 1490 SEQYQPYPEQQEPFVQQQQ [14]. However, the very low amount (66 mg) of one peptide from oat avenins is in accordance with the controversial CD-toxicity of oats.
The highest quantities of peptides were derived from rye and barley, especially from γ-75k-secalins and C-hordeins, followed by γ-hordeins and ω-secalins. This may explain the overestimation of rye and barley by the R5 monoclonal antibody when gliadin is used as a calibrator [15]. Furthermore, it may be possible that wheat, and particularly α-gliadins, are overestimated as most immunogenic agents in CD. More studies with peptides derived from all storage protein types of wheat, rye, barley, and oats are necessary to elucidate their respective contributions to the innate and adaptive immune responses in CD.
References
1. Celiac Disease database of the University of Nebraska-Lincoln (allergenonline.org, 02. October 2013).
2. Shan L, Qiao S-W. Arentz-Hansen H, et al. Identification and analysis of multivalent proteolytically resistant peptides from gluten: implications for celiac sprue. J Proteome Res 2005, 4: 1732-1741.
3. Tjon JM-L, van Bergen J, Koning F. Celiac disease: how complicated can it get? Immunogenetics 2010, 62: 641-651.
4. Der kleine Souci-Fachmann-Kraut: Lebensmitteltabelle für die Praxis. Wissenschaftliche Verlagsgesellschaft mbH, Stuttgart, 2011, pp. 223, 225, 233, 241.

58 Estimated quantities of gluten peptides arriving at the intestinal brushborder
5. Wieser H, Seilmeier W, Belitz H-D. Vergleichende Untersuchungen über partielle Aminosäuresequenzen von Prolaminen und Glutelinen verschiedener Getreidearten. I. Proteinfraktionierung nach Osborne. Z Lebensm Unters Forsch 1980, 170: 17-26.
6. Wieser H, Kieffer R. Correlations of the amount of gluten protein types to the technological properties of wheat flours determined on a micro-scale. J Cereal Sci 2001, 34: 19-27.
7. Gellrich C, Schieberle P, Wieser H. Biochemical characterization and quantification of the storage protein (secalin) types in rye flour. Cereal Chem 2003, 80:102-109.
8. Lange M, Vincze E, Wieser H, et al. Suppression of C-hordein synthesis in barley by antisense constructs results in a more balanced amino acid composition. J Agric Food Chem 2007, 55: 6074-6081.
9. Database UniProt KB, PeptideCutter tool (ExPASy) (uniprot.org, 02. October 2013).
10. Matysiak-Budnik T, Candalh C, Dugave C, et al. Alterations of the intestinal transport and processing of gliadin peptides in celiac disease. Gastroenterol 2003, 125: 696-707.
11. Fasano A. Zonulin and its regulation of intestinal barrier function: the biological door to inflammation, autoimmunity, and cancer. Physiol Rev 2011, 91: 151-175.
12. Dieterich W, Ehnis T, Bauer M, et al. Identification of tissue transglutaminase as the autoantigen of celiac disease. Nat Med 1997, 3: 797-801.
13. Di Sabatino A, Vanoli A, Giuffrida P, et al. The function of tissue transglutaminase in celiac disease. Autoimmun Rev 2012, 11: 746-753.
14. Arentz-Hansen H, Fleckenstein B, Molberg O, et al. The molecular basis for oat intolerance in patients with celiac disease. PLoS Med 2004, 1: e1.
15. Kanerva P, Sontag-Strohm TS, Ryoppy, PH, et al. Analysis of barley contamination in oats using R5 and ω-gliadin antibodies. J Cereal Sci 2006, 44: 347-352.
4 Analytical research reports 59
4.7 Studies on the degradation of gluten with peptidases from different sources
Theresa Walter, Herbert Wieser, Peter Koehler
German Research Centre for Food Chemistry, Leibniz Institute, Freising, Germany
Introduction
A number of bacterial and fungal peptidases with the capability of degrading gluten in foods and raw materials for coeliac disease patients (“prolylendopeptidases”) have been described in the last years. Examples are the commercially available AN-PEP from Aspergillus niger [1,2] and enzymes from bran of germinated cereals [3,4]. Both types of enzymes exhibit a gluten-specific peptidase activity, i.e. not only gluten peptides but also intact gluten proteins can be degraded. Studies comparing the potential of AN-PEP and enzymes from germinated cereals for degrading gluten in foods are not available up until now. Therefore, the present study aimed at comparing the ability of these enzymes to eliminate gluten in foods.
Materials and methods
Determination of peptidase activity
Gluten-specific peptidase activities were tested both towards a protein- (gliadin isolated from common wheat cv. Cubus) and two peptide-based substrates (PQPQLPYPQPQLPY from α-gliadin and SQQQFPQPQQPFPQQP from γ-hordein). Bran from germinated cereals was extracted with a sodium acetate buffer (0.2 mol/L, pH 4.0) at 4 °C to obtain enzyme solutions. AN-PEP solutions were prepared by dissolving the lyophilised fermentation broth of Aspergillus niger in distilled water. Gliadin or coeliac-active peptides were incubated with the enzyme solutions at 50 °C for 60 - 150 min at pH values between 1.0 and 9.0. The reactions were stopped by heating to 90°C for 10 min. Unincubated and incubated sample solutions were separated by reversed-phase high-performance liquid chromatography (RP-HPLC) with UV-detection at 210 nm. Activities were quantitated on the basis of the reduction of relevant HPLC peak areas before and after incubation.
Gluten quantitation
The gluten content was quantitated by means of a competitive ELISA using the R5 antibody.
Degradation of gluten in foods
The following foods were subjected to peptidase treatment for gluten degradation: A commercially available wheat starch (wheat starch 1), two self-isolated wheat starches

60 Degradation of gluten in food with peptidases
from wheat cv. Tommi (wheat starch 2) and cv. Flair (wheat starch 3), bran from wheat grain of cv. Hermann (wheat bran 1), bran from germinated wheat grain of cv. Hermann (wheat bran 2), a commercial rye flour (rye flour), and a sourdough starter based on rye flour (“Böcker F10”, rye sourdough starter). Samples were incubated with enzyme solutions at temperatures between 4 and 60 °C and pH values between 1.0 and 9.0 for 4 to 48 h. After incubation the solvent was removed by lyophilisation and gluten was quantitated as described above.
Comparison of quality parameters
Peptidase-treated wheat starch was analysed for residual peptidase activity (RP-HPLC), amylase activity (Amylazyme-Method) as well as for its thermal (Differential Scanning Calorimetry, DSC) and pasting properties (Rapid Visco Analyser, RVA). In wheat bran, the content of folates and dietary fiber was determined. Rye products were checked for their techno-functional properties by performing baking tests and by evaluating loaf volume of the bread, firmness of the crumb, and sensory aspects. Samples before peptidase treatment were used as controls, respectively.
Results and discussion
Peptidase activity
Both enzymes from bran of germinated cereals and AN-PEP showed peptidase acitivity towards all substrates. The specific activity of bran extracts from germinated cereals was around 60 U/kg bran (substrate PQPQLPYPQPQLPY from α-gliadin) [5]. AN-PEP was present in a much more concentrated form and aqueous solutions had specific peptidase activities of up to more than 7000000 U/kg lyophilised powder.
Gluten quantitation
The gluten content of the food samples before incubation with peptidases is shown in Table 1. Bran 1 had a gluten content of more than 100000 mg/kg (ca. 10% of the sample). The gluten content of the other samples was between 110 and 81000 mg/kg.
Table 1. Gluten content of food samples before peptidase treatment.
Sample Gluten content (mg/kg)
Wheat starch 1 110 ± 6 Wheat starch 2 1679 ± 104 Wheat starch 3 2070 ± 6 Wheat bran 1 107285 ± 1245 Wheat bran 2 5335 ± 401 Rye flour 56173 ± 130 Rye sourdough starter 80536 ± 1704

4 Analytical research reports 61
Degradation of gluten by peptidase treatment
Peptidases from both sources were capable of degrading gluten in foods. Extracts from bran of germinated cereals reduced the gluten content of starch 1 (initially 110 mg gluten/kg) after incubation. However, further experiments showed that peptidases from this source were not able to degrade gluten to a concentration below 20 mg/kg. This would have been required to justify a gluten-free claim. In contrast, AN-PEP eliminated gluten in starch 1 to a concentration below the limit of quantitation of the ELISA (5 mg gliadin/kg). Therefore, only AN-PEP was subsequently used to degrade gluten in the other samples.
The concentrations of AN-PEP and the conditions of incubation for degrading gluten to a concentration below 20 mg/kg are given in Table 2. Gluten in wheat starch was easily degraded by AN-PEP in a wide range of pH values (1.0 - 6.0) and temperatures (4 - 60 °C). In contrast, gluten in wheat bran 1 (initially 107285 mg/kg) was very resistant to complete degradation. Both enzyme concentration and incubation time had to be increased to achieve a final gluten concentration below 20 mg/kg. The same was true for all other samples. Two additions of an enzyme concentration of 500 mg/kg and an incubation time of up to 48 h were necessary to extensively degrade gluten in rye flour. Altogether, wheat starches with gluten contents of up to 2000 mg/kg, wheat bran with up to 107000 mg gluten/kg and rye products containing more than 80000 mg gluten/kg were detoxified by AN-PEP.
Table 2. AN-PEP concentrations, incubation times, and pH values necessary to degrade gluten to a concentration below 20 mg/kg in food samples.
Sample Enzyme
concentration (mg/mL)
Duration of incubation (h)
pH value
Wheat starch 1 10 4 1.0 – 6.0 Wheat starch 2 100 24 1.0 – 6.0 Wheat starch 3 100 24 1.0 – 6.0 Wheat bran 1 400 48 1.0 – 4.0 Wheat bran 2 400 24 1.0 – 4.0
Rye flour 2 x 500b 48 4.0 Rye sourdough starter 100 48 1.0 – 9.0
a RT = room temperature, b addition of AN-PEP at the beginning and after 24 h of incubation
Comparison of quality parameters
Analysis of quality parameters showed no detrimental effects of peptidase treatment except for a decrease of the pasting viscosities of enzyme-treated wheat starches in the RVA as compared to native starches. This effect could be minimised by using shorter incubation times and higher concentrations of AN-PEP. Peptidase treatment rendered wheat bran gluten-free without any adverse effects. Using bran from germinated wheat

62 Degradation of gluten in food with peptidases
(wheat bran 2) led to an increased content of dietary fiber (1.5-fold) and especially folates (20-fold) and, thus, provided a gluten-free raw material with an additional health value after peptidase treatment. Finally, baking tests with peptidase-treated, gluten-free rye products yielded breads with improved quality parameters as compared to breads from a mix of gluten-free ingredients. Sensory evaluation showed improved attributes compared to breads from coeliac-safe raw materials but poorer sensory quality as compared to a traditional gluten-containing rye bread.
Conclusions
Gluten-containing cereal-based foods can be rendered gluten-free by means of AN-PEP. This offers the possibility to produce gluten-free foods with typical quality parameters of the corresponding gluten-containing starting materials. Therefore, the industrial application of AN-PEP, e.g. in the production of gluten-free wheat starch seems feasible. The use of bran extracts from germinated cereals may be a promising alternative, but it would be necessary to concentrate or purify the extracts to achieve higher peptidase activities.
References
1. Edens L, Van der Hoeven R, De Ros AL, et al. Use of proline-specific endoproteases to hydrolyse proline-rich peptides at acid pH in food processing. Patent No, 2005/027953.
2. Lopez M, Edens L, Effective Prevention of Chill-Haze in Beer Using an Acid Proline-Specific Endoprotease from Aspergillus niger. J Agric Food Chem 2012, 53: 7944-7949.
3. Hartmann G, PhD Thesis: Abbau von Getreidespeicherproteinen durch endogene Peptidasen. Technische Universität München, 2009; pp. 134-194.
4. Gessendorfer B, Hartmann G, Wieser H, et al. Determination of celiac disease-specific peptidase activity of germinated cereals. Eur Food Res Technol 2011, 232: 205-209.
5. Schwalb T, Wieser H, Koehler P. Studies on the gluten-specific peptidase activity of germinated grains from different cereal species and cultivars. Eur Food Res Technol 2012, 235: 1161-1170.

5 Clinical research reports 63
5 Clinical research reports
5.1 Biased T cell receptor usage in coeliac disease
Frits Koning
Leiden University Medical Centre, Leiden, The Netherlands
Introduction
Many autoimmune diseases are linked to the expression of particular HLA-molecules [1,2]. HLA-molecules present peptides derived from self and non-self-proteins to the T cells of the immune system as a means to detect and ultimately destroy invading pathogens. The capacity to distinguish between peptides derived from self and non-self-proteins is therefore a crucial feature of the immune system. Failure of this mechanism can result in T cell reactivity against peptides derived from self-proteins and cause autoimmunity. This is the most likely explanation for the association between particular HLA-molecules and the occurrence of autoimmune diseases like rheumatoid arthritis and type 1 diabetes. Notwithstanding these well-known associations, little is known about the nature of the HLA-bound self-peptides that are involved in these autoimmune diseases. There is, however, one striking exception: coeliac disease (CD). CD is a disease of the small intestine caused by intolerance to gluten, proteins found in wheat, barley, and rye. CD has an extraordinarily strong HLA-association: almost all patients express HLA-DQ2 and/or HLA-DQ8 [1,2]. Moreover, it is well established that these HLA-molecules can bind (modified) gluten peptides and in patients, but not healthy controls, T cells are present in the inflamed intestine that respond to these HLA-DQ-gluten complexes and secrete pro-inflammatory cytokines. Importantly, the modification involves the conversion of particular glutamine residues in gluten peptides into glutamic acid by the enzyme tissue transglutaminase, thus introducing negative charges that facilitate peptide binding to the disease predisposing HLA-DQ2 or HLA-DQ8 molecules [3,4] and this is considered a crucial step in disease pathogenesis [1,2]. Further evidence that such T cell responses underlie the disease is the observation that the complete withdrawal of gluten from the diet results in the disappearance of symptoms and (usually) full recovery [1,2].
We have generated a large panel of gluten-specific T cells isolated from small intestinal biopsies of children and adults with coeliac disease. Without exception, these T cells are specific for (modified) gluten peptides when bound to either HLA-DQ2 or HLA-DQ8. We and others have determined the nature of the gluten peptides that are specifically recognised by such T cells [1,2,5]. Through this work it has been established that in children this T cell response appears to be diverse while in adults responses to particular gluten peptides are almost invariably found, potentially indicating selection of T cells with particular specificities over time [6,7]. Such

64 Biased T cell receptor usage in coeliac disease
immunodominant responses are highly specific for peptides derived from /-gliadins and homologues thereof in the gluten-like proteins in barley and rye [5]. Strikingly, most of these peptides contain several proline residues in the 9 amino acid core required for binding to HLA-DQ, rendering them highly resistant to degradation in the gastrointestinal tract [8], a property likely related to their immunodominance. More recently, attention has shifted to the analysis of the T cell receptor repertoire utilised by gluten-specific T cells in an attempt to further unravel the role of these gluten-specific T cells in CD.
Results and discussion
Recently, we have started to analyse the T cell receptor (TCR) usage by T cell clones specific for an immunodominant -gliadin derived peptide that is specifically targeted in HLA-DQ8 positive patients (Table 1) [9]. We observed that three T cell clones generated from three unrelated patients with CD expressed a T cell receptor composed of TRAV26 in combination with TRBV9 (Table 1) [9]. Strikingly, a non-germline encoded arginine (R) was present in the TRAV CDR3 regions of all three TRAV26.2 positive T cell clones (underlined in Table 1).
Table 1. TRAV and TRBV gene usage and CDR3 region sequences of 3 HLA-DQ8-α-1 gliadin specific T cell clones isolated from three unrelated patients with CD.
Clone TRAV TRAV CDR3 sequence TRBV TRBV CDR3 sequence
L3-12 26-2*01 YYC ILRDSRAQKLV FG 9*01 CAS SAGTSGEYEQ YFG
S13 26-2*01 YYC ILRDRSNQFY FG 9*01 CAS STTPGTGTETQ YFG
E1 26-2*01 YYC ILRDSRAQKLV FG 9*01 CAS SVGVAGEYEQ YFG
Similarly, Qiao et al. have reported biased T cell receptor usage in T cell clones specific for -gliadin peptides bound to HLA-DQ2 [10,11]. As the potential T cell receptor repertoire in any individual is enormous (estimated to exceed 1018) this indicates that out of this repertoire certain T cell receptors are selected that are very well suited for the recognition of gluten peptides bound to HLA-DQ2 or HLA-DQ8. Importantly, the structure between such a gluten-specific T cell receptor and HLA-DQ8-gliadin has shed light on the selection of such biased T cell receptors [9]. In particular, the non-germline encoded arginine was found to play a dominant role as it interacts with the p1 glutamate and the p3 serine residues in the gliadin peptide as well as with a phenylalanine residue in the HLA-DQ8 alpha-chain. In addition, a leucine residue encoded by the TCRB CDR1 region and a tyrosine residue encoded by the TCRB CDR2 region make several contacts with multiple residues in the gliadin peptide which offers a likely explanation for the TRBV9 bias as the combination of these two amino acids is unique to this TRBV. Thus, there are two distinct “hot spots” underpinning the interaction between the biased T cell receptor and HLA-DQ8-

5 Clinical research reports 65
gliadin. Current studies are in progress to provide additional information on the selection of such biased T cell receptors in both HLA-DQ2 and HLA-DQ8 associated diseases.
These observations raise a number of important questions. First of all, are such biased gluten-specific T cell receptors present in healthy individuals? If so, how are they controlled to prevent disease? If not, is their appearance linked to disease initiation? The latter issue is particularly relevant as the generation of T cell receptors is a random process that continues during life. It is thus feasible that HLA-DQ2 and HLA-DQ8 individuals will not develop CD as long as the relevant T cell receptors are not generated. Alternatively, the presence of such high affinity T cell receptors may be linked to disease severity. These issues will be the topic of future research.
Conclusions
Strong evidence is emerging for the selection of a high affinity biased T cell receptor repertoire in both HLA-DQ2 and HLA-DQ8 associated CD. In the future this might be used to specifically target T cells expressing such T cell receptors in an attempt to reinstall tolerance to gluten in patients with CD.
References
1. Koning F. Celiac disease: caught between a rock and a hard place. Gastroenterology 2005, 129: 1294-1301.
2. Abadie V, Sollid LM, Barreiro LB, et al. Integration of genetic and immunological insights into a model of celiac disease pathogenesis. Annu Rev Immunol 2011, 29: 493-525.
3. Wal van de Y, Kooy Y, Veelen van P, et al. Cutting Edge: Selective deamidation by tissue transglutaminase strongly enhances gliadin-specific T cell reactivity. J Immunol 1998, 161: 1585-1588.
4. Molberg Ø, McAdam S, Körner R, et al. Tissue transglutaminase selectively modifies gliadin peptides that are recognized by gut-derived T cells in celiac disease. Nature Med 1998, 4: 713-717.
5. Sollid LM, Qiao SW, Anderson RP, et al. Nomenclature and listing of celiac disease relevant gluten T-cell epitopes restricted by HLA-DQ molecules. Immunogenetics 2012, 64: 455-460.
6. Vader W, Kooy Y., van Veelen P, et al. The gluten response in children with recent onset celiac disease. A highly diverse response towards multiple gliadin and glutenin derived peptides. Gastroenterology 2002, 122: 1729-1737.
7. Arentz-Hansen H, Körner R, Molberg Ø, et al. The intestinal T cell response to -gliadin in adult celiac disease is focused on a single deamidated glutamine targeted by tissue transglutaminase. J Exp Med 2000, 191: 603-612.

66 Biased T cell receptor usage in coeliac disease
8. Shan L, Molberg Ø, Parrot I, et al. Structural basis for gluten intolerance in celiac sprue. Science 2002, 297: 2275-2279.
9. Broughton SE, Petersen J, Theodossis A, et al. Biased T cell receptor usage directed against human leukocyte antigen DQ8-restricted gliadin peptides associated with celiac disease. Immunity, 2012, 37(4): 611-621.
10. Qiao SW, Ráki M, Gunnarsen KS, et al. Posttranslational modification of gluten shapes TCR usage in celiac disease. J Immunol 2011, 187: 3064-3071.
11. Qiao SW, Christophersen A, Lundin KE, et al. Biased usage and preferred pairing of α- and β-chains of TCRs specific for an immunodominant gluten epitope in coeliac disease. Int Immunol 2014, 26(1): 13-19.

5 Clinical research reports 67
5.2 Differential expression of Fatty Acid Binding Proteins (FABPs) in coeliac disease
Marina Garcia1*, Natalia Bottasso-Arias2*, Constanza Bondar1, Betina Corsico2, Fernando Chirdo1
1 Laboratorio de Investigación en el Sistema Inmune-LISIN, Departamento de Ciencias Biológicas, Facultad de Ciencias Exactas, Universidad Nacional de La Plata, La Plata. Argentina
2 Instituto de Investigaciones Bioquímicas de La Plata-INIBIOLP (CONICET-UNLP), Facultad de Ciencias Médicas, Universidad Nacional de La Plata, La Plata. Argentina
* Both authors contributed equally to this work
Introduction
Fatty acid binding proteins (FABPs) belong to a family of small cytosolic proteins. FABPs bind and transport long chain fatty acids but also have important roles in signalling pathways, particularly those related to peroxisome proliferator-activated receptors (PPAR) which link lipid metabolism and inflammatory processes [1,2]. There are nine isoforms which are differentially expressed in distinct tissues. Intestinal and liver FABPs (I- and L-FABP, respectively) are abundantly expressed in the epithelium of the small intestine [3-5]. Particularly, their expression was reported primarily restricted to fully differentiated epithelial cells [6-8].
Expression of L- and I-FABP has been evaluated in the small and large intestine by immunofluorescence [9]. In the gestational period as well as in adult tissues L-FABP staining was detected in the upper half of the villi along the whole small intestine, while the expression was barely detected in the lower half of the villi and in the crypt. On the other hand, I-FABP staining was visualised in intestinal epithelial cells in the villi and in the crypts in both fetal and adult jejunum.
Severe changes at the intestinal mucosa (villous atrophy, crypt hyperplasia and lymphocytic infiltration) are characteristically observed in untreated coeliac disease (CD) patients. These histological changes are linked to changes in the level and the pattern of expression of different genes. Although there are reports describing the expression of L- and I-FABPs in the normal small intestine, their expression was not evaluated in CD enteropathy.
In addition, higher levels of I-FABP were found in the serum of untreated CD patients compared with non-coeliac controls. Remarkably, Adriaanse et al. [10] reported that the concentration of I-FABP in the serum correlates with the severity of the histological changes. Moreover, the determination of circulating I-FABP seems to be a useful complementary tool to monitor adherence to the gluten-free diet [11,12].

68 Fatty Acid Binding Proteins in celiac disease
The aim of this work was to assess the expression of L- and I-FABP by quantitative PCR in the normal small intestine and in active CD as well as to evaluate the determination of I-FABP as a biomarker for active CD.
Patients and methods
Small intestinal biopsies and serum samples
Biopsies were collected from the second portion of the duodenum from coeliac and non-coeliac patients during the routine diagnostic procedure for adults and children in the gastroenterology units of Hospital San Martin and Hospital Sor María Ludovica, respectively, from La Plata, Buenos Aires, Argentina. CD was diagnosed according to clinical presentation, histology, positive serology and response to the gluten-free diet. Intestinal tissue was preserved in RNAlater (Ambion) for mRNA expression analysis or fixed in formaldehyde solution for histological evaluation. Serum samples were also collected from CD patients and non-coeliac controls. The study was approved by the ethics committee of both hospitals.
Assessment of serum levels of I-FABP
Determination of I-FABP serum levels was performed using an ELISA kit (HyCult Biotech, HK406).
Quantitative PCR determination
Quantitative real-time PCR was performed in an IQ Cycler from BioRad using SYBRgreen and specific primers for the genes of interest. β-Actin was used as housekeeping gene.
Results and discussion
High levels of serum I-FABP in untreated CD patients
As has already been described [11,12], untreated CD patients presented significantly higher levels of I-FABP in the serum compared to non-coeliac controls (Figure 1). A gluten-free diet normalised I-FABP levels in the serum of CD patients. Therefore, higher levels of I-FABP in the serum seem to be a specific consequence of the pathogenic process in CD patients. I-FABP is likely released from damaged enterocytes in CD patients, but only after gluten intake.
Expression of L- and I-FABP in the small intestine
I- and L-FABP have critical functions in lipid absorption in the intestine. Their expression was evaluated in normal tissue, but there is no study reported in CD patients, where mucosal histology is altered. By immunofluorescence studies, we demonstrated that I- and L-FABP are not only expressed in the remaining epithelium in severe enteropathy but also in the crypts (not shown). Since the pattern of expression is changed in the duodenum from CD patients, we studied the mRNA

5 Clinical research reports 69
levels of both FABPs to evaluate whether these proteins are differentially regulated in the damaged tissue.
L- and I-FABP mRNA expression was assessed by real-time PCR in duodenal biopsies from adult and paediatric populations. mRNA levels for both L- and I-FABP were higher in the small intestine from non-coeliac adult controls (Figure 2). Although there is no study for mRNA levels in adult tissues, it was reported that levels of FABPs changed when comparing fetal, paediatric and adult tissues. Immunofluorescence and immunoprecipitation analysis showed that adult tissue contains higher levels of both FABPs [9].
Quantitative PCR analysis also showed that mRNA levels of L-FABP in the normal intestine were higher than those of I-FABP (Figure 2), which correlates with previous reports showing that L-FABP is 40-50 fold higher than I-FABP at protein level [9].
Remarkably, expression of both L- and I-FABP was reduced in untreated adult CD patients compared with non-coeliac controls. This difference was not observed in the paediatric population (Figure 3).
CONTROLS CD GFD0
1000
2000
3000
4000
5000
6000
7000
**** *
IFA
BP
(p
g/m
l)
Figure 1. Higher level of serum I-FABP in untreated CD patients I-FABP serum levels (pg/mL) were assessed by a commercial ELISA. Serum samples from controls (n=42), untreated CD patients (n=39) and patients on gluten-free diet (GFD)(n=9) were analysed. (*p=0.02; ***p<0.0001)
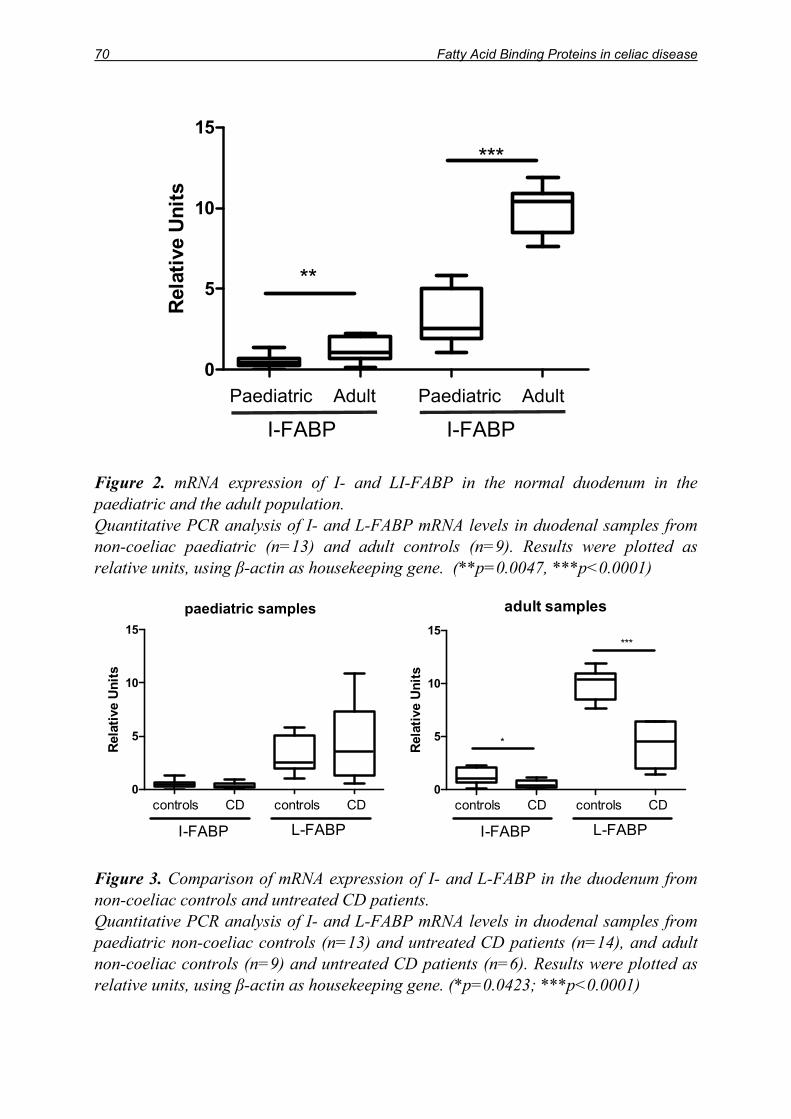
70 Fatty Acid Binding Proteins in celiac disease
Pediatric Adult Pediatric Adult0
5
10
15
I-FABP L-FABP
**
***R
elat
ive
Un
its
Figure 2. mRNA expression of I- and LI-FABP in the normal duodenum in the paediatric and the adult population. Quantitative PCR analysis of I- and L-FABP mRNA levels in duodenal samples from non-coeliac paediatric (n=13) and adult controls (n=9). Results were plotted as relative units, using β-actin as housekeeping gene. (**p=0.0047, ***p<0.0001)
Figure 3. Comparison of mRNA expression of I- and L-FABP in the duodenum from non-coeliac controls and untreated CD patients. Quantitative PCR analysis of I- and L-FABP mRNA levels in duodenal samples from paediatric non-coeliac controls (n=13) and untreated CD patients (n=14), and adult non-coeliac controls (n=9) and untreated CD patients (n=6). Results were plotted as relative units, using β-actin as housekeeping gene. (*p=0.0423; ***p<0.0001)
pediatric samples
0
5
10
15
I-FABP L-FABPcontrols CD controls CD
Rel
ativ
e U
nit
s
adult samples
0
5
10
15
I-FABP L-FABPcontrols CD controls CD
*
***
Rel
ativ
e U
nit
sPaediatric Adult Paediatric Adult
I-FABP I-FABP
paediatric samples

5 Clinical research reports 71
Conclusions
In this study we replicated previous findings from other groups showing that serum levels of I-FABP are higher in untreated CD patients. Circulating I-FABP is likely released from the damaged enterocytes in untreated CD patients, suggesting that the determination of serum I-FABP can be used as an assessment of mucosal damage and as complementary information for the diagnosis and follow-up of CD patients. Additional studies involving a large number of samples are required to establish the analytical performance of this test in the diagnosis or follow-up of CD.
Furthermore, we observed that mRNA levels of I-FABP and L-FABP in the small intestine were higher in adult than in paediatric samples and, remarkably, that the small intestine of untreated adult CD patients showed a reduction of mRNA levels of I-FABP and L-FABP compared to healthy controls. Lower levels of FABPs may have consequences not only in lipid absorption and metabolism, but also in inflammatory pathways such as those related to PPARα and - which are active in the intestinal mucosa.
References
1. Bünger M, van den Bosch HM, van der Meijde J, et al. Genome-wide analysis of PPARalpha activation in murine small intestine. Physiol Genomics 2007, 30(2): 192-204.
2. Wang X, Pan L, Lu J, et al. N-3 PUFAs attenuate ischemia/reperfusion induced intestinal barrier injury by activating I-FABP-PPARγ pathway. Clin Nutr 2012, 31(6): 951-957.
3. Ockner RK, Manning JA, Poppenhausen RB, et al. A binding protein for fatty acids in cytosol of intestinal mucosa, liver, myocardium, and other tissues. Science 1972, 177(4043): 56-58.
4. Ockner RK, Manning JA. Fatty acid-binding protein in small intestine. Identification, isolation, and evidence for its role in cellular fatty acid transport. J Clin Invest 1974, 54(2): 326-338.
5. Mishkin S, Stein L, Gatmaitan Z, et al. The binding of fatty acids to cytoplasmic proteins: binding to Z protein in liver and other tissues of the rat. Biochem Biophys Res Commun 1972, 47(5): 997-1003.
6. Shields HM, Bates ML, Bass NM, et al. Light microscopic immunocytochemical localization of hepatic and intestinal types of fatty acid-binding proteins in rat small intestine. J Lipid Res 1986, 27(5): 549-557.
7. Glatz JFC, van der Vusse GJ. Cellular fatty acid-binding proteins: their function and physiological significance. Prog Lipid Res 1996, 35(3): 243-282.

72 Fatty Acid Binding Proteins in celiac disease
8. Pelsers MM, Namiot Z, Kisielewski W, et al. Intestinal-type and liver-type fatty acid-binding protein in the intestine. Tissue distribution and clinical utility. Clin Biochem 2003, 36(7): 529-535.
9. Levy E, Ménard D, Delvin E, et al. Localization, function and regulation of the two intestinal fatty acid-binding protein types. Histochem Cell Biol 2009, 132(3): 351-367.
10. Adriaanse MP, Tack GJ, Passos VL, et al. Serum I-FABP as marker for enterocyte damage in coeliac disease and its relation to villous atrophy and circulating autoantibodies. Aliment Pharmacol Ther 2013, 37(4): 482-490.
11. Vreugdenhil AC, Wolters VM, Adriaanse MP, et al. Additional value of serum I-FABP levels for evaluating celiac disease activity in children. Scand J Gastroenterol 2011, 46(12): 1435-1441.
12. Not T, Ziberna F, Vatta S, et al. Cryptic genetic gluten intolerance revealed by intestinal antitransglutaminase antibodies and response to gluten-free diet. Gut 2011, 60(11): 1487-1493.

5 Clinical research reports 73
5.3 Potential role for intestinal myofibroblasts in coeliac disease
Jean Dunne1, James de Boisanger1, Sarah Cooper1, Louise Elliott1, Greg Byrne2, Conleth Feighery1
1 Department of Immunology and Institute for Molecular Medicine, St. James’s Hospital and Trinity College Dublin, Dublin, Ireland
2 School of Biological Sciences, DIT, Dublin, Ireland
Introduction
The measurement of IgA anti-tissue transglutaminase (tTG) antibodies is well established as the key serological test for the diagnosis of coeliac disease. In many laboratories a confirmatory test is performed in which antibody to the endomysium (EMA) in monkey oesophagus slides is investigated. The detection of anti-tTG antibodies is strongly correlated with the presence of EMA antibodies. However, in some patients the typical endomysial antibody pattern is obscured and there is evidence that this is caused by co-existing, circulating IgA smooth muscle antibodies. Why some coeliac patients develop these additional IgA antibodies is unknown.
Previous studies have reported the presence of F-actin antibodies in coeliac disease [1,2]. The purpose of the present study was to determine whether anti-actin antibodies contribute to the atypical EMA pattern observed in some coeliac patients. The findings were then correlated with the expression of smooth muscle alpha actin in the biopsy tissue of coeliac patients.
Materials and methods
Patients
The study group consisted of 81 patients with EMA and anti-tTG antibody positive coeliac disease and these included patients with untreated and partially treated disease. 50 of this group had an atypical EMA antibody pattern whereas the classic fishnet pattern was found in the remaining 31 coeliac patients. 22 healthy controls and 30 paediatric patients with Crohn’s disease were also included in the study: all had negative anti-tTG antibody levels. In the tissue immunostaining studies, biopsy samples from two controls with normal duodenal architecture, five treated coeliac patients with a Marsh 0 lesion and seven treated and untreated atypical “EMA positive” patients were stained for tTG expression and smooth muscle -actin expression.

74 Intestinal myofibroblasts in coeliac disease
Serological tests for coeliac disease
The patients included in this study were screened for coeliac disease by measuring IgA anti-tTG antibodies using an ELISA kit (Celikey, Pharmacia Diagnostics). Based on local population screening, a cut-off value of 1.9 U/mL was established. All patients with raised anti-tTG antibodies were further tested for IgA EMA antibodies on monkey oesophagus tissue (Binding Site, UK) at dilutions of 1:5. Anti-F-actin antibody levels were measured using the QUANTA LiteTM F-Actin IgA ELISA system (INOVA, USA).
Identification of tissue transglutaminase and smooth muscle α-actin in duodenal biopsy tissue
Formalin-fixed paraffin-embedded duodenal tissue from both coeliac and control subjects was examined. Histological sections were stained with a rabbit polyclonal IgG to tissue transglutaminase (Roboscreen, Leipzig, Germany). The binding of tissue transglutaminase antibody was identified by the addition of Alexa Fluor 568 labelled goat-anti-rabbit IgG (Invitrogen, Ireland). After washing, the sections were incubated with FITC labelled mouse monoclonal antibody to smooth muscle alpha actin decapeptide (Sigma-Aldrich, USA) at 1:800 dilution. Nuclei were visualised with Hoechst fluorescent nuclear stain. The binding pattern of individual antibodies was examined using an INCell 1000 analyser. A protocol was developed to examine specific target cells, which had an elongated morphology and were stained with smooth muscle -actin. The area of tissue expressing smooth muscle -actin, tissue transglutaminase and the area of co-expression of these two antigens was measured relative to the area of tissue under examination. These co-localisation results were expressed as a percentage of the tissue area.
Results and discussion
In Figure 1 an example of the atypical EMA pattern is shown and this is contrasted with the classical or typical EMA pattern in which a fishnet pattern of staining is found. Interestingly, if dilution of the atypical serum was performed, the more classical staining pattern was observed.
It has been speculated that the atypical pattern is caused by smooth muscle antibodies, such as actin antibodies [3] and F-actin antibodies were then measured in an ELISA assay (Figure 2). Elevated levels of F-actin antibodies were noted in both groups of coeliac patients but levels in patients with an atypical EMA pattern were significantly greater than in patients with a classical EMA pattern (p<0.0001, Mann-Whitney). Since both groups included patients with untreated and partially treated coeliac disease and a similar range of histological lesions, this finding seems to identify a subset of coeliac patients. In previous studies, elevated F-actin antibodies have been reported to correlate with the severity of intestinal damage [2]. Of interest, F-actin antibodies were not elevated in a group of paediatric patients with active Crohn’s disease.

5 Clinical research reports 75
To provide a potential explanation for the raised levels of actin antibodies, in preliminary studies, histological tissue sections from patient biopsies were investigated for the extent of actin staining. Employing a monoclonal antibody to smooth muscle alpha actin, cells with the typical appearance of myofibroblasts were identified in the lamina propria and these cells were particularly prominent in the peri-cryptal region of the biopsy tissue. The extent of tissue transglutaminase staining in these same biopsies was also investigated and it was noted that tTG was over-expressed in untreated coeliac tissue. It was also demonstrated that intense tTG expression was noted in myofibroblasts. Measurement of the area of tTG and smooth muscle alpha actin expression revealed that there was increased co-expression of these two antigens in the duodenum of patients with the atypical EMA pattern (Figure 3). Furthermore, there was a correlation in these atypical EMA patients between this co-expression and the levels of anti-tTG and anti-F-actin antibodies in serum (Table 1). Future work will include extending the biopsy staining to include a larger number of atypical EMA+ patients as well as EMA+ patients with positive and negative F-actin antibodies.
Figure 1. Monkey oesophagus with patient IgA antibodies counterstained with FITC labelled anti-IgA in an atypical EMA pattern (a) and a classical EMA pattern (b)

76 Intestinal myofibroblasts in coeliac disease
Figure 2. IgA antibodies to F-actin in healthy controls, EMA positive (EMA+) and atypical EMA+ coeliac patients and Crohn’s disease controls (*p<0.05, ** p<0.0001)

5 Clinical research reports 77
Figure 3. Duodenal biopsies from a healthy control (a) and a coeliac patient with a Marsh 3 lesion (b) stained for smooth muscle alpha actin with FITC labelled monoclonal IgG (green) and tissue transglutaminase with Alexa Fluor 568 labelled polyclonal IgG (red). The area of smooth muscle -actin and tTG co-localisation (yellow) is increased in the coeliac patient (b)
Table 1. Anti-tTG and anti-F-actin levels in serum related to the area of tTG and smooth muscle -actin co-expression in peri-cryptal myofibroblasts in duodenal biopsies. The percentage co-expression area relative to the tissue size is used as a measure of expression.
ID Seruma tTG
mean [U/mL] Serum a F-actin mean [U/mL]
tTG / Actin co-expression in biopsy [% of tissue area]
Control n=2
0.85 8.85 1.37
CD M0 n=5
1.37 9.00 1.11
CD M2/3 n=7
46.15 62.30 7.43 a Matched serum sample (tTG and F-actin antibodies) and duodenal biopsy from controls and coeliac
disease patients
Conclusions
In these experiments we have demonstrated that coeliac sera that produce an atypical EMA pattern express significantly higher F-actin antibody levels than those with a classical pattern. Tissue staining of duodenal biopsies from these patients showed an

78 Intestinal myofibroblasts in coeliac disease
increased co-expression of actin and tissue transglutaminase in myofibroblasts in the peri-cryptal region.
The increased area of tTG and smooth muscle -actin co-localisation, demonstrated to occur predominantly in the peri-cryptal myofibroblasts, is of particular interest given the putative role of these cells in tissue remodelling and wound healing through the secretion of chemokines, cytokines, prostaglandins, growth factors, and extracellular matrix components [4]. These cells are likely to play a critical role both in the development and healing of the coeliac lesion [4-6]. The presence of autoantibodies to two major antigen components may possibly disrupt the function of these cells in the restitution of intestinal damage.
References
1. Clemente MG, Musu MP, Frau F, et al. Immune reaction against the cytoskeleton in coeliac disease. Gut 2000, 47: 520-526.
2. Granito A, Muratori P, Cassani F, et al. Anti-actin IgA antibodies in severe coeliac disease. Clin Exp Immunol 2004, 137: 386-392.
3. Lasagni D, Ferrari R, Lapini M. Unmasking anti-endomysial antibodies in coeliac subjects positive for anti-smooth muscle antibodies. Acta Paediatr 1999, 88: 462-464.
4. Powell DW, Mifflin RC, Valentich JD, et al. Myofibroblasts. II. Intestinal subepithelial myofibroblasts. Am J Physiol 1999, 277: C183-C201.
5. Podolsky DK. Healing the epithelium: solving the problem from two sides. J Gastroenterol 1997, 32: 122-126.
6. Desmouliere A, Geinoz A, Gabbiani F, et al. Transforming growth factor-beta 1 induces alpha-smooth muscle actin expression in granulation tissue myofibroblasts and in quiescent and growing cultured fibroblasts. J Cell Biol 1993, 122: 103-111.

5 Clinical research reports 79
5.4 Gluten challenge in coeliac disease and non-coeliac gluten sensitivity
Margit Brottveit1, Knut E.A. Lundin2,3
1 Department of Gastroenterology, Oslo University Hospital, Ullevål, Oslo, Norway 2 Department of Gastroenterology, Oslo University Hospital, Rikshospitalet, Oslo,
Norway 3 Centre for Immune Regulation, University of Oslo and Oslo University Hospital,
Oslo, Norway
Introduction
It has been suggested by the “Oslo working group” that the term “Gluten-related disorders” should be used as an umbrella term covering the various types of unwanted reactions to gluten [1]. Coeliac disease (CD) and non-coeliac gluten sensitivity (NCGS) constitute two of these disorders [2]. The diagnosis of CD is based on clinical signs, positive serology by antibodies towards transglutaminase 2 and/or deamidated gliadin peptides and confirmed by typical alterations in small bowel biopsies. In NCGS, the clinical response to gluten intake is similar to that seen among CD patients, but both serology and morphology are “normal”. The matter is complicated by the fact that the same is seen in CD patients when they are on a gluten-free diet (GFD). The aims of our study were to investigate the prevalence of CD in a cohort of NCGS patients who had started a GFD without proper examinations, and to investigate possible mechanisms in CD and NCGS.
Materials and methods
All study patients were HLA-DQ2+ and adhered to a strict GFD at the time of inclusion. We used a protocol with short time, open (not placebo-controlled and blinded) oral gluten challenge with 4 slices of white, gluten containing bread/day for three days. CD patients and HLA-DQ2+ self-reported gluten sensitive individuals were included. The patients were examined for:
a. Gluten-specific T cells in peripheral blood by flow cytometry after staining with HLA-DQ2 tetramers [3,4]
b. Histological response [4] c. Mucosal cytokine response [5] d. Symptoms, Health Related Quality of Life (HRQoL) and personality [6]
The methods are commented in each of the three following subsections; details are described in the original papers.

80 Gluten challenge in coeliac disease and non-coeliac gluten sensitivity
I) We first elaborated the protocol with the short time gluten challenge and the tetramer test of our initial proof of principle study [3,4]. We examined 13 treated, HLA-DQ2+ CD patients as well as 35 HLA-DQ2+ individuals on a GFD with uncertain CD. In addition, duodenal biopsies were taken before and after the three-day gluten challenge and examined for typical morphological alterations according to the Marsh classification. Two of the 35 with uncertain diagnosis denied to have a gastroscopy. The work-up showed that only 3/35 uncertain CD patients could be diagnosed with CD. The response detected by HLA-DQ2-gliadin tetramer examination was superior to small bowel biopsies for the confirmation of CD after a short, oral gluten challenge (Figure 1).
Figure 1. Upper two panels show responses in biopsies and tetramer staining in patients with treated CD (filled circles) and disease controls (only tetramer staining, open circles). Lower two panels show the same in uncertain CD patients. Number of responsive patients is shown in brackets. CD, coeliac disease; d, day. Adapted from [4]
II) We next examined the mucosal response after the same short in vivo gluten challenge in HLA-DQ2+ NCGS patients and treated CD patients [5]. Untreated CD patients and disease controls served as comparison groups. Both CD and NCGS patients on a GFD had a higher density of CD3+ intraepithelial T cells than controls at baseline, and the numbers did not increase during challenge (Figure 2). In fact, some NCGS patients had rather high IEL numbers.

5 Clinical research reports 81
Figure 2. Density of CD3+ intraepithelial lymphocytes (IELs) per 100 epithelial cells examined in formalin-fixed sections of duodenal mucosa from coeliac disease (CD; n=15) patients and non-coeliac gluten sensitivity (NCGS; n=30) patients on a gluten-free diet before and after a three-day gluten challenge. Disease controls and untreated CD patients on a gluten containing diet are used as control groups. Medians are indicated by horizontal lines. Adapted from [5]
By real-time quantitative reverse transcriptase PCR we examined mRNA for different cytokines. In addition, immunohistochemistry examination was performed for CD3+ IELs and for the protein MxA (an indirect sign of IFN-α-activation). This short in vivo gluten challenge induced a concomitant adaptive (TNF-α, IFN-γ-related genes) and innate (IL-8, MxA for IFN-α) mucosal immune response in CD patients. IFN-γ expression increased after gluten challenge in NCGS patients. IFN- expression was unexpectedly high in treated CD patients (Figure 3).
III) We lastly registered the symptoms of CD patients and HLA-DQ2+ NCGS patients before, during and after gluten challenge [6]. Questionnaires regarding anxiety, depression, neuroticism and lie, hostility and aggression, alexithymia, health locus of control, physical complaints and HRQoL (SF-36) were completed. The NCGS patients reported more symptoms after gluten challenge than CD patients (Figure 4). There were no significant differences between CD and NCGS patients regarding personality traits, level of somatisation, HRQoL, anxiety or depressive symptoms. The level of somatisation was low in both NCGS and CD. Symptom-increase after gluten challenge was not related to personality in NCGS patients and they showed no tendency for general somatisation. Personality and HRQoL did not differ between NCGS and CD patients, and were mostly at the same level as in healthy controls.

82 Gluten challenge in coeliac disease and non-coeliac gluten sensitivity
Figure 3. The mucosal levels of mRNA for IFN- are shown. Left part shows the levels in control patients and untreated coeliac disease (CD) patients. As expected, the untreated CD patients express more IFN- than controls. The levels in non-coeliac gluten sensitivity (NCGS) patients are not significantly increased prior to challenge, but increase after challenge. The levels in treated CD patients are increased prior to challenge, and do not increase further. Adapted from [5]
Figure 4. Mean scores for gastrointestinal symptom rating scale-irritable bowel symptoms version (GSRS-IBS) in coeliac disease (CD) (●) and non-coeliac gluten sensitivity (NCGS) (○) patients during challenge. Error bars are standard deviation. Significant differences in challenge response between CD and NCGS patients were seen from d0 to d3: ΔGSRS-IBS; p=0.01. d, day. Adapted from [6]
NCGS CD
5 Clinical research reports 83
Conclusions
NCGS is a rather newly recognised clinical entity that lacks definite diagnostic criteria. Blinded, placebo-controlled challenge studies show conflicting results [7,8]. The clinical work-up is complicated by the fact that serology and morphology of CD patients on a GFD typically normalise. We show here that a short gluten challenge followed by HLA-DQ2-gliadin tetramer staining of peripheral blood lymphocytes can distinguish NCGS from CD. The challenge protocol could be developed further with comparison of placebo versus gluten containing meals. However, the palatability and appearance of gluten-free and gluten containing foods are quite different, and product development for experimental and clinical challenge goods is needed. Some of our results could be compatible with the notion that immune mechanisms are involved in NCGS.
References
1. Ludvigsson JF, Leffler DA, Bai JC, et al. The Oslo definitions for coeliac disease and related terms. Gut 2013, 62: 43-52.
2. Lundin KE, Alaedini A. Non-celiac gluten sensitivity. Gastrointest Endosc Clin N Am 2012, 22: 723-734.
3. Raki M, Fallang LE, Brottveit M, et al. Tetramer visualization of gut-homing gluten-specific T cells in the peripheral blood of celiac disease patients. Proc Natl Acad Sci U S A 2007, 104: 2831-2836.
4. Brottveit M, Raki M, Bergseng E, et al. Assessing possible celiac disease by an HLA-DQ2-gliadin tetramer test. Am J Gastroenterol 2011, 106: 1318-1324.
5. Brottveit M, Beitnes AC, Tollefsen S, et al. Mucosal cytokine response after short-term gluten challenge in celiac disease and non-celiac gluten sensitivity. Am J Gastroenterol 2013, 108: 842-850.
6. Brottveit M, Vandvik PO, Wojniusz S, et al. Absence of somatization in non-coeliac gluten sensitivity. Scand J Gastroenterol 2012, 47: 770-777.
7. Biesiekierski JR, Newnham ED, Irving PM, et al. Gluten causes gastrointestinal symptoms in subjects without celiac disease: A double-blind randomized placebo-controlled trial. Am J Gastroenterol 2011, 106: 508-514.
8. Biesiekierski JR, Peters SL, Newnham ED, et al. No effects of gluten in patients with self-reported non-coeliac gluten sensitivity after dietary reduction of fermentable, poorly absorbed, short-chain carbohydrates. Gastroenterology 2013;145:320-328.

84 Gluten challenge in coeliac disease and non-coeliac gluten sensitivity

5 Clinical research reports 85
5.5 Alpha-Amylase/Trypsin Inhibitors elicit innate immune activation in murine and human intestinal tissue explants
Victor Zevallos1, Peter Olinga2, Phan Bao Tung2, Detlef Schuppan1
1 Institute of Translational Immunology, University Medical Centre, Johannes Gutenberg University Mainz, Mainz, Germany
2 Department of Pharmaceutical Technology and Biopharmacy, University of Groningen, Groningen, The Netherlands
Introduction
Coeliac disease (CD) is an inflammatory condition triggered by the ingestion of gluten containing cereals (wheat, barley, and rye). CD compromises architecture and function of the small intestine in genetically predisposed individuals and it is characterised by a well-defined adaptive, Th1 T-cell mediated immune activation and an ill-defined innate immune component [1].
Initially, the innate trigger was attributed to peptide p31-43 from α-gliadin [2,3]. However, we could not induce innate stimulatory activity using p31-43, or p31-49 in cultures of mouse and human intestinal epithelial cells, monocytes, macrophages, and dendritic cells, whereas strong innate stimulatory activity was contained in pepsin-trypsin (PT) digested gliadin. Activity was not identified in any of the HPLC purified gliadin fractions (α, γ, ω) [4], but present in a prominent family of (contaminating) non-gluten proteins, namely the wheat amylase-trypsin inhibitors (ATIs) [5]. ATIs trigger innate immunity via the toll-like receptor 4 (TLR4)-MD2-CD14 complex in monocytes, macrophages, and dendritic cells and are the only currently known nutritional triggers of this central innate immune receptor [5].
Stimulatory ATIs are present in gluten containing cereals (wheat, rye, and barley), with relative molecular weights ranging from 12000 to 16000. They can form monomers, dimers or tetramers, and they contain a highly conserved secondary structure, based on five intrachain disulfide bonds and four α-helices [6,7]. ATIs protect plants from pest attacks by inhibiting parasite enzymes. Notably, ATIs are capable of resisting intestinal degradation and can stimulate innate immune cells in the intestine in vivo after oral ingestion [5].
Recent genomic and proteomic analyses have revealed up to 16 distinct ATI species in modern wheat, and that ATIs represent up to 4% of total wheat protein [8,9]. Notably, they are considered to be the central allergens in baker’s asthma [10].
Precision-cut tissue slices (PCTS) are viable ex vivo explants of tissues with a reproducible, well-defined thickness. PCTS come close to the intact organ, with preserved intercellular and cell matrix interactions, similar to their natural multi-

86 Alpha-Amylase/Trypsin Inhibitors elicit innate immune activation
cellular environment [11]. Therefore, we aimed to evaluate the effects of ATIs to stimulate innate immunity using PCTS (Figure 1).
Materials and methods
ATI-enriched solutions were obtained by exhaustive extraction of milled and defatted samples of wheat flour using salt solutions and dialysed against either acidic or neutral buffers, sterile filtrated and lyophilised. ATIs and negative protein controls (casein or zein) were cultured overnight at different concentrations (0.5, 1 and 2 mg/mL) with individual PCTS from three different sections of the intestine (duodenum, jejunum and colon) of C57BL/6 mice on a gluten-free diet, as well as normal human jejunal samples obtained from resections (ethical approval of the Univ. of Groningen). After incubation, the concentration of inflammatory cytokines and expression of mRNA transcript levels for inflammatory genes were measured.
Figure 1. Preparation of human intestinal tissue. (a) Stapled human jejunum. (b) Staples and fat removed and the intestine is unfolded. Segment fixed on a silicone mattress (c) and removal of muscularis layer (d,e). Intestine is cut into pieces of approximately 10 × 20 mm (f) and embedded with low-gelling agarose (g,h) [11]
Results and discussion
ATIs significantly stimulated the expression of inflammatory cytokines (KC/IL-8, IL-6 and TNF-α) in supernatants of murine PCTS compared to the protein controls at 2mg/mL, and transcript levels of inflammatory genes (KC and MCP-1) (Figure 2). Transcript levels were upregulated in a dose-dependent manner when ATIs were tested at different concentrations (0.5, 1 and 2 mg/mL). Furthermore, our preliminary experiments indicated that ATIs significantly upregulated the expression of transcript

5 Clinical research reports 87
levels of inflammatory cytokines (INF-γ and IL-6) in PCTS supernatants and tissue from human jejunum, compared to the negative controls (not shown).
A
med
ium
case
inATIs
med
ium
case
inATIs
med
ium
case
inATIs
0
200
400
600
800
2000
4000
6000KCIL-6
**
Duodenum Ileum Mid colon
Cyt
oki
nes
rel
ease
(p
g/m
L)
B
MA 0
.5 1 2C 0
.5 1 2 MA 0
.5 1 2C 0
.5 1 2 MA 0
.5 1 2C 0
.5 1 2
0
2
4
6
8
IleumMid colon
Duodenum**
**
Rel
ativ
e M
CP
-1 m
RN
A l
evel
s
Figure 2. Cytokine release and transcript levels of inflammatory markers in three sections of murine intestine. (A) KC and IL-6 in supernatants after incubating PCTS from duodenum, ileum and mid colon with casein or ATIs at a concentration of 2 mg/mL. (B) Transcript levels of MCP-1 after incubating PCTS from duodenum, ileum and mid colon with medium (M), ATIs (A) or casein (C) at three different concentrations (0.5, 1 and 2 mg/mL). Level of significance (p<0.05) is marked by asterisks
Conclusions
The innate stimulatory activity of ATIs in a multi-cellular intestinal environment resembling the in vivo situation, even in the absence of pre-existent damage, was confirmed using PCTS. Our results suggest that ATIs are the missing nutritional trigger of innate immunity in gluten containing cereals, having an adjuvant effect on coeliac disease severity, and possibly on other autoimmune diseases. PCTS permit comparative testing of effects and pharmacological interventions in mouse and human tissues, serving as a bridge to clinical studies.
References
1. Schuppan D, Junker Y, Barisani D. Celiac disease: from pathogenesis to novel therapies. Gastroenterology 2009, 137: 1912-1933.
2. Maiuri L, Ciacci C, Ricciardelli I, et al. Association between innate response to gliadin and activation of pathogenic T cells in coeliac disease. Lancet 2003, 362: 30-37.
3. Hue S, Mention JJ, Monteiro RC, et al. A direct role for NKG2D/MICA interaction in villous atrophy during celiac disease. Immunity 2004, 21: 367-377.
4. Wieser H, Koehler P. The biochemical basis for celiac disease. Cereal Chem 2008, 85: 1-13.

88 Alpha-Amylase/Trypsin Inhibitors elicit innate immune activation
5. Junker Y, Zeissig S, Kim SJ, et al. Wheat amylase trypsin inhibitors drive intestinal inflammation via activation of toll-like receptor 4. J Exp Med 2012, 209: 2395-2408.
6. Tatham AS, Shewry PR. Allergens to wheat and related cereals. Clin Exp Allergy 2008, 38: 1712-1726.
7. Oda Y, Matsunaga T, Fukuyama K, et al. Tertiary and quaternary structures of 0.19 alpha-amylase inhibitor from wheat kernel determined by X-ray analysis at 2.06 A resolution. Biochemistry 1997, 36: 13503-13511.
8. Dupont FM, Vensel WH, Tanaka CK, et al. Deciphering the complexities of the wheat flour proteome using quantitative two-dimensional electrophoresis, three proteases and tandem mass spectrometry. Proteome Sci 2011, 9: 10.
9. Altenbach SB, Vensel WH, Dupont FM. The spectrum of low molecular weight alpha-amylase/protease inhibitor genes expressed in the US bread wheat cultivar Butte 86. BMC Res Notes 2011, 4: 242.
10. Walusiak J, Hanke W, Górski P, et al. Respiratory allergy in apprentice bakers: do occupational allergies follow the allergic march? Allergy 2004, 59: 442-50.
11. De Graaf IAM, Olinga P, Jager MH, et al. Preparation and incubation of precision-cut liver and intestinal slices for application in drug metabolism and toxicity studies. Nature Protocols 2010, 5: 1540-1551.

6 New ESPGHAN guidelines 89
6 New guidelines of the ESPGHAN for the diagnosis of coeliac disease
6.1 Defining thresholds of antibody levels for the diagnosis of coeliac disease
Thomas Mothes, Johannes Wolf
Department of Laboratory Medicine, Clinical Chemistry, and Molecular Diagnostics, University of Leipzig, Leipzig, Germany
According to the Criteria of the European Society of Paediatric Gastroenterology, Hepatology, and Nutrition (ESPGHAN) from 1990 [1], the characteristic lesions of the small bowel mucosa represented the gold standard for the diagnosis of coeliac disease (CD). The presence of serological markers, vanishing after gluten withdrawal, was only considered to add support to the diagnosis.
Starting with the discovery of endomysium antibodies (EMA) [2,3] and later with the finding of tissue transglutaminase (tTG, or transglutaminase 2) as autoantigen of CD [4] and of antibodies directed to tTG [5], serological tests with high performance in the diagnosis of CD became available. Recently, antibodies against deamidated gliadin peptides (DGP) have joined autoantibodies as tests with high diagnostic performance [6]. Already several years ago it was asked if the assay of antibodies against tTG could replace small-bowel biopsy to diagnose CD in selected paediatric populations [7].
A recent analysis of questionnaires sent to experienced paediatric gastroenterologists (ESPGHAN members) via the internet revealed, that approximately 90% requested a revision and modification of the criteria from 1990 [8]. 44% wanted to omit the small bowel biopsy in symptomatic children with positive IgA antibodies against tTG or EMA, especially if they were DQ2/DQ8 positive. For silent cases detected by screening with convincingly positive IgA antibodies to tTG or EMA, about 30% considered that no small bowel biopsy should be required in selected cases. Adding HLA typing in the diagnostic workup was asked for by 42% of the responders.
In 2012, new guidelines were elaborated by the ESPGHAN [9]. CD was defined as an immune-mediated systemic disorder elicited by gluten and related prolamins in genetically susceptible individuals and characterised by the presence of a variable combination of gluten-dependent clinical manifestations, CD-specific antibodies (EMA, antibodies against tTG and DGP), HLA-DQ2 or HLA-DQ8 haplotypes, and enteropathy. Thus, antibodies are now included in the definition of the disease. This also means a higher impact of antibody test results in the diagnosis of CD.
The new guidelines asked “In which patients can the diagnosis of CD be made without duodenal biopsies?” It was lined out that “In children and adolescents with signs or symptoms suggestive of CD and very high anti- tTG titres with levels exceeding 10 times the upper limit of normal (> 10 x ULN) the likelihood for villous atrophy (Marsh

90 Defining thresholds of antibody levels for the diagnosis of coeliac disease
3) is high. In this situation the paediatric gastroenterologist may discuss with the parents and patient (as appropriate for age) the option of performing further laboratory testing (EMA, HLA) in order to make the diagnosis of CD without biopsies. Antibody positivity should be verified by EMA from a blood sample drawn at a separate occasion to the initial test in order to avoid false positive serology results due to mislabeling of blood samples or other technical mistakes. If EMA testing confirms specific CD antibody positivity in this second blood sample the diagnosis of CD can be made and the child started on a GFD. It is advisable to check for HLA types in patients diagnosed without small intestinal biopsy to reinforce the diagnosis of CD.”
The ESPGHAN suggestion is based on the fact that increasing the cut-off above the company level will enhance the specificity of a test result on expense of sensitivity. As a consequence, the post-test probability (positive predictive value) will increase (in dependence on the prevalence).
What was the evidence for the proposed 10 x ULN cut-off? For this, the new guidelines referred to three studies. In the first study [10] 146 adults were investigated, 136 of them were coeliac patients. 91 of the CD patients, but none of the seven controls had antibody levels > 10 x ULN. In the second study [11], 324 coeliac patients but no controls were investigated. It was found that with increasing mucosal lesion the fraction of patients with antibody concentration > 10 x ULN increased. The antibody concentrations of all patients with a Marsh 3c lesion were above 10 x ULN. We critically note that both studies lack controls and thus, data on specificity. As a consequence, positive predictive values could not be calculated. Statistical evaluations on the reliability of the 10 x ULN rule are completely missing.
In the third study [12], 170 coeliac patients were compared with 131 controls. The authors found at the company (1 x ULN) cut-off a sensitivity of 100.0% and a specificity of 99.2% (only 1 of 131 controls positive at the 1 x ULN cut-off). This admirably high accuracy already at the company cut-off raises the question, why a 10 x ULN should be set? In a subsequent paper [13] it was mentioned that the authors of the third study [12] suggested raising the limit to 30 U/mL, 10 times the suggested threshold of 3 U/mL, which is considered superior to the manufacturer’s suggested cut-off to avoid even this small proportion of false-positive patients.
It should be stressed that all data on the 10 x ULN cut-off reported by the ESPGHAN guidelines were obtained with one and the same test kit. However, an upper cut-off with a high positive predictive value should be verified for the different assays on the market. There is a strong need for quality management in coeliac serology. CD is still a clinical diagnosis. The extent how much diagnoses may be assisted by serology may be higher than expected formerly, but still has to be defined by prospective studies.
The new guidelines [9] also mentioned the new tests for anti-DGP. It was stated that these tests perform favourably and much better than antibodies against native gliadin, but that their performance was inferior compared with anti-tTG or EMA assays. It should be critically noted that the references cited in the references [12-14] do not

6 New ESPGHAN guidelines 91
support the conclusion of inferiority of IgG-anti-DGP: In [12], anti-DGP were not measured at all. In [14], the inferior results of antibodies to DGP were referred on the IgA and not on the more specific IgG class, and in [13] it was indicated that the performance of anti-DGP in patients (not preselected by anti-tTG or EMA testing) must be resolved in prospective studies.
The ESPGHAN concludes [9] that the performance of the new guidelines in clinical practice should be evaluated prospectively. A prospective international multicentre biopsy-controlled trial on antibody diagnostics in paediatric CD (AbCD) is currently recruiting patients to evaluate the proposed diagnostic algorithm to diagnose CD [15].
References
1. Walker-Smith JA, Guandalini S, Schmitz J, et al. Revised criteria for diagnosis of coeliac disease. Arch Dis Child 1990, 65: 909-611.
2. Chorzelski TP, Sulej J, Tchorzewska H, et al. IgA class endomysium antibodies in dermatitis herpetiformis and coeliac disease. Ann N Y Acad Sci 1983, 420: 325-334.
3. Rossi TM, Slbini CH, Kumar V, et al. Incidence of celiac disease identified by the presence of serum endomysial antibodies in children with chronic diarrhea, short stature, or insulin-dependent diabetes mellitus. J Pediatr 1993, 123: 262-264.
4. Dieterich W, Ehnis T, Bauer M, et al. Identification of tissue transglutaminaseas the autoantigen of celiac disease. Nat Med 1997, 3: 797-801.
5. Dieterich W, Laag E, Schöpper H, et al. Autoantibodies to tissue transglutaminase as predictors of celiac disease. Gastroenterology 1998, 115: 1317-1321.
6. Prause C, Ritter M, Probst C, et al. Antibodies against deamidated gliadin as new and accurate biomarkers of childhood coeliac disease. J Pediatr Gastroenterol Nutr 2009, 49: 52-58.
7. Barker CC, Mitton C, Jevon G, et al. Can tissue transglutaminase antibody titers replace small-bowel biopsy to diagnose celiac disease in select pediatric populations? Pediatrics 2005, 115: 1341-1346.
8. Ribes-Koninckx C, Mearin ML, Korponay-Szabó IR, et al. (The ESPGHAN Working Group on Coeliac Disease Diagnosis). Coeliac disease diagnosis: ESPGHAN 1990 Criteria or need for a change? Results of a Questionnaire. J Pediatr Gastroenterol Nutr 2012, 54: 15-19.
9. Husby S, Koletzko S, Korponay-Szabo IR, et al. (The ESPGHAN Working Group on Coeliac Disease Diagnosis). ESPGHAN guidelines for the diagnosis of coeliac disease in children and adolescents. An evidence-based approach. J Pediatr Gastroenterol Nutr 2012, 54: 136-160.
10. Hill PG, Holmes GKT. Coeliac disease: a biopsy is not always necessary for diagnosis. Aliment Pharmacol Ther 2008, 27: 572-577.

92 Defining thresholds of antibody levels for the diagnosis of coeliac disease
11. Vivas S, Ruiz de Morales JG, Riestra S, et al. Duodenal biopsy may be avoided when high transglutaminase antibody titers are present. World J Gastroenterol 2009, 15: 4775-4780.
12. Dahlbom I, Korponay-Szabó IR, Kovács JB, et al. Prediction of clinical and mucosal severity of coeliac disease and dermatitis herpetiformis by quantification of IgA/IgG serum antibodies to tissue transglutaminase. J Pediatr Gastroenterol Nutr 2010, 50: 140-146.
13. Giersiepen K, Lelgemann M, Stuhldreher N, et al. Accuracy of Diagnostic Antibody Tests for Coeliac Disease in Children: Summary of an Evidence Report. J Pediatr Gastroenterol Nutr 2012, 54: 229-241.
14. Lewis NR, Scott BB. Meta-analysis: deamidated gliadin peptide antibody and tissue transglutaminase antibody compared as screening tests for coeliac disease. Aliment Pharmacol Ther 2010, 31: 73-81.
15. https://faustino.imise.uni-leipzig.de/abcd/

6 New ESPGHAN guidelines 93
6.2 A critical appraisal of the ESPGHAN guidelines for the diagnosis of coeliac disease
Martin Stern
University Children's Hospital, University of Tuebingen, Tuebingen, Germany
Introduction
Diagnosis of coeliac disease is a complex matter in children and adults. Recently ESPGHAN has published new guidelines for the diagnosis of coeliac disease replacing current Budapest guidelines [1,2]. Although general definitions (coeliac disease is an immune-mediated systemic disorder triggered by gluten in genetically susceptible individuals with variable clinical manifestations, with presence of coeliac disease-specific antibodies, HLA DQ 2/8 haplotypes and enteropathy) are not disputed, the new guidelines, especially as presented in popular publications [3] and discussed among general paediatricians, have shown to be too complicated. They have been leading to misinterpretations like "small intestinal biopsy is obsolete" or "it is sufficient to switch to a gluten-free diet after positive antibody results". Other misinterpretations range from "general paediatricians can make the diagnosis after doing the score calculations on their own" to "diagnosis of coeliac disease is so complicated today that it should be left to specialised centres of paediatric gastroenterology".
The new algorithms presented by ESPGHAN for the diagnosis in children or adolescents with otherwise unexplained symptoms and signs suggestive of coeliac disease and for children or adolescents without symptoms belonging to a high-risk group [2] are by far too complicated. They lead into open questions and dead ends for many patients. Longstanding specific paediatric experience, simple medical reason and also common sense suggest that these guidelines and algorithms should be revised leading to better practical new guidelines suitable for a broader consensus than the present ones [4].
Diagnosis of coeliac disease
For this purpose of revision, it is useful to go one step back. It is very helpful to follow basic recent ESPGHAN definitions [2] and also to define four levels: Clinics, Genetics, Serology, and Small Intestinal Biopsy.
1. Clinics
The widely accepted iceberg model of coeliac disease is still a good way to picture the variable and widely ranging clinical manifestations of coeliac disease from the classical presentation (abdominal distension, steatorrhoea, failure to thrive) to atypical

94 A critical appraisal of the ESPGHAN guidelines for the diagnosis of coeliac disease
symptoms (gastrointestinal problems, growth retardation and endocrine problems, deficiency syndromes, bone, skin, CNS disease and others). Association of coeliac disease with autoimmune diseases like type 1 diabetes mellitus, with IgA deficiency, and also asymptomatic coeliac patients (for instance first degree relatives of index patients) further complicate the diagnostic process [5,6]. In this situation, it is of no help and misleading to group presenting features as a mixture of specific signs like growth failure, deficiency states and abdominal distension together with unspecific signs like irregular bowel habits, chronic fatigue and irritability (compare Table 1, ref. 2). This compilation is not a good basis for a clinical diagnosis of coeliac disease and should be regrouped into clearcut accepted features and non-specific signs. Otherwise any scoring would lead into error.
2. Genetics
The genetic background of coeliac disease (HLA DQ 2 and DQ 8 haplotypes) is well accepted [7,8]. In particular, the haplotype HLA DQ 2.5 bears a high risk for coeliac disease [7,8]. However, as the new ESPGHAN guidelines indicate (Table 3 and 4, ref. [2]) there are also HLA DQ 2/8-negative coeliac patients. The relative proportion of this minority is disputed, but may come up to almost 10%. Before this "false negativity" has been followed up for immunologic or diagnostic errors, HLA typing should be used with caution and cannot be used as a sole laboratory test for diagnosing coeliac disease, as has been proposed in laboratory settings with low diagnostic expertise.
3. Serology
Autoantibodies such as IgA antibodies against endomysium and tissue transglutaminase 2 (IgA EMA, IgA anti- tTG) and IgG antibodies to deamidated gliadin (IgG anti-DGP) are appropriate serological indicators of coeliac disease. This has been shown and confirmed in many different settings [9,10] (see chapter 6.1) and has also been acknowledged by the ESPGHAN guidelines [2,11]. However, evaluations of the different antibody findings have to take into account limits in sensitivity, specificity and reproducibility of the respective tests. Even for the most specific antibodies, coeliac predictivity is not correct in up to approximately 10% of patients [10] (see chapter 6.1). No evidence is produced for a superiority of anti- tTG over EMA in the new guidelines [2,11]. In addition to this, lack of standardisation and lack of quality management of serological methods have led to complex possibilities of misinterpretation, mostly by laboratories overvalueing single and isolated serological findings (for instance false positive IgA- tTG antibodies, misleading IgG antibodies to native gliadin). There are several attempts to overcome this problem of lacking standardisation (in the UK: NEQAS, in Germany: Instand ring trial no. 271). Nevertheless, highly skilled clinical and serological professionals are needed to come to the right diagnostic conclusions from clinical and serological findings in coeliac disease.

6 New ESPGHAN guidelines 95
4. Small Intestinal Biopsy
Small intestinal biopsy in coeliac disease shows a wide spectrum of lesions [12]. Only a part, usually the more severe, of these lesions qualifies for the diagnosis of coeliac disease [13]. There is a strong dispute about low-grade enteropathy in coeliac disease [14]. At least in children, a high degree of intestinal damage (Marsh 2, Marsh 3a, 3b, 3c) is pathognomonic of coeliac disease, provided there is normalisation on a gluten-free diet. The latter event is also in itself a matter of debate, particularly in adults [15].
Synthesis
In many ways the new ESPGHAN guidelines [2] are not placed on solid ground: Clinical manifestations are grouped in a very undifferentiated way, there are false negatives in HLA haplotypes, there is a misleading evaluation of different serological tools. Any antibody calculations are misleading as long as there is no generally accepted standardisation and quality control of laboratory methods. In mild enteropathy and in responsiveness to a gluten-free diet, even the well-established small intestinal biopsy level leaves questions open. In addition to this, the time scale is not included in the current new guidelines (latent coeliac disease) [16]. The scoring system is premature. Adult gastroenterology does not appear to be included in ESPGHAN considerations. What happens if adult gastroenterologists do not accept coeliac diagnosis in children without biopsy, putting patients transferred to them at the age of 18 years systematically back to a gluten-containing diet for diagnostic reasons?
In this situation and as a compromise for revised guidelines, it is suggested to take one step back not using any algorithms or scores (see Table 1). Grouping into two groups (symptoms/no symptoms) might be sufficient when covering the four diagnostic levels (clinics, serology, genetics, biopsy). Individual assessment using reasonable medical logics and experience should be appropriate. It might also be acceptable to leave out small intestinal biopsy in clearly symptomatic patients with clearcut results in serology and HLA, responding well to a gluten-free diet. This, however, should be an exception and not a rule. By no ways small intestinal biopsy is obsolete after the introduction of the new ESPGHAN guidelines [2].
Table 1. Diagnosis of coeliac disease in children and adolescents.
2 GROUPS
Clinics Symptoms Gluten-dependent
No symptoms --
4 LEVELS Serology tTG, EMA, DGP tTG, EMA, DGP --
Genetics HLA DQ 2/8 HLA DQ 2/8 --
Biopsy optional mandatory --

96 A critical appraisal of the ESPGHAN guidelines for the diagnosis of coeliac disease
In addition, latent coeliac disease has to be considered and appropriate consenting should include adult gastroenterology. In coeliac serology, prospective evaluation and non-commercial multicentre studies covering all regions of Europe are mandatory. Only after this, a reasonable revison of current ESPGHAN guidelines may be accomplished.
References
1. Walker-Smith JA, Guandalini S, Schmitz J, et al. Revised criteria for diagnosis of coeliac disease. Arch Dis Child 1990, 65: 909-911.
2. Husby S, Koletzko S, Korponay-Szabó IR, et al. European Society for Pediatric Gastroenterology, Hepatology, and Nutrition Guidelines for the Diagnosis of Coeliac Disease. J Pediatr Gastroenterol Nutr 2012, 54: 136-160.
3. Koletzko S, Zimmer KP. Zöliakie: Neue diagnostische Kriterien der ESPGHAN (report). pädiatrie hautnah 2011, 23 (6): 481-484.
4. Ribes-Koninckx C, Mearin ML, Korponay-Szabó IR, et al. Coeliac disease diagnosis: ESPGHAN 1990 criteria or need for a change? Results of a questionnaire. J Pediatr Gastroenterol Nutr 2012, 54: 15-19.
5. Collin P, Kaukinen K, Mäki M. Clinical features of celiac disease today. Dig Dis 1999, 17: 100-106.
6. Tack GJ, Verbeek WHM, Schreurs MWJ, et al. The spectrum of celiac disease: epidemiology, clinical aspects and treatment. Nat Rev Gastroenterol Hepatol 2010, 7: 1-10.
7. Sollid LM, Qiao SW, Anderson RP, et al. Nomenclature and listing of celiac disease relevant gluten T-cell epitopes restricted by HLA-DQ molecules. Immunogenetics 2012, 64: 455-460.
8. Anderson RP, Henry MJ, Taylor R, et al. A novel serogenetic approach determines the community prevalence of celiac disease and informs improved diagnostic pathways. BMC Med 2013, 11: 188.
9. Stern M for the Working Group on Serologic Screening for Celiac Disease. Comparative evaluation of serologic tests for celiac disease: A European initiative toward standardization. J Pediatr Gastroenterol Nutr 2000, 31: 513-519.
10. Mothes T, Wolf J. Defining thresholds of antibody levels for the diagnosis of coeliac disease. In: Koehler P (ed) Proceedings of the 27th Meeting of the Working Group on Prolamin Analysis and Toxicity. Verlag Deutsche Forschungsanstalt für Lebensmittelchemie (DFA), 2014, pp. 89-92.
11. Giersiepen K, Lelgemann M, Stuhldreher N, et al. Accuracy of diagnostic antibody tests for coeliac disease in children: Summary of an evidence report. J Pediatr Gastroenterol Nutr 2012, 54: 229-241.

6 New ESPGHAN guidelines 97
12. Marsh MN. Gluten, MHC and the small intestine: A molecular and immunobiologic approach to the spectrum of gluten-sensitivity ('celiac sprue'). Gastroenterology 1992, 102: 330-354.
13. Oberhuber G, Caspary WF, Kirchner T, et al. Empfehlungen zur Zöliakie-/Spruediagnostik. Pathologe 2001, 22: 72-81.
14. Kurppa K, Collin P, Viljamaa M, et al. Diagnosing mild enteropathy celiac disease: A randomized, controlled clinical study. Gastroenterology 2009, 136: 816-823.
15. Rubio-Tapia A, Rahim MW, See JA, et al. Mucosal recovery and mortality in adults with celiac disease after treatment with a gluten-free diet. Am J Gastroenterol 2010, 105: 1412-1420.
16. Ferguson A, Arranz E, O'Mahony S. Spectrum of expression of intestinal cellular immunity: Proposal for a change in diagnostic criteria of celiac disease. Ann Allergy 1993, 71: 29-32.

98 A critical appraisal of the ESPGHAN guidelines for the diagnosis of coeliac disease

6 New ESPGHAN guidelines 99
6.3 ESPGHAN Guidelines - A gastroenterologist’s view
Paul J Ciclitira1, Ikram Nasr2
1 Department of Gastroenterology, Division of Nutritional Sciences, Kings College London, The Rayne Institute, St Thomas’ Hospital, London, UK
2 Department of Gastroenterology, Guy’s & St Thomas’ NHS Foundation Trust, London, UK
Introduction
Guidelines from the European Society of Paediatric Gastroenterology Hepatology and Nutrition (ESPGHAN) for the diagnosis and treatment of coeliac disease (CD) had not been renewed for twenty years. The perception of CD has changed from an uncommon enteropathy to a common multi-organ disease with a strong genetic predisposition, mainly associated with the human leukocyte antigen locus (HLA DQ2/DQ8).
The ESPGHAN working group was established to formulate the diagnosis of CD. The conclusion was that the diagnosis of coeliac disease could be based on symptoms, positive serology with anti-tissue transglutaminase (tTG-IgA) antibody titres that are >10 times the upper limit of normal with positive HLA DQ2 or DQ8 status [1].
CD may present with various non-specific signs and symptoms. It remains important to diagnose CD in children, adolescents, and adults. The availability of serological tests provides an excellent basis for screening, particularly as in the UK only 1:8 cases are diagnosed with an even lower proportion in the USA.
Screening for CD should be offered to children, adolescents and adults, and symptomatic individuals with either diarrhoea, constipation, amenorrhoea, iron-deficiency anaemia, nausea, vomiting, chronic abdominal pain, abdominal bloating, chronic fatigue, recurrent aphthous mouth ulceration, stomatitis, dermatitis herpetiformis, unexplained osteopoenia or osteoporosis or abnormal liver function tests.
Certain asymptomatic groups are at increased risk of developing CD. This includes, type 1 diabetes mellitus (IDDM), Down's, Turner and William's syndromes, autoimmune thyroid and liver diseases and first-degree relatives of probands with CD.
ESPGHAN Guidelines for CD diagnosis
Serological Screening Tests
CD-specific antibody tests assess anti-tTG, endomysial antibodies (EMA) and/or deamidated gluten peptides (DGP). Immunoglobulin levels should be quantitated. Gluten ingestion should have occurred for at least several weeks prior to investigation.

100 ESPGHAN Guidelines - A gastroenterologist’s view
HLA DQ2/DQ8
The ESPGHAN group recommended typing for HLA DQ2/DQ8 as positive HLA DQ2 or DQ8 status adds strength to the diagnosis.
Histology
The ESPGHAN guidelines note that the histological findings of a small intestinal biopsy exhibits varying degrees of enteropathy. They suggest that the presence or absence of normal villi or the degree of villous atrophy with crypt elongation, the villous height to crypt ratio, the number of intra-epithelial lymphocytes (IELs) and the Marsh-Oberhuber score should be recorded.
Conclusion
The ESPGHAN guidelines conclude that if children or adolescents are symptomatic, exhibit anti-tTG IgA antibody titres >10 times normal and are either HLA DQ2 or DQ8 positive a firm diagnosis can be made without a small intestinal biopsy. The authors suggest this should be prospectively evaluated. Paediatric gastroenterologists express varying views on the suitability of the guidelines. The relationship of these guidelines to the management of adults remains to be determined.
Approaches for CD diagnosis in adults suggested by the authors
Serology
Adult patients should have a history taken to assess symptoms. They need to be examined for signs of malabsorption. Individuals should be screened for CD serological antibodies when taking a gluten containing diet. This should include both IgA class anti-tTG and also IgA and IgG EMA. While it has been suggested that it is acceptable to exclude IgG antibody tests if the IgA level is normal, current UK and USA guidelines stipulate that both IgA and IgG tests should be performed in all cases of screening for CD [2,3]. Additional quantitation against DGP may be useful in patients who are negative for other CD-specific antibodies in whom clinical symptoms raise a strong suspicion of CD. Tests for IgA and IgG to native gliadin have become outmoded for CD screening as they may be raised in inflammatory bowel disease, including ileal Crohn's disease, and IgG tests are positive in 5% of normal subjects.
Small Intestinal Biopsy
False positive tTG values have been reported in both autoimmune thyroiditis and IDDM. It therefore remains mandatory for adult patients in whom there is a strong suspicion of CD or there is positive serology to proceed to endoscopy and small intestinal biopsy. In pregnancy, that provides a partial contraindication to endoscopy, a sugar permeability test such as a hypertonic lactulose/rhamnose permeability test can be used to assess indirectly small intestinal function.

6 New ESPGHAN guidelines 101
Upper gastro-intestinal endoscopy can be undertaken with or without parental sedation with midazolam. Small intestinal biopsies should be taken, with possibly one from the bulb, and at least four biopsies from the second or third part of the duodenum. The pathology should report a description of the orientation of the biopsies, the presence or not of normal villi or the degree of villous atrophy and crypt elongation, the number of IELs and the Marsh or Marsh-Oberhauer grading.
Should the biopsies all be normal, a subsequent push enteroscopy should be undertaken when multiple biopsies of the distal duodenum and proximal jejunum should be undertaken. This follows the finding that a significant number of individuals who were previously diagnosed with latent CD with positive serology and a normal D2 biopsy in fact have an enteropathy affecting the distal duodenum and proximal jejunum [4].
Follow-up
CD affected individuals require referral to a dietician for advice on a gluten-free diet with avoidance of wheat, rye, triticale, and barley. The place of oats remains controversial; although evidence suggests 5% of CD, affected individuals are sensitive to oats. There should be follow-up at six weeks to review symptoms and evaluate any changes in CD serology titres.
Following the change, the ESPGHAN guidelines the place of follow-up of children and adolescents who have been diagnosed without a small intestinal biopsy remains to be determined. We suggest that when these individuals are transferred from paediatric to adult gastroenterology care, careful assessment of the previous diagnosis should be made with consideration of a two week gluten-challenge comprising ten grams of gluten with four slices of gluten-containing bread per day followed by an endoscopy with small intestinal biopsies. Should the diagnosis not be confirmed the individuals should be advised to take a normal gluten containing diet with reinvestigation after a further six to twelve months.
The authors suggest that in adults a second endoscopy and small intestinal biopsy be undertaken at four to six months after initiation of a gluten-free diet. This will permit confirmation or otherwise rebuttal of the diagnosis. The authors suggest this is important not only to evaluate the response to treatment but also to confirm the diagnosis. We suggest that if there has not been significant improvement in the small intestinal morphology there should be a review of the diagnosis and a further endoscopy and with small intestinal biopsy be undertaken after a further year. This is important to identify not only patients with non-responsive disease but also those with either type one or two refractory CD. The latter is important as without appropriate treatment type 2 refractory CD has a 50% five-year mortality [5].

102 ESPGHAN Guidelines - A gastroenterologist’s view
References
1. Husby S, Koletzko S, Korponay-Szabo IR, et al. European Society for Pediatric Gastroenterology, Hepatology, and Nutrition guidelines for the diagnosis of coeliac disease. J Pediatr Gastroenterol Nutr 2012, 54: 136-160.
2. Ciclitira PJ. British Society of Gastroenterology Guidelines for the Management of Coeliac Disease. 2013, http://www.bsg.org.uk/clinical/commissioning-report/ coeliac-disease.html, accessed March 6, 2014.
3. Ciclitira PJ. Management of Celiac Disease in Adults. In: LaMont JT (ed). Up-to-Date, 2013, http://www.uptodate.com/contents/management-of-celiac-disease-in-adults, accessed March 6, 2014.
4. Willington R, Lashmar V, Kenes K, et al. Push enteroscopy leads to a change in diagnosis in the major of patients with positive coeliac serology and negative duodenal biopsy. Gut 2013, 62(Supplement 1): 286.
5. Dewar DH, Donnelly SC, McLaughlin SD et al. Celiac disease: Management of persistent symptoms in patients on a gluten-free diet. World J Gastroenterol 2012, 18: 1348-1356.

6 New ESPGHAN guidelines 103
6.4 Evaluation of serology in coeliac disease
Johannes Wolf1, David Petroff2, Dirk Hasenclever2, Thomas Mothes1
1 Department of Laboratory Medicine, Clinical Chemistry, and Molecular Diagnostics, University of Leipzig, Leipzig, Germany
2 Coordination Centre for Clinical Trials, University of Leipzig, Leipzig, Germany
Introduction
As described above [1] (see chapter 6.1), the European Society of Paediatric Gastroenterology, Hepatology and Nutrition (ESPGHAN) concluded that the performance of the new guidelines for the diagnosis of coeliac disease (CD) in clinical practice should be evaluated prospectively [2]. A prospective international multicentre biopsy-controlled trial on antibody diagnostics in paediatric coeliac disease (AbCD) is currently recruiting patients to evaluate the proposed diagnostic algorithm to diagnose CD [3]. For preparation of this trial, we analysed our own (retrospective) pilot data.
Materials and Methods
We analysed antibody measurements performed in sera of 1071 children from nine European centres. The patients included 376 children with CD and 695 controls (prevalence = 0.35). Selective IgA deficiency (sIgAD) was found in three disease controls and 24 CD patients.
Contrary to the ESPGHAN, we did not only consider the 10xULN (upper limit of normal) cut-off for IgA antibodies to tissue transglutaminase (IgA-aTTG), but also for IgG-antibodies against deamidated gliadin peptides (IgG antibodies to gliadin analogous fusion (GAF) peptides, IgG-aGAF). Test kits from EUROIMMUN were used for all assays. We investigated the predictive values of assays for IgA-aTTG and of IgG-aGAF performed as single tests (one-test procedure) but also when considered in combination (two-test procedure). In addition to clearly negative cases with very low antibody concentrations (below company cut-off) and clearly positive cases with very high antibody concentrations (> 10xULN) we introduced a third category, unclear test results with antibody concentrations in between (grey zone).
The reliability of a test result is reflected by the fraction of test-positives who are sick (positive predictive value, PPV) and of test-negatives who are non-sick (negative predictive value, NPV). These predictive values strongly depend on the prevalence (pre-test probability) of the diseased patients. The PPV increases with increasing prevalence, whereas the NPV decreases.
However, the prevalence in symptomatic patients in clinical practice may be as low as 3 to 10% [4-6]. Higher prevalences may be due to preselection of patients by the results of antibody tests. We calculated the predictive values in dependence on prevalence. A test was regarded reliable if the point estimates of PPV and NPV both

104 Evaluation of serology in coeliac disease
lay above 95%. Further, we demanded that the 95% lower confidence bound (LCB) for both predictive values be simultaneously above 90%.
Results and discussion
In Table 1 the two predictive values at a prevalence of 0.35, the range of prevalence for which the test can be regarded reliable, and the percentage of patients in the grey zone are reported.
At the prevalence of our retrospective data (0.35), all tests and test combinations had very high predictive values (PPV ≥ 0.99 and NPV ≥ 0.94).
Except the one-test procedure measuring IgG-aGAF, all tests and test combinations (whether or not sIgAD patients were excluded) were reliable (predictive values > 0.95 and LCB of the predictive values > 0.90) at a prevalence range starting from 0.09. The IgG-aGAF test as one-test procedure even had a higher PPV. This procedure would avoid the only two patients false-positive for anti-TTG (with IgA-aTTG values above 10xULN). However, with the one-test procedure applying IgG-aGAF there was a lower number of true-positives compared to the other procedures. This means that this estimate could not be provided with a comparable certainty, i.e. the LCB was lower and only above 90% for a narrow range of prevalence.
Table 1. Performance of IgA-aTTG and IgG-aGAF as single tests (one-test procedure) or in combination (two-test procedure).
Patients Tests
PPV at prevalence
of 0.35
NPV at prevalence
of 0.35
Prevalence range for reliability
Proportion in
grey zone Without known sIgAD (n = 1044)
IgA-aTTG 0.99 0.99 0.09 - 0.64 0.03 - 0.07
IgA-aTTG + IgG-aGAF
0.99 0.99 0.09 - 0.69 0.05 - 0.07
All (n = 1071)
IgA-aTTG 0.99 0.95 0.09 - 0.36 0.03 - 0.05
IgA-aTTG + IgG-aGAF
0.99 0.98 0.09 - 0.57 0.05 - 0.08
IgG-aGAF 1.00 0.94 0.19 - 0.29 0.14 - 0.19
PPV, positive predictive value; NPV, negative predictive value; sIgAD, selective IgA deficiency; IgA-aTTG, IgA antibodies to tissue transglutaminase; IgG-aGAF, IgG antibodies to gliadin analogous fusion peptides (=deamidated gliadin peptides)
High values of NPV (and a broad range of prevalence in which the tests are reliable) can only be reached if patients with sIgAD were excluded or if IgG-aGAF were considered in combination with IgA-aTTG (two-test procedure).
6 New ESPGHAN guidelines 105
Among our patients we found two CD children who were negative for IgA-aTTG but positive for IgG-aGAF. One of them had partial IgA-deficiency (total IgA higher than in sIgAD but lower than the age dependent cut-off). The second child had normal IgA.
Conclusion
Antibody assays could render biopsies unnecessary in the majority of children if experienced paediatric gastroenterologists evaluate the case. The two-test procedure may be safer and advantageous in special situations (total IgA measurements not available, for instance in very young children). IgG-aGAF can also pick-up some IgA-competent patients negative for IgA-aTTG. The predictive values of both procedures are so high, that further confirmation by EMA or HLA-typing only adds negligible information.
The above suggestions only apply to the test-kits used here and should be verified for the different assays on the market. Our study has several limitations resulting from its retrospective nature. Therefore, the results have to be confirmed prospectively [3].
Acknowledgments
The contributions of Bossyut X (Dept Lab Med of the Univ Hosp Leuven), Flemming G (Univ Children’s Hosp Leipzig), Hauer AC (Univ Children’s Hosp Graz), Koletzko S (Univ Children’s Hosp München), Laass MW (Univ Children’s Hosp Dresden), de Laffolie, J (Univ Children’s Hosp Gießen), Richter T (Children’s Hosp Clin Centre „Sankt Georg“ Leipzig) Schlumberger W (EUROIMMUN Lübeck), Stern M (Univ Children’s Hosp Tübingen), Uhlig HH (Transl Gastroenterol Unit, Exp Med of the Univ, John Radcliffe Hosp Oxford), Villalta D (Allergy & Immunol Unit, Azienda Ospedal “San Maria degli Angeli,” Pordenone), in retrospective data acquisition and evaluation are gratefully acknowledged.
References
1. Mothes T, Wolf J. Defining thresholds of antibody levels for the diagnosis of coeliac disease. In: Koehler P (ed) Proceedings of the 27th Meeting of the Working Group on Prolamin Analysis and Toxicity. Verlag Deutsche Forschungsanstalt für Lebensmittelchemie (DFA), 2014, pp. 89-92.
2. Husby S, Koletzko S, Korponay-Szabo IR, et al. (The ESPGHAN Working Group on Coeliac Disease Diagnosis). ESPGHAN guidelines for the diagnosis of coeliac disease in children and adolescents. An evidence-based approach. J Pediatr Gastroenterol Nutr 2012, 54: 136-160.
3. https://faustino.imise.uni-leipzig.de/abcd/
4. Vecsei A, Arenz T, Heilig G, et al. Influence of age and genetic risk on anti-tissue transglutaminase IgA titers. J Pediatr Gastroenterol Nutr 2009, 48: 544-549.

106 Evaluation of serology in coeliac disease
5. Vermeersch P, Geboes K, Marien G, et al. Defining thresholds of antibody levels improves diagnosis of celiac disease. Clin Gastroenterol Hepatol 2013, 11: 398-403.
6. Reeves GEM, Squance ML, Duggan AE, et al. Diagnostic accuracy of coeliac serological tests: a prospective study. Eur J Gastroenterol Hepatol 2006, 18: 493-501.

7 Statements by participating organisations 107
7 Statements by participating organisations, representatives from industry and guests
7.1 Call for experts in order to set an Expert Working Group on Wheat Quality under the International Wheat Initiative
Angéla Juhász1, W. John Rogers 2, Gerard Branlard3, Tatsuya M. Ikeda1
1 Agricultural Institute CAR HAS, Martonvásár, Hungary 2 Catedra de Genetica y Fitotecnia, Facultad de Agronomia, UNICEN, Buenos Aires,
Argentina 3 INRA UMR1095 GDEC-UBP, Clermont-Ferrand, France 4 NARO, Western Region Agricultural Research Centre, Fukuyama, Japan
Introduction
In a scenario of climate change and rapidly rising urban populations demanding processed foods, it is necessary to develop new wheat cultivars combining high yield potential, disease resistance, and stability for yield, processing quality and nutritional value, even under heat or drought stress conditions. The definition of wheat quality highly depends on the demands raised by the breeders, the milling industry, food industry and food processing and the customer. Additionally, feed and non-food uses also require specific aspects to be considered. In a previous successful international collaboration four laboratories and an international institution shared cultivars and compared results of SDS-PAGE, two-dimensional electrophoresis, MALDI-TOF-MS and PCR analyses in order to identify certain low molecular weight (LMW) glutenin alleles and also to unify the different LMW glutenin subunit classification methods [1,2]. Next to the precise identification and analysis of the LMW glutenin alleles the composition of other gluten protein fractions, the amount of the expressed proteins and their interactions with each other also strongly determine the quality of wheat. Furthermore involvement of non-gluten proteins, carbohydrates, lipids and micronutrients will enhance our understanding in the complexity of wheat quality. Therefore an Expert Working Group on Wheat Quality under the frame of the International Wheat Initiative is going to be created based on a need expressed by wheat scientists working on different aspects of quality.
The Working Group initially will focus on seven main tasks (Figure 1): the gluten composition, the allergen and toxic nature of the wheat grain, the composition and effect of carbohydrates, the processing related tasks, the effect of nutrients, micronutrients, food safety issues including toxins, and the non-food uses. The establishment of a Working Group will enhance to collect and organise the wheat quality related tasks, to organise research priorities and will help to develop

108 Expert working group on wheat quality
international collaborations between researchers, research institutions and funding agencies.
Figure 1. Main objectives and priorities of the Expert Working Group on Wheat Quality
By sharing materials and methods among international research groups, it becomes possible to define better the relationship between specific gluten proteins, carbohydrate characteristics and other compounds including the effect of nutrients and micronutrients and processing quality stability, even under heat or drought stress wheat growing conditions. One of the main focuses of this Expert Working Group will
Figure 2. Objectives and targets of the prolamin related tasks

7 Statements by participating organisations 109
be to establish a system to share materials internationally in order to enhance the precise identification of gluten forming proteins (Figure 2). We propose to deposit cultivars representing particular gluten protein alleles in public gene banks (e.g. Germplasm bank in CIMMYT, Genebank in VIR in Russia, NBRP in Japan, and GRIN in the USA). The registered alleles will be available publicly through these gene banks. New alleles can be evaluated by curators of the catalogue and other researchers for registration in the catalogue. This system also helps to refine the catalogue. At present CIMMYT Genebank performs seed multiplication of a Glu-3 common wheat master set.
It is also important to use common methodologies to identify the alleles of interest. For the identification of polymeric gluten proteins by SDS-PAGE, Peña proposed the use of separation gels containing Tris buffer of pH 8.5 instead of pH 8.8 for better separation of LMW-GS bands [1,3]. Lowering bis-acrylamide concentration and using larger size gels also helps better separation (Branlard et al. 2003). Further evaluation for creating a standard SDS-PAGE method is necessary. For PCR markers, as the number of known alleles increases, we need to reconfirm the usefulness of PCR markers to identify the alleles of interest.
There is a gap in the identification of durum and hexaploid prolamin alleles. The LMW glutenin alleles of durum wheat were classified independently of those of common wheat [4,5]. In the catalogue, the durum Glu-3 alleles were originally assigned separately and subsequently combined into one provisional list. Since tetraploid durum wheat shares common ancestral species with common wheat, we would expect some alleles to be identical to those of common wheat. We shared standard cultivars and studied Glu-3 alleles by SDS-PAGE, 2-DE and PCR. Some alleles seemed to share the same alleles with common wheat, but some were unique in durum wheat (data not shown). This means that durum allele might widen the genetic diversity of common wheat alleles, and vice versa. Further analysis is necessary to clarify durum Glu-3 alleles and produce a definitive list in the catalogue for use by the wheat community. This is also important for Glu-1 alleles.
Gliadin consists of -//-gliadins, which contain many proteins having a range of molecular weights and pI values. Variation in the gliadins also effects dough properties [6]. Gliadins are also known to contain epitopes involved in wheat gluten related disorders [7]. Gliadin analysis was mainly carried out using A-PAGE. The analysis of gliadin proteins using SDS-PAGE allows the determination of the banding patterns associated with the close linkage existing between Gli-1 and Glu-3, and, therefore, this approach further contributes to the identification of specific Glu-3 LMW-GS in both common and durum wheat.
With increasing genome sequence data availability, it is important to identify all the expressed proteins by proteomic techniques to clarify correspondence between prolamin and non-prolmin proteins, their toxic linear or structural epitopes and their overall allergen characteristics [8]. The analysis of epitope sequences and conformation and defining how their structure is related to the caused effect will help

110 Expert working group on wheat quality
to understand the allergen nature of wheat strorage proteins. The analysis of wheat allergens will also need the involvement of gastroenterologists, immunologists and the food industry. The exponentially increasing amount of data available from the analysis of the human genome, the different clinical and immunological studies has highlighted the complexity of wheat related food disorders. The better understanding of the difference between allergies, coeliac disease or non-coeliac gluten sensitivity combined with the knowledge obtained from the gluten protein analyses may also help identify cereal genotypes suitable to develop specific diets with different levels of “healthy” gluten.
Currently there are more than sixty researchers all over from the world joined our proposal coming from different areas of wheat quality. We would like to invite other colleagues related to wheat quality to join our collaboration. In case you are interested please contact Dr. Tatsuya M. Ikeda (email: [email protected]).
References
1. Ikeda TM, Branlard G, Peña RJ, et al.. International collaboration for unifying Glu-3 nomenclature system in common wheats in: The 11th International Wheat Genetics Symposium. R. Appels, R. Eastwood, E. Lagudah, P. Langridge, M. M. Lynne and URI, eds. Sydney University Press, Brisbane, 2008.
2. Liu L, Ikeda TM, Branlard G, et al. Comparison of low molecular weight glutenin subunits identified by SDS-PAGE, 2-DE. MALDI-TOF-MS and PCR in common wheat. BMC Plant Biol 2010, 10: 124.
3. Peña RJ, Gonzalez-Santoyo H, Cervantes F. Relationship between some Glu-D1/Glu-B3 allelic combinations and bread-making quality related parameters commonly used in wheat breeding. Pages 156-157 in: The Gluten Proteins. D. Lafiandra, S. Masci and R. D'Ovidio, eds. Royal Society of Chemistry, 2004.
4. Martinez MdC, Ruiz M, Carrillo JM. New B low Mr glutenin subunit alleles at the Glu-A3, Glu-B2 and Glu-B3 loci and their relationship with gluten strength in durum wheat. J Cereal Sci 2004, 40: 101-107.
5. Nieto-Taladriz MT, Ruiz M, Martínez MC, et al. Variation and classification of B low-molecular-weight glutenin subunit alleles in durum wheat. Theor Appl Genet 1997, 95: 1155-1160.
6. Branlard G, Dardevet M. A Null Gli-D1 Allele with a Positive Effect on Bread Wheat Quality. J Cereal Sci 1994, 20: 235-244.
7. Juhasz A, Gell G, Bekes F. The epitopes in wheat proteins for defining toxic units relevant to human health. Funct Integr Genomic 2012, 12: 585-598.
8. Sapone A, Bai JC, CiacciC, et al. Spectrum of gluten-related disorders: consensus on new nomenclature and classification. BMC Medicine 2012, 10: 13.

8 Perspectives and action plan 111
8 Perspectives and action plan of the PWG
Peter Koehler
German Research Centre for Food Chemistry, Leibniz Institute, Freising, Germany
The Prolamin Working Group executive meeting and joint discussion held on October 11th, 2013 led to the decisions outlined below.
Action plan
I. Analytical
Peter Koehler is responsible for the PWG gliadin reference material ([email protected]).
PWG gliadin will continue being the reference material supported by the group.
Plans for new reference materials will be collected and reviewed within the next two years. The PWG is part of external approaches for producing alternative reference materials (collaboration with MoniQA Association).
Collaborative studies on gluten quantitation will continue (immunochemical and non-immunochemical, Lateral Flow Devices, deamidated gluten).
II. Clinical
For the symposium of the 2014 meeting the topic “Antigen receptors in coeliac disease” has been selected. Speakers will be Frits Koning and Knut Lundin.
Studies on mechanisms of innate immunity and gluten sensitivity continue being in the focus in the next years.
III. Publication and policy
Prof. Knut Lundin (Oslo, Norway) is a new member of the group since 2013.
New group members will be identified and will replace leaving members in the next years. A list of possible candidates will be created.
The group has the goal to become active in research projects within the Horizon 2020 programme of the EU.
The PWG website was improved. New address: http://www.wgpat.com
This printed, citable book (print run: 300 copies with ISBN number) was made possible by funding of Dr. SCHÄR GmbH/Srl, (Burgstall, BZ, Italy) and by the help of Mrs. Anneliese Stoiber and Dr. Gaby Andersen, Deutsche Forschungs-anstalt für Lebensmittelchemie (Freising, Germany). It will be distributed among leaders of opinion in gluten analysis and clinical medicine.

112 8 Perspectives and action plan
Next meeting: 2014 We are very pleased to announce the venue for our meeting in 2014: Nantes, France
Hosts: Dr. Olivier Tranquet Dr. Sandra Dénéry INRA Rue de la Géraudière BP 71627 44 316 Nantes Cedex 3, France Phone: +33 2 40 67 50 27, Fax: +33 2 40 67 50 25 E-mail: [email protected]
Time: September 25 – 27, 2014 Focus of the meeting:
Antigen receptors in coeliac disease
Analysis of gluten and deamidated gluten
Research on coeliac disease and wheat allergy in France The meeting will be limited to 50 participants and attendance is by invitation only. Invitations will be sent by April 2014. Registration deadline will be June 15, 2014. For registration please contact:
Olivier Tranquet (address: see above)
Very special thanks to the host of this kind invitation!