Embed Size (px)
Citation preview

Working Futures 2014–2024
www.gov.uk/ukces

www.gov.uk/ukces
Man
ager
s, D
irec
tors
an
d Se
nior
Offi
cial
sPr
ofes
sion
al
Occ
upat
ions
Asso
ciat
e Pr
ofes
sion
al
and
Tech
nica
lAdm
inist
rativ
e
and S
ecre
taria
l
Skille
d Trades
Caring, Leisure
and Other Service
Sales and Customer
Service
Process, Plant and
Machine Operatives
Elementary Occupations
Working Futures
PAST NOW
2024
FUTURE
Public Admin,
Health and Education
Introduction
The presentation:
Sets out the background to the Working Futures model
Examines economic and sectoral prospects
Explores the outlook for skills by assessing occupational prospects and the implications for qualifications.
www.gov.uk/ukces

www.gov.uk/ukces
What is Working Futures?
Why use Working Futures?
For employers, it gives an indication of future requirements for skilled labour, including by industry sector and occupation.
For individuals, it gives a sense of where the future jobs may be – and whether they’re in growth industries, or meeting a need to replace retiring workers.
For education and training providers it gives an insight into the skills that are likely to be in the greatest demand in future.
And for policymakers, it allows us to think about whether we’re going to have the right people in the right jobs in the future.
The main purpose of Working Futures is to provide a rich source of information that can inform choice and facilitate evidence based rather than anecdotal decision making.

www.gov.uk/ukces
Methodology
The projections are based on the use of a multi-sectoral, regional macroeconomic model, combined with occupational, replacement demand and qualification modules.
The results take account of the latest official data published by the Office for National Statistics.
Comprehensive it covers the entire UK labour market, investigating how different industry sectors’ prospects interact, with some expanding and some contracting, and each changing in different ways.
Robust it draws on the full range of published statistics to provide an employment baseline by sector, occupation and local area, and uses sophisticated modelling to forecast how these different dimensions are likely to evolve. Data sources that underpin Working Futures include: The Office for National Statistics’ UK National and Regional Accounts, Input-Output Supply and Use Tables, the Labour Force Survey and the 2011 Census.
Granular by providing a breakdown by sector and occupation, it allows us to understand not only the likely broad changes in the labour market, but also the implications for the skills mix in each industry sector.

www.gov.uk/ukces
Source: Working Futures
Labour market context
Employment trend 1990-2024
40,000,000
35,000,000
30,000,000
25,000,000
20,000,000
15,000,000
10,000,000
5,000,000
0
1990
1991
1992
1993
1994
1995
1996
1997
1998
1999
2000
2001
2002
2003
2004
2005
2006
2007
2008
2009
2010
2011
2012
2013
2014
2015
2016
2017
2018
2019
2020
2021
2022
2023
2024

www.gov.uk/ukces
Source: Working Futures
Labour market context
Changes in employment in the UK by gender and status, 2014-24
1200
1000
800
600
400
200
0
-200
Male Female Total
Empl
oym
ent (
000’
s)
Full-time Part-time Self-employed

www.gov.uk/ukces
Source: Working Futures
Sectoral prospects
Performance of broad sectors of the economy by forecast output and employment change, 2014-2024
Empl
oym
ent
% C
hang
e 20
14 -
2024
20
-15
0 10-10 20 30 40 50
k
p
n m
ab
e
q
j gi
d
l
f ch
o
Bubble size represents the percentage of the workforce employed in the sector in 2024
15
10
5
0
-5
-10
Primary sector & utilities
GVA % Change 2014 - 2024
a
Real estatej
Manufacturingb
Professional servicesk
Constructionc
Support servicesl
Wholesale and retail traded
Public administration and defencem
Transport and storagee
Educationn
Accommodation and foodf
Health and social worko
Arts and entertainment p
Other servicesq
Note: Public administration and defence excludes H.M. Forces
Media g
Information technologyh
Finance and insurancei

www.gov.uk/ukces
Sector ProfilePrimary sector & utilities
Activity is expected to grow modestly in this sector, leading to a fall in its share of total output. It is anticipated that competition from imports and cost pressures will drive efficiency savings and productivity improvements, leading to a decline in employment over the course of the decade.
Industry profile
Share of total employment
Total employment
2014
837,0002024
765,000
Share of UK output (GVA)
20242.2%
2014£68,253m
2024£72,730m
20144.5%
20243.9%
GVA: £ (£2011m)
20142.5%
Employment change (n)
Employment change (%)
GVA growth (% p.a)
Productivity growth (% p.a)
Replacement demand (n)1
Trends in output, productivity and employment
Sector2014 - 2024 UK Average
-72,000 1,810,000
1.5 1.7330,000 13,110,000
-8.6% 5.4 %0.6% 2.2 %
Key factors influencing the sector:
Coal, oil & gas production is expected to fall, due to dwindling domestic reserves and high costs of extraction relative to imports.
Utilities output is forecast to grow modestly, driven partly by an anticipated increase in household demand.
Energy policies and environmental legislation are likely to grow in importance, creating long-term opportunities and challenges for the sector.
Agricultural output is expected to grow modestly, driven by changing consumer patterns. However, productivity improvements are expected to result in a fall in employment.
Employment levels in utilities will grow more slowly as efficiency measures will reduce labour demand.
Agriculture, forestry and fishing
Mining and quarrying
Electricity, gas, steam and air conditioning
Water supply, sewerage, waste management
Sub-sectors

www.gov.uk/ukces
Sector ProfileManufacturing
Manufacturing is forecast to grow at a slower rate than the wider economy over the next decade, in the face of intense competition from overseas. Its share of total output will decline slightly. Productivity growth is expected to lead to a continued decline in employment, with traditional roles being particularly affected.
Industry profile
Trends in output, productivity and employment
Food, drink & tobacco Textiles & clothing Wood & paper
products Printing & recording Coke & petroleum Chemicals & chemical
products Rubber & plastic
products & other non-metallic mineral products
Pharmaceuticals Metals & metal
products Electronics Electrical equipment Machinery Motor vehicles Other transport
equipment Other manufacturing
& repair
Sub-sectors
Share of total employment
Total employment
2014
2,591,0002024
2,350,000
20147.8%
20246.7%
2014£147,439m
2024£175,430m
20149.7%
20249.3%
GVA: £ (£2011m)
Employment change (n)
Employment change (%)
GVA growth (% p.a)
Productivity growth (% p.a)
Replacement demand (n)
2014 - 2024 Sector UK Average
-241,000 1,810,000
2.8 1.7885,000 13,110,000
-9.3 % 5.4 %1.8 % 2.2 %
Key factors influencing the sector:
Employment is expected to stagnate or fall despite the growth in output, driven mostly by increasing automation in the sector.
New processes and techniques such as 3D printing, additive and composite manufacturing and plastic electronics are changing the shape of production within the sectori.
The availability of skilled labour will be an important consideration for the employment outlook in the long-term.
Global population growth, as well as a rising proportion of individuals with middle-class incomes, are expected to increase global consumption of manufactured goods.
Future output growth in manufacturing is expected to be constrained by increasing competition from overseas manufacturers.
Global growth in advanced manufacturing demand will drive an increase in domestic activity, especially for industries in which the UK has specialised, such as aerospace, pharmaceuticals, and other technology-intensive industries.
IMPORTIMPORT
IMPORT
IMPORT
IMPO
RT
IMPORT
IMPORTIMPORT
IMPORT
IMPO
RT
Share of UK output (GVA)

www.gov.uk/ukces
Sector ProfileConstruction
Construction is expected to see the fastest rate of growth of the six sectors, in both output and employment terms, resulting from an anticipated increase in public and private investment.
Industry profile
Trends in output, productivity and employment
Construction of buildings
Civil engineering Specialised construction activities e.g. demolition, installation, building completion activities
Sub-sectors
Share of total employment
Total employment
2014
2,092,0002024
2,393,000
20146.3%
20246.8%
2014£92,139m
2024£124,734m
20146.1%
20246.7%
GVA: £ (£2011m)
Employment change (n)
Employment change (%)
GVA growth (% p.a)
Productivity growth (% p.a)
Replacement demand (n)
Sector UK Average
301,000 1,810,000
1.7 1.7765,000 13,110,000
14.4 % 5.4 %3.1 % 2.2 %
2014 - 2024
Key factors influencing the sector:
Rising population levels in the UK are expected to increase demand for construction of housing and infrastructure.
Overall, regulatory policies are likely to encourage construction growth particularly as firms seek innovative processes and technologies to adapt to environmental concerns.
Long-term, major public infrastructure projects, such as HS2 and Crossrail 2, are likely to contribute to output growth.
Construction growth will depend on the recovery of lending to the private sector and public infrastructure spending.
New types of demand will encourage technological innovations and stimulate growth. In particular, integrating construction processes with technological developments (e.g. the development of “smart cities”) will be an important driver of long-term growth.
£
Share of UK output (GVA)

www.gov.uk/ukces
Sector ProfileTrade, accommodation & transport
Although diverse in composition, the performance of the trade, accommodation and transport sector is largely dependent on the amount of activity in the wider economy. The output of the sector is forecast to grow at a pace similar to the economy average, whilst employment will grow a little faster than average.
Industry profile
Trends in output, productivity and employment
Wholesale and retail trade; repair of motor vehicles
Transport and storage
Accommodation and food activities
Sub-sectors
SALE
Share of total employment
Total employment
2014
8,604,0002024
9,248,000
Share of UK output (GVA)
201425.8%
202426.3%
2014£284,662m
2024£351,880m
201418.8%
202418.7 %
GVA: £ (£2011m)
Employment change (n)
Employment change (%)
GVA growth (% p.a)
Productivity growth (% p.a)
Replacement demand (n)
Sector UK Average
644,000 1,810,000
1.4 1.73,490,000 13,110,000
7.5 % 5.4 %2.1 % 2.2 %
2014 - 2024
Key factors influencing the sector:
The strongest output growth is likely to be observed in air transport services, although there may be capacity constraints, especially in London.
Retail, accommodation and food services, as well as transportation services are likely to be partly dependent on the outlook for tourism growth, which is expected to be modest.
Increased automation and technology improvements will reduce labour demand in some traditional roles; such as retail check-out staff.
Changing consumer behaviour, such as a switch to purchasing goods online, are expected to increase demand in postal and courier activities, and transportation and distributional services.
The performance of the sector hinges on factors such as household disposable income and business activities.
Employment growth in the sector is expected to be mainly driven by jobs growth in retail, accommodation and catering.
£££
SALE
VACANCIES
SALE

www.gov.uk/ukces
Sector ProfileBusiness & other services
Business and other services is forecast to see a moderation in its rate of growth in output and employment compared with that seen between 2004 and 2014, although it is expected that it will still outpace growth in the wider economy. As the largest of the six broad sectors it will make a considerable contribution to growth in absolute terms.Industry profile
Trends in output, productivity and employment
Information technology
Financial and insurance activities
Real estate activities
Professional services
Support service activities
Arts, entertainment and recreation
Other service activities
Sub-sectors
Share of total employment
Total employment
2014
10,523,0002024
11,552,000
Share of UK output (GVA)
201431.6%
202432.9%
2014£523,570m
2024£661,595m
201434.5%
202435.1%
GVA: £ (£2011m)
Employment change (n)
Employment change (%)
GVA growth (% p.a)
Productivity growth (% p.a)
Replacement demand (n)
Sector UK Average
1,029,000 1,810,000
1.4 1.74,228,000 13,110,000
9.8 % 5.4 %2.4 % 2.2 %
2014 - 2024
Key factors influencing the sector:
The industries expected to make the largest contribution to growth are financial services, professional, scientific and technical activities, and information technology.
Technological progress supported by strong capital investment within the information technology industry will be a major factor in stimulating long-term growth, even though it is likely to weaken employment growth in some traditional roles.
Although the country’s comparative advantage in professional and business services will come under pressure in the long-run, these activities will continue to attract investment into the UK over this period.
Overall, the comparative advantage of the UK, strong investment into the sector, and technological progress are anticipated to be major factors driving long-term growth.
The sector is expected to see strong growth in labour demand in the long run; much of this demand is likely to be in high-skilled and low-skilled roles continuing the trend of occupational polarisation.

www.gov.uk/ukces
Sector ProfilePublic admin, health, education
Current government commitments to reducing the deficit will constrain the sector’s growth potential in the medium-term. However, as concerns for budgetary balance decrease, increasing demand is expected to accelerate growth in the sector in the long-term. Job losses in the first half of the period are expected to be more than offset as employment growth picks up between 2019 and 2024.Industry profile
Trends in output, productivity and employment
Public administration and defence
Education Health and social work
Sub-sectors
Share of total employment
Total employment
2014
8,684,0002024
8,833,000
Share of UK output (GVA)
201426.1%
202425.1%
2014£284,910m
2024£341,469m
201418.8%
202418.1%
GVA: £ (£2011m)
Employment change (n)
Employment change (%)
GVA growth (% p.a)
Productivity growth (% p.a)
Replacement demand (n)
Sector UK Average
149,000 1,810,000
1.7 1.73,411,000 13,110,000
1.7 % 5.4 %1.8 % 2.2 %
2014 - 2024
Key factors influencing the sector:
Wider demographic trends, such as the ageing population, will be a major driver of increased demand in the long run.
Activity and employment in education services, especially within private education and higher education institutions, are forecast to increase, driven partly by a rise in export demand.
Activity in public administration, health and education are dependent on political decisions, as government is a major component of this sector’s demand.
X

www.gov.uk/ukces
Occupational change 2014-2024
Strong growth for higher level occupations: managers, most professional occupations and many associate professional and technical roles.
Caring, leisure and other service occupations also to see significant growth.
Net job losses for administrative & secretarial occupations; skilled trade occupations; and process, plant & machine operatives.
Mixed fortunes for elementary occupations -modest growth in jobs less subject to automation, losses in other areas.
Occupational change, total employment (000s)
Managers, directors and senior officials
Professional occupations
Associate, professional and technical
Administrative and secretarial
Skilled trades occupations
Caring, leisure and other services
Sales and customer service
Process, plant and machine operatives
Elementary occupations
-600 -400 -200 0 200 400 600 800 1000 1200 1400
2004 - 20142014 - 2024 (projected)

www.gov.uk/ukces
Managers, directors and senior officials
Professional occupations
Associate, professional and technical
Administrative and
secretarial
Skilled trades occupations
Caring, leisure and other services
Sales and customer
service
Elementary occupations
Managers, directors
and senior officials
11%share of 2024 employment
15% net employment
change 2014–2024
Job openings 2012-24000s
Expansion Demand
Total Requirement
Replacement Demand
53% male
47% female
Occupation by gender 2024
499
1,888
1,389

www.gov.uk/ukces
Professional occupations
21%share of 2024 employment
13% net employment
change 2014–2024
Job openings 2012-24000s
Expansion Demand
Total Requirement
Replacement Demand
Occupation by gender 2024
875
3,506
2,631
53% male
47% female
Professional occupations
Associate, professional and technical
Administrative and
secretarial
Skilled trades occupations
Caring, leisure and other services
Sales and customer
service
Elementary occupations
Managers, directors
and senior officials

www.gov.uk/ukces
Associate, professional and technical
15%share of 2024 employment
12% net employment
change 2014–2024
Job openings 2012-24000s
Expansion Demand
Total Requirement
Replacement Demand
Occupation by gender 2024
538
2,2621,723
53% male
47% female
Professional occupations
Associate, professional
and technical
Administrative and
secretarial
Skilled trades occupations
Caring, leisure and other services
Sales and customer
service
Elementary occupations
Managers, directors
and senior officials

www.gov.uk/ukces
Administrative and secretarial
9%share of 2024 employment
-11%
net employment change
2014–2024
Job openings 2012-24000s
Expansion Demand
Total Requirement
Replacement Demand
Occupation by gender 2024
-389
1,114
1,504
26% male
74% female
Professional occupations
Associate, professional and technical
Administrative and
secretarial
Skilled trades occupations
Caring, leisure and other services
Sales and customer
service
Elementary occupations
Managers, directors
and senior officials

www.gov.uk/ukces
Skilled trades occupations
16%share of 2024 employment
-4%
net employment change
2014–2024
Job openings 2012-24000s
Expansion Demand
Total Requirement
Replacement Demand
Occupation by gender 2024
-229
1,8462,076
11% male
89% female
Professional occupations
Associate, professional and technical
Administrative and
secretarial
Skilled trades occupations
Caring, leisure and other services
Sales and customer
service
Elementary occupations
Managers, directors
and senior officials
www.gov.uk/ukces
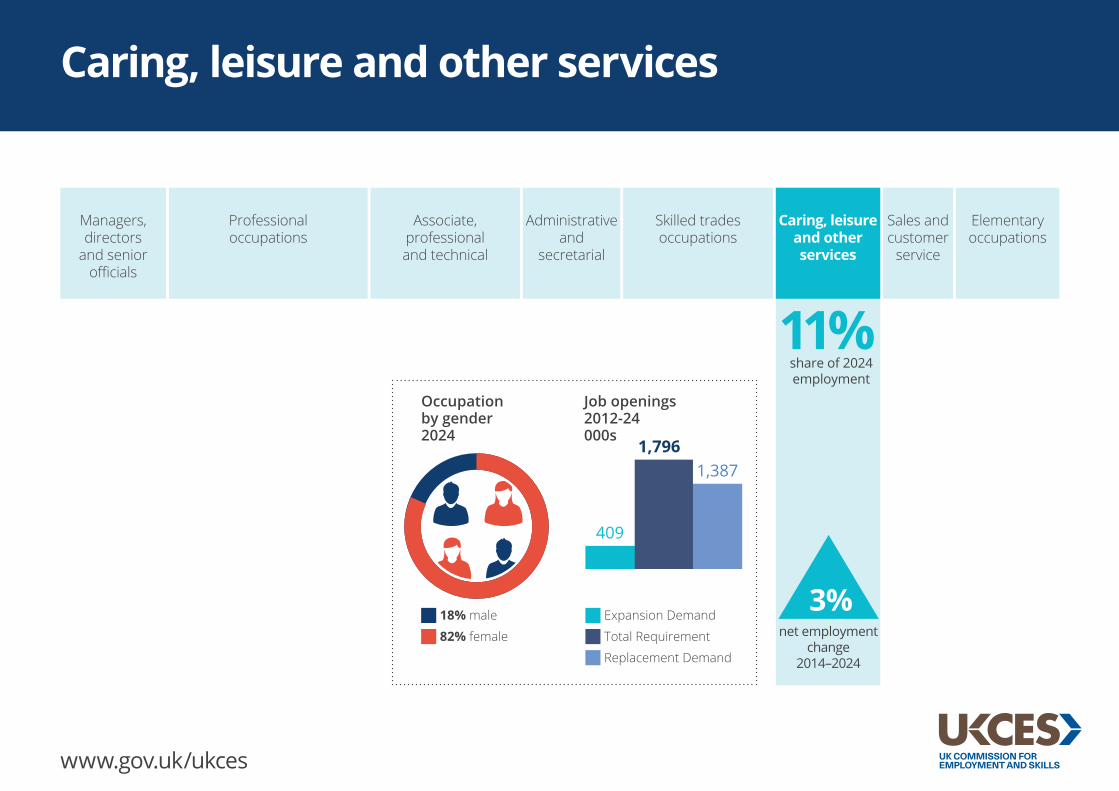
Caring, leisure and other services
11%share of 2024 employment
Job openings 2012-24000s
Expansion Demand
Total Requirement
Replacement Demand
Occupation by gender 2024
409
1,7961,387
net employment change
2014–2024
3% 18% male
82% female
Professional occupations
Associate, professional and technical
Administrative and
secretarial
Skilled trades occupations
Caring, leisure and other services
Sales and customer
service
Elementary occupations
Managers, directors
and senior officials

www.gov.uk/ukces
Sales and customer service
7%share of
2024 employmentJob openings
2012-24000s
Expansion Demand
Total Requirement
Replacement Demand
Occupation by gender 2024
3
950 947
0%
net employment
change 2014–2024
38% male
62% female
Professional occupations
Associate, professional and technical
Administrative and
secretarial
Skilled trades occupations
Caring, leisure and other services
Sales and customer
service
Elementary occupations
Managers, directors
and senior officials

www.gov.uk/ukces
Elementary occupations
11%share of 2024 employment
Job openings 2012-24000s
Expansion Demand
Total Requirement
Replacement Demand
Occupation by gender 2024
119
1,574 1,454
net employment change
2014–2024
3% 57% male
43% female
Professional occupations
Associate, professional and technical
Administrative and
secretarial
Skilled trades occupations
Caring, leisure and other services
Sales and customer
service
Elementary occupations
Managers, directors
and senior officials

www.gov.uk/ukces
Qualifications
Changing profile of employment by qualification level
2024 % share
Level 2 GCSE
(grades A*-C)NVQ level 2
2014 6,607,000
2024 6,134,000
Levels 4-6 Certificate of
higher education (L4)
Foundation degree (L5)Bachelor’s degree (L6)
2014 10,527,000
Levels 7-8 Master’s
degree (L7)Doctorate (L8)
2014 3,107,000
2024 4,030,000
Level 3 AS and A levelBTEC National
2014 6,633,000
2024 6,243,000
No qualifications and Level 1
11%
Level 218%
Levels 4-643%
Levels 7-812%
Level 318%
2014 2024 level
Selected examples
of qualifications
2014-2024 % change
-41%
-7% -6%
42%30%
2 The Regulated Qualifications Framework categorises qualifications by size and difficulty ranging from entry level to level 8 (Ofqual, 2015). The Scottish Credit and Qualifications Framework applies to Scotland.
By 2024, around
54% of people in employment are expected to be qualified at level 4 and above
No qualification and Level 1
GCSE (grades D-G)
BTEC award, certificate and diploma level 1
2014 6,293,000
2024 3,688,000

Conclusions: Expected Sectoral Trends
Private services main engine of job growth, contributing more than 90 per cent of net additional jobs between 2014 and 2024.
Business and other services activities such as professional services and Information technology expected to see the strongest rates of job growth.
Manufacturing to see a continued decline in jobs, but coupled with output and productivity growth, implying that jobs in the sector will become more skilled.
The construction sector is forecast to rebound strongly to become the strongest performing of the six broad sectors in terms of both output and employment.
Health and social care expected to see strong growth but prospects for education and public administration muted.
www.gov.uk/ukces

Conclusions: Expected Occupational Trends
Continuing polarisation of employment but with a strong bias towards higher skilled occupations.
Growth of nearly 2m jobs for higher skilled occupations.
Caring, leisure and other service roles to contribute over 400,000 additional jobs.
Administrative and secretarial occupations to see largest decline with 390,000 fewer jobs.
Process, plant and machine operatives (-130,000) and skilled trades occupations (-100,000) are also projected to see job losses.
“Winners” and others “losers” not the whole story, replacement demands will mean job openings (and career opportunities) across all broad occupational areas, including those projected to see net decline.
www.gov.uk/ukces

Conclusions: Qualifications
Continued shift towards more people holding more high level qualifications – 54 per cent of jobs held by tertiary educated by 2024.
Average qualification level to rise within all occupations - increasing skill requirements or “qualifications inflation” ?
www.gov.uk/ukces

Also available
Working Futures 2014-2024 full length evidence and technical reports.
Annexes containing: Comparisons with previous projections. Trends in employment and output by nation of the UK and regions of England. Methodological details relating to the spatial analysis.
Excel workbooks containing analysis for the UK, nations and English regions.
www.gov.uk/ukces
For further details and to access the previous Working Futures reports and data visit: www.gov.uk/government/collections/the-future-of-jobs-and-skills

For more information
www.gov.uk/government/collections/the-future-of-jobs-and-skills
@ukces