Embed Size (px)
Citation preview

Vol.:(0123456789)1 3
International Archives of Occupational and Environmental Health (2021) 94:1823–1837 https://doi.org/10.1007/s00420-021-01692-0
ORIGINAL ARTICLE
Working from home, quality of life, and perceived productivity during the first 50‑day COVID‑19 mitigation measures in Austria: a cross‑sectional study
Jakob Weitzer1 · Kyriaki Papantoniou1 · Stefan Seidel2,3 · Gerhard Klösch2,3 · Guido Caniglia4 · Manfred Laubichler5,6,7 · Martin Bertau8 · Brenda M. Birmann9 · Carlo C. Jäger7,10,11 · Lukas Zenk12 · Gerald Steiner7,12 · Eva Schernhammer1,7,9,13
Received: 25 November 2020 / Accepted: 6 March 2021 / Published online: 20 April 2021 © The Author(s) 2021
AbstractObjectives To explore changes in quality of life and perceived productivity, focusing on the effects of working from home during the first COVID-19 50-day mitigation period in Austria.Methods We conducted an Austrian-representative online survey (N = 1010) of self-reported life- and work-related changes during the first COVID-19 50-day mitigation period (March 16 through May 1 2020) compared to the situation before. We used multinominal logistic regression models to identify correlates of improved/decreased quality of life in the entire sample, and of improved/decreased productivity in a subsample of the working population (N = 686). We also calculated age- and multivariable-adjusted ORs and 95% CIs of an improved/decreased quality of life and an improved/decreased productivity by work from home status.Results During the COVID-19 mitigation period, quality of life improved in 17.5%, but decreased in 20.7% of the general Austrian population; perceived productivity at work increased in 12.7%, but decreased in 30.2% of the working population. Working from home during the mitigation period was associated with an increased quality of life (vs. none, partially: OR 2.07, 95% CI 1.09–3.91; all the time: 3.69, 1.86–7.29). In contrast, perceived productivity seemed to decrease when people worked from home (vs. none, partially: 1.42, 0.86–2.35; all the time: 1.48, 0.85–2.58). Working from home and related benefits were not equally distributed among gender, age, and educational attainment.Conclusions A transition to more flexibility of workplace and working hours for employees could have important positive consequences for family and professional life, for stakeholders, for public health, and ultimately for the environment.
Keywords Telework · Work from home · Occupational health · Quality of life
* Eva Schernhammer [email protected]
1 Department of Epidemiology, Center for Public Health, Medical University of Vienna, Vienna, Austria
2 Department of Neurology, Medical University of Vienna, Vienna, Austria
3 Institute for Sleep-Wake-Research, Vienna, Austria4 Konrad Lorenz Institute for Evolution and Cognition
Research (KLI), Klosterneuburg, Austria5 School of Life Sciences, Arizona State University, Tempe,
AZ, USA6 Santa Fe Institute, Santa Fe, NM, USA7 Complexity Science Hub, Vienna, Austria
8 Institut Für Technische Chemie, TU Bergakademie Freiberg, Freiberg, Germany
9 Channing Division of Network Medicine, Department of Medicine, Brigham and Women’s Hospital and Harvard Medical School, Boston, MA, USA
10 Academy of Disaster Reduction and Emergency Management, School of Geography, Beijing Normal University, Beijing 100875, China
11 Global Climate Forum, 10178 Berlin, Germany12 Department for Knowledge and Communication
Management, Faculty of Business and Globalization, Danube University Krems, Krems, Austria
13 Department of Epidemiology, Harvard T.H. Chan School of Public Health, Boston, MA, USA

1824 International Archives of Occupational and Environmental Health (2021) 94:1823–1837
1 3
Introduction
Across the globe, confinement measures to curb the spread of COVID-19 contributed to unhealthy lifestyle behaviors (Ammar et al. 2020a, b; Deschasaux-Tanguy et al. 2020; Reyes-Olavarría et al. 2020) and negative health outcomes, including important increases in the prevalence of psy-chosocial and emotional disorders (Ammar.et al. 2020b). However, some positive consequences in the context of “One Health”, which includes all aspects of human, envi-ronmental, and animal health (Laubichler 2020), have also been documented, e.g., for the environment (Zambrano-Monserrate et al. 2020) and for certain health outcomes in some sections of society. Importantly, specific COVID-19 mitigation strategies differed across countries and differ-entially affected specific sections of societies. Thus, the overall implications of COVID-19 mitigation measures for public and environmental health remain uncertain.
A 50-day mitigation period in response to the first COVID-19 wave in Austria started on March 16, 2020 (Republik Österreich 2020a) with restrictions lifted on May 1, 2020 (Republik Österreich 2020b). The policy included a ban on entering public places with only five exceptions: errands to cover necessary basic needs, pro-fessional activity (i.e., by essential workers such as health care workers), care and assistance for those in need of support, exercise outdoors alone or with people living in the same household, and averting danger to life, limb or property (Republik Österreich 2020a). Schools and kin-dergardens were closed (Kurier 2020), and day care was provided only for essential workers, e.g., health care work-ers, who could not allocate other resources for childcare.
In Austria, the prevalence of mental health problems increased during the mitigation period, with younger age, female gender, unemployment and low income as the driving risk factors (Pieh et al. 2020). In addition, a decrease of in-person psychotherapy was not compensated by increases in remote psychotherapy (Probst et al. 2020). In other countries, a few positive outcomes of COVID-19 mitigation measures have been reported, for example, eating more healthily than before (Deschasaux-Tanguy et al. 2020; Reyes-Olavarría et al. 2020). Before the emer-gence of the COVID-19 pandemic, studies mainly reported negative effects of quarantine measures on mental health, suggesting potentially long-lasting consequences (Brooks et al. 2020). However, COVID-19 measures came with a novelty for a large part of the population: work from home.
Evidence before pandemic times suggests that work from home can improve life and work in several ways. People who chose to work from home reported to enjoy greater flexibility in relation to work, leisure activities, and family (Laegran 2008). More control and choice in work
is expected to improve wellbeing (Joyce et al. 2010), and working from home has been linked to higher job satisfac-tion (Troup and Rose 2012). Finally, Eurofound concluded that telework has mainly positive effects on individual per-formance (Eurofound 2017), although working from home entails problems too, such as unclear boundaries between work and private life (Palumbo 2020; Palumbo et al. 2020; Vittersø et al. 2003) and lack of interpersonal relationship of colleagues (Webster and Wong 2008).
In early times of the pandemic, the transition to working from home was associated with a decrease in physical and mental health in a North American sample although reported associations might be the consequence of overall mitigation measures (Xiao et al. 2020). In a Japanese sample, working from home was associated with less depressive symptoms among men who worked long hours and among women in general (Sato et al. 2020), while a study among software engineers indicated a neutral effect of working from home on their well-being and productivity (Russo et al. 2020). In Austria, approximately 25% of the working population worked from home during the first mitigation period, and 72% of those stated that they preferred working from home once the pandemic ends (TQS Research & Consulting 2020). Furthermore, a survey among 526 Austrian companies revealed that 54% plan to maintain post-pandemic work-from-home options for some employees (Land Niederöster-reich 2020). In sum, it can be expected that working from home comes with positive and negative side effects even during pandemic times, and the new high in people working from home warrants to further explore how working from home might affect work and life.
Therefore, the objective of this study was to explore changes in quality of life and perceived productivity, with a specific focus on the effects of working from home during the first COVID-19 50-day mitigation period in Austria.
Methods
Study design and setting
Between June 3 and June 23, 2020, we conducted an online survey assessing changes in lifestyle and work-related char-acteristics with specific reference to the time period during the COVID-19 mitigation measures in Austria (March 16 to May 1, 2020) among 1010 Austrians randomly selected from an Online-Panel quota sampled to represent the age (18–65 years), sex and county distribution of Austria’s general population. To assess changes in lifestyle, quality of life and perceived productivity, participants rated on a 5-point Likert scale ranging from “decreased importantly” to “increased importantly” whether aforementioned vari-ables had changed during the mitigation period compared

1825International Archives of Occupational and Environmental Health (2021) 94:1823–1837
1 3
to before the pandemic. The survey, which included 81 questions and took approximately 30 minutes to complete, was implemented by Interrogare (www. inter rogare. de), a health care research institute based in Germany. Participa-tion was voluntary and anonymous, and informed consent was implied through participation.
Variables
In addition to demographic and lifestyle variables, par-ticipants indicated on a Likert scale [decreased impor-tantly, decreased, no change, improved, improved impor-tantly] if their quality of life and, among those in the work force, perceived productivity at work, had changed during the COVID-19 mitigation period compared to the time before the mitigation period. Participants reported if they were working from home during the mitigation period [not working from home, working partially from home, working from home all the time]. The covariates, which included age [< 30, 30–39, 40–49, 50–59, ≥ 60 years], gen-der [female, male], educational attainment [high school or less, university entry exam, university degree], citizenship [Austrian, other], race [Caucasian/White, other], region of residence [West, South, East], residential area [urban, rural with < 50,000 inhabitants, rural with at least 50,000 inhabit-ants], marital status [single/married/in partnership, divorced/widowed], size of household including oneself [single, 2, 3, 4 + persons], number of children [none, 1/2/3 +], hav-ing to take care of children younger than 6 years at home [yes, no, none that age], having to take care of children ages 6–16 at home [yes, no, none that age], current work status [employed (including self-employed) full-time, employed (including self-employed) part-time, retired, unemployed, student or in training], financial strain during mitigation period [none, some, high, very high], dispositional optimism assessed using the validated Life Orientation Test‐Revised (LOT‐R) (Scheier et al. 1994) [low, high], job loss [yes, no] and short-time work [no, yes, not employed before the mitigation period], were self-reported. Short-time work, a policy to help retain jobs, was implemented in Austria at the beginning of the COVID-19 pandemic and entailed having companies reduce employee work hours while continuing to pay almost full salary, with the government subsidizing a major portion of the salaries.
Statistical methods
We used multinominal logistic regression models to calcu-late age- and multivariable-adjusted odds ratios (ORs) and 95% confidence intervals (95% CI) of improved/decreased quality of life in the entire sample, and of improved/decreased productivity in a subsample comprising only those who had been employed before the mitigation period
(working population: N = 686). In the latter subset, we also calculated age- and multivariable-adjusted ORs and 95% CIs of an improved/decreased quality of life and an improved/decreased productivity by work from home status (not, part of the time, all the time). Our multivariable models consid-ered the covariables listed above as confounders. A two-sided significance level (α = 0.05) and STATA (version 14.1, 2015, StataCorp LP) were used for all analyses.
Results
Sample characteristics
Of 1010 respondents to the survey, three with missing information on gender were excluded, leaving 1007 partici-pants for our analyses. Fifty-five percent of survey partici-pants were women, and approximately 91% were Austrian citizens. Of all participants, 65.3% (men, 68.8%; women, 62.0%) were part- or full-time employed (including those self-employed) and 4.6% had lost their job during the mitiga-tion period (men, 4.8%; women, 4.3%). Men were older and more frequently reported having received only basic educa-tion. 31.8% of the whole sample had not been employed (or self-employed) before the mitigation period. During the mitigation period, 17.7% of the sample were not working from home, 29.5% were working from home part of the time and 21.0% all the time (Table 1). In the working sam-ple, those working from home were more frequently men (75.1% vs. 72.9% working from home), younger (< 30 years, 82.6% working from home; 30–49 years, 78.1%; ≥ 50 years, 61.1%), and participants who had received higher education (high school or less, 57.7% working from home; University entering exam, 80.8%; University degree, 85%).
Prevalence of changes in quality of life and perceived productivity
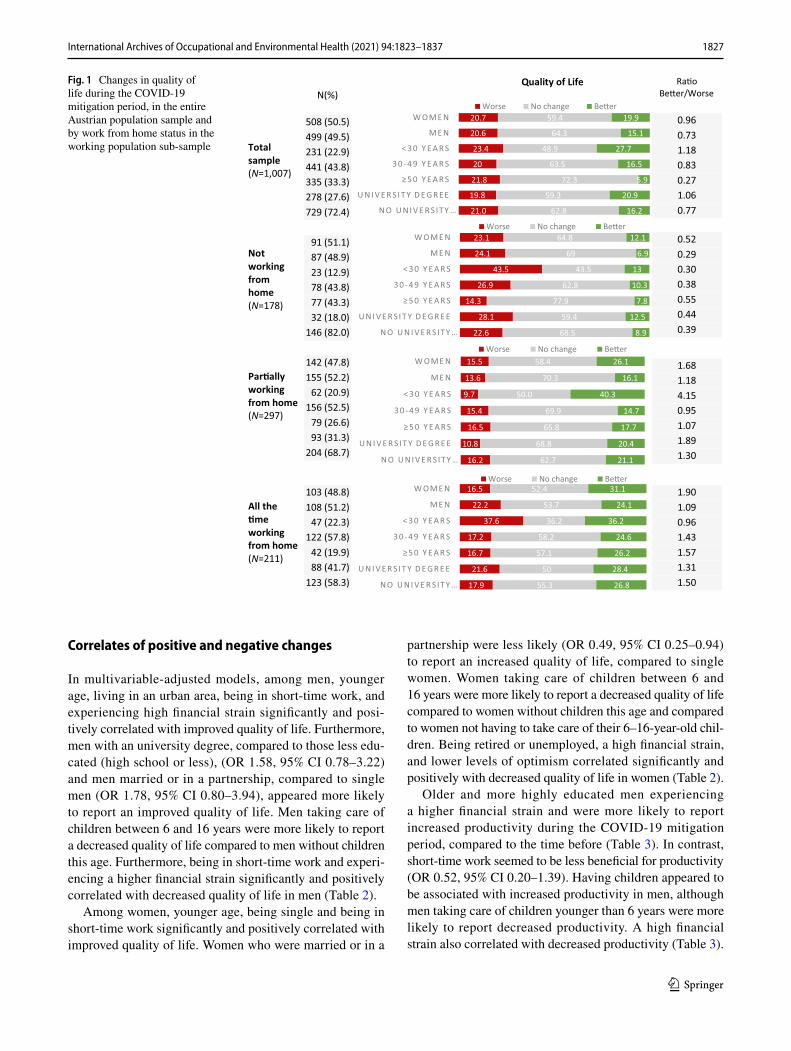
During the COVID-19 mitigation period in Austria, quality of life improved for 17.5% (men, 15.1%; women, 19.9%) and decreased for 20.7% (men, 20.6%; women, 20.7%) of the overall Austrian population sample (Fig. 1). Younger and highly educated participants reported an improved quality of life more often than older or less educated participants. In addition, participants reported improved quality of life more frequently if they worked from home than if they did not work from home—a trend which was seen irrespective of age group and level of educational attainment (Fig. 1).
Productivity at work improved in 12.7% (men, 13.4%; women, 11.9%) and decreased in 30.2% (men, 27.4%; women, 33.0%) of the working population sample. Younger individuals reported decreased work productiv-ity more frequently than older persons, and participants

1826 International Archives of Occupational and Environmental Health (2021) 94:1823–1837
1 3
with a higher educational status reported improved pro-ductivity more frequently than those with less educa-tion (Supplementary Fig. 1). Men, but not women, who worked from home during the mitigation period reported an increased productivity more frequently than those who did not work from home (none, 8.1%; part of the time, 11.6%; all the time, 20.4%). Increased productivity was also reported more frequently by highly educated partici-pants who worked from home than by those who did not (none, 3.1%; part of the time, 18.3%; all the time, 21.6%;
Supplementary Fig. 1). Participants reporting an improved quality of life more frequently reported an improved per-ceived productivity (19.7% vs. 12.7%) compared to those reporting a decreased quality of life.
Older participants, men, and persons not working from home were most likely to report no changes in quality of life or perceived productivity (Fig. 1 and supplementary Fig. 1).
Table 1 Characteristics of the study sample (N = 1007)
a Includes self-employed participants
Men (N = 499) Women (N = 508) Total (N = 1007)N (%) N (%) N (%)
Age, years < 30 98 (19.6) 133 (26.2) 231 (22.9) 30–39 84 (16.8) 108 (21.3) 192 (19.1) 40–49 133 (26.7) 116 (22.8) 249 (24.7) 50–59 120 (24.1) 114 (22.4) 234 (23.3) ≥ 60 64 (12.8) 37 (7.3) 101 (10.0)
Highest education High school or less 198 (39.7) 165 (32.5) 363 (36.1) Matura (University entry exam) 166 (33.3) 200 (39.4) 366 (36.3) University degree 135 (27.0) 143 (28.1) 278 (27.6)
Citizenship Austrian 459 (92.0) 455 (89.6) 914 (90.8) Other EU country 24 (4.8) 39 (7.7) 63 (6.2) Non-EU country 16 (3.2) 14 (2.7) 30 (3.0)
Region of residence Burgenland 18 (3.6) 19 (3.7) 37 (3.7) Carinthia 30 (6.0) 32 (6.3) 62 (6.2) Lower Austria 96 (19.3) 100 (19.7) 196 (19.5) Salzburg 25 (5.0) 23 (4.5) 48 (4.8) Styria 76 (15.2) 58 (11.4) 134 (13.3) Tyrol 36 (7.2) 45 (8.9) 81 (8.0) Upper Austria 73 (14.6) 74 (14.6) 147 (14.6) Vienna 124 (24.9) 139 (27.4) 263 (26.1) Vorarlberg 21 (4.2) 18 (3.5) 39 (3.8)
Current work status Employed full timea 305 (61.1) 229 (45.1) 534 (53.0) Employed part timea 38 (7.7) 86 (16.9) 124 (12.3) Retired 55 (11.0) 48 (9.4) 103 (10.2) Unemployed 46 (9.2) 44 (8.7) 90 (9.0) Student, in training, civil service 55 (11.0) 101 (19.9) 156 (15.5) Job loss during lockdown 24 (4.8) 22 (4.3) 46 (4.6)
Working from home during lockdown No 87 (17.4) 91 (17.9) 178 (17.7) Partially 155 (31.1) 142 (28.0) 297 (29.5) All the time 108 (21.6) 103 (20.2) 211 (21.0) Not employed before lockdown 149 (29.9) 172 (33.9) 321 (31.8)
1827International Archives of Occupational and Environmental Health (2021) 94:1823–1837
1 3
Correlates of positive and negative changes
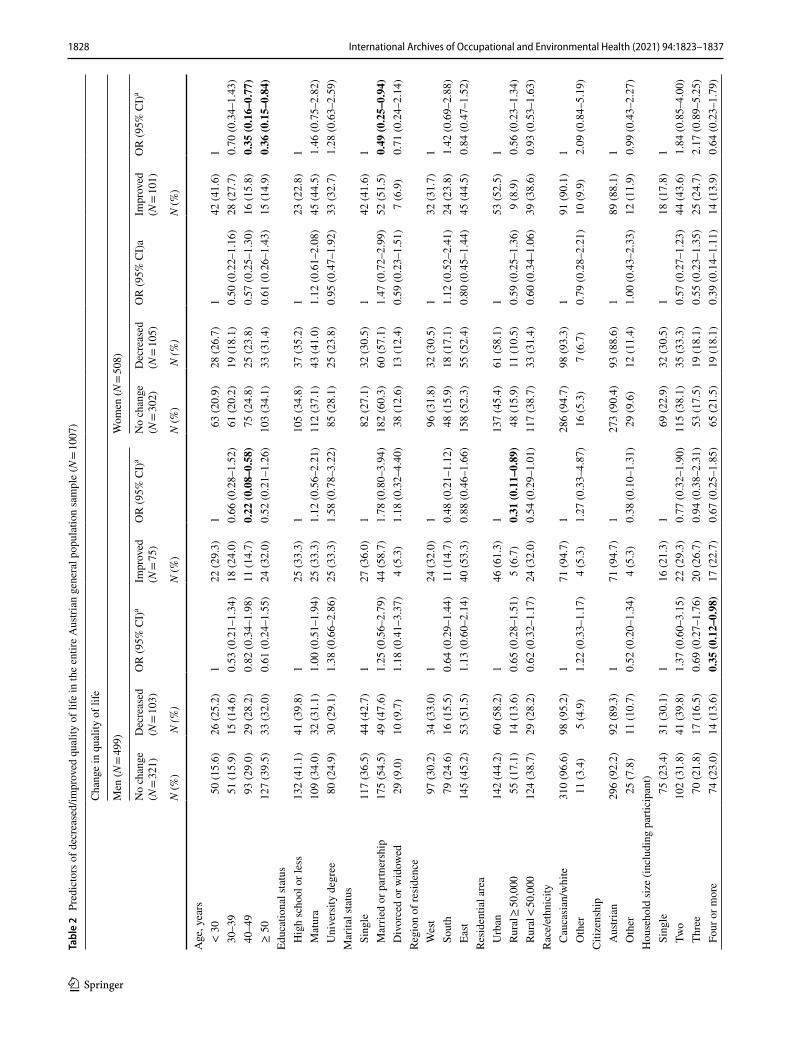
In multivariable-adjusted models, among men, younger age, living in an urban area, being in short-time work, and experiencing high financial strain significantly and posi-tively correlated with improved quality of life. Furthermore, men with an university degree, compared to those less edu-cated (high school or less), (OR 1.58, 95% CI 0.78–3.22) and men married or in a partnership, compared to single men (OR 1.78, 95% CI 0.80–3.94), appeared more likely to report an improved quality of life. Men taking care of children between 6 and 16 years were more likely to report a decreased quality of life compared to men without children this age. Furthermore, being in short-time work and experi-encing a higher financial strain significantly and positively correlated with decreased quality of life in men (Table 2).
Among women, younger age, being single and being in short-time work significantly and positively correlated with improved quality of life. Women who were married or in a
partnership were less likely (OR 0.49, 95% CI 0.25–0.94) to report an increased quality of life, compared to single women. Women taking care of children between 6 and 16 years were more likely to report a decreased quality of life compared to women without children this age and compared to women not having to take care of their 6–16-year-old chil-dren. Being retired or unemployed, a high financial strain, and lower levels of optimism correlated significantly and positively with decreased quality of life in women (Table 2).
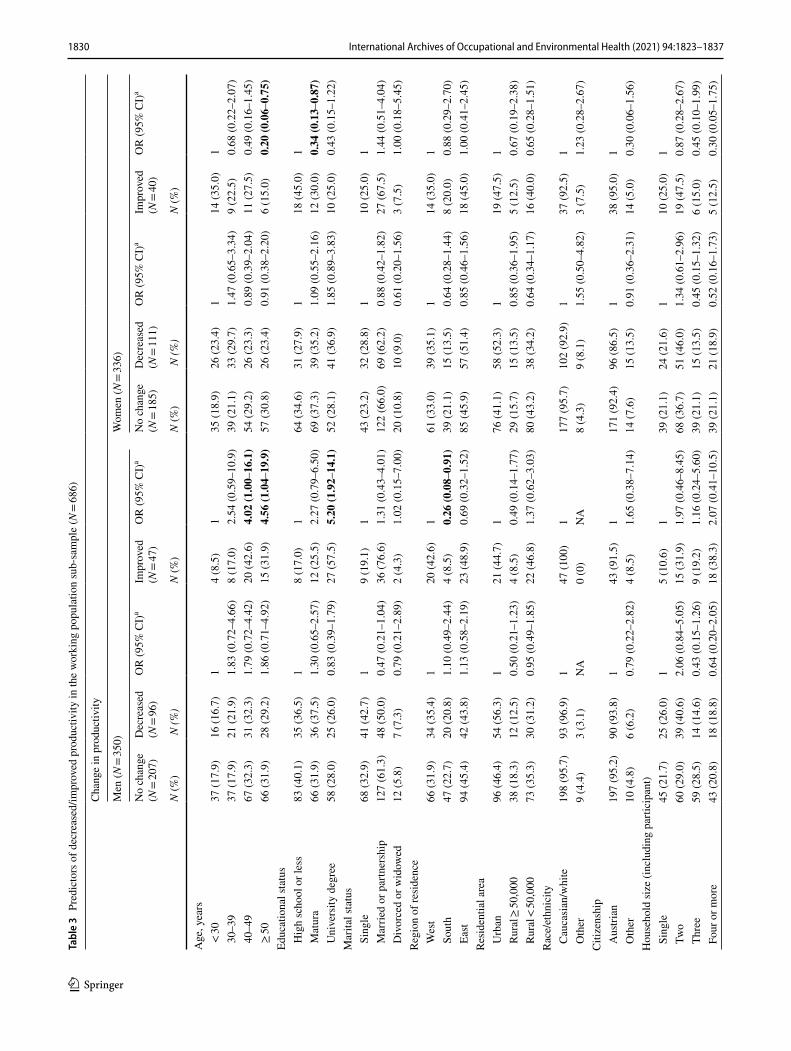
Older and more highly educated men experiencing a higher financial strain and were more likely to report increased productivity during the COVID-19 mitigation period, compared to the time before (Table 3). In contrast, short-time work seemed to be less beneficial for productivity (OR 0.52, 95% CI 0.20–1.39). Having children appeared to be associated with increased productivity in men, although men taking care of children younger than 6 years were more likely to report decreased productivity. A high financial strain also correlated with decreased productivity (Table 3).
Fig. 1 Changes in quality of life during the COVID-19 mitigation period, in the entire Austrian population sample and by work from home status in the working population sub-sample
N(%)
Quality of Life Ra�o Be�er/Worse
Total sample (N=1,007)
508 (50.5) 499 (49.5) 231 (22.9) 441 (43.8) 335 (33.3) 278 (27.6) 729 (72.4)
0.96 0.73 1.18 0.83 0.27 1.06 0.77
Not working from home (N=178)
91 (51.1) 87 (48.9) 23 (12.9) 78 (43.8) 77 (43.3) 32 (18.0)
146 (82.0)
0.52 0.29 0.30 0.38 0.55 0.44 0.39
Par�ally working from home (N=297)
142 (47.8) 155 (52.2)
62 (20.9) 156 (52.5)
79 (26.6) 93 (31.3)
204 (68.7)
1.68 1.18 4.15 0.95 1.07 1.89 1.30
All the �me working from home (N=211)
103 (48.8) 108 (51.2)
47 (22.3) 122 (57.8)
42 (19.9) 88 (41.7)
123 (58.3)
1.90 1.09 0.96 1.43 1.57 1.31 1.50
21.0
19.8
21.8
20
23.4
20.6
20.7
62.8
59.3
72.3
63.5
48.9
64.3
59.4
16.2
20.9
5.9
16.5
27.7
15.1
19.9
N O U N I V E R S ITY …
U N I V E R S I T Y D E G R EE
≥ 5 0 Y E A R S
3 0 - 4 9 Y E A R S
< 3 0 Y E A R S
M E N
W OM E NWorse No change Be�er
22.6
28.1
14.3
26.9
43.5
24.1
23.1
68.5
59.4
77.9
62.8
43.5
69
64.8
8.9
12.5
7.8
10.3
13
6.9
12.1
N O U N I V E R S ITY …
U N I V E R S I T Y D E G R E E
≥ 5 0 Y E A R S
3 0 - 4 9 Y E A R S
< 3 0 Y E A R S
M E N
W OM E NWorse No change Be�er
16.2
10.8
16.5
15.4
9.7
13.6
15.5
62.7
68.8
65.8
69.9
50.0
70.3
58.4
21.1
20.4
17.7
14.7
40.3
16.1
26.1
N O U N I V E R S ITY …
U N I V E R S I T Y D E G R E E
≥ 5 0 Y E A R S
3 0 - 4 9 Y E A R S
< 3 0 Y E A R S
M E N
W OM E NWorse No change Be�er
17.9
21.6
16.7
17.2
37.6
22.2
16.5
55.3
50
57.1
58.2
36.2
53.7
52.4
26.8
28.4
26.2
24.6
36.2
24.1
31.1
N O U N I V E R S ITY …
U N I V E R S I T Y D E G R E E
≥ 5 0 Y E A R S
3 0 - 4 9 Y E A R S
< 3 0 Y E A R S
M E N
W OM E NWorse No change Be�er
1828 International Archives of Occupational and Environmental Health (2021) 94:1823–1837
1 3
Tabl
e 2
Pre
dict
ors o
f dec
reas
ed/im
prov
ed q
ualit
y of
life
in th
e en
tire
Aus
trian
gen
eral
pop
ulat
ion
sam
ple
(N =
1007
)
Cha
nge
in q
ualit
y of
life
Men
(N =
499)
Wom
en (N
= 50
8)
No
chan
ge(N
= 32
1)D
ecre
ased
(N =
103)
OR
(95%
CI)
aIm
prov
ed(N
= 75
)O
R (9
5% C
I)a
No
chan
ge(N
= 30
2)D
ecre
ased
(N =
105)
OR
(95%
CI)
aIm
prov
ed(N
= 10
1)O
R (9
5% C
I)a
N (%
) N
(%)
N (%
)N
(%)
N (%
)N
(%)
Age
, yea
rs <
30
50 (1
5.6)
26 (2
5.2)
122
(29.
3)1
63 (2
0.9)
28 (2
6.7)
142
(41.
6)1
30–
3951
(15.
9)15
(14.
6)0.
53 (0
.21–
1.34
)18
(24.
0)0.
66 (0
.28–
1.52
)61
(20.
2)19
(18.
1)0.
50 (0
.22–
1.16
)28
(27.
7)0.
70 (0
.34–
1.43
) 4
0–49
93 (2
9.0)
29 (2
8.2)
0.82
(0.3
4–1.
98)
11 (1
4.7)
0.22
(0.0
8–0.
58)
75 (2
4.8)
25 (2
3.8)
0.57
(0.2
5–1.
30)
16 (1
5.8)
0.35
(0.1
6–0.
77)
≥ 5
012
7 (3
9.5)
33 (3
2.0)
0.61
(0.2
4–1.
55)
24 (3
2.0)
0.52
(0.2
1–1.
26)
103
(34.
1)33
(31.
4)0.
61 (0
.26–
1.43
)15
(14.
9)0.
36 (0
.15–
0.84
)Ed
ucat
iona
l sta
tus
Hig
h sc
hool
or l
ess
132
(41.
1)41
(39.
8)1
25 (3
3.3)
110
5 (3
4.8)
37 (3
5.2)
123
(22.
8)1
Mat
ura
109
(34.
0)32
(31.
1)1.
00 (0
.51–
1.94
)25
(33.
3)1.
12 (0
.56–
2.21
)11
2 (3
7.1)
43 (4
1.0)
1.12
(0.6
1–2.
08)
45 (4
4.5)
1.46
(0.7
5–2.
82)
Uni
vers
ity d
egre
e80
(24.
9)30
(29.
1)1.
38 (0
.66–
2.86
)25
(33.
3)1.
58 (0
.78–
3.22
)85
(28.
1)25
(23.
8)0.
95 (0
.47–
1.92
)33
(32.
7)1.
28 (0
.63–
2.59
)M
arita
l sta
tus
Sin
gle
117
(36.
5)44
(42.
7)1
27 (3
6.0)
182
(27.
1)32
(30.
5)1
42 (4
1.6)
1 M
arrie
d or
par
tner
ship
175
(54.
5)49
(47.
6)1.
25 (0
.56–
2.79
)44
(58.
7)1.
78 (0
.80–
3.94
)18
2 (6
0.3)
60 (5
7.1)
1.47
(0.7
2–2.
99)
52 (5
1.5)
0.49
(0.2
5–0.
94)
Div
orce
d or
wid
owed
29 (9
.0)
10 (9
.7)
1.18
(0.4
1–3.
37)
4 (5
.3)
1.18
(0.3
2–4.
40)
38 (1
2.6)
13 (1
2.4)
0.59
(0.2
3–1.
51)
7 (6
.9)
0.71
(0.2
4–2.
14)
Regi
on o
f res
iden
ce W
est
97 (3
0.2)
34 (3
3.0)
124
(32.
0)1
96 (3
1.8)
32 (3
0.5)
132
(31.
7)1
Sou
th79
(24.
6)16
(15.
5)0.
64 (0
.29–
1.44
)11
(14.
7)0.
48 (0
.21–
1.12
)48
(15.
9)18
(17.
1)1.
12 (0
.52–
2.41
)24
(23.
8)1.
42 (0
.69–
2.88
) E
ast
145
(45.
2)53
(51.
5)1.
13 (0
.60–
2.14
)40
(53.
3)0.
88 (0
.46–
1.66
)15
8 (5
2.3)
55 (5
2.4)
0.80
(0.4
5–1.
44)
45 (4
4.5)
0.84
(0.4
7–1.
52)
Resi
dent
ial a
rea
Urb
an14
2 (4
4.2)
60 (5
8.2)
146
(61.
3)1
137
(45.
4)61
(58.
1)1
53 (5
2.5)
1 R
ural
≥ 50
,000
55 (1
7.1)
14 (1
3.6)
0.65
(0.2
8–1.
51)
5 (6
.7)
0.31
(0.1
1–0.
89)
48 (1
5.9)
11 (1
0.5)
0.59
(0.2
5–1.
36)
9 (8
.9)
0.56
(0.2
3–1.
34)
Rur
al <
50,0
0012
4 (3
8.7)
29 (2
8.2)
0.62
(0.3
2–1.
17)
24 (3
2.0)
0.54
(0.2
9–1.
01)
117
(38.
7)33
(31.
4)0.
60 (0
.34–
1.06
)39
(38.
6)0.
93 (0
.53–
1.63
)R
ace/
ethn
icity
Cau
casi
an/w
hite
310
(96.
6)98
(95.
2)1
71 (9
4.7)
128
6 (9
4.7)
98 (9
3.3)
191
(90.
1)1
Oth
er11
(3.4
)5
(4.9
)1.
22 (0
.33–
1.17
)4
(5.3
)1.
27 (0
.33–
4.87
)16
(5.3
)7
(6.7
)0.
79 (0
.28–
2.21
)10
(9.9
)2.
09 (0
.84–
5.19
)C
itize
nshi
p A
ustri
an29
6 (9
2.2)
92 (8
9.3)
171
(94.
7)1
273
(90.
4)93
(88.
6)1
89 (8
8.1)
1 O
ther
25 (7
.8)
11 (1
0.7)
0.52
(0.2
0–1.
34)
4 (5
.3)
0.38
(0.1
0–1.
31)
29 (9
.6)
12 (1
1.4)
1.00
(0.4
3–2.
33)
12 (1
1.9)
0.99
(0.4
3–2.
27)
Hou
seho
ld si
ze (i
nclu
ding
par
ticip
ant)
Sin
gle
75 (2
3.4)
31 (3
0.1)
116
(21.
3)1
69 (2
2.9)
32 (3
0.5)
118
(17.
8)1
Tw
o10
2 (3
1.8)
41 (3
9.8)
1.37
(0.6
0–3.
15)
22 (2
9.3)
0.77
(0.3
2–1.
90)
115
(38.
1)35
(33.
3)0.
57 (0
.27–
1.23
)44
(43.
6)1.
84 (0
.85–
4.00
) T
hree
70 (2
1.8)
17 (1
6.5)
0.69
(0.2
7–1.
76)
20 (2
6.7)
0.94
(0.3
8–2.
31)
53 (1
7.5)
19 (1
8.1)
0.55
(0.2
3–1.
35)
25 (2
4.7)
2.17
(0.8
9–5.
25)
Fou
r or m
ore
74 (2
3.0)
14 (1
3.6)
0.35
(0.1
2–0.
98)
17 (2
2.7)
0.67
(0.2
5–1.
85)
65 (2
1.5)
19 (1
8.1)
0.39
(0.1
4–1.
11)
14 (1
3.9)
0.64
(0.2
3–1.
79)

1829International Archives of Occupational and Environmental Health (2021) 94:1823–1837
1 3
Tabl
e 2
(con
tinue
d)
Cha
nge
in q
ualit
y of
life
Men
(N =
499)
Wom
en (N
= 50
8)
No
chan
ge(N
= 32
1)D
ecre
ased
(N =
103)
OR
(95%
CI)
aIm
prov
ed(N
= 75
)O
R (9
5% C
I)a
No
chan
ge(N
= 30
2)D
ecre
ased
(N =
105)
OR
(95%
CI)
aIm
prov
ed(N
= 10
1)O
R (9
5% C
I)a
N (%
) N
(%)
N (%
)N
(%)
N (%
)N
(%)
Car
e ta
king
of a
chi
ld y
oung
er th
an 6
at h
ome
Yes
46 (1
4.3)
13 (1
2.6)
112
(16.
0)1
38 (1
2.6)
16 (1
5.2)
116
(15.
8)1
Nob
173
(53.
9)49
(47.
6)1.
05 (0
.37–
3.00
)39
(52.
0)1.
17 (0
.45–
3.06
)15
9 (5
2.6)
63 (6
0.0)
0.82
(0.3
5–1.
91)
54 (5
3.5)
0.79
(0.3
4–1.
81)
No
child
that
age
102
(31.
8)41
(39.
8)3.
28 (0
.97–
11.1
)24
(32.
0)2.
20 (0
.72–
6.68
)10
5 (3
4.8)
26 (2
4.8)
0.54
(0.2
9–1.
48)
31 (3
0.7)
0.65
(0.2
5–1.
71)
Car
e ta
king
of a
chi
ld b
etw
een
6 an
d 16
at h
ome
Yes
60 (1
8.7)
22 (2
1.4)
119
(25.
3)1
52 (1
7.2)
25 (2
3.8)
118
(17.
8)1
Nob
132
(41.
1)41
(39.
8)0.
61 (0
.22–
1.69
)30
(40.
0)0.
66 (0
.25–
1.69
)12
3 (4
0.7)
49 (4
6.7)
0.42
(0.1
7–0.
99)
42 (4
1.6)
0.67
(0.2
8–1.
58)
No
child
that
age
129
(40.
2)40
(38.
8)0.
23 (0
.07–
0.72
)26
(34.
7)0.
37 (0
.13–
1.08
)12
7 (4
2.1)
31 (2
9.5)
0.33
(0.1
3–0.
86)
41 (4
0.6)
0.69
(0.2
7–1.
75)
Wor
k st
atus
Em
ploy
ed fu
ll tim
ec20
3 (6
3.3)
50 (4
8.5)
152
(69.
3)1
135
(44.
7)36
(34.
3)1
58 (5
7.4)
1 E
mpl
oyed
par
t tim
ec20
(6.2
)14
(13.
6)2.
47 (0
.95–
6.46
)4
(5.3
)0.
65 (0
.19–
2.24
)53
(17.
6)17
(16.
2)1.
18 (0
.57–
2.46
)16
(15.
8)0.
86 (0
.42–
1.74
) R
etire
d44
(13.
7)8
(7.8
)1.
05 (0
.10–
11.4
)3
(4.0
)0.
20 (0
.01–
3.29
)31
(10.
3)16
(15.
2)9.
03 (2
.13–
38.2
)1
(1.0
)0.
28 (0
.03–
3.14
) U
nem
ploy
ed25
(7.8
)15
(14.
6)1.
17 (0
.11–
12.6
)6
(8.0
)0.
74 (0
.05–
10.7
)26
(8.6
)15
(14.
3)7.
00 (1
.60–
30.4
)3
(3.0
)0.
54 (0
.09–
3.40
) S
tude
nt/in
trai
ning
29 (9
.0)
16 (1
5.5)
2.05
(0.2
6–16
.2)
10 (1
3.4)
0.76
(0.0
7–7.
74)
57 (1
8.9)
21 (2
0.0)
3.37
(0.9
9–11
.5)
23 (2
2.8)
1.07
(0.3
1–3.
77)
Shor
t-tim
e w
ork
No
181
(56.
4)32
(31.
1)1
36 (4
8.0)
115
6 (5
1.7)
46 (4
3.8)
153
(52.
5)1
Yes
46 (1
4.3)
34 (3
3.0)
2.85
(1.4
0–5.
76)
21 (2
8.0)
2.17
(1.0
4–4.
51)
40 (1
3.2)
14 (1
3.3)
0.76
(0.3
5–1.
66)
27 (2
6.7)
2.06
(1.0
5–4.
03)
Not
em
ploy
ed p
re-p
ande
mic
94 (2
9.3)
37 (3
5.9)
1.88
(0.2
1–16
.5)
18 (2
4.0)
1.81
(0.1
6–20
.9)
106
(35.
1)45
(42.
9)0.
24 (0
.07–
0.83
)21
(20.
8)0.
49 (0
.13–
1.84
)Fi
nanc
ial s
train
dur
ing
lock
dow
n N
o fin
anci
al st
rain
179
(55.
8)13
(12.
6)1
31 (4
1.4)
115
0 (4
9.7)
25 (2
3.8)
148
(47.
5)1
Som
e95
(29.
6)26
(25.
3)3.
35 (1
.53–
7.47
)19
(25.
3)0.
95 (0
.46–
1.92
)10
5 (3
4.8)
36 (3
4.3)
2.34
(1.2
5–4.
37)
37 (3
6.6)
0.83
(0.4
7–1.
49)
Hig
h33
(10.
3)47
(45.
6)16
.1 (7
.20–
36.0
)22
(29.
3)2.
99 (1
.41–
6.35
)36
(11.
9)33
(31.
4)6.
36 (3
.12–
12.9
)13
(12.
9)1.
10 (0
.50–
2.43
) V
ery
high
14 (4
.3)
17 (1
6.5)
14.6
(5.0
8–41
.8)
3 (4
.0)
1.07
(0.2
7–4.
45)
11 (3
.6)
11 (1
0.5)
7.44
(2.6
5–20
.9)
3 (3
.0)
0.94
(0.2
2–3.
97)
Opt
imis
m L
ow13
1 (4
0.8)
62 (6
0.2)
129
(38.
7)1
132
(42.
7)65
(61.
9)1
45 (4
4.6)
1 H
igh
190
(59.
2)41
(39.
8)0.
66 (0
.38–
1.17
)46
(61.
3)1.
32 (0
.73–
2.38
)17
0 (5
6.3)
40 (3
8.1)
0.55
(0.3
3–0.
94)
56 (5
5.4)
1.15
(0.6
8–1.
95)
Odd
s rat
ios i
n bo
ld a
re st
atist
ical
ly si
gnifi
cant
OR
odds
ratio
, CI c
onfid
ence
inte
rval
,a A
ll od
ds ra
tios a
re m
utua
lly a
djus
ted
for a
ll va
riabl
es in
the
tabl
e; th
e re
fere
nce
grou
p ar
e th
ose
with
no
chan
ge in
qua
lity
of li
feb So
meo
ne e
lse
was
taki
ng c
are
eith
er a
t hom
e or
som
ewhe
re e
lse
c Incl
udes
the
self-
empl
oyed
par
ticip
ants
1830 International Archives of Occupational and Environmental Health (2021) 94:1823–1837
1 3
Tabl
e 3
Pre
dict
ors o
f dec
reas
ed/im
prov
ed p
rodu
ctiv
ity in
the
wor
king
pop
ulat
ion
sub-
sam
ple
(N =
686)
Cha
nge
in p
rodu
ctiv
ity
Men
(N =
350)
Wom
en (N
= 33
6)
No
chan
ge(N
= 20
7)D
ecre
ased
(N =
96)
OR
(95%
CI)
aIm
prov
ed(N
= 47
)O
R (9
5% C
I)a
No
chan
ge(N
= 18
5)D
ecre
ased
(N =
111)
OR
(95%
CI)
aIm
prov
ed(N
= 40
)O
R (9
5% C
I)a
N (%
) N
(%)
N (%
)N
(%)
N (%
)N
(%)
Age
, yea
rs <
3037
(17.
9)16
(16.
7)1
4 (8
.5)
135
(18.
9)26
(23.
4)1
14 (3
5.0)
1 3
0–39
37 (1
7.9)
21 (2
1.9)
1.83
(0.7
2–4.
66)
8 (1
7.0)
2.54
(0.5
9–10
.9)
39 (2
1.1)
33 (2
9.7)
1.47
(0.6
5–3.
34)
9 (2
2.5)
0.68
(0.2
2–2.
07)
40–
4967
(32.
3)31
(32.
3)1.
79 (0
.72–
4.42
)20
(42.
6)4.
02 (1
.00–
16.1
)54
(29.
2)26
(23.
3)0.
89 (0
.39–
2.04
)11
(27.
5)0.
49 (0
.16–
1.45
) ≥
5066
(31.
9)28
(29.
2)1.
86 (0
.71–
4.92
)15
(31.
9)4.
56 (1
.04–
19.9
)57
(30.
8)26
(23.
4)0.
91 (0
.38–
2.20
)6
(15.
0)0.
20 (0
.06–
0.75
)Ed
ucat
iona
l sta
tus
Hig
h sc
hool
or l
ess
83 (4
0.1)
35 (3
6.5)
18
(17.
0)1
64 (3
4.6)
31 (2
7.9)
118
(45.
0)1
Mat
ura
66 (3
1.9)
36 (3
7.5)
1.30
(0.6
5–2.
57)
12 (2
5.5)
2.27
(0.7
9–6.
50)
69 (3
7.3)
39 (3
5.2)
1.09
(0.5
5–2.
16)
12 (3
0.0)
0.34
(0.1
3–0.
87)
Uni
vers
ity d
egre
e58
(28.
0)25
(26.
0)0.
83 (0
.39–
1.79
)27
(57.
5)5.
20 (1
.92–
14.1
)52
(28.
1)41
(36.
9)1.
85 (0
.89–
3.83
)10
(25.
0)0.
43 (0
.15–
1.22
)M
arita
l sta
tus
Sin
gle
68 (3
2.9)
41 (4
2.7)
19
(19.
1)1
43 (2
3.2)
32 (2
8.8)
110
(25.
0)1
Mar
ried
or p
artn
ersh
ip12
7 (6
1.3)
48 (5
0.0)
0.47
(0.2
1–1.
04)
36 (7
6.6)
1.31
(0.4
3–4.
01)
122
(66.
0)69
(62.
2)0.
88 (0
.42–
1.82
)27
(67.
5)1.
44 (0
.51–
4.04
) D
ivor
ced
or w
idow
ed12
(5.8
)7
(7.3
)0.
79 (0
.21–
2.89
)2
(4.3
)1.
02 (0
.15–
7.00
)20
(10.
8)10
(9.0
)0.
61 (0
.20–
1.56
)3
(7.5
)1.
00 (0
.18–
5.45
)Re
gion
of r
esid
ence
Wes
t66
(31.
9)34
(35.
4)1
20 (4
2.6)
161
(33.
0)39
(35.
1)1
14 (3
5.0)
1 S
outh
47 (2
2.7)
20 (2
0.8)
1.10
(0.4
9–2.
44)
4 (8
.5)
0.26
(0.0
8–0.
91)
39 (2
1.1)
15 (1
3.5)
0.64
(0.2
8–1.
44)
8 (2
0.0)
0.88
(0.2
9–2.
70)
Eas
t94
(45.
4)42
(43.
8)1.
13 (0
.58–
2.19
)23
(48.
9)0.
69 (0
.32–
1.52
)85
(45.
9)57
(51.
4)0.
85 (0
.46–
1.56
)18
(45.
0)1.
00 (0
.41–
2.45
)Re
side
ntia
l are
a U
rban
96 (4
6.4)
54 (5
6.3)
121
(44.
7)1
76 (4
1.1)
58 (5
2.3)
119
(47.
5)1
Rur
al ≥
50,0
0038
(18.
3)12
(12.
5)0.
50 (0
.21–
1.23
)4
(8.5
)0.
49 (0
.14–
1.77
)29
(15.
7)15
(13.
5)0.
85 (0
.36–
1.95
)5
(12.
5)0.
67 (0
.19–
2.38
) R
ural
< 50
,000
73 (3
5.3)
30 (3
1.2)
0.95
(0.4
9–1.
85)
22 (4
6.8)
1.37
(0.6
2–3.
03)
80 (4
3.2)
38 (3
4.2)
0.64
(0.3
4–1.
17)
16 (4
0.0)
0.65
(0.2
8–1.
51)
Rac
e/et
hnic
ity C
auca
sian
/whi
te19
8 (9
5.7)
93 (9
6.9)
147
(100
)1
177
(95.
7)10
2 (9
2.9)
137
(92.
5)1
Oth
er9
(4.4
)3
(3.1
)N
A0
(0)
NA
8 (4
.3)
9 (8
.1)
1.55
(0.5
0–4.
82)
3 (7
.5)
1.23
(0.2
8–2.
67)
Citi
zens
hip
Aus
trian
197
(95.
2)90
(93.
8)1
43 (9
1.5)
117
1 (9
2.4)
96 (8
6.5)
138
(95.
0)1
Oth
er10
(4.8
)6
(6.2
)0.
79 (0
.22–
2.82
)4
(8.5
)1.
65 (0
.38–
7.14
)14
(7.6
)15
(13.
5)0.
91 (0
.36–
2.31
)14
(5.0
)0.
30 (0
.06–
1.56
)H
ouse
hold
size
(inc
ludi
ng p
artic
ipan
t) S
ingl
e45
(21.
7)25
(26.
0)1
5 (1
0.6)
139
(21.
1)24
(21.
6)1
10 (2
5.0)
1 T
wo
60 (2
9.0)
39 (4
0.6)
2.06
(0.8
4–5.
05)
15 (3
1.9)
1.97
(0.4
6–8.
45)
68 (3
6.7)
51 (4
6.0)
1.34
(0.6
1–2.
96)
19 (4
7.5)
0.87
(0.2
8–2.
67)
Thr
ee59
(28.
5)14
(14.
6)0.
43 (0
.15–
1.26
)9
(19.
2)1.
16 (0
.24–
5.60
)39
(21.
1)15
(13.
5)0.
45 (0
.15–
1.32
)6
(15.
0)0.
45 (0
.10–
1.99
) F
our o
r mor
e43
(20.
8)18
(18.
8)0.
64 (0
.20–
2.05
)18
(38.
3)2.
07 (0
.41–
10.5
)39
(21.
1)21
(18.
9)0.
52 (0
.16–
1.73
)5
(12.
5)0.
30 (0
.05–
1.75
)

1831International Archives of Occupational and Environmental Health (2021) 94:1823–1837
1 3
Tabl
e 3
(con
tinue
d)
Cha
nge
in p
rodu
ctiv
ity
Men
(N =
350)
Wom
en (N
= 33
6)
No
chan
ge(N
= 20
7)D
ecre
ased
(N =
96)
OR
(95%
CI)
aIm
prov
ed(N
= 47
)O
R (9
5% C
I)a
No
chan
ge(N
= 18
5)D
ecre
ased
(N =
111)
OR
(95%
CI)
aIm
prov
ed(N
= 40
)O
R (9
5% C
I)a
N (%
) N
(%)
N (%
)N
(%)
N (%
)N
(%)
Car
e ta
king
of a
chi
ld y
oung
er th
an 6
at h
ome
Yes
26 (1
2.6)
24 (2
5.0)
111
(23.
4)1
30 (1
6.2)
15 (1
3.5)
15
(12.
5)1
Nob
113
(54.
6)41
(42.
7)0.
19 (0
.07–
0.52
)26
(55.
3)0.
43 (0
.14–
1.33
)10
3 (5
5.7)
64 (5
7.7)
1.73
(0.7
1–4.
20)
22 (5
5.0)
1.22
(0.3
2–4.
63)
No
child
that
age
68 (3
2.8)
31 (3
2.3)
0.19
(0.0
6–0.
63)
10 (2
1.3)
0.37
(0.1
0–1.
40)
52 (2
8.1)
32 (2
8.8)
1.14
(0.4
0–3.
29)
13 (3
2.5)
0.86
(0.1
9–3.
99)
Car
e ta
king
of a
chi
ld b
etw
een
6 an
d16
at h
ome
Yes
45 (2
1.7)
21 (2
1.9)
116
(34.
1)1
35 (1
8.9)
27 (2
4.3)
17
(17.
5)1
Nob
84 (4
0.6)
38 (3
9.6)
1.04
(0.3
5–3.
07)
19 (4
0.4)
0.43
(0.1
4–1.
33)
84 (4
5.4)
44 (3
9.7)
0.30
(0.1
1–0.
80)
17 (4
2.5)
0.31
(0.0
7–1.
40)
No
child
that
age
78 (3
7.7)
37 (3
8.5)
0.92
(0.2
8–3.
00)
12 (2
5.5)
0.37
(0.1
0–1.
40)
66 (3
5.7)
40 (2
6.0)
0.44
(0.1
6–1.
20)
16 (4
0.0)
0.54
(0.1
2–2.
52)
Wor
k st
atus
Em
ploy
ed fu
ll tim
ec18
5 (8
9.4)
77 (8
0.2)
143
(91.
4)1
118
(63.
8)75
(67.
6)1
36 (9
0.0)
1 E
mpl
oyed
par
t tim
ec19
(9.2
)17
(17.
7)1.
85 (0
.77–
4.47
)2
(4.3
)0.
63 (0
.12–
3.43
)56
(30.
2)29
(26.
1)0.
73 (0
.39–
1.37
)1
(2.5
)0.
04 (0
.07–
0.35
) R
etire
d0(
0)0
(0)
0 (0
)2
(1.1
)1
(0.9
)0
(0)
Une
mpl
oyed
NA
NA
2.91
(0.3
2–26
.3)d
NA
3.38
(0.3
4–33
.8)d
NA
NA
0.83
(0.2
7–2.
58)d
NA
0.94
(0.2
1–4.
26)d
Stu
dent
/ in
train
ing
3 (1
.4)
2 (2
.1)
2 (4
.3)
9 (4
.9)
6 (5
.4)
3 (7
.5)
Shor
t-tim
e w
ork
No
159
(76.
8)52
(54.
2)1
38 (8
0.8)
115
2 (8
2.2)
72 (6
4.9)
131
(77.
5)1
Yes
48 (2
3.2)
44 (4
5.8)
1.52
(0.8
1–2.
85)
9 (1
9.2)
0.52
(0.2
0–1.
39)
33 (1
7.8)
39 (3
5.1)
2.37
(1.2
5–4.
49)
9 (2
2.5)
1.02
(0.3
6–2.
86)
Not
em
ploy
ed p
re-p
ande
mic
NA
NA
NA
NA
NA
NA
NA
NA
NA
NA
Fina
ncia
l stra
in d
urin
g lo
ckdo
wn
No
finan
cial
stra
in12
0 (5
8.0)
16 (1
6.7)
117
(36.
2)1
101
(54.
6)32
(28.
8)1
19 (4
7.5)
1 S
ome
47 (2
2.7)
42 (4
3.7)
6.92
(3.2
4–14
.8)
18 (3
8.3)
3.45
(1.4
2–8.
36)
62 (3
3.5)
48 (4
3.3)
2.13
(1.1
4–3.
99)
12 (3
0.0)
1.34
(0.5
1–3.
52)
Hig
h33
(15.
9)29
(30.
2)6.
00 (2
.68–
13.4
)8
(17.
0)3.
37 (1
.13–
10.1
)19
(10.
3)23
(20.
7)3.
29 (1
.46–
7.44
)7
(17.
5)1.
88 (0
.57–
6.21
) V
ery
high
7 (3
.4)
9 (9
.4)
9.71
(2.7
2–34
.5)
4 (8
.5)
7.49
(1.4
7–38
.2)
3 (1
.6)
8 (7
.2)
9.60
(2.0
5–45
.0)
2 (5
.0)
10.9
(1.2
4–96
.5)
Opt
imis
m L
ow86
(41.
5)45
(46.
9)1
14 (2
9.8)
173
(39.
5)54
(48.
7)1
14 (3
5.0)
1 H
igh
121
(58.
5)51
(53.
1)1.
02 (0
.56–
1.84
)33
(70.
2)1.
34 (0
.59–
3.06
)11
2 (6
0.5)
57 (5
1.4)
0.80
(0.4
5–1.
41)
26 (6
5.0)
2.00
(0.8
7–4.
60)
Odd
s rat
ios i
n bo
ld a
re st
atist
ical
ly si
gnifi
cant
OR
odds
ratio
, CI c
onfid
ence
inte
rval
, NA
not a
pplic
able
a All
odds
ratio
s are
mut
ually
adj
uste
d fo
r all
pred
icto
rs in
the
tabl
eb So
meo
ne e
lse
was
taki
ng c
are
eith
er a
t hom
e or
som
ewhe
re e
lse
c Incl
udes
the
self-
empl
oyed
par
ticip
ants
d Odd
s rat
io fo
r par
ticip
ants
who
wer
e re
tired
, une
mpl
oyed
or s
tude
nts/
in tr
aini
ng. G
roup
s wer
e co
llaps
ed, s
ince
num
bers
wer
e ve
ry sm
all

1832 International Archives of Occupational and Environmental Health (2021) 94:1823–1837
1 3
Older women were less likely to report increased productivity at work (OR 0.20, 95% CI 0.06–0.75) com-pared to younger women, as were women with a univer-sity degree compared to those less educated (high school or less) and women employed part-time compared to full-time employees. Women in short-time work were more likely to report decreased productivity compared to women not in short-time work, and a high financial strain and taking care of children between 6 and 16 years correlated significantly and positively with decrease qual-ity of life (Table 3).
Association of work from home with changes in quality of life and perceived productivity
Overall, participants who worked from home all the time during the COVID-19 mitigation period were more likely to report an increased quality of life (OR 3.69, 95% CI 1.86–7.29), compared to participants who were not work-ing from home. The effect was similar for men (OR 4.11, 95% CI 1.30–13.0) and women (OR 3.33, 95% CI 1.34–8.29; Table 4). Similarly, working part of the time from home was associated with an increased quality of life (OR 2.07, 95% CI 1.09–3.91). Effect estimates had the same direc-tion when stratifying by gender, but did not reach statistical
Table 4 Likelihood of positive and negative changes compared to the time pre-COVID-19 by work from home status in the working sub-sample (N = 686)
a Age-adjusted [< 30, 30–39, 40–49, ≥ 50 years]b Additionally adjusted for gender [binary] (in not-gender stratified models), race (white/Caucasian, other), citizenship (Austrian, other), edu-cational attainment [High school or less, Matura(University entry exam), university degree], region of residence (west, south, east), area of residence (urban area, rural with < 50,000 inhabitants, rural with ≥ 50,000 inhabitants), marital status (single, married or partnership, divorced or widowed), number of children [none, one, two, three or more], taking care of children younger than 6 years at home (yes, no, no child that age), taking care of children between 6 and 12 years at home (yes, no, no child that age), household size (one, two, three, four, five or more persons), short-time work (binary), job loss [binary], work status [full time employed (including self-employed), part time employed (including self-employed)], financial strain during lockdown (None, some, high, very high) and dispositional optimism (low, high)
Men (N = 350) Women (N = 336) Total (N = 686)
Working from home Working from home Working from home
No(N = 87)
Part time(N = 155)
All the time(N = 108)
No(N = 91)
Part time(N = 142)
All the time(N = 103)
No(N = 178)
Part time(N = 297)
All the time(N = 211)
N (%) N (%) N (%) N (%) N (%) N (%) N (%) N (%) N (%)
Quality of life No change 60 (69.0) 109 (70.3) 58 (53.7) 59 (64.8) 83 (58.5) 54 (52.4) 119 (66.9) 192 (64.7) 112 (53.1) Decreased 21 (24.1) 21 (13.6) 24 (22.2) 21 (23.1) 22 (15.5) 17 (16.5) 42 (23.6) 43 (14.5) 41 (19.4) OR (95%
CI)a1 (Ref.) 0.51 (0.25–
1.03)1.07 (0.52–2.21)
1 (Ref.) 0.67 (0.38–1.72)
0.81 (0.38–1.72)
1 (Ref.) 0.58 (0.36–0.95)
0.94 (0.56–1.57)
OR (95% CI)a,b
1 (Ref.) 0.47 (0.17–1.26)
1.02 (0.36–2.91)
1 (Ref.) 0.63 (0.27–1.47)
0.72 (0.28–1.84)
1 (Ref.) 0.54 (0.30–0.97)
0.88 (0.46–1.68)
Improved 6 (6.9) 25 (16.1) 26 (24.1) 11 (12.1) 37 (26.1) 32 (31.1) 17 (9.6) 62 (20.9) 58 (27.5) OR (95%
CI)a1 (Ref.) 2.39 (0.91–
6.27)4.46 (1.65–12.1)
1 (Ref.) 1.96 (0.90–4.24)
2.74 (1.23–6.12)
1 (Ref.) 2.03 (1.12–3.69)
3.18 (1.72–5.90)
OR (95% CI)a,b
1 (Ref.) 2.09 (0.71–6.13)
4.11 (1.30–13.0)
1 (Ref.) 1.71 (0.73–3.98)
3.33 (1.34–8.29)
1 (Rsef.) 2.07 (1.09–3.91)
3.69 (1.86–7.29)
Productivity No change 59 (67.8) 90 (58.1) 58 (53.7) 54 (59.3) 76 (53.5) 55 (43.4) 113 (63.5) 166 (55.9) 113 (53.6) Decreased 21 (24.1) 47 (30.3) 28 (25.9) 25 (27.5) 47 (33.1) 39 (37.9) 46 (25.8) 94 (31.6) 67 (31.7) OR (95%
CI)a1 (Ref.) 1.44 (0.78–
2.68)1.31 (0.65–2.64)
1 (Ref.) 1.22 (0.67–2.24)
1.39 (0.73–2.64)
1 (Ref.) 1.33 (0.86–2.04)
1.34 (0.84–2.15)
OR (95% CI)a,b
1 (Ref.) 1.83 (0.83–4.04)
1.39 (0.56–3.45)
1 (Ref.) 1.35 (0.66–2.75)
1.78 (0.82–3.84)
1 (Ref.) 1.42 (0.86–2.35)
1.48 (0.85–2.58)
Improved 7 (8.1) 18 (11.6) 22 (20.4) 12 (13.2) 19 (13.4) 9 (8.7) 19 (10.7) 37 (12.5) 31 (14.7) OR (95%
CI)a1 (Ref.) 1.80 (0.70–
4.63)3.82 (1.46–9.99)
1 (Ref.) 0.94 (0.41–2.15)
0.62 (0.24–1.62)
1 (Ref.) 1.27 (0.69–2.34)
1.55(0.82–2.94)
OR (95% CI)a,b
1 (Ref.) 1.11 (0.36–3.38)
1.65 (0.50–5.37)
1 (Ref.) 0.72 (0.26–2.00)
0.68 (0.22–2.10)
1 (Ref.) 1.08 (0.56–2.10)
1.18 (0.58–2.45)

1833International Archives of Occupational and Environmental Health (2021) 94:1823–1837
1 3
significance. Furthermore, not working from home seemed to be associated with a decreased quality of life compared to working partially or all the time from home (Table 4). These results did not change importantly after further adjustment for changes in perceived productivity.
In contrast, participants working part or all of the time from home appeared more likely to report decreased pro-ductivity (vs. not working from home, partially: OR 1.42, 95% CI 0.86–2.35; all the time: OR 1.48, 95% CI 0.85–2.58) (Table 4).
Discussion
Overall, quality of life and perceived productivity improved in a sizeable segment of the Austrian population sample dur-ing the COVID-19 mitigation period. Simultaneously, these factors decreased in an even larger part of the sample. Work-ing from home during the mitigation period was associated with an improved quality of life, consistent with prior reports that Austrians expressed a preference to work from home (TQS Research & Consulting 2020), but this did not cor-respond to increased perceived productivity. Furthermore, our results suggested that changes in perceived productivity did not drive the association of working from home with increased quality of life.
Our results and interpretations are limited by not hav-ing assessed potentially informative aspects of employment history or the working environment and related conditions at home. For example, we did not collect information on income or whether individuals worked from home prior to the 50-day mitigation period, some, although probably very few, might already have worked from home prior to the pan-demic. We also did not assess if working from home was also coupled with greater working hour flexibility. Accord-ing to Hill et al. ‘Work-at-home should be coupled with perceived schedule flexibility to maximize benefits’ (Hill et al. 2010). Measures to assess changes in quality of life and perceived productivity were not validated. Furthermore, we could not quantify the changes in self-reported quality of life and productivity, and changes in one’s perceived produc-tivity may not correspond to changes in employer-assessed productivity. Participants might have interpreted the term “productivity” in various ways and results must, therefore, be interpreted cautiously. That circumstances surrounding the pandemic might have altered the perception, definition, and determinants of productivity limits the generalizability of our findings. Furthermore, change in quality of life, a multidimensional concept, was assessed with a single ques-tion adding to the limited generalizability of our findings, as dimensions within the concept of quality of life might have changed differentially during the pandemic. The cross-sec-tional design of our study precludes causal inferences, and
non-differential misclassification could have led to underes-timates in our results. Furthermore, while reverse causation appears unlikely, the reported association between working from home and quality of life and perceived productivity could be confounded by such factors as type of occupation, commuting distance, general job satisfaction, (Bhattarai 2020) and pre-pandemic work arrangements, for which we could not properly adjust.
Overall, a decrease in quality of life and perceived pro-ductivity was reported more frequently than an increase in our sample suggesting that the first mitigation period affected the life of the Austrian population negatively, although some individuals appeared to benefit from the introduced measures. Pieh et al. (2020) reported that the mental health burden during the mitigation period was alarmingly high among young Austrian adults and sug-gested that this could potentially be explained by their higher occupational uncertainty and larger restrictions in their daily lives. In the present study, most younger participants reported no change in quality of life, with similar propor-tions reporting a decrease or an increase in quality of life. However, middle-aged and older adults were notably more likely than younger participants to report no change; hence, the mitigation measures appear to have affected the quality of life of younger Austrians more than other age groups, both positively and negatively. That these effects on quality of life might differ depending on age was recently corrobo-rated by a Belgian survey among young physicians, where 56% reported a positive impact of the COVID-19 crisis on their life (Degraeve et al. 2020).
Pieh et al. (2020) also reported that the mental health of women in Austria was more negatively affected during the mitigation period. In our study, the reported decrease in quality of life was almost identical across gender, and women more frequently reported an improved than a decreased quality of life. Interestingly, being married or in a partnership appeared to correlate with a positive change in quality of life in men, whereas for women, the oppo-site effect was observed; women who were married or in a partnership were less likely than single women to report an increased quality of life. One explanation for this obser-vation could be that women might have had to shoulder a bigger part of the mitigation period´s consequences when in a partnership, especially in families with children. And indeed, although with limited power, our results are sugges-tive for slightly stronger effects among women in partner-ships with children, compared to single women or women in partnerships without children. A German COVID-19 survey showed that even today, women are still carrying most of the burden of childcare, household chores, and care for the elderly (Czymara et al. 2020; Hans-Böckler-Stiftung 2020). In Spain, the closure of schools and daycares increased the time women spent on home schooling and domestic care,

1834 International Archives of Occupational and Environmental Health (2021) 94:1823–1837
1 3
whereas males increased their contribution to housework only slightly (Farré et al. 2020).
In the present study, higher optimism correlated with lower likelihood of decreased quality of life in women. However, optimism did not seem to be linked with a higher likelihood of reporting an improved quality of life. One potential explanation for this observation might be related to resilience (Aburn et al. 2016), which is an important trait during challenging situations, with optimism as an essen-tial contributor (Lee et al. 2013). However, more research is needed to elucidate these potential associations.
Surprisingly, high financial strain correlated with improved quality of life and perceived increased productivity in men. Less work could lead to an improved quality of life (e.g., more time for hobbies) but also to a higher financial strain, which in turn could motivate people to work more or could influence their perceived productivity. In a simi-lar manner, our observations of more frequently reported increases in quality of life for participants in short-time work arrangements or those working from home may be explained by more flexibility in the attribution of available time throughout the day and by simply having more time available to attribute to certain activities (Hill et al. 2010). Working partially or all the time from home implies that commuting is no longer part of daily life. In Austria, this implies that about 53% of the working population could free up 30 min to 2 h every day (STATISTIK AUSTRIA 2017) and allot the available time to other more pleasurable or productive activities. For example, an ability to allot time to an activity at a preferable time (having lunch with the family, meeting friends, doing sports, etc.) may be a key element of quality of life that enhances healthy lifestyle behaviors and thereby contributes to a stronger sense of well-being in the face of co-existing challenges. However, these findings must be interpreted with caution as they may be limited to socie-ties and situations where working from home is a choice, rather than mandated by a pandemic.
This hypothesis is corroborated by other evidence. For example, a study into the COVID-19 mitigation period in Chile revealed that 60% of the population were preparing food at home more frequently than before, 33.7% ate more healthily and 23% were physically more active (Reyes-Ola-varría et al. 2020). In a French sample, 18.7% increased their level of physical activity during the mitigation period and 23% reported weight loss. More favorable lifestyle behaviors correlated more strongly with education level, income, and working from home. The authors also noted that a mitiga-tion period enabled an important segment of the population to improve their nutritional behavior in potentially sustain-able ways (e.g., post mitigation period) (Deschasaux-Tanguy et al. 2020). In a qualitative study, participants reported neg-ative long-term behavioral changes after a quarantine (not COVID-19 related). The authors suggested that a similar
pattern of longer term sustained change might apply to posi-tive changes as well (Brooks et al. 2020). Lack of time is one of the most important barriers to adopting and maintaining a healthy lifestyle, especially in working populations (Kearney and McElhone 1999; Spiteri et al. 2019). Therefore, gaining time through more flexible working hours and workplace arrangements could have important positive implications for society and may explain the present findings.
Overall, a deeper understanding of side effects of more flexible working conditions is needed. In our study, work-ing from home seemed more often to be associated with decreased rather than increased perceived productivity. A qualitative study into the COVID-19 mitigation period in April 2020 in Indonesia supports that working from home improved work-life balance, workplace and time flexibility and diminished participants’ discomfort from otherwise working under constant supervision. However, participants also reported decreased motivation, increased distraction, and difficulties communicating with colleagues and manag-ers (Mustajab et al. 2020). In a survey of 51 Italian adminis-trative officers who had started to work remotely during the beginning of the COVID-19 crisis, 39.2% of participants indicated lower and 29.4% higher productivity compared to before they started to work from home. 62.7% wanted to continue working from home occasionally or all the time, while the lack of interaction with colleagues was the main reason for 31.4% of participants to indicate the opposite. The rest (5.9%) indicated distractions as the main reason for not wanting to continue to work from home (Moretti et al. 2020). The ability to concentrate was shown to be an essential influ-ence on perceived productivity (Maarleveld and de Been 2014). Some factors, e.g., having to take care of children at home or having to sit on a non-ergonomic chair all day long, could be unique to the COVID-19 mitigation period. Moreo-ver, worldwide productivity—in almost every way—reached a low during the COVID-19 mitigation period, likely inde-pendent of the concrete place of work (World Bank 2020).
In their 2017 report on telework, Eurofound and the Inter-national Labour Office concluded that telework has mainly positive effects on individual performance, explained in part by longer working hours and a higher ability to concentrate due to fewer interruptions (Eurofound 2017). Yet, working from home had not been widely adopted in Europe before the emergence of COVID-19 (Eurofound 2017). In a sur-vey administered in 75 countries, working from home and perceived schedule flexibility were related to less work-life conflict. However, women with children aged five or younger were more likely to report work difficulties when working from home compared to women who did not primarily work from home (Hill et al. 2010). This result points towards a key nuance when discussing benefits and downsides of work-ing from home: effects differ substantially across different subgroups. In our study, for example, older and more highly

1835International Archives of Occupational and Environmental Health (2021) 94:1823–1837
1 3
educated men were more likely to report an increased per-ceived productivity, whereas this was not seen in women of similar age and education level. Recently, women in science reported a substantial decline in time devoted to research (Myers et al. 2020), and women were less likely to report job satisfaction compared to men when working from home dur-ing the pandemic (Bhattarai 2020). In our study, inequalities also surfaced when looking at the distribution of working from home by gender, age, and educational status. Working from home was much more frequent among higher educated participants, suggesting that less educated participants were less likely to benefit from any improvements associated with working from home. In our study, not working from home during the mitigation period seemed to be associated with a decreased quality of life. Other studies reported that changes in lifestyle differed by income (Deschasaux-Tanguy et al. 2020) and that economically vulnerable groups experienced more negative consequences from the crisis (Hans-Böckler-Stiftung 2020). These inequalities and the ones referred to previously might partially be explained by the unequal dis-tribution of organizational and occupational factors such as job insecurity, uncertainty of the future, and long periods of isolation (Giorgi et al. 2020) that can influence the mental response of workers during the pandemic. While in theory the implementation of resilience training interventions tar-geted at vulnerable parts of the population could bring some relief (Giorgi et al. 2020; Wang et al. 2020), especially when interventions are adaptable for local needs and are intro-duced to an environment with effective communication and safe and supportive learning environments (Pollock et al. 2020), their practicability and usefulness remains open to debate. To our knowledge, ours is the first study to describe associations between working from home during a COVID-19 mitigation period and quality of life and perceived pro-ductivity at a population level. The results from our survey of the Austrian population might not be generalizable to other populations, and the generalizability to the whole Austrian population might also be limited by drawing par-ticipants from an Online-Panel. Furthermore, results might not be generalizable to pre- and post-pandemic conditions considering the exceptional characteristics of the first miti-gation period in Austria compared to “normal” times. In addition, we captured merely the 50 days of the COVID-19 mitigation period in Austria, warranting further examina-tion of the long-term associations of working from home with quality of life. Lastly, studies are needed to evaluate the implications of our results in the context of the One Health paradigm, i.e., how exactly does more workplace flexibility reduce our ecological footprint?
The ongoing pandemic is an opportunity for researchers and companies alike to further investigate effects of work-ing from home on the employee´s life. Future longitudinal
studies will ideally investigate both short-term and long-term associations of working from home with key indica-tors of the employee’s quality of life, perceived produc-tivity, and objectively measured productivity to clarify the positive and negative repercussions of working from home for employees and employers, and ultimately to inform policy makers. Results for different subgroups and stakeholders are needed (since outcomes might be posi-tive for one group but negative for another), and barri-ers and facilitators for a positive impact of working from home on quality of life should be identified, including the influence of sociodemographic factors and the working environment/conditions at home. Studies should also avail of the opportunities to incorporate further transitions as the pandemic resolves. Such further research holds the potential to inform beneficial public policy to minimize longer term negative consequences of COVID-19 preven-tion measures and better understand and mitigate existing societal inequalities and their implications for family and professional life, for stakeholders, for the environment, and ultimately for public and One Health. Society should try to use the momentum, in this case the recently experi-enced transition to more flexibility of workplace and work-ing hours for employees, to improve life and environmental conditions in the future.
Supplementary Information The online version contains supplemen-tary material available at https:// doi. org/ 10. 1007/ s00420- 021- 01692-0.
Acknowledgements We thank all survey participants for their contributions.
Author contributions ES, GS, GC, ML, MB, BMB, CCJ and LZ designed the study. JW analyzed the data. All authors interpreted the results. JW, ES, and GS drafted the Article. All authors contributed to the writing of the final version of the Article.
Funding Open access funding provided by Medical University of Vienna. The study was funded by the Department of Epidemiology, Center for Public Health, Medical University of Vienna, Austria and the Department for Knowledge and Communication Management, Fac-ulty of Business and Globalization, Danube University Krems, Krems, Austria.
Data availability Data are available by contacting the corresponding author and following acceptance by the contributing centers.
Code availability Codes are available by contacting the corresponding author and following acceptance by the contributing centers.
Declarations
Conflict of interest We declare no competing interests.
Consent to participate Participation was voluntary and anonymous, and informed consent was implied through participation.

1836 International Archives of Occupational and Environmental Health (2021) 94:1823–1837
1 3
Open Access This article is licensed under a Creative Commons Attri-bution 4.0 International License, which permits use, sharing, adapta-tion, distribution and reproduction in any medium or format, as long as you give appropriate credit to the original author(s) and the source, provide a link to the Creative Commons licence, and indicate if changes were made. The images or other third party material in this article are included in the article’s Creative Commons licence, unless indicated otherwise in a credit line to the material. If material is not included in the article’s Creative Commons licence and your intended use is not permitted by statutory regulation or exceeds the permitted use, you will need to obtain permission directly from the copyright holder. To view a copy of this licence, visit http:// creat iveco mmons. org/ licen ses/ by/4. 0/.
References
Aburn G, Gott M, Hoare K (2016) What is resilience? An integrative review of the empirical literature. J Adv Nurs 72(5):980–1000. https:// doi. org/ 10. 1111/ jan. 12888
Ammar A, Brach M, Trabelsi K, Chtourou H, Boukhris O, Masmoudi L, Bouaziz B, Bentlage E, How D, Ahmed M, Müller P, Müller N, Aloui A, Hammouda O, Paineiras-Domingos LL, Braakman-Jansen A, Wrede C, Bastoni S, Pernambuco CS, Hoekelmann A (2020a) Effects of COVID-19 home confinement on eating behaviour and physical activity: results of the ECLB-COVID19 international online survey. Nutrients. https:// doi. org/ 10. 3390/ nu120 61583
Ammar A, Trabelsi K, Brach M, Chtourou H, Boukhris O, Masmoudi L, Bouaziz B, Bentlage E, How D, Ahmed M, Mueller P, Mueller N, Aloui A, Hammouda O, Paineiras-Domingos LL, Braakman-jansen A, Wrede C, Bastoni S, Pernambuco CS, Hoekelmann A (2020b) Effects of home confinement on mental health and life-style behaviours during the COVID-19 outbreak: insight from the “ECLB-COVID19” multi countries survey. MedRxiv. https:// doi. org/ 10. 1101/ 2020. 05. 04. 20091 017
Bhattarai M (2020) Working from home and job satisfaction during the pandemic times. July. https:// www. resea rchga te. net/ publi cation/ 34291 4908_ Worki ng_ from_ Home_ and_ Job_ Satis facti on_ Dur-ing_ the_ Pande mic_ Times. Accessed 14 Oct 2020
Brooks SK, Webster RK, Smith LE, Woodland L, Wessely S, Green-berg N, Rubin GJ (2020) The psychological impact of quaran-tine and how to reduce it: rapid review of the evidence. Lancet 395(10227):912–920. https:// doi. org/ 10. 1016/ S0140- 6736(20) 30460-8
Czymara CS, Langenkamp A, Cano T (2020) Cause for concerns: gen-der inequality in experiencing the COVID-19 lockdown in Ger-many. Eur Soc. https:// doi. org/ 10. 1080/ 14616 696. 2020. 18086 92
Degraeve A, Lejeune S, Muilwijk T, Poelaert F, Piraprez M, Svistakov I, Roumeguère T (2020) When residents work less, they feel bet-ter: Lessons learned from an unprecedent context of lockdown. Prog Urol. https:// doi. org/ 10. 1016/j. purol. 2020. 08. 005
Deschasaux-Tanguy M, Druesne-Pecollo N, Esseddik Y, Szabo de Edelenyi F, Alles B, Andreeva VA, Baudry J, Charreire H, Des-champs V, Egnell M, Fezeu LK, Galan P, Julia C, Kesse-Guyot E, Latino-Martel P, Oppert J-M, Peneau S, Verdot C, Hercberg S, Touvier M (2020) Diet and physical activity during the COVID-19 lockdown period (March-May 2020): results from the French NutriNet-Sante cohort study. MedRxiv. https:// doi. org/ 10. 1101/ 2020. 06. 04. 20121 855
Eurofound (2017) Working anytime, anywhere: the effects on the world of work | Eurofound. https:// www. eurof ound. europa. eu/ publi catio ns/ report/ 2017/ worki ng- anyti me- anywh ere- the- effec ts- on- the- world- of- work. Accessed 12 Sept 2020
Farré, L., Fawaz, Y., González, L., Graves, J. (2020) How the COVID-19 lockdown affected gender inequality in paid and unpaid work in Spain. IZA Discussion Paper, 13434(13434).
Giorgi G, Lecca LI, Alessio F, Finstad GL, Bondanini G, Lulli LG, Arcangeli G, Mucci N (2020) COVID-19-related mental health effects in the workplace: a narrative review. Int J Environ Res Pub-lic Health 17(21):7857. https:// doi. org/ 10. 3390/ ijerp h1721 7857
Hans-Böckler-Stiftung (2020) Coronakrise verschärft soziale Ungleich-heit—Hans-Böckler-Stiftung. https:// www. boeck ler. de/ de/ boeck ler- impuls- coron akrise- versc harft- sozia le- ungle ichhe it- 25092. htm. Accessed 30 Sept 2020
Hill EJ, Erickson JJ, Holmes EK, Ferris M (2010) Workplace flexibil-ity, work hours, and work-life conflict: finding an extra day or two. J Fam Psychol 24(3):349–358. https:// doi. org/ 10. 1037/ a0019 282
Joyce K, Pabayo R, Critchley JA, Bambra C (2010) Flexible working conditions and their effects on employee health and wellbeing. Cochrane Database Syst Rev. https:// doi. org/ 10. 1002/ 14651 858. cd008 009. pub2
Kearney JM, McElhone S (1999) Perceived barriers in trying to eat healthier—results of a pan-EU consumer attitudinal survey. Br J Nutr 81(Suppl. 2):S133–S137. https:// doi. org/ 10. 1017/ s0007 11459 90009 87
Kurier (2020) Chronologie: was die Schüler ab dem ersten Fall alles erlebten. https:// kurier. at/ wissen/ wisse nscha ft/ chron ologie- timel ine- bildu ng- in- oeste rreich- was- die- schue ler- ab- dem- ersten- fall- alles- erleb ten/ 40113 5031. Accessed 3 Feb 2021
Laegran AS (2008) Domesticating home anchored work: negotiating flexibility when bringing ICT based work home in rural communi-ties. Geoforum 39(6):1991–1999. https:// doi. org/ 10. 1016/j. geofo rum. 2008. 06. 007
Laubichler, M. (2020) “COVID-19 reveals the systemic risks for one health and the need for a novel network governance”. Global Sus-tainability 2021 (in press)
Lee JH, Nam SK, Kim A-R, Kim B, Lee MY, Lee SM (2013) Resil-ience: a meta-analytic approach. J Couns Dev 91(3):269–279. https:// doi. org/ 10. 1002/j. 1556- 6676. 2013. 00095.x
Maarleveld M, de Been I (2014) The influence of the workplace on perceived productivity. pp 1–13. https:// www. resea rchga te. net/ publi cation/ 25591 0695_ The_ influ ence_ of_ the_ workp lace_ on_ perce ived_ produ ctivi ty. Accessed 19 Sept 2020
Moretti A, Menna F, Aulicino M, Paoletta M, Liguori S, Iolascon G (2020) Characterization of home working population during COVID-19 emergency: a cross-sectional analysis. Int J Environ Res Public Health 17(17):1–13. https:// doi. org/ 10. 3390/ ijerp h1717 6284
Mustajab D, Bauw A, Rasyid A, Irawan A, Akbar MA, Hamid MA (2020) Working from home phenomenon as an effort to prevent COVID-19 attacks and its impacts on work productivity. Int J Appl Bus 4(1):13
Myers KR, Tham WY, Yin Y, Cohodes N, Thursby JG, Thursby MC, Schiffer P, Walsh JT, Lakhani KR, Wang D (2020) Unequal effects of the COVID-19 pandemic on scientists. Nat Hum Behav 4(9):880–883
Land Niederösterreich (2020) ExpertInnenstudie und Unternehmens-befragung 2020 zu Homeoffice und Videokonferenzen—Land Niederösterreich. https:// www. noe. gv. at/ noe/ Digit alisi erung/ Home- Office. html. Accessed 8 Apr 2021
Republik Österreich (2020a) Bundesgesetzblatt für die Republik Öster-reich. 98. Verordnung: Verordnung gemäß § 2 Z 1 des COVID-19-Maßnahmengesetzes. 2020. https:// www. ris. bka. gv. at/ Dokum ente/ BgblA uth/ BGBLA_ 2020_ II_ 98/ BGBLA_ 2020_ II_ 98. html. Accessed 8 Apr 2021
Republik Österreich (2020b) Bundesgesetzblatt für die Republik Öster-reich. 197. Verordnung: Verordnung gemäß §§1 und 2 Z 1 des COVID-19-Maßnahmengesetzes und des Epidemiegesetztes 1950.

1837International Archives of Occupational and Environmental Health (2021) 94:1823–1837
1 3
2020. https:// www. ris. bka. gv. at/ Dokum ente/ BgblA uth/ BGBLA_ 2020_ II_ 197/ BGBLA_ 2020_ II_ 197. html. Accessed 8 Apr 2021
Palumbo R (2020) Let me go to the office! an investigation into the side effects of working from home on work-life balance. Int J Public Sect Manag 33(6–7):771–790. https:// doi. org/ 10. 1108/ IJPSM- 06- 2020- 0150
Palumbo R, Manna R, Cavallone M (2020) Beware of side effects on quality! investigating the implications of home working on work-life balance in educational services. TQM J. https:// doi. org/ 10. 1108/ TQM- 05- 2020- 0120
Pieh C, Budimir S, Probst T (2020) The effect of age, gender, income, work, and physical activity on mental health during coronavi-rus disease (COVID-19) lockdown in Austria. J Psychosom Res 136:110186. https:// doi. org/ 10. 1016/j. jpsyc hores. 2020. 110186
Pollock A, Campbell P, Cheyne J, Cowie J, Davis B, McCallum J, McGill K, Elders A, Hagen S, McClurg D, Torrens C, Maxwell M (2020) Interventions to support the resilience and mental health of frontline health and social care professionals during and after a disease outbreak, epidemic or pandemic: a mixed methods sys-tematic review. Cochrane Database Syst Rev 11(11):CD013779. https:// doi. org/ 10. 1002/ 14651 858. CD013 779
Probst T, Stippl P, Pieh C (2020) Changes in provision of psycho-therapy in the early weeks of the COVID-19 lockdown in Austria. Int J Environ Res Public Health 17(11):3815. https:// doi. org/ 10. 3390/ ijerp h1711 3815
Reyes-Olavarría D, Latorre-Román PÁ, Guzmán-Guzmán IP, Jerez-Mayorga D, Caamaño-Navarrete F, Delgado-Floody P (2020) Positive and negative changes in food habits, physical activity patterns, and weight status during COVID-19 confinement: asso-ciated factors in the Chilean population. Int J Environ Res Public Health 17(15):1–14. https:// doi. org/ 10. 3390/ ijerp h1715 5431
Russo, D., Hanel, P. H. P., Altnickel, S., van Berkel, N. (2020) Predic-tors of well-being and productivity among software professionals during the COVID-19 pandemic—a longitudinal study. ArXiv http:// arxiv. org/ abs/ 2007. 12580
Sato K, Sakata R, Murayama C, Yamaguchi M, Matsuoka Y, Kondo N (2020) Working from home and lifestyle changes associated with risk of depression during the COVID-19 pandemic: an observa-tional study of health app (CALO Mama) users. SSRN Electron J. https:// doi. org/ 10. 2139/ ssrn. 36612 02
Scheier MF, Carver CS, Bridges MW (1994) Distinguishing opti-mism from neuroticism (and trait anxiety, self-mastery, and self-esteem): a reevaluation of the life orientation test. J Pers Soc Psychol 67(6):1063–1078. https:// doi. org/ 10. 1037// 0022- 3514. 67.6. 1063
Spiteri K, Broom D, Bekhet AH, De Caro JX, Laventure B, Grafton K (2019) Barriers and motivators of physical activity participation
in middle-aged and older adults—a systematic review. J Aging Phys Act 27(6):929–944. https:// doi. org/ 10. 1123/ japa. 2018- 0343
STATISTIK AUSTRIA (2017) Pendlerinnen und Pendler. STATISTIK AUSTRIA. https:// www. stati stik. at/ web_ de/ stati stiken/ mensc hen_ und_ gesel lscha ft/ bevoe lkeru ng/ volks zaehl ungen_ regis terza ehlun gen_ abges timmte_ erwer bssta tistik/ pendl erinn en_ und_ pendl er/ index. html. Accessed 19 Sept 2020
TQS Research & Consulting (2020) New work and home-schooling während der Corona-pandemie. http:// www. blog. tqs. at/ 2020/ 05/ 04/ besch aefti gte- zwisc hen- new- work- und- home- schoo ling- waehr end- der- corona- pande mie/. Accessed 13 Sept 2020
Troup C, Rose J (2012) Working from home: do formal or informal telework arrangements provide better work-family outcomes? Community Work Fam 15(4):471–486. https:// doi. org/ 10. 1080/ 13668 803. 2012. 724220
Vittersø J, Akselsen S, Evjemo B, Julsrud TE, Yttri B, Bergvik S (2003) Impacts of home-based telework on quality of life for employees and their partners quantitative and qualitative results from a European survey. J Happiness Stud 4(2):201–233
Wang YX, Guo HT, Du XW, Song W, Lu C, Hao WN (2020) Factors associated with post-traumatic stress disorder of nurses exposed to corona virus disease 2019 in China. Medicine 99(26):e20965. https:// doi. org/ 10. 1097/ MD. 00000 00000 020965
Webster J, Wong WKP (2008) Comparing traditional and virtual group forms: identity, communication and trust in naturally occurring project teams. Int J Hum Resour Manag 19(1):41–62. https:// doi. org/ 10. 1080/ 09585 19070 17638 83
World Bank (2020) Global economic prospects. https:// www. world bank. org/ en/ publi cation/ global- econo mic- prosp ects#: ~: text= Global. The baseline forecast envisions a,economies will shrink this year. Accessed 28 Oct 2020
Xiao Y, Becerik-Gerber B, Lucas G, Roll SC (2020) Impacts of work-ing from home during COVID-19 pandemic on physical and men-tal well-being of office workstation users. J Occup Environ Med. https:// doi. org/ 10. 1097/ JOM. 00000 00000 002097
Zambrano-Monserrate MA, Ruano MA, Sanchez-Alcalde L (2020) Indirect effects of COVID-19 on the environment. Sci Total Envi-ron 728:138813. https:// doi. org/ 10. 1016/j. scito tenv. 2020. 138813
Publisher’s Note Springer Nature remains neutral with regard to jurisdictional claims in published maps and institutional affiliations.