Embed Size (px)
Citation preview

Department for Work and Pensions
Research Report No 182
Corporate Document Services
Working after StatePension Age: QuantitativeAnalysis
Deborah Smeaton and Stephen McKay
A report of research carried out by the Policy Studies Institute and the Personal FinanceResearch Centre on behalf of the Department for Work and Pensions

© Crown Copyright 2003. Published for the Department for Work and Pensions under licence fromthe Controller of Her Majesty’s Stationery Office by Corporate Document Services, Leeds.
Application for reproduction should be made in writing toThe Copyright Unit, Her Majesty’s Stationery Office, St Clements House, 2-16 Colegate,Norwich NR3 1BQ.
First Published 2003.
ISBN 1 84123 532 6
Views expressed in this report are not necessarily those of the Department for Work and Pensionsor any other Government Department.
Printed by The Charlesworth Group (Huddersfield, UK).

iii
ContentsAcknowledgements .............................................................................................................. vii
The Authors......................................................................................................................... viii
Summary ............................................................................................................................... 1
1 Introduction..................................................................................................................... 51.1 Background .......................................................................................................... 5
1.1.1 Older workers in Britain ........................................................................ 5
1.1.2 European comparisons ......................................................................... 7
1.1.3 Reasons for declining rates of work among older people ....................... 8
1.2 The study ............................................................................................................. 9
1.2.1 Aims .................................................................................................... 9
1.2.2 Data and methods ................................................................................ 9
1.2.3 Plan of report ..................................................................................... 10
1.3 Central themes ................................................................................................... 10
1.4 Numbers of older people: future trends .............................................................. 11
2 The work decision.......................................................................................................... 132.1 Introduction ....................................................................................................... 13
2.2 Male and female participation rates .................................................................... 13
2.2.1 Women .............................................................................................. 14
2.2.2 Men ................................................................................................... 15
2.3 Poverty push or living standard maintenance? ..................................................... 15
2.3.1 Marital status ..................................................................................... 15
2.3.2 The contribution of earnings to weekly incomes .................................. 17
2.3.3 Educational qualifications ................................................................... 19
2.3.4 Health status ...................................................................................... 20
2.4 Household circumstances .................................................................................... 20
2.4.1 Equalising State Pension Ages ............................................................. 21
2.4.2 Caring ................................................................................................ 22
Contents

iv Contents
2.5 The demand for older workers ............................................................................ 23
2.6 Multivariate analyses: pulling the picture together ............................................... 24
3 Types of Jobs ................................................................................................................. 273.1 Introduction ....................................................................................................... 27
3.2 New jobs or old .................................................................................................. 27
3.3 Job characteristics ............................................................................................... 28
3.3.1 Employment contracts ........................................................................ 28
3.3.2 Downshifting ..................................................................................... 31
3.3.3 Industry and occupation ..................................................................... 33
3.3.4 Organisational type ............................................................................ 35
3.3.5 Job satisfaction ................................................................................... 36
3.3.6 Wanting to leave work ....................................................................... 37
3.4 Earnings ............................................................................................................. 37
4 Dynamics of retirement .................................................................................................. 394.1 Introduction ....................................................................................................... 39
4.2 Simple panel analysis: antecedents of working post-SPA ..................................... 39
4.2.1 Couples and joint retirement .............................................................. 42
4.3 Event-history analysis .......................................................................................... 43
5 Effects of working past State Pension Age ..................................................................... 475.1 Introduction ....................................................................................................... 47
5.2 Analysis of current workers and non-workers ...................................................... 47
5.3 Controlling for past status .................................................................................. 50
6 Concluding remarks ....................................................................................................... 53
Appendix A Logistic regression models of working .............................................................. 55
Appendix B OLS regression models of hourly earnings ........................................................ 59
References ........................................................................................................................... 61
Other research reports available ........................................................................................... 63
List of tablesTable 2.1 Employment status after SPA ........................................................................... 13
Table 2.2 Working by age group and sex ........................................................................ 14
Table 2.3 Proportion of post-SPA respondents working by marital status ......................... 16
Table 2.4 Proportion of post-SPA respondents working by housing tenure ....................... 16
Table 2.5 What percentage of total weekly income do earnings represent? ..................... 17
Table 2.6 Total weekly income among the working and non-working .............................. 18
Table 2.7 Average earnings as a percentage of average weekly household income .......... 18
Table 2.8 Receipt of occupational pension by employment status .................................... 19
Table 2.9 Rates of working by highest academic qualification: above SPA ........................ 20
Table 2.10 Work by health status: those above SPA .......................................................... 20
Table 2.11 The relationship between working and partner’s status ................................... 21

vContents
Table 2.12 Proportions of men and women with adult caring roles .................................... 22
Table 2.13 Participation rates by caring responsibilities ...................................................... 22
Table 2.14 Proportion of post-SPA respondents working by region .................................... 24
Table 3.1 Proportion of post-SPA workers employed in same job as pre-SPA .................... 28
Table 3.2 Employment contract by age group (%): Men and women 2001 ...................... 29
Table 3.3 Type of temporary job by age (%): Men and women........................................ 31
Table 3.4 Employment type among post-SPA workers ..................................................... 32
Table 3.5 Reason for working part-time by sex ................................................................ 32
Table 3.6 Reason for not wanting full-time work by age (%) ........................................... 32
Table 3.7 Average hours worked by contractual type and age group: 2001 ..................... 33
Table 3.8 Industrial sector by age category: 2001 ............................................................ 33
Table 3.9 Proportion of workers in each occupational group by age group ...................... 34
Table 3.10 Proportion of workers in each occupational group by new or old job ................ 35
Table 3.11 Percentage of each age group by workplace size ............................................. 35
Table 3.12 Job satisfaction by age group and sex .............................................................. 36
Table 3.13 Average hourly pay by contractual type and age group .................................... 38
Table 4.1 Work in 2000 by ‘energy level’ in 1991 ............................................................ 40
Table 4.2 Work in 2000 by work status in 1991 .............................................................. 40
Table 4.3 Work in 2000 by work status in 1991 .............................................................. 41
Table 4.4 Proportion of men in couples working, by own and partner’s age ..................... 42
Table 4.5 Proportion of women in couples working, by own and partner’s age ................ 43
Table 5.1 Financial situation of workers and non-workers, among those aged fromSPA to SPA+10 years ....................................................................................... 48
Table 5.2 Net household equivalised income of workers and non-workers,among those aged from SPA to SPA+10 years ................................................. 48
Table 5.3 Health status of workers and non-workers, among those aged fromSPA to SPA+10 years ....................................................................................... 49
Table 5.4 GHQ unhappy/depressed responses of workers and non-workers,among those aged from SPA to SPA+10 years ................................................. 49
Table 5.5 Miscellaneous characteristics of workers and non-workers, amongthose aged from SPA to SPA+10 years ............................................................. 50
Table 5.6 Health in 2000, by health status in 1995 and work transition 1995-2000 ......... 51
Table 5.7 Health in 2000, by health status in 1999 and work transition 1999-2000 ......... 51
Table A.1 Factors related to working post-SPA: Men and women .................................... 56
Table A.2 Factors related to working post-SPA (odds ratios) ............................................. 57
Table B.1 OLS regression models of hourly earnings ........................................................ 59
List of figuresFigure 1.1 Rates of economic activity after SPA (men) ......................................................... 6
Figure 1.2 Rates of economic activity after SPA (women) .................................................... 6
Figure 1.3 Comparative activity rates (1997, men) .............................................................. 7
Figure 1.4 Comparative activity rates (1997, women) ......................................................... 8
Figure 1.5 Future growth of older age group (men) .......................................................... 12
Figure 1.6 Future growth of older age group (women) ..................................................... 12

vi
Figure 2.1 Proportion of men and women employed or self-employed by age: 2001 ......... 15
Figure 3.1 Proportion of men and women working part-time by age ................................ 29
Figure 3.2 Proportion of men and women self-employed by age ....................................... 30
Figure 3.3 Percentage wanting to leave work in next year, by age and sex ........................ 37
Figure 4.1 Rate of remaining in work by age, men, by 1991 characteristics ....................... 44
Figure 4.2 Rate of remaining in work by age, women, by 1991 characteristics .................. 44
Figure 4.3 Rate of remaining in work by age (based on respondents in work post-57 for .......women, post-62 for men) ................................................................................ 45
Contents

viiAcknowledgements
AcknowledgementsWe would like to thank DWP for supporting this piece of research. Isobel Hines of IAD Social Researchhas been responsible for liaison and ensuring the efficient running of the project. We thank her, andparticipants at a presentation held at DWP on 5 July 2002, for their ideas and suggestions.
Any remaining deficiencies are the responsibility of the two authors.

viii The Authors
The AuthorsDeborah Smeaton is a Research Fellow at the Policy Studies Institute, and has previously conductedresearch on older workers and self-employment.
Stephen McKay is Deputy Director of the Personal Finance Research Centre at Bristol University, andhas also published several reports on older workers.

1Summary
Summary
Introduction
The primary aim of this study is to further understanding of the factors affecting the labour marketparticipation of older people at, and particularly after, State Pension Age (SPA)1. The numbers of olderpeople in paid work have generally been declining and most research attention has focused on thosein the run-up to SPA, generally from age 50 upwards. However, rates of employment of men olderthan SPA have fallen significantly since the early 1970s, and at best have been static among women(Figures 1.1 and 1.2). Real earnings among pensioners have declined by five per cent between 1979and 1995.
Despite these declining rates of paid work, older people in Britain are more likely to be working thanin most of the rest of the European Union. In the EU, high rates of working among older men andwomen are associated with Southern Europe (high rates of self-employment and work withinagriculture), and Scandinavia (pro-work policies). The UK has higher rates of working post 65 (men)and 60 (women) than most of Continental Europe.
This study is based on secondary analysis of the most recent data from the Labour Force Survey, FamilyResources Survey and British Household Panel Study. In the analysis, three different reasons arehighlighted for why individuals may be remaining in paid work beyond State Pension Age. These arejoint retirement, work satisfaction, and maintenance of living standards.
The work decision
Overall, employment rates for women from the age of 60 and men from the age of 65 stand at eightper cent and nine per cent respectively (Table 2.1).
For women, the process of labour market withdrawal, highlighted in Figure 2.1, begins around theage of 51 - at which point just under three-quarters are employed or self-employed. Between 51 and59 years of age, participation rates fall steadily by about four percentage points each year until SPA isreached, at which stage a 10 percentage point drop in employment levels occurs. By the age of 59 lessthan half (44 per cent) of women are working despite not yet receiving a state pension. By age 61, overone-quarter of women (28 per cent) remain employed.
1 Currently, the State Pension Age in the UK is 60 for women and 65 for men.

2 Summary
For men, there is a 17 percentage point decline in participation rates at SPA. There are also raised exitrates for men between the ages of 54 and 55 (six per cent exiting), 59-60 (six per cent exiting) and 60-61 (seven per cent exiting).
Marital status appears to be an important factor for women, the participation rates of marriedwomen are exceeded by the participation rates of women who are separated or divorced. The groupsof both men and women with the highest probability of labour market participation are those withoutstanding mortgages on their properties. Tenants were among the least likely to work.
Forty per cent of the non-workers received an occupational pension, a figure that fell to 33 per centamong workers. The association between working and lower levels of occupational pension receiptis, however, confined to men. Among the men, 67 per cent of non-workers had an occupationalpension compared with 53 per cent of the working men (Table 2.8). Having any educationalqualifications was associated with working past SPA, and having none was associated with leavingwork.
There were important links between the participation rates of men and women living in couples: 41per cent of post-SPA working men had working partners compared with just eight per cent of non-working men. Among working women, 55 per cent of their partners were also working, while just 11per cent of non-working women had partners at work.
Analysis was also undertaken of the demand-side. Participation rates after SPA were not stronglyassociated with regional unemployment levels. However, the highest levels of post-SPA employmentwere found in London, especially Inner London, and the South East.
A statistical model of working showed the strong significance of many of these factors. The resultstended to support the idea that for many pensionable age people, working was associated withfinancial hardship such as: the absence of an occupational pension, income below £100 for men, stillpaying a mortgage and, for women, being separated or divorced. Yet a certain level of advantagewould appear to be a prerequisite in terms of reasonable levels of education, more affluent regions ofresidence, good health and being of a younger age (Table A.1).
Types of jobs
Three-quarters of both men and women working after SPA were in jobs they held prior to SPA (Table3.1). This proportion rises for full-time employees but for men working part-time drops to a little overhalf.
Table 3.4 indicates the importance of part-time opportunities. The largest groups of employed andself-employed men and women worked part-time, predominantly through choice. Indeed, the post-SPA workforce worked fewer hours than younger workers, whether working full-time, part-time orin temporary jobs. This gap in hours was greater for men than women (Table 3.7)
Post-SPA workers were over-represented in certain industries: distribution, hotels, restaurants and‘other services’ (Table 3.8). They were under-represented in the construction industry and thedeclining manufacturing sector from which significant proportions of all men over the age of 50 havelost their jobs over the past couple of decades. Post-SPA men were less likely than their youngercolleagues to be employed as managers, in skilled trades or as machine operatives. Instead theyexhibited increased representation in the ‘elementary occupations’, which often require little trainingor qualifications. Similar occupational outcomes apply to women. Their employment in professionaljobs diminishes with increasing proportions located in elementary occupations instead.

3
Workers over SPA were twice as likely as other age groups to be employed in companies with 1-10staff. They were also far less likely to be employed in organisations with over 50 staff (Table 3.11).
Generally speaking, those in their 50s were the most likely to say they wanted to give up paid work.Among men, the desire to give up paid work was rather lower among those in their 60s, especiallypast SPA, than among those just prior to State Pension Age. For women, however, those working intotheir early 60s were more likely to say they wanted to leave work than women in their late 50s. Manypeople working beyond State Pension Age appear to value their work rather highly.
Reaching State Pension Age was not generally associated with a deterioration in hourly pay rates onceoccupational group, employment status, sex and educational achievement were controlled for(however, there was a gap among men working full-time).
Dynamics of retirement
Simple panel analysis looked at the antecedents of being in work post-SPA in 2000. It showed thedifficulty of returning to work once people left the labour force. Whether people were working in1991, and if as an employee or as self-employed, was particularly important in which of them wereworking in 2000 (Table 4.2). Among men aged 50-59 and self-employed in 1991, some 40 per centwere working ten years’ later. This compared with 17 per cent among employees, and just five percent of those not in paid work.
The best predictor of being in work post-SPA is being in work in the period just before. Most‘apparent’ factors correlated with working post-SPA worked through this link. Their independenteffect on working after 60/65 was much weaker. However, some of the characteristics of jobs andworkers are associated with remaining in work after SPA. For both men and women, having a partnerin work (in 1991) made a large difference to the prospect of remaining in work post-SPA. Womenworking full-time continued working longer than women who worked part-time (Table 4.3).
Couples seemed to be making joint labour supply decisions. In couples, the older the female partner,the less likely that men were in paid work at any given age, and vice versa for women.
More complex event-history analysis confirmed many of these findings for men, but illustrated thelimited effect of different characteristics on women’s rates of working. Rates of working weresustained for only a few years after State Pension Age, and this only happens for those working in theperiod just prior. Increasing participation in paid work post-SPA would seem to have to deal withkeeping people in the labour force before SPA, as well as the decisions made by workers once theyreach SPA.
Effects of working past State Pension Age
Men working past SPA reported financial situations that were superior to those of non-workers (Table5.1). Some 59 per cent of men working past SPA said they were ‘living comfortably’, compared with40 per cent of those not working (and aged 65-75). Among women, 87 per cent of workers older thanSPA said they were either ‘living comfortably’ or ‘doing all right’, compared with 65 per cent of thosewomen not working. The median incomes of workers were around two-thirds higher than amongnon-workers for both men and women.
Some 76 per cent of men who were working and aged 65-75 described their health over the last yearsas either ‘excellent’ or ‘very good’, compared with 54 per cent of non-workers (Table 5.3). Amongwomen, 71 per cent of workers reported a similarly high level of health, compared with 49 per centof non-workers.
Summary

4
Half the male workers, and approaching two-thirds of the women, were saving money. Thiscompared with around one-third of non-working men and women (Table 5.5). This could be evidencethat they were putting money away for their future retirement, particularly since the proportion ofpeople saving, compared to five years previously, had fallen for non-workers, but increased forworkers.
More detailed analysis attempts to control for past employment experience. This showed that theability of people to sustain or even improve health was better among continuing workers than amongthose remaining out of the labour market.
Summary

5
1 IntroductionThis chapter provides some background information about older workers, before explaining thescope of the research project and the methods used. There are some key themes that emerged fromthe project, and these are briefly summarised. This chapter ends with some remarks about futurepopulation trends, which reinforce the importance of the groups being studied.
1.1 Background
This report begins with some background about older workers in Britain.
1.1.1 Older workers in Britain
Prior to the twentieth century, people tended to continue productive work until death. Theintroduction of state pensions in the first part of that century was partly in recognition that peoplemight live beyond their productive working lifetimes, and require financial support to replace lostearnings. Even so, in 1908, pensions were made available only for those of at least 70 years of age,although on a non-contributory basis.
Subsequent reforms established a system of contributory state pensions, and pensionable ages of 60and 65. Until 1988, however, there was essentially a test of retirement before people could get theirpensions. People might chose to delay receiving a state pension by continuing to work, in which casetheir pension would be enhanced when they did receive it.
However, in more recent years there has been interest mostly in people’s employment in the five orten years prior to state pension age. The numbers of older people in paid work, from age 50 upwards,have generally been declining. Campbell (1999) investigated the decline in employment among olderworkers. He found that around two-fifths of men aged between 55 and 65 were without paid workin 1997, compared to one-fifth in 1979. This fall in employment was matched by a rise in rates ofinactivity (such as disability), with levels of unemployment for older workers barely increasing. Whilstthe pace of decline was greatest during the high unemployment of the 1980s, each successive cohortof men appears less likely to remain in employment at older ages.
Among older women, the proportion without paid work had not fallen in the same way, but it is clearthat older women did not share in the general rise in female employment over this period.
There were two main groups most likely to have left the labour market, in this age band below StatePension Age. First, those in the bottom quarter of the hourly wage distribution, and second those withwages in the top half who are also members of occupational pension schemes.
There has been much less attention paid to those older than State Pension Age, and researchspecifically about the labour market participation of this age-group has been sporadic. As a group
Introduction

6
they are perhaps expected to be outside the labour market. Nevertheless, it is clear that the long-termtrend has been to lower rates of economic activity among those above SPA. As shown in Figure 1.1,the proportion of men aged 65-69 who are economically active has declined from 30 per cent in 1971,to 13 per cent in 2001. Among those over 70, whilst more than one man in ten was economicallyactive in 1971, fewer than one in 20 of this group were active in 2001.
Figure 1.1 Rates of economic activity after SPA (men)
Figure 1.2 Rates of economic activity after SPA (women)
Introduction

7
Among women above SPA, rates of economic activity have followed a slightly different path to thoseof men (Figure 1.2). There has been a recovery in activity rates among women aged 60-64, which in2001 were quite similar to those of 1971, having declined in the late 1970s and increased over the1990s. Rates of activity have declined for women aged 65 or older, from what was already in 1971 alow base. However, rates of working have increased for younger age groups of the group over thistime.
For information over the last 20 years or so, there are statistics from the DWP Pensioners’ IncomeSeries. These show that income from earnings among pensioners fell by five per cent between 1979and 1994/5 (in real terms). Over this time, total pensioner incomes rose by 62 per cent (DSS 2000),again after allowing for price inflation.
In the current setting, in the five-year group after SPA, women are more likely to be in paid work thanmen. That is, rates of working among women aged 60-64 exceed those of men aged 65-69.However, among men and women of the same age, men are more likely to be in paid work. Between2010 and 2020, the State Pension Age for women will rise progressively from 60 to 65 years. This fora group with participation rates below one in every three, at present
1.1.2 European comparisons
Vlasblom and Nekkers (2001) used the various European Labour Force Surveys to investigate rates ofworking among older workers in the EU. Their results tend to place the UK as having above-averagerates of working for those in their sixties and early seventies. Rates of men continuing in paid workwere highest in Portugal, Ireland and Greece, followed by the Scandinavian countries, and then theUK (Figure 1.3). This pattern probably reflects high rates of self-employment and agriculturalemployment for the top group of countries. It also reflects relatively high pension ages and generallyhigh employment rates for the next group. The central European countries have long-establishedrelatively generous state pension provision, relatively low retirement ages, and (the Netherlandsaside) limited non-state pensions. They also have the lowest rates of employment among older men(aged 65+).
By way of comparison, in the USA around 30 per cent of men aged 65-69 are in paid work (matchedonly by Portugal in the EU), as were 18 per cent of men aged 70-74 (ahead of all the EU countries).
Figure 1.3 Comparative activity rates (1997, men)2
2 Figure for Denmark, men aged 70-74, not available.
Introduction

8
A similar picture for women, for ages five years younger, is shown in Figure 1.4. A number of the samepoints apply. It is the southern European countries that have high rates of employment, but leadingthe table this time are some of the Nordic countries (Sweden, Finland) – with the UK again with higheractivity rates than the EU average. For women, it is probably gender equality characteristics thatdetermine the top of the graph, though with similar effects of a relatively large agricultural labourforce on higher rates of activity in Southern Europe. Countries with long histories of state earnings-related pensions have the lowest rates of participation.
Figure 1.4 Comparative activity rates (1997, women)
Figures for the United States show 40 per cent of women aged 60-64 in paid work (bettered only bySweden from the EU), and 19 per cent of women aged 65-69 (ahead of all EU).
1.1.3 Reasons for declining rates of work among older people
In the last 20 years, the employment prospects of older people (aged 50 and above, as well as thoseabove SPA) have undergone a number of changes. One half of all men and one third of women nowretire before State Pension Age (Disney et al., 1997).
There are a number of different reasons for the declining labour market participation of older groups.Particular weight has been attached by some studies to the role of the social security system, with astrong correspondence being noted between the age at which benefits are available and departurefrom the labour force (Blundell and Johnson, 1999). Others have argued that occupational pensionprovision for the better-off is important in financing early labour market departure (McKay andMiddleton, 1998; Lissenburgh and Smeaton, 2001). It is likely that as people become generallybetter-off, they will want to spend a greater proportion of their time in leisure rather thanemployment. A range of other factors may link low rates of participation of older people to a morerapidly changing labour market in general.
However, at present there is little in-depth or explanatory research about the labour marketparticipation of the post-SPA population. There are good reasons for finding out more about thisgroup and their labour market attachment. Where movement into retirement is not freely chosen, itis frequently experienced in terms of tension, loss, reluctance, and even failure (Phillipson, 1993),particularly where individuals have developed a strong attachment to their occupational role. Older
Introduction

9
people who have taken up ‘bridge’ employment in the interim between withdrawing from full-timepositions and permanently ceasing to participate in paid labour, have found it to be particularlyhelpful in easing their transitions into retirement (Atchley, 1989). However, at present the scale ofsuch jobs appears to be small. Flexible retirement would allow for a period of psychological andfinancial adjustment and may prevent the onset of ill health. Such a benefit may be attractive to aconsiderable proportion of the population in retirement were opportunities made available but notcompulsory.
When people are less likely to work up until State Pension Age, those working still later become aneven more select group. One of the main questions addressed is how far decisions to work post-SPAmay be considered in a positive light, and how far they are instead a reluctant, constrained choice.
1.2 The study
1.2.1 Aims
The primary aim of this study is to further understanding of the factors affecting the labour marketparticipation of older people at, and particularly after, State Pension Age (SPA). The main questionsarising are:
• Under what circumstances do individuals work past SPA?
• What sort of jobs do they have?
• What impact does working post-SPA have upon the wealth, health and happiness of the workingcompared with the non-working retired population?
1.2.2 Data and methods
The project is based on secondary analysis of three existing large national datasets.
1 Cross-sectional analysis of the Labour Force Survey, to establish some of the main statistics onrates of economic activity, using the largest possible sample. Data is taken from 2000 and 2001.
2 Detailed cross-sectional analysis of the Family Resources Survey, drawing on its rich data onincomes, household arrangements and pensions. The dataset analysed is based on combingdata from 1997/98, 1998/99 and 1999/2000 (the three most recently available years of data atthe time of analysis).
3 Panel analysis of waves 1-10 from the British Household Panel Study. (i.e. covering data from1991 to 2000/013).
The analysis deploys a range of different analytical methods. Many of the information requirementsmay be met by providing descriptive analysis of various kinds – such as cross-tabulations and tablesof averages. Much of this analysis compares workers with non-workers, across the age range fromState Pension Age upwards. This forms the first stage of the analysis. Second, multivariate methodsare used to investigate the main outcome of interest. Since the main outcome is whether in paid workor not, a logistic method of regression is most appropriate. This estimates the independent effects ofa range of variables of working after State Pension Age, controlling for the effects of the other factorsincluded – such as age. Third, a range of different kinds of panel analysis is possible using the data totrack individuals in the BHPS over ten years from 1991 to 2000.
3 Each year, interviews start in the Autumn and end by Spring the following calendar year. However, mostinterviews are completed prior to Christmas each year.
Introduction

10
1.2.3 Plan of report
This report contains four main chapters:
• Chapter 2 looks at which groups continue to work post-SPA, and how these compare to non-workers. A combination of tabular and modelling approaches is used to effectively ‘predict’ thelikelihood that people work after SPA.
• Chapter 3 describes the kinds of jobs people have post-SPA. This includes analysis of wagelevels, occupation, industry, employment contracts, and so on.
• Chapter 4 is an analysis of the longer-term antecedents of working post-SPA. It uses panel datato try to differentiate those who stop working, and continue to work, post-SPA.
• Chapter 5 analyses some of the apparent effects of remaining in work. This includes analysis ofhealth outcomes, savings, and so on.
The report then concludes.
1.3 Central themes
There are a number of themes that run through the analysis presented in this report. The mostimportant is an attempt to focus on the different motivations behind people working past StatePension Age.
It is all the more difficult for people to work past State Pension Age if they drop out of the labour forceprior to that. Returns from inactivity and unemployment are progressively more difficult at older ages(McKay and Middleton 1998). Therefore, already the group of interest – those working after SPA - isselected from a distinct, and declining, group. Those who are ‘lost’ to employment prior to SPA aredrawn from the lowest paid, and those with better pay and good occupational pension provision.This suggests that those working at SPA may be rather untypical. Mostly they can be expected to havebelow-average income, but without being the lowest paid, who have already left the labour marketin large numbers. Some may be on above-average earnings – but perhaps lacking the kind ofoccupational pension provision often associated with being on higher earnings.
Self-employment is also expected to feature strongly. The proportion of workers who are self-employed is much higher among those working beyond State Pension Age, than below it. Someprevious research (McKay and Middleton 1998) has attributed this to later retirement among theself-employed, rather than to any large-scale tendency for employees to shift to self-employment atthis age.
The willingness and ability of people to keep working will depend on various factors. These includetheir own state of health, and perhaps the situations of those around them, their ability to find anemployer who will employ them, or to continue working for their existing firm. This may be easier forthe self-employed, who do not face the same kind of potential company policy towards a fixed ageof retirement. There is no legislation regarding age discrimination at present, and such laws may haveincreased rates of work among older people in the US (Neumark 2001), and possibly more widely(Hornstein 2001) – though the evidence is not uncontroversial.
In the analysis, three different reasons are highlighted for why individuals may be remaining in paidwork beyond State Pension Age. These are joint retirement, work satisfaction, and maintenance ofliving standards.
Introduction

11
The first reason for working after SPA, perhaps particularly important for women, is the possibilitythat men and women in couples want to retire at the same time. If a husband is two years’ older thanhis wife, the couple might decide to both retire at (say) 64 and 62. This would be beyond SPA for thewoman, and below it for the man. Given such age gaps, and indeed couples with women older thantheir partners, then to retire at a similar point in time will require one or other to retire before or aftertheir respective State Pension Age.
The second area is that of fulfilling employment. Some older workers appear to derive considerablesatisfaction from their employment, it may be an important part of their identity, and contribute toa positive outlook. There is evidence of this factor from looking at high levels of job satisfactionamong older workers, and a reluctance to leave work.
The third area considered is people working to improve their financial circumstances in retirement.This may be to avoid low income when work ends, but working for financial reasons is not necessarilyto avoid poverty. Many of the poorest post-SPA are likely to be those who left the labour market,through unemployment or ill health, before SPA, sometimes labour market exit can occur well beforeSPA. Those working post-SPA may think they have insufficient non-state income, or existingcommitments they would like to clear before making the probably irrevocable decision to end work.There is evidence of this in the high rate of saving of this group, and the lower than average receiptof occupational pensions.
1.4 Numbers of older people: future trends
It is well-known that Great Britain, in common with other developed nations, now has an ageingpopulation. As a result of the ‘baby boom’ generation reaching retirement, lower fertility andincreases in life expectancy, the average age is rising. An increasing proportion of the population willbe found in the older age group, and numbers in these groups are now inexorably rising (Figures 1.5and 1.6). The rates of employment among these groups will therefore be increasingly important forthe numbers of people in work overall.
It has already been mentioned that the State Pension Age for women begins to rise in 2010, reaching65 by 2020, which will then make it equal to that of men. This offsets some of the pension spendingimplications of population ageing.
These two charts show a strong projected increase in the number of people who will be aged 70 orolder as the 21st century unfolds. The numbers aged 65-69 are also expected to rise, but by lowernumbers each year.
Introduction

12
Figure 1.5 Future growth of older age group (men)
Figure 1.6 Future growth of older age group (women)
Introduction
13
2 The work decision
2.1 Introduction
This chapter begins with an assessment of the relevance of age and gender in affecting the tendencyto work post State Pension Age (SPA). As discussed in the introduction, the chapter is also designed toassess the extent to which the employment choice is motivated by ‘poverty push’ or ‘living standardmaintenance’ considerations. To this end, the wealth and non-earned income of working and non-working groups will be compared. Are those continuing in work concentrated in low-income and lowsavings categories?
Other factors that enter the work decision include a desire for company, health problems affectingability to work and household circumstances, including a partner’s employment status and caringresponsibilities. Together these elements of choice constitute the supply factors that influence labourforce participation. In terms of the demand for older workers, regional differences in economicconditions will impact upon employment levels at all ages. The relationship between propensity towork, region of residence and regional unemployment levels is therefore also examined.
Bivariate and multivariate analytical methods are deployed throughout the chapter to build up apicture of the circumstances associated with working, or refraining from labour market participation,among the post-SPA population.
2.2 Male and female participation rates
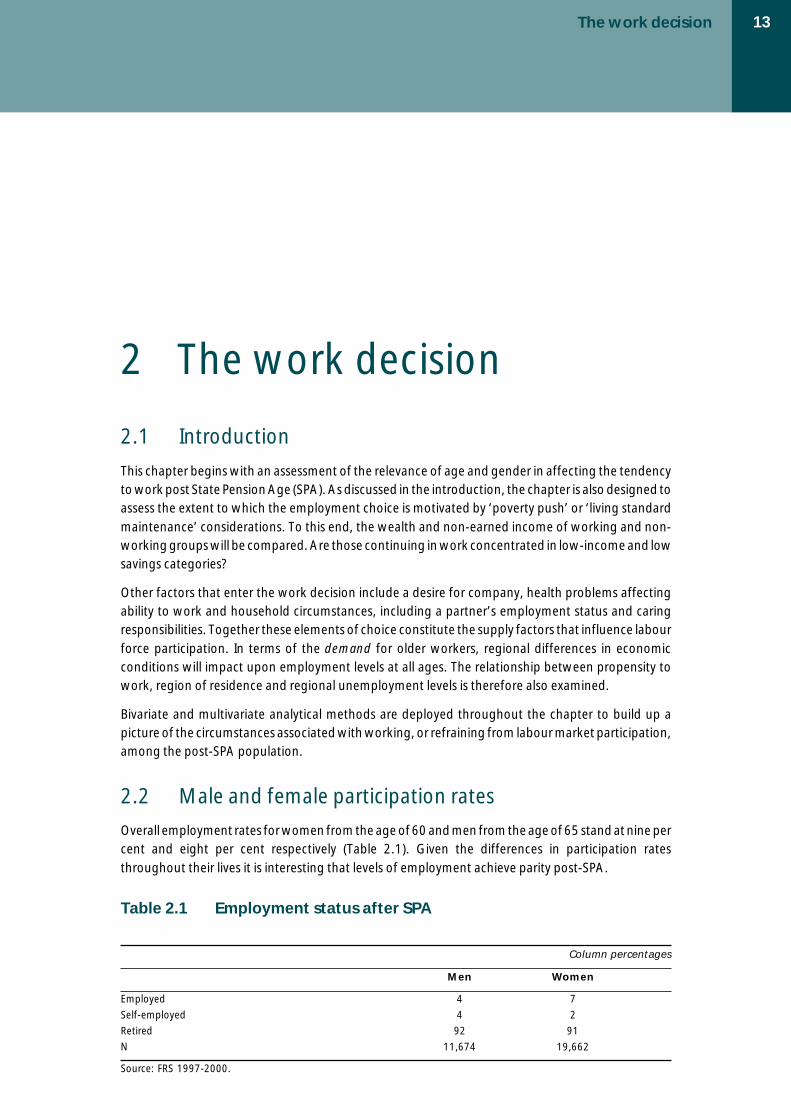
Overall employment rates for women from the age of 60 and men from the age of 65 stand at nine percent and eight per cent respectively (Table 2.1). Given the differences in participation ratesthroughout their lives it is interesting that levels of employment achieve parity post-SPA.
Table 2.1 Employment status after SPA
Column percentages
Men Women
Employed 4 7
Self-employed 4 2
Retired 92 91
N 11,674 19,662
Source: FRS 1997-2000.
The work decision
14
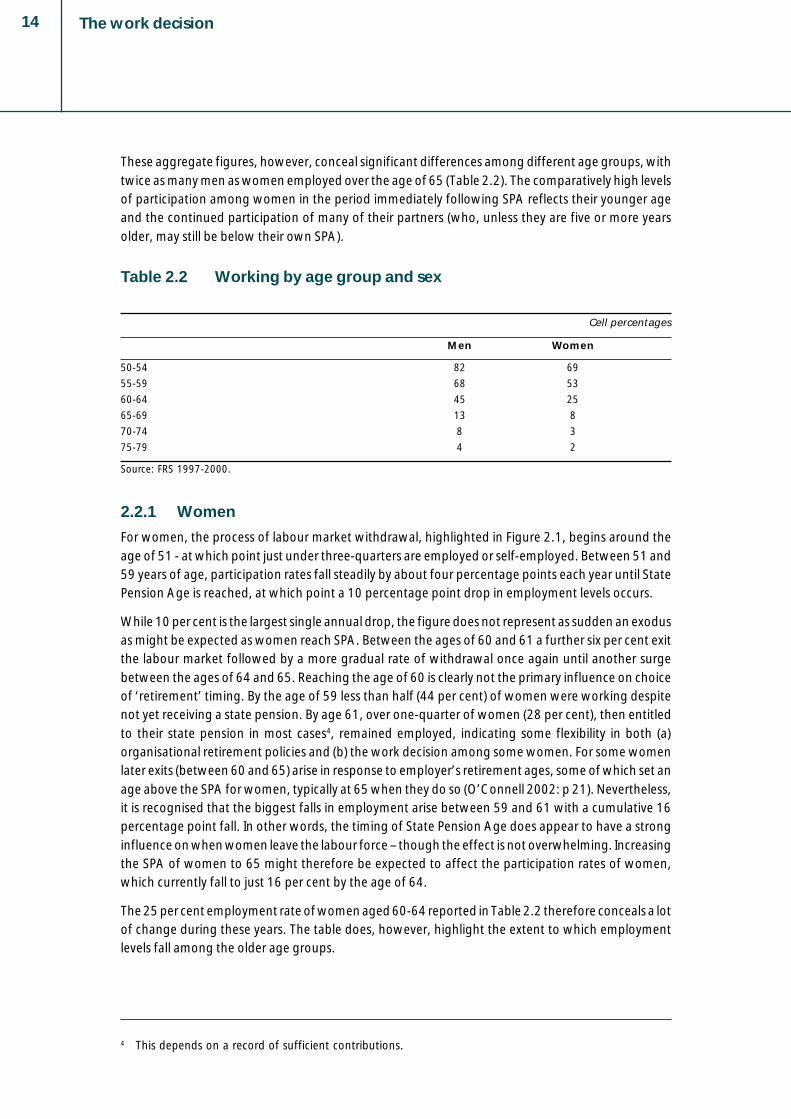
These aggregate figures, however, conceal significant differences among different age groups, withtwice as many men as women employed over the age of 65 (Table 2.2). The comparatively high levelsof participation among women in the period immediately following SPA reflects their younger ageand the continued participation of many of their partners (who, unless they are five or more yearsolder, may still be below their own SPA).
Table 2.2 Working by age group and sex
Cell percentages
Men Women
50-54 82 69
55-59 68 53
60-64 45 25
65-69 13 8
70-74 8 3
75-79 4 2
Source: FRS 1997-2000.
2.2.1 Women
For women, the process of labour market withdrawal, highlighted in Figure 2.1, begins around theage of 51 - at which point just under three-quarters are employed or self-employed. Between 51 and59 years of age, participation rates fall steadily by about four percentage points each year until StatePension Age is reached, at which point a 10 percentage point drop in employment levels occurs.
While 10 per cent is the largest single annual drop, the figure does not represent as sudden an exodusas might be expected as women reach SPA. Between the ages of 60 and 61 a further six per cent exitthe labour market followed by a more gradual rate of withdrawal once again until another surgebetween the ages of 64 and 65. Reaching the age of 60 is clearly not the primary influence on choiceof ‘retirement’ timing. By the age of 59 less than half (44 per cent) of women were working despitenot yet receiving a state pension. By age 61, over one-quarter of women (28 per cent), then entitledto their state pension in most cases4, remained employed, indicating some flexibility in both (a)organisational retirement policies and (b) the work decision among some women. For some womenlater exits (between 60 and 65) arise in response to employer’s retirement ages, some of which set anage above the SPA for women, typically at 65 when they do so (O’Connell 2002: p 21). Nevertheless,it is recognised that the biggest falls in employment arise between 59 and 61 with a cumulative 16percentage point fall. In other words, the timing of State Pension Age does appear to have a stronginfluence on when women leave the labour force – though the effect is not overwhelming. Increasingthe SPA of women to 65 might therefore be expected to affect the participation rates of women,which currently fall to just 16 per cent by the age of 64.
The 25 per cent employment rate of women aged 60-64 reported in Table 2.2 therefore conceals a lotof change during these years. The table does, however, highlight the extent to which employmentlevels fall among the older age groups.
4 This depends on a record of sufficient contributions.
The work decision

15
Figure 2.1 Proportion of men and women employed or self-employedby age: 2001
2.2.2 Men
While, for women, reaching State Pension Age is associated with only a 10 percentage point drop inemployment levels, for men there is a 17 per cent decline in participation rates. Reaching SPA wouldappear to be more significant for men than women, albeit five years later. Other ages which exhibitraised exit rates for men are between 54 and 55 (six per cent exiting), 59-60 (six per cent exiting) and60-61 (seven per cent exiting). At these junctures access to occupational pensions may becomeavailable, reflecting the choice of an early retirement age. Research by Campbell (1999) indicates thatearly retirement is the preferred choice among many higher earning groups with occupationalpensions, which might be expected to ensure a good standard of living during retirement years. Manyof these early exits may also, however, reflect redundancy policies that target older workers as victimsof organisational downsizing, and potential declines in health.
2.3 Poverty push or living standard maintenance?
In assessing the importance of financial considerations to the decision-making process, five factorsare considered; marital status, housing tenure, the significance of earnings to weekly householdbudgets, educational qualifications and health. The first two have a direct impact upon disposableincome while the value of earnings indicates the financial significance of a salary in comparison toother income sources such as occupational and state pensions. Qualifications and health statusprovide some guide to the capacity and opportunity for older people to work.
2.3.1 Marital status
Marital status is an interesting and ambiguous variable as both social and financial welfare issuesapply. It is difficult to establish the relative weights of each of these influences on the work decisionbut clues do arise from the distinct responses of men and women to common marital states. Table 2.3outlines the proportion of men and women who are working among those of various different maritalstates. Widows and single people were the least likely to work. Among women, being married
The work decision

16
enhanced the participation rates possibly due to the practice of some working women coincidingtheir retirement with that of their partners.’ However, the participation rates of married women areexceeded by the participation rates of women who are separated or divorced. These women areplausibly motivated by social factors (e.g. a desire to leave the house and meet people) as well asfinancial factors (family budgets are often affected by couples splitting up).
Being separated or divorced was also associated with the highest participation rates among men, butthe difference from the norm was rather less than among women. Under these circumstanceswomen’s finances are inevitably squeezed with a widely recognised risk of poverty among womenpreviously financially dependent upon male partners (Dunnell, 2001). It is therefore of interest thatdivorced men do not experience the same enhanced participation rates as women; their financial andpension circumstances are not compromised to the same extent as those of female divorcees.
Table 2.3 Proportion of post-SPA respondents working bymarital status
Cell percentages
Men Women
Single, never married 6 7
Married, living with partner 8 11
Married, separated 12 14
Divorced 12 16
Widowed 3 4
All states 7 8
Source: LFS 2000-2001.
Housing tenure
The financial commitments associated with housing tenure provide a clear indication that pecuniarymotivations are significant in the decision-making process about remaining in paid work (Table 2.4).The groups of both men and women with the highest probability of labour market participation arethose with outstanding mortgages on their properties. Having an outstanding mortgage is associatedwith age – 16 per cent of SPA men below 70 and women below 65 are still buying their properties. Thisfigure drops to 6 per cent of men 70+ and women 65+. Those renting are the least likely to workwhich may be reflecting generally lower rates of employment among tenants, or perhaps increasedaccess to Housing Benefit among those of pension age.
Table 2.4 Proportion of post-SPA respondents working by housingtenure
Cell percentages
Men Women
Own outright 7 8
Buying with mortgage 12 22
Part rent part mortgage 8 4
Renting 4 4
Rent free 6 5
All states 7 8
Source: LFS 2000-2001.
The work decision

17
2.3.2 The contribution of earnings to weekly incomes
Developing the idea that financial concerns feature highly in the decision to continue working afterpensionable age, Table 2.5 provides information relating to the significance of earnings to individualbudgets.
Table 2.5 What percentage of total weekly income do earningsrepresent?
Cell percentages
Average Unweighted base
Employees1
All men 42 401
Full-time men 63 104
Part-time men 35 297
All women 60 1265
Full-time women 78 364
Part-time women 53 901
Self-employed2
All men 45 332
Full-time men 58 140
Part-time men 31 202
All women 51 205
Full-time women 60 64
Part-time women 43 146
Source: FRS 1997-20001 130 employees (2% of total) received zero earnings last week. These are excluded from analyses.2 45 self-employed (6% of total) earned zero or made a loss, these are excluded from presented analyses.
Their inclusion depresses percentages by 1% - 3%.
On average, continuing to work and earn a wage or salary makes a considerable difference to theweekly income of men and women whether employed or self-employed. Earnings typicallyconstituted around 40 per cent of the weekly income of men, rising to around 60 per cent for full-timers and falling to a third among men working part-time.
Compared with men, women made a more substantial contribution to weekly budgets by working.Their earnings represented nearly two-thirds of total income (up to three-quarters for womenworking full-time and half for women working part-time). Employment earnings therefore provide animportant source of income for those choosing to remain in the workforce after pensionable age.
The contribution of earnings to total weekly income among self-employed men reflect those of theiremployed counterparts. Income from working among self-employed women does not represent ashigh a proportion of total receipts compared with employed women but remains high nevertheless at50 per cent on average.
Another way of presenting the gains from employment is simply to compare the weekly incomes ofthe working and non-working population (Table 2.6). The differences are stark, in keeping with theresults from Table 2.5, it is apparent that incomes double for labour market participants. Thedifferences between working men and women are largely attributable to the greater proportion of
The work decision

18
women working part-time (56 per cent compared with 32 per cent of men). The differences betweennon-working men and women are explained, in part, by the smaller proportion of women in receiptof an occupational pension (25 per cent compared with 67 per cent of men).
Table 2.6 Total weekly income among the working and non-working
£ per week
Average Income +/-1 N
All over SPA £154.06 £1.85 31329
Working men £401.66 £36.85 901
Working women £211.69 £8.30 1667
Non-working men £191.44 £3.07 10771
Non-working women £113.94 £1.33 17990
1 Confidence interval
Source: FRS 1997-2000
There are clear financial benefits associated with working for most people beyond retirement age. Itshould be noted however that the earnings potential of the in-work and out-of-work groups may bedifferent. Heightened earnings power may explain, in part, the decision to continue working, with aperception that it is financially worthwhile and effort adequately rewarded. Despite the apparentfinancial advantages of working, a diminishing proportion of older people pursued this option. Acomplex web of demand and supply obstacles and disincentives would appear to be depressingparticipation rates.
In addition to the individual level analyses presented in Tables 2.5 and 2.6, household level data is alsoprovided in Table 2.7.
Table 2.7 Average earnings as a percentage of average weeklyhousehold income
Employed Earnings as a
respondents Total household Earned percentage of
income income total income Base
All workers £492 £177 36% 2568
Married (or cohabiting) £554 £196 35% 1875
Single £316 £126 40% 690
Source: FRS 1997-2000.
The total household income of married respondents is just 43 per cent higher than their non-marriedcounterparts, reflecting in part the reduced state pension awarded to couples whose costs arepresumed to be lower due to economies associated with the sharing of resources and collectivepurchasing or consumption. As a result of the higher total household income of couples, thecontribution of earnings to this total budget is lower compared with the earnings contribution of asingle person. Hence married respondents boost household income by working to the tune of 35 percent compared with 43 per cent by single workers.
A further factor associated with working among the SPA population was occupational pensionreceipt. Forty per cent of the non-workers received an occupational pension, a figure that fell to 33 percent among workers. However, the association between working and lower levels of occupational
The work decision

19
pension receipt is confined to men. About one-quarter of women received an occupational pensionregardless of whether they worked. Among the men, 67 per cent of non workers had an occupationalpension compared with 53 per cent of the working men (Table 2.8).
This difference could be reflecting the link between working post-SPA and a perceived lack of privateprovision (or a shortfall in private provision). Many of those with good occupational pensions leavework before SPA. Some of those remaining may be attempting to secure private provision of otherkinds, such as through additional saving (as discussed in Chapter 5).
Table 2.8 Receipt of occupational pension by employment status
Cell percentages
Workers Non-workers
Men 53 67
Women 22 25
Source: FRS 1997-2000.
There were also small differences in the proportions of working and non-working women claimingtheir state pension, though these did not apply to men, 97 per cent of whom received a state pension.Some 94 per cent of non-working women received a state pension compared with 85 per cent ofworking women. This latter group could have been deferring receipt, which increases the stateentitlement by seven per cent each year. Alternatively they might not have been entitled to a statepension in their own right. For some women, inadequate National Insurance contributions throughouttheir working lives denies them a full state pension, including some who may have taken the ‘marriedwomen’s option’ prior to 1978. Home Responsibilities Protection was introduced after 1978, andreduces the years of contributions needed for a pension for those with caring responsibilities, butmany current pensioners still have large gaps in their contributions.
2.3.3 Educational qualifications
Campbell (1999) has indicated that those stopping work prior to SPA are disproportionately drawnfrom the less well-qualified, plus some from those with good occupational provision. Overall, havinghigher educational qualifications was associated with working past SPA, and having none wasassociated with leaving work.
As Table 2.9 illustrates, among men with degree-level qualifications, 28 per cent were in paid workand among those with O-levels as their highest qualification, 19 per cent worked. This is comparedwith just six per cent of those with no qualifications. The next column of the table looks at the profileof workers, and reflects the distribution of qualifications in the older population as a whole. Despitea low rate of working among men without qualifications, still 49 per cent of men working past SPAhad no qualifications, compared with 17 per cent of whom who were graduates.
Among women, it was again true that those with no academic qualifications were the group leastlikely to work (six per cent). Despite this, just over half the women (52 per cent) working past SPA hadno qualifications, whilst over one-quarter (28 per cent) had qualifications not beyond O-level grade Cstandard.
The work decision

20
Table 2.9 Rates of working by highest academic qualification:above SPA
Cell and column percentages
Men Women
Per cent Per cent of Per cent Per cent of
working all workers working all workers
(cell %) (col %) (cell %) (col %)
Degree 28 17 14 5
HNC, HND 10 9 7 4
A-level 7 6 18 10
O-level 10 19 15 28
None 6 49 6 52
Total 1,137 100% 1,857 100%
N=77 N=138
Source: BHPS wave 10. Var jQFACHI
2.3.4 Health status
There was a strong link between people’s perceptions of their health, and the likelihood that theywere in paid work after State Pension Age. Some 15 per cent of men and 14 per cent of women with‘excellent’ health were in paid work, post-SPA, compared with nine per cent for both sexes with goodhealth, and no-one working with health described as being ‘very poor’ (Table 2.10).
Table 2.10 Work by health status: those above SPA
Cell percentages
Excellent Good Fair Poor Very poor Total
Per cent in paid work
Men 15 9 4 5 0 8
Women 14 9 6 4 0 8
Unweighted bases
Men 157 490 378 129 59 1137
Women 242 829 656 275 116 1857
Source: BHPS wave 10. Var jHLSTAT
2.4 Household circumstancesIt is well documented (Gustman & Steinmeier, 2000, Shaw, 1984, Hurd, 1988) that men and womenoften arrange to coincide their retirement dates. Because most women are younger than theirpartners and among older generations male partners’ jobs command higher salaries, male retirementusually dictates the timing of joint exits. The coincidence of retirement arises from mutual leisureinterests and greater enjoyment of retirement status in the company of one’s spouse.
Table 2.11 supports these findings. 41 per cent of post-SPA working men had working partnerscompared with just eight per cent of non-working men. A number of these men will have wives underpensionable age thereby explaining the fairly high participation rates of these women. Restricting thesample to both men and partners above pensionable age still yields a 33 per cent participation rateamong the female partners.
The work decision

21
Among working women, 55 per cent of their partners were also working, down to 35 per centselecting on both partners being of SPA. Just 11 per cent of non-working women had partners atwork. Clearly a large proportion of men and women chose to continue working for as long as theirpartners remained in the labour market. These and other issues are discussed in more detail in Section4.2.1.
Table 2.11 The relationship between working and partner’s status
Cell percentages
Per cent of partners working
Men (partners above and below1 SPA)
Working 41
Not working 8
Men (partners above SPA)
Working 33
Not working 5
Women (partners above and below SPA)
Working2 55
Not working 11
Women (partners above SPA)
Working2 35
Not working 6
Men and women
Working 49
Not working 9
1 19% of working men had wives below SPA.2 50% of working women had husbands below SPA.
Source: FRS 1997-2000.
2.4.1 Equalising State Pension Ages
Actual age and SPA are just two of a wide range of factors that influence the retirement decision.Raising the SPA will have an impact – the availability of state pensions does seem to trigger significantdrops in labour force participations - but access to personal and occupational pensions also has a largeeffect. The extent to which control over access to occupational pensions can be exercised will alsohave a strong bearing on retirement practices.
The average age difference between partners, coupled with the common practice of coincidingretirement dates, will militate against policies designed to achieve an equalised age of retirement forboth men and women at 65 (or at any other equal age, such as the 67 years recently recommendedby IPPR researchers). Focusing on the equalisation of pension ages at 65, to be achieved by the year2020, according to current trends it is likely that women would exit a few years below their StatePension Age as their male partners reach SPA. Alternatively, men may continue to work a little longer.Currently, as discussed in Section 2.1, one-quarter of women in the five year period after SPAcontinued to work, largely due to (a) their younger age and presumably continuing good health, (b)the fact that many of their partners are also working and (c) for some, the higher female retirementage found in some organisations5. Inevitably, health considerations will become increasingly salient as
5 Nearly one third of women remaining in work after the age of 60 claim organisational policies towardwomen’s retirement age are responsible (Disney et al., 1997).
The work decision

22
the SPA is pushed upwards and policies will therefore need to be sensitive to the needs of differentgroups to avoid penalising those with health disadvantages.
2.4.2 Caring
Childcare responsibilities are not discussed in this report as only a handful of respondents claim toperform childcare duties. However, there is some evidence that grandparents often assume caringroles for their grandchildren (Disney, 1997).
Caring for other adults is of relevance, although still performed by small proportions of the post-SPAcommunity. Table 2.12 indicates that only 6.2 per cent of men and 5.2 per cent of women assumecaring responsibilities for another adult.
Table 2.12 Proportions of men and women with adult caring roles
Column percentages
Men Women
Non-carers 93.8 94.8
Care 1-9 hours 2.5 2
Care 10+ hours 3.7 3.2
Total 100% 100%
N 11674 19662
Source: FRS 1997-2000.
There remains, however, an issue relating to causality, it is unclear whether, in the absence of workcommitments, individuals chose to assume a caring role which could possibly be taken on by anotherperson. Alternatively, it may be that caring responsibilities prevent the search for, or continuation of,employment.
Finch and Mason (1993) suggest that caring roles are frequently accompanied by a sense of duty andobligation and effectively limit the scope of carers to pursue preferred activities including paidemployment. Regardless of causal direction, there remains an association between caring andworking with non-carers more than twice as likely to work compared with those caring for 10 hoursor more per week (Table 2.13).
Table 2.13 Participation rates by caring responsibilities
Cell percentages
Percentage working
Non carers 9
Carers 1-9 hours per week 7
Carers 10+ hours per week 4
Source: FRS 1997-2000.
The work decision

23
2.5 The demand for older workers
Most of the preceding analysis has examined the characteristics of older workers and non-workers.This might be regarded as representing the ‘supply-side’ of the equation. However, rates of workingwill also reflect the demand-side and this is now examined.
The demand for labour in particular regions transcends simple unemployment levels and depends alsoupon the mix of manufacturing and services and large and small companies. Since the late 70s,various structural changes have affected the composition of the British labour force, erecting barriersand producing opportunities with implications for older workers. A well documented contraction ofthe manufacturing base has been accompanied by an expansion of the service sector, although theshrinking employment share of those aged over 50 and beyond SPA has taken place in both growingand declining industries (Campbell, 1999, Kohli, 1991). However, service sector employers generallyexhibit a more positive orientation toward older workers, which may increase the range ofemployment opportunities for this group (Taylor & Walker, 1994).
In terms of company size, Chapter 3 reveals that workers over SPA are twice as likely as other agegroups to be employed in smaller companies with 1-10 staff. They are also far less likely to beemployed in organisations with over 50 staff. This distribution may reflect the greater informality ofsmall companies, which are far less likely to provide occupational pension schemes and are less likelyto impose specific ages for retirement. The ratio of large to small firms also bears upon opportunitiesfor self employment which is often pursued by older workers (Smeaton 1992, Lissenburgh &Smeaton 2001). Regions with high numbers of small firms, which provide a good ‘incubator’environment are positively related to self-employment (Storey, 1982, Quince, 1985) as are rurallocations (Keeble & Wever 1986, Gudgin & Fothergill 1984).
Aggregate unemployment levels will reflect overall demand for labour including those over StatePension Age. Also, to the extent that older people are lower down the ‘labour queue’ (Reskin & Roos,1990) - a queue in which employers rank employees in order of preference - as unemployment levelsrise and markets become looser post-SPA employment will fall.
A simple bivariate analysis, presented as Table 2.13, suggests that participation rates after SPA are notstrongly associated with regional unemployment levels. The highest levels of post-SPA employmentfor example are to be found in London, especially Inner London and the South East. Yet Inner Londonhas unemployment levels of seven per cent, three percentage points higher than the nationalaverage. High unemployment levels elsewhere such as Tyne & Wear are associated with depressedparticipation rates. Both region and unemployment rates will be included within the multivariatemodels which follow.
The work decision

24
Table 2.14 Proportion of post-SPA respondents working by region
Cell percentages
Percentage Percentage
working unemployed
post-SPA (all ages)
Tyne & Wear 4 7
Rest of Northern Region 5 6
South Yorkshire 6 5
West Yorkshire 7 4
Rest of Yorkshire & Humberside 6 4
East Midlands 7 4
East Anglia 8 3
Inner London 11 7
Outer London 9 4
Rest of South East 11 3
South West 9 3
West Midlands (metropolitan) 7 6
Rest of West Midlands 8 3
Greater Manchester 7 4
Merseyside 5 6
Rest of North West 7 3
Wales 7 4
Strathclyde 4 6
Rest of Scotland 7 4
Northern Ireland 7 6
All regions 8 4
Source: LFS 2000-2001.
2.6 Multivariate analyses: pulling the picture together
Bivariate (‘two way’) analyses, discussed earlier in the chapter, indicated the salience of increasingage, marital status, housing tenure, partner’s status, caring responsibilities and, to some extent,region of residence, in the probability of working beyond pensionable age. In order to assess thesignificance of these variables, controlling for other explanatory factors, a number of logisticregressions were performed. The models use ‘working’ as the dependent variable, which assumes avalue of 0 if the respondent is not working and 1 if they do have a job. Appendix A provides furthertechnical details of the modelling conducted, and more detailed results.
Examination of the model presented in Table A.1 finds that despite women, on aggregate, beingmore likely to work than men (eight per cent compared with seven per cent), controlling for age theirodds of working are reduced by more than one-half. Unsurprisingly ageing was also significantlyassociated with lower working probabilities while good health enhances the odds of participation.
Consistent with the bivariate findings reported above, devoting time to the care of other adults has anegative effect on participation rates. Caring for 1-9 hours a week reduces the likelihood of workingby one-quarter while caring for 10+ hours a week halves the odds of paid employment.
The housing tenure variable produces few surprises. Compared with owning a home outright, havingan outstanding mortgage multiplies the odds of working by a factor of nearly 2. Rent-free tenants aresomething of an anomaly though, with more than double the odds of working. This may be explained
The work decision

25
by ‘tied accommodation’ whereby free housing is provided as part of a job. The FRS unfortunatelydoes not provide adequate detail to allow confirmation of this supposition.
In terms of marital status, the divorced and separated exhibit enhanced odds of working comparedwith the married/cohabiting group. Disaggregation by gender however, reveals that marital status isnot important for men. It is only among women that labour market engagement is increased whencouples separate or divorce. Their odds of working nearly double (see Table A.2, models 1 and 2). Asdiscussed earlier however, it is not immediately obvious whether a marriage breakdown encouragesemployment primarily as a means of developing one’s social life or in response to financial hardship.Given that the marital status / working relationship only holds for women it is probable that financialdifficulties are the prime motivator as marriage dissolution has a greater economic impact uponwomen than men.
The role of family savings, individual total weekly income and receipt of an occupational pension shedfurther light on the centrality of financial considerations in the decision to work beyond pensionableage. Compared with individuals with family savings of £8,000-£20,000, no other savings groups weresignificantly more or less likely to work apart from those with savings with a value of less than £1,500.33 per cent of the total sample have savings below £1,500 and this group are roughly one-quarter lesslikely to work than those with higher savings levels. It would appear that those with the greatestfinancial need are the least likely to work despite controlling for education and health levels.Individuals with low income and savings below £8,000 are entitled to Income Support or other means-tested benefits. Returning to work and receiving a salary risks compromising these entitlements,which may therefore act as a disincentive to job search activity. However, benefit entitlement is onlypart of the story, individuals with savings under £1,500 are also likely to have lower earnings powerand fewer opportunities to engage with the labour market.
In contrast to savings, weekly non-earned income does exert some explanatory power over thedecision to work. Compared with ‘middle’ income groups which receive between £105-£200 perweek, being in a low income group which receives between £1 and £104 per week, multiplies theodds of economic activity by 1.6. Financial need would appear to be driving their decision to work. Ofinterest however, is the enhanced probability of working associated with the top of the income scale.Income in excess of £200 per week increases the probability of working by the same amount as low-income groups. These individuals appear to be seeking to maintain a given standard of living for aslong as possible without having to rely on savings. Alternatively, non-monetary drives are promotinga desire to continue working.
Receipt of an occupational pension can be expected to boost weekly income but widely varying valuesassociated with pensions render speculation on the association between pension receipt and workingdifficult. Table A.1 indicates that, on average, receiving a pension more than halved the odds ofworking post-SPA compared with individuals without an occupational pension. This finding lendssupport to the idea that workers are, to some extent, motivated by a need to offset potentially lowincomes once work ends.
Compared with men and women leaving full-time education between the ages of 15 and 18, leavingschool at 14 is negatively associated with working while remaining in education until at least 19 ispositively associated with working beyond SPA. The early leavers are more likely to have had careersin lower-skilled positions and have perhaps reached retirement age with fewer opportunitiesavailable to continue.
Higher unemployment levels are associated with a decreased chance of working. Compared withliving in the North East the following regions of residence increase the likelihood of employment; EastMidlands, East, London, South East and South West.
The work decision

26
Finally, compared with being white, Indian and Pakistani men and women have significantly reducedprobabilities of working beyond SPA.
It is apparent from models 1 and 2 in Table A.2 that the factors associated with working are broadlysimilar for men and women. There are a couple of exceptions however; marital status, discussedabove and family savings.
For men, savings between £8,000 and £20,000 are associated with the highest odds of working.Savings extremes of less than £1,500 and more than £20,000 significantly depress participation rates.Presumably for those with high savings ‘financial push’ motivations are less common. Benefitentitlements among low-income and low-savings groups will also act as a disincentive to work. Thesefindings are therefore in keeping with expectations.
For women, savings of less than £1,500 have the same lowering effect as for men but savings over£20,000 double their participation. It is possible that the value of ‘benefit unit’ savings is of greaterrelevance to the labour market activity of men than women. Using family level data relies on anassumption that the control and allocation of family resources is distributed evenly within the familyunit. Pahl (1990) however, asserts the need to recognise widespread conflicts and compromises overaccess to resources within households. A further factor that may lead women in better off families tocontinuing working relates to their potentially superior working terms and conditions, which havecontributed to higher savings levels. Better jobs tend to offer good occupational pensions. Womenwith occupational pensions may feel the need to continue working for longer in order to compensatefor years spent out of the labour market while raising a family as this allows pension contributions tobe extended and their ultimate value enhanced.
In models 3 and 4, which add the influence of a partner working, the caring variable fails to achievesignificance and, for women, receiving a low weekly income is no longer significant. For both men andwomen, the effect of having a partner at work is very large with their odds of working multiplied by6 and 5 respectively. Clearly, the employment status of partners represents the most important causalfactor in explaining labour market participation after retirement age regardless of gender.
Taken as a whole, the results tend to support the idea that for many SPA people, working is associatedwith financial hardship such as; the absence of an occupational pension, income below £100 for men,still paying a mortgage and, for women, being separated or divorced. Yet a certain level of advantagewould appear to be a prerequisite in terms of reasonable levels of education, more affluent regions ofresidence, good health and younger ages. Those in more extreme need with very low savings haveoften experienced a lifetime of disadvantage with attenuated employment opportunities leading toreliance upon state benefits, which in turn can function as an employment disincentive.
The work decision

27
3 Types of jobs
3.1 Introduction
This chapter seeks to examine the employment circumstances of the falling numbers of post-SPAworkers. Are the majority employed by the same organisations for which they worked prior toretirement age or do many find new employment opportunities? Under what contractual basis dothey secure work? Are some industries and occupations more likely to absorb or retain older workers?Similarly, is employment sector and company size important for such employment opportunities?Finally, the chapter also investigates the earnings commanded by post-SPA workers in comparisonwith younger groups. Are older workers ‘exploited’ in the sense of reduced earnings power?
3.2 New jobs or old
In order to construct policies designed to promote more flexible retirement trajectories it is necessaryto understand the labour market movements undertaken by older workers. The type of work pursuedwill depend upon motivations for working. For those wishing to sustain the challenge andresponsibilities of work, many of the casual opportunities most abundant in the service sector may notbe suitable. Similarly, for those motivated by financial need, lower paid elementary vacancies may berejected as below reservation wages. For these groups of people remaining with an employingorganisation offers the best prospect for longer-term labour market engagement. If forced to leavesuch jobs the likelihood of securing a new position with comparable terms and conditions is slim formen and women in their 60s. Changing jobs is frequently associated with, at least, a reduction inearnings. Gregg et al. (1999) identified a 25-35 per cent reduction in earnings levels among men over50 who were displaced from jobs.
Elsewhere, analyses of the costs associated with job loss reveal a worsening situation. Between theearly 80s and mid 90s, wage loss for men subsequent to unemployment has increased by 40 per cent,with high skill groups suffering the largest declines (Nickell et al 1999). Access to ‘primary labourmarket’ positions, characterised by promotion prospects, decent occupational benefits and goodconditions tend to be denied to older workers searching for jobs as ports of entry are restricted toyounger, initially cheaper recruits (Hirsch et al 2000). It is therefore necessary to acquire greaterunderstanding of the extent to which participation rates are facilitated or blocked by employers’policies toward retirement ages. Individuals may be more attracted to work opportunities if theirhourly earnings, status and conditions are maintained, which is mainly achieved by remaining with anemploying organisation. Therefore policies which attempt to encourage people back into the labour
Types of jobs

28 Types of jobs
market, having retired from a long-term employer, may prove difficult. Efforts are plausibly morelikely to succeed if directed towards the retention of pensionable age staff. Organisations as well asindividuals need to be provided with incentives and relevant pension legislation to develop flexibleterms and conditions that will promote delayed labour market exit.
This section aims to establish the proportions of men and women in work, both full and part-time,who maintain their employment relationships beyond SPA as opposed to acquiring new positionselsewhere. Table 3.1 indicates that three-quarters of men and women working after SPA were in jobsthey held prior to SPA. This proportion rises for full-time employees but for men working part-timedrops to a little over half, further research would be beneficial in explaining this result. Given thatmany, if not most, men and women prefer part-time working arrangements at this stage of their lives(see Tables 3.4 and 3.5) it is possible that part-time opportunities are not available to men wishing toremain with their pre-SPA employer. Instead, to continue working, it becomes necessary to seek newemployment. Given the difficulties associated with securing decent employment at older ages, jobsearch efforts for many among this group may prove futile, hence the dramatic decline in numbersemployed at this stage of life.
Table 3.1 Proportion of post-SPA workers employed in same job aspre-SPA
Cell percentages
Men Women
All 73 77
Full-time 83 91
Part-time 56 75
Self-employed 88 82
Source: LFS 2000-2001.
Twelve per cent of men and 18 per cent of women appeared to have initiated a new businesssubsequent to retiring (Table 3.1). It is possible that some of this group have remained with a previousemployer but having drawn their occupational pension are now employed on a new contractual basis,as consultants for example. A document published by The Cabinet Office Performance andInnovation Unit; ‘Winning the Generation Game’ urges the Inland Revenue and Department of SocialSecurity (as DWP then was) to review the rules associated with pension access while remaining withthe same employer. Current regulations permit such access to a pension only upon the departurefrom the employing organization with which the pension resides. This gives rise to the perversesituation of an individual leaving a job, collecting their pension and then becoming re-employed bythe same organisation on a contractual / consultancy basis, a practice which has become fairlywidespread (Preston 2000, Bone 2000).
3.3 Job characteristics
3.3.1 Employment contracts
This section examines the contractual basis of employment among older workers. As retirementapproaches, are SPA workers increasingly drawn to ‘non standard’ contracts such as fixed term,casual, part-time and self-employed positions? Comparisons with younger workers indicate theextent to which older workers increase their representation in such contracts, which are also

29
described as ‘bridge jobs’ suggesting employment positions that ease the transition between full-timepermanent work and full-time retirement. Sudden transitions between these states can causepsychological as well as financial adjustment difficulties. These can be smoothed by shifting, for aperiod of time, to new jobs possibly with fewer hours and/or responsibilities.
Table 3.2 presents figures that indicate the contractual basis of employment among the workingpopulation. The proportion of women working part-time increases fairly steadily but one-fifth remainworking on a full-time basis, a larger proportion than the 15 per cent of men, reflecting the youngerage at which women reach SPA. Figure 3.1 provides greater detail and shows a gradual upward trendin women working part-time from the age of 49 followed by a notably steeper incline from the age of59. Returning to Table 3.2, the preponderance of temporary contracts increases for post-SPA womenbut remains fairly low at nine per cent, while self-employment doubles, reaching 16 per cent. Self-employment levels are also displayed in Figure 3.2, which reveals fairly flat participation rates amongwomen, at under 10 per cent, until they reach the age of 60. At this point self-employment jumpsupward.
Table 3.2 Employment contract by age group: Men andwomen 2001
Column percentages
Men Women
25-49 50-64 65+ 25-49 50-59 60+
Full-time permanent 80 69 15 53 46 20
Part-time permanent 2 5 32 35 40 56
Temporary 4 4 10 6 5 9
Self-employed 15 22 44 7 9 16
Total (=100%) 31560 12921 1075 29162 9177 2120
Source: LFS, 2001. Base = all working.
Figure 3.1 Proportion of men and women working part-time by age
Types of jobs

30
The distribution among different types of employment for men was far more skewed than forwomen. The largest post-SPA group, at 44 per cent, were self-employed, double the number of 50-64 year old men (see Figure 3.2). The extent to which self-employment represents a free as opposedto constrained choice among older men, facing attenuated employment alternatives, cannot beascertained from the LFS or FRS. Evidence from alternative data sources, however, (Smeaton, 2002)suggest that entry into self-employment is increasingly an ‘unemployment push’ phenomenon,associated with redundancy and enforced early retirement packages, with a widespread beliefamong the self-employed that they are perceived as too old for available employment opportunities.Nevertheless, despite being pushed into this status, large proportions of the self-employed becomeconverted to the merits of independence and would not return to employment (Smeaton, 2002).They are also freer to continue working as long they wish, hence the preponderance of self-employment amongst pensionable age working men.
Figure 3.2 Proportion of men and women self-employed by age
Relatively few post-SPA men were employed under temporary contracts, although at 10 per cent theywere twice as likely as their younger counterparts to be so employed (Table 3.2). One-third of menwere employed on a permanent part-time basis, up from extremely small percentages among pre-SPA men. As indicated above, a little under half of the men working part-time were employed in newjobs compared with just under one-fifth of men working full-time.
The distribution of SPA men and women throughout the different temporary job types are nearlyidentical, they are therefore combined in Table 3.3. At this stage of life, men and women are less likelyto be on a fixed-term contract, which tends to be associated with professional positions. Instead, theyare more than three times more likely than younger employees to be working on a casual basis,although whether by choice or not cannot be discerned from the LFS or FRS.
Types of jobs

31
Table 3.3 Type of temporary job by age: Men and women
Column percentages
25-49 50-59/64 60/65+
Seasonal work 3 4 8
Fixed-term contract 57 57 35
Agency temping 18 15 7
Casual work 10 14 40
Other 12 11 11
N 2789 969 299
Source:LFS 2000-2001.
3.3.2 Downshifting
The prevalence of ‘downshifting’ of hours or responsibilities among older workers is not known, butgiven current economic pressures and evidence of ongoing widespread restructuring strategiesthroughout the UK (Worral et al, 2000) it is unlikely to be widespread. Strategies include downsizing(shedding labour) and delayering (removing managerial strata) with the aim of reducing costs,improving communications and enhancing the responsiveness of companies to changing demands.The effects upon employees and managers within organisations are often adverse, marked by workintensification (Green, 2000) and ‘increasing spans of (people and task) control’ (Worral et al, 2000)with clear health implications.
This intensification of work is now recognised in some organisations as problematic for an ageingworkforce. Nissan has called it ‘The Ageing Worker Problem’, an issue that is still being discussed andfar from resolution, ‘Nissan workers in their thirties express anxiety about how long they can continuewith a punishing pace of work’ (Bradley et al, 2000). Evidence of this sort suggests that the scope fordownshifting has been seriously undermined over the past decade or so as workers of all ages areincreasingly pushed to achieve more with less. It is likely that a lack of opportunities to manipulatework tasks or hours precipitates exits from full-time employment. Within this context it may provedifficult to encourage the older workforce to remain in employment beyond SPA.
Table 3.4 indicates the importance of part-time opportunities. The largest groups of employed andself-employed men and women worked part-time, predominantly through choice. Reasons forworking part-time rather than full-time are outlined in Tables 3.5 and 3.6, which show that 95 percent did not want to work on a full-time basis. Of these, 39 per cent choose to work part-time becausethey were financially comfortable and wished either to sustain a particular standard of living orbecause they enjoyed working. A further 44 per cent worked part-time for ‘other’ reasons. This is alarge group, which warrants further qualitative investigation to unpack the interplay of motives forworking part-time, which are likely to include health, financial and opportunity dimensions.
Types of jobs

32
Table 3.4 Employment type among post-SPA workers
Column percentages
Men Women
Employed full-time 16 25
Employed part-time 34 56
Self-employed full-time 19 6
Self-employed part-time 30 13
N 901 1667
Source: FRS 1997-2000.
Given the apparent preference for part-time contracts, in order to retain workers, companies need tooffer opportunities or incentives such as reduction in hours, home working opportunities or flexiblehours systems. Some organizations already provide this form of flexibility for women who are raisinga family. Extension of such provisions to older men and women is likely to be met favourably.
Table 3.5 Reason for working part-time by sex
Column percentages
Men Women
Ill or Disabled 2 2
Could not find full-time work 3 3
Did not want full-time work 95 95
N 756 1655
Base: Pensionable age men and women.
Source: LFS 2000-2001.
Table 3.6 Reason for not wanting full-time work by age
Column percentages
25-49 50-59/64 60/65+
Financially secure work because I want to 3 18 27
Earn enough working part-time 4 14 12
To spend more time with family 46 21 9
Domestic commitments 35 19 8
Insufficient childcare facilities 3 0 0
Another reason 10 28 44
N 13436 5775 1940
Source: LFS 2000-2001.
Table 3.7 further supports the claim that pensionable age men and women are more likely to want towork reduced hours. Within each contractual category, whether full-time, part-time or temporary,the post-SPA workforce worked fewer hours than younger workers, this gap in hours was greater formen than women. Having reached official retirement age these men and women can either afford toreduce their hours, desire a better work/life balance or, for health reasons, need to spend less time atwork.
Types of jobs

33
Table 3.7 Average hours worked by contractual type and agegroup: 2001
Average weekly hours
Men Women
25-49 50-64 65+ 25-49 50-59 60+
Full-time permanent 43 43 40 39 39 38
Part-time permanent 21 21 18 20 20 16
Temporary 39 33 18 27 24 15
Source: LFS 2001.
3.3.3 Industry and occupation
Can differences between pre and post-SPA workers be discerned when comparing their distributionthroughout the industrial and occupational structure? In other words, do some jobs appear to offermore opportunities for those wishing to continue working beyond SPA?
Table 3.8 Industrial sector by age category: 2001
Column percentages
Men Women
25-49 50-64 65+ 25-49 50-59 60+
Agriculture & Fishing 1 1 3 1 1 1
Energy & Water 2 2 1 1 * *
Manufacturing 26 27 19 10 10 9
Construction 9 10 5 1 2 2
Distribution, Hotels 14 12 20 19 19 21
& Restaurants
Transport & Communications 11 11 8 5 3 3
Banking Finance & Insurance 17 13 16 16 12 13
Public Administration, 17 20 20 43 50 44
Education & Health
Other Services 4 5 8 5 5 8
Total % 100 100 100 100 100 100
N 27123 10238 636 27369 8437 1811
Source: LFS 2001 employees only. * =<0.5.
Looking first at the industrial sectors of men, the post-SPA workers were over-represented indistribution, hotels, restaurants and ‘other services’ (Table 3.8). They were under-represented in theconstruction industry and declining manufacturing sector from which significant proportions of allmen over the age of 50 have lost their jobs over the past couple of decades. Of the jobs that remainin these sectors, many require a degree of physical strength, which employers may regard asunsuitable for older workers. They also tend to be dominated by full-time permanent positions, whichmay not be favoured by men beyond SPA.
Women gravitate toward part-time positions at various points in their life-cycle and many enterindustries that can accommodate their desire for flexible hours. Hence, women of all ages areconcentrated in the service sector generally and in public administration, education and health morespecifically.
Types of jobs

34
Table 3.9 presents the occupational distribution of workers of all ages. Post-SPA men were less likelythan their younger colleagues to be employed as managers, in skilled trades or as machine operatives.Instead they exhibited increased representation in elementary occupations that require little trainingand few, if any, qualifications. Once again, it is not clear whether it is these occupations which aremost likely to offer retention opportunities beyond SPA, provide the most opportunities for re-employment among men or whether these older men prefer a less demanding position during theirfinal years of work. The distinct occupational profiles of the different age groups of men may alsoreveal a cohort effect with the post-SPA workers retaining their distinct occupational and industrialprofiles at earlier ages. Further research is required to investigate the occupational choices andconstraints facing the older workforce.
Similar occupational outcomes apply to women. Their employment in professional jobs diminishes,with increasing proportions located in elementary occupations instead. Once again, issues relating tochoice and cohort effects arise. The current generation of women aged 60+ faced very differentoccupational and educational opportunities when first entering the labour market with long-termimplications for employment trajectories.
Table 3.9 Proportion of workers in each occupational group byage group
Column percentages
Men Women
25-49 50-64 65+ 25-49 50-59 60+
Managers and senior officials 22 23 19 11 9 7
Professionals 12 11 9 11 10 6
Associate professionals 10 7 4 12 9 8
Admin and secretarial 8 7 10 27 29 24
Skilled trades 18 17 11 2 2 2
Personal service 7 6 12 15 16 21
Sales and customer service 4 3 6 10 10 10
Process plant and machine operatives 15 19 16 4 4 4
Elementary occupations 6 7 14 8 11 19
Total % 100 100 100 100 100 100
N 20426 7623 416 20221 5620 1299
Source: FRS 1997-2000. Base: employees only.
In order to investigate the occupational effect of leaving a pre-SPA employer and taking up newemployment elsewhere, Table 3.10 presents the occupational location of ‘movers’ vs. ‘stayers’.‘Movers’ are working individuals who entered their current jobs at or beyond SPA. ‘Stayers’ are thosewho continue working with organisations with which they were employed prior to SPA. Is the over-representation of men and women in elementary occupations attributable to new appointmentsassumed after pensionable age? The answer to this question is yes.
Comparing male ‘movers’ with ‘stayers’, the former were three times as likely as those remaining withpre-SPA employers to be employed in elementary occupations. Similarly among women, thosesecuring new jobs were twice as likely as the non-movers to end up in low-skilled elementarypositions. Men and women remaining with longer-term employers retained their positions asmanagers and professionals to a far greater extent than post-SPA job changers. Whether thisdifference in occupational attainment matters depends upon motivations for working. Future
Types of jobs

35
research should address this issue of occupational choice and the extent to which individuals areprepared to take a drop in skill, status and salary in the search for work post-SPA. Of course, it may bethat job movers who end up in low-skilled positions were always employed in elementary occupationswith no associated loss of status. Analysis of longitudinal data with complete job history informationis needed to establish whether it is the low-skilled groups with a history of lower earnings who aremost likely to exit at pensionable age and then embark on new job search activities.
Table 3.10 Proportion of workers in each occupational group bynew or old job
Column percentages
Men 65+ Women 60+
Old job New job Old job New job
Managers and senior officials 23 6 18 3
Professionals 12 5 6 3
Associate professionals 4 2 8 6
Admin and secretarial 10 10 26 16
Skilled trades 12 8 2 2
Personal service 11 14 19 25
Sales and customer service 15 9 9 13
Process plant machine operatives 14 18 4 4
Elementary occupations 9 28 17 29
Total % 100 100 100 100
N 290 122 1033 263
Source: FRS 1997-2000.
Base: Pensionable age employees only.
3.3.4 Organisational type
Table 3.11 highlights the importance of company size for prospects among older workers.
Workers over SPA were twice as likely as other age groups to be employed in companies with 1-10staff, they were also far less likely to be employed in organisations with over 50 staff. This distributionmay reflect the greater informality of small companies, which are far less likely to provideoccupational pension schemes and are less likely to impose specific ages for retirement. Therefore,despite large organizations being required to operate with formal equal opportunities policies andwith human resource departments more aware of issues such as age discrimination and workforcediversity, it is very small companies that retain or absorb members of staff over SPA in greaternumbers.
Table 3.11 Percentage of each age group by workplace size
Column percentages
Age group
25-49 50-59/64 60/65+
Number of employees at work
1-10 18 23 43
11-49 27 28 28
50+ 56 49 30
Source: LFS 2000-01.
Types of jobs

36
The question of whether the small companies are primarily fulfilling a recruiting, as opposed to aretention, role is explored a little further. Restricting the sample to the SPA population, 40 per cent of‘stayers’ are employed in companies with 1-10 staff. A slightly higher proportion (48 per cent) of‘movers’ are in the smallest organisations. Both groups, however, were significantly over-representedin small firms, which were therefore apparently more inclined to both retain and recruit older workersbeyond State Pension Age.
The distribution between public and private sectors among the different age groups was notsignificantly different.
3.3.5 Job satisfaction
There was some tendency among those working past SPA to be more satisfied with their jobs (asemployees) than among younger age groups (Table 3.12). In particular, they were the most likely tosay that they were ‘completely satisfied’ with their job. Whilst the results for men are based onrelatively few cases, they mimic the figures for women, which have a larger base. Moreover, results forthe self-employed, asked an analogous question about their job satisfaction, show similar results.Indeed, the self-employed post-SPA were even more positive about their jobs than were employees.
Table 3.12 Job satisfaction by age group and sex
Column percentages
Age group
16-29 30-49 50<SPA SPA+
Men
1 Not satisfied at all 2 1 2 [4]
2 3 3 3 [9]
3 7 9 9 [4]
4 Not satisfied/not dissatisfied 9 9 10 [4]
5 26 26 22 [16]
6 44 45 46 [38]
7 Completely satisfied 10 6 9 [27]
Women
1 Not satisfied at all 1 1 1 1
2 3 2 2 2
3 8 7 7 0
4 Not satisfied/not dissatisfied 7 6 6 5
5 24 24 21 15
6 48 49 50 38
7 Completely satisfied 10 11 13 39
Source: BHPS wave 10. Var jJBSAT. Base: employees.
Numbers in [ ] are based on fewer than 50 cases and may be unreliable.
These results provide a more positive interpretation of why people remain in paid work after SPA. Forsome, work may be particularly rewarding.
Types of jobs

37
3.3.6 Wanting to leave work
BHPS workers were asked if, in the next 12 months, they would like to give up paid work6 and theresults from this question are shown in Figure 3.3. Generally speaking, those in their 50s were themost likely to say they wanted to give up paid work. Among men, the desire to give up paid work wasrather lower among men in their 60s, especially past SPA, than among those just prior to State PensionAge. For women, however, those working into their early 60s were more likely to say they wanted toleave work than women in their late 50s. This chart again illustrates that many people working beyondState Pension Age may be valuing their work rather highly.
Figure 3.3 Percentage wanting to leave work in next year, by ageand sex
3.4 Earnings
How do the earnings of post-SPA workers compare with other age groups? Do men and women atthis stage of life have the same earnings power as younger colleagues? Examination of Table 3.13suggests that the answer depends on the contractual basis of employment. Among post-SPA menonly full-time permanent workers earned significantly less than younger groups7. For women, thepost-SPA workers earned significantly less than 25-49 year-old full-time and part-time permanentworkers. There were no significant differences in hourly earnings among the women working ontemporary contracts.
6 The full question was: JE101E :I am going to read out a list of things which you may or may not want tohappen to your current employment situation. for each one can you please tell me whether you would likethis to happen to you in the next twelve months. Would you like to... Give up paid work?
7 Overlapping confidence intervals among part-time and temporary workers result in insignificant differencesamong the various generations of men.
Types of jobs

38
Table 3.13 Average hourly pay by contractual type and age group
£ per hour
Men Women
25-49 50-64 65+ 25-49 50-59 60+
(+/- confidence interval)
FT permanent 11.49 11.01 8.27 9.51 8.70 7.55
(0.15) (0.25) (1.68) (0.14) (0.23) (1.06)
PT permanent 7.43 8.64 7.61 6.94 6.28 6.20
(0.95) (1.16) (1.61) (0.15) (0.19) (0.42)
Temporary 9.55 12.06 8.72 8.86 9.45 11.01
(0.63) (1.59) (1.94) (0.51) (1.07) (3.27)
Source:LFS 2000-2001.
Of course, it cannot be concluded that lower average earnings among post-SPA full-time permanentmen and women and part-time women is attributable to discrimination. The reported earnings areplausibly explained by the concentration of these older men and women in service sectors with anover-representation in elementary occupations. Multivariate analyses are required to establishwhether there is, in addition to other known factors associated with earnings levels, a residualdifference that may be attributed to the age of the workers. Such analyses have been performed andare presented in Appendix B, as Table B.1.
Ordinary least squares (OLS) regressions, predicting employee hourly earnings, were carried out formen and women working full-time and part-time. Focusing on the variable of interest, age group, itis clear that once occupational group, employment status, sex and educational achievement arecontrolled for, reaching SPA was not associated with a deterioration in hourly pay rates.
There was one exception to this finding; pensionable age men working on a full-time basis earned asignificant £1.88 per hour less than 25-49 year olds with an even bigger gap compared with men aged50-64. The source of financial disadvantage for these older men working full-time is not evident fromthe results derived from analysis of the LFS but warrants further investigation.
Types of jobs

39
4 Dynamics of retirement
4.1 Introduction
This chapter provides further analysis of the British Household Panel Survey, to consider how far alongitudinal study may shed light on the timing of exit from the labour force, and working past StatePension Age. The main disadvantage of the BHPS is that it is much smaller than the other datasets usedhere. The advantage is its ability to track the same individuals over time. However, the small samplesizes available mean that the analysis reported on here should be regarded as exploratory rather thandefinitive. It should be possible to test some of the results when larger scale longitudinal data becomesavailable for this age group (e.g. the English Longitudinal Study of Ageing, ELSA).
4.2 Simple panel analysis: antecedents of workingpost-SPA
In this section, the longitudinal element of the BHPS is exploited in relatively simple ways. Thecharacteristics of respondents in 1991 (the first year of the survey), are compared with their workstatus in 2000/01 (the most recently available dataset). The analysis is based on women aged 50-59and men aged 55-64 in 1991. By the last interview, in 2000 (or 2001) they will all be older than SPA.This amounts to looking at the antecedents of current economic activity.
In 1991, there were 1,057 BHPS respondents who were women aged 50-59 or men aged 55-64. Ofthis number, a total of 560 (just over half, 53 per cent) were in paid work in 1991, whilst 47 per centwere not in paid work. Looking at the same people in 2000, 110 of those who had been working in1991 were still working (20 per cent: 110/560); conversely, only 20 of those who had not beenworking in 1991 had become workers by 2000 (four per cent: 20/497). This comparison demonstratesthe low probability of re-entry to the labour market among older workers who leave their jobs beforeSPA.
There are a range of different factors that, in 1991, appear to be linked to being in work in 2000. Forinstance, in 1991 respondents were asked ‘How energetic do you feel compared to most people ofyour age ? Would you say you are... [more/same/less]’. This might seem a rather unusual, rathersubjective question. However, as shown in Table 4.1, there were some strong linkages between theanswers provided, and work status ten years later. One-quarter of those claiming to have above-average ‘energy’ levels in 1991 were working in 2000, compared with 15 per cent of thosecomparable to those of their age, and nine per cent saying that they had less energy than others theirage.
Dynamics of retirement

40
Table 4.1 Work in 2000 by ‘energy level’ in 1991
Cell percentages
Level of energy compared Men Women All
to people of same age (1991) (% working (% working (% working
in 2000) in 2000) in 2000)
More energetic 23 28 25
About the same 10 20 15
Less energetic 9 10 9
Source: BHPS.
Base: Women aged 50-59, men 55-64 in 1991. Vars aHLZEST, aSEX, jJBHAS
There are some characteristics of work and workers that affected whether people remained in work,or not. Whether people were working in 1991, and whether as employee or as self-employed, wasparticularly important in whether they were working in 2000 (Table 4.2). Among men aged 50-59 andself-employed in 1991, some 40 per cent were working ten years later. This compared with 17 percent among employees, and just five per cent of those not in paid work. The figures for women do notshow an effect of self-employment, which was rather rare among women in any case – though theydo illustrate that not being in work was strongly related to remaining out of work.
Table 4.2 Work in 2000 by work status in 1991
Column percentages
Men: status in 1991 Women: status in 1991
Self- Not Self- Not
Status in 2000/01 employed Employees working employed Employees working
Working 40 17 5 [26] 32 4
Not working 60 83 95 [74] 68 96
Unweighted base (=100%) 81 251 243 40 351 286
Source: BHPS.
Base: Women aged 50-59, men 55-64 in 1991. Vars aJBSEMP, aSEX, jJBHAS
Numbers in [ ] are based on fewer than 50 cases and may be unreliable
Those found to be in work in 2000 were more likely to have had higher levels of qualification in 1991,and to have reported better health. In fact, it is possible to find a large number of characteristics ofpeople that appear to ‘explain’ which groups were most likely to remain in work after State PensionAge - better health, good qualifications, and so on. However, the picture is not so clear after havingcontrolled for status during the years in the run-up to SPA. The best predictor of being in work post-SPA is, perhaps unsurprisingly, being in work in the period just prior. Most ‘apparent’ factorscorrelated with work post-SPA work through this link. Their independent effect on working after 60/65 is much weaker. However, some of the characteristics of jobs and workers are associated withremaining in work after SPA.
Table 4.3 shows rates of working in 2000 by a range of employment-related characteristics measuredin 1991.
Dynamics of retirement

41
Table 4.3 Work in 2000 by work status in 1991
Row percentages
Status in 2000/01
Working Not working Unweighted base
(=100%)
Status in 1991
Men 15 85 575
Single 10 90 100
Partner, but not working 7 93 226
Partner in work 23 77 249
Among workers only
Working full-time 22 78 290
Working part-time [23] [77] 27
Union/staff association at workplace 13 87 156
No union/association 22 78 84
Women 21 89 678
Single 17 83 148
Partner, but not working 13 87 148
Partner in work 25 75 382
Among workers only
Working full-time 37 63 198
Working part-time 26 84 173
Union/staff association at workplace 27 73 171
No union/association 34 66 163
Source: BHPS.
Base: Women aged 50-59, men 55-64 in 1991.
Numbers in [ ] are based on fewer than 50 cases and may be unreliable.
For both men and women, having a partner in work (in 1991) made a large difference to the prospectof remaining in work post-SPA. Those with a non-working partner (in 1991) were less likely tocontinue working than single people. There are a number of different potential reasons why thisrelationship occurs (Hurd 1988). It could be reflecting similarities between husbands and wives, interms of skill level and employment experience. It might be reflecting that each faces a similar locallabour market – although, as shown in Chapter 2, the effects of living in particular regions is not great.It may also be reflecting wider household circumstances. The importance of joint retirement isdiscussed later, in Section 4.2.1.
Women working full-time continued working longer than women who worked part-time – 37 percent compared with 26 per cent. This might be reflecting having a more advantaged ‘career’although, as elsewhere in this report, it might also be interpreted as signalling a greater need forincome.
There was some tendency for men to work for longer, where they were working in workplaceswithout unions (or staff associations). This perhaps mirrors our finding about workers post-SPA oftenbeing found in smaller firms. There was a similar effect for women, but of lesser importance.
Dynamics of retirement

42
Among the key factors which do appear to discriminate between workers who continue to work, andthose who stop, are (a) having a working partner and (b) having a good health status, especiallyavoiding health problems that are said (by respondents) to limit work activities.
4.2.1 Couples and joint retirement
It has been discussed, above, that men and women often act to coincide their dates of retirement.Currently, there are unequal state pension ages, and men tend to be a couple of years older than theirpartners, though with a large range of age differences in the ages of men and women in partnerships.This combination (different pension ages, the age differences in many couples, a desire to retiretogether) can imply one or other partner continuing to work past SPA, or stopping before SPA.
It is well-known that the rate of working among men and women drops at older age groups.However, it seems that the proportion of men and women in work at later ages reflects thecircumstances of their partner, as well as their own characteristics.
Table 4.4 shows the proportion of men in paid work, by both their own age and that of their partner(among men in couples). So, 51 per cent of men aged 60-69 were working, where his partner was inher 50s, compared with 24 per cent where the partner was in her 60s, and 13 per cent where thepartner was in her 70s. Reading down each column, the older the female partner, the less likely thatmen were in paid work at any given age.
Table 4.4 Proportion of men in couples working, by own andpartner’s age
Cell percentages
Age of man (own age)
50-59 60-69 70-79
Age of female partner
50s 80 51
60s 66 24 11
70s 13 3
All men (including single) 78 31 6
Source: BHPS wave 10. Based on couples.
The corresponding picture for women is show in Table 4.5.
Again, the younger the male partner, the more likely that the woman was in paid work at any givenage range. For example, 29 per cent of women aged 60-69 with partners in their 50s were working,compared with 18 per cent for women of the same age but with partners in their 60s.
As with the results for men, these hints at joint decision-making about work are consistent with arange of different theories. Perhaps people with younger partners have a more ‘youthful’ attitudetowards work, or maybe they just were more likely to have partners who were themselves in paidwork.
Dynamics of retirement

43
Table 4.5 Proportion of women in couples working, by own andpartner’s age
Cell percentages
Age of woman (own age)
50-59 60-69 70-79
Age of male partner
50s 70 29
60s 52 18 12
70s 16 5
80s 0
All women (including single) 66 16 3
Source: BHPS wave 10. Based on couples.
4.3 Event-history analysis
A more complex means of examining the data is to look at the rate of movement out of and into workat particular ages. The aim is to consider at what ages, and for what groups, the rate of transition isgreatest.
One means of looking at movement out of the labour force is to plot the percentage of men andwomen remaining in work at different ages. The analysis starts with those in work, then observes therate at which they leave work. Unlike in the simpler analysis of Section 4.2, this tracks the rate at whichpeople leave work on a year-to-year basis.
The rate at which men and women leave work is plotted in Figure 4.1. This chart (and the two thatfollow it) is based on respondents who were in paid work at age 50, or later, so that the charts beginat 100 per cent in work. They then ‘follow’ respondents until the point that they leave work.8
For men, being self-employed in 1991 was a key contributor to remaining in the labour force.Moreover, there was no particular age at which this group appeared to be more likely to stop working.They were particularly likely to remain working during 60-65, when the rate of labour force exit for allmen was quite high. Having a working partner (in 1991) was also associated with remaining in work,but the effect on a yearly basis was not large, and seemed to be most significant in the late 50s inkeeping men in work. Men with an occupational pension were less likely to remain in work at eachgiven age. There is a drop in rates of working at 65, noticeable for all groups but reducing work ratesto well under ten per cent at that age for those with occupational pensions.
8 These are ‘survival charts’, based on those aged 50+ in BHPS wave 1.
Dynamics of retirement

44
Figure 4.1 Rate of remaining in work by age, men, by 1991characteristics
A similar set of analyses may be run for women, and some results are shown in Figure 4.2. Overall,there were few factors that appeared to have a particular large effect on remaining in work anddifferent effects appeared to operate at different ages. For example, being a full-time worker in 1991was associated with higher rates of working post 65, but generally lower rates of working in women’slate 50s.
Figure 4.2 Rate of remaining in work by age, women, by1991 characteristics
Dynamics of retirement

45
There are a number of points with large falls in rates of working. There is considerable movement outof work around 50 and there is a relatively steep drop at 60, the State Pension Age. For those withoccupational pensions, there is then a significant drop at age 65 – taking this group from the highestto the lowest rates of paid work among these groups. This may be reflecting the fact that 65 is the‘normal pension age’ for women in 31 per cent of occupational pension schemes (Smith and McKay2002: Table 5.19)
Next, a focus on those working relatively close to State Pension Age (Figure 4.3). This is based on menwho had a job at age 62 (or later), and women who were working at age 57 (or later). This effectivelydrops from the base some older workers who leave work well before the SPA.
Figure 4.3 Rate of remaining in work by age (based on respondents inwork post-57 for women, post-62 for men)
This chart indicates that the State Pension Age remains an important threshold, even for those in paidwork three years prior to that point. The effect of SPA on leaving work was somewhat morepronounced for men, and less significant among women. This is consistent with our own and otherevidence about the effect of State Pensions on rates of working (Disney and Tanner 2000).
Once past SPA, the rate of decline for both men and women remained fairly steep. Numbers were toosmall to provide further breakdowns. What data there was suggested that working partners wereagain important in keeping people in the labour market. Having an occupational pension wasassociated with more rapid exits for men, but the pattern for women was not clear – other thanindications of a rather sharp drop at 65 for women with occupational pensions, which might bereflecting gender equalisation in non-state pension ages for particular schemes.
Another important conclusion is that rates of working are only typically sustained for a few years afterState Pension Age, and this only happens for those working in the period just prior. Increasingparticipation in paid work post-SPA would seem to have to deal with keeping people in the labourforce before SPA, as well as the decisions made by workers once they reach SPA.
Dynamics of retirement


47
5 Effects of working pastState Pension Age
5.1 Introduction
In this section, data is analysed to consider how working past State Pension Age affects people’sbehaviour, including their savings, health and general well being. Section 5.2 compares workers withnon-workers. Section 5.3 attempts to control for the path taken through work and retirement.
5.2 Analysis of current workers and non-workers
The characteristics of workers and their behaviour in various arenas, may be contrasted with that ofnon-workers. It is natural to look at all those over State Pension Age in such an analysis, but to do sowould be slightly misleading. Most of those working past SPA are rather younger than the vastly largergroup of non-workers. Therefore, a comparison of workers and non-workers may be implicitly acomparison of younger with older people. So, for this section, attention is restricted to those within 10years of SPA: men aged 65-75 and women aged 60-70. This provides some control of age differencebetween the working and non-working groups.
Men working past SPA reported financial situations that were superior to those of non-workers.Some 59 per cent of men working past SPA said they were ‘living comfortably’, compared with 40 percent of those not working (and aged 65-75). Moreover, only nine per cent of those working describedthemselves as ‘just getting by’, compared with 32 per cent of the non-workers. Among women, thedifferences were less pronounced. Still, 87 per cent of the women working said they were either‘living comfortably’ or ‘doing all right’, compared with 65 per cent of those women not working.
Effects of working past State Pension Age

48
Table 5.1 Financial situation of workers and non-workers, amongthose aged from SPA to SPA+10 years
Column percentages
Men Women
Working Not working Working Not working
Financial situation
Living comfortably 59 40 40 38
Doing all right 29 24 47 27
Just about getting by 9 32 11 29
Finding it quite difficult 3 2 2 5
Finding it very difficult 0 1 0 1
Unweighted base 73 733 126 871
Source: BHPS wave 10. Base: men aged 65-75, women aged 60-70. Vars: jFISIT, jAGE, jSEX.
The reasons why these groups felt better off are not surprising, when put against differences in theirhousehold incomes. The median incomes of workers were around two-thirds higher than amongnon-workers (Table 5.2), for both men and women.
Table 5.2 Net household equivalised income of workers and non-workers, among those aged from SPA to SPA+10 years
£ per week
Men Women
Working Not working Working Not working
Financial situation
Mean income £463 £298 £410 £273
Median income £391 £236 £372 £231
Source: BHPS wave 9. Base: men aged 65-75, women aged 60-70.
Continuing to work was associated with better levels of self-reported health (Table 5.3). Some 76 percent of men working and aged 65-75 described their health over the last years as either ‘excellent’ or‘very good’, compared with 54 per cent of non-workers. Among women, 71 per cent of workersreported a similarly high level of health, compared with 49 per cent of non-workers.
It can be argued that health is more a cause of work status than an effect. It could be the case thatcontinuing to work is associated with people continuing to be active, and hence better health wouldthen be part of the effects of working. Alternatively, health conditions could affect people’s decisionsabout whether to work, and their ability to work – such an analysis appears as Table 2.9 in Chapter 2.In that case, health status would be the cause of work status, not the effect. These issues are analysedin more detail in Section 5.3, which attempts to control for previous employment experience.
Effects of working past State Pension Age

49
Table 5.3 Health status of workers and non-workers, among thoseaged from SPA to SPA+10 years
Column percentages
Men Women
Working Not working Working Not working
Health status over last 12 months
Excellent 25 15 21 14
Good 51 39 50 45
Fair 17 32 23 27
Poor 7 9 6 10
Very poor 0 4 0 4
Unweighted base 73 733 126 871
Source: BHPS wave 10. Base: men aged 65-75, women aged 60-70.
BHPS respondents complete a short form of the General Health Questionnaire (GHQ-12). Extractinga particular question on levels of unhappiness or depression, there was only limited evidence thatworkers were enjoying better mental health (as measured here) than non-workers.
Table 5.4 GHQ unhappy/depressed responses of workers and non-workers, among those aged from SPA to SPA+10 years
Column percentages
Men Women
Working Not working Working Not working
GHQ: Unhappy or depressed
Not at all 53 47 39 33
No more than usual 43 40 37 47
Rather more 2 10 20 16
Much more 1 2 2 3
Unweighted base 73 733 126 871
Source: BHPS wave 10. Base: men aged 65-75, women aged 60-70.
This sections ends with a relatively diverse range of information on savings and financial behaviour(Table 5.5).
Those older groups in paid work were more likely to be saving money, than non-workers. Half themale workers, and approaching two-thirds of the women, were saving money. This compared witharound one-third of non-working men and women. This could be evidence that they were puttingmoney away for their future retirement. Indeed, their responses to questions about motives forsavings tended to reflect this. Of course, a range of different motivations for saving was mentionedand an alternative possibility is just that people with higher incomes tend to be more likely to save.However, the proportion of people saving in 2000, compared to five years’ previously, had fallen fornon-workers, but increased for workers. This divergence is consistent with people starting to save (orsave more) when post SPA, to acquire sufficient assets to retire.
Effects of working past State Pension Age

50
Rather more workers than non-workers said they had store cards or credit cards. Last, workers weremuch more likely to own a mobile phone than non-workers. Whether this is evidence of higherincome, a means of keeping in contact with professional colleagues, or reflective of a more ‘youthful’outlook, it is not possible to say. The same may be said of the results relating to having a computer, andan internet connection, within the household.
Table 5.5 Miscellaneous characteristics of workers and non-workers,among those aged from SPA to SPA+10 years
Cell percentages
Men Women
Working Not working Working Not working
Saves from current income 50 34 63 31
Was saving 5 years ago 41 37 52 34
Has store cards or credit card 70 52 74 50
Has a mobile phone 49 18 44 25
Accommodation has a computer 41 19 34 22
Accommodation has a computer
with an internet connection 24 12 28 11
Unweighted base 73 733 126 871
Source: BHPS wave 10. Base: men aged 65-75, women aged 60-70.
5.3 Controlling for past status
Some characteristics may be the effect of being in work (perhaps level of income is a good example),whilst others may really be closer to being a cause of being in work (perhaps including health status).Ideally, the analysis would be able to separate which are causes from those that are effects.
It may never be possible to do this with survey data collected for other purposes, instead, qualitativework or specially-designed surveys are probably needed. However, it is possible to use the longitudinalelement of the data here – information on the same people at different points in time – to investigatehow much can be learned from the sequence and timing of different events.
Table 5.6 shows health status in 2000 according to health in 1995, and work transition statusbetween 1995 and 2000. Sadly, many of the sample sizes are rather small, making it difficult to drawfirm conclusions. However, 82 per cent of those with excellent/good health in 1995 and who wereworking in 1995 and 2000, said they had excellent health in 2000. This rate of sustaining excellenthealth was certainly as good as among any other group – but these magnitudes do not suggest to anygreater extent than the other groups.
Effects of working past State Pension Age

51
Table 5.6 Health in 2000, by health status in 1995 and work transition1995-2000
Column percentages
Work -> work Work -> Not work Not work -> work Not work->Not work
Health Fair, poor Health Fair, poor Health Fair, poor Health Fair, poor
excellent or v poor excellent or v poor excellent or v poor excellent or v poor
Health in 2000
Excel. or good 83 [39] 80 [43] [56] [50] 73 27
Fair, poor or v poor 17 [61] 20 [57] [44] [50] 27 73
Base 83 17 133 49 16 4 363 231
Source: BHPS wave 10 and wave 9. Base: men aged 65-75, women aged 60-70, in wave 10.
Numbers in [ ] are based on fewer than 50 cases and may be unreliable.
It is possible to increase some of the sample numbers by focusing in on a shorter time period. So Table5.7 looks at only the last two waves of interviews, taking place in 1999 and 2000. This increases thenumbers remaining in work, with varying health states, though at the expense of fewer cases foundleaving work in that particular year. This time, there can be greater confidence that the ability ofpeople to sustain or even improve health was better among continuing workers than among thoseremaining out of the labour market. The difference was clearest among those reporting only ‘fair’,‘poor’ or ‘very poor’ health in the previous year. Some 58 per cent were reporting ‘excellent’ or ‘good’health the following year among continuing workers, compared with 37 per cent among those notworking in both years.
However, sample numbers were too small to make appropriate comparisons with those leaving work,or starting work, in the course of the year.
Table 5.7 Health in 2000, by health status in 1999 and work transition1999-2000
Column percentages
Work -> work Work -> Not work Not work -> work Not work->Not work
Health Fair, poor Health Fair, poor Health Fair, poor Health Fair, poor
excellent or v poor excellent or v poor excellent or v poor excellent or v poor
Health in 2000
Excel. or good 92 58 [75] [55] [83] [60] 86 37
Fair, poor or v poor 8 42 [25] [45] [17] [40] 14 63
Base 73 80 32 47 12 10 519 925
Source: BHPS wave 10 and wave 5. Base: men aged 65-75, women aged 60-70, in wave 10.
Numbers in [ ] are based on fewer than 50 cases and may be unreliable.
In making comparisons between those working after SPA and those who are not, it should beremembered that the latter comprises two very different groups. First, those who made good non-state provision, either through pensions and other forms of savings, and who were able to retire at atime mostly of their choosing. Second, those who left the labour market some years before SPA, whomight have wished to have continued working but were unable to (such as because of ill health).
Effects of working past State Pension Age

52
Those working past State Pension Age tend not to have the kind of resources that permit a promptretirement, but do have the capacity to continue working, sometimes accompanied by a strongwillingness to do so. As a result, comparisons between these two groups can be difficult to interpret.
In this chapter, a number of ways in which working past State Pension Age may be affectingbehaviour have been investigated. Clearly, the workers had a number of advantages over the non-workers, particularly regarding their financial circumstances. This was a direct result of their havingearnings. Their better health may be attributable to them continuing to work, but the evidence is notstrong enough to be definitive that this was not instead a cause rather than an effect of them working.
Effects of working past State Pension Age

53
6 Concluding remarksThe aim of this study has been to enhance our understanding of which groups work beyond StatePension Age (SPA), the kind of jobs they do, and the difference that working makes to their lives. Thewider context is that rates of working after SPA have long been falling for men, and have been ratherstatic for women, despite people generally living longer and there being more women in paid workgenerally. However, these falls mostly occurred prior to 1990. Rates of working for men have sincenearly flattened out, and for women have even increased slightly. These trends are important, at atime when increases in the sizes of these age groups may confidently be projected.
In the UK, rates of working for men aged 65-69, and for women aged 60-64, are somewhat above theaverage for the European Union. It is in the South of Europe, and the North, that these employmentrates are highest. The social-democratic welfare regimes (Esping-Andersen 1990) of Western Europehave produced relatively low rates of labour force participation among older workers.
This report has focused on rates of working in 2000 and 2001, using secondary data with either largenumbers of individuals (the Labour Force Survey, the Family Resources Survey from three years) orunique data tracking the same people over time (the British Household Panel Survey). This has shednew light on the groups working after SPA, and the kind of work they do.
One of the main themes running through the report has been the different motivations behind peoplecontinuing to work. For some, it seems to be linked to their wider household circumstances, and adesire to stop working quite close to the retirement of their partner. Among older workers, the kindof ‘work rich’ versus ‘work poor’ analysis based on younger groups (Gregg and Wadsworth 1999) hasstrong resonance. Moreover, having a younger partner was also associated with remaining in paidwork for longer. There were other hints at a more ‘youthful’ aspect to those working past SPA – theirhigher ownership rates of computers and mobile phones, perhaps?
A second set of incentives to work for longer is to maintain living standards, or perhaps to improvethem sufficiently for the period when work has ended. There was considerable evidence for this,those working past SPA had high rates of saving (Chapter 5) and were less likely than non-workers tobe receiving income from an occupational pension. They were quite likely to have outstandingmortgages that, presumably, they wanted to clear whilst still in paid work (Chapter 2). There wasevidence that the divorced and separated, particularly among women, worked for longer than thosewho were married which might also be evidence of working to protect future living standards.
A third area was that of choosing to work. Older workers had relatively high levels of job satisfaction,and relatively few of the men wanted to stop working. A high proportion were self-employed, but thisappears to be reflecting later retirement among the self-employed rather than any great switching
Concluding remarks

54
from employee status to self-employed, though this did happened for some people. Many employeeshad, however, decided to reduce their hours and work part-time instead which seemed to besomething they were happy to do. The clear majority of those working after SPA had remained in thesame job as before. They were more likely than younger age groups to be working for small firms withless than 10 employees at their place of work.
One of the strongest conclusions is that working beyond SPA is only a strong possibility for thoseworking in the run-up to this stage. It is difficult to re-enter the labour market having left it. Moreover,many of those leaving work may be doing so on health grounds, or because they have sufficientresources to live on in retirement. Rates of leaving work for those who do continue to work droprelatively quickly after 60/65. Even if more people can be encouraged to work after this age, oncurrent trends they would not work for many more years.
The analysis poses a number of questions that may be taken forward with more qualitative methods.Our categorisation of reasons for working post-SPA is based on inference from secondary data, andother quantitative research. It assumes a certain degree of decision-making that would beappropriate to research further in greater depth. Some of the interactions between partners couldalso be usefully explored, as could perceptions of what constitutes enough of a package of resourcesfor a comfortable retirement. The role that employers play in permitting or even promoting peopleworking after SPA is another under-researched area.
Concluding remarks

61References
ReferencesAtchley, R. (1989) ‘A continuity theory of ageing’ Gerontologist 29: 183-190.
Blundell, R and Johnson, P (1999) ‘Pensions and Retirement in the United Kingdom’ pp 403-436 in JGruber and D Wise (editors) “Social Security and Retirement Around the World” University of ChicagoPress.
Bone, J. and Mercer, S. (2000) Flexible Retirement, Employers’ Forum on Age.
Bradley, H., et al. (2000) Myths at Work, Cambridge: Polity Press.
Campbell, N. (1999) The Decline of Employment Among Older People in Britain CASE paper 19,London School of Economics.
DSS (2000) Pensioner Income Series London: ASD.
Disney, R., Grundy, E. and Johnson, P. (eds.) (1997) The Dynamics of Retirement: Analyses of theRetirement Surveys, London: The Stationery Office.
Disney, R. and Tanner, S. (2000) The Abolition of the Earnings Rule for UK Pensioners, London: IFSWorking Paper WP00/13.
Dunnell, K. (2001, Spring) ‘Policy responses to population ageing and population decline in the UK’Population Trends London: The Stationary Office.
Esping-Andersen, G. (1990) The Three Worlds of Welfare Capitalism, Cambridge: Polity Press.
Finch, J. and Mason, J. (1993) Negotiating Family Responsibilities, London: Routledge.
Green, F. (2000) It’s Been a Hard Day’s Night: The Concentration and Intensification of Labour in late20th Century Britain, Leverhulme Trust.
Gregg, P., Knight, G. and Wadsworth, J. (1999) ‘The Cost of Job Loss’ in Gregg and Wadsworth (ed)The State of Working Britain.
Gudgin, G. and Fothergill, S. (1984) ‘New Firms and Rural Industrialization in East Anglia’,Regional Studies, Vol 18.3, 189-201.
Gustman, A.L. and Steinmeier, T.L. (2000) ‘Retirement in Dual-Career Families: A Structural Model’Journal of Labour Economics, 18 (3): 503-537.
Hirsch, B., Macpherson, D. and Hardy, M. (2000) ‘Occupational Age Structure and Access For OlderWorkers’, Industrial & Labour Relations Review, Vol 53, No.3.
62
Hornstein, Z. (editor) (2001) Outlawing age discrimination: Foreign lessons, UK choices, Bristol: ThePolicy Press.
Hurd, M. (1988) The joint retirement decision of husbands and wives, NBER Working Paper 2803.
Hilbourne, M. (1999) ‘Living together full-time? Middle-class couples approaching retirement,Ageing and Society 19, pp161-183.
Keeble, D. and Wever, E. (1986) New Firms & Regional Development in Europe, London Croom Helm.
Kohli, M., Rein, M., Guillemard, A. & van Gunsteren, H. (1991) Time for Retirement. ComparativeStudies of Early Exit from the Labour Force. CUP.
Lissenburgh, S. and Smeaton, D. (2001) Employment Transitions of Older Workers: The Role ofFlexible Employment in maintaining Labour Market Participation, JRF, York.
McKay, S. and Middleton, S. (1998) Characteristics of Older Workers, DfEE Research Report 45.
Neumark, D. (2001) Age Discrimination Legislation in the United States, NBER Working Paper 8152.
Nickell, S., Jones and Quintini (1999) A Picture of the Job Insecurity Facing British Men, DP No. 42,Centre for Economic Performance, LSE.
O’Connell, A. (2002) Raising State Pension Age: Are We Ready?, London: Pensions Policy Institute.
OECD (1995) The Transition from Work to Retirement, Social Policy Studies No.16, France, OECD.
Pahl, J. (1990) ‘Household Spending, Personal Spending & the Control of Money in Marriage’Sociology, 24, 1, 119-138.
Phillipson, C. (1993) ‘The Sociology of Retirement’ in Bond, J., Coleman, P. and Peace, S. (eds.) Ageingin Society: An Introduction to Social Gerontology London: Sage.
Preston, P. (2000) ‘Old Enough To Know Better’, The Guardian, 20.02.01, p11.
Quince, S. and Wicksteed, B. (1985) The Cambridge Phenomenon, Segal Quince & Partners,Cambridge.
Reskin and Roos (1990) Job Queues, Gender Queues, Philadelphia: Temple University Press.
Shaw, L.B. (1984) ‘Retirement Plans of Middle-Aged Women’, Gerontologist 24 (2): 154-159.
Smeaton, D. (1992) Self Employment – Some Preliminary Findings, CEP Discussion Paper No. 96,London School of Economics.
Smeaton, D.(2002) Self-employed Workers : Calling the Shots or Hesitant Independents?,A Consideration of the Trends PSI Working Paper.
Smith, A and McKay, S (2002) “Employers Pension Provision 2000” Leeds: Corporate DocumentServices [DWP Research Report No 163].
Storey, D. (1982) Entrepreneurship and the New Firm, Croom Helm, London.
Taylor, P. and Walker, A. (1994) ‘The Ageing Workforce: Employers Attitudes Towards Older People’,Work Employment & Society, 8, 4, 569-591.
Vlasblom, J. and Nekkers, G. (2001) Regional Differences in Labour Force Activity Rates of PersonsAged 55+ in the European Union, European Commission.
Worrall, L. (2000) ‘The New Reality for UK Managers: Perpetual Change and Employment Instability’,Work Employment and Society, vol 14, No. 4, 647-668.
References

55Appendices – Logistic regression models of working
Appendix ALogistic regression modelsof workingExplanatory variables added to the model include;
• Health - a dummy variable with a value of 1 if in poor health, 0 for those in good health.
• Sex – men form the reference category.
• Total family savings - a categorical variable with 5 values; less than £1,500, £1,500-£8,000,£8,000-£20,000 (the reference group) and £20,000+
• Education - in the absence of a qualifications variable, the age left full-time education is usedinstead. This is a categorical measure with the following departure ages; 14, 15, 16, 17, 18, 19+.
• Total weekly non-earned income – this includes receipts from benefits, pensions, interest frominvestments and savings plus any other income.
• Regional unemployment levels – the figures are ILO unemployment rates.
• Ethnic group - 5 groups are defined; White, Black Caribbean, Indian, Pakistani and Other. The‘other’ collective is not reported as it is not a viable category, including a number of non-comparablegroups which, individually, are too small in number to produce estimates.
• Receipt of an occupational pension - included in the model as a dummy variable with a value of1 if a pension is received and 0 if not. The pension value is not modelled separately but contributestoward the total non-earned weekly income instead.
• Tenure – reference group is ‘own home’, further categories are ‘buying with a mortgage’, ‘renting& part renting, part mortgage’ and ‘rent free’.
• Marital status – reference group is ‘single, never married’, contrasted with ‘married or cohabiting’,‘separated’, ‘divorced’ and ‘widowed’.
• Caring responsibilities – those with no adult caring responsibilities are contrasted separately withindividuals performing caring duties for less than 10 hours a week and individuals caring for 10or more hours a week. Only 10 pensionable age individuals had caring responsibilities for children,these were therefore not examined.

56 Appendices – Logistic regression models of working
Presented in Table A.1 is a single pooled logistic regression model for men and women. In Table A.2a further four models are applied to the following pensionable age respondents:
• All men
• All women
• Men with partners
• Women with partners
Models 3 and 4 are identical to models 1 and 2 but add the variable ‘partner’s employment status’which is defined as 0 if the partner is not working and 1 if working in any capacity.
In Table A.2 the ‘beta coefficient’ represents the log odds of working, for ease of interpretation theodds ratio is also presented with significant results indicated in the final column.
Table A.1 Factors related to working post-SPA: Men and women
B Odds ratio Significance
Sex (ref: men) -0.881 0.414 **
Age -0.175 0.838 **
Good health 0.711 2.03 **
Caring responsibilities (ref: 0 hours)
1-9 hours per week -0.33 0.715 *
10 + hours per week -0.84 0.429 **
Housing tenure (ref: own home)
Buying with mortgage 0.632 1.88 **
Renting -0.214 0.883
Rent free 0.886 2.42 **
Total family savings (ref: £8,000-20,000)
Less than £1,500 -0.327 0.721 **
£1,500-£8000 0.086 1.09
£20,000+ 0.098 1.1
Marital status (ref: married/cohabiting)
Single, never married -0.077 0.925
Widowed 0.02 1.01
Separated 0.443 1.56 **
Divorced 0.428 1.53 **
Age finished full-time education (ref: 17)
14 -0.393 0.674 **
15 -0.058 0.943
16 0.055 1.05
18 0.069 1.07
19+ 0.412 1.51 **
Income (ref: £140-£199 per week)
£1-£69 0.474 1.61 **
£70-£104 0.472 1.61 **
£105-£139 0.044 1.04
£200+ 0.567 1.76 **
Continued

57Appendices – Logistic regression models of working
Table A.1 Continued
B Odds ratio Significance
Region (ref: North East)
North west 0.189 1.2
Yorkshire 0.149 1.16
East Midlands 0.277 1.32 **
West Midlands 0.179 1.19
East 0.434 1.54 **
London 0.515 1.68 **
South East 0.436 1.54 **
South West 0.52 1.68 **
Wales -0.071 0.93
Scotland 0.241 1.27
Ethnic group (ref: white)
Black Caribbean -0.278 0.756
Indian -1.16 0.311 **
Pakistani -1.52 0.219 **
Receipt of occupational pension -0.841 0.431 **
ILO Regional Unemployment (1) -0.059 0.942 **
Constant 10.25 **
Notes: Logistic regression analysis. N=28,484. * significant at 5% level, ** significant at 1% level
(1) Collinearity problems prevented the combined modelling of region and regional unemployment. Unemployment
coefficients are therefore derived excluding region. All remaining coefficients reported are derived from the model
including region only. Using unemployment causes all other coefficients to remain virtually unchanged
Table A.2 Factors related to working post-SPA (odds ratios)
All men All women M + partner F + partner
Age 0.89** .80** .91** .81**
Good health 2.09** 2.01** 2.07** 1.98**
Caring responsibilities(ref: 0 hours)
1-9 hours per week 0.91 .61** 1.08 0.88
10 + hours per week 0.46* .41** 0.65 0.68
Housing tenure (ref: own home)
Buying with mortgage 2.10** 1.75** 1.82** 1.28**
Renting 0.76** 0.85 .74* 1.03
Rent free 3.40** 1.73** 3.15** 1.19
Total family savings(ref: £8,000-20,000)Less than £1,500 0.51** .792* .53** 1.04
£1,500-£8000 0.71* 1.26* .65** 1.48**
£20,000+ 0.73** 1.29** .61* 1.55**
Marital status(ref: married/cohabiting)Single 0.73 0.99
Widowed 0.60** 1.26*
Separated 1.23 1.91**
Divorced 0.87 1.94**
Continued

58
Table A.2 Continued
All men All women M + partner F + partner
Age finished full-time
education (ref: 17)
14 0.67* .75* .56** 1.01
15 0.98 0.82 0.76 0.94
16 1.13 0.96 0.99 1.09
18 1.29 0.94 1.19 0.99
19+ 1.81** 1.38* 1.3 1.47*
Income (ref: £140-£199
per week)
£1-£69 3.12** 1.50** 2.26** 1.39
£70-£104 1.77** 1.39** 1.64** 1.2
£105-£139 1.31* 0.84 1.36* 0.86
£200+ 1.57** 1.84** 1.54** 2.17**
Region (ref: North East)
North west 1.49 1.07 1.21 0.93
Yorkshire 1.19 1.15 0.93 0.99
East Midlands 1.68* 1.15 1.59 0.89
West Midlands 1.2 1.21 1.15 0.94
East 1.68 1.51* 1.29 1.06
London 2.13** 1.46* 1.74* 1.15
South East 1.99** 1.39* 1.66* 1.06
South West 1.97** 1.61** 1.58 1.39
Wales 1.12 0.85 0.77 0.68
Scotland 1.62 1.15 1.23 0.91
Ethnic group (ref: white)
Black Caribbean 0.56 0.93 0.79 0.92
Indian 0.27** .31* 0.28 0.72
Pakistani 0.22 0.22 0.34 0.53
Receipt of
occupational pension 0.31** .59** .32** .52**
Partner Working 6.54** 5.25**
N 10,770 17,714 7,855 9,001
Notes: Logistic regression analysis
* significant at the 5% level, ** significant at the 1% level
Appendices – Logistic regression models of working

59Appendices – OLS regression models of hourly earnings
Appendix BOLS regression models ofhourly earningsTable B.1 OLS regression models of hourly earnings
Men Women
Full-time Part-time Full-time Part-time
Age group (ref:25-49)
50-60/64 .324* .70 .17 -.24
60/64+ -1.88** .57 -.19 .14
Occupation (ref: managers)
Professionals -2.11** -3.62 .09 2.32**
Associate professionals -3.84** -7.61* -2.41** -1.45
Clerical & secretarial -6.58** -9.08** -4.08** -3.49**
Craft & related -6.74** -11.25** -5.42** -5.39**
Personal & protective -8.14** -10.67** -5.58** -4.95**
Sales -7.87** -11.18** -5.19** -5.38**
Machine operatives -7.54** -11.69** -5.26** -5.28**
Elementary -8.43** -11.81** -6.14** -5.57**
Highest qualification
(ref: no qualifications)
NVQ1 .725* -.50 .55** .02
NVQ2 .846* -.85 .73** .45**
NVQ3 1.26* .44 1.01** .53**
NVQ4 .99** .76 .89** .35**
NVQ5 .81** 4.14** 3.84* 2.93**
Constant 14.06** 16.42** 10.68** 10.24**
N 9800 531 6103 4830
(Source: LFS)


63Other research reports available
Other research reportsavailableNo. Title ISBN Price
1. Thirty Families: Their living standards in unemployment 0 11 761683 4 £6.65
2. Disability, Household Income & Expenditure 0 11 761755 5 £5.65
3. Housing Benefit Reviews 0 11 761821 7 £16.50
4. Social Security & Community Care: The case of theInvalid Care Allowance 0 11 761820 9 £9.70
5. The Attendance Allowance Medical Examination:Monitoring consumer views 0 11 761819 5 £5.50
6. Lone Parent Families in the UK 0 11 761868 3 £15.00
7. Incomes In and Out of Work 0 11 761910 8 £17.20
8. Working the Social Fund 0 11 761952 3 £9.00
9. Evaluating the Social Fund 0 11 761953 1 £22.00
10. Benefits Agency National Customer Survey 1991 0 11 761956 6 £16.00
11. Customer Perceptions of Resettlement Units 0 11 761976 6 £13.75
12. Survey of Admissions to London Resettlement Units 0 11 761977 9 £8.00
13. Researching the Disability Working Allowance Self 0 11 761834 9 £7.25Assessment Form
14. Child Support Unit National Client Survey 1992 0 11 762060 2 £15.00
15. Preparing for Council Tax Benefit 0 11 762061 0 £5.65
16. Contributions Agency Customer SatisfactionSurvey 1992 0 11 762064 5 £18.00
17. Employers’ Choice of Pension Schemes: Report of aqualitative study 0 11 762073 4 £5.00

64
18. GPs and IVB: A qualitative study of the role of GPs inthe award of Invalidity Benefit 0 11 762077 7 £12.00
19. Invalidity Benefit: A survey of recipients 0 11 762087 4 £10.75
20. Invalidity Benefit: A longitudinal survey of new recipients 0 11 762088 2 £19.95
21. Support for Children: A comparison of arrangements 0 11 762089 0 £22.95in fifteen countries
22. Pension Choices: A survey on personal pensions in 0 11 762091 2 £18.95comparison with other pension options
23. Crossing National Frontiers 0 11 762131 5 £17.75
24. Statutory Sick Pay 0 11 762147 1 £23.75
25. Lone Parents and Work 0 11 762147 X £12.95
26. The Effects of Benefit on Housing Decisions 0 11 762157 9 £18.50
27. Making a Claim for Disability Benefits 0 11 762162 5 £12.95
28. Contributions Agency Customer Satisfaction Survey 1993 0 11 762220 6 £20.00
29. Child Support Agency National Client SatisfactionSurvey 1993 0 11 762224 9 £33.00
30. Lone Mothers 0 11 762228 1 £16.75
31. Educating Employers 0 11 762249 4 £8.50
32. Employers and Family Credit 0 11 762272 9 £13.50
33. Direct Payments from Income Support 0 11 762290 7 £16.50
34. Incomes and Living Standards of Older People 0 11 762299 0 £24.95
35. Choosing Advice on Benefits 0 11 762316 4 £13.95
36. First-time Customers 0 11 762317 2 £25.00
37. Contributions Agency National Client SatisfactionSurvey 1994 0 11 762339 3 £21.00
38. Managing Money in Later Life 0 11 762340 7 £22.00
39. Child Support Agency National Client Satisfaction 0 11 762341 5 £35.00Survey 1994
40. Changes in Lone Parenthood 0 11 7632349 0 £20.00
41. Evaluation of Disability Living Allowance and 0 11 762351 2 £40.00Attendance Allowance
42. War Pensions Agency Customer Satisfaction Survey 1994 0 11 762358 X £18.00
43. Paying for Rented Housing 0 11 762370 9 £19.00
44. Resettlement Agency Customer Satisfaction Survey 1994 0 11 762371 7 £16.00
Other research reports available

65
45. Changing Lives and the Role of Income Support 0 11 762405 5 £20.00
46. Social Assistance in OECD Countries: Synthesis Report 0 11 762407 1 £22.00
47. Social Assistance in OECD Countries: Country Report 0 11 762408 X £47.00
48. Leaving Family Credit 0 11 762411 X £18.00
49. Women and Pensions 0 11 762422 5 £35.00
50. Pensions and Divorce 0 11 762423 5 £25.00
51. Child Support Agency Client Satisfaction Survey 1995 0 11 762424 1 £22.00
52. Take Up of Second Adult Rebate 0 11 762390 3 £17.00
53. Moving off Income Support 0 11 762394 6 £26.00
54. Disability, Benefits and Employment 0 11 762398 9 £30.00
55. Housing Benefit and Service Charges 0 11 762399 7 £25.00
56. Confidentiality: The public view 0 11 762434 9 £25.00
57. Helping Disabled Workers 0 11 762440 3 £25.00
58. Employers’ Pension Provision 1994 0 11 762443 8 £30.00
59. Delivering Social Security: A cross–national study 0 11 762447 0 £35.00
60. A Comparative Study of Housing Allowances 0 11 762448 9 £26.00
61. Lone Parents, Work and Benefits 0 11 762450 0 £25.00
62. Unemployment and Jobseeking 0 11 762452 7 £30.00
63. Exploring Customer Satisfaction 0 11 762468 3 £20.00
64. Social Security Fraud: The role of penalties 0 11 762471 3 £30.00
65. Customer Contact with the Benefits Agency 0 11 762533 7 £30.00
66. Pension Scheme Inquiries and Disputes 0 11 762534 5 £30.00
67. Maternity Rights and Benefits in Britain 0 11 762536 1 £35.00
68. Claimants’ Perceptions of the Claim Process 0 11 762541 8 £23.00
69. Delivering Benefits to Unemployed People 0 11 762553 1 £27.00
70. Delivering Benefits to Unemployed 16–17 year olds 0 11 762557 4 £20.00
71. Stepping–Stones to Employment 0 11 762568 X £27.00
72. Dynamics of Retirement 0 11 762571 X £36.00
73. Unemployment and Jobseeking before Jobseeker’sAllowance 0 11 762576 0 £34.00
74. Customer views on Service Delivery in the Child SupportAgency 0 11 762583 3 £27.00
Other research reports available

66
75. Experiences of Occupational Pension Scheme Wind–Up 0 11 762584 1 £27.00
76. Recruiting Long–Term Unemployed People 0 11 762585 X £27.00
77. What Happens to Lone Parents 0 11 762598 3 £31.00
78. Lone Parents Lives 0 11 762598 1 £34.00
79. Moving into Work: Bridging Housing Costs 0 11 762599 X £33.00
80. Lone Parents on the Margins of Work 1 84123 000 6 £26.00
81. The Role of Pension Scheme Trustees 1 84123 001 4 £28.00
82. Pension Scheme Investment Policies 1 84123 002 2 £28.00
83. Pensions and Retirement Planning 1 84123 003 0 £28.00
84. Self–Employed People and National Insurance Contributions 1 84123 004 9 £28.00
85. Getting the Message Across 1 84123 052 9 £26.00
86. Leaving Incapacity Benefit 1 84123 087 1 £34.00
87. Unemployment and Jobseeking: Two Years On 1 84123 088 X £38.00
88. Attitudes to the Welfare State and the Response to Reform 1 84123 098 7 £36.00
89. New Deal for Lone Parents: Evaluation of Innovative 1 84123 101 0 £26.00Schemes
90. Modernising service delivery: The Lone Parent Prototype 1 84123 103 7 £26.00
91. Housing Benefit exceptional hardship payments 1 84123 104 5 £26.00
92. New Deal for Lone Parents: Learning from the Prototype 1 84123 107 X £29.00Areas
93. Housing Benefit and Supported Accommodation 1 84123 118 5 £31.50
94. Disability in Great Britain 1 84123 119 3 £35.00
95. Low paid work in Britain 1 84123 120 7 £37.00
96. Keeping in touch with the Labour Market 1 84123 126 6 £28.50
97. Housing Benefit and Council Tax Benefit delivery:Claimant experiences 1 84123 127 4 £24.00
98. Employers’ Pension Provision 1996 1 84123 138 X £31.50
99. Unemployment and jobseeking after the introductionof Jobseeker’s Allowance 1 84123 146 0 £33.00
100. Overcoming barriers: Older people and Income Support 1 84123 148 7 £29.00
101. Attitudes and aspirations of older people: A review ofthe literature 1 84123 144 4 £34.00
102. Attitudes and aspirations of older people: A qualitativestudy 1 84123 158 4 £29.00
Other research reports available

67
103. Relying on the state, relying on each other 1 84123 163 0 £27.00
104. Modernising Service Delivery: The Integrated Services 1 84123 162 2 £27.00Prototype
105. Helping pensioners: Evaluation of the Income SupportPilots 1 84123 164 9 £30.00
106. New Deal for disabled people: Early implementation 1 84123 165 7 £39.50
107. Parents and employment: An analysis of low incomefamilies in the British Household Panel Survey 1 84123 167 3 £28.50
108. Evaluation of the New Deal for Lone Parents: Early lessonsfrom the Phase One Prototype Synthesis Report 1 84123 187 8 £27.50
109. Evaluation of the New Deal for Lone Parents: Early lessonsfrom the Phase One Prototype Findings of Surveys 1 84123 3190 8 £42.50
110. Evaluation of the New Deal for Lone Parents: Early lessonsfrom the Phase One Prototype Cost-benefit andeconometric analyses 1 84123 188 6 £29.50
111. Understanding the Impact of Jobseeker’s Allowance 1 84123 192 4 £37.50
112. The First Effects of Earnings Top-up 1 84123 193 2 £39.50
113. Piloting change: Interim Qualitative Findings from theEarnings Top-up Evaluation 1 84123 194 0 £28.50
114. Building Up Pension Rights 1 84123 195 9 £33.50
115. Prospects of part-time work: The impact of the Backto Work Bonus 1 84123 196 7 £29.00
116. Evaluating Jobseeker’s Allowance 1 84123 197 5 £16.00
117. Pensions and divorce: The 1998 Survey 1 84123 198 3 £36.00
118. Pensions and divorce: Exploring financial settlements 1 84123 199 1 £24.00
119. Local Authorities and Benefit Overpayments 1 84123 200 9 £26.50
120. Lifetime Experiences of Self-Employment 1 84123 218 1 £31.50
121. Evaluation of the Pension Power for you Helpline 1 84123 221 1 £28.50
122. Lone Parents and Personal Advisers: Roles and Relationships 1 84123 242 4 £29.00
123. Employers’ Pension Provision 1 84123 269 6 £35.00
124. The Changing Role of the Occupational Pension SchemeTrustee 1 84123 267 X £25.00
125. Saving and Borrowing 1 84123 277 7 £28.50
126. First Effects of ONE 1 84123 281 5 £38.50
127. Why not ONE? 1 84123 282 3 £25.00
Other research reports available

68
128. The British Lone Parent Cohort 1991 to 1998 1 84123 283 1 £34.00
129. Housing Benefits and the Appeals Service 1 84123 294 7 £26.00
130. Pensions 2000 (Attitudes to retirement planning) 1 84123 295 5 £33.00
131. Earnings Top-up Evaluation: Effects on Unemployed People 1 84123 289 0 £38.00
132. Earnings Top-up Evaluation: Employers’ Reactions 1 84123 290 4 £29.50
133. Earnings Top-up Evaluation: Qualitative Evidence 1 84123 291 2 £30.00
134. Earnings Top-up Evaluation: Effects on Low Paid Workers 1 84123 292 0 £37.00
135. Earnings Top-up Evaluation: The Synthesis Report 1 84123 293 9 £27.50
136. Modernising Service Delivery: The Better Governmentfor Older People Prototypes 1 84123 300 5 £28.00
137. The Verification Framework: Early Experiences ofImplementation 1 84123 303 X £27.00
138. Low-income families in Britain: Work, welfare and socialsecurity in 1999 1 84123 312 9 £53.00
139. Recruiting benefit claimants: A survey of employers inONE pilot areas 1 84123 349 8 £26.50
140. Moving towards work: The short term impact of ONE 1 84123 352 8 £27.50
141. Incapacity Benefits and Work Incentives 1 84123 350 1 £28.00
142. Cross-country comparisons of pensioners’ incomes 1 84123 351 X £33.00
143. Evaluation of the New Deal for Disabled People InnovativeSchemes pilots 1 84123 353 6 £36.00
144. Evaluation of the New Deal for Disabled People PersonalAdviser Service pilot 1 84123 354 4 £44.00
145. ‘Well enough to work?’ 1 84123 360 9 £31.00
146. Payments of pensions and benefits: A survey of socialsecurity recipients paid by order book or girocheque 1 84123 370 6 £34.50
147. Evaluation of the Minimum Income Guarantee Claim Line 1 84123 381 6 £27.50
148. The role of GPs in sickness certification 1 84123 389 7 £28.50
149. The medium-term effects of voluntary participation in ONE 1 84123 393 5 £34.50
150. Recruiting Benefit Claimants: A qualitative study ofemployers who recruited benefit claimants 1 84123 394 3 £25.00
151. Moving between sickness and work 1 84123 397 8 £37.00
152. National Survey of Child Support Agency Clients 1 84123 398 6 £39.00
153. Families, poverty, work and care 1 84123 406 0 £38.50
Other research reports available

69
154. ONE year on: clients’ medium-term experiences of ONE 1 84123 407 9 £28.00
155. Barriers to employment for offenders and ex-offenders 1 84123 415 X £53.00
156. Short term effects of compulsory participation in ONE 1 84123 416 8 £46.50
157. The Dynamics of Poverty in Britain 1 84123 417 6 £32.00
158. Outcomes for children of poverty 1 84123 418 4 £33.00
159. Self-Funded Admissions to Care Homes 1 84123 420 6 £35.00
160. New Deal for Disabled People: National Survey ofincapacity benefits claimants 1 84123 421 4 £33.50
161. Low/moderate-income families in Britain: Work, WorkingFamilies’ Tax Credit and childcare in 2000 1 84123 426 5 £31.00
162. Evaluation of the Capability Report: Identifying thework-related capabilities of incapacity benefits claimants 1 84123 437 0 £29.00
163. Employers’ Pension Provision 2000 1 84123 419 2 £36.50
164. Low/moderate-income families in Britain: Changes inLiving Standards 1999-2000 1 84123 438 9 £32.50
165. Low- and moderate-income families in Britain: Changesin 1999 and 2000 1 84123 452 4 £35.00
166. Delivering a work-focused service: Final findings fromONE case studies and staff research 1 84123 450 8 £35.00
167. Delivering a work-focused service: Views and experiencesof clients 1 84123 451 6 £30.50
168. Findings from the Macro evaluation of the New Deal forYoung People 1 84123 464 8 £26.50
169. Costs and benefits to service providers of makingreasonable adjustments under Part III of the DisabilityDiscrimination Act 1 84123 476 1 £42.00
170. From job seekers to job keepers: Job retention, advancementand the role of in-work support programmes 1 84123 477 X £41.00
171. Qualitative research with clients: Longer term experiencesof a work-focused service 1 84123 478 8 £30.00
172. Social Fund use amongst older people 1 84123 485 0 £29.50
173. ‘Disabled for life?’ attitudes towards, and experiences of, 1 84123 493 1 £46.00disability in Britain
174. A comparison of Child Benefit packages in 22 countries 1 84123 506 7 £54.00
175. Easing the transition to work 1 84123 507 5 £34.00
176. Electronic government at DWP: Attitudes to electronicmethods of conducting benefit business 1 84123 508 3 £32.50
Other research reports available

70
177. Self-employment as a route off benefit 1 84123 509 1 £31.50
178. The wider benefits of education and training:a comparative longitudinal study 1 84123 517 2 £30.00
179. Refugees’ opportunities and barriers inemployment and training 1 84123 518 0 £34.50
180. Family change 1999 to 2001 1 84123 530 X £39.00
181. Working Families’ Tax Credit in 2001 1 84123 531 8 £27.50
Social Security Research Yearbook 1990–91 0 11 761747 4 £8.00
Social Security Research Yearbook 1991–92 0 11 761833 0 £12.00
Social Security Research Yearbook 1992–93 0 11 762150 1 £13.75
Social Security Research Yearbook 1993–94 0 11 762302 4 £16.50
Social Security Research Yearbook 1994–95 0 11 762362 8 £20.00
Social Security Research Yearbook 1995–96 0 11 761446 2 £20.00
Social Security Research Yearbook 1996–97 0 11 762570 1 £27.00
Social Security Research Yearbook 1997–98 1 84123 086 3 £34.00
Social Security Research Yearbook 1998–99 1 84123 161 4 £30.00
Social Security Research Yearbook 1999–2000 1 84123 286 6 £27.50
Social Security Research Yearbook 2000–2001 1 84123 427 3 £27.50
Further information regarding the content of the above may be obtained from:
Department for Work and PensionsAttn. Paul NoakesSocial Research DivisionInformation and Analysis Directorate4-26 Adelphi1–11 John Adam StreetLondon WC2N 6HT
Other research reports available


