Embed Size (px)
Citation preview

Workers’ Replacements and Firms’ Innovation Dynamics:
New Evidence from Italian Matched Longitudinal Data
Elena Grinzaa,∗, Francesco Quatrarob,c
aDepartment of Economics, Management, and Quantitative Methods, University of MilanbDepartment of Economics and Statistics ‘Cognetti de Martiis’, University of Turin
cCollegio Carlo Alberto
Abstract
In this paper, we explore the impact of a firm’s workers’ replacements on innovation performance,
by using rich matched employer-employee panel data for the Veneto region of Italy. We take
the well-known resource-based theory of the firm as our departure point, and develop a set
of hypotheses which we test empirically with negative binomial regressions. Coherently with
our theoretical framework, we find that workers’ replacements significantly dampen innovation
performance, because they generate losses in the tacit knowledge base of the firm. We also
find that workers’ replacements are especially detrimental to large and young firms, because
large companies have more hierarchical rigidities and innovative capabilities in young firms are
mostly dependent on specific human capital. Finally, our results show that firms’ localization in
industrial districts significantly mitigates the negative impact of workers’ replacements, and that
a similar picture emerges when firms are more exposed to knowledge spillovers, particularly of
related knowledge.
Keywords: Workers’ replacements, excess worker turnover, innovation performance, tacit
knowledge, knowledge spillovers, employer-employee matched longitudinal data.
JEL: J63, O30.
∗Corresponding author: [email protected]

1. Introduction
The relationship between firms’ innovation activities and labor market dynamics received much
attention in economics, both from a theoretical and empirical viewpoint.
The debate focused on a number of distinct and yet related issues. First, a large and contro-
versial debate about the impact of innovation on employment established in the literature. On
the one hand, innovation is expected to negatively affect employment because of replacement
effects. On the other hand, indirect mechanisms are expected to engender compensation effects
that ultimately result in employment growth (Pianta, 2005; Piva and Vivarelli, 2018). Second,
following the well-known skill-biased technological change hypothesis, many studies investigated
the relationship between technological change and the composition of the labor force in terms
of skills within firms and local areas (Acemoglu and Autor, 2011; Autor et al., 2003; Vona and
Consoli, 2015; Moretti and Thulin, 2013). A third set of studies focused on the impact of labor
market dynamics on firms’ innovation performance, with particular attention to the effects of
labor market deregulation and flexibility on firms’ ability to successfully carry out more or less
formalized innovation activities (Michie and Sheehan, 2003; Zhou et al., 2011; Kleinknecht et al.,
2014; Wachsen and Blind, 2016).
Within the latter strand of analysis, a large debate about the relationship between labor
mobility and firms’ innovation performance gained momentum in the last decade. This issue was
mainly tackled from a geographical viewpoint. In fact, the mobility of highly-qualified personnel
is regarded as one of the main channels for knowledge spillovers across different locations to
materialize (Agrawal et al., 2006; Simonen and McCann, 2008). This literature focused much on
the role of social ties and the interplay between spatial, technological, and cognitive proximity
in shaping the effectiveness of labor-driven knowledge flows. Firm-level studies also investigated
this issue from a strategic viewpoint. In fact, inter-firm labor mobility can be a source of knowl-
edge externalities, which may involve the transmission of relevant and confidential knowledge to
competitors. These dynamics affect firms’ human resources strategic management, which aims to
minimize workers’ separations and information leakage, and to improve innovation performance
by increasing the hiring of high-qualified human capital (Maliranta et al., 2009; Parrotta and
Pozzoli, 2012; Herstad et al., 2015; Kaiser et al., 2015).
While the benefits of hiring knowledge-intensive workers were largely documented, how labor
mobility affects firms’ innovation performance through the combination of hirings and separations
was less investigated. Yet, the churning of workers likely affects firms’ performance in many
respects. Workers’ replacements were found to affect firms’ financial and economic performance,
especially with respect to firm productivity (Grinza, 2016). Instead, there is much more scant
evidence on the relationship between workers’ replacements and firms’ innovation outcomes,
which mostly focused on the churning of R&D personnel (Muller and Peters, 2010; Cooper,
2001; Eriksson et al., 2014; Braunerhjelm et al., 2015).
2

Our paper contributes to this strand of literature by investigating the impact of workers’
replacements on firms’ innovation performance. In doing this, we take the well-known resource-
based theory of the firm as a departure point. In this theoretical framework, the firm is regarded
as the locus of competence accumulation, wherein technological and organizational knowledge
develops through the integration of formalized R&D activities and learning processes (Penrose,
1959; Foss, 1997, 1998). The emphasis on learning dynamics allows appreciating the importance
of all of the firms’ workers in the generation of new competencies leading to new knowledge. While
R&D activities are mostly related to the generation of codified knowledge, learning dynamics
are related to the generation of tacit knowledge, which is very likely to remain attached to the
people who developed it (von Hippel, 1994). The relevance of learning process in the generation of
tacit organizational knowledge makes firms’ human resources key to the achievement of strategic
objectives and the preservation of competitive advantage (Peteraf, 1993). To the best of our
knowledge, this paper represents the first attempt to look at the effect of workers’ replacements
on innovation performance within such a broader theoretical and empirical framework.
We carry out the empirical analysis on rich administrative matched employer-employee data,
which cover the entire private sector of the Veneto region of Italy over a 7-year period. These
data have the unique feature of providing a monthly-level history of job matches, which allows
constructing a detailed dynamics of firms’ workers’ replacements. They are merged with other
data sources to gather financial and patent information of firms. Balance sheet data are taken
from the Bureau van Dijk’s Analisi Informatizzata delle Aziende Italiane (AIDA) data set. In-
stead, we recover information on firms’ innovative performance and local knowledge stock from
the PATSTAT and OECD REGPAT data sets. To match patent data at the firm level, we draw
upon the procedure proposed by Lotti and Marin (2013).
The results of our empirical analyses provide support to our main hypothesis according to
which workers’ replacements are detrimental to firms’ innovation performance, because of the loss
of important tacit knowledge repositories. We also find that firms’ age and size are two important
factors that mediate the relationship between workers’ replacements and innovation performance.
Large and young firms are those that suffer from workers’ replacements. On the one hand, large
firms are penalized by more rigid hierarchical structures and lower capabilities to adapt to fast-
changing environments. On the other hand, young firms pay for the fact that they rely much
on innovative capabilities of specific workers rather than on practices rooted in the organization.
Moreover, we show that factors external to firms’ boundaries are crucial moderators of the
impact of workers’ replacements on innovation performance, too. Features such as being located
in industrial districts and in areas characterized by high knowledge spillovers (especially of related
knowledge) considerably mitigate the negative impact of workers’ replacements, thus pointing to
the importance of thicker social relationships and better integrated local labor markets.
The rest of the paper is as follows. Section 2 outlines the theoretical framework linking work-
3

ers’ replacements to innovation performance. Section 3 presents the empirical model. Section 4
describes the data and the variables used and presents relevant summary statistics. Section 5
shows and discusses our results. Finally, Section 6 concludes.
2. Theory and hypotheses development
A wide body of theoretical and empirical literature documented a positive impact of innovation
dynamics on firms’ economic and financial performance. Instead, studies on the relationship
between innovation and employment provided controversial results. While the impact of tech-
nological and organizational change on employment aroused much attention, how labor market
dynamics affect firms’ innovation performance received relatively scarce consideration.
The resource-based view of the firm provides a valuable framework to appreciate the impact
of workers’ replacements on firms’ innovation performance. According to Penrose (1959), firms
are bundles of resources and competencies. Distinctive competitive advantage emerges from the
ownership of idiosyncratic resources and competencies, and the ability of firms to combine them
in unique and effective ways (Mahoney, 1995). Improvements in the management of resources
and new ways to combine competencies allow firms to generate new knowledge and innovations.
In this framework, dynamic capabilities are firms’ ability to combine internal and external com-
petencies, achieve new configurations, address challenges from rapidly changing environments.
In other words, dynamic capabilities concern firms’ ability to set up innovative dynamics (Teece
et al., 1997).
Learning processes play a major role in enhancing the way firms manage and combine re-
sources and competencies to achieve competitive advantages (Arrow, 1962). In this sense, orga-
nizational knowledge is cumulative, in that it builds upon the previous experience and entails the
development of routines, which are the building blocks of competencies and capabilities (Nelson
and Winter, 1982; Dosi and Grazzi, 2010). Organizational routines concerning the creation of
novelty at the firm level can thus be regarded as the constituents of firms’ dynamic capabilities.
A basic issue relates to the extent to which these routines, and the emanating competencies,
are codified to preserve the organizational memory and provide the building blocks for future
changes and innovations, or they rather are embodied in tacit skills of relevant actors, that is,
firms’ employees (Dosi and Grazzi, 2006, 2010). Based on the seminal contribution of Polanyi
(1966), tacit knowledge received large attention in innovation studies. Knowledge is said to be
tacit when actors, even the most competent and experienced, are not able to fully articulate the
“procedures by which ‘things are done’, problems are solved, behavioral patterns are formed”
(Dosi and Grazzi, 2010, p.176). An important attribute of tacit knowledge is its stickiness, that
is, the difficulty with which it can be transmitted to other parties. Relevant resources have to
be committed to making a person’s tacit knowledge transferable and usable by others. This
makes tacit knowledge attached to the place in which it is produced, as well as to the actors that
4
developed it through learning dynamics (von Hippel, 1994).
Because of the importance of learning processes for the accumulation of organizational knowl-
edge enabling successful innovation dynamics, firms’ strategic decisions have to confront with the
need to deploy competencies and tacit skills to generate novelties (Neffke and Henning, 2013).
In view of the tacit dimension of knowledge emerging from learning dynamics, strategic deci-
sions also involve the management of human capital (Delery and Shaw, 2001; Shaw et al., 2013).
Consequently, workers’ replacements can be regarded as a factor hindering the development and
the preservation of organizational routines. This can be particularly harmful to innovation per-
formance, which depends to a large extent on learning and knowledge accumulation (Nelson and
Winter, 1982). These arguments lead us to spell out our first hypothesis.
Hypothesis 1: Workers’ replacements are negatively associated with firms’ innovation perfor-
mance.
The empirical literature on the determinants of innovative outputs at the firm level investi-
gated how key features such as firms’ age and size affect the capacity to generate new knowledge
and, eventually, new technologies. Empirical evidence is ambiguous, depending on how innova-
tion outcomes are proxied. Hansen (1992) found that age is negatively associated with innovation
when it is measured as the number of new products. Instead, Sørensen and Stuart (2000) found
that age has a positive impact when innovation is measured by patent applications. These results
are evidently influenced by the changing nature of firms’ innovation efforts across their life-cycle
(Utterback, 1994). Similarly, the evidence on the relationship between size and innovation is
non-univocal. According to the Schumpeterian tradition, large firms are expected to have an
advantage in producing innovations (Schumpeter, 1942; Galbraith, 1958). This is attributable
to a number of reasons, including financial structure and access to a wider range of knowledge
and human capital skills (Rogers, 2004). Yet, a number of studies stressed that both small and
large firms show comparative advantages in innovation, depending on the proxy that is used in
the empirical analyses. Large firms, in particular, exhibit a clear advantage when measures of
formalized innovation efforts are considered (Vaona and Pianta, 2008). These arguments lead us
to the following hypothesis:
Hypothesis 2a: Firms’ size and age are positively associated with the outcome of formalized
innovation activities.
While size and age are expected to have a direct impact on firms’ innovation performance, they
are also likely to influence the relationship between workers’ replacements and innovation, because
of how these features affect firms’ reliance on idiosyncratic human capital and organizational
routines. On the one hand, previous analyses stressed that young firms tend to rely mostly
on the skills possessed by younger workers, because of their stronger attitude to creativity and
5
novelty. In these firms, innovative capabilities are thus prevalently dependent on specific human
capital, rather than on organizational routines that are institutionalized in the organization.
Young firms are expected to be harmed by workers’ replacements more than old firms (Aubert
et al., 2006; Ouimet and Zarutskie, 2014; Coad, 2018). On the other hand, one advantage of small
firms, as compared to large companies, is the capacity to promptly recognize new opportunities
and to adjust their plans in research and production activities. Small firms may also find it easier
to allow less rigid management structures. Hence, thanks to lower hierarchical rigidities, small
firms may be more resilient than large companies to worker churning (Rogers, 2004). In view of
these considerations, we propose the following hypothesis:
Hypothesis 2b: Firms’ size and age moderate the effect of workers’ replacements on innovation
performance. Workers’ replacements are expected to affect young firms more than old firms,
while they are expected to affect small firms less than large companies.
According to a large number of studies, firms’ economic and innovation performance is affected
by place-specific external conditions, because of the role of technical, pecuniary, and knowledge
externalities (Antonelli and Colombelli, 2017; Antonelli et al., 2011). Based on the seminal work
by Glaeser, Kallal, Scheinkman, and Shleifer (1992), it is possible to identify two main classes of
externalities: the Marshall-Arrow-Romer (MAR) and the Jacobs’ externalities. MAR externali-
ties emerge from the spatial concentration of firms within a specific industry. Spatial proximity
may enhance firms’ performance because of three key channels: i) input-output linkages, ii) labor
market dynamics, and iii) knowledge spillovers (Marshall, 1890).
The second point is especially relevant for the relationship between workers’ replacements and
innovation. Indeed, labor market pooling is deemed a major source of agglomeration externalities.
According to Marshall (1890), spatial concentration matters in that it provides constant markets
for skills. Overman and Puga (2010) provided empirical evidence of the relationship between
industries’ degree of spatial concentration and employment volatility shocks, supporting the
labor market pooling hypothesis. Spatial concentration allows firms to cope with employment
shocks because of easiness in replacing skilled workers. Division of labor entails specialization
and favors the emergence of local markets for specialized competencies. Besides the pooling
effect, agglomeration economies from labor market can stem from matching dynamics. Spatial
concentration, in fact, favors the alignment of competencies between labor demand and supply as
well as learning by interacting, and it also reduces frictions related to information asymmetries
(Duranton and Puga, 2004). Based on these arguments, we can spell out the following hypothesis:
Hypothesis 3a: Firms’ localization in industrial districts mitigates the negative effects of work-
ers’ replacements.
Agglomeration externalities are also generated by knowledge spillovers. Several empirical
studies provided support to the important role of external knowledge in firms’ innovation per-
6

formance. Since Griliches (1992), the role of knowledge spillovers was found to be significant in
many different empirical settings. Knowledge spillovers increase the productivity of knowledge
generation activities for a given budget, because of the access to knowledge inputs generated by
other firms. Spatial proximity was found to be crucial for external effects to take place in this
case (Jaffe et al., 1993; Audretsch and Feldman, 1996; Quatraro and Usai, 2017). According to
this evidence, the larger the amount of knowledge produced by co-localized firms, the larger the
productivity of innovation activities of each firm in the area. Ceteris paribus, one thus expects
that high levels of knowledge spillovers can mitigate the negative effects of workers’ replace-
ments, because of overall productivity gains in the knowledge generation function (Antonelli and
Colombelli, 2015a,b). This leads us to the following hypothesis:
Hypothesis 3b: The high (low) availability of knowledge spillovers mitigates (augments) the
negative effects of workers’ replacements on firms’ innovation dynamics.
Jacobs’ externalities are also important in innovation dynamics. In fact, not only the local
stock of knowledge matters but also its composition. Jacobs’ externalities are traditionally
associated with the variety of firms and industries in a specific area. Recent theoretical and
empirical contributions extended the notion of Jacobs’ externalities to the analysis of knowledge
spillovers, stressing the relevance of knowledge variety for the rate of creation of new knowledge.
These studies are conceptually grounded on the recombinant knowledge theory (Weitzman, 1997;
Fleming and Sorenson, 2001). According to this view, the creation of novelty is the outcome of a
dynamics in which agents combine existing pieces of knowledge in new and unprecedented ways,
or they rather combine brand new pieces of knowledge. The degree of relatedness among these
components is likely to affect the knowledge generation process, in such a way that the higher
the relatedness, the higher the likelihood to engage in successful novelty creation (Nesta and
Saviotti, 2005; Quatraro, 2010; Antonelli and Colombelli, 2015a). An increasing variety of related
technologies leads to higher rates of innovation, because of the closeness of the competencies
they impinge upon. On the contrary, recombining unrelated technologies is more complicated,
because of the heterogeneity of the competencies they impinge upon. For this reason, successful
exploitation of loosely related knowledge requires deep familiarity with a firm’s routines and
capabilities, in order to spot fruitful recombination opportunities fitting firms’ resources and
innovation potential. These arguments lead us to our last hypothesis:
Hypothesis 3c: The high (low) degree of related knowledge variety mitigates (augments) the
negative effects of workers’ replacements on firms’ innovation dynamics.
The rest of the paper is dedicated to the empirical test of the three sets of hypotheses
elaborated above. The next section presents our empirical methodology.
7

3. The empirical model
To investigate the relationship between a firm’s innovation performance and workers’ replace-
ments, we use a knowledge production function (henceforth, KPF). The concept of KPF was
introduced by Pakes and Griliches (1980), and a first empirical analysis was carried out by Haus-
man et al. (1984). It represents to date the standard way to estimate the association between a
variety of factors, including workforce characteristics, and innovation output (e.g., Bronzini and
Piselli, 2016).
In its most general specification, a KPF takes the following form:
Innovation output = f(Innovation inputs). (1)
It relates a firm’s innovation output to a vector of innovation inputs. Innovation inputs include
investments in R&D and an array of other variables which influence innovation performance,
such as industry- and province-specific features and human resources characteristics. We include
workers’ replacements, our object of interest, in the set of innovation inputs. In the previous sec-
tion, we highlighted several mechanisms in which workers’ replacements can influence innovation
performance. Estimating Equation (1) will give us an empirical test of this.
Since, as it is standard in the literature, we measure a firm’s innovation capability through
the number of patent applications, we use count data models and estimation methods. They are
more appropriate than linear models when dealing with dependent variables that take on non-
negative integer values, as in our case. We model the expected number of patent applications of
firm i in year t, Pit, as follows:
E[Pit|R&Dit−1, EWTRit−1, Xit−1] = λit = exp(βR&Dit−1 + θEWTRit−1 + γXit−1). (2)
R&D are R&D investments; EWRT is the excess worker turnover rate, our measure of workers’
replacements (see Subsection 4.3); and X is a series of other workforce and firm characteristics
and several fixed effects, included as controls. To avoid any spurious relationships, we lag all
the explanatory variables by one year. This is a standard practice in the literature, and also has
the advantage to capture dynamics in the impact, which generally takes time to materialize as
producing innovation is a relatively long-run process (Nesta and Saviotti, 2005).
We estimate this model by using maximum likelihood for the negative binomial distribution.
We prefer negative binomial models over Poisson models as the equality between the mean
and variance of the dependent variable assumed by Poisson models is not verified in our data.
The distribution of the number of patent applications, in fact, is substantially over-dispersed:
the variance is about 4 times higher than the mean (see Table 1). Moreover, Voung tests of
zero-inflated versus standard negative binomial models speak in favor of the standard version.
Similarly, Vuong tests for hurdle models suggest that standard negative binomial models offer a
8

better description of the data generating process.
4. The data
4.1. The Veneto case
In this paper, we use data for Veneto, an administrative region in the Northeast of Italy with
around 5 million people. During the 1970s and 1980s, Veneto underwent a fast industrialization
process that transformed it into one of the richest Italian regions. Veneto firms are typically
small and operate in the manufacturing industry, particularly in the sectors of chemicals, metal-
mechanics, and electronics. Veneto is characterized by the division of the territory into industrial
districts, in which firms belonging to similar sectors share much in terms of knowledge and
network base.
Italy has traditionally been considered as a country with strict employment protection rules
(Kugler and Pica, 2008). Yet, despite Italian politicians have long aimed to limit workers’
movements, the degree of labor mobility in Italy was in line with that of other countries known
for their labor market flexibility, such as the UK (Contini et al., 2008). The causes of this reside
in widespread illegal practices, fragile control systems, and contradictory laws. Interestingly, the
Veneto labor market was even more mobile (Tattara and Valentini, 2003). This feature makes
our Veneto data a valuable ground for estimating economic impacts of worker flows (Serafinelli,
2018).
4.2. The data sets
Our data are the result of the match of three separate data sources: Veneto Workers History
(VWH), Analisi Informatizzata delle Aziende Italiane (AIDA), and PATSTAT together with
OECD REGPAT.
Giuseppe Tattara and his team at the University of Venice constructed VWH starting from
administrative data of the Italian Social Security System. The VHW data set collects labor
market histories between 1975 and 2001 of each employee working for at least one day in the
Veneto private sector (except for agriculture). It is organized in three parts. There is the
worker archive, which gathers personal information of the worker (e.g., gender, age, and place
of birth); the job archive, which contains job information (e.g., hiring date, separation date, if
applicable, contract type); and the firm archive, which stores information on the firm (e.g., the
firm’s national tax number, used as a firm identifier, location, and industry). This structure
makes VWH a longitudinal matched employer-employee data set.1
1See Tattara and Valentini (2010) and http://www.frdb.org/page/data/scheda/
inps-data-veneto-workers-histories-vwh/doc_pk/11145 for details on VWH. Note, however, thatboth documents refer to a restricted version of the data, which only covers the Veneto provinces of Treviso andVicenza.
9

Unfortunately, VWH does not include financial information of firms. Yet, Bureau van Dijk
provides AIDA yearly since 1995. It contains detailed information on balance sheets of all (non-
financial and non-agricultural) incorporated private companies in Italy with annual sales above
500 thousand Euros. The AIDA variables include R&D expenditures, revenues, and the firm’s
national tax number.2
Through the firms’ national tax number it is possible to match worker and job information
in VWH with balance sheet information in AIDA. David Card, Francesco Devicienti, and Agata
Maida conceived and conducted this match, which they carefully describe in Card et al. (2013).
The result is a longitudinal matched employer-employee data set, VWH-AIDA, which covers
the period 1995-2001 and collects job histories of all employees in all the (non-financial and
non-agricultural) incorporated private Veneto firms with revenues greater than 500 thousand
Euros.
The third source of information, that related to a firm’ innovation output and local knowledge
stock, derives from PATSTAT and OECD REGPAT, respectively. The first is the well-known
patent data set provided by the European Patent Office. It collects a wealth of patent informa-
tion, including when the patent application was filed and who the applicants were. The second
data set, distributed by the OECD and obtained starting from PATSTAT, provides aggregated
information on knowledge stock of local areas at a fine-grained level. To match patent information
from PATSTAT with VWH-AIDA, we draw upon the matching procedure between PATSTAT
and AIDA firms developed by Lotti and Marin (2013).
4.3. The variables
In the empirical analysis, we measure a firm’s innovation output with the (capitalized) number
of patent applications filed by the firm.
As Davis et al. (1996), we measure a firm’s workers’ replacements through the excess worker
turnover, expressed as follows:
hirings: number of workers hired between t− 1 and t;
separations: number of workers separated between t− 1 and t;
worker turnover: sum of hirings and separations between t− 1 and t;
net job creation: difference between the number of employees at t and t− 1;
excess worker turnover: difference between worker turnover and the absolute value of net job
creation.
2See https://www.bvdinfo.com/en-gb/our-products/data/national/aida#secondaryMenuAnchor0 fordetails on AIDA.
10
An example clarifies these definitions. Let us consider a company with 50 employees at
the beginning of the year, which hires 5 workers immediately after and does not separate from
anyone during the rest of the year. The number of workers at the end of the year is 55. This
firm experiences 5 hirings, 0 separations, worker turnover equal to 5 (5 hirings + 0 separations),
and excess worker turnover equal to 0, as worker turnover compensates exactly for job creation.
Let us consider another firm, with 50 employees at the beginning of the year, which hires 10
workers and separates from 5 immediately after. Assume that nothing changes for the rest of
the year, so that the number of workers at the end of the year is 55, exactly as in the previous
case. Here, however, the firm experiences 10 hirings, 5 separations, worker turnover equal to 15
(10 hirings + 5 separations), and excess worker turnover equal to 10 (15 − 5, where 15 is worker
turnover and 5 is job creation). While the first firm increases its workforce by simply hiring 5
new workers, the second firm does so by hiring 10 workers and separating from 5. Hence, in the
latter case, the firm replaces 5 of its workers with 5 new ones and the excess worker turnover
measures this.3
In our regressions, we express excess worker turnover in rates (Davis et al., 1996). We divide
excess worker turnover by the average number of workers (computed as the average between the
number of workers in January and December of a given year). It is vital to express excess worker
turnover in rates in the estimating equations because this takes into account the firm’s size and
the relative weight of workers’ replacements (e.g., replacing 10 more workers in a 50-employee
company is much different from replacing 10 more workers in a 500-employee firm).
Generally, researchers obtain worker flows on the basis of yearly-level information on the stock
of workers in the firm. Instead, we can bank on a finer, monthly-level information. Therefore,
we can get more precise measures of worker flows, which account for work relations that start
and end within a year.4
4.4. Sample construction and descriptive statistics
In this paper, we focus on manufacturing companies with at least 50 employees operating in the
top innovative industries: chemicals, metal-mechanics, electronics, and automotive.5
We carry out an essential cleaning of the sample to remove unusable observations or obser-
vations representing particular cases that can bias the estimates. The first issue is that VWH
refers to establishment-level data (i.e., it reports information for all the Veneto establishments of
3Excess worker turnover is always twice the number of replacements. This is because a replacement convertsinto two worker flows, one separation and one hiring.
4Thanks to the monthly-level structure of our data, we can construct a large series of workforce controls (e.g.,the shares of females, foreigners, and so on) by weighting workers on a monthly basis. For example, to computethe share of females, a woman who is employed for only four months weights three times less than a womanemployed for the whole year.
5These are the top-25% 2-digit industries in terms of percentage of firms that innovate (i.e., have at least onepatent filed in the year).
11

a firm), while AIDA refers to firm-level data (i.e., possibly including non-Veneto establishments).
To alleviate this potential bias, we exclude firms for which the number of employees reported by
VWH is less than a half compared to that reported by AIDA. Second, we only consider firms
established (still alive) at least one calendar year before (after) we observe them. We do this
to exclude excess worker turnover derived from firm entry (exit), which is not the focus of this
paper.6 Third, we restrict the analysis to firms classified as ‘active’, thereby excluding firms that
are closing down. Finally, we remove a few (outlier) firms with excess worker turnover rates
greater than 1, meaning that at least 50% of the workforce is replaced with new employees in a
given year.
The data set used in our empirical analysis is the firm-level collapsed version of the (cleaned)
matched employer-employee data set. It consists of 1,565 firm-year observations.
Table 1 provides general descriptive statistics about workforce and firm characteristics. On
average, firms in the sample have 0.6 patents filed each year and invest around 0.3% of their
revenues in R&D. They employ about 153 workers and earn about 29 million Euros per year in
revenues. The average firm is about 18 years old and gets 25 Euros of net profit out of 1,000
Euros of revenues. In the average company, only 17.7% of the workers are females, consistently
with the fact that the industries in which we focus are predominantly male industries; 4.3% are
foreigners; employees are, on average, about 35 years old; and a few of them are employed on a
part-time basis (2.4%) or are temporary workers (3.9%). In the average firm, the vast majority
of employees are blue- (65.1%) or white-collar (29.4%) workers. A few of them are apprentices
(2.2%) or managers (2.6%). On average, workers stay in the same firm for about 7.6 years.
INSERT TABLE 1 AROUND HERE
Table 2 focuses on job and worker flows. As reported in the top panel, the average firm (with
153 employees) hires 27 workers and separates from 22 in any given year. Hence, it experiences
a worker turnover of 49 (27 hirings + 22 separations) and a net job creation of 5 (27 hirings −22 separations). In principle, the average firm could accommodate this job creation by hiring
5 workers and separating from none. Instead, it hires 27 workers and separates from 22, thus
replacing 22 of its workers with 22 new ones and experiencing an excess worker turnover equal
to 44.7 The second panel of Table 2 reports rates of job and worker flows. On average, firms
increase their workforce by 4.8% per year. The average hiring and separation rates are 0.207 and
0.160, respectively, so that the worker turnover rate is 0.367. The average excess worker turnover
rate is 0.286, meaning that 14.3% of the workforce is replaced each year.
INSERT TABLE 2 AROUND HERE
6For the last year of observation we cannot identify which firms close down in the subsequent year.7Table 2 reports the exact numbers. Here, we use integer numbers to make the discussion about the ‘typical
firm’ realistic.
12
Finally, Table 3 reports the correlation matrix of the (continuous) variables used in our regres-
sions. Interestingly, the correlation between a firm’s innovation output and workers’ replacements
appears to be negative (-0.122) and significant at the 1% level. This is a first indication that
workers’ replacements may dampen a firm’s innovation output. The following econometric anal-
ysis will shed more light on this, by accounting for several potentially confounding workforce and
firm characteristics and possible simultaneity bias.
INSERT TABLE 3 AROUND HERE
5. Results
5.1. Main results
The results of our econometric estimations are reported in Table 4. All the estimations include
year, industry, and province dummies. The first column presents the baseline estimations. The
coefficient of the excess worker turnover rate is negative and significant, as predicted by our Hy-
pothesis 1. Workers’ replacements hinder the dynamics of innovation, because of the importance
of individual learning dynamics and knowledge embeddedness. When workers leave, they bring
with themselves firm-specific knowledge about competencies and routines, as well as about the
potential for resource combination for the creation of novelty. The incoming of new replacement
workers, with their own tacit knowledge base which might be valuable to the firm, does not
appear to compensate this negative effect.
INSERT TABLE 4 AROUND HERE
In Column (2) we show an extended version of the model, which includes several firm-specific
controls. First of all, we include two types of variables related to learning dynamics. Firms’
age shows a positive and significant coefficient, supporting the importance of dynamic scale
economies. As for workers’ age, we test for the presence of non-linearities in the impact on
innovation. We find that workers’ age and firms’ innovation are linked by an inverted U-shape
relationship. Learning dynamics at the individual level are important, but diminishing returns
are likely to emerge because of skill obsolescence. The impact of size is assessed by using the log of
firms’ revenues. The coefficient of this variable is positive and significant. These results support
Hypothesis 2a, according to which firms’ size and age are expected to yield direct positive and
significant effects on innovation. The negative and significant effect of excess worker turnover is
confirmed also in this setting.
As for the other control variables, the coefficient of R&D intensity is positive and significant,
as expected. Moreover, the dummy variable indicating the location within an industrial district
is characterized by a positive and significant coefficient. This is in line with the literature
emphasizing the role of externalities in innovation dynamics. Agglomeration economies favor
13

the access to external knowledge produced by co-localized firms, which, in turn, is used as an
input in firm-level generation of innovation. The shares of both female and foreign workers are
featured by positive and significant coefficients.
In Columns (3) and (4), we extend the set of control variables, finding a persistent negative
and significant coefficient of the excess worker turnover rate. In Column (5), we check for possible
non-linearities in the effect of our variable of interest, but our results do support only the existence
of a linear effect, the coefficient of the quadratic term not being statistically significant. Finally,
in Column (6) we substitute our focal regressor and introduce three dummy variables indicating
low, medium, and high levels of excess worker turnover rate, respectively. We find that the
coefficient of the lowermost class is not statistically significant, while the coefficient for medium
and high levels of excess worker turnover rate is negative and significant. This suggests that the
effect is stronger the higher is the replacement activity.
Overall, this first set of estimates provides robust support to our Hypotheses 1 and 2a,
according to which excess worker turnover hinders firms’ innovation dynamics, while size and
age are positively associated with the outcomes of formalized innovation activities.
Yet, size and age are also expected to moderate the impact of excess worker turnover on
innovation. In particular, the literature discussed in Section 2 suggests that young firms are
expected to be more sensitive to excess worker turnover than old firms, while small firms are
likely to be more resilient to workers’ replacements than large firms.
We test these expectations by running additional estimations, the results of which are reported
in Table 5. Note that all the regression results from now on use the same set of controls as
Specification (3) of Table 4. In the top panel of Table 5, we report evidence about the moderating
effect of size. This latter is measured by using either revenues (as in Table 4) or employment. Let
us start with the case of size measured through revenues. The coefficient of the excess worker
turnover rate in the standard regression is indeed -1.080, as in Column (3) of Table 4. The
moderating effect of size is obtained by interacting revenues with the excess worker turnover rate.
Specifically, we build two dummy variables distinguishing firms with low versus high revenues.
We follow the standard threshold for large firms proposed by the European Commission and
set at 50 million Euros of revenues per year.8 The results suggest that large firms are much
more sensitive than small companies to the effect of workers’ replacements, as signaled by the
marked difference between the two coefficients, as well as by the fact that the interaction with the
uppermost revenue class shows a statistically significant coefficient, while the other interaction
does not. We also check the robustness of these results by using the number of employees as
a proxy of firm size. The results are very similar to those obtained by using revenues and, in
fact, the two variables show a sensible correlation (0.855). The coefficient of the interaction with
8For details, see http://ec.europa.eu/eurostat/statistics-explained/index.php/Archive:Small_
and_medium-sized_enterprises.
14
the dummy variable identifying small firms (with 250 or fewer employees - also here we follow
the classification of the European Commission) is not statistically significant in this case, too.
Conversely, the effect on large firms (with more than 250 employees) is large and significant.
INSERT TABLE 5 AROUND HERE
The bottom panel of Table 5 shows, instead, the results about the moderating role of firm age.
We follow two distinct strategies. First, we interact the excess worker turnover rate with firm
age (continuous variable). We obtain a positive and significant coefficient. This suggests that,
other things being equal, the older is the firm, the smaller is the overall impact of excess worker
turnover on innovation. Second, we create three age classes, build the correspondent dummy
variables, and multiply each of them by the excess worker turnover rate. We obtain consistent
results. In particular, the coefficient for firms in the uppermost age class is not significant,
while the coefficients for firms in the intermediate and lowermost age classes are negative and
significant. It must also be noted that the coefficient for firms in the lowermost age class is ten
times larger than that for firms in the intermediate class.
Overall, these results provide support to our Hypothesis 2b. First, small firms are more
resilient to workers’ replacements than large firms. This is because of the higher flexibility and
capacity to adjust their plans that characterize small firms. Second, old firms are less damaged by
workers’ replacements than young firms, because the latter strongly rely on individual capacity
and specific human capital in their innovative dynamics.
5.2. Innovation, workers’ replacements, and the role of external factors
The first set of results confirms our hypothesis about the negative impact of excess worker
turnover on firms’ innovation output, and sheds light on the moderating role of two important
variables, size and age, which are well-known major sources of heterogeneity in firms’ economic
and innovative performance.
In Section 2, we stressed that also factors external to firms’ boundaries can influence the
impact of workers’ replacements on innovation.
First, we set forth the hypothesis that firms within industrial districts suffer less from work-
ers’ replacements compared to firms outside industrial districts (Hypothesis 3a). This is because
of labor pooling dynamics and job matching effects. Spatial clustering and localized industrial
specialization increase the probability to replace workers that abandoned the firms with new
workers holding the requested (and missed) competencies. We investigate the impact of localiza-
tion in industrial districts by building two dummy variables covering firms within districts and
firms that are outside.9 The results of the estimations are reported in the first panel of Table
9We identify industrial districts from the list given by the Osservatorio Nazionale dei Distretti Industriali (theItalian monitoring center of industrial districts). For a detailed list, see http://www.osservatoriodistretti.
org/category/regione/Veneto.
15
6. While the effect of workers’ replacements on innovation is not significant in firms localized
within industrial districts, firms localized outside these areas significantly suffer from workers’
replacements. The coefficient of the excess worker turnover rate for these latter firms is indeed
large and significant.
INSERT TABLE 6 AROUND HERE
Next, we investigate whether the impact of workers’ replacements varies with the availabil-
ity of knowledge spillovers in the areas in which firms localize (Hypothesis 3b). Knowledge
spillovers are measured by aggregating all the Veneto firms’ patent stock at the NUTS 3 level
(i.e., provinces). In areas with large amounts of available knowledge stock, the general efficiency
of firms’ innovation activities is expected to be high, as compared to areas characterized by
scarcity of external knowledge. Moreover, the high spatial concentration of knowledge increases
the likelihood that local human capital access and absorb place- and industry-specific competen-
cies that can be useful for co-localized firms. These dynamics render workers’ replacements less
harmful for firms operating in areas with high levels of aggregate knowledge stock. As before,
to explore this issue we build up two dummy variables capturing firms’ location in areas with
high versus low levels of knowledge spillovers. As for agglomeration externalities, the effect of
workers’ replacements in firms located in areas characterized by high knowledge externalities is
not significant. Conversely, workers’ replacements largely dampen innovation performance when
firms cannot access to high knowledge externalities (second panel of Table 6).
Finally, we hypothesized that knowledge variety can moderate the effects of workers’ replace-
ments on innovation. The dispersion of individual technological competencies across a wide array
of fields makes more difficult the matching between firms’ needs and human capital specializa-
tion. We also hypothesized that this negative moderation is driven by unrelated versus related
technological variety (Hypothesis 3c). We report the results of our estimations in the third and
fourth panels of Table 6. As before, we create relevant dummy variables identifying the different
contexts in which the firms are located. The degree of knowledge variety of an area is measured
by the information entropy at the NUTS 3 level. The degree of unrelated and related knowledge
variety is measured by the between and within information entropy rates, respectively, again
measured at the NUTS 3 level. In the regressions, we insert the ratio between the unrelated
and related components of knowledge variety. First, as expected, firms located in areas with
high technological variety experience a negative and significant effect of workers’ replacements.
Conversely, firms located in areas with low levels of knowledge variety are not significantly af-
fected by excess worker turnover (third panel of Table 6). The breakdown of variety in its related
and unrelated components is also in line with expectations. For firms operating in areas with
high levels of the unrelated/related ratio (i.e., featured by the prevalence of unrelated variety),
workers’ replacements significantly harm innovation performance. Conversely, for firms located
16
in areas with low levels of this indicator (i.e., featured by the prevalence of related variety), the
negative impact of workers’ replacements vanishes.
Overall, this second set of estimates confirms that the features of the external environment in
which firms operate largely influence the impact of excess worker turnover on innovation dynam-
ics. The channel is the distribution of skills and technological components among individuals in
local labor markets.
6. Conclusions
In this paper, we investigated the impact of workers’ replacements, captured by excess worker
turnover, on firms’ innovation dynamics. Our main argument hinges on the resource-based view of
the firm and the importance of workers’ learning dynamics in the accumulation of tacit knowledge
and in the development of organizational routines, which are major drivers of firms’ innovation.
Workers’ replacements imply the loss of organizational knowledge embodied in individuals and
accumulated over time through on-the-job learning. This, in turn, is likely to hinder firms’
innovation outcomes. Moreover, we investigated the moderating role of factors both internal
and external to the firm. The former concerns firm’s age and size, while the latter includes
agglomeration externalities, knowledge spillovers, and technological variety.
Our empirical investigation is based on matched employer-employee data for the Veneto region
of Italy in the period 1995-2001. These data were merged with other information sources: Bureau
van Dijk’s AIDA and the PATSTAT and OECD REGPAT data sets. We implemented negative
binomial estimations to assess the impact of excess worker turnover rate, as well as the influence
of hypothesized moderating factors.
Our results confirm that excess worker turnover is negatively associated with firms’ inno-
vation outcomes. This result is persistent across all of the implemented models. As for the
interacting factors, we find that both firms’ size and age play an important role. In particu-
lar, our results suggest that young and large firms are more sensitive to the negative effects of
workers’ replacements on innovation. Moreover, agglomeration externalities allow mitigating the
effect of workers’ replacements, and the same applies to availability of local knowledge spillovers.
Instead, variety is found to amplify the negative impact of excess worker turnover on innovation.
We grounded the interpretation of these results on the basis of the theory discussed in Section
2, which identifies labor pooling dynamics as the main channel driving the influence of external
factors on the relationship between workers’ replacements and innovation.
As many other empirical investigations, also this one presents some caveats to be mentioned.
First, the geographical coverage is limited to the Veneto region. Though it is part of the more
advanced North-East regions in Italy, it cannot be considered as representative of country dy-
namics. Yet, our data have the unique advantage of referring to the entire population of Veneto
firms, thus allowing us to have a complete view of a self-contained labor market. Second, the time
17
coverage is limited to the early 2000s, leaving aside the most recent years, which are characterized
by fiercer technology-based competition. Both these limitations are due to data constraints.
Yet, the study brings about important implications from both a strategic management and
policy perspective. As for the former, our results suggest that workers’ mobility is detrimental to
firms’ innovation dynamics. This would seem to be at odds with the findings reported in Grinza
(2016), wherein excess workers turnover is found to have a positive impact on firm productivity.
On the contrary, this latter can be interpreted as an outcome of imitation externalities. Firms
willing to increase their productivity by means of replication of competitors’ routines and tech-
nologies will benefit from workers’ mobility. Conversely, firms’ willing to stand competitive by
means of innovation should find out measures to promote experienced workers to stay instead
of migrating to other firms. Experienced workers represent indeed a crucial asset for innovative
firms because they are repositories of organizational knowledge and routines, and, for this reason,
they are to be regarded as a source of opportunities to generate novelty that valorizes firms’ core
competencies.
From the viewpoint of labor policies, this paper suggests that one-size-fits-all solutions cannot
be supported. Also, these results challenge the idea that labor mobility is positive in absolute.
Clearly, policy makers are not expected to obstacle labor mobility to promote innovation. Our
results rather imply that some firms in specific places and industries would benefit from labor
mobility more than others. Therefore, the promotion of labor mobility should especially be
targeted towards areas characterized by low innovation performances, and stronger reliance on
imitation strategies.
This study opens up stimulating avenues for further research. First, from the viewpoint of
firms’ innovation strategies, it would be interesting to assess the differential impact of excess
workers turnover on exploration versus exploitation strategies. Moreover, our results call for
further refinements of the analyses to better understand the channels behind the negative impact
of workers’ replacements on innovation, by exploiting the information on workers’ histories, and,
in particular, by looking at their previous employment and qualifying their experience in terms
of sectoral and technological variety as well as of relatedness to their current activity.
18
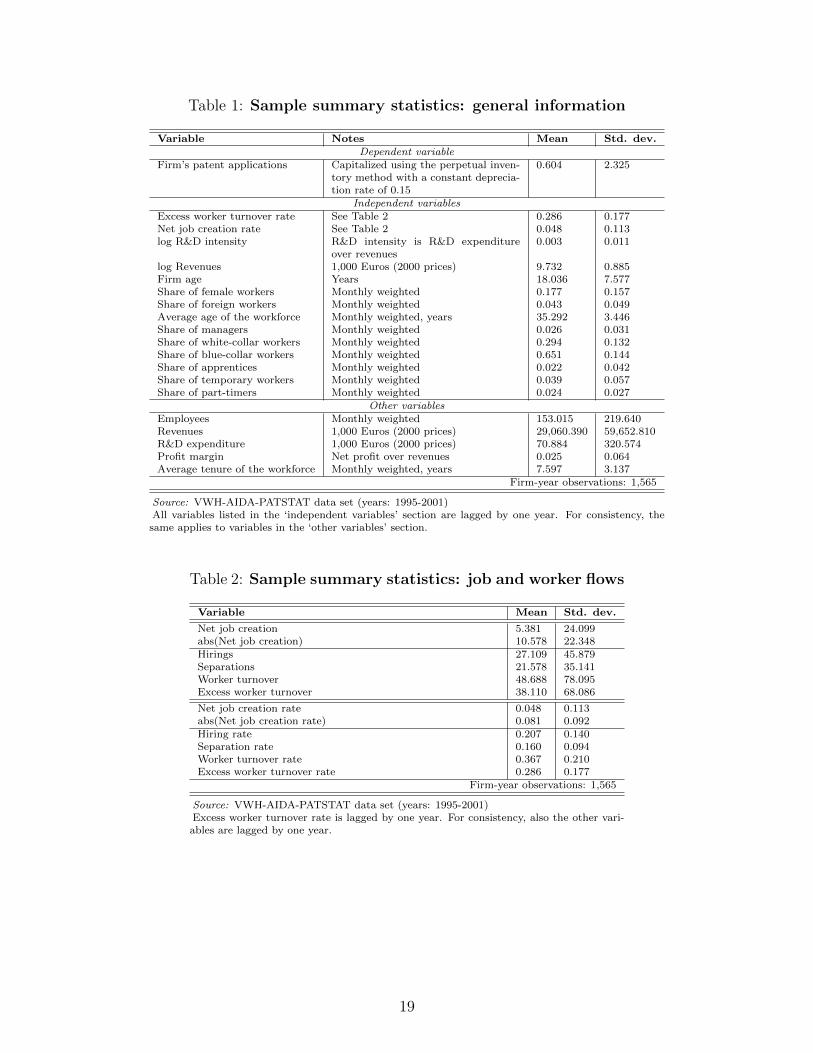
Table 1: Sample summary statistics: general information
Variable Notes Mean Std. dev.Dependent variable
Firm’s patent applications Capitalized using the perpetual inven-tory method with a constant deprecia-tion rate of 0.15
0.604 2.325
Independent variablesExcess worker turnover rate See Table 2 0.286 0.177Net job creation rate See Table 2 0.048 0.113log R&D intensity R&D intensity is R&D expenditure
over revenues0.003 0.011
log Revenues 1,000 Euros (2000 prices) 9.732 0.885Firm age Years 18.036 7.577Share of female workers Monthly weighted 0.177 0.157Share of foreign workers Monthly weighted 0.043 0.049Average age of the workforce Monthly weighted, years 35.292 3.446Share of managers Monthly weighted 0.026 0.031Share of white-collar workers Monthly weighted 0.294 0.132Share of blue-collar workers Monthly weighted 0.651 0.144Share of apprentices Monthly weighted 0.022 0.042Share of temporary workers Monthly weighted 0.039 0.057Share of part-timers Monthly weighted 0.024 0.027
Other variablesEmployees Monthly weighted 153.015 219.640Revenues 1,000 Euros (2000 prices) 29,060.390 59,652.810R&D expenditure 1,000 Euros (2000 prices) 70.884 320.574Profit margin Net profit over revenues 0.025 0.064Average tenure of the workforce Monthly weighted, years 7.597 3.137
Firm-year observations: 1,565
Source: VWH-AIDA-PATSTAT data set (years: 1995-2001)All variables listed in the ‘independent variables’ section are lagged by one year. For consistency, thesame applies to variables in the ‘other variables’ section.
Table 2: Sample summary statistics: job and worker flows
Variable Mean Std. dev.
Net job creation 5.381 24.099abs(Net job creation) 10.578 22.348Hirings 27.109 45.879Separations 21.578 35.141Worker turnover 48.688 78.095Excess worker turnover 38.110 68.086
Net job creation rate 0.048 0.113abs(Net job creation rate) 0.081 0.092Hiring rate 0.207 0.140Separation rate 0.160 0.094Worker turnover rate 0.367 0.210Excess worker turnover rate 0.286 0.177
Firm-year observations: 1,565
Source: VWH-AIDA-PATSTAT data set (years: 1995-2001)Excess worker turnover rate is lagged by one year. For consistency, also the other vari-ables are lagged by one year.
19

Table 3: Sample summary statistics: correlation matrix
pat ewtr ewtr-sq ewtr1 ewtr2 ewtr3 njcr lni lnrev f-age fem for age age-sq man wc bc app temp ptFirm’s patent applica-tions (pat)
1
Excess workerturnover rate (ewtr)
-0.122 1
Excess workerturnover rate -squared (ewtr-sq)
-0.094 0.951 1
Excess workerturnover rate - whenlow (ewtr1)
0.088 -0.370 -0.232 1
Excess workerturnover rate - whenmedium (ewtr2)
-0.013 -0.394 -0.438 -0.300 1
Excess workerturnover rate - whenhigh (ewtr3)
-0.090 0.930 0.901 -0.223 -0.699 1
Net job creation rate(njcr)
-0.050 0.225 0.202 -0.156 -0.016 0.183 1
log R&D intensity(lni)
0.003 0.008 0.001 -0.000 0.008 0.002 0.005 1
log Revenues (lnrev) 0.355 -0.164 -0.140 0.036 0.091 -0.162 -0.024 -0.035 1Firm age (f-age) 0.081 -0.142 -0.136 0.058 0.010 -0.112 -0.152 -0.076 0.036 1Share of female work-ers (fem)
0.131 0.098 0.083 -0.044 -0.056 0.099 0.042 -0.063 -0.046 -0.092 1
Share of foreign work-ers (for)
-0.016 0.345 0.336 -0.110 -0.144 0.323 0.014 0.047 -0.020 -0.008 0.037 1
Average age of theworkforce (age)
0.144 -0.407 -0.350 0.205 0.107 -0.359 -0.297 -0.041 0.190 0.306 -0.250 -0.065 1
Average age of theworkforce - squared(age-sq)
0.148 -0.404 -0.344 0.212 0.099 -0.355 -0.297 -0.046 0.184 0.297 -0.238 -0.072 0.998 1
Share of managers(man)
0.281 -0.210 -0.176 0.133 0.055 -0.188 -0.093 -0.008 0.342 0.000 0.096 -0.049 0.261 0.262 1
Share of white-collarworkers (wc)
0.108 -0.189 -0.183 0.024 0.131 -0.197 -0.031 0.118 0.191 -0.048 -0.054 -0.119 0.121 0.114 0.326 1
Share of blue-collarworkers (bc)
-0.151 0.150 0.142 -0.016 -0.095 0.152 0.024 -0.107 -0.189 0.089 -0.058 0.137 -0.052 -0.054 -0.461 -0.915 1
Share of apprentices(app)
-0.060 0.294 0.268 -0.102 -0.139 0.283 0.104 0.023 -0.224 -0.103 0.094 -0.026 -0.445 -0.424 -0.180 -0.189 -0.086 1
Share of temporaryworkers (temp)
-0.037 0.352 0.344 -0.126 -0.148 0.331 0.167 -0.000 0.002 -0.070 0.151 0.210 -0.276 -0.271 -0.060 -0.134 0.087 0.182 1
Share of part-timeworkers (pt)
0.105 -0.062 -0.038 0.064 -0.027 -0.039 -0.063 -0.043 -0.048 0.046 0.369 0.046 0.099 0.105 0.030 -0.008 -0.015 0.009 0.014 1
Firm-year observations: 1,565
Source: VWH-AIDA-PATSTAT data set (years: 1995-2001)All variables except the firm’s patent applications (pat) are lagged by one year.
20
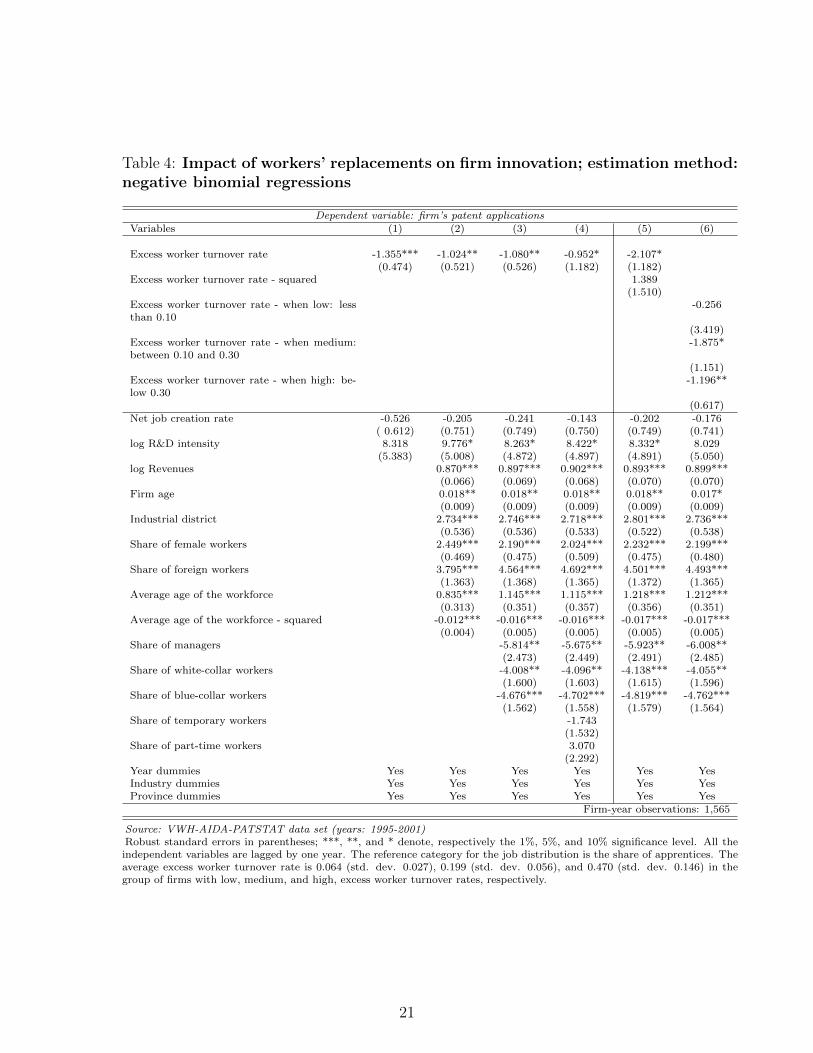
Table 4: Impact of workers’ replacements on firm innovation; estimation method:negative binomial regressions
Dependent variable: firm’s patent applicationsVariables (1) (2) (3) (4) (5) (6)
Excess worker turnover rate -1.355*** -1.024** -1.080** -0.952* -2.107*(0.474) (0.521) (0.526) (1.182) (1.182)
Excess worker turnover rate - squared 1.389(1.510)
Excess worker turnover rate - when low: lessthan 0.10
-0.256
(3.419)Excess worker turnover rate - when medium:between 0.10 and 0.30
-1.875*
(1.151)Excess worker turnover rate - when high: be-low 0.30
-1.196**
(0.617)Net job creation rate -0.526 -0.205 -0.241 -0.143 -0.202 -0.176
( 0.612) (0.751) (0.749) (0.750) (0.749) (0.741)log R&D intensity 8.318 9.776* 8.263* 8.422* 8.332* 8.029
(5.383) (5.008) (4.872) (4.897) (4.891) (5.050)log Revenues 0.870*** 0.897*** 0.902*** 0.893*** 0.899***
(0.066) (0.069) (0.068) (0.070) (0.070)Firm age 0.018** 0.018** 0.018** 0.018** 0.017*
(0.009) (0.009) (0.009) (0.009) (0.009)Industrial district 2.734*** 2.746*** 2.718*** 2.801*** 2.736***
(0.536) (0.536) (0.533) (0.522) (0.538)Share of female workers 2.449*** 2.190*** 2.024*** 2.232*** 2.199***
(0.469) (0.475) (0.509) (0.475) (0.480)Share of foreign workers 3.795*** 4.564*** 4.692*** 4.501*** 4.493***
(1.363) (1.368) (1.365) (1.372) (1.365)Average age of the workforce 0.835*** 1.145*** 1.115*** 1.218*** 1.212***
(0.313) (0.351) (0.357) (0.356) (0.351)Average age of the workforce - squared -0.012*** -0.016*** -0.016*** -0.017*** -0.017***
(0.004) (0.005) (0.005) (0.005) (0.005)Share of managers -5.814** -5.675** -5.923** -6.008**
(2.473) (2.449) (2.491) (2.485)Share of white-collar workers -4.008** -4.096** -4.138*** -4.055**
(1.600) (1.603) (1.615) (1.596)Share of blue-collar workers -4.676*** -4.702*** -4.819*** -4.762***
(1.562) (1.558) (1.579) (1.564)Share of temporary workers -1.743
(1.532)Share of part-time workers 3.070
(2.292)Year dummies Yes Yes Yes Yes Yes YesIndustry dummies Yes Yes Yes Yes Yes YesProvince dummies Yes Yes Yes Yes Yes Yes
Firm-year observations: 1,565
Source: VWH-AIDA-PATSTAT data set (years: 1995-2001)Robust standard errors in parentheses; ***, **, and * denote, respectively the 1%, 5%, and 10% significance level. All theindependent variables are lagged by one year. The reference category for the job distribution is the share of apprentices. Theaverage excess worker turnover rate is 0.064 (std. dev. 0.027), 0.199 (std. dev. 0.056), and 0.470 (std. dev. 0.146) in thegroup of firms with low, medium, and high, excess worker turnover rates, respectively.
21

Table 5: Impact of workers’ replacements on firm innovation: diversifiedimpacts by firm size and age; estimation method: negative binomial regres-sions
Firm sizeUsing number of employees to control for firm size:
Standard regression:Excess worker turnover rate -0.946* (0.526)
Differentiated impact by firm size:Excess worker turnover rate ∗ firm with 50-250 employees -0.397 (0.510)Excess worker turnover rate ∗ firm with 250+ employees -6.142*** (1.197)
Using revenues to control for firm size:Standard regression:
Excess worker turnover rate -1.080** (0.526)Differentiated impact by firm size:
Excess worker turnover rate ∗ firm with revenues lower than or equal to 50 million Euros -0.571 (0.512)Excess worker turnover rate ∗ firm with revenues greater than 50 million Euros -4.664*** (1.791)
Firm ageDifferentiated impact by firm age (1):
Excess worker turnover rate -4.243*** (1.137)Excess worker turnover rate ∗ firm age 0.172*** (0.054)
Differentiated impact by firm age (2):Excess worker turnover rate ∗ firm established less than 5 years before -11.089*** (1.607)Excess worker turnover rate ∗ firm established between 5 and 20 years before -1.439** (0.643)Excess worker turnover rate ∗ firm established more than 20 years before -0.142 (0.673)
Source: VWH-AIDA-PATSTAT data set (years: 1995-2001)All the estimations include the same set of controls as Specification (3) of Table 4. For the rest, see the footnote ofTable 4. The average excess worker turnover rate is 0.297 (std. dev. 0.178) in firms with 50-250 employees, and 0.210(std. dev. 0.151) in firms with 250+ employees. It is 0.363 (std. dev. 0.204), 0.305 (std. dev. 0.182), and 0.261 (std.dev. 0.164) in firms established less than 5, between 5 and 20, and more than 20 years before, respectively.
Table 6: Impact of workers’ replacements on firm innovation: local networks;estimation method: negative binomial regressions
Industrial districtsExcess worker turnover rate ∗ firm belonging to an industrial district -0.388 (0.516)Excess worker turnover rate ∗ firm not belonging to an industrial district - 5.523*** (1.515)
Stock of innovative capital in the provinceExcess worker turnover rate ∗ firm belonging to a province with high stock of innovativecapital
-0.579 (0.582)
Excess worker turnover rate ∗ firm belonging to a province with low stock of innovativecapital
-1.742** (0.857)
Information entropy (IE) in the provinceExcess worker turnover rate ∗ firm belonging to a province with high information entropy -1.355** (0.553)Excess worker turnover rate ∗ firm belonging to a province with low information entropy -0.827 (0.650)
Between/within entropy ratio (IEB/IEW) in the provinceExcess worker turnover rate ∗ firm belonging to a province with high between/within entropyratio
-1.279** (0.593)
Excess worker turnover rate ∗ firm belonging to a province with low between/within entropyratio
-0.844 (0.571)
Source: VWH-AIDA-PATSTAT data set (years: 1995-2001)The high (low) categories refer to values above (below) the median. All the estimations include the same set of controlsas Specification (3) of Table 4. For the rest, see the footnote of Table 4. The average excess worker turnover rate is0.283 (std. dev. 0.172) in firms that belong to industrial districts, and 0.300 (std. dev. 0.196) in firms that do not. Itis 0.307 (std. dev. 0.179) in firms that belong to provinces with high stock of innovative capital, and 0.271 (std. dev.0.173) in firms that do not. It is 0.290 (std. dev. 0.177) in firms that belong to provinces with high information entropy,and 0.284 (std. dev. 0.177) in firms that do not. It is 0.297 (std. dev. 0.180) in firms that belong to provinces withhigh between/within entropy ratio, and 0.274 (std. dev. 0.172) in firms that do not.
22
References
Acemoglu, D., Autor, D. H., 2011. Skills, Tasks and Technologies: Implications for
Employment and Earnings. In: Card, D., Ashenfelter, O. (Eds.), Handbook of
Labor Economics. Vol. 4B. Elsevier, Amsterdam, NL, pp. 1043–1171.
Agrawal, A., Cockburn, I., McHale, J., 2006. Gone but not Forgotten: Knowledge
Flows, Labor Mobility, and Enduring Social Relationships. Journal of Economic
Geography 6 (5), 571–591.
Antonelli, C., Colombelli, A., 2015a. External and Internal Knowledge in the Knowl-
edge Generation Function. Industry and Innovation 22 (4), 273–298.
Antonelli, C., Colombelli, A., 2015b. The Knowledge Cost Function. International
Journal of Production Economics 168, 290–302.
Antonelli, C., Colombelli, A., 2017. The Locus of Knowledge Externalities and the
Cost of Knowledge. Regional Studies 51 (8), 1151–1164.
Antonelli, C., Patrucco, P. P., Quatraro, F., 2011. Productivity Growth and
Pecuniary Knowledge Externalities: An Empirical Analysis of Agglomeration
Economies in European Regions. Economic Geography 87 (1), 23–50.
Arrow, K. J., 1962. The Economic Implications of Learning by Doing. The Review
of Economic Studies 29 (3).
Aubert, P., Caroli, E., Roger, M., 2006. New Technologies, Organisation and Age:
Firm-Level Evidence. The Economic Journal 116 (509), F73–F93.
Audretsch, D. B., Feldman, M. P., 1996. R&D Spillovers and the Geography of
Innovation and Production. The American Economic Review 86 (3), 630–640.
Autor, D. H., Levy, F., Murnane, R. J., 2003. The Skill Content of Recent Techno-
logical Change: An Empirical Exploration. The Quarterly Journal of Economics
118 (4), 1279–1333.
Braunerhjelm, P., Ding, D., Thulin, P., 2015. Does Labour Mobility Foster Inno-
vation? Evidence from Sweden, Centre of Excellence for Science and Innovation
Studies - Royal Institute of Technology, Working Paper No. 403.
Bronzini, R., Piselli, P., 2016. The Impact of R&D Subsidies on Firm Innovation.
Research Policy 45 (2), 442–457.
23
Card, D., Devicienti, F., Maida, A., 2013. Rent-sharing, Holdup, and Wages: Evi-
dence from Matched Panel Data. The Review of Economic Studies 81 (1), 84–111.
Coad, A., 2018. Firm age: a survey. Journal of Evolutionary Economics 28 (1),
13–43.
Contini, B., Leonbruni, R., Pacelli, L., Villosio, C., 2008. The Structure of Wages:
an International Comparison. The University of Chicago Press, Chicago, IL, Ch.
Wage Mobility and Dynamics in Italy in the 1990s, pp. 373–400.
Cooper, D. P., 2001. Innovation and Reciprocal Externalities: Information Transmis-
sion via Job Mobility. Journal of Economic Behaviour & Organization 45, 403–425.
Davis, S. J., Haltiwanger, J. C., Schuh, S., 1996. Job Creation and Destruction. MIT
Press, Cambridge.
Delery, J. E., Shaw, J. D., 2001. The Strategic Management of People in Work Or-
ganizations: Review, Synthesis, and Extension. Research in Personnel and Human
Resources Management 20, 165–197.
Dosi, G., Grazzi, M., 2006. Technologies as Problem-Solving Procedures and Tech-
nologies as Input-Output Relations: Some Perspectives on the Theory of Produc-
tion. Industrial and Corporate Change 15 (1), 173–202.
Dosi, G., Grazzi, M., 2010. On the Nature of Technologies: Knowledge, Procedures,
Artifacts and Production Inputs. Cambridge Journal of Economics 34 (1), 173–184.
Duranton, G., Puga, D., 2004. Micro-Foundations of Urban Agglomeration
Economies. In: Henderson, J. V., Thisse, J. F. (Eds.), Handbook of Regional
and Urban Economics. Vol. 4. Elsevier, Amsterdam, NL, pp. 2065–2118.
Eriksson, T., Qin, Z., Wang, W., 2014. Firm-Level Innovation Activity, Employee
Turnover and HRM Practices - Evidence from Chinese Firms. China Economic
Review 30, 583–597.
Fleming, L., Sorenson, O., 2001. Technology as a Complex Adaptive System: Evi-
dence from Patent Data. Research Policy 30 (7), 1019–1039.
Foss, N. J., 1997. Resources and Strategy: Problems, Open Issues, and Ways Ahead.
In: Foss, N. J. (Ed.), Resources, Firms and Strategies: a Reader in the Resource-
Based Perspective. Oxford University Press, Oxford, UK, pp. 345–365.
24
Foss, N. J., 1998. The Resource-Based Perspective: An Assessment and Diagnosis of
Problems. Scandinavian Journal of Management 14 (3), 133–149.
Galbraith, J. K., 1958. The Affluent Society. Houghton Mifflin Company, Boston,
MA.
Glaeser, E. L., Kallal, H. D., Scheinkman, J. A., Shleifer, A., 1992. Growth in Cities.
Journal of Political Economy 100 (6), 1126–1152.
Griliches, Z., 1992. The Search for R&D Spillovers. Scandinavian Journal of Eco-
nomics 92 (Supplement), 29–47.
Grinza, E., 2016. Replacing Workers: Is It a Boon or a Bane for Firm Productivity?,
Department of Economics and Statistics (Dipartimento di Scienze Economico-
Sociali e Matematico-Statistiche) - University of Turin, Working Paper No. 034.
Hansen, J. A., 1992. Innovation, Firm Size, and Firm Age. Small Business Economics
4 (1), 37–44.
Hausman, J., Hall, B. H., Griliches, Z., 1984. Econometric Models for Count Data
with an Application to the Patents-R&D Relationship. Econometrica 52 (4), 909–
938.
Herstad, S. J., Sandven, T., Ebersberger, B., 2015. Recruitment, Knowledge Inte-
gration and Modes of Innovation. Research Policy 44 (1), 138–153.
Jaffe, A. B., Trajtenberg, M., Henderson, R., 1993. Geographic Localization of
Knowledge Spillovers as Evidenced by Patent Citations. The Quarterly Journal
of Economics 108 (3), 577–598.
Kaiser, U., Kongsted, H. C., Rønde, T., 2015. Does the Mobility of R&D Labor
Increase Innovation? Journal of Economic Behavior & Organization.
Kleinknecht, A., van Schaik, F. N., Zhou, H., 2014. Is Flexible Labour Good for
Innovation? Evidence from Firm-Level Data. Cambridge Journal of Economics
38 (5), 1207–1219.
Kugler, A., Pica, G., 2008. Effects of Employment Protection on Worker and Job
Flows: Evidence from the 1990 Italian Reform. Labour Economics 15 (1), 78–95.
25

Lotti, F., Marin, G., 2013. Matching of PATSTAT Applications to AIDA Firms: Dis-
cussion of the Methodology and Results, Banca d’Italia - Eurosistema, Questioni
di Economia e Finanza (Occasional Papers).
Mahoney, J. T., 1995. The Management of Resources and the Resource of Manage-
ment. Journal of Business Research 33 (2), 91–101.
Maliranta, M., Mohnen, P., Rouvinen, P., 2009. Is Inter-Firm Labor Mobility a
Channel of Knowledge Spillovers? Evidence from a Linked Employer-Employee
Panel. Industrial and Corporate Change 18 (6), 1161–1191.
Marshall, A., 1890. Principles of Economics. Macmillan Publishers, London, UK.
Michie, J., Sheehan, M., 2003. Labour Market Deregulation, ‘Flexibility’ and Inno-
vation. Cambridge Journal of Economics 27 (1), 123–143.
Moretti, E., Thulin, P., 2013. Local Multipliers and Human Capital in the United
States and Sweden. Industrial and Corporate Change 22 (1), 339–362.
Muller, K., Peters, B., 2010. Churning of R&D Personnel and Innovation, Center for
European Economic Research (Zentrum fur Europaische Wirtschaftsforschung),
Working Paper No. 10-032.
Neffke, F., Henning, M., 2013. Skill Relatedness and Firm Diversification. Strategic
Management Journal 34 (3), 297–316.
Nelson, R. R., Winter, S. G., 1982. An Evolutionary Theory of Economic Change.
Harvard University Press.
Nesta, L., Saviotti, P. P., 2005. Coherence of the Knowledge Base and the Firm’s
Innovative Performance: Evidence from the U.S. Pharmaceutical Industry. The
Journal of Industrial Economics 53 (1), 123–142.
Ouimet, P., Zarutskie, R., 2014. Who works for startups? The relation between firm
age, employee age, and growth. Journal of Financial Economics 112 (3), 386–407.
Overman, H. G., Puga, D., 2010. Labor Pooling as a Source of Agglomeration: An
Empirical Investigation. In: Glaeser, E. L. (Ed.), Agglomeration Economics. The
University of Chicago Press, Chicago, IL, pp. 133–150.
Pakes, A., Griliches, Z., 1980. Patents and R&D at the Firm Level: A First Report.
Economics Letters 5 (4), 377–381.
26

Parrotta, P., Pozzoli, D., 2012. The Effect of Learning by Hiring on Productivity.
The RAND Journal of Economics 43 (1), 167–185.
Penrose, E., 1959. The Theory of the Growth of the Firm. Blackwell Publishing,
Oxford, UK.
Peteraf, M. A., 1993. The Cornerstones of Competitive Advantage: A Resource-
Based View. Strategic Management Journal 14 (3), 179–191.
Pianta, M., 2005. Innovation and employment. In: Fagerberg, J., Mowery, D., Nelson,
R. R. (Eds.), Handbook of Innovation. Oxford University Press, Oxford, UK, pp.
568–598.
Piva, M., Vivarelli, M., 2018. Technological Change and Employment: is Europe
Ready for the Challenge? Eurasian Business Review 8 (1), 13–32.
Polanyi, M., 1966. The Tacit Dimension. Routledge & Kegan Paul, London, UK.
Quatraro, F., 2010. Knowledge Coherence, Variety and Economic Growth: Manu-
facturing Evidence from Italian Regions. Research Policy 39 (10), 1289–1302.
Quatraro, F., Usai, S., 2017. Are Knowledge Flows All Alike? Evidence from Euro-
pean Regions. Regional Studies 51 (8), 1246–1258.
Rogers, M., 2004. Networks, Firm Size and Innovation. Small Business Economics
22 (2), 141–153.
Schumpeter, J., 1942. Capitalism, Socialism, and Democracy. Harper & Brothers,
New York City, NY.
Serafinelli, M., 2018. ‘Good’ Firms, Worker Flows and Productivity. Unpublished
paper, University of Toronto. Forthcoming in the Journal of Labor Economics.
Shaw, J. D., Park, T., Kim, E., 2013. A Resource-Based Perspective on Human Cap-
ital Losses, HRM Investments, and Organizational Performance. Strategic Man-
agement Journal 34 (5), 572–589.
Simonen, J., McCann, P., 2008. Firm Innovation: The Influence of R&D Cooperation
and the Geography of Human Capital Inputs. Journal of Urban Economics 64 (1),
146–154.
27
Sørensen, J. B., Stuart, T. E., 2000. Aging, Obsolescence, and Organizational Inno-
vation. Administrative Science Quarterly 45 (1), 81–112.
Tattara, G., Valentini, M., 2003. Un Mercato del Lavoro molto Mobile? Sı, ma con
molti se e molti ma. Economia e Societa Regionale (1), 24–54.
Tattara, G., Valentini, M., 2010. Turnover and Excess Worker Reallocation. The
Veneto Labour Market between 1982 and 1996. Labour 24 (4), 474–500.
Teece, D. J., Pisano, G., Shuen, A., 1997. Dynamic Capabilities and Strategic Man-
agement. Strategic Management Journal 18 (7), 509–533.
Utterback, J., 1994. Mastering the Dynamics of Innovation. Harvard Business School
Press, Boston, MA.
Vaona, A., Pianta, M., 2008. Firm Size and Innovation in European Manufacturing.
Small Business Economics 30 (3), 283–299.
von Hippel, E., 1994. “Sticky Information” and the Locus of Problem Solving: Im-
plications for Innovation. Management Science 40 (4), 429–439.
Vona, F., Consoli, D., 2015. Innovation and Skill Dynamics: A Life-Cycle Approach.
Industrial and Corporate Change 24 (6), 1393–1415.
Wachsen, E., Blind, K., 2016. More Labour Market Flexibility for more Innovation?
Evidence from Employer-Employee Linked Micro Data. Research Policy 45 (5),
941–950.
Weitzman, M., 1997. Sustainability and Technical Progress. Scandinavian Journal of
Economics 99 (1), 1–13.
Zhou, H., Dekker, R., Kleinknecht, A., 2011. Flexible Labor and Innovation Perfor-
mance: Evidence from Longitudinal Firm-Level Data. Industrial and Corporate
Change 20 (3), 941–968.
28