Embed Size (px)
Citation preview

Workers Compensation Update
Karen Ayres, FCAS, MAAANCCI
Casualty Loss Reserve SeminarSeptember 12, 2005

Workers Compensation Results

31.0 31.3
26.3 25.2 24.2 23.3 22.325.0 26.1
29.331.1
34.5
29.130.529.8
0
10
20
30
40
50
1990 1991 1992 1993 1994 1995 1996 1997 1998 1999 2000 2001 2002 2003 2004p
WC Net Written Premium ($ B)
Workers Compensation PremiumContinued to Rise in 2004
Private Carriers$ Billions
Calendar Yearp Preliminary
Source: 1990-2003, A.M. Best Aggregates & Averages; 2004p, NCCI

117123 122
109102
97 100 101107
115 118122
111 109105
0
20
40
60
80
100
120
140
1990 1991 1992 1993 1994 1995 1996 1997 1998 1999 2000 2001 2002 2003 2004p
Loss LAE Underwriting Expense Dividends
1.9% Due to September 11Percent
WC Calendar Year Combined Ratio Continued Its Modest Decline in 2004
Private Carriers
p Preliminary
Source: 1990-2003, A.M. Best Aggregates & Averages; 2004p, NCCI
Calendar Year

13.014.0
18.116.7
14.4
16.817.6
20.421.3
20.519.5
14.0
10.7 10.4 10
0
5
10
15
20
25
1990* 1991* 1992 1993 1994 1995 1996 1997 1998 1999 2000 2001 2002 2003 2004p
Percent
Low Workers Compensation InvestmentReturns Continued in 2004
Investment Gain on Insurance Transactions to Premium RatioPrivate Carriers
Calendar Yearp Preliminary* Adjusted to include realized capital gains to be consistent with 1992 and afterInvestment Gain on Insurance Transactions includes Other IncomeSource: 1990-2003, A.M. Best Aggregates & Averages; 2004p, NCCI

7.5
12.8
19.717.9
19.8
13.9
5.2
1.5 1.0
5
0.0
-7.5
-3.4
-8.7
-4.2
-15
-10
-5
0
5
10
15
20
25
1990* 1991* 1992 1993 1994 1995 1996 1997 1998 1999 2000 2001 2002 2003 2004p
Percent
Calendar Yearp Preliminary* Adjusted to include realized capital gains to be consistent with 1992 and afterOperating Gain equals 1.00 minus (Combined Ratio less Investment Gain on Insurance Transactions and Other Income)Source: 1990-2003, A.M. Best Aggregates & Averages; 2004p, NCCI
2004 Workers CompensationResults Improved Over 2003
Pre-Tax Operating Gain Ratio—Private Carriers

28.427.0 25.9
28.5
32.0
37.5
42.0
46.0
25.0
0
10
20
30
40
50
1996 1997 1998 1999 2000 2001 2002 2003 2004p
25.2 24.2 26.129.2 31.1
34.5
23.3 22.325.0
0
10
20
30
40
50
1996 1997 1998 1999 2000 2001 2002 2003 2004p
State Funds ($ B)
Private Carriers ($ B)
$ Billions
p PreliminarySource: 1996-2003 Private Carriers, A.M. Best Aggregates & Averages; 2004p, NCCI
1996-2004p State Funds: AZ, CA, CO, HI, ID, KY, LA, MO, MT, NM, OK, OR, RI, TX, UT Annual Statements
Workers Compensation PremiumVolume Continues to Grow
Private Carriers and State Funds
Calendar Year

100 101
107
115118
122
111 109105
112
119
143147
144
115 114 116 118119
128
141144
136
116 117
103 101
80
90
100
110
120
130
140
150
1996 1997 1998 1999 2000 2001 2002 2003 2004p
Private Carriers NCCI Affiliated State Funds State Funds
Percent
Calendar Year
Workers Compensation Calendar YearNet Combined Ratios
Private Carriers and State Funds
p PreliminarySource: 1996-2003 Private Carriers, A.M. Best Aggregates & Averages; 2004p, NCCI
1996-2004p State Funds: AZ, CA, CO, HI, ID, KY, LA, MO, MT, NM, OK, OR, RI, TX, UT Annual Statements

Workers Compensation
Accident Year Results
And
Reserve Estimates

p PreliminaryAccident Year data is evaluated as of 12/31/2004 and developed to ultimateSource: Calendar Years 1995-2003, A.M. Best Aggregates & Averages;
Calendar Year 2004p and Accident Years 1995-2004p, NCCIIncludes dividends to policyholders
Accident Year Combined RatioAnother Underwriting Profit in 2004
Workers Compensation Calendar Year vs.Ultimate Accident Year – Private CarriersPercent
97100 101
107
115118
122
111109
105
100
106
120
131
139135
126
106
98
94
90
100
110
120
130
140
1995 1996 1997 1998 1999 2000 2001 2002 2003 2004p
Calendar Year Accident Year

p PreliminaryReported Loss and LAE reserves from Schedule PSource: 1995-2004p, NAIC Annual Statement insurance data
Workers Compensation AccidentYear Loss & LAE Ratios
Private CarriersPercent
Accident Year
78 7779
8184
83 83
7577
69
73
85
94
10098
86
7673
74
65
70
75
80
85
90
95
100
105
1995 1996 1997 1998 1999 2000 2001 2002 2003 2004p
At First Report
As of 12/31/2004

15
18
2021
18
15
12
2
5
10
0
5
10
15
20
25
1995 1996 1997 1998 1999 2000 2001 2002 2003 2004p
$ Billions
Workers Compensation Reserve Deficiencies Continue to Decline
Private Carriers
Loss and LAE Reserve Deficiency Through Year Endp Preliminary
Difference between NCCI estimated ultimate losses and LAE as of 12/31/2004 and reported in Schedule P
$5 billion of the Reserve Deficiencyin 2004 is due to Tabular Discounts

Workers Compensation
Premium Drivers

12.1
7.4
10.0
2.9 3.5
1.2
4.9
6.6
-0.9
-6.4
-3.2
-6.0
-8.0
-5.4
-2.6
-6.0
-10
-5
0
5
10
15
1990 1991 1992 1993 1994 1995 1996 1997 1998 1999 2000 2001 2002 2003 2004 2005*
Cumulative 1990-1993
+36.3%
Cumulative 1994-1999
-27.8%
Average Approved BureauRates/Loss Costs
History of Average WC Bureau Rate/Loss Cost Level ChangesPercent
Cumulative 2000-2003
+17.1%
Cumulative
2004-2005
-6.8%
Calendar Year* States approved through 04/15/2005Countrywide approved changes in advisory rates, loss costs and assigned risk rates as filed by the applicable rating organization

-5.1-3.0
-2.0 -1.8-1.5-1.3 -1.1-1.0-0.7 -0.3
0.0 0.1 0.61.7 2.0 2.2 2.3 2.4 2.5 3.4 3.9 4.9 5.3 5.5 6.3 6.5
8.8
12.0
11.2 11.4
-20.2
12.1
-6.5
-25
-20
-15
-10
-5
0
5
10
15
20
RI CONV
FL HI SD DC AR MO IA GA AL CT OR IL MS KS NC ME LA AZIN
NH MD TN NEVA
ID OK KY VT NM UT SC AK MT
Current NCCI Voluntary Market Approved Rate/Loss Cost Changes
Excludes Law-Only FilingsPercent
States approved through 04/15/2005

-7.1 -7.5 -7.0-8.5
-10.4
-14.6
-17.7
-22.6
-19.2
-14.2
-4.00.2
-23.2
-1.7
-25
-20
-15
-10
-5
0
5
1991 1992 1993 1994 1995 1996 1997 1998 1999 2000 2001 2002 2003 2004p
Rate/Loss Cost Departure Schedule Rating Dividends
Percent
Impact of Discounting on Workers Compensation Premium
NCCI States—Private Carriers
p PreliminaryNCCI benchmark level does not include an underwriting contingency provisionDividend ratios are based on calendar year statisticsBased on data through 12/31/2004 for the states where NCCI provides ratemaking services
Policy Year

Workers Compensation
Loss Drivers

$9
.7
$9
.4
$9
.1
$9
.6
$9
.7
$1
0.3
$1
1.1
$1
2.1
$1
3.3
$1
4.7
$1
6.1
$1
6.5
$1
7.2
$1
7.9
+4.2%+4.6%
+2.4%+9.0%
+11.2%
+9.9%
+8.5%+7.7%
+5.9%+1.7%+4.9%
-2.8%-3.1%+1.0%
5
7
9
11
13
15
17
19
1991 1992 1993 1994 1995 1996 1997 1998 1999 2000 2001 2002 2003 2004p
IndemnityClaim Cost (000s)
Annual Change 1991–1995: +0.3%Annual Change 1996–2003: +7.4%
2004p: Preliminary based on data valued as of 12/31/20041991-2003: Based on data through 12/31/2003, developed to ultimateBased on the states where NCCI provides ratemaking servicesExcludes the effects of deductible policies
The Growth in WC Indemnity ClaimCosts Has Eased in Recent Years
Lost–Time Claims
Accident Year

Indemnity severity 2004p: Preliminary based on data valued as of 12/31/2004Indemnity severity 1995-2003: Based on data through 12/31/2003, developed to ultimateBased on the states where NCCI provides ratemaking services, excludes the effects of deductible policiesSource: Calendar year Current Population Survey, Economy.com; Accident year indemnity severity, NCCI
2.8 2.8
4.04.7
4.24.9
4.2
2.2 2.01.7
5.9
7.78.5
9.9
11.2
9.0
2.4
4.64.2
2.2
0
2
4
6
8
10
12
1995 1996 1997 1998 1999 2000 2001 2002 2003 2004p
Change in CPS Wage Change in Indemnity Cost per Lost-Time Claim
Percent Change
Workers Compensation Indemnity Severity Is Outpacing Wage Inflation
Lost–Time Claims
Year

Annual Change 1991–1995: +3.9%Annual Change 1996–2003: +9.3%
WC Medical Claim Cost TrendsDouble-Digit Growth Continued in 2004
Lost–Time ClaimsMedicalClaim Cost (000s)
Accident Year
$8
.0
$8
.2
$8
.0
$8
.7
$9
.1
$9
.8
$1
0.8
$1
1.6
$1
2.8
$1
3.9
$1
5.5
$1
6.8
$1
8.7
$2
0.6
+10.5%
+10.9
+8.4%
+11.9%
+8.5%+9.9%
+7.6%+10.1%
+7.4%+5.1%+9.0%
-2.1%+1.3%+6.8%
5
7
9
11
13
15
17
19
21
1991 1992 1993 1994 1995 1996 1997 1998 1999 2000 2001 2002 2003 2004p
2004p: Preliminary based on data valued as of 12/31/20041991-2003: Based on data through 12/31/2003, developed to ultimateBased on the states where NCCI provides ratemaking servicesExcludes the effects of deductible policies

4.53.6
2.83.2 3.5
4.14.6 4.7
4.0
5.1
7.4
10.1
7.6
9.9
8.5
11.9
8.4
10.9 10.5
4.4
0
2
4
6
8
10
12
14
1995 1996 1997 1998 1999 2000 2001 2002 2003 2004p
Change in Medical CPI Change in Medical Cost per Lost-Time Claim
Workers Compensation Medical Severity Has Been Growing Much
Faster Than the Medical CPILost–Time ClaimsPercent Change
Medical severity 2004p: Preliminary based on data valued as of 12/31/2004Medical severity 1995-2003: Based on data through 12/31/2003, developed to ultimateBased on the states where NCCI provides ratemaking services, excludes the effects of deductible policiesSource: Calendar year Current Population Survey, Economy.com; Accident year medical severity, NCCI
Year

3.2 3.54.1 4.6 4.7
7.6
9.9
8.5
11.9
8.4
12.9
15.1
12.4
14.9
11.1
0
2
4
6
8
10
12
14
16
18
20
1998 1999 2000 2001 2002
Change in Medical CPIChange in Medical Cost per Lost-Time ClaimChange in Rx Drug Costs per Lost-Time Claim
Percent Change
Drug Costs Are Increasing More Rapidly Than Total WC Medical Costs
Year
Medical severity: Based on data through 12/31/2003, developed to ultimateBased on the states where NCCI provides ratemaking services, excludes the effects of deductible policiesSource: Calendar year Current Population Survey, Economy.com; Accident year medical severity, NCCI; Accident year
Rx Drug Costs, NCCI estimate based on sample data provided by carriers

Workers Compensation Medical Losses Are More Than Half of Total Losses
All Claims—NCCI States
44%56%
1984
MedicalIndemnity
1994
51% 49%
Indemnity Medical
2004p
43% 57%Indemnity Medical
2004p: Preliminary based on data valued as of 12/31/20041984, 1994: Based on data through 12/31/2003, developed to ultimateBased on the states where NCCI provides ratemaking servicesExcludes the effects of deductible policies

-4.2 -4.4
-9.2
-6.3
-4.2-3.7 -3.4
0.3
-6.5
-4.5
0.5
-3.9
-2.3
-4.5
-10
-8
-6
-4
-2
0
2
1991 1992 1993 1994 1995 1996 1997 1998 1999 2000 2001 2002 2003 2004p
Cumulative Change of –42.0%(1990-2003)
Percent Change
Workers Compensation Lost-Time Claim Frequency Continues Its Decline
Lost-Time Claims
Accident Year2004p: Preliminary based on data valued as of 12/31/20041991-2003: Based on data through 12/31/2003, developed to ultimateBased on the states where NCCI provides ratemaking servicesExcludes the effects of deductible policies

Workers Compensation Frequency for Selected Classes
Policies Expiring in 2003 Policies Expiring in 1999
Payroll ($M)Lost-Time
Claims FreqLost-Time
Claims FreqFreq
Change
Clerical 526,085$ 29,402 0.056 28,974 0.060 -8%Salesperson - Outside 117,728$ 8,688 0.074 9,964 0.089 -17%College Professional 67,230$ 6,531 0.097 7,385 0.108 -10%Physician 59,364$ 4,568 0.077 4,173 0.080 -4%Retail Store 32,183$ 16,555 0.514 15,626 0.513 0%Hospital Professional 28,806$ 7,665 0.266 8,343 0.313 -15%Attorneys 26,717$ 938 0.035 1,064 0.047 -25%Auditors/Accountants 25,334$ 408 0.016 431 0.017 -5%Caterer 22,642$ 15,357 0.678 19,459 0.887 -24%Auto Service/Repair 16,593$ 10,414 0.628 11,484 0.703 -11%Architect/Engineer 15,189$ 1,655 0.109 1,619 0.129 -16%Electrical Wiring 11,754$ 7,219 0.614 8,602 0.779 -21%Fast Food Restaurant 10,985$ 6,931 0.631 7,643 0.821 -23%Convalescent/Nursing Home 10,093$ 9,239 0.915 12,701 1.249 -27%Plumbing 9,927$ 7,150 0.720 8,065 0.892 -19%Total - Largest Classes 980,630$ 132,720 0.135 145,533 0.160 -16%Total - All Classes 1,568,658$ 529,404 0.337 633,235 0.422 -20%Mix-Adjusted Total -16%
Countrywide Class
Frequency = Lost-time claims/payroll. Payroll adjusted for inflation Claim count determined at first report
NCCI states only

-24%-21%-15%-22%-8%
-70
-60
-50
-40
-30
-20
-10
0
10
20
Fatal PermanentTotal
PermanentPartial
TemporaryTotal
Medical OnlyPe
rce
nt
Ch
an
ge
in L
os
t-T
ime
Cla
im F
req
ue
nc
y
Smallest 1/3 of Claims within Injury Type
Middle 1/3 of Claims within Injury Type
Largest 1/3 of Claims within Injury Type
Percent Change Between Policies Expiring in 1999 and 2003
Change in Lost-Time Claim Frequency By Injury Type and by Size of Loss Group
Loss Size Adjustments: 4.2% Indemnity, 7.4% MedicalFrequency = Lost-time claims / payroll; Payroll adjusted for inflationClaim count determined at 1st report. NCCI States only, excluding Texas

$1
2.1
$1
3.3
$1
4.7
$1
6.1
$1
6.5
$1
7.2
$1
7.9
+4.2%+4.6%
+2.4%+9.0%+11.2%
+9.9%+8.5%
5
7
9
11
13
15
17
19
21
23
1998 1999 2000 2001 2002 2003 2004p
IndemnityClaim Cost (000s)
Workers Compensation Indemnity Claim Costs
Lost–Time Claims
Accident Year
Annual Change Before Adjustment for Claim Size, 1998-2002: +8.1%
2004p: Preliminary based on data valued as of 12/31/20041998-2003: Based on data through 12/31/2003, developed to ultimateBased on the states where NCCI provides ratemaking servicesExcludes the effects of deductible policies

$1
2.1
$1
2.9
$1
4.0
$1
4.8
$1
4.7 ? ?
? ?
+4.2%+4.6%
+2.4%+9.0%+11.2%
+9.9%+8.5%
5
7
9
11
13
15
17
19
21
23
1998 1999 2000 2001 2002 2003 2004p
IndemnityClaim Cost (000s)
Annual Change Before Adjustment for Frequency by Size, 1998-2002: +8.1%Annual Change After Adjustment for Frequency by Size, 1998-2002: +5.1%
Impact of Changes in Claim Size Distribution on Indemnity Claim Costs
Lost–Time Claims
Accident Year2004p: Preliminary based on data valued as of 12/31/20041998-2003: Based on data through 12/31/2003, developed to ultimateBased on the states where NCCI provides ratemaking servicesExcludes the effects of deductible policies
$1
1.6
$1
2.8
$1
3.9
$1
5.5
$1
6.8
$1
8.7
$2
0.6
+10.5%
+10.9%
+8.4%+11.9%
+8.5%+9.9%
+7.6%
5
7
9
11
13
15
17
19
21
23
1998 1999 2000 2001 2002 2003 2004p
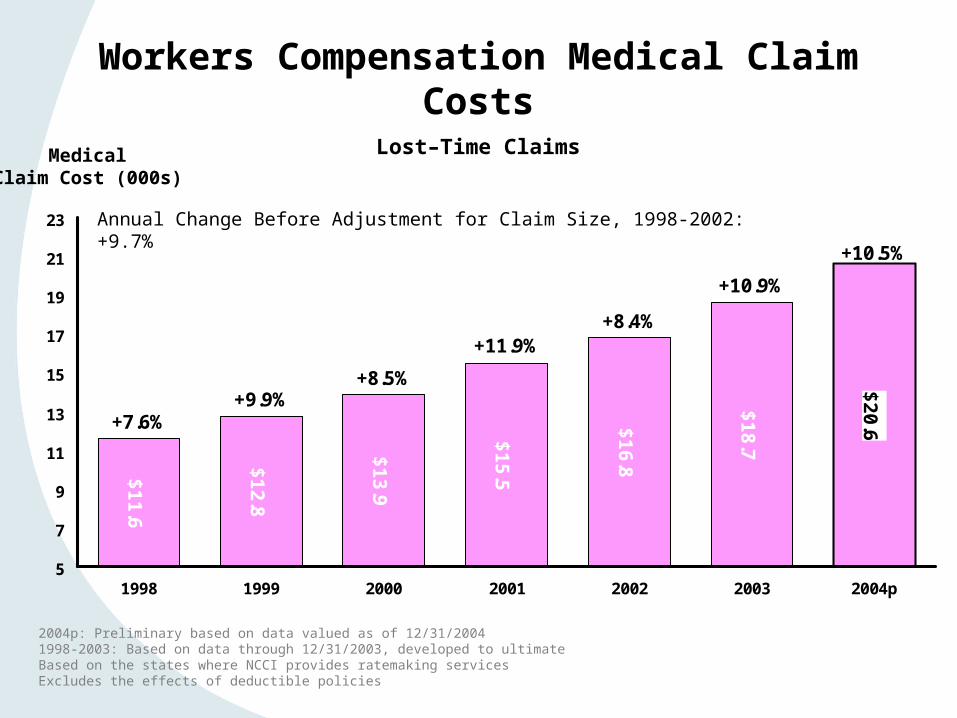
Workers Compensation Medical Claim Costs
Lost–Time Claims
Accident Year
Annual Change Before Adjustment for Claim Size, 1998-2002: +9.7%
MedicalClaim Cost (000s)
2004p: Preliminary based on data valued as of 12/31/20041998-2003: Based on data through 12/31/2003, developed to ultimateBased on the states where NCCI provides ratemaking servicesExcludes the effects of deductible policies

$1
1.6
$1
2.5
$1
3.4
$1
4.6
$1
5.6
??
?
?
+7.6%+9.9%
+8.5%
+11.9%+8.4%
+10.9%
+10.5%
5
7
9
11
13
15
17
19
21
23
1998 1999 2000 2001 2002 2003 2004p
Annual Change Before Adjustment for Frequency by Size, 1998-2002: +9.7%Annual Change After Adjustment for Frequency by Size, 1998-2002: +7.7%
Impact of Changes in Claim Size Distribution on Medical Claim Costs
Lost–Time Claims
Accident Year
MedicalClaim Cost (000s)
2004p: Preliminary based on data valued as of 12/31/20041998-2003: Based on data through 12/31/2003, developed to ultimateBased on the states where NCCI provides ratemaking servicesExcludes the effects of deductible policies

0
5
10
15
20
25
30
19261930
19341938
19421946
19501954
19581962
19661970
19741978
19821986
19901994
19982002
20062010
Model Projection Period
Injury Rates
Trend Line
Historical Bounds
Patterns in Historical Labor Statistics Underlie a Possible Modest Upturn
Calendar Year
Source: NCCI analysis of Bureau of Labor Statistics injury rates from 1926-2002
ManufacturingInjury Rates

Workers CompensationResidual Market

1.2
2.12.6
2.8
3.54.0
4.44.8
4.1
3.1
2.0
1.00.6
0.3 0.3 0.40.6
1.11.4 1.5
0
1
2
3
4
5
6
Workers Compensation Residual Market Premium Volume
NCCI-Serviced Workers Compensation Residual Market PoolsAs of December 31, 2004
$ Billions
Policy Year
* Excludes Maine Residual Market Pool** Incomplete Policy Year Projected to Ultimate

Workers Compensation Residual Market Shares Continue to Rise
Workers Compensation Insurance Plan States* Premium As a Percent of Direct Written Premium
9
1618 17
2224
2629 28
24
17
11
8
4 3 3
13
5
1112
0
5
10
15
20
25
30
Percent
Calendar Year
p Preliminary* NCCI Plan states plus DE, IN, MA, MI, NJ, NC

176
164168 166
159
143
127
112103
98 94 98 102
115119 118 116114 115 113
80
100
120
140
160
180
200
19851986
19871988*
1989*
1990*
1991*
1992*
19931994
19951996
19971998
19992000
20012002
20032004**
Workers Compensation Residual Market Combined Ratios
NCCI-Serviced Workers Compensation Residual Market Pools As of December 31, 2004
Percent
Policy Year
* Excludes Maine Residual Market Pool** Incomplete Policy Year Projected to Ultimate

-922
-1,361
-1,777-1,883
-2,063
-1,687
-1,190
-553
-141-14 -50 -53 -63
-240-85 -164 -174
71 11816
-2,500
-2,000
-1,500
-1,000
-500
0
500
Workers Compensation Residual Market Underwriting Results
NCCI-Serviced Workers Compensation Residual Market PoolsAs of December 31, 2004
$ Millions
Policy Year
* Excludes Maine Residual Market Pool** Incomplete Policy Year Projected to Ultimate

Residual Market ProgramsMitigate the Burden
Pricing Programs:– Differential/Surcharge
– ARAP/SARAP
– Removal/Reduction ofPremium Discount
– LSRP
– Two point or greater underwriting
contingency provision
Depopulation Mechanisms:– Take-Out Credit Program– Voluntary Compensation Assistance Program
Improved Controls:– Paid Loss Ratio Incentive Program– Heightened carrier audit process
Improved Efficiency:– Servicing carrier bid process
ARAP: Assigned Risk Adjustment ProgramSARAP: Simplified Assigned Risk Adjustment ProgramLSRP: Loss Sensitive Rating Plan

Impact of TRIAOn Workers Compensation

• TRIA’s direct financial impact is limited to infrequent extreme events
• TRIA is not triggered under approximately 98% of the modeled scenarios
• TRIA enables the P/C market to function effectively with minimal financial exposure to taxpayer funds
When Does TRIA Make a Difference?

2% 2% 4% 6%12%
20%
68%
0
50
100
150
200
250
9/10 3/4 1/2 1/4 1/20 1/25 3/100 1/50 1/100 1/500 1/1000
Industry Loss with TRIA Federal Contribution Excess of TRIA Limit
Under Most Scenarios TRIA Is Dormant, but When TRIA Is Triggered It Is Vital
P/C Underwriting Loss With and Without TRIA Support
Chance of an Event
Total Loss as % of P/C Surplus
U/W Loss ($ B)
Source: EQECAT, NCCI

In Summary
Negatives
• Low investment returns continue to put pressure on underwriting results
• Medical severity continues rapid growth
• Calendar year results lag behind other lines
• Uncertainties surrounding TRIA extension
Positives
• Results are improving
• Frequency continues to decline
• Industry making progress on reserve deficiency
• Residual Market burden still manageable

End of Presentation
Thank You