Embed Size (px)
Citation preview

RESEARCH AND STATISTICS OFFICE January 2021
WORKERS’ COMPENSATION
DATA BOOK 2019

State of Hawai‘i David Y. Ige, Governor
Department of Labor and Industrial Relations Anne Perreira-Eustaquio, Director JoAnn Vidinhar, Deputy Director
Research and Statistics Office
Jeri Sato, Acting Chief
Operations Management Information Jarrett Ku, Acting Supervisor
Prepared by:
Elizabeth Ishimoto Janet Kaya
Disability Compensation Division Royden Koito, Acting Administrator

WORKERS' COMPENSATION DATA BOOK
2019
INTRODUCTION
The WORKERS’ COMPENSATION DATA BOOK presents a summary of information on injuries and illnesses reported to the Disability Compensation Division of the State of Hawai‘i Department of Labor and Industrial Relations. This publication includes work injury and illness cases, cost and days lost information by island, industry, occupation, sex, part of body, average weekly wage, source of injury or illness, marital status, event or exposure, nature of injury or illness, and age.
Publications from 2000 are available on the Internet at http://labor.hawaii.gov/rs/. Please direct inquiries or comments to:
State of Hawai‘i Department of Labor & Industrial Relations Research and Statistics Office Operations Management Information Staff 830 Punchbowl St., Room 304 Honolulu, HI 96813
Data contained in this report – 586-9009 Copies of this report – 586-8999
E-mail: [email protected]

TABLE OF CONTENTS
Highlights 2019 ....................................................................................................... 3
2019 Hawai‘i Reported Injuries and Illnesses ......................................................... 4
Hawai‘i Reported Injuries and Illnesses: Reported Cases as a Percentage of
Employment by Industry 2018 vs 2019 ................................................................ 5
2019 Hawai‘i Processed Cases and Cost ................................................................. 6
2019 Average Cost by Part of Body ........................................................................ 6
2019 Hawai‘i Type of Payments by Industry .......................................................... 6
Back Cases: Cost and Days Lost by Nature of Injury and Illness ........................... 7
2019 Hawai‘i Workers’ Compensation Statistics
Reported Cases:
Part of Body Affected by Nature of Injury or Illness ........................................... 8
Event or Exposure by Source of Injury or Illness ................................................. 8
Reported & Processed Cases, Cost, Days Lost:
State ...................................................................................................................... 9
O‘ahu .................................................................................................................. 12
Maui County ....................................................................................................... 14
Hawai‘i County ................................................................................................... 16
Kaua‘i County ..................................................................................................... 18
2019 Hawai‘i Reported Fatalities .......................................................................... 20
2019 Hearings and Decisions Issued ..................................................................... 21
Maximum Weekly Wage Base and
Maximum Weekly Benefit Amount History ...................................................... 21
2019 Digest of the Workers' Compensation Law .................................................. 22
Definitions ............................................................................................................ 23
Technical Notes ..................................................................................................... 24

3
HIGHLIGHTS 2019
STATE OF HAWAI‘I
REPORTED CASES: 20,414 PROCESSED CASES: 43,844
PROCESSED CASES WITH COST: 31,325 TOTAL COST: $382,454,127 COST PER CASE: $12,209
MEDICAL COST: $175,246,308 DAYS LOST: 1,297,261
REPORTED FATALITIES: 26
Hawai‘i County
Reported Cases: 2,368 Processed Cases: 5,553
Processed Cases with Cost: 4,080 Total Cost: $58,203,838 Cost Per Case: $14,266
Medical Cost: $28,665,390 Days Lost: 205,385 Reported Fatality: 6
Kaua‘i County
Reported Cases: 1,279 Processed Cases: 2,610
Processed Cases with Cost: 1,793 Total Cost: $15,799,037 Cost Per Case: $8,812
Medical Cost: $6,587,717 Days Lost: 55,012
Reported Fatality: 3
O‘ahu
Reported Cases: 13,747 Processed Cases: 30,028
Processed Cases with Cost: 21,411 Total Cost: $265,618,030 Cost Per Case: $12,406
Medical Cost: $118,936,366 Days Lost: 904,183
Reported Fatality: 14
Maui County
Reported Cases: 3,020 Processed Cases: 5,653
Processed Cases with Cost: 4,041 Total Cost: $42,833,222 Cost Per Case: $10,600
Medical Cost: $21,056,835 Days Lost: 132,681 Reported Fatality: 3
Note: Cost may not add due to rounding.

4
2019 HAWAI‘I REPORTED INJURIES AND ILLNESSES
Employment and Reported Cases by Industry for Hawai‘i
INDUSTRY
2018 2019
Employment Reported
Cases
Injury Case per Number of Employees
Employment Reported
Cases
Injury Case per Number of Employees
Total 624,580 21,388 1 in 29 624,673 20,414 1 in 31
Natural Resources & Mining 5,881 161 1 in 37 5,923 201 1 in 29
Construction 36,012 1,365 1 in 26 36,981 1,262 1 in 29
Manufacturing 14,215 573 1 in 25 14,010 506 1 in 28
Wholesale Trade 17,836 661 1 in 27 18,285 634 1 in 29
Retail Trade 71,682 2,752 1 in 26 71,077 2,500 1 in 28
Transportation & Warehousing 29,680 1,609 1 in 18 32,220 1,707 1 in 19
Utilities 3,793 97 1 in 39 3,710 105 1 in 35
Information 9,147 300 1 in 30 8,725 260 1 in 34
Financial Activities 28,379 650 1 in 44 29,429 594 1 in 50
Professional, Scientific & Technical Services 24,820 379 1 in 65 24,898 361 1 in 69
Management of Companies & Enterprises 8,940 124 1 in 72 9,153 114 1 in 80
Administrative, Support & Waste Management 49,082 1,999 1 in 25 40,245 2,008 1 in 20
Educational Services 14,317 320 1 in 45 14,152 328 1 in 43
Health Care & Social Assistance 71,249 1,995 1 in 36 72,922 1,948 1 in 37
Arts, Entertainment & Recreation 13,030 401 1 in 32 13,778 338 1 in 41
Accommodations & Food Services 110,839 3,847 1 in 29 112,781 3,549 1 in 32
Other Services, except Public Administration 26,638 632 1 in 42 27,204 599 1 in 45
Public Administration 88,264 3,491 1 in 25 88,271 3,370 1 in 26
Information Not Available/Unclassified 776 32 1 in 24 909 30 1 in 30
In 2019, employment remained relatively stable, increasing by only 93 employees, while reported
Workers’ Compensation (WC) injury cases decreased by 974 or 4.6 percent. Employment rose for the nineth consecutive year since 2010.
12 out of 18 industries accounted for the growth in employment and two of these industries recorded increases in reported WC cases. In total, 12 industries had less reported WC cases in 2019 than 2018.
Administrative, Support and Waste Management registered the largest decline in employment, dropping by 8,837 employees or 18.0 percent, while having nine more reported WC cases than the previous year.
Retail had the second largest descent in employment dropping by 605 employees or 0.8 percent, while reported WC cases dropped by 252 or 9.2 percent in 2019.
Transportation & Warehousing ranked highest in employment increase and in reported WC cases trending up by 2,540 or 8.6 percent and 98 or 6.1 percent, respectively.
Accommodations & Food Services experienced the second highest growth in employment by 1,942 employees or 1.8 percent, and was less likely to have reported WC cases with one injury per 32 workers in 2019.
Public Administration listed the smallest employment gain of seven employees following a decrease of 684 employees in the previous year, and had the third highest likelihood for reported WC cases among the 18 industries.

5
2.7%
3.8%
4.0%
3.7%
3.8%
5.4%
2.6%
3.3%
2.3%
1.5%
1.4%
4.1%
2.2%
2.8%
3.1%
3.5%
2.4%
4.0%
3.4%
3.4%
3.6%
3.5%
3.5%
5.3%
2.8%
3.0%
2.0%
1.4%
1.2%
5.0%
2.3%
2.7%
2.5%
3.1%
2.2%
3.8%
0.0% 1.0% 2.0% 3.0% 4.0% 5.0% 6.0%
Natural Resources & Mining
Construction
Manufacturing
Wholesale Trade
Retail Trade
Transportation & Warehousing
Utilities
Information
Financial Activities
Professional, Scientific &Technical Services
Management of Companies &Enterprises
Administrative, Support &Waste Management
Educational Services
Health Care & SocialAssistance
Arts, Entertainment &Recreation
Accommodation &Food Services
Other Services, exceptPublic Administration
Public Administration
Hawai‘i Reported Injuries and Illnesses:Reported Cases as a Percentage of Employment by Industry
2018 vs 2019
2018
2019

6
2019 HAWAI‘I PROCESSED CASES AND COST
2004004
2019 HAWAI‘I TYPE OF
TOTAL COST
TEMPORARY TOTAL DISABILITY
TEMPORARY PARTIAL
DISABILITY
PERMANENT TOTAL DISABILITY
CASES COST CASES COST CASES COST
INDUSTRY $382,454,127 11,557 $103,797,035 1,473 $5,069,485 477 $14,432,448
Natural Resources & Mining $4,650,193 104 $694,664 9 $48,236 13 $1,218,182
Construction $39,766,258 758 $11,344,401 60 $193,894 49 $1,574,333
Manufacturing $13,167,925 337 $3,439,510 28 $74,308 34 $758,088
Wholesale Trade $11,470,350 364 $2,949,644 50 $157,337 3 $53,739
Retail Trade $38,772,823 1,303 $8,887,746 222 $601,233 31 $900,370
Transportation & Warehousing $42,485,418 1,350 $13,513,439 207 $743,742 22 $644,843
Utilities $3,961,132 54 $421,488 2 $8,963 4 $126,522
Information $5,740,696 149 $1,855,625 12 $30,414 12 $357,575
Fin, Ins, Real Est, Rent, & Leasing $9,799,555 278 $2,299,683 36 $114,210 9 $317,855
Professional, Scientific, & Tech. $6,071,398 106 $1,272,836 22 $101,117 5 $148,741
Management of Companies & Entrpr. $3,257,814 76 $880,204 16 $73,431 11 $339,504
Administrative, Support, & Waste $30,338,020 1,158 $7,519,399 88 $252,304 13 $402,079
Educational Services $3,066,875 79 $474,702 18 $61,285 3 $43,850
Health Care & Social Assistance $28,486,996 996 $7,367,860 243 $891,533 25 $757,102
Arts, Entertainment, & Recreation $3,692,990 144 $594,878 17 $53,521 4 $82,368
Accommodation and Food Services $45,465,742 1,868 $11,798,317 203 $597,300 25 $596,403
Other Services, except Public Admin. $10,181,020 309 $2,368,987 29 $50,363 12 $270,670
Public Administration $77,727,600 2,108 $25,974,863 209 $1,009,460 109 $2,957,940
Other $4,351,322 16 $138,789 2 $6,834 93 $2,882,284 Notes: Cost is rounded to the nearest whole dollar and may not add to total.
2019 Average Cost by Part of Body Head $13,272
Eyes 2,798 Ears
$3,937 Face
$5,647
Back $14,546
Neck $16,208
Shoulder $16,699
Wrists $9,742
Fingers $3,711
Arms $9,391
Hands $4,889
Legs $13,689
Toes $3,286
Ankles $8,339
Feet $8,242
Chest $10,304
Pelvic $17,446
Abdomen $8,591
In 2019 Processed Cases decreased by 199 cases (0.5 percent) to 43,844, while Process Cases with Cost increased by 305 cases (1.0 percent) to 31,325; indicating no significant change from the previous year.
Total Cost reported a 6.7 percent increase growing to $382,454,127 following a considerable 10.3 percent increase in the prior year. Days Lost increased slightly by 28,097 days (2.2 percent) to 1,297,261 and Total Workers’ Compensation cost per Case trended up 5.7 percent to $12,209.
Injury to the Pelvic Region had an Average Cost of $17,446, the highest Average Cost by Part of Body in 2019, and had a 16.3 percent growth rate over 2018. Torso ranked second highest average cost at $17,100. Shoulder followed third at $16,699 although posting an increase by $333 (2.0 percent) in average cost from 2018. Ears experienced the largest decline in Average Cost and percentage contracting by $983 or 20.0 percent. Head had the highest percent increase from 2018 in Average Cost by Part of Body of 36.4 percent to reach $13,272.
Medical accounted for $175,246,308 or 45.8 percent of the total Workers’ Compensation Cost. Total Medical Cost steadily continued its ascent trending up by $76.6 million since 2009, and averaging an annual increase of $14.3 million in the past three years. Medical Cost per Case grew by $398 (7.1 percent) to $6,032. Permanent Total Disability comprised the highest average cost at $30,257, while Disfigurement had the lowest average cost of $609.
Torso $17,100
7
`
Back Cases:
PAYMENTS BY INDUSTRY
PERMANENT PARTIAL
DISABILITY DEATH DISFIGUREMENT
VOCATIONAL REHABILITATION
ATTENDANT SERVICES
MEDICAL
Cases Cost Cases Cost Cases Cost Cases Cost Cases Cost Cases Cost Cost per
Case
3,010 $75,721,215 75 $2,279,323 1,656 $1,009,168 817 $4,492,214 17 $406,932 29,055 $175,246,308 6,032 35 $940,669 3 $32,004 22 $7,565 5 $31,102 0 $0 310 $1,677,771 5,412
288 $9,881,423 12 $346,392 185 $164,114 114 $705,568 4 $74,433 1,937 $15,481,700 7,993
99 $2,619,782 2 $70,415 58 $28,250 30 $210,730 1 $27,692 777 $5,939,150 7,644
102 $2,620,502 4 $139,964 58 $44,150 29 $142,047 0 $0 872 $5,362,967 6,150
327 $8,253,489 2 $103,474 165 $76,250 106 $716,831 2 $7,332 3,264 $19,226,098 5,890
313 $7,339,449 4 $200,351 151 $68,018 106 $501,007 3 $43,258 2,619 $19,431,311 7,419
16 $328,157 1 $45,916 9 $10,000 3 $12,801 1 $20,537 182 $2,986,748 16,411
45 $1,096,885 0 $0 26 $8,520 6 $36,598 0 $0 399 $2,355,079 5,902
82 $2,022,902 2 $62,320 43 $23,651 26 $154,540 1 $8,520 766 $4,795,874 6,261
50 $1,167,912 1 ($3,627) 24 $24,730 13 $97,633 1 $134,761 445 $3,127,295 7,028
18 $513,682 1 $14,664 8 $32,350 8 $72,635 0 $0 172 $1,331,344 7,740
308 $7,609,739 15 $391,151 176 $140,666 80 $337,349 0 $0 2,554 $13,685,333 5,358
37 $764,869 1 $29,712 17 $10,652 3 $10,948 0 $0 362 $1,670,857 4,616
238 $5,769,715 1 $6,618 94 $55,155 67 $257,001 1 $156 2,506 $13,381,856 5,340
44 $660,969 2 $42,352 23 $8,650 7 $38,265 0 $0 415 $2,211,987 5,330
352 $8,462,462 2 $35,230 211 $125,103 119 $657,294 0 $0 4,264 $23,193,633 5,439
80 $2,145,877 2 $34,455 42 $20,925 21 $145,856 1 $22,768 786 $5,121,119 6,515
574 $13,399,134 17 $709,005 341 $152,119 68 $333,966 2 $67,475 6,291 $33,123,638 5,265
2 $123,598 3 $18,927 3 $8,300 6 $30,043 0 $0 134 $1,142,547 8,526
Back Cases: Cost and Days Lost by
Nature of Injury and Illness
2018
2019
Cases with Cost
Total Cost
Medical Cost
Days Lost
Cases with Cost
Total Cost
Medical Cost
Days Lost
Nature of Injury and Illness Total 5,245 $75,024,134 $33,561,971 276,459 4,979 $72,426,419 $32,375,765 258,484
Sprain, Strain 3,180 $43,469,419 $19,595,500 158,459 3,040 $42,409,547 $19,005,420 154,882
Back Pain 1,369 $18,877,816 $8,706,508 78,378 1,279 $19,191,761 $8,954,302 70,338
Traumatic Injury 303 $5,942,689 $2,651,075 22,005 240 $4,340,587 $1,795,873 15,733
Dislocation 57 $1,165,249 $454,953 1,890 67 $1,387,487 $741,691 4,205
Bruises, Contusions 136 $1,680,745 $825,952 6,133 139 $1,227,706 $580,499 4,491
Fracture 50 $1,634,603 $553,794 5,591 53 $1,623,354 $548,878 3,867
Multiple Traumatic Injuries/Disorders 24 $170,421 $115,530 577 23 $198,926 $93,803 508
Musculoskeletal System & Connective Tissue 51 $713,587 $418,229 3,003 64 $803,474 $353,423 3,096
Other Injuries and Illnesses 23 $66,119 $43,279 70 27 $202,713 $110,849 1,364
Non-classifiable 52 $1,303,485 $197,151 353 47 $1,040,865 $191,029 0 Cost is rounded to the nearest whole dollar and may not add to total.
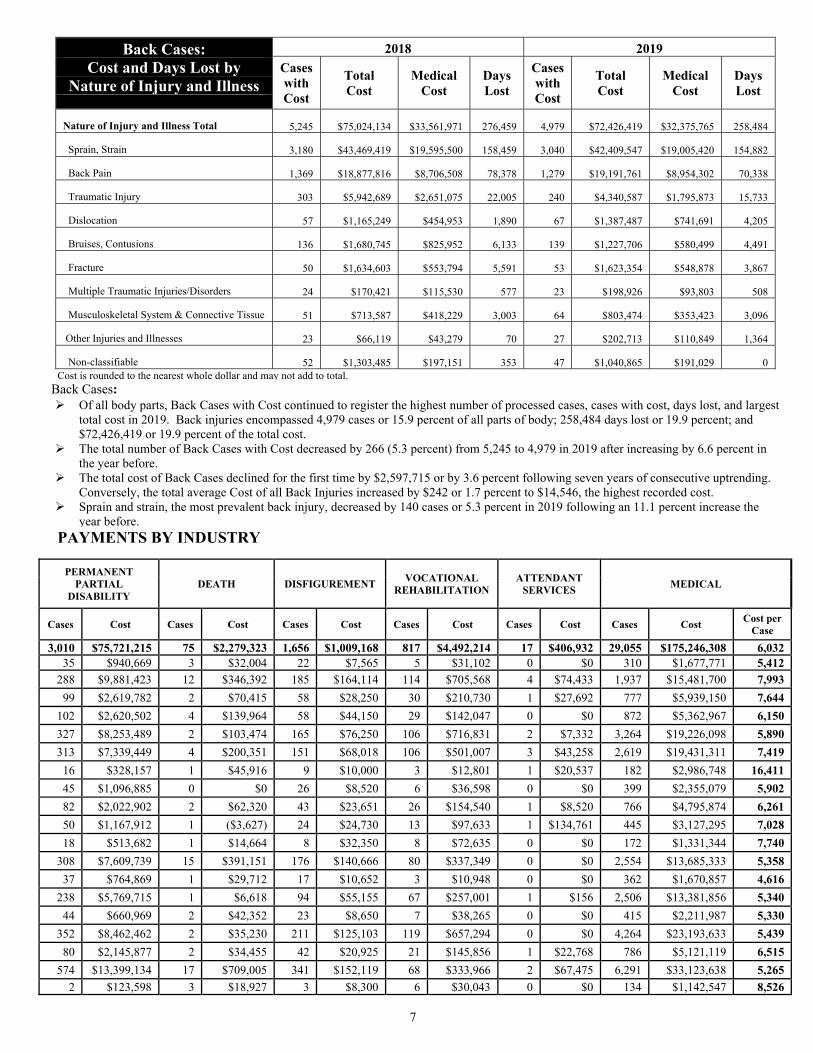
Of all body parts, Back Cases with Cost continued to register the highest number of processed cases, cases with cost, days lost, and largest total cost in 2019. Back injuries encompassed 4,979 cases or 15.9 percent of all parts of body; 258,484 days lost or 19.9 percent; and $72,426,419 or 19.9 percent of the total cost.
The total number of Back Cases with Cost decreased by 266 (5.3 percent) from 5,245 to 4,979 in 2019 after increasing by 6.6 percent in the year before.
The total cost of Back Cases declined for the first time by $2,597,715 or by 3.6 percent following seven years of consecutive uptrending. Conversely, the total average Cost of all Back Injuries increased by $242 or 1.7 percent to $14,546, the highest recorded cost.
Sprain and strain, the most prevalent back injury, decreased by 140 cases or 5.3 percent in 2019 following an 11.1 percent increase the year before.

Reported Cases Part of Body Eyes
Head, Neck, Excl.
Eyes
Trunk, Excl. Back Back Fingers
Upper Extremity,
Excl. FingersLower
Extremity Body SystemMultiple
Body Parts
Non-classi-fiable
Nature of Injury or Illness 20,414 636 1,787 2,259 2,570 2,713 2,948 4,199 900 2,351 51
Traumatic Injuries 829 38 109 95 65 46 93 185 0 196 2
Fracture 734 0 68 89 16 161 130 248 0 22 0
Sprains, Strains 5,845 2 148 1,036 1,679 144 637 1,624 0 575 0
Cut, Laceration 2,519 18 371 9 0 1,338 532 229 0 22 0
Puncture, Excluding Bites 563 6 7 8 2 329 99 111 0 1 0
Abrasions, Scratches 345 80 30 7 10 25 74 70 0 49 0
Bruises, Contusions 2,596 33 474 278 106 223 352 754 0 375 1
Foreign Bodies 247 244 2 0 0 0 0 0 0 1 0
Heat Burns 472 16 30 9 1 31 238 94 0 51 2
Multiple Injuries/Disorders 902 6 93 33 11 51 104 170 0 434 0
Back Pain 600 0 0 0 600 0 0 0 0 0 0
Pain, Excluding Back 1,527 7 75 362 0 134 322 427 0 200 0
Carpal Tunnel 33 0 0 0 0 0 33 0 0 0 0
Musculoskeletal 193 0 1 17 39 18 56 60 0 2 0
Skin Disorders 101 0 7 1 0 6 48 7 0 32 0
Symptoms 401 2 22 4 0 0 2 2 369 0 0
Mental Disorders 284 0 0 0 0 0 0 0 284 0 0
Exposure 166 21 28 1 0 2 7 4 96 7 0
Other Injuries/Illnesses 2,011 162 321 309 41 205 221 213 151 383 5
Nonclassifiable 46 1 1 1 0 0 0 1 0 1 41
Reported CasesEvent or Exposure
Struck By or Struck Against
Caught In, Under, or Between
Rubbed or
Abraded FallBodily
Reaction Overexertion
Contact With Temp.
Extremes
Exposure (Harmful
Substance)
Highway Motor
Vehicle Accidents Other
Source of Injury or Illness 20,414 4,733 886 315 3,661 1,898 4,041 477 1,251 462 2,690
Chemical, Chemical Product 358 2 0 1 1 0 0 10 336 0 8
Containers 2,709 723 100 1 88 0 1,742 45 2 0 8
Furniture, Fixtures 1,016 430 80 0 158 0 336 2 3 0 7
Machinery 1,107 435 160 0 62 0 263 62 7 3 115
Building Materials 520 293 27 0 29 0 161 4 1 0 5
Vehicle, Mobile Eqmt Parts 153 60 9 0 4 0 75 0 1 0 4
Other Parts and Materials 523 346 24 0 20 0 99 6 2 0 26
Plants, Animals, Minerals 1,169 172 11 11 67 0 73 183 278 0 374
Person, Injured Worker 2,853 2 0 0 0 1,898 5 0 190 0 758
Person, Other 1,425 94 4 1 3 0 384 0 56 1 882
Floors, Walkways, Ground 2,994 39 8 1 2,934 0 9 0 0 0 3
Structures, Other Surfaces 792 349 189 0 155 0 79 1 0 0 19
Handtools (Nonpowered) 1,020 833 46 1 3 0 132 0 0 0 5
Handtools (Powered) 293 160 20 1 2 0 94 7 0 0 9 Other Tools, Instruments, Equipment 848 265 32 1 25 0 236 5 271 0 13
Highway Vehicle, Motorized 950 131 104 2 58 0 68 1 0 453 133
Nonpowered Plant, Vehicles 412 155 50 0 28 0 176 0 0 0 3
Other Vehicles 378 55 20 0 14 0 41 0 0 5 243
Scrap, Waste, Debris 487 137 1 285 4 0 9 7 42 0 2
Other Sources 407 52 1 10 6 0 59 144 62 0 73
EVENT OR EXPOSURE BY SOURCE OF INJURY OR ILLNESS
PART OF BODY AFFECTED BY NATURE OF INJURY OR ILLNESS
2019 HAWAI‘I WORKERS' COMPENSATION STATISTICS
8

STATEISLAND 20,414 100.0% 43,844 100.0% 31,325 100.0% $382,454,127 100.0% 1,297,261 100.0%O‘ahu 13,747 67.3 30,028 68.5 21,411 68.4 265,618,030 69.5 904,183 69.7East Hawai‘i 1,118 5.5 2,890 6.6 2,103 6.7 25,413,125 6.6 101,837 7.9West Hawai‘i 1,250 6.1 2,663 6.1 1,977 6.3 32,790,713 8.6 103,548 8.0Maui 2,822 13.8 5,313 12.1 3,812 12.2 40,978,912 10.7 124,245 9.6Moloka‘i 59 0.3 123 0.3 85 0.3 731,963 0.2 4,273 0.3Lana‘i 139 0.7 217 0.5 144 0.5 1,122,347 0.3 4,163 0.3Kaua‘i 1,279 6.3 2,610 6.0 1,793 5.7 15,799,037 4.1 55,012 4.2INDUSTRY 20,414 100.0% 43,844 100.0% 31,325 100.0% $382,454,127 100.0% 1,297,261 100.0%Natural Resources & Mining 201 1.0 421 1.0 341 1.1 4,650,193 1.2 11,863 0.9Construction 1,262 6.2 2,597 5.9 2,091 6.7 39,766,258 10.4 108,030 8.3Manufacturing 506 2.5 1,036 2.4 849 2.7 13,167,924 3.4 38,948 3.0Wholesale Trade 634 3.1 1,184 2.7 932 3.0 11,470,349 3.0 39,666 3.1Retail Trade 2,500 12.2 4,667 10.6 3,452 11.0 38,772,823 10.1 141,857 10.9Transportation & Warehousing 1,707 8.4 3,514 8.0 2,832 9.0 42,485,417 11.1 159,090 12.3Utilities 105 0.5 324 0.7 197 0.6 3,961,132 1.0 3,895 0.3Information 260 1.3 554 1.3 427 1.4 5,740,696 1.5 17,091 1.3Financial Activities 594 2.9 1,122 2.6 825 2.6 9,799,555 2.6 32,175 2.5Professional, Scientific, & Tech. 361 1.8 650 1.5 461 1.5 6,071,397 1.6 16,578 1.3Management of Companies & Entrpr. 114 0.6 264 0.6 191 0.6 3,257,813 0.9 12,577 1.0Administrative, Support, & Waste 2,008 9.8 3,580 8.2 2,758 8.8 30,338,022 7.9 116,325 9.0Educational Services 328 1.6 575 1.3 381 1.2 3,066,876 0.8 5,919 0.5Health Care & Social Assistance 1,948 9.5 3,551 8.1 2,687 8.6 28,486,997 7.4 98,324 7.6Arts, Entertainment, & Recreation 338 1.7 581 1.3 441 1.4 3,692,990 1.0 10,811 0.8Accommodation and Food Services 3,549 17.4 6,057 13.8 4,551 14.5 45,465,742 11.9 167,297 12.9Other Services, except Public Admin. 599 2.9 1,111 2.5 849 2.7 10,181,021 2.7 36,349 2.8Public Administration 3,370 16.5 11,803 26.9 6,856 21.9 77,727,600 20.3 278,823 21.5Other 30 0.1 253 0.6 204 0.7 4,351,322 1.1 1,643 0.1TYPE OF INSURANCE 20,414 100.0% 43,844 100.0% 31,325 100.0% $382,454,127 100.0% 1,297,261 100.0% Carrier 13,498 66.1 25,368 57.9 19,284 61.6 227,634,066 59.5 786,517 60.6 Self-Insured: Private & Captive 3,611 17.7 6,813 15.5 5,722 18.3 64,021,747 16.7 234,522 18.1 Self-Insured: Government 3,305 16.2 11,663 26.6 6,319 20.2 74,339,925 19.4 276,222 21.3 State of Hawai‘i 1,711 8.4 7,050 16.1 3,500 11.2 41,172,273 10.8 175,400 13.5 City & County of Honolulu 1,139 5.6 3,450 7.9 2,094 6.7 24,352,346 6.4 70,388 5.4 Hawai‘i County 203 1.0 625 1.4 305 1.0 4,032,809 1.1 17,172 1.3 Maui County 162 0.8 329 0.8 265 0.8 3,242,090 0.8 8,446 0.7 Kaua‘i County 90 0.4 209 0.5 155 0.5 1,540,407 0.4 4,816 0.4 Special Compensation Fund INA -- INA -- INA -- 16,458,389 4.3 INA --OCCUPATION 20,414 100.0% 43,844 100.0% 31,325 100.0% $382,454,127 100.0% 1,297,261 100.0% Executive, Admin. & Managerial 1,016 5.0 2,017 4.6 1,439 4.6 18,041,784 4.7 41,546 3.2 Professional Specialty 1,689 8.3 4,317 9.8 2,538 8.1 25,712,001 6.7 76,593 5.9 Technical Support 513 2.5 1,038 2.4 679 2.2 7,101,967 1.9 25,703 2.0 Sales 1,151 5.6 2,368 5.4 1,728 5.5 23,829,839 6.2 82,197 6.3 Administrative Support 1,168 5.7 3,092 7.1 1,970 6.3 20,701,205 5.4 74,744 5.8 Services 6,794 33.3 14,215 32.4 9,987 31.9 107,682,149 28.2 408,361 31.5 Agricultural, Forestry & Fishing 1,011 5.0 2,018 4.6 1,454 4.6 13,320,329 3.5 47,024 3.6 Mechanic, Repairer 1,330 6.5 2,698 6.2 2,054 6.6 26,371,055 6.9 81,016 6.2 Construction Trades 1,098 5.4 2,431 5.5 1,899 6.1 31,740,056 8.3 90,365 7.0 Precision Production 323 1.6 667 1.5 475 1.5 6,341,127 1.7 18,962 1.5 Operator, Fabricator, Inspector 220 1.1 486 1.1 393 1.3 4,677,035 1.2 13,022 1.0 Transportation, Material Moving 1,361 6.7 3,090 7.0 2,491 8.0 44,209,314 11.6 156,359 12.1 Handler, Helper, Laborer 2,703 13.2 5,158 11.8 4,035 12.9 49,558,811 13.0 179,272 13.8 Nonclassifiable 37 0.2 249 0.6 183 0.6 3,167,455 0.8 2,097 0.2SEX 20,414 100.0% 43,844 100.0% 31,325 100.0% $382,454,127 100.0% 1,297,261 100.0% Male 11,634 57.0 24,838 56.7 18,256 58.3 241,429,962 63.1 738,518 56.9 Female 8,780 43.0 19,006 43.3 13,069 41.7 141,024,165 36.9 558,743 43.1 Note: Cost and percent totals may not add due to rounding.
2019 HAWAI‘I WORKERS' COMPENSATION STATISTICSPROCESSED WITH COST COST DAYS LOSTREPORTED
9

STATEPART OF BODY 20,414 100.0% 43,844 100.0% 31,325 100.0% $382,454,127 100.0% 1,297,261 100.0% Ears 69 0.3 197 0.4 110 0.4 433,071 0.1 1,775 0.1 Face, Excluding Eyes, Ears 676 3.3 1,161 2.6 749 2.4 4,229,273 1.1 12,762 1.0 Eyes 636 3.1 973 2.2 643 2.1 1,798,893 0.5 5,602 0.4 Head, Excluding Ears, Face, Eyes 807 4.0 1,509 3.4 1,070 3.4 14,200,782 3.7 35,057 2.7 Neck 235 1.2 590 1.3 430 1.4 6,969,362 1.8 23,785 1.8 Trunk, Excluding Back 2,259 11.1 5,219 11.9 3,915 12.5 61,600,342 16.1 217,067 16.7 Shoulder 1,137 5.6 2,826 6.4 2,212 7.1 36,937,610 9.7 134,395 10.4 Chest 441 2.2 782 1.8 509 1.6 5,244,638 1.4 15,628 1.2 Abdomen 115 0.6 201 0.5 134 0.4 1,151,175 0.3 4,581 0.4 Pelvic Region 249 1.2 555 1.3 408 1.3 7,117,946 1.9 22,841 1.8 Trunk, Multiple/Unspecified 317 1.6 855 2.0 652 2.1 11,148,974 2.9 39,622 3.1 Back (Spine/Spinal Cord) 2,570 12.6 6,461 14.7 4,979 15.9 72,426,419 18.9 258,484 19.9 Arms 1,006 4.9 2,065 4.7 1,432 4.6 13,666,941 3.6 53,188 4.1 Wrists 555 2.7 1,264 2.9 915 2.9 8,913,902 2.3 32,109 2.5 Hands, Excluding Fingers 982 4.8 1,613 3.7 1,153 3.7 5,637,134 1.5 20,423 1.6 Fingers 2,713 13.3 4,385 10.0 3,098 9.9 11,495,579 3.0 31,177 2.4 Upper Extremities, Multiple 405 2.0 836 1.9 579 1.8 5,563,207 1.5 21,041 1.6 Legs 2,158 10.6 5,188 11.8 3,853 12.3 52,742,804 13.8 179,656 13.8 Ankles 812 4.0 1,551 3.5 1,089 3.5 9,080,763 2.4 38,917 3.0 Feet, Excl. Toes 685 3.4 1,252 2.9 895 2.9 7,376,715 1.9 26,226 2.0 Toes 276 1.4 496 1.1 333 1.1 1,094,181 0.3 4,157 0.3 Lower Extremities, Multiple 268 1.3 578 1.3 414 1.3 4,385,073 1.1 20,907 1.6 Body Systems 900 4.4 1,879 4.3 762 2.4 11,474,843 3.0 51,069 3.9 Multiple Body Parts 2,351 11.5 6,450 14.7 4,791 15.3 83,389,521 21.8 260,090 20.0 Nonclassifiable 51 0.2 177 0.4 115 0.4 5,975,322 1.6 3,769 0.3AVERAGE WEEKLY WAGE 20,414 100.0% 43,844 100.0% 31,325 100.0% $382,454,127 100.0% 1,297,261 100.0% $.01-$200 377 1.8 962 2.2 693 2.2 8,400,982 2.2 28,642 2.2 $200.01-$400 1,416 6.9 3,365 7.7 2,444 7.8 26,601,753 7.0 93,037 7.2 $400.01-$600 2,829 13.9 5,625 12.8 4,161 13.3 47,374,012 12.4 170,692 13.2 $600.01-$800 2,476 12.1 5,983 13.6 4,282 13.7 52,505,294 13.7 210,842 16.3 $800.01-$1000 2,211 10.8 4,975 11.3 3,581 11.4 46,853,112 12.3 168,432 13.0 Over $1000 4,481 22.0 10,494 23.9 7,323 23.4 101,928,599 26.7 298,984 23.0 Information Not Available 6,624 32.4 12,440 28.4 8,841 28.2 98,790,375 25.8 326,632 25.2SOURCE OF INJURY OR ILLNESS 20,414 100.0% 43,844 100.0% 31,325 100.0% $382,454,127 100.0% 1,297,261 100.0% Chemical, Chemical Product 358 1.8 610 1.4 395 1.3 2,422,792 0.6 7,003 0.5 Containers 2,709 13.3 5,615 12.8 4,292 13.7 49,604,480 13.0 188,894 14.6 Furniture, Fixtures 1,016 5.0 2,139 4.9 1,534 4.9 15,490,864 4.1 63,678 4.9 Machinery 1,107 5.4 2,178 5.0 1,650 5.3 19,309,879 5.0 63,687 4.9 Building Materials 520 2.5 1,007 2.3 764 2.4 9,493,094 2.5 29,559 2.3 Vehicle, Mobile Equipment Parts 153 0.7 291 0.7 215 0.7 2,974,133 0.8 7,291 0.6 Other Parts and Materials 523 2.6 968 2.2 740 2.4 7,409,077 1.9 23,230 1.8 Plants, Animals, Minerals 1,169 5.7 1,867 4.3 1,159 3.7 6,716,792 1.8 20,904 1.6 Person, Injured Worker 2,853 14.0 6,857 15.6 4,513 14.4 60,542,195 15.8 234,358 18.1 Person, Other than Injured Worker 1,425 7.0 3,636 8.3 2,451 7.8 33,362,956 8.7 115,155 8.9 Floors, Walkways, Ground 2,994 14.7 7,285 16.6 5,315 17.0 80,788,587 21.1 267,230 20.6 Structures, Other Surfaces 792 3.9 1,577 3.6 1,165 3.7 10,321,681 2.7 34,764 2.7 Handtools (Nonpowered) 1,020 5.0 1,778 4.1 1,307 4.2 8,386,285 2.2 22,833 1.8 Handtools (Powered) 293 1.4 569 1.3 432 1.4 3,690,112 1.0 14,155 1.1 Other Tools, Instruments, Equipment 848 4.2 1,722 3.9 1,128 3.6 10,431,807 2.7 31,681 2.4 Highway Vehicle, Motorized 950 4.7 2,273 5.2 1,762 5.6 31,891,436 8.3 93,243 7.2 Nonpowered Plant Vehicles 412 2.0 807 1.8 628 2.0 6,626,532 1.7 26,283 2.0 Other Vehicles 378 1.9 799 1.8 639 2.0 9,990,876 2.6 28,822 2.2 Scrap, Waste, Debris 487 2.4 757 1.7 514 1.6 2,189,626 0.6 4,496 0.3 Other Sources 407 2.0 1,109 2.5 722 2.3 10,810,923 2.8 19,995 1.5MARITAL STATUS 20,414 100.0% 43,844 100.0% 31,325 100.0% $382,454,127 100.0% 1,297,261 100.0% Married 9,054 44.4 21,035 48.0 18,256 58.3 241,429,962 63.1 738,518 56.9 Single 11,146 54.6 21,882 49.9 13,069 41.7 141,024,165 36.9 558,743 43.1 Information Not Available 214 1.0 927 2.1 0 0.0 0 0.0 0 0.0 Note: Cost and percent totals may not add due to rounding.
2019 HAWAI‘I WORKERS' COMPENSATION STATISTICSPROCESSED WITH COST COST DAYS LOSTREPORTED
10

STATEEVENT OR EXPOSURE 20,414 100.0% 43,844 100.0% 31,325 100.0% $382,454,127 100.0% 1,297,261 100.0% Struck Against 1,848 9.1 3,030 6.9 2,105 6.7 11,094,759 2.9 35,573 2.7 Struck By 2,885 14.1 5,010 11.4 3,646 11.6 25,053,648 6.6 83,412 6.4 Caught In, Under, or Between 886 4.3 1,497 3.4 1,136 3.6 7,110,849 1.9 20,984 1.6 Rubbed or Abraded 315 1.5 461 1.1 318 1.0 804,808 0.2 2,147 0.2 Other Contact with Object, Equipment 124 0.6 226 0.5 122 0.4 829,426 0.2 2,452 0.2 Falls (From Elevation) 916 4.5 2,386 5.4 1,846 5.9 33,970,531 8.9 97,341 7.5 Falls (To Same Level) 2,732 13.4 6,211 14.2 4,469 14.3 58,601,112 15.3 212,272 16.4 Falls (Other) 13 0.1 89 0.2 69 0.2 1,232,802 0.3 3,343 0.3 Bodily Reaction 1,898 9.3 4,485 10.2 3,266 10.4 41,532,685 10.9 154,872 11.9 Overexertion 4,041 19.8 9,988 22.8 7,704 24.6 109,883,957 28.7 410,287 31.6 Repetitive Motion 467 2.3 1,257 2.9 863 2.8 12,381,930 3.2 50,910 3.9 Heart Attacks and Strokes 39 0.2 104 0.2 37 0.1 966,981 0.3 1,656 0.1 Contact (Electrical) 38 0.2 86 0.2 63 0.2 1,742,075 0.5 3,948 0.3 Contact (Temperature Extremes) 477 2.3 731 1.7 452 1.4 2,177,710 0.6 4,228 0.3 Exposure (Noise) 24 0.1 95 0.2 50 0.2 121,172 0.0 7 0.0 Exposure (Harmful Substance) 1,251 6.1 2,245 5.1 1,160 3.7 8,050,115 2.1 32,590 2.5 Accidents (Highway Vehicle) 462 2.3 1,211 2.8 924 2.9 20,349,228 5.3 51,454 4.0 Accidents (Non-Highway Vehicle) 245 1.2 547 1.2 444 1.4 8,083,459 2.1 22,497 1.7 Accidents (Other Transportation) 203 1.0 511 1.2 414 1.3 7,307,616 1.9 25,042 1.9 Explosions 16 0.1 48 0.1 38 0.1 1,222,243 0.3 1,875 0.1 Assaults, Violent Acts 1,170 5.7 2,735 6.2 1,765 5.6 21,347,738 5.6 67,442 5.2 Other Events/Exposures 300 1.5 519 1.2 181 0.6 1,991,531 0.5 3,922 0.3 Nonclassifiable 64 0.3 372 0.8 253 0.8 6,597,752 1.7 9,007 0.7NATURE OF INJURY OR ILLNESS 20,414 100.0% 43,844 100.0% 31,325 100.0% $382,454,127 100.0% 1,297,261 100.0% Traumatic Injuries 829 4.1 3,120 7.1 2,124 6.8 35,730,202 9.3 109,902 8.5 Fracture 734 3.6 1,942 4.4 1,507 4.8 27,960,848 7.3 75,703 5.8 Sprains, Strains 5,845 28.6 13,099 29.9 10,096 32.2 135,846,093 35.5 519,120 40.0 Cut, Laceration 2,519 12.3 3,909 8.9 2,836 9.1 11,169,105 2.9 27,694 2.1 Puncture, Excluding Bites 563 2.8 851 1.9 597 1.9 1,498,031 0.4 3,321 0.3 Abrasions, Scratches 345 1.7 640 1.5 399 1.3 2,504,673 0.7 7,525 0.6 Bruises, Contusions 2,596 12.7 4,342 9.9 3,118 10.0 24,449,785 6.4 95,049 7.3 Foreign Bodies 247 1.2 354 0.8 248 0.8 580,368 0.2 1,643 0.1 Heat Burns 472 2.3 717 1.6 467 1.5 2,808,632 0.7 5,494 0.4 Multiple Injuries/Disorders 902 4.4 1,816 4.1 1,357 4.3 17,227,232 4.5 54,769 4.2 Back Pain 600 2.9 1,735 4.0 1,279 4.1 19,191,761 5.0 70,338 5.4 Pain, Excluding Back 1,527 7.5 4,142 9.4 2,937 9.4 39,393,973 10.3 135,899 10.5 Carpal Tunnel 33 0.2 126 0.3 80 0.3 1,402,596 0.4 5,139 0.4 Musculoskeletal 193 0.9 469 1.1 352 1.1 4,367,877 1.1 18,104 1.4 Skin Disorders 101 0.5 170 0.4 95 0.3 443,808 0.1 1,163 0.1 Symptoms 401 2.0 674 1.5 226 0.7 1,787,635 0.5 4,782 0.4 Mental Disorders 284 1.4 842 1.9 349 1.1 7,009,832 1.8 41,458 3.2 Exposure 166 0.8 240 0.5 98 0.3 138,391 0.0 952 0.1 Other Injuries/Illnesses 2,011 9.9 4,384 10.0 2,956 9.4 40,755,826 10.7 116,745 9.0 Nonclassifiable 46 0.2 272 0.6 204 0.7 8,187,459 2.1 2,461 0.2AGE 20,414 100.0% 43,844 100.0% 31,325 100.0% $382,454,127 100.0% 1,297,261 100.0% Under 18 74 0.4 108 0.2 72 0.2 593,753 0.2 858 0.1 18-24 2,270 11.1 3,534 8.1 2,450 7.8 12,145,441 3.2 43,593 3.4 25-34 4,279 21.0 7,927 18.1 5,642 18.0 51,578,079 13.5 173,121 13.3 35-44 3,986 19.5 8,871 20.2 6,333 20.2 81,460,871 21.3 270,102 20.8 45-54 4,438 21.7 11,075 25.3 8,024 25.6 110,811,185 29.0 382,563 29.5 55-64 4,102 20.1 9,623 21.9 6,892 22.0 99,311,372 26.0 330,575 25.5 Over 64 1,259 6.2 2,640 6.0 1,871 6.0 25,766,686 6.7 95,742 7.4 Information Not Available 6 0.0 66 0.2 41 0.1 786,740 0.2 707 0.1 Note: Cost and percent totals may not add due to rounding.
2019 HAWAI‘I WORKERS' COMPENSATION STATISTICSREPORTED PROCESSED WITH COST COST DAYS LOST
11

O‘AHUINDUSTRY 13,747 100.0% 30,028 100.0% 21,411 100.0% $265,618,030 100.0% 904,183 100.0%Natural Resources & Mining 54 0.4 126 0.4 110 0.5 1,177,330 0.4 4,716 0.5Construction 833 6.1 1,751 5.8 1,413 6.6 28,626,850 10.8 75,074 8.3Manufacturing 404 2.9 816 2.7 667 3.1 10,284,800 3.9 32,793 3.6Wholesale Trade 471 3.4 879 2.9 685 3.2 8,613,023 3.2 30,064 3.3Retail Trade 1,632 11.9 3,125 10.4 2,322 10.8 26,282,216 9.9 95,174 10.5Transportation & Warehousing 1,303 9.5 2,751 9.2 2,201 10.3 33,799,500 12.7 124,414 13.8Utilities 67 0.5 211 0.7 128 0.6 3,331,640 1.3 2,408 0.3Information 215 1.6 456 1.5 352 1.6 4,917,163 1.9 14,335 1.6Financial Activities 376 2.7 720 2.4 527 2.5 6,664,809 2.5 18,507 2.0Professional, Scientific, & Tech. 269 2.0 479 1.6 335 1.6 4,567,084 1.7 11,901 1.3Management of Companies & Entrpr. 81 0.6 192 0.6 141 0.7 2,513,328 0.9 9,401 1.0Administrative, Support, & Waste 1,220 8.9 2,243 7.5 1,701 7.9 19,237,691 7.2 73,019 8.1Educational Services 277 2.0 467 1.6 291 1.4 2,127,879 0.8 4,405 0.5Health Care & Social Assistance 1,453 10.6 2,676 8.9 2,019 9.4 22,406,748 8.4 74,234 8.2Arts, Entertainment, & Recreation 228 1.7 393 1.3 299 1.4 2,142,644 0.8 6,995 0.8Accommodation and Food Services 2,072 15.1 3,597 12.0 2,729 12.7 24,901,468 9.4 106,458 11.8Other Services, except Public Admin. 438 3.2 850 2.8 641 3.0 7,372,874 2.8 27,673 3.1Public Administration 2,336 17.0 8,129 27.1 4,716 22.0 53,441,817 20.1 192,012 21.2Other 18 0.1 167 0.6 134 0.6 3,209,166 1.2 600 0.1PART OF BODY 13,747 100.0% 30,028 100.0% 21,411 100.0% $265,618,030 100.0% 904,183 100.0% Ears 33 0.2 119 0.4 67 0.3 340,774 0.1 1,513 0.2 Face, Excluding Eyes, Ears 456 3.3 792 2.6 501 2.3 2,732,218 1.0 8,432 0.9 Eyes 394 2.9 619 2.1 418 2.0 1,327,279 0.5 3,317 0.4 Head, Excluding Ears, Face, Eyes 561 4.1 1,034 3.4 731 3.4 10,246,452 3.9 26,695 3.0 Neck 156 1.1 408 1.4 302 1.4 5,408,952 2.0 21,371 2.4 Trunk, Excluding Back 1,490 10.8 3,541 11.8 2,681 12.5 43,270,150 16.3 148,664 16.4 Back (Spine/Spinal Cord) 1,750 12.7 4,473 14.9 3,430 16.0 53,045,298 20.0 186,435 20.6 Arms 670 4.9 1,412 4.7 979 4.6 9,795,962 3.7 37,253 4.1 Wrists 400 2.9 909 3.0 646 3.0 6,415,611 2.4 22,680 2.5 Hands, Excluding Fingers 641 4.7 1,074 3.6 752 3.5 3,693,813 1.4 13,984 1.5 Fingers 1,804 13.1 2,965 9.9 2,069 9.7 7,415,906 2.8 20,050 2.2 Upper Extremities, Multiple 288 2.1 610 2.0 426 2.0 4,223,236 1.6 16,417 1.8 Legs 1,468 10.7 3,597 12.0 2,659 12.4 35,106,842 13.2 122,315 13.5 Ankles 530 3.9 1,036 3.5 727 3.4 6,615,534 2.5 28,581 3.2 Feet, Excluding Toes 478 3.5 865 2.9 622 2.9 4,874,294 1.8 17,566 1.9 Toes 182 1.3 340 1.1 228 1.1 764,467 0.3 3,252 0.4 Lower Extremities, Multiple 197 1.4 417 1.4 296 1.4 3,261,948 1.2 13,406 1.5 Body Systems 588 4.3 1,233 4.1 466 2.2 6,968,808 2.6 28,144 3.1 Multiple Body Parts 1,619 11.8 4,445 14.8 3,322 15.5 58,220,509 21.9 181,067 20.0 Nonclassifiable 42 0.3 139 0.5 89 0.4 1,889,977 0.7 3,041 0.3SOURCE OF INJURY OR ILLNESS 13,747 100.0% 30,028 100.0% 21,411 100.0% $265,618,030 100.0% 904,183 100.0% Chemical, Chemical Product 229 1.7 402 1.3 253 1.2 1,310,856 0.5 4,873 0.5 Containers 1,806 13.1 3,859 12.9 2,912 13.6 34,773,528 13.1 132,892 14.7 Furniture, Fixtures 693 5.0 1,466 4.9 1,063 5.0 11,237,948 4.2 47,419 5.2 Machinery 715 5.2 1,425 4.7 1,072 5.0 12,773,673 4.8 42,036 4.6 Building Materials 336 2.4 658 2.2 488 2.3 6,341,373 2.4 18,831 2.1 Vehicle, Mobile Equipment Parts 92 0.7 180 0.6 128 0.6 2,190,983 0.8 4,790 0.5 Other Parts and Materials 348 2.5 637 2.1 499 2.3 5,535,867 2.1 17,707 2.0 Plants, Animals, Minerals 755 5.5 1,184 3.9 727 3.4 4,611,515 1.7 13,953 1.5 Person, Injured Worker 1,983 14.4 4,798 16.0 3,163 14.8 43,571,019 16.4 161,928 17.9 Person, Other than Injured Worker 1,060 7.7 2,686 8.9 1,810 8.5 21,048,222 7.9 80,266 8.9 Floors, Walkways, Ground 2,007 14.6 4,865 16.2 3,581 16.7 53,300,905 20.1 179,169 19.8 Structures, Other Surfaces 530 3.9 1,080 3.6 791 3.7 6,851,657 2.6 21,672 2.4 Handtools (Nonpowered) 602 4.4 1,120 3.7 831 3.9 5,979,919 2.3 14,912 1.6 Handtools (Powered) 190 1.4 400 1.3 303 1.4 2,680,435 1.0 10,652 1.2 Other Tools, Instruments, Equipment 583 4.2 1,211 4.0 783 3.7 7,734,654 2.9 22,417 2.5 Highway Vehicle, Motorized 671 4.9 1,624 5.4 1,243 5.8 24,750,968 9.3 71,408 7.9 Nonpowered Plant Vehicles 289 2.1 580 1.9 457 2.1 4,652,074 1.8 18,907 2.1 Other Vehicles 268 1.9 563 1.9 439 2.1 7,327,190 2.8 22,453 2.5 Scrap, Waste, Debris 321 2.3 492 1.6 338 1.6 1,629,977 0.6 3,253 0.4 Other Sources 269 2.0 798 2.7 530 2.5 7,315,267 2.8 14,645 1.6 Note: Cost and percent totals may not add due to rounding.
2019 HAWAI‘I WORKERS' COMPENSATION STATISTICSREPORTED PROCESSED WITH COST COST DAYS LOST
12

O‘AHUOCCUPATION 13,747 100.0% 30,028 100.0% 21,411 100.0% $265,618,030 100.0% 904,183 100.0% Executive, Admin. & Managerial 691 5.0 1,375 4.6 971 4.5 12,069,866 4.5 30,233 3.3 Professional Specialty 1,293 9.4 3,073 10.2 1,834 8.6 18,359,828 6.9 52,063 5.8 Technical Support 374 2.7 774 2.6 513 2.4 5,702,942 2.1 21,583 2.4 Sales 741 5.4 1,576 5.2 1,144 5.3 16,697,400 6.3 56,571 6.3 Administrative Support 822 6.0 2,173 7.2 1,398 6.5 14,839,155 5.6 50,835 5.6 Services 4,494 32.7 9,726 32.4 6,858 32.0 71,387,916 26.9 287,680 31.8 Agricultural, Forestry & Fishing 539 3.9 1,105 3.7 766 3.6 7,105,431 2.7 26,678 3.0 Mechanic, Repairer 896 6.5 1,839 6.1 1,389 6.5 18,798,269 7.1 55,338 6.1 Construction Trades 720 5.2 1,607 5.4 1,256 5.9 21,386,817 8.1 57,558 6.4 Precision Production 205 1.5 444 1.5 316 1.5 4,308,303 1.6 13,414 1.5 Operator, Fabricator, Inspector 166 1.2 353 1.2 277 1.3 3,258,018 1.2 9,172 1.0 Transportation, Material Moving 993 7.2 2,275 7.6 1,828 8.5 33,348,426 12.6 118,116 13.1 Handler, Helper, Laborer 1,798 13.1 3,548 11.8 2,742 12.8 35,959,971 13.5 123,995 13.7 Nonclassifiable 15 0.1 160 0.5 119 0.6 2,395,688 0.9 947 0.1NATURE OF INJURY OR ILLNESS 13,747 100.0% 30,028 100.0% 21,411 100.0% $265,618,030 100.0% 904,183 100.0% Traumatic Injuries 557 4.1 2,144 7.1 1,465 6.8 24,320,893 9.2 75,334 8.3 Fracture 506 3.7 1,305 4.3 1,021 4.8 18,787,326 7.1 51,032 5.6 Sprains, Strains 3,925 28.6 9,038 30.1 6,969 32.5 97,930,006 36.9 370,653 41.0 Cut, Laceration 1,621 11.8 2,544 8.5 1,825 8.5 7,207,215 2.7 18,905 2.1 Puncture, Excluding Bites 371 2.7 568 1.9 388 1.8 996,367 0.4 2,569 0.3 Abrasions, Scratches 242 1.8 458 1.5 278 1.3 1,676,805 0.6 5,422 0.6 Bruises, Contusions 1,750 12.7 2,971 9.9 2,143 10.0 17,523,146 6.6 67,410 7.5 Foreign Bodies 160 1.2 221 0.7 164 0.8 423,972 0.2 807 0.1 Heat Burns 322 2.3 483 1.6 313 1.5 1,672,891 0.6 4,542 0.5 Multiple Injuries/Disorders 635 4.6 1,230 4.1 910 4.3 10,834,771 4.1 36,399 4.0 Back Pain 442 3.2 1,244 4.1 916 4.3 14,383,883 5.4 50,458 5.6 Pain, Excluding Back 1,096 8.0 2,993 10.0 2,127 9.9 29,019,560 10.9 98,852 10.9 Carpal Tunnel 27 0.2 96 0.3 59 0.3 1,216,796 0.5 3,974 0.4 Musculoskeletal 130 0.9 334 1.1 247 1.2 3,076,114 1.2 11,863 1.3 Skin Disorders 70 0.5 122 0.4 69 0.3 395,396 0.1 857 0.1 Symptoms 267 1.9 454 1.5 140 0.7 891,508 0.3 1,602 0.2 Mental Disorders 172 1.3 514 1.7 201 0.9 4,045,937 1.5 22,472 2.5 Exposure 122 0.9 184 0.6 64 0.3 101,396 0.0 903 0.1 Other Injuries/Illnesses 1,293 9.4 2,911 9.7 1,950 9.1 27,365,051 10.3 78,032 8.6 Nonclassifiable 39 0.3 214 0.7 162 0.8 3,748,997 1.4 2,097 0.2EVENT OR EXPOSURE 13,747 100.0% 30,028 100.0% 21,411 100.0% $265,618,030 100.0% 904,183 100.0% Struck Against 1,236 9.0 2,060 6.9 1,408 6.6 6,925,125 2.6 23,929 2.6 Struck By 1,871 13.6 3,296 11.0 2,395 11.2 16,653,900 6.3 55,718 6.2 Caught In, Under, or Between 586 4.3 1,010 3.4 769 3.6 4,595,248 1.7 14,695 1.6 Rubbed or Abraded 210 1.5 301 1.0 217 1.0 644,584 0.2 1,645 0.2 Other Contact with Object, Equipment 82 0.6 153 0.5 88 0.4 536,211 0.2 1,254 0.1 Falls (From Elevation) 604 4.4 1,543 5.1 1,197 5.6 21,272,854 8.0 60,711 6.7 Falls (To Same Level) 1,838 13.4 4,180 13.9 3,041 14.2 39,489,821 14.9 146,657 16.2 Falls (Other) 9 0.1 64 0.2 49 0.2 877,181 0.3 1,608 0.2 Bodily Reaction 1,307 9.5 3,149 10.5 2,296 10.7 30,231,476 11.4 108,460 12.0 Overexertion 2,711 19.7 6,954 23.2 5,343 25.0 80,875,292 30.4 294,617 32.6 Repetitive Motion 352 2.6 909 3.0 621 2.9 8,764,743 3.3 36,248 4.0 Heart Attacks and Strokes 25 0.2 70 0.2 25 0.1 814,207 0.3 1,230 0.1 Contact (Electrical) 28 0.2 61 0.2 43 0.2 1,583,334 0.6 3,290 0.4 Contact (Temperature Extremes) 331 2.4 505 1.7 318 1.5 1,570,998 0.6 3,800 0.4 Exposure (Noise) 15 0.1 61 0.2 32 0.1 79,999 0.0 0 0.0 Exposure (Harmful Substance) 809 5.9 1,464 4.9 724 3.4 5,010,128 1.9 19,795 2.2 Accidents (Highway Vehicle) 339 2.5 881 2.9 660 3.1 15,698,159 5.9 39,623 4.4 Accidents (Non-Highway Vehicle) 163 1.2 357 1.2 285 1.3 5,851,016 2.2 15,363 1.7 Accidents (Other Transportation) 143 1.0 369 1.2 296 1.4 5,370,525 2.0 18,952 2.1 Explosions 6 0.0 22 0.1 15 0.1 615,260 0.2 880 0.1 Assaults, Violent Acts 843 6.1 1,986 6.6 1,290 6.0 12,456,792 4.7 45,872 5.1 Other Events/Exposures 194 1.4 355 1.2 109 0.5 1,264,565 0.5 2,325 0.3 Nonclassifiable 45 0.3 278 0.9 190 0.9 4,436,612 1.7 7,511 0.8 Note: Cost and percent totals may not add due to rounding.
2019 HAWAI‘I WORKERS' COMPENSATION STATISTICSREPORTED PROCESSED WITH COST COST DAYS LOST
13
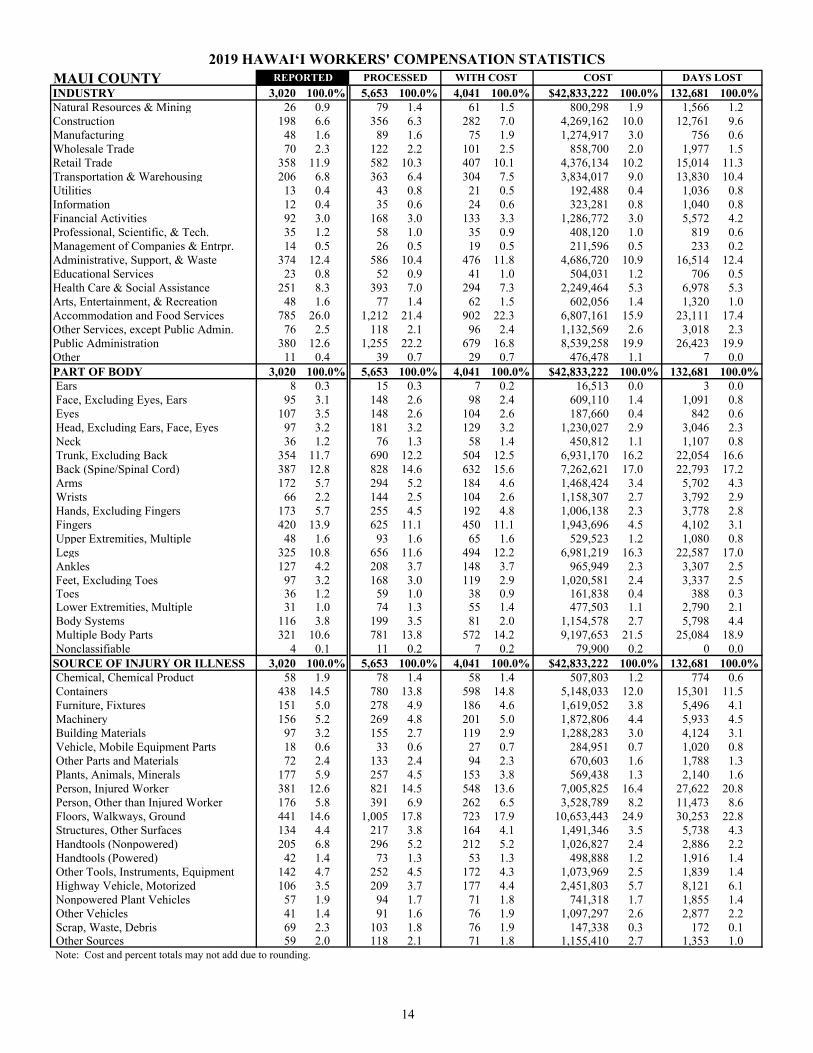
MAUI COUNTYINDUSTRY 3,020 100.0% 5,653 100.0% 4,041 100.0% $42,833,222 100.0% 132,681 100.0%Natural Resources & Mining 26 0.9 79 1.4 61 1.5 800,298 1.9 1,566 1.2Construction 198 6.6 356 6.3 282 7.0 4,269,162 10.0 12,761 9.6Manufacturing 48 1.6 89 1.6 75 1.9 1,274,917 3.0 756 0.6Wholesale Trade 70 2.3 122 2.2 101 2.5 858,700 2.0 1,977 1.5Retail Trade 358 11.9 582 10.3 407 10.1 4,376,134 10.2 15,014 11.3Transportation & Warehousing 206 6.8 363 6.4 304 7.5 3,834,017 9.0 13,830 10.4Utilities 13 0.4 43 0.8 21 0.5 192,488 0.4 1,036 0.8Information 12 0.4 35 0.6 24 0.6 323,281 0.8 1,040 0.8Financial Activities 92 3.0 168 3.0 133 3.3 1,286,772 3.0 5,572 4.2Professional, Scientific, & Tech. 35 1.2 58 1.0 35 0.9 408,120 1.0 819 0.6Management of Companies & Entrpr. 14 0.5 26 0.5 19 0.5 211,596 0.5 233 0.2Administrative, Support, & Waste 374 12.4 586 10.4 476 11.8 4,686,720 10.9 16,514 12.4Educational Services 23 0.8 52 0.9 41 1.0 504,031 1.2 706 0.5Health Care & Social Assistance 251 8.3 393 7.0 294 7.3 2,249,464 5.3 6,978 5.3Arts, Entertainment, & Recreation 48 1.6 77 1.4 62 1.5 602,056 1.4 1,320 1.0Accommodation and Food Services 785 26.0 1,212 21.4 902 22.3 6,807,161 15.9 23,111 17.4Other Services, except Public Admin. 76 2.5 118 2.1 96 2.4 1,132,569 2.6 3,018 2.3Public Administration 380 12.6 1,255 22.2 679 16.8 8,539,258 19.9 26,423 19.9Other 11 0.4 39 0.7 29 0.7 476,478 1.1 7 0.0PART OF BODY 3,020 100.0% 5,653 100.0% 4,041 100.0% $42,833,222 100.0% 132,681 100.0% Ears 8 0.3 15 0.3 7 0.2 16,513 0.0 3 0.0 Face, Excluding Eyes, Ears 95 3.1 148 2.6 98 2.4 609,110 1.4 1,091 0.8 Eyes 107 3.5 148 2.6 104 2.6 187,660 0.4 842 0.6 Head, Excluding Ears, Face, Eyes 97 3.2 181 3.2 129 3.2 1,230,027 2.9 3,046 2.3 Neck 36 1.2 76 1.3 58 1.4 450,812 1.1 1,107 0.8 Trunk, Excluding Back 354 11.7 690 12.2 504 12.5 6,931,170 16.2 22,054 16.6 Back (Spine/Spinal Cord) 387 12.8 828 14.6 632 15.6 7,262,621 17.0 22,793 17.2 Arms 172 5.7 294 5.2 184 4.6 1,468,424 3.4 5,702 4.3 Wrists 66 2.2 144 2.5 104 2.6 1,158,307 2.7 3,792 2.9 Hands, Excluding Fingers 173 5.7 255 4.5 192 4.8 1,006,138 2.3 3,778 2.8 Fingers 420 13.9 625 11.1 450 11.1 1,943,696 4.5 4,102 3.1 Upper Extremities, Multiple 48 1.6 93 1.6 65 1.6 529,523 1.2 1,080 0.8 Legs 325 10.8 656 11.6 494 12.2 6,981,219 16.3 22,587 17.0 Ankles 127 4.2 208 3.7 148 3.7 965,949 2.3 3,307 2.5 Feet, Excluding Toes 97 3.2 168 3.0 119 2.9 1,020,581 2.4 3,337 2.5 Toes 36 1.2 59 1.0 38 0.9 161,838 0.4 388 0.3 Lower Extremities, Multiple 31 1.0 74 1.3 55 1.4 477,503 1.1 2,790 2.1 Body Systems 116 3.8 199 3.5 81 2.0 1,154,578 2.7 5,798 4.4 Multiple Body Parts 321 10.6 781 13.8 572 14.2 9,197,653 21.5 25,084 18.9 Nonclassifiable 4 0.1 11 0.2 7 0.2 79,900 0.2 0 0.0SOURCE OF INJURY OR ILLNESS 3,020 100.0% 5,653 100.0% 4,041 100.0% $42,833,222 100.0% 132,681 100.0% Chemical, Chemical Product 58 1.9 78 1.4 58 1.4 507,803 1.2 774 0.6 Containers 438 14.5 780 13.8 598 14.8 5,148,033 12.0 15,301 11.5 Furniture, Fixtures 151 5.0 278 4.9 186 4.6 1,619,052 3.8 5,496 4.1 Machinery 156 5.2 269 4.8 201 5.0 1,872,806 4.4 5,933 4.5 Building Materials 97 3.2 155 2.7 119 2.9 1,288,283 3.0 4,124 3.1 Vehicle, Mobile Equipment Parts 18 0.6 33 0.6 27 0.7 284,951 0.7 1,020 0.8 Other Parts and Materials 72 2.4 133 2.4 94 2.3 670,603 1.6 1,788 1.3 Plants, Animals, Minerals 177 5.9 257 4.5 153 3.8 569,438 1.3 2,140 1.6 Person, Injured Worker 381 12.6 821 14.5 548 13.6 7,005,825 16.4 27,622 20.8 Person, Other than Injured Worker 176 5.8 391 6.9 262 6.5 3,528,789 8.2 11,473 8.6 Floors, Walkways, Ground 441 14.6 1,005 17.8 723 17.9 10,653,443 24.9 30,253 22.8 Structures, Other Surfaces 134 4.4 217 3.8 164 4.1 1,491,346 3.5 5,738 4.3 Handtools (Nonpowered) 205 6.8 296 5.2 212 5.2 1,026,827 2.4 2,886 2.2 Handtools (Powered) 42 1.4 73 1.3 53 1.3 498,888 1.2 1,916 1.4 Other Tools, Instruments, Equipment 142 4.7 252 4.5 172 4.3 1,073,969 2.5 1,839 1.4 Highway Vehicle, Motorized 106 3.5 209 3.7 177 4.4 2,451,803 5.7 8,121 6.1 Nonpowered Plant Vehicles 57 1.9 94 1.7 71 1.8 741,318 1.7 1,855 1.4 Other Vehicles 41 1.4 91 1.6 76 1.9 1,097,297 2.6 2,877 2.2 Scrap, Waste, Debris 69 2.3 103 1.8 76 1.9 147,338 0.3 172 0.1 Other Sources 59 2.0 118 2.1 71 1.8 1,155,410 2.7 1,353 1.0 Note: Cost and percent totals may not add due to rounding.
2019 HAWAI‘I WORKERS' COMPENSATION STATISTICSREPORTED PROCESSED WITH COST COST DAYS LOST
14

MAUI COUNTYOCCUPATION 3,020 100.0% 5,653 100.0% 4,041 100.0% $42,833,222 100.0% 132,681 100.0% Executive, Admin. & Managerial 140 4.6 256 4.5 189 4.7 2,067,965 4.8 3,968 3.0 Professional Specialty 201 6.7 532 9.4 287 7.1 2,708,202 6.3 6,323 4.8 Technical Support 54 1.8 96 1.7 56 1.4 536,757 1.3 874 0.7 Sales 167 5.5 325 5.7 231 5.7 2,951,340 6.9 9,432 7.1 Administrative Support 166 5.5 406 7.2 232 5.7 2,220,716 5.2 8,364 6.3 Services 1,147 38.0 1,972 34.9 1,389 34.4 13,655,768 31.9 43,440 32.7 Agricultural, Forestry & Fishing 169 5.6 281 5.0 220 5.4 1,656,998 3.9 7,125 5.4 Mechanic, Repairer 179 5.9 330 5.8 255 6.3 2,594,348 6.1 8,144 6.1 Construction Trades 177 5.9 352 6.2 279 6.9 3,742,358 8.7 12,262 9.2 Precision Production 40 1.3 70 1.2 52 1.3 544,905 1.3 1,356 1.0 Operator, Fabricator, Inspector 15 0.5 48 0.8 47 1.2 864,253 2.0 1,651 1.2 Transportation, Material Moving 149 4.9 308 5.4 258 6.4 4,028,088 9.4 12,706 9.6 Handler, Helper, Laborer 415 13.7 657 11.6 528 13.1 4,992,638 11.7 16,902 12.7 Nonclassifiable 1 0.0 20 0.4 18 0.4 268,886 0.6 134 0.1NATURE OF INJURY OR ILLNESS 3,020 100.0% 5,653 100.0% 4,041 100.0% $42,833,222 100.0% 132,681 100.0% Traumatic Injuries 125 4.1 390 6.9 259 6.4 3,377,118 7.9 9,275 7.0 Fracture 103 3.4 260 4.6 197 4.9 4,217,687 9.8 9,800 7.4 Sprains, Strains 901 29.8 1,721 30.4 1,318 32.6 15,194,371 35.5 50,818 38.3 Cut, Laceration 391 12.9 568 10.0 412 10.2 1,648,932 3.8 3,178 2.4 Puncture, Excluding Bites 101 3.3 137 2.4 108 2.7 296,743 0.7 353 0.3 Abrasions, Scratches 43 1.4 72 1.3 47 1.2 181,728 0.4 492 0.4 Bruises, Contusions 397 13.1 590 10.4 409 10.1 2,754,655 6.4 8,577 6.5 Foreign Bodies 32 1.1 52 0.9 39 1.0 59,876 0.1 444 0.3 Heat Burns 84 2.8 112 2.0 71 1.8 535,878 1.3 205 0.2 Multiple Injuries/Disorders 140 4.6 252 4.5 193 4.8 2,002,401 4.7 7,053 5.3 Back Pain 69 2.3 202 3.6 147 3.6 1,877,144 4.4 7,681 5.8 Pain, Excluding Back 173 5.7 433 7.7 301 7.4 3,718,331 8.7 11,995 9.0 Carpal Tunnel 4 0.1 14 0.2 12 0.3 167,703 0.4 1,128 0.9 Musculoskeletal 33 1.1 65 1.1 52 1.3 730,121 1.7 3,488 2.6 Skin Disorders 11 0.4 19 0.3 13 0.3 37,288 0.1 288 0.2 Symptoms 61 2.0 92 1.6 29 0.7 452,248 1.1 1,537 1.2 Mental Disorders 35 1.2 79 1.4 33 0.8 560,568 1.3 4,321 3.3 Exposure 20 0.7 26 0.5 19 0.5 25,618 0.1 10 0.0 Other Injuries/Illnesses 294 9.7 547 9.7 367 9.1 4,777,458 11.2 12,038 9.1 Nonclassifiable 3 0.1 22 0.4 15 0.4 217,354 0.5 0 0.0EVENT OR EXPOSURE 3,020 100.0% 5,653 100.0% 4,041 100.0% $42,833,222 100.0% 132,681 100.0% Struck Against 277 9.2 426 7.5 295 7.3 1,531,285 3.6 4,231 3.2 Struck By 453 15.0 705 12.5 522 12.9 3,023,555 7.1 9,067 6.8 Caught In, Under, or Between 132 4.4 217 3.8 154 3.8 1,175,857 2.7 2,065 1.6 Rubbed or Abraded 44 1.5 68 1.2 51 1.3 51,596 0.1 29 0.0 Other Contact with Object, Equipment 16 0.5 24 0.4 11 0.3 89,892 0.2 462 0.3 Falls (From Elevation) 148 4.9 346 6.1 264 6.5 4,525,035 10.6 13,076 9.9 Falls (To Same Level) 389 12.9 840 14.9 590 14.6 7,545,306 17.6 22,807 17.2 Falls (Other) 0 0.0 3 0.1 2 0.0 873 0.0 0 0.0 Bodily Reaction 267 8.8 558 9.9 404 10.0 4,990,356 11.7 18,886 14.2 Overexertion 632 20.9 1,274 22.5 974 24.1 10,598,366 24.7 34,198 25.8 Repetitive Motion 53 1.8 154 2.7 111 2.7 1,488,053 3.5 5,931 4.5 Heart Attacks and Strokes 3 0.1 9 0.2 2 0.0 23,956 0.1 0 0.0 Contact (Electrical) 3 0.1 5 0.1 3 0.1 41,312 0.1 264 0.2 Contact (Temperature Extremes) 78 2.6 102 1.8 59 1.5 505,002 1.2 196 0.1 Exposure (Noise) 2 0.1 9 0.2 3 0.1 14,187 0.0 0 0.0 Exposure (Harmful Substance) 197 6.5 289 5.1 178 4.4 1,002,163 2.3 3,731 2.8 Accidents (Highway Vehicle) 37 1.2 79 1.4 67 1.7 1,290,920 3.0 3,531 2.7 Accidents (Non-Highway Vehicle) 32 1.1 75 1.3 60 1.5 896,342 2.1 2,549 1.9 Accidents (Other Transportation) 28 0.9 56 1.0 48 1.2 1,001,119 2.3 3,184 2.4 Explosions 6 0.2 12 0.2 10 0.2 108,382 0.3 106 0.1 Assaults, Violent Acts 164 5.4 304 5.4 187 4.6 2,135,985 5.0 7,535 5.7 Other Events/Exposures 56 1.9 73 1.3 28 0.7 341,813 0.8 670 0.5 Nonclassifiable 3 0.1 25 0.4 18 0.4 451,867 1.1 163 0.1 Note: Cost and percent totals may not add due to rounding.
2019 HAWAI‘I WORKERS' COMPENSATION STATISTICSREPORTED PROCESSED WITH COST COST DAYS LOST
15

HAWAI‘I COUNTYINDUSTRY 2,368 100.0% 5,553 100.0% 4,080 100.0% $58,203,838 100.0% 205,385 100.0%Natural Resources & Mining 94 4.0 165 3.0 126 3.1 1,365,421 2.3 4,648 2.3Construction 160 6.8 366 6.6 301 7.4 5,914,662 10.2 16,987 8.3Manufacturing 39 1.6 97 1.7 79 1.9 1,199,467 2.1 3,621 1.8Wholesale Trade 79 3.3 157 2.8 124 3.0 1,725,455 3.0 6,908 3.4Retail Trade 332 14.0 673 12.1 519 12.7 6,733,573 11.6 24,556 12.0Transportation & Warehousing 131 5.5 291 5.2 239 5.9 3,840,887 6.6 16,368 8.0Utilities 13 0.5 44 0.8 31 0.8 239,939 0.4 383 0.2Information 25 1.1 42 0.8 34 0.8 413,504 0.7 1,621 0.8Financial Activities 64 2.7 122 2.2 93 2.3 1,381,123 2.4 6,527 3.2Professional, Scientific, & Tech. 38 1.6 79 1.4 63 1.5 741,173 1.3 2,776 1.4Management of Companies & Entrpr. 18 0.8 41 0.7 29 0.7 483,664 0.8 2,772 1.3Administrative, Support, & Waste 262 11.1 492 8.9 384 9.4 4,796,623 8.2 19,145 9.3Educational Services 24 1.0 50 0.9 44 1.1 413,133 0.7 752 0.4Health Care & Social Assistance 163 6.9 338 6.1 263 6.4 3,171,403 5.4 13,277 6.5Arts, Entertainment, & Recreation 22 0.9 42 0.8 30 0.7 289,718 0.5 1,408 0.7Accommodation and Food Services 363 15.3 679 12.2 499 12.2 10,644,640 18.3 27,331 13.3Other Services, except Public Admin. 53 2.2 91 1.6 72 1.8 1,272,866 2.2 4,672 2.3Public Administration 487 20.6 1,750 31.5 1,121 27.5 13,058,236 22.4 51,019 24.8Other 1 0.0 34 0.6 29 0.7 518,351 0.9 614 0.3PART OF BODY 2,368 100.0% 5,553 100.0% 4,080 100.0% $58,203,838 100.0% 205,385 100.0% Ears 21 0.9 49 0.9 32 0.8 73,048 0.1 259 0.1 Face, Excluding Eyes, Ears 83 3.5 156 2.8 108 2.6 765,538 1.3 2,565 1.2 Eyes 80 3.4 118 2.1 68 1.7 245,260 0.4 1,240 0.6 Head, Excluding Ears, Face, Eyes 101 4.3 200 3.6 151 3.7 2,317,891 4.0 4,004 1.9 Neck 24 1.0 73 1.3 46 1.1 534,649 0.9 1,008 0.5 Trunk, Excluding Back 276 11.7 690 12.4 515 12.6 8,833,011 15.2 36,267 17.7 Back (Spine/Spinal Cord) 281 11.9 820 14.8 653 16.0 10,214,329 17.5 39,797 19.4 Arms 100 4.2 243 4.4 191 4.7 1,968,065 3.4 8,564 4.2 Wrists 62 2.6 151 2.7 117 2.9 988,682 1.7 4,046 2.0 Hands, Excluding Fingers 111 4.7 196 3.5 145 3.6 755,129 1.3 2,324 1.1 Fingers 315 13.3 505 9.1 370 9.1 1,382,062 2.4 5,104 2.5 Upper Extremities, Multiple 36 1.5 80 1.4 50 1.2 475,498 0.8 2,481 1.2 Legs 241 10.2 631 11.4 483 11.8 8,596,453 14.8 28,260 13.8 Ankles 103 4.3 210 3.8 150 3.7 1,157,190 2.0 5,110 2.5 Feet, Excluding Toes 70 3.0 150 2.7 108 2.6 1,213,944 2.1 4,789 2.3 Toes 34 1.4 58 1.0 42 1.0 120,840 0.2 444 0.2 Lower Extremities, Multiple 25 1.1 51 0.9 38 0.9 410,646 0.7 2,748 1.3 Body Systems 130 5.5 289 5.2 140 3.4 2,065,470 3.5 10,487 5.1 Multiple Body Parts 271 11.4 859 15.5 656 16.1 12,091,863 20.8 45,160 22.0 Nonclassifiable 4 0.2 24 0.4 17 0.4 3,994,270 6.9 728 0.4SOURCE OF INJURY OR ILLNESS 2,368 100.0% 5,553 100.0% 4,080 100.0% $58,203,838 100.0% 205,385 100.0% Chemical, Chemical Product 41 1.7 84 1.5 55 1.3 357,439 0.6 738 0.4 Containers 294 12.4 659 11.9 532 13.0 8,223,226 14.1 34,441 16.8 Furniture, Fixtures 92 3.9 235 4.2 176 4.3 1,763,183 3.0 8,009 3.9 Machinery 166 7.0 335 6.0 261 6.4 2,595,289 4.5 12,634 6.2 Building Materials 63 2.7 145 2.6 117 2.9 1,581,007 2.7 5,604 2.7 Vehicle, Mobile Equipment Parts 24 1.0 50 0.9 38 0.9 369,086 0.6 1,075 0.5 Other Parts and Materials 71 3.0 148 2.7 114 2.8 980,971 1.7 2,996 1.5 Plants, Animals, Minerals 157 6.6 272 4.9 182 4.5 1,022,828 1.8 3,160 1.5 Person, Injured Worker 319 13.5 845 15.2 548 13.4 7,662,925 13.2 32,430 15.8 Person, Other than Injured Worker 123 5.2 408 7.3 287 7.0 7,795,205 13.4 18,569 9.0 Floors, Walkways, Ground 373 15.8 958 17.3 713 17.5 13,284,876 22.8 46,332 22.6 Structures, Other Surfaces 80 3.4 190 3.4 146 3.6 1,608,476 2.8 5,984 2.9 Handtools (Nonpowered) 136 5.7 238 4.3 178 4.4 921,141 1.6 3,900 1.9 Handtools (Powered) 39 1.6 64 1.2 49 1.2 369,968 0.6 1,067 0.5 Other Tools, Instruments, Equipment 82 3.5 170 3.1 117 2.9 1,289,566 2.2 5,658 2.8 Highway Vehicle, Motorized 127 5.4 339 6.1 274 6.7 3,948,615 6.8 11,343 5.5 Nonpowered Plant Vehicles 34 1.4 82 1.5 66 1.6 870,472 1.5 4,382 2.1 Other Vehicles 38 1.6 95 1.7 80 2.0 1,166,462 2.0 2,898 1.4 Scrap, Waste, Debris 54 2.3 95 1.7 60 1.5 295,899 0.5 980 0.5 Other Sources 55 2.3 141 2.5 87 2.1 2,097,204 3.6 3,185 1.6 Note: Cost and percent totals may not add due to rounding.
2019 HAWAI‘I WORKERS' COMPENSATION STATISTICSREPORTED PROCESSED WITH COST COST DAYS LOST
16

HAWAI‘I COUNTYOCCUPATION 2,368 100.0% 5,553 100.0% 4,080 100.0% $58,203,838 100.0% 205,385 100.0% Executive, Admin. & Managerial 124 5.2 260 4.7 192 4.7 2,935,462 5.0 4,798 2.3 Professional Specialty 139 5.9 476 8.6 303 7.4 3,739,026 6.4 14,065 6.8 Technical Support 60 2.5 122 2.2 81 2.0 672,822 1.2 2,907 1.4 Sales 158 6.7 322 5.8 250 6.1 3,430,587 5.9 12,540 6.1 Administrative Support 107 4.5 345 6.2 239 5.9 3,084,813 5.3 13,656 6.6 Services 699 29.5 1,603 28.9 1,134 27.8 18,151,335 31.2 60,245 29.3 Agricultural, Forestry & Fishing 209 8.8 451 8.1 339 8.3 3,685,028 6.3 11,692 5.7 Mechanic, Repairer 146 6.2 319 5.7 251 6.2 3,706,156 6.4 14,614 7.1 Construction Trades 139 5.9 348 6.3 267 6.5 5,486,783 9.4 16,665 8.1 Precision Production 56 2.4 116 2.1 81 2.0 1,138,741 2.0 3,587 1.7 Operator, Fabricator, Inspector 28 1.2 63 1.1 50 1.2 397,744 0.7 1,630 0.8 Transportation, Material Moving 154 6.5 378 6.8 302 7.4 4,585,297 7.9 19,660 9.6 Handler, Helper, Laborer 328 13.9 689 12.4 551 13.5 6,701,178 11.5 28,814 14.0 Nonclassifiable 21 0.9 61 1.1 40 1.0 488,866 0.8 512 0.2NATURE OF INJURY OR ILLNESS 2,368 100.0% 5,553 100.0% 4,080 100.0% $58,203,838 100.0% 205,385 100.0% Traumatic Injuries 110 4.6 460 8.3 316 7.7 7,312,920 12.6 22,839 11.1 Fracture 96 4.1 272 4.9 211 5.2 3,607,470 6.2 10,794 5.3 Sprains, Strains 662 28.0 1,569 28.3 1,237 30.3 17,443,217 30.0 73,978 36.0 Cut, Laceration 321 13.6 506 9.1 392 9.6 1,765,407 3.0 4,237 2.1 Puncture, Excluding Bites 60 2.5 93 1.7 68 1.7 149,664 0.3 239 0.1 Abrasions, Scratches 30 1.3 59 1.1 40 1.0 486,150 0.8 1,324 0.6 Bruises, Contusions 268 11.3 490 8.8 370 9.1 3,402,158 5.8 16,458 8.0 Foreign Bodies 34 1.4 51 0.9 30 0.7 85,693 0.1 388 0.2 Heat Burns 35 1.5 68 1.2 43 1.1 438,805 0.8 633 0.3 Multiple Injuries/Disorders 78 3.3 229 4.1 182 4.5 2,509,094 4.3 8,901 4.3 Back Pain 58 2.4 221 4.0 165 4.0 2,648,570 4.6 11,460 5.6 Pain, Excluding Back 170 7.2 505 9.1 360 8.8 5,159,818 8.9 20,399 9.9 Carpal Tunnel 1 0.0 13 0.2 6 0.1 10,664 0.0 3 0.0 Musculoskeletal 15 0.6 43 0.8 33 0.8 441,435 0.8 2,088 1.0 Skin Disorders 13 0.5 20 0.4 9 0.2 9,224 0.0 8 0.0 Symptoms 50 2.1 83 1.5 39 1.0 151,624 0.3 782 0.4 Mental Disorders 44 1.9 154 2.8 70 1.7 1,493,358 2.6 9,273 4.5 Exposure 17 0.7 20 0.4 9 0.2 8,225 0.0 17 0.0 Other Injuries/Illnesses 302 12.8 664 12.0 476 11.7 6,896,158 11.8 21,200 10.3 Nonclassifiable 4 0.2 33 0.6 24 0.6 4,184,184 7.2 364 0.2EVENT OR EXPOSURE 2,368 100.0% 5,553 100.0% 4,080 100.0% $58,203,838 100.0% 205,385 100.0% Struck Against 194 8.2 327 5.9 242 5.9 1,716,507 2.9 6,024 2.9 Struck By 370 15.6 675 12.2 508 12.5 3,769,486 6.5 13,225 6.4 Caught In, Under, or Between 101 4.3 165 3.0 134 3.3 850,787 1.5 3,297 1.6 Rubbed or Abraded 35 1.5 57 1.0 31 0.8 80,416 0.1 372 0.2 Other Contact with Object, Equipment 19 0.8 39 0.7 17 0.4 178,691 0.3 670 0.3 Falls (From Elevation) 113 4.8 360 6.5 289 7.1 6,892,797 11.8 20,640 10.0 Falls (To Same Level) 335 14.1 781 14.1 571 14.0 8,321,491 14.3 32,985 16.1 Falls (Other) 2 0.1 15 0.3 11 0.3 279,039 0.5 1,646 0.8 Bodily Reaction 218 9.2 543 9.8 395 9.7 5,034,385 8.6 21,650 10.5 Overexertion 447 18.9 1,213 21.8 974 23.9 14,694,732 25.2 65,197 31.7 Repetitive Motion 36 1.5 137 2.5 93 2.3 1,673,942 2.9 6,479 3.2 Heart Attacks and Strokes 7 0.3 20 0.4 9 0.2 120,810 0.2 426 0.2 Contact (Electrical) 6 0.3 17 0.3 15 0.4 116,988 0.2 394 0.2 Contact (Temperature Extremes) 39 1.6 75 1.4 41 1.0 64,948 0.1 124 0.1 Exposure (Noise) 5 0.2 20 0.4 12 0.3 22,942 0.0 7 0.0 Exposure (Harmful Substance) 159 6.7 310 5.6 165 4.0 1,180,873 2.0 4,536 2.2 Accidents (Highway Vehicle) 74 3.1 209 3.8 168 4.1 2,962,564 5.1 6,653 3.2 Accidents (Non-Highway Vehicle) 32 1.4 84 1.5 72 1.8 1,059,943 1.8 4,023 2.0 Accidents (Other Transportation) 19 0.8 55 1.0 46 1.1 634,490 1.1 2,522 1.2 Explosions 3 0.1 10 0.2 10 0.2 473,026 0.8 889 0.4 Assaults, Violent Acts 110 4.6 327 5.9 215 5.3 6,154,910 10.6 11,486 5.6 Other Events/Exposures 32 1.4 59 1.1 25 0.6 236,388 0.4 807 0.4 Nonclassifiable 12 0.5 55 1.0 37 0.9 1,683,683 2.9 1,333 0.6 Note: Cost and percent totals may not add due to rounding.
2019 HAWAI‘I WORKERS' COMPENSATION STATISTICSREPORTED PROCESSED WITH COST COST DAYS LOST
17

KAUA‘I COUNTYINDUSTRY 1,279 100.0% 2,610 100.0% 1,793 100.0% $15,799,037 100.0% 55,012 100.0%Natural Resources & Mining 27 2.1 51 2.0 44 2.5 1,307,144 8.3 933 1.7Construction 71 5.6 124 4.8 95 5.3 955,584 6.0 3,208 5.8Manufacturing 15 1.2 34 1.3 28 1.6 408,741 2.6 1,778 3.2Wholesale Trade 14 1.1 26 1.0 22 1.2 273,172 1.7 717 1.3Retail Trade 178 13.9 287 11.0 204 11.4 1,380,899 8.7 7,113 12.9Transportation & Warehousing 67 5.2 109 4.2 88 4.9 1,011,014 6.4 4,478 8.1Utilities 12 0.9 26 1.0 17 0.9 197,065 1.2 68 0.1Information 8 0.6 21 0.8 17 0.9 86,748 0.5 95 0.2Financial Activities 62 4.8 112 4.3 72 4.0 466,851 3.0 1,569 2.9Professional, Scientific, & Tech. 19 1.5 34 1.3 28 1.6 355,020 2.2 1,082 2.0Management of Companies & Entrpr. 1 0.1 5 0.2 2 0.1 49,225 0.3 171 0.3Administrative, Support, & Waste 152 11.9 259 9.9 197 11.0 1,616,986 10.2 7,647 13.9Educational Services 4 0.3 6 0.2 5 0.3 21,833 0.1 56 0.1Health Care & Social Assistance 81 6.3 144 5.5 111 6.2 659,382 4.2 3,835 7.0Arts, Entertainment, & Recreation 40 3.1 69 2.6 50 2.8 658,572 4.2 1,088 2.0Accommodation and Food Services 329 25.7 569 21.8 421 23.5 3,112,473 19.7 10,397 18.9Other Services, except Public Admin. 32 2.5 52 2.0 40 2.2 402,711 2.5 986 1.8Public Administration 167 13.1 669 25.6 340 19.0 2,688,289 17.0 9,369 17.0Other 0 0.0 13 0.5 12 0.7 147,328 0.9 422 0.8PART OF BODY 1,279 100.0% 2,610 100.0% 1,793 100.0% $15,799,037 100.0% 55,012 100.0% Ears 7 0.5 14 0.5 4 0.2 2,736 0.0 0 0.0 Face, Excluding Eyes, Ears 42 3.3 65 2.5 42 2.3 122,407 0.8 674 1.2 Eyes 55 4.3 88 3.4 53 3.0 38,694 0.2 203 0.4 Head, Excluding Ears, Face, Eyes 48 3.8 94 3.6 59 3.3 406,412 2.6 1,312 2.4 Neck 19 1.5 33 1.3 24 1.3 574,949 3.6 299 0.5 Trunk, Excluding Back 139 10.9 298 11.4 215 12.0 2,566,012 16.2 10,082 18.3 Back (Spine/Spinal Cord) 152 11.9 340 13.0 264 14.7 1,904,172 12.1 9,459 17.2 Arms 64 5.0 116 4.4 78 4.4 434,490 2.8 1,669 3.0 Wrists 27 2.1 60 2.3 48 2.7 351,302 2.2 1,591 2.9 Hands, Excluding Fingers 57 4.5 88 3.4 64 3.6 182,054 1.2 337 0.6 Fingers 174 13.6 290 11.1 209 11.7 753,914 4.8 1,921 3.5 Upper Extremities, Multiple 33 2.6 53 2.0 38 2.1 334,949 2.1 1,063 1.9 Legs 124 9.7 304 11.6 217 12.1 2,058,290 13.0 6,494 11.8 Ankles 52 4.1 97 3.7 64 3.6 342,090 2.2 1,919 3.5 Feet, Excluding Toes 40 3.1 69 2.6 46 2.6 267,896 1.7 534 1.0 Toes 24 1.9 39 1.5 25 1.4 47,036 0.3 73 0.1 Lower Extremities, Multiple 15 1.2 36 1.4 25 1.4 234,975 1.5 1,963 3.6 Body Systems 66 5.2 158 6.1 75 4.2 1,285,988 8.1 6,640 12.1 Multiple Body Parts 140 10.9 365 14.0 241 13.4 3,879,496 24.6 8,779 16.0 Nonclassifiable 1 0.1 3 0.1 2 0.1 11,175 0.1 0 0.0SOURCE OF INJURY OR ILLNESS 1,279 100.0% 2,610 100.0% 1,793 100.0% $15,799,037 100.0% 55,012 100.0% Chemical, Chemical Product 30 2.3 46 1.8 29 1.6 246,695 1.6 618 1.1 Containers 171 13.4 317 12.1 250 13.9 1,459,693 9.2 6,260 11.4 Furniture, Fixtures 80 6.3 160 6.1 109 6.1 870,681 5.5 2,754 5.0 Machinery 70 5.5 149 5.7 116 6.5 2,068,112 13.1 3,084 5.6 Building Materials 24 1.9 49 1.9 40 2.2 282,431 1.8 1,000 1.8 Vehicle, Mobile Equipment Parts 19 1.5 28 1.1 22 1.2 129,113 0.8 406 0.7 Other Parts and Materials 32 2.5 50 1.9 33 1.8 221,636 1.4 739 1.3 Plants, Animals, Minerals 80 6.3 154 5.9 97 5.4 513,010 3.2 1,651 3.0 Person, Injured Worker 170 13.3 393 15.1 254 14.2 2,302,426 14.6 12,378 22.5 Person, Other than Injured Worker 66 5.2 151 5.8 92 5.1 990,740 6.3 4,847 8.8 Floors, Walkways, Ground 173 13.5 457 17.5 298 16.6 3,549,362 22.5 11,476 20.9 Structures, Other Surfaces 48 3.8 90 3.4 64 3.6 370,202 2.3 1,370 2.5 Handtools (Nonpowered) 77 6.0 124 4.8 86 4.8 458,398 2.9 1,135 2.1 Handtools (Powered) 22 1.7 32 1.2 27 1.5 140,822 0.9 520 0.9 Other Tools, Instruments, Equipment 41 3.2 89 3.4 56 3.1 333,617 2.1 1,767 3.2 Highway Vehicle, Motorized 46 3.6 101 3.9 68 3.8 740,050 4.7 2,371 4.3 Nonpowered Plant Vehicles 32 2.5 51 2.0 34 1.9 362,668 2.3 1,139 2.1 Other Vehicles 31 2.4 50 1.9 44 2.5 399,927 2.5 594 1.1 Scrap, Waste, Debris 43 3.4 67 2.6 40 2.2 116,412 0.7 91 0.2 Other Sources 24 1.9 52 2.0 34 1.9 243,042 1.5 812 1.5 Note: Cost and percent totals may not add due to rounding.
2019 HAWAI‘I WORKERS' COMPENSATION STATISTICSREPORTED PROCESSED WITH COST COST DAYS LOST
18

KAUA‘I COUNTYOCCUPATION 1,279 100.0% 2,610 100.0% 1,793 100.0% $15,799,037 100.0% 55,012 100.0% Executive, Admin. & Managerial 61 4.8 126 4.8 87 4.9 968,491 6.1 2,547 4.6 Professional Specialty 56 4.4 236 9.0 114 6.4 904,945 5.7 4,142 7.5 Technical Support 25 2.0 46 1.8 29 1.6 189,446 1.2 339 0.6 Sales 85 6.6 145 5.6 103 5.7 750,512 4.8 3,654 6.6 Administrative Support 73 5.7 168 6.4 101 5.6 556,521 3.5 1,889 3.4 Services 454 35.5 914 35.0 606 33.8 4,487,129 28.4 16,996 30.9 Agricultural, Forestry & Fishing 94 7.3 181 6.9 129 7.2 872,874 5.5 1,529 2.8 Mechanic, Repairer 109 8.5 210 8.0 159 8.9 1,272,282 8.1 2,920 5.3 Construction Trades 62 4.8 124 4.8 97 5.4 1,124,097 7.1 3,880 7.1 Precision Production 22 1.7 37 1.4 26 1.5 349,178 2.2 605 1.1 Operator, Fabricator, Inspector 11 0.9 22 0.8 19 1.1 157,020 1.0 569 1.0 Transportation, Material Moving 65 5.1 129 4.9 103 5.7 2,247,502 14.2 5,877 10.7 Handler, Helper, Laborer 162 12.7 264 10.1 214 11.9 1,905,024 12.1 9,561 17.4 Nonclassifiable 0 0.0 8 0.3 6 0.3 14,016 0.1 504 0.9NATURE OF INJURY OR ILLNESS 1,279 100.0% 2,610 100.0% 1,793 100.0% $15,799,037 100.0% 55,012 100.0% Traumatic Injuries 37 2.9 126 4.8 84 4.7 719,271 4.6 2,454 4.5 Fracture 29 2.3 105 4.0 78 4.4 1,348,365 8.5 4,077 7.4 Sprains, Strains 357 27.9 771 29.5 572 31.9 5,278,499 33.4 23,671 43.0 Cut, Laceration 186 14.5 291 11.1 207 11.5 547,552 3.5 1,374 2.5 Puncture, Excluding Bites 31 2.4 53 2.0 33 1.8 55,258 0.3 160 0.3 Abrasions, Scratches 30 2.3 51 2.0 34 1.9 159,990 1.0 287 0.5 Bruises, Contusions 181 14.2 291 11.1 196 10.9 769,825 4.9 2,604 4.7 Foreign Bodies 21 1.6 30 1.1 15 0.8 10,826 0.1 4 0.0 Heat Burns 31 2.4 54 2.1 40 2.2 161,058 1.0 114 0.2 Multiple Injuries/Disorders 49 3.8 105 4.0 72 4.0 1,880,966 11.9 2,416 4.4 Back Pain 31 2.4 68 2.6 51 2.8 282,163 1.8 739 1.3 Pain, Excluding Back 88 6.9 211 8.1 149 8.3 1,496,264 9.5 4,653 8.5 Carpal Tunnel 1 0.1 3 0.1 3 0.2 7,434 0.0 34 0.1 Musculoskeletal 15 1.2 27 1.0 20 1.1 120,208 0.8 665 1.2 Skin Disorders 7 0.5 9 0.3 4 0.2 1,900 0.0 10 0.0 Symptoms 23 1.8 45 1.7 18 1.0 292,256 1.8 861 1.6 Mental Disorders 33 2.6 95 3.6 45 2.5 909,970 5.8 5,392 9.8 Exposure 7 0.5 10 0.4 6 0.3 3,152 0.0 22 0.0 Other Injuries/Illnesses 122 9.5 262 10.0 163 9.1 1,717,158 10.9 5,475 10.0 Nonclassifiable 0 0.0 3 0.1 3 0.2 36,922 0.2 0 0.0EVENT OR EXPOSURE 1,279 100.0% 2,610 100.0% 1,793 100.0% $15,799,037 100.0% 55,012 100.0% Struck Against 141 11.0 217 8.3 160 8.9 921,842 5.8 1,389 2.5 Struck By 191 14.9 334 12.8 221 12.3 1,606,707 10.2 5,402 9.8 Caught In, Under, or Between 67 5.2 105 4.0 79 4.4 488,959 3.1 927 1.7 Rubbed or Abraded 26 2.0 35 1.3 19 1.1 28,213 0.2 101 0.2 Other Contact with Object, Equipment 7 0.5 10 0.4 6 0.3 24,632 0.2 66 0.1 Falls (From Elevation) 51 4.0 137 5.2 96 5.4 1,279,844 8.1 2,914 5.3 Falls (To Same Level) 170 13.3 410 15.7 267 14.9 3,244,494 20.5 9,823 17.9 Falls (Other) 2 0.2 7 0.3 7 0.4 75,708 0.5 89 0.2 Bodily Reaction 106 8.3 235 9.0 171 9.5 1,276,468 8.1 5,876 10.7 Overexertion 251 19.6 547 21.0 413 23.0 3,715,566 23.5 16,275 29.6 Repetitive Motion 26 2.0 57 2.2 38 2.1 455,193 2.9 2,252 4.1 Heart Attacks and Strokes 4 0.3 5 0.2 1 0.1 8,008 0.1 0 0.0 Contact (Electrical) 1 0.1 3 0.1 2 0.1 441 0.0 0 0.0 Contact (Temperature Extremes) 29 2.3 49 1.9 34 1.9 36,762 0.2 108 0.2 Exposure (Noise) 2 0.2 5 0.2 3 0.2 4,043 0.0 0 0.0 Exposure (Harmful Substance) 86 6.7 182 7.0 93 5.2 856,951 5.4 4,528 8.2 Accidents (Highway Vehicle) 12 0.9 42 1.6 29 1.6 397,585 2.5 1,647 3.0 Accidents (Non-Highway Vehicle) 18 1.4 31 1.2 27 1.5 276,159 1.7 562 1.0 Accidents (Other Transportation) 13 1.0 31 1.2 24 1.3 301,481 1.9 384 0.7 Explosions 1 0.1 4 0.2 3 0.2 25,576 0.2 0 0.0 Assaults, Violent Acts 53 4.1 118 4.5 73 4.1 600,050 3.8 2,549 4.6 Other Events/Exposures 18 1.4 32 1.2 19 1.1 148,765 0.9 120 0.2 Nonclassifiable 4 0.3 14 0.5 8 0.4 25,590 0.2 0 0.0 Note: Cost and percent totals may not add due to rounding.
2019 HAWAI‘I WORKERS' COMPENSATION STATISTICSREPORTED PROCESSED WITH COST COST DAYS LOST
19

2019 HAWAI‘I REPORTED FATALITIES
% of HAWAI‘I MAUI KAUA‘I
STATE TOTAL O‘AHU COUNTY COUNTY COUNTY
26 100.0% 14 6 3 3
SEX
Male 23 88.5 11 6 3 3
Female 3 11.5 3 0 0 0
MARITAL STATUS
Married 13 50.0 6 2 3 2
Single 13 50.0 8 4 0 1
AGE
18-24 0 0.0 0 0 0 0
25-34 2 7.7 2 0 0 0
35-44 4 15.4 2 2 0 0
45-54 7 26.9 4 1 1 1
55-64 7 26.9 4 2 1 0
Over 64 6 23.1 2 1 1 2
INDUSTRY
Natural Resources 1 3.8 1 0 0 0
Construction 4 15.4 1 1 1 1
Wholesale Trade 2 7.7 1 1 0 0
Retail Trade 2 7.7 1 0 1 0
Transportation & Warehousing 4 15.4 2 1 0 1
Finance, Insurance, Real Estate, Rental, & Leasing 1 3.8 0 1 0 0
Professional, Scientific & Tech 1 3.8 1 0 0 0
Administrative, Support, & Waste Management 5 19.2 2 1 1 1
Educational Services 1 3.8 1 0 0 0
Health Care & Social Assistance 1 3.8 1 0 0 0
Arts, Entertainment, and Recreation 1 3.8 1 0 0 0
Other Services, except Public Administration 1 3.8 1 0 0 0
Public Administration 2 7.7 1 1 0 0
OCCUPATION
Professional Specialty 4 15.4 3 1 0 0
Technical Support 3 11.5 2 0 0 1
Sales 2 7.7 1 0 1 0
Admin Support/Clerical 1 3.8 0 0 1 0
Protective Service 4 15.4 1 1 1 1
Services 3 11.5 2 1 0 0
Agricultural, Forestry & Fishing 2 7.7 1 1 0 0
Mechanic, Repairer 3 11.5 2 1 0 0
Construction Trades/Extractive 1 3.8 1 0 0 0
Transportation, Material Moving 1 3.8 0 0 0 1
Handler, Helper, Laborer 2 7.7 1 1 0 0
CAUSE
Falls 4 15.4 2 2 0 0
Bodily Reaction 6 23.1 3 1 2 0
Heart Attacks and Strokes 9 34.6 5 2 1 1
Exposure (Harmful Substance) 1 3.8 0 1 0 0
Transportation Accidents 3 11.5 1 0 0 2
Fires and Explosions 1 3.8 1 0 0 0
Assault or Violent Acts 1 3.8 1 0 0 0
Nonclassifiable 0 0.0 0 0 0 0Note: Percentages may not add due to rounding.
20

21
2019 HEARINGS AND DECISIONS ISSUED
EAST WEST STATE O‘AHU HAWAI‘I HAWAI‘I MAUI KAUA‘I
HEARINGS 1,319 677 153 120 254 115 DECISIONS ISSUED 6,222 4,192 504 379 828 319 Act 59 Settlement 769 546 50 54 81 38 Attorney Fees 1,287 1,011 91 53 95 37 Denial 46 24 1 4 7 10 Disfigurement 361 163 57 43 40 58 Fatality 14 6 2 3 0 3 Medical 460 190 78 64 103 25 Permanent Partial 1,851 1,365 95 81 229 81 Permanent Total 8 6 1 0 1 0 Temporary Partial 5 3 1 0 1 0 Temporary Total 178 95 23 7 35 18 Benefit Adjustments 0 0 0 0 0 0 Other 1,243 783 105 70 236 49
WORKERS’ COMPENSATION MAXIMUM WEEKLY WAGE BASE AND MAXIMUM WEEKLY BENEFIT AMOUNT HISTORY
Year
Maximum Weekly Wage
Base
Maximum Weekly Benefit
Amount
Year
Maximum Weekly Wage
Base
Maximum Weekly Benefit
Amount
1984 $421.50 $281.00 2002 $845.96 $564.00
1985 $436.50 $291.00 2003 $869.96 $580.00
1986 $448.50 $299.00 2004 $893.96 $596.00
1987 $477.00 $318.00 2005 $932.95 $622.00
1988 $501.00 $334.00 2006 $980.95 $654.00
1989 $537.00 $358.00 2007 $1.016.95 $678.00
1990 $574.47 $383.00 2008 $1,043.95 $696.00
1991 $617.97 $412.00 2009 $1,087.45 $725.00
1992 $655.47 $437.00 2010 $1,117.44 $745.00
1993 $689.97 $460.00 2011 $1,096.45 $731.00
1994 $721.46 $481.00 2012 $1,120.44 $747.00
1995 $736.46 $491.00 2013 $1,142.94 $762.00
1996 $743.46 $496.00 2014 $1,165.44 $777.00
1997 $751.46 $501.00 2015 $1,178.94 $786.00
1998 $761.96 $508.00 2016 $1,217.94 $812.00
1999 $778.46 $519.00 2017 $1,268.94 $846.00
2000 $793.46 $529.00 2018 $1,324.43 $883.00
2001 $820.46 $547.00 2019 $1,348.43 $899.00

22
2019 DIGEST OF THE WORKERS' COMPENSATION LAW
Purpose To provide medical, rehabilitation, income, and indemnity benefits to workers suffering work-connected injuries, or in the event of death, income and indemnity benefits to their dependents.
Coverage All workers except: Federal government workers. Workers for nonprofit organizations if in voluntary or unpaid capacity. Students working for a school, college, or university in return for board, lodging, or tuition. Ordained members of the church. Certain domestic workers. Certain 25% stockholders of a corporation. Owners with 50% or more of a corporation. Real estate salespersons or brokers paid solely by commission. Certain 50% distributional interest members of a limited liability company. Certain 50% partners of a limited liability partnership. Partners of a partnership. Sole Proprietors.
Eligibility Requirements for Benefits Employee suffering personal injury by accident arising out of and in the course of employment, or by disease proximately caused by or resulting from the nature of the employment.
Disqualification from Benefits Injury incurred by willful self-infliction or to another by actively engaging in any unprovoked non-work related physical altercation other than in self-defense or by intoxication. Mental stress claims resulting solely from disciplinary action taken in good faith by employer.
Waiting Period Three days.
Weekly Benefits 66-2/3% of the worker's average weekly wages for permanent total, partial, and temporary total disabilities. 66-2/3% of difference of wages before and after injury for temporary partial disability.
Benefit Provisions - 2019 Minimum weekly benefits - $225.00 Maximum weekly benefits - $899.00 Maximum weekly amount used to compute weekly benefits for surviving spouse - $1,348.43 Funeral expenses - $8,990.00 Burial expenses - $4,495.00
Duration Medical - as reasonably needed or as the nature or injury requires. Death - various duration for beneficiaries. Temporary total disability - duration of the disability. Permanent total disability - for life.
Appeal Provisions Within 20 days after a decision has been sent to parties concerned.
Statute of Limitation for Filing a Claim Within two years after date of injury in which the effects have manifest and within five years after date of accident or occurrence of injury.
Employer's Penalties and Fines Effective July 1, 2016, penalty will not be less than $500 or $100 for each employee each day for failure to give security for compensation (whichever sum is greater). Up to $5,000 for refusing or neglecting to give required notice or to make required reports. 20% of unpaid compensation for default in payment.
Method of Insuring Through insurance carriers or approved employer self-financing.
Financing Cost of insurance paid by employer.
Funds Special Compensation Fund
Income: Fines and penalties. Death benefits where there are no dependents. Special assessments.
Outgo: To pay benefits to injured employee whose injury occurred prior to 1973 and where the employer or carrier has paid the maximum aggregate, for concurrent employment benefits and for preexisting condition benefits. To reimburse employees/employers effective January 1, 1992 and January 1 of every tenth year thereafter, for the cost of supplemental allowance for permanent total disability payments to employees injured before January 1, 1992 and January 1 of every tenth year thereafter. To injured employee or dependents where employer is in default in payment of compensation. For litigation expense incurred by or on behalf of the Special Compensation Fund.
Solvency: When cash balance falls below an amount determined by the Director to be insufficient to meet the fund's current and projected obligation, a levy based on a percentage of gross premiums and a special charge against self-insured until cash balance equals or exceeds an amount determined by the director to be sufficient to meet the fund's current and projected obligations.

23
DEFINITIONS
Attendant Services Cost of services of an attendant for a totally disabled employee.
Average Cost Per Case Total compensation costs divided by the number of processed cases with cost.
Compensation Orders Decisions made on controverted cases, on awarding of permanent partial disability and disfigurement, and on reopening cases.
Costs All payments accorded to a claimant to include disability, death, disfigurement, vocational rehabilitation, attendant services, and medical payments.
Days Lost Number of compensated (calendar) days in which injured workers were not able to work because of temporary total disability. This excludes the three-day waiting period.
Disfigurement Scar, deformity, discoloration, or other disfiguring consequences resulting from the injury or caused by medical, surgical, and hospital treatment of the employee. This is separate from permanent partial disability.
Employment That portion of the work force covered by Workers' Compensation law. Annual average taken from the "Employment and Payrolls in Hawai‘i" report excluding federal government employees.
Event or Exposure Identifies the circumstance, which directly resulted in the injury or illness.
Industry Identifies employers by the major type of activity in which they are engaged.
Medical Physicians and hospital costs and costs for services and supplies.
Nature of Injury or Illness Identifies the injury or illness in terms of its principal physical characteristic.
Occupation Identifies the nature of work of the employee.
Part of Body Identifies the part of the worker's body directly affected by the injury or illness.
Permanent Partial Disability Injury or illness which results in the complete loss or loss of any member or part of the body or any permanent impairment of functions of the body or part thereof, regardless of any pre-existing disability.
Permanent Total Disability Any injury or illness other than death, which permanently and totally incapacitates an employee from following any gainful occupation.
Processed Cases Reported injuries or illnesses during the report year and all prior years on the Disability Compensation Information System database for which an action has occurred during the report year. Actions on a case includes having been subject to a screening procedure having the injury or illness medically evaluated, and/or medical costs and/or workers’ compensation payments occurred. For example a case initially reported on a WC-1 in 1990, where payments were made in 2014, would be counted as a 2014 processed case and a case reported in 2014 with or without payments will be counted as a 2014 reported case and 2014 processed case.
Reported Injuries and Illnesses (Reported Cases)
All injuries and illnesses reported to the Disability Compensation Division. These reported injuries or illnesses may not have occurred during the report year, due to the change in close date (See Technical Notes, #5) to process a reported case.
Reported Fatalities Any death resulting from an on-the-job injury or illness reported to the Disability Compensation Division.
Source of Injury or Illness Identifies the object, substance, exposure, or bodily motion, which directly produced or inflicted the injury or illness.
Temporary Partial Disability A work injury or illness which causes partial rather than total disability for temporary periods. The injured worker is paid a weekly benefit amount of 66-2/3 percent of the difference between his average weekly wages before the injury and his weekly earnings thereafter for the duration of the disability.
Temporary Total Disability A common type of disability where the work injury or illness causes total disability for temporary periods. The employer or insurance carrier, for the duration of the disability, but not including the first three days, pays the injured worker a weekly benefit amount of 66-2/3 percent of his average weekly wages, but not more than the maximum weekly benefit amount nor less than the minimum weekly benefit amount, or if his average weekly wages are less than the minimum weekly benefit amount, at a rate of 100 percent of his average weekly wages.
Vocational Rehabilitation Cost of vocational rehabilitation services.

24
TECHNICAL NOTES The Workers’ Compensation Data Book is based on the annual accumulation of data in the State of Hawai‘i, Disability Compensation database.
1. The following coding systems and locally revised versions were used to categorize data:
a) Industrial attachment is determined by the principal activity of the employer as defined in the North American Industry Classification System 2002 (NAICS). The new NAICS industry groupings better reflect the workings of the U.S. economy, particularly in the services sector. NAICS, developed using a production oriented conceptual framework, groups establishments into industries based on the activity in which they are primarily engaged. It is not an update of the Standard Industrial Classification (SIC) system. NAICS focuses on how products and services are created. More information on NAICS is available at the U.S. Census Bureau website at http://www.census.gov/epcd/www/naics.html.
b) Codes and definitions used to categorize Nature of Injury or Illness, Part of Body Affected, Source of Injury or Illness, and Event or Exposure were modeled after the 1992 Bureau of Labor Statistics (BLS) Occupational Injury and Illness Classification Structures (OIICS). Starting with 1996 data, BLS OIICS data codes were locally modified to 2 digits instead of 4 digits, making the data less detailed.
c) Occupational groups are based on the 1990 Alphabetical Index of Industries and Occupations, developed and published by the Bureau of the Census, Washington, D.C., U.S. Government Printing Office. Starting with 1996 data, the occupation classifications were locally modified, making the data less detailed.
2. From 1999, the employment data source used in the Worker’s Compensation Data Book has been changed. Instead of the Labor Force Data Book employment we are using the Employment and Payrolls in Hawai‘i statistics. Employment data from the later publication may be more in line with workers covered under the Workers’ Compensation program. Caution should be taken when reviewing the employment and frequency data for trend analysis prior to 1999.
3. From 2000, the table Hearings and Decisions Issued (previously called Compensation Orders Issued and Number of Hearings) has changed to include Act 59 settlements and attorney fees. The combined category Permanent Partial & Disfigurement no longer exists. Figures are reported under the category with the highest severity. For example: a case with disability payments and disfigurement award would be counted in the disability category and not in disfigurement.
4. Beginning with the 2002 Workers’ Compensation Data Book, there is a new format for the Industry category.
The North American Industry Classification System (NAICS) is being used to designate the different industries instead of the Standard Industrial Classification (SIC) system. For trend analysis purposes, the data may not be comparable.
5. Effective with the 2004 Workers’ Compensation Data Book, the close date to process a “reported case” for the
preceding calendar year was changed from January 31 to December 31 to accommodate the filing of electronic “WC-1 Employers Report of Industrial Injury”. For trend analysis purposes, the data for 2004 may not be comparable.
6. From 2014, Financial Activities in the Industry group replaced Finance, Insurance, Real Estate, Rent & Leasing;
Finance, Ins, Real Estate, Rent, & Leasing; and Fin, Ins, Real Est, Rent, & Leasing.


STATE OF HAWAII DEPARTMENT OF LABOR AND INDUSTRIAL RELATIONS RESEARCH AND STATISTICS OFFICE 830 PUNCHBOWL STREET, ROOM 304 HONOLULU, HAWAII 96813