Embed Size (px)
Citation preview

ABSTRACT
WOODLIEF, JOHN ASHLEY, Paratransit Customer Satisfaction With Real-Time
Information: The Winston-Salem Trans-AID Case. (Under the direction of Dr. John R.
Stone.)
Improving transit service to attract new riders is a primary goal for transit agencies. And
tracking the effects of new services on customer satisfaction helps transit managers
determine if they are making cost-effective decisions. This research examines the effects
of improved telephone communication on customer satisfaction with transit service.
Customer satisfaction data were collected before and after Winston-Salem Transit
Authority installed an interactive voice response automated telephone system. Using a
touch-tone telephone, passengers call WSTA to check on their paratransit trip status,
cancel trip reservations, ask questions regarding transit service and policies, and conduct
other trip-related functions. The research methodology uses three complementary
methods to collect and process customer satisfaction data before and after the telephone
system is installed: stated preference surveys, revealed preference data, and derived
importance. Survey results indicate that customers adapted to using the automatic
telephone system as a useful and reliable alternative to speaking with a WSTA operator.
Surveys show a general increase in customer satisfaction with transit information and
services, and analysis reveals a significant improvement in customer satisfaction and
reduced frequency of waiting on hold or having to call back after receiving a busy signal.
Derived importance analysis indicates rising customer expectations for transit service,

especially the ease of calling WSTA and the time to confirm, cancel or book a trip.
Revealed preference data confirm the results of the user surveys and demonstrate a
significant shift of passengers from speaking to operators directly to using the automated
touch-tone telephone system. Overall, the automated telephone system appears to be a
valuable asset to Winston-Salem Transit.

PARATRANSIT CUSTOMER SATISFACTION WITH REAL-TIME INFORMATION: THE WINSTON-
SALEM TRANS-AID CASE
BY JOHN ASHLEY WOODLIEF
A THESIS SUBMITTED TO THE GRADUATE FACULTY OF NORTH CAROLINA STATE UNIVERSITY
IN PARTIAL FULFILLMENT OF THE REQUIREMENTS FOR THE DEGREE OF
MASTER OF SCIENCE
DEPARTMENT OF CIVIL ENGINEERING
RALEIGH, NC OCTOBER, 2003
APPROVED BY:
Dr. John R. Stone Chair of the Advisory Committee
Dr. Joseph E. Hummer
Dr. Billy M. Williams

ii
BIOGRAPHY John Ashley Woodlief was born in Durham, North Carolina in May 1979 to Rickey and
Karen Woodlief. He attended Apex High School where he developed an appreciation for
creative design. He obtained his Bachelor of Science degree in Civil Engineering from
North Carolina State University in December 2001. John hopes to pursue a career in public
infrastructure design with a focus on finance and possibly an MBA after completing his
Master of Science degree in Civil Engineering from North Carolina State University.

iii
ACKNOWLEDGEMENTS
I would like to express my sincerest gratitude for having the opportunity to successfully
complete my master’s research dissertation. I want to dedicate this accomplishment to the
multitude of outstanding people who collectively buttressed my resolve when the
challenges appeared too daunting to overcome.
To my parents, Rickey and Karen, forever I will be indebted to your inexorable conviction
to faithfully inspire me to pursue the ideals and virtues of humility, tolerance, compassion,
and responsibility.
To Dr. John Stone (Chair of Advisory Committee), I someday aspire to reach a modicum of
your personal and professional stature; your uncompromising attention and persistence to
assiduously guide me through the trials and tribulations of undergraduate course work is
worthy of recognition. I most admire your patience and commitment in providing
leadership where it was needed and to challenge me to think critically and independently
throughout the development of my thesis.
I would be remiss if I failed to recognize Dr. Joseph Hummer (Advisory Committee
Member) for his substantial contributions as an educator and a personal role model. His
tireless work in the classroom and pervasive involvement with student organizations
resonates with me as well as every student fortunate enough to follow his direction.
The outstanding employees of the Winston-Salem Transit Authority, including Suzanne
Tellechea and Linda Little, are to be commended for their selfless resolve to skillfully
accommodate our research demands. Ms. Tellechea and Ms. Little helped conceive and
carry out the tasks of data collection and data synthesis that were so integral to the research
project.

iv
I would also like to express my appreciation for the financial support provided by the
Winston-Salem Transit Authority and the Southeastern Transportation Center.

v
TABLE OF CONTENTS
LIST OF FIGURES vii
LIST OF TABLES viii
SECTION I. INTRODUCTION 1
Background 1
Advanced Public Transportation Systems 1
Winston-Salem Transit Authority and APTS 3
Problem 6
Scope and Objectives 6
SECTION 2. LITERATURE REVIEW 8
Introduction 8
Focus Groups 9
User Surveys 9
Revealed Preference 10
Derived Importance 11
Summary 13
SECTION 3. METHODOLOGY FOR CUSTOMER EVALUATION 15
Introduction 15
Focus Groups 16
Stated Preference Survey Design 17
Stated Preference Survey Administration 18
Revealed Preference 19
Derived Importance 19
Summary 24
SECTION 4. WSTA CUSTOMER SATISFACTION EVALUATION 25
Introduction 25

vi
Focus Groups 25
Stated Preference 27 Stated Preference Summary 33
Revealed Preference 33
Revealed Preference Analysis 36 General Trends 36 Telephone Activity 36 Operator Workload 41 Average Call Length 43
Synthesizing Stated and Revealed Preference Findings 43 Information Characteristics 44 Information Characteristics Summary 46 Service Characteristics 46
Revealed Preference Summary 47
Derived Importance 48 Service Characteristics 51
Synthesizing Stated Preference and Derived Importance Findings 53 Information Characteristics 53 Service Characteristics 60
Derived Importance Summary 63
SECTION 5. CONCLUSIONS AND RECOMMENDATIONS 65
Introduction 65
Focus Groups 65
Stated Preference 66
Revealed Preference 68
Derived Importance 69
Recommendations for Future Assessments and Research 71
Implications for Future WSTA Service Improvements 72
SECTION 6. REFERENCES 74
APPENDIX 1. TRANS-AID CUSTOMER SATISFACTION SURVEY 76
APPENDIX 2. SAMPLE IVR ACTIVITY REPORT 77
APPENDIX 3. PRE-IVR AND POST-IVR DATA FOR FIGURE 4-3 78
APPENDIX 4. PRE-IVR AND POST-IVR AVERAGE CALL LENGTH 79

vii
LIST OF FIGURES Figure 1-1: Piedmont Triad Region of North Carolina 4 Figure 1-2: The Piedmont Triad, Winston-Salem and Forsyth County 4 Figure 3-1: Methodology Flow Diagram 16 Figure 3-2: Derived Importance (Weinstein 2000) 23 Figure 4-1: IVR Dichotomy 35 Figure 4-2: Pre-IVR and Post-IVR Trans-AID Customer Telephone Activity 37 Figure 4-3: Pre-IVR and Post-IVR Trans-AID Customer Telephone Activity 39 (Part II) Figure 4-4: Pre-IVR and Post-IVR WSTA Customer Telephone Activity 42 (Trans-AID & Fixed Route) Figure 4-5: Pre-IVR and Post-IVR Comparison with Trans-AID Information 49 Characteristics Figure 4-6: Pre-IVR and Post-IVR Comparison with Trans-AID Service 52 Characteristics

viii
LIST OF TABLES 2-1: Comparison Matrix for Study Methods 13 4-1: Data Collection Summary 30 4-2: Pre-IVR and Post-IVR Data Sets 30 4-3: Pre-IVR and Post-IVR Data Summary 32 4-4: Summary of Pre-IVR and Post-IVR Comparison with Trans-AID 50 Information Characteristics 4-5: Summary of Pre-IVR and Post-IVR Comparison with Trans-AID Service 53 Characteristics

1. Introduction 1
SECTION I. INTRODUCTION
Background
Numerous transit agencies have implemented Advanced Public Transportation Systems
(APTS) technologies in the past decade. Yet the impacts of APTS on customer satisfaction
remain unclear. The following study will provide a thorough assessment of one APTS
technology in particular: the Interactive Voice Response (IVR) automatic telephone
system, which is capable of providing customers with a wealth of transit information
through touch-tone dialing. To evaluate IVR, a before-after case study is performed to
analyze paratransit customer satisfaction for the Winston-Salem Transit Authority (WSTA)
in Winston-Salem, North Carolina.
Advanced Public Transportation Systems
Advances in technology along with federal and state transportation initiatives over the last
decade have provided an impetus for paratransit operators to invest in technological
upgrades such as computer-assisted scheduling and dispatching (Pagano et al 2001).
Transit operators throughout the United States assume that integration of new technologies
in transit operations benefit the operators and users. The August 2003 issue of METRO
magazine references the use of new technology as a way to improve paratransit service,
stating the use of automated vehicle location (AVL), mobile data terminals (MDTs),
interactive voice response (IVR) and onboard navigational technology is becoming
increasingly common among paratransit operators (Neal 2003). Transit systems use APTS
technologies to improve services to the customers. These technologies collect and analyze
transit vehicle location and scheduling while passing this information on to customers. An
Interactive Voice Response Telephone System (IVR) is any telephone system application
that interactively takes digital or voice input from callers and returns output in voice or
auditory information. Automatic Vehicle Location (AVL) is technology that tracks
vehicles and stores the data in a central terminal for scheduling purposes. The location data

1. Introduction 2
may also be displayed to customers as expected arrival and departure times or as vehicle
tracks on digital kiosk maps. Mobile Data Terminals (MDT), allow transit staff and
customers to access information from a base computer system to determine vehicle
location, vehicle route, arrival times and other important information.
The benefits from APTS are presumed to be in the areas of customer satisfaction and transit
system efficiency. Yet, few studies support or refute the assumption that customer
satisfaction is improved with increasing usage and complexities of new technologies.
Specifically, little information exists about the benefits of IVR systems on customer
satisfaction. Few researchers have studied explicitly the customers who use paratransit as a
primary source of mobility, and fewer still have examined the way in which these
customers view the services that they receive (Wallace 1997).
Several U.S. transit authorities have installed IVR operations in paratransit services. Dallas
Area Rapid Transit (DART) restructured their paratransit service in 1997 to improve
productivity and customer service. As part of the restructuring, DART implemented IVR
for their paratransit service in 2001. No documented results were found for IVR impacts;
the system as a whole has improved productivity and customer satisfaction according to
anecdotal reports (DART 2000).
The literature does not indicate a correlation between customer satisfaction and ease of
access to information. While the USDOT, National ITS Guidelines advocate that
maintaining customer satisfaction is essential, a Detroit study by the Suburban Mobility
Authority for Regional Transportation (SMART) indicated that there was no significant
impact on customer satisfaction following the implementation of a customer information
system similar to IVR (Wallace 1997). In fact, at SMART the level of satisfaction of long-
time customers seemed to decrease with the implementation of this technology across a
range of important factors:
• Customer satisfaction while scheduling a paratransit trip,

1. Introduction 3
• Customer satisfaction while taking a paratransit trip,
• Accessibility to mandatory destinations (work places, shopping areas),
• Efficiency and ease of scheduling and taking a paratransit trip, and
• Convenience of trips (meeting desired pickup and drop off times).
To further explore the work begun at DART and SMART, this study seeks to examine the
impacts of IVR on similar customer satisfaction factors at the Winston-Salem Transit
Authority (WSTA). Winston-Salem Transit Authority and APTS
WSTA provides public transportation services for the City of Winston-Salem, located in
the central Piedmont region of North Carolina. Winston-Salem lies approximately 100
miles west of Raleigh and 100 miles northeast of Charlotte. The Piedmont Triad region
shown in Figure 1-1 encompasses 12 counties including Forsyth County, whose county seat
is Winston-Salem. According to the 2000 U.S. census, 1,464,390 people lived in the
Piedmont Triad; the population of Forsyth County was 306,067, and the City of Winston-
Salem had 185,776 residents.
WSTA offers paratransit service to qualifying citizens in Winston-Salem and surrounding
areas in Forsyth County, representing a 409-square mile service area. WSTA’s paratransit
service, referred to as Trans-AID, is a 20-vehicle demand-responsive shared ride system
facilitating over 98,000 annual passenger trips to human service agencies, the regional
medical center, doctors’ offices, nutrition centers, etc. The Trans-AID client base is
predominantly composed of elderly, lower income and minority passengers. Trans-AID
has about 3000 clients and handles approximately 450 daily trips. This service operates
between 8 a.m. and 5 p.m. Monday through Friday with limited service on Saturday.

1. Introduction 4
Figure 1-1: Piedmont Triad Region of North Carolina
Source: Piedmont Triad Partnership
Figure 1-2: The Piedmont Triad, Winston-Salem and Forsyth County
Source: Winston-Salem Convention & Visitors Bureau

1. Introduction 5
WSTA has served as a model transit system for North Carolina and the United States for
the past decade. In 1993 USDOT designated WSTA as a National Demonstration Project
for Mobility Management. Work began in 1993 to produce functional designs for
computerized scheduling, mobile data terminals, advanced vehicle locators and smart cards
for the 20-vehicle Trans-AID paratransit system. During the implementation and
evaluation phase (Phase 1) WSTA staff and contractors installed the technologies in 1994,
and NCSU researchers determined these APTS components improve transit productivity
(Stone 1996). The research also led to the development of innovative scheduling and
evaluation tools (Baugh et al 1998).
Phase 2 of the WSTA Mobility Management project began in 2000 with an operational
goal of developing a single source of information about local mobility options using real-
time information. During this phase WSTA implemented technology to provide customers
real-time information on arrival and departure times of paratransit and fixed route services.
Included in this phase are automated telephone systems, bus bay signs, and a centralized
station master board. WSTA hopes to be able to demonstrate that improved
communication improves passenger satisfaction. IVR technology has operated since
August 2000 and the supporting AVL and MDT technologies are scheduled to be operating
in 2003. Bay signs and the master board will be installed in 2004.
When fully functional, IVR technology will allow Trans-AID customers to
• Call back and cancel rides automatically;
• Ask “Where’s my Bus?” without speaking to an operator; and
• Perform a variety of other information requests using the telephone keypad to select
pre-recorded and real-time messages.
Using a four-digit PIN number, customers confirm or cancel service reservations using a
telephone. Customers also have access to information such as schedules, policies, and lost

1. Introduction 6
and found items. A later stage of the IVR project will include automatic IVR trip
reservations and call-outs for passengers a few minutes before their bus arrives.
Problem
Finding changes in customer satisfaction resulting from IVR informs future policy
decisions regarding APTS improvement projects at WSTA and other transit agencies.
Transit agencies like WSTA want to know answers to such questions as:
• Will IVR and related APTS technologies generally improve customer satisfaction
with telephone information?
• Will IVR and related APTS technologies generally improve customer satisfaction
with transit service?
• According to passengers, what specific components of telephone information or
transit service are most improved by IVR?
Such components affected by IVR include information availability, quality of telephone
communication, staff helpfulness and ease of making trip reservations. Besides assessing
impacts of APTS on transit customer satisfaction, transit agencies also wish to know the
best or most efficient methods for acquiring customer feedback. Thus, this research will
use the WSTA Trans-AID service to determine customer satisfaction impacts of IVR and to
systematically compare alternative methods to acquire customer satisfaction information
for APTS and other improvements.
Scope and Objectives
The fundamental research question is, “to what extent does automatic information increase,
or not, transit customer satisfaction?” This project addresses the question for the
implementation of IVR-based automated Trans-AID information. During the research,
Trans-AID had ‘static’ IVR technology facilitating customers’ requests for previously

1. Introduction 7
programmed information like cancellations; however, the system could not handle real-
time ‘dynamic’ questions like, “where is my bus”, and “can I schedule a ride on this date?”
These questions rely on constantly updated, real-time information produced by AVL
scheduling systems planned for installation in 2003.
Specific objectives for the research are:
• To compare alternative methods for evaluating transit customer satisfaction before
and after a transit system change,
• To develop and apply a methodology for assessing changes in Trans-AID customer
satisfaction with telephone information as a result of installing an IVR automated
telephone system,
• To determine any impacts IVR has on customer satisfaction with Trans-AID
service,
• To identify ‘lessons learned’ regarding the customer satisfaction assessment, and
• To gauge the success of the Trans-AID IVR project with respect to customer
satisfaction and make recommendations for future WSTA technology
improvements.
In a broader context for the national transit industry this research project tests the utility of
automated information systems and demonstrates methods of assessing customer
satisfaction. While the focus of this project is on IVR automated telephone technology for
paratransit service, it is anticipated that the assessment methods developed in this project
will extend to fixed bus bay signs, kiosks and the master board for fixed-route arrival and
departure times. As WSTA installs these new technologies careful planning is necessary to
obtain the appropriate before and after implementation data that allow comparative impacts
to be assessed.

2. Literature Review 8
SECTION 2. LITERATURE REVIEW
Introduction
According to the National ITS Guidelines (USDOT 2002), maintaining customer
satisfaction is an important research area as well as an operational objective. WSTA’s
concern about customer satisfaction and transit service improvement reflects an increasing
awareness of customers’ perceptions. If transit managers know how their customers rate
the transit system on service characteristics and the relative importance of those
characteristics, then they will be able to set priorities for sustaining or improving customer
satisfaction (Weinstein 2000).
A literature review was undertaken to identify previous research initiatives dedicated to
evaluating transit customers’ satisfaction before and after the implementation of changes in
information or transit service. With the exception of R.R. Wallace’s “Paratransit Customer
Modeling Elements of Satisfaction with Service,” the literature review did not encounter
any other studies that emphasized a comprehensive scientific approach towards analyzing
transit customers’ satisfaction.
Moving beyond explicit customer satisfaction research, a review of general before-after
studies identifies a variety of evaluation techniques or methods. These methods include
focus groups, user surveys, revealed preference and derived importance. Each of these
methods may be compared on the basis of objectivity, subjectivity, statistical bias, etc.
Methods that are objective rely on ‘hard’ data rather than subjective opinions and responses
to survey questions. Whether a method is quantitative or qualitative depends on the degree
to which numerical methods apply and the statistical validity depends on the sample size.
However, important information for planning and marketing may be obtained from a
method that is not necessarily statistically valid, such as focus groups and opinion surveys.

2. Literature Review 9
Focus Groups
Transit professionals and a host of others have embraced focus groups as a constructive
venue to engage participants in managed discussion. The focus group relies on a candid,
expressive dialogue among participants, which may be inhibited unless participants have
similar ethnic and socioeconomic backgrounds (Kruegar 2000). The group discussion is
conducted several times with similar groups of participants to identify trends and patterns
in perceptions (Marczak, Sewell 2002).
The strengths of the focus group include:
• Revealing how customers use and value paratransit service,
• Identifying the level of service customers expect, and
• Enabling exploration of user perceptions, values, and behavior.
The weaknesses of the focus group include:
• Evaluating information,
• Generalizing findings from the group to the overall transit passengers or city
population,
• The lack of statistical significance, and
• Drawing valid conclusions based on small samples of subjective group discussion.
User Surveys
The most common method for evaluating transit customer satisfaction is based on customer
survey responses. User surveys provide an invaluable resource to examine the relationship
between customers and transit service. The survey approach yields customer responses
based on customer opinions and preferences. However, the survey may be limited in scope
and fail to elicit answers to all pertinent issues. Nonetheless, customers’ stated preferences
2. Literature Review 10
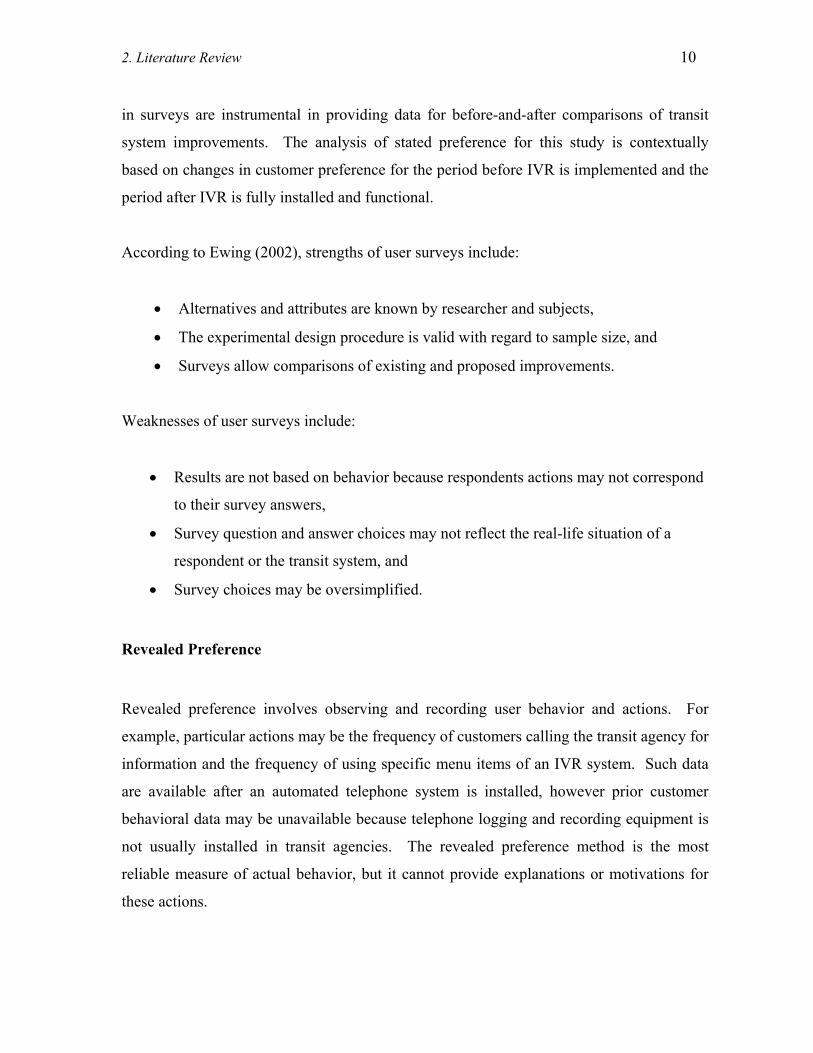
in surveys are instrumental in providing data for before-and-after comparisons of transit
system improvements. The analysis of stated preference for this study is contextually
based on changes in customer preference for the period before IVR is implemented and the
period after IVR is fully installed and functional.
According to Ewing (2002), strengths of user surveys include:
• Alternatives and attributes are known by researcher and subjects,
• The experimental design procedure is valid with regard to sample size, and
• Surveys allow comparisons of existing and proposed improvements.
Weaknesses of user surveys include:
• Results are not based on behavior because respondents actions may not correspond
to their survey answers,
• Survey question and answer choices may not reflect the real-life situation of a
respondent or the transit system, and
• Survey choices may be oversimplified.
Revealed Preference
Revealed preference involves observing and recording user behavior and actions. For
example, particular actions may be the frequency of customers calling the transit agency for
information and the frequency of using specific menu items of an IVR system. Such data
are available after an automated telephone system is installed, however prior customer
behavioral data may be unavailable because telephone logging and recording equipment is
not usually installed in transit agencies. The revealed preference method is the most
reliable measure of actual behavior, but it cannot provide explanations or motivations for
these actions.

2. Literature Review 11
Strengths of revealed preference include (Ewing 2002):
• Revealed preference data provide good indications of underlying preferences.
• Revealed preference data support realistic choices more than imaginary preferred
choices.
Weaknesses of revealed preference include:
• The difficulty in estimating the effects of small variances in attributes,
• The difficulty of minimizing the effects of highly correlated attributes, and
• Data are costly and difficult to collect.
Derived Importance
Derived importance determines the relative importance of information and service
characteristics by correlating various components of information and service to overall
information and service, respectively. While correlation analysis cannot be equated with
causation, it serves as a statistic that describes the importance of a characteristic in overall
customer satisfaction. Ranking the relative importance of the characteristics included in
the survey allows target issues to be identified for possible future improvement. Ranking
answers two important questions:
1. Does a statistical predictive relation exist between the satisfaction rating of a
particular characteristic and overall satisfaction rating? For example, is “ease of
calling Trans-AID” a statistical predictor of “overall satisfaction with Trans-AID?”
2. How strong is the statistical relation? For example, is “ease of calling” a major
component of overall information satisfaction compared to other information
attributes?

2. Literature Review 12
As a theoretical mechanism, derived importance probes beyond simple average inferences.
The unique advantage of derived importance, separating it from stated preference analysis,
is the ability to systematically examine and uncover the distinct relationships existing
between customer satisfaction with elementary Trans-AID information attributes and
overall aggregate customer satisfaction with Trans-AID information. For instance,
customers might rate a particular attribute higher after IVR is installed. However, if this
attribute has little influence on aggregate satisfaction, its higher rating has relatively little
impact on aggregate satisfaction.
Unlike revealed preference, derived importance presents a snapshot of customer
satisfaction before and after IVR, rather than a representation of long-term IVR calling
trends incorporated in customer preference data. However, derived importance may
provide an explanation for the development of long-term trends in customers’ revealed
preference choices. Derived importance is useful in ascertaining the most important and
least important aspects of Trans-AID information and Trans-AID services. The average
Trans-AID customer’s ideals and expectations for transit information and transit services
are unknown to the transit provider (WSTA). Surveys are helpful in determining the
customer’s level of satisfaction with explicit services, but they do not collectively compare
which features of transit information and services are most important to the customer. The
only viable alternative to derived importance is an addendum to the original survey, which
asks customers to rate their satisfaction for each characteristic. In the addendum customers
would be asked to additionally consider “how each characteristic individually influences
their overall satisfaction.” Presumably, it would be difficult to properly phrase such a
survey question without confusing the customer with ambiguous terminology.
Derived importance, as a theoretical model that interprets customers’ behaviors and
customers’ preferences, is not immune to error. Below are several potential sources of
error in derived importance analysis.

2. Literature Review 13
• A heavy reliance on survey data gathered in small sample sizes may present a false
representation of derived importance results for the entire population of Trans-AID
customers,
• There is no true ‘average’ customer. Thus, the unknown scope of surveyed
customers’ experiences and activities using IVR may give an unfair advantage
towards a particular measure of importance based on an overrepresentation of
responses from customers who use a particular IVR application, and
• Rating the relative importance and relative performance of each characteristic to its
companion characteristics subjects them to a competition of merit by rank, where
winners obligate the persistence of losers. Under these conditions it is possible to
designate a characteristic as ‘relatively unimportant’; when in fact the characteristic
is still important to most customers.
Summary
Some methods share quantitative-objective and qualitative-subjective attributes with subtle
differences. Summary advantages and disadvantages for each method are shown Table 2-1.
Table 2-1: Comparison Matrix for Study Methods
While focus groups are qualitative-subjective, user surveys are quantitative-subjective.
Focus groups and user surveys prompt customers to offer their opinions and observations
regarding Trans-AID information and service; both methods lack precision, yet they are
reliable devices for intercepting personal attitudes and opinions. Survey responses
represent quantitative data, as survey ratings are numerical embodiments of customers’

2. Literature Review 14
subjective perceptions of Trans-AID attributes. Derived importance utilizes a statistical
approach leading to subjective-qualitative results; derived importance data originates from
user surveys. Revealed preference serves an important role as the only true objective
method contributing quantitative data. Revealed preference data are especially vital in
verifying the reasonableness of customer survey data and the applicability of derived
importance analysis.
Depending on the time and resources available focus groups may be quickly and
inexpensively undertaken because they do not require a large sample from the population to
generate a wealth of feedback. Higher cost and benefits will accrue from derived
importance; it combines good qualities of all the methods, but it is expensive and time-
consuming to carry out because a large sample size is needed to gather statistically valid
comparison data (i.e., user survey data).
With the exception of focus groups, this research project applies each of the methods
simultaneously, for pre-IVR and post-IVR conditions, so that maximum information
regarding WSTA customer satisfaction with IVR can be developed. The next section of
this report describes the methods used to evaluate customer satisfaction before and after
IVR is implemented.

3. Methodology 15
SECTION 3. METHODOLOGY FOR CUSTOMER EVALUATION
Introduction
For the purposes of scientific research, concrete data are required. Quantifiable data permit
statistical testing of the factors affecting customer satisfaction. For this reason, a before-
after evaluation using survey data and ‘real’ customer behavioral data is the preferred
method of study. Stated preference surveys provide a quantitative evaluation of levels of
customer satisfaction for various information characteristics. The results of the surveys are
validated by automated telephone menu item frequencies and other quantitative
information. Such revealed preference is based on explicit data demonstrating objective
usage patterns of transit information resources and IVR system user trends. Revealed
preference data show how customers’ calling behaviors are affected by the implementation
of IVR. Furthermore, the derived importance of the information characteristics indicates
needed management actions.
Customers’ qualitative attitudes are generated in a focus group setting. A subsequent
before-after survey complemented by derived importance analysis, and revealed preference
complete the methodology (Figure 3-1). Each of the four methods included in the
methodology are selected as each provides an element of WSTA customer satisfaction
analysis that others lack
Focus groups were chosen as the first in a series of methods to study individual customer
perceptions prior to the installation of IVR. The next step involves administering customer
surveys, which enables stated preference and derived importance evaluation. The final
research method, revealed preference, relies on data collected from monthly IVR reports
based on Trans-AID customers’ telephone selections. The results of these four methods
were compared to ensure that they support each other, and that people did act as they
responded in the surveys. From these results customer satisfaction was assessed.

3. Methodology 16
Recommendations were made for transit agencies considering implementing IVR
technology.
Figure 3-1: Methodology Flow Diagram
Focus Groups
The purpose of a focus group is the collection of rich, specific, and usually qualitative
information (Milazzo 2003). Focus groups contain approximately four to eight individuals
with similar backgrounds and vested interest in the topic. Accompanying these individuals
are a note-taker and a moderator. The moderator guides the discussion while the note-taker
records the responses of participants. The participants are encouraged to provide insights
and opinions relevant to the topic of discussion. This qualitative and descriptive
information, recorded by a note-taker, is later condensed into a narrative summary of
customers’ overall opinions, observations and recommendations. WSTA followed these
3. Methodology 17
guidelines when it organized its focus group and demonstration of IVR. A summary of the
Trans-AID focus group discussion can be found in section four of this report.
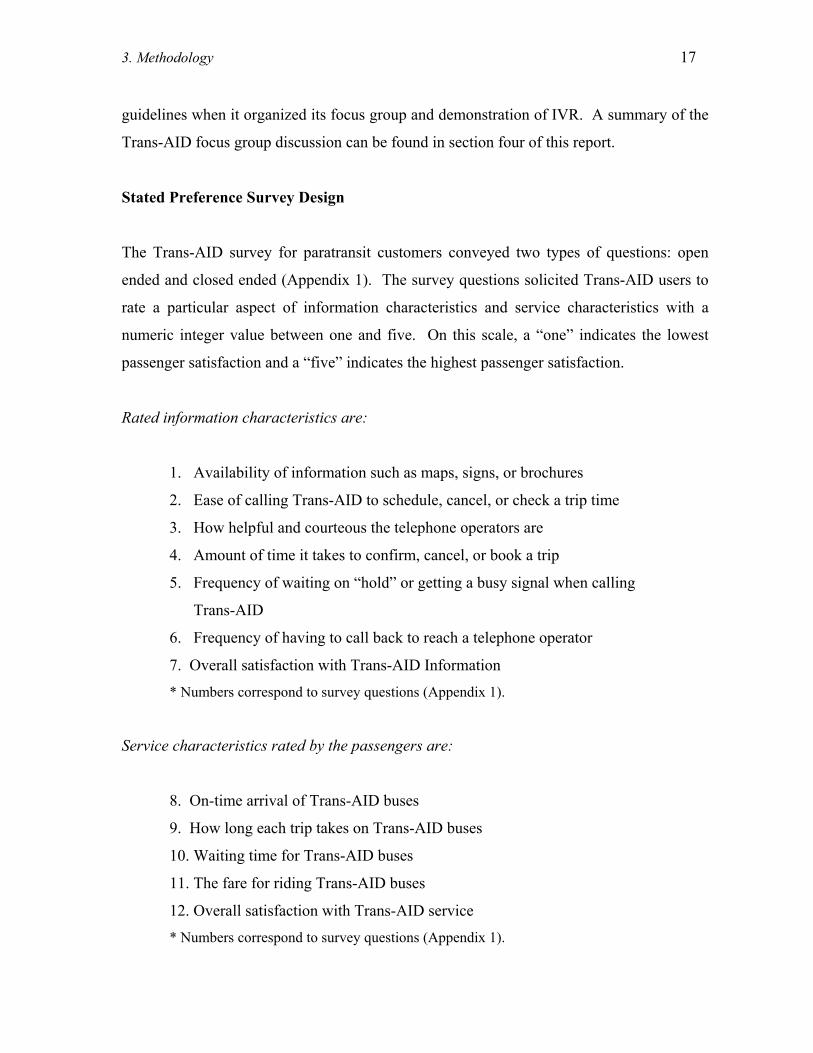
Stated Preference Survey Design
The Trans-AID survey for paratransit customers conveyed two types of questions: open
ended and closed ended (Appendix 1). The survey questions solicited Trans-AID users to
rate a particular aspect of information characteristics and service characteristics with a
numeric integer value between one and five. On this scale, a “one” indicates the lowest
passenger satisfaction and a “five” indicates the highest passenger satisfaction.
Rated information characteristics are:
1. Availability of information such as maps, signs, or brochures
2. Ease of calling Trans-AID to schedule, cancel, or check a trip time
3. How helpful and courteous the telephone operators are
4. Amount of time it takes to confirm, cancel, or book a trip
5. Frequency of waiting on “hold” or getting a busy signal when calling
Trans-AID
6. Frequency of having to call back to reach a telephone operator
7. Overall satisfaction with Trans-AID Information
* Numbers correspond to survey questions (Appendix 1).
Service characteristics rated by the passengers are:
8. On-time arrival of Trans-AID buses
9. How long each trip takes on Trans-AID buses
10. Waiting time for Trans-AID buses
11. The fare for riding Trans-AID buses
12. Overall satisfaction with Trans-AID service
* Numbers correspond to survey questions (Appendix 1).

3. Methodology 18
The categories of information questions and service questions culminate with an overall
assessment of each group. Customers’ overall assessment of information and service
characteristics also support derived importance analysis, which seeks to identify the most
‘important’ attributes of Trans-AID information and service.
Stated Preference Survey Administration
The large majority of WSTA’s paratransit clients travel in small buses between their
residence and destination in a taxi-cab-like service. There are stops at other passengers’
homes and destinations; there are no bus stops or central transfer locations. As a result, the
most common form of interaction between WSTA operators and Trans-AID clients is by
telephone. Consequently, centrally located survey administration is infeasible.
Trans-AID customer survey responses are obtained using a two-step approach. In the first
step researchers boarded WSTA Trans-AID buses and interviewed passengers in person.
The second step involved placing phone calls to a random set of paratransit clients selected
from about 4,000 registered riders. After calling an individual client, the researcher
proceeded to ask each survey question in sequential order and duly recorded customers’
responses. This approach required hours of discussion and a large amount of time on
behalf of the researchers for the relatively small sample size of respondents. Yet, telephone
surveys yielded a great deal of anecdotal evidence in the form of comments regarding the
transit system from the clients, as well as answers to the survey questions. The ‘pre-IVR’
surveys were administered in October of 2000, after August of 2000 when IVR was in full
operation. Clients were excluded from the October ‘pre-IVR’ survey if they had already
used IVR. The ‘post-IVR’ surveys were administered in August 2001 and June 2002.

3. Methodology 19
Revealed Preference
Monthly IVR reports were collected from WSTA for the period April 2000 – May 2002.
The reports contained monthly counts of event commands executed by callers to the IVR
system. Recorded events were compiled in a spreadsheet to facilitate trend analysis over
the entire data period. The relevant customer-selected or customer-activated telephone
attributes, recorded by IVR include: total number of IVR calls, number of calls transferred
to the operator, number of requests to book a Trans-AID trip, the number of requests for
WSTA information, etc. A sample report can be found in Appendix 2. The recorded IVR
events were analyzed graphically, enabling the process of identifying informative trends in
the data. The trend analysis results provide evidence of patterns in customers’ interactions
with IVR.
Derived Importance
Derived importance consists of a formal statistical expression applied to Trans-AID survey
data organized as two sets: pre-IVR surveys and post-IVR surveys. Within each set,
questions 1 - 6 relating to information characteristics and questions 8 - 11 relating to
service characteristics are analyzed separately. The statistical expression used to perform
the analysis is the Pearson’s product-moment correlation equation. Pearson’s product-
moment incorporates customers’ satisfaction ratings for information and service attributes,
and it compares these ratings to survey questions 7 and 12, which are the overall
satisfaction rating for information and service characteristics, respectively. The correlation
between a characteristic and overall satisfaction is computed by Pearson’s product-
moment, which takes the form:
Rij = [NΣXiYj – (ΣXi)(ΣYj)]
{[NΣXi2 – (ΣXi)2]*[NΣYj
2 – (ΣYj)2]}1/2
Where:

3. Methodology 20
R = simple correlation coefficient
N = survey sample size
X = characteristic rating for each survey question
Y = overall service satisfaction rating
i = survey questions {1 – 6} for Set 1, and {8 – 11} for Set 2
j = 7 (overall information satisfaction ratings for Set 1)
j = 12 (overall service satisfaction ratings for Set 2)
Set 1. Information Characteristics (Survey questions 1 – 6)
R1,7 = the correlation coefficient of information availability
R2,7 = the correlation coefficient of calling ease
R3,7 = the correlation coefficient of staff helpfulness
R4,7 = the correlation coefficient of time to call
R5,7 = the correlation coefficient of hold time
R6,7 = the correlation coefficient of number of times needed to call and
make a transit reservation
Set 2. Service Characteristics (Survey question 8 – 11)
R8,12 = the correlation coefficient of on time arrival
R9,12 = the correlation coefficient of trip duration
R10,12 = the correlation coefficient of waiting time
R11,12 = the correlation coefficient of free fare
Unlike a regression coefficient, which expresses the magnitude of a change in overall
satisfaction associated with a unit change in the characteristic rating, a correlation
coefficient is unitless and is a measure of intensity of association between information or
service characteristics and the overall satisfaction of a particular passenger. The magnitude

3. Methodology 21
of the correlation coefficient ranges from –1 to +1, depending on the relationship that exists
between the characteristic and overall satisfaction. A positive correlation suggests that an
increase in the characteristic rating will increase customer satisfaction; a negative
correlation indicates that an increase in the characteristic rating will decrease overall
satisfaction. A zero correlation means there is no linear association between the
characteristic and overall satisfaction. Conditionally, a characteristic’s score of zero,
positive, or negative correlation provides important policymaking implications. In this
study WSTA indicates a belief that paratransit customer satisfaction is based on six
information characteristic parameters and four service characteristic parameters.
Information Characteristics (Trans-AID survey questions 1 – 7)
X1. How available is information such as maps, signs, and brochures?
X2. How easy is calling Trans-AID to schedule, cancel, or check a trip time?
X3. How helpful and courteous are the telephone operators?
X4. How much time does it take to confirm, cancel, or book a trip?
X5. How often do you wait on “hold” or get a busy signal when you call Trans-AID?
X6. How often do you have to call back to reach a telephone operator?
X7. What is your overall satisfaction with calling for Trans-AID information?
Y7 = ƒ(X1, X2, X3, X4, X5, X6), represents the overall information characteristic satisfaction
as a function of six parameters.
Service Characteristics (Trans-AID survey questions 8 – 12)
WSTA also believes that customer satisfaction is related to service as reflected in the
following characteristics.
X8. On-time arrival of Trans-AID buses.
X9. How long each trip takes on Trans-AID buses.

3. Methodology 22
X10. Waiting time for Trans-AID buses.
X11. The free fare for riding Trans-AID
X12. What is your overall satisfaction with Trans-AID service?
Y12 = ƒ(X8, X9, X10, X11), and represents the overall customer satisfaction with WSTA
service as a function of the four service parameters.
The functions for Y7 and Y12 are helpful in defining the nature of overall customer
satisfaction, but they do not show the internal weights or importance attached to the
aggregate characteristics. A graphical way of displaying the weight given to a particular
characteristic is derived importance shown in Figure 3-2. The derived importance of a
particular characteristic is measured by comparing the correlation coefficient for each
characteristic rating to the median correlation level of all characteristics (Weinstein 2000).
A derived importance greater than 100 means a characteristic is more correlated with
overall satisfaction and a derived importance less than 100 signifies a less correlated
characteristic as shown below.
DI= (Ri/RM) * 100
Where:
DI = derived importance
Ri,7 = correlation level of an individual information characteristic
Ri,12 = correlation level of an individual service characteristic
RM,7 = median correlation level of all information characteristics
RM,12 = median correlation level of all service characteristics
Figure 3-2 shows characteristic ratings vs. derived importance. The scatter diagram has
four quadrants with the median characteristic rating as the vertical boundary and the
derived importance of 100 as the horizontal boundary. The survey ratings fall into four
categories of relative importance and need for improvement based on the opinions of

3. Methodology 23
customers and the impact on customer satisfaction. These four categories or quadrants
illustrated in Figure 3-2 are described below relating the position of each attribute or issue
with its relative importance and satisfaction performance.
Quadrant A: Important issue, needs improvement
Quadrant B: Important issue, no improvement needed
Quadrant C: Unimportant issue, needs improvement
Quadrant D: Unimportant issue, no improvement needed
Figure 3-2: Derived Importance (Weinstein 2000)

3. Methodology 24
Summary
The wish to improve WSTA transit service and assess customer satisfaction prompted the
use of complementary methods of analysis: focus group discussion, customers stated
preferences, revealed preferences and derived importance. The four-pronged methodology
approach represents an assembly of procedures manifested by its strengths in combining
real Trans-AID customer activities with customer preferences and opinion. Presumably,
the forces that control customer choices or actions will cause customers to ally their
perceptions of transit service (stated preference survey opinion) with real experiences
(revealed preference). A bolder examination of customer satisfaction using derived
importance will seek to classify the most influential elements of transit information and
service characteristics affecting customers’ overall satisfaction with transit information and
service.

4. Evaluation 25
SECTION 4. WSTA CUSTOMER SATISFACTION EVALUATION Introduction
A variety of procedures and techniques were used to collect and analyze Trans-AID data.
They are often complementary leading to an abundance of interconnected results. The
results of the before-after analysis delineate the changes in customer satisfaction as well as
facilitate an assessment of the procedures chosen to complete the customer satisfaction
evaluation. The summary of findings is organized by focus groups, stated preference,
revealed preference and finally derived importance.
The concepts and standard approaches described in the methodology section represent the
modus operandi for evaluating Trans-AID customer satisfaction before and after the
installation of IVR. The first step in customer satisfaction evaluation involves a means of
collecting passenger data. The most popular forms of data collection include telephone
interviews, surveys, questionnaires and focus groups. A combination of telephone
interviews, surveys and focus groups were used as complementary methods of data
collection for this research. Once the data were collected, several techniques were
employed to analyze the data. They include statistical models for stated preference and
derived importance as well as trend analysis based on discrete customer data obtained from
IVR over a series of months.
Focus Groups
The purpose of the Trans-AID focus group in June 2000 was to obtain information relevant
to customer use and opinion of the planned IVR automatic telephone system. WSTA
invited four human service agency representatives and four passengers to the focus group.
All four passengers were women 60 years of age or older. The moderator and recorder
were WSTA employees. Three observers attended.

4. Evaluation 26
The moderator began the focus group meeting with an introduction of people present and
the purpose of the meeting. She gave a brief history of WSTA participation in
experimental Mobility Manager projects, and she described and demonstrated the IVR
system with charts and an active telephone connected to the prototype IVR server. She
explained that initially the IVR system will automatically provide general WSTA policy,
route and service information. To schedule trips a passenger will still have to contact a
Trans-AID call taker who would always be available for any call.
The moderator demonstrated the call-in, password and cancellation function of the IVR
system; and she asked each of the participants to take a turn at cancellations. During the
next hour each of the eight participants made two experimental calls to the IVR system
using sample passwords to test cancellations and develop user feedback.
The following observations occurred during the experimental calls:
• Nearly all eight focus group participants had trouble with the password and date of
requested service cancellation.
• The participants did not understand the meaning of “trip” thinking it was a round
trip rather than two one-way trips.
• When canceling trips to and from an activity center, the participants generally
cancelled the first trip and forgot to cancel the return trip.
• Six of the participants succeeded in canceling at least the originating trip, if not the
return trip.
• Two of the participants were very enthusiastic about the IVR system, four were
quiet during discussions, and two had much difficulty with the both calls and
wanted to speak to “live voices”.
For the usual pre-IVR call-in service to cancel a trip or schedule a trip, all participants
reported that they frequently experienced busy signals (“…about every other time”) and
had to call back. They also said that they were frequently placed on “Hold”.
4. Evaluation 27
Overall, the participants complimented the service that Trans-AID provides. Specific
comments included:
“It may be late, but I always get there.”
“I love Trans-AID.”
“Trans-AID should be knighted.”
As a result of the focus group session, the following recommendations were discussed by
the staff:
• Consider having practice sessions before the IVR system ‘goes live’.
• Emphasize that callers can speak to ‘live’ customer representatives whenever they
want to.
• Emphasize that the IVR system will not schedule trips.
• Anticipate ‘problem’ clients and focus special training on them.
• Anticipate accidental cancellations and include an “are you sure” function before
the cancellation is made automatically.
• Include a “please wait” function when the IVR system is accessing information and
when the phone may be silent for a short time.
Stated Preference
Customers’ stated preferences are used to identify and dissect facets of Trans-AID
information and service most influenced by the implementation of IVR. Several options
were explored for collecting Trans-AID stated preference survey data. Telephone
interviews and on-board Trans-AID customer interviews were chosen to gather pre-IVR
and post-IVR data. Telephone interviews were used to perform the pre-IVR data collection
procedure in October 2000. This method involved randomly phoning Trans-AID clients
selected from about 4,000 registered Trans-AID customers. After calling an individual
client, researchers confirmed the client had not used IVR. Once Trans-AID customers had

4. Evaluation 28
been screened as non-IVR users, researchers proceeded to ask each survey question and
record customers’ responses.
The pre-IVR survey data collection process represented an ad hoc attempt to collect pre-
IVR data in the post-IVR period. It was evident that this approach would yield data
subjected to the possibilities of survey biases and survey sampling errors because
customers were selected from a pool of non-IVR users who may have been
characteristically different from the typical Trans-AID customers. Non-IVR users
surveyed in October 2000 had avoided using IVR for two months following the
introduction of IVR in August 2000. Although the pre-IVR survey did not solicit
explanations from customers concerning their lack of IVR use, several possibilities emerge.
1. Trans-AID subscription customers are not required to contact WSTA unless they
need to change the appointed time or day of their previously scheduled trip.
Subscriptions are maintained for customers performing consecutive trips to the
same locations; subscriptions are designed to alleviate Trans-AID calls to schedule
redundant trips. Thus subscription customers were less likely to have used IVR
based on the reduced frequency of having to call Trans-AID.
2. Some customers may have been reluctant to try-out IVR for the sake of avoiding
new technology or altering their exclusive reliance on operators.
An over-representation of these two groups of Trans-AID customers in the pre-IVR survey
period would have introduced a sampling bias. However, the key consideration is whether
or not pre-IVR survey responses would have changed markedly if the sample had actually
reflected the normal Trans-AID customer population distribution. Subscription customers’
infrequent interactions with telephone operators might have had a positive impact on their
satisfaction with Trans-AID information as minimal exposure to Trans-AID information
would have hindered customers’ formation of opinions and critiques of the system.
Customers who were reluctant to familiarize themselves with IVR initially might have had
a general aversion towards technology or perhaps an affinity for the status-quo of exclusive

4. Evaluation 29
WSTA operator assistance. Customers in the latter category might have rated Trans-AID
information characteristics higher than the average Trans-AID customer if they were
satisfied enough to continue relying on the pre-IVR system of telephone operators, after
IVR was implemented.
Pre-IVR telephone interviews posed numerous challenges, not only in selecting a suitable
pre-IVR sample, but also in the physical collection of the data. This approach required
hours of discussion and a large amount of time on behalf of researchers and customers
making it difficult to collect a large sample size. Further sample size difficulties arose in
the pre-IVR collection period of October 2000 as researchers were forced to screen Trans-
AID customers already using IVR, since IVR became operational in August 2000.
Eventually a sample size of 18 – 35 respondents for the pre-IVR period was realized.
Due to the limited success of telephone interviews, researchers abandoned the telephone
survey in favor of on-board customer interviews for the post-IVR analysis period in August
2001 and June 2002. Obtaining post-IVR stated preference data, by administering surveys
while riding Trans-AID vehicles, proved quite fortuitous in collecting larger amounts of
data. The first-hand presence of researchers riding transit vehicles, interacting with Trans-
AID customers, was far superior to telephone surveys in reducing the amount of time spent
collecting data and obtaining higher quality data. Larger sample sizes are achieved by
surveying all Trans-AID customers riding a particular transit vehicle. Data for the August
2001 and June 2002 collection periods were combined to form the post-IVR data set with a
sample size of 79 respondents. Table 4-1 shows the three data collection periods and
corresponding sample sizes achieved in each phase.
The before-after IVR implementation survey analysis focuses on a comparison of October
2000 (before) and June 2002 (after) data. Given the fact that IVR was fully operational in
August of 2000, the August 2001 data were placed in the after period category along with
June 2002 data, producing a larger post-IVR dataset with the combination of the two
original sets of data. The pre-IVR and post-IVR data sets are presented in Table 4-2 which

4. Evaluation 30
shows the t-test and Z-test statistic performances based on a α = 0.05 (95% confidence
interval) and α = 0.10 (90% confidence interval).
Table 4-1: Data Collection Summary
* IVR testing June and July 2000, IVR operational August 2000
Table 4-2: Pre-IVR and Post-IVR Data Sets
The before-after IVR implementation survey analysis focuses on a comparison of October
2000 (before) and June 2002 (after) data. Given the fact that IVR was fully operational in
August of 2000, the August 2001 data were placed in the after period category along with
June 2002 data, producing a larger post-IVR dataset with the combination of the two
original sets of data. The pre-IVR and post-IVR data sets are presented in Table 4-2 which
shows the t-test and Z-test statistic performances based on a α = 0.05 (95% confidence
interval) and α = 0.10 (90% confidence interval).

4. Evaluation 31
The t-test statistic exposes changes in customers’ stated preference based on significant
variability detected in the pre-IVR and post-IVR periods. If the numerical difference is
positive it implies a favorable change and negative difference implies unfavorable change.
The combination of 2001 and 2002 data is compared with 2000 data in Table 4-2. The
sample size for the 2000 data (N1) is generally one-forth the size of the 2001 & 2002 data
(N2) for questions in the information category. The t-test evaluates the significant
difference between two data points when at least one sample (N) is less than 30. The pre-
IVR sample size (N1) was less than 30 for questions pertaining to information, thus the t-
test was used. The Z-test is appropriate for sample sizes greater than or equal to 30. Pre-
IVR and Post-IVR sample sizes (N2) exceeded 30 for all service questions, thus the Z-test
was used.
Under the “Analysis” heading in Table 4-2, results of the t-test (t) and Z-test (Z) indicate
whether a significant change in customer satisfaction is apparent for each survey question.
The t-test is divided into two confidence intervals, 95% (α = 0.05) and 90% (α = 0.10). A
one-tailed test was performed on the data because the hypothesis seeks to test if IVR
improves customers’ satisfaction with information and service.
The basic quantitative measurements in Table 4-2 demonstrating critical changes in Trans-
AID customer satisfaction include:
• The net change (positive or negative) in the mean score attributed to each
question in the before and after period,
• The results of a t-test and Z-test at the 90% and 95% confidence intervals.
Without exception, every question in the survey, for both information and service
categories, showed positive net improvement after the installation of IVR. Table 4-3
reveals that every survey question showed net positive improvement in customer
satisfaction in the post-IVR period. Only Questions 5 (frequency of waiting on “hold” or
getting a busy signal when calling Trans-AID) and Question 6 (frequency of having to call

4. Evaluation 32
back to reach a telephone operator) demonstrated a statistically significant positive
improvement at the 90% confidence level. Such results are promising in that frequency of
busy signals, calling back, and being placed on “hold” were common complaints in focus
group discussions. Stated preference results for survey questions 5 and 6 suggest that IVR
functions adequately by providing customers with alternative communication services
comparable to the operator. IVR also indirectly improves the courtesy of operators
(perhaps by unburdening them) and time to book a trip (perhaps an artifact of reduced busy
signals, holds, and call-backs). Question 7 (overall satisfaction with Trans-AID
information) showed a net positive improvement in customer satisfaction after installing
IVR.
IVR appears to slightly improve customer satisfaction with Trans-AID service, although
there is no verifiable relationship between IVR and any of the service variables queried
during the passenger interviews. As suspected, the relatively minor net positive changes
are statistically insignificant (Tables 4-2, 4-3). The relatively small improvements may be
an artifact of general passenger satisfaction with Trans-AID service and WSTA or the
elimination of the $1 fare that occurred about a year after IVR telephone service began.
Table 4-3: Pre-IVR and Post-IVR Data Summary

4. Evaluation 33
Stated Preference Summary
1. The results of the t-test and Z-test analysis demonstrate a positive improvement in
customer satisfaction for all survey questions, and a significant improvement in
customers’ satisfaction for two survey questions (at the 90% confidence level) after
IVR. They are, question 5: frequency of waiting on “hold” or getting a busy signal
when calling Trans-AID, and Question 6: frequency of having to call back to reach
a telephone operator.
2. Based on customers’ stated preferences, IVR appears to improve the availability of
information and ease of calling due to its functionality and increased capacity for
calls. By circumventing the operator and choosing to use IVR to complete certain
tasks, customers avoid the possibility of being placed on “hold”, getting a busy
signal, or having to call back to reach an operator.
3. Pre-IVR survey responses might have overstated customers’ satisfaction with
information because the pre-IVR sample may have contained a higher concentration
of respondents who would have been less critical of exclusive operator assistance.
If this is true then the net improvement in customers’ satisfaction after IVR is
understated.
4. Based on surveys conducted over the telephone and surveys conducted while riding
Trans-AID vehicles, on-site survey administration is far superior to collecting
survey data over the telephone.
Revealed Preference
The entire history of Trans-AID customers’ IVR telephone selections is stored in the IVR
server making it possible to identify prevailing patterns and trends suggesting customers’
revealed preferences (i.e., actual inclinations) to use IVR, and likewise determining the
most popular IVR component services. Initial availability of IVR data coincided with the
installation of the technology during the five-month period of April – August 2000. The
five-month introductory phase allowed time for customers to become informed of the new

4. Evaluation 34
automatic telephone system and become familiar with its notable capabilities. The
introductory period also allowed WSTA telephone operators the opportunity to gain
experience coexisting with IVR.
IVR has the capability of tracking all customer call activities within the IVR system and
compiling the cumulative calls for each IVR function. The following is a list of IVR
activity parameters.
• Monthly telephone calls (before/after IVR),
• Average call length per month (before/after IVR),
• Percentage of calls facilitated by operators,
• Percentage of calls facilitated by IVR, and
• Comparison of operators’ workload before and after IVR is installed.
Prior to IVR, WSTA operators handled all Trans-AID calls and WSTA fixed route
inquiries. With IVR, customers dial the main WSTA number and hear an automatic voice
greeting which prompts them to select from five different options. Figure 4-1 outlines the
hierarchy of IVR choices available to customers.
All WSTA calls are “new calls.” Then customers have the option of continuing with
automatic IVR information services or talking directly to an operator. The distinctions
between the two types of customer selections are shown in Figure 4-1. After placing a
“new call”, Trans-AID customers advance to the Paratransit Main Menu, where they have
four options. Confirming or canceling a trip and information requests are automated.
Booking a trip and asking questions are operator-assisted.
Revealed preference analysis is constrained by the availability of pre-IVR tally sheet data;
only two months of pre-IVR data are available for February and April of 2000.
Alternatively, twenty-two consecutive months of post-IVR data help to define trends and
patterns in customers’ telephone behavior. To perform an analogous before/after

4. Evaluation 35
comparison of revealed preference data, pre-IVR data for February and April 2000 is
compared with post-IVR data for February and April 2001 - 2002.
Figure 4-1: IVR Dichotomy
The evaluation of post-IVR data is simplified with the assistance of IVR software capable
of storing the entire history of customer command choices. Appendix 2 shows a sample of
IVR records for telephone activity including Trans-AID and fixed-route calls. In
preparation for the revealed preference analysis, IVR data are retrieved from the software
and compiled into monthly time increments. After gathering the data and organizing it into
a manageable format, a trend analysis displays fluctuations in customers’ interactions with
IVR from implementation to the end of the study period in May 2002. The next section
presents figures showing user trends

4. Evaluation 36
Revealed Preference Analysis
General Trends
In order to correctly interpret the data and make proper generalizations, it is mandatory to
identify confounding factors. Trans-AID ridership is a confounding factor because it
cannot be controlled and its affects on Trans-AID telephone activity in the pre-IVR and
post-IVR periods are unknown. Thus, it is important to examine the changes in Trans-AID
ridership, as they occur in conjunction with the various phases of IVR. Monthly Trans-
AID passenger records for the three-year period (2000 – 2002) covered by this study
indicate the average monthly passenger trips scheduled for 2000, in the pre-IVR period, are
slightly higher (6.65%) compared to the average monthly passenger trips for July 2001
through June 2002, in the post-IVR period. The small reduction in Trans-AID passengers
following the implementation of IVR can translate into reduced overall telephone activity.
However, overall telephone activity is a secondary measurement of customer interactions
with IVR. The actual proportion of automatic-IVR telephone activity is more instructive in
assessing the actual use of IVR, indicating Trans-AID customers’ level of involvement
with IVR.
Telephone Activity
Telephone activity demonstrates customer interactions with the IVR system. Prior to the
installation of IVR, operators facilitated all Trans-AID calls. After a four-month testing
phase (April – July 2000), IVR became operational in August 2000 allowing customers full
access to the system. Data in Figure 4-2 clearly depict the inception of IVR calls following
the testing phase. Prior to IVR, periodic tallies were made of operator call activity. Tally
sheet data for pre-IVR calls are available for February and April 2000 showing that the
average number of Trans-AID calls for these two months was 1,991. The average number
of total Trans-AID calls for the post-IVR months of February and April 2001 - 2002 is
1,713, representing a 14% decrease in total Trans-AID calls after IVR. Due to the limited
availability of pre-IVR tallies a comprehensive comparison of pre-IVR and post-IVR

4. Evaluation 37
telephone activity is condensed to a direct comparison of pre-IVR months of February and
April 2000, and post-IVR months of February and April 2001 - 2002. Without a robust and
complete sequential set of pre-IVR data to match the IVR data that are available, the results
offered in this section pertaining to telephone activity before and after IVR should be
treated as tentative outcomes of an incomplete partial set of data.
Figure 4-2: Pre-IVR and Post-IVR Trans-AID Customer Telephone Activity (Part I)
* IVR becomes operational August 2000
Once IVR is fully operational, operators share call-taking responsibilities with the
automatic services offered in IVR, as customers have a choice of using IVR or transferring
to an operator. Figure 4-2 distinguishes the percentage of Trans-AID callers accessing an
operator versus the percentage of callers making IVR selections as a proportion of total
Trans-AID-related calls. In the post-IVR months of February and April of 2001 – 2002,
corresponding to the tally sheet months before IVR, the average number of Trans-AID-
Pre-IVR IVR Operational

4. Evaluation 38
related calls processed by operators decreased by 36% to 1,274 calls per month. These
operator-assisted calls represented 74.4% of all Trans-AID-related calls for this post-IVR
period. This relatively high proportion of operator calls is still necessary to book trips or
ask questions like “Where’s my bus?” Such functions cannot be handled by the current
Trans-AID IVR system.
Telephone activities or calling functions include booking a Trans-AID trip, canceling a trip,
confirming a trip, and general Trans-AID information questions. In the pre-IVR phase,
WSTA operators facilitated all calls regardless of function. After IVR operators still must
book trips. Also, callers can request an operator any time. After IVR is installed callers
can choose between operators or the automated IVR service for cancellations,
confirmations, and questions.
Figure 4-3 differentiates Trans-AID calls by calling function. In the pre-IVR phase, the
monthly volume of operator calls for each Trans-AID calling function is noted by the two
data points corresponding to February and April 2000. In the post-IVR period the two
trend lines labeled “operator book trip” and “operator other” confirm the total monthly
volumes of Trans-AID calls processed by operators exclusively. The category for operator
book trips represents all Trans-AID calls to book a trip, while the operator other is a
composite measure of all operator calls by function, with the exception of requests to book
a trip. Automatic IVR call volumes are distinguished in Figure 4-3 by call purpose, (i.e.
trip cancellations, trip confirmations, and Trans-AID information) for the post-IVR period.
These trends clearly indicate customers’ willingness to use IVR. However, when given a
choice most customers prefer to use an operator by a ratio as high as 2 to 1 in some months.
Tally sheet data for the pre-IVR period show that the February 2000 monthly trip
confirmations and Trans-AID information requests handled by operators were 455 and 377,
respectively. In February 2001, automated IVR calls for trip confirmations and Trans-AID
information requests totaled 304 and 145, respectively. Thus, IVR took over a portion of
typical operator assisted calls. (Please refer to Appendix 3 to view the complete set of data
for Figure 4-3).

4. Evaluation 39
Figure 4-3: Pre-IVR and Post-IVR Trans-AID Customer Telephone Activity
(Part II)
* IVR becomes operational August 2000
A portion of customers are performing trip confirmations and information requests under
the auspices of IVR instead of maintaining an exclusive reliance on operators. Several
features of IVR give it a distinct advantage over operators in accommodating customers’
trip confirmation and Trans-AID information requests.
• Accessing information in IVR is expedited by the organization of information under
easily identifiable subject headings,
• IVR is available 24 hours a day, seven days a week, and
• By using IVR, customers avoid obtaining hard-to-understand information from
operators who might misinterpret customers’ questions and requests.
Pre-IVR IVR Operational

4. Evaluation 40
On the other hand, as the data show, and focus group discussions indicate, many customers
prefer talking to operators when given that option.
With the adoption of IVR as a complementary service that assists operators, customers may
be hesitant to disassociate from operators in the opening months of service due to their lack
of background knowledge and exposure to IVR. A small number of IVR calls in the first
few months of operation followed by a gradual increase in IVR usage would suggest that
customers are acting in this regard. With respect to trip confirmations and Trans-AID
information requests, customers do not act this way and do not require a period of
introduction to familiarize themselves with IVR and transition away from using operators
exclusively. Post-IVR trends in Figure 4-2 show that customers did not require a warm-up
period to get acquainted with IVR. In fact, during the first three months of operation the
average monthly automatic-IVR calls are 619 while the average monthly automatic-IVR
calls for the entire analysis period (Aug. 2000 – May 2002) are 463. The volumes of
automatic-IVR calls remain stable through the remainder of the study period providing
further proof that customers are not only willing to test out IVR, but as repeated customers
they also display a satisfaction and preference for IVR.
According to Figure 4-3, despite customers’ revealed preference for using IVR to confirm
trips and request Trans-Aid information, customers are reluctant to choose IVR for the
purposes of trip cancellations. Figure 4-3 data show the average number of trip
cancellations completed by operators in the pre-IVR months of February and April 2000 is
much larger than the average number of automatic IVR trip cancellations in February and
April 2001 and 2002. IVR reports show that the automatic trip cancellations for September
2000 – February 2001 average 36 per month, representing only 13% of average monthly
trip cancellations before IVR. However, IVR trip cancellation data for March 2001 – May
2002 suggests that the average number of automatic trip cancellations is 1.7 per month.
These data might have understated the actually number of trip cancellations performed
using IVR; it is suspected that IVR may have been operating properly but that the
tabulation of trip cancellations may have malfunctioned. Despite the ambiguity of trip

4. Evaluation 41
cancellation data after March 2001, judging by the data from September 2000 – February
2001, it is apparent that customers’ are far more receptive towards using IVR for automatic
trip confirmations and information requests than for cancellations. Differences in the levels
of interaction with IVR by calling function demonstrate nuances in customer preferences,
as customers seem to favor certain areas and conveniences offered to them with IVR, while
being more sensitive and judicious about using other functions.
With regard to confirming a trip or requesting information costumers are merely asking
IVR to repeat relevant and updated information without affecting the status of their Trans-
AID trip. However, when accessing IVR to automatically cancel a Trans-AID trip
customers are altering the status of their trip independently. This is a more complex task
that requires greater confidence in the system to process the command correctly as it
automatically and permanently eliminates a scheduled trip, unless the trip is rescheduled
with an operator. There may be other reasons to explain the small number of trip
cancellations recorded by IVR such as an imprecise or inaccurate tally of actual IVR trip
cancellations. However, the most likely explanation rests with customer resistance toward
automatically altering their trip status as opposed to the more mundane IVR activity of
automatically retrieving information, which customers appear to be very comfortable
doing.
Operator Workload
The comprehensive workload of WSTA operators is complex given the multitude of
functions and operations performed. In concept, IVR helps to unload the operator. With
IVR, customers can confirm or cancel a Trans-AID trip; however direct operator assistance
is still required to book a Trans-AID trip because of schedule negotiation. The routine
customer activities previously handled by operators can be facilitated using IVR. IVR
provides the greatest benefit to operators by reducing the number of calls requesting trip
confirmations. IVR also unloads operators from general information calls, lost-and-found
calls, etc. IVR is not intended to completely eliminate direct operator-customer contact.

4. Evaluation 42
Customers always have the option to consult with an operator if they desire. There are
many circumstances mandating the presence of an operator, including:
• Helping new customers become familiar with Trans-AID service,
• Answering complex questions that require extensive interpretation, and
• Fielding complaints or suggestions
Figure 4-4: Pre-IVR and Post-IVR WSTA Customer Telephone Activity
(Trans-AID & Fixed Route)
* IVR becomes operational August 2000
Figure 4-4 shows that the IVR system facilitates WSTA information delivery and provides
substantial relief for operators managing routine activities. Based on these data, it is quite
apparent that customers embraced IVR initially and continued to find utility and
convenience using the automated services provided by IVR as a complement to operator
assistance. Data in Figure 4-4 reflect total WSTA calls including WSTA fixed-route calls
Pre-IVR IVR Operational

4. Evaluation 43
and Trans-AID calls. These data indicate a two to three – fold increase in total calls,
primarily for WSTA fixed-route service, following the implementation of IVR. The
average number of WSTA calls before IVR is 7,083 while the average number of calls after
IVR is 17,030 representing a 140% increase in the number of calls received by WSTA. A
large portion of total WSTA calls in the after period are facilitated by IVR. Between
August 2000 and May 2002 (when IVR is operational), the average monthly proportion of
total WSTA calls handled by IVR is 48%. During the same period, 38% of Trans-AID
calls are handled by IVR. Thus, fixed-route passengers tend to use IVR more than Trans-
AID passengers.
Average Call Length
Average call length distinguishes customer proficiency in understanding and navigating the
IVR system. Average call length is expected to be directly proportional to the brevity of
explanation, logic of format, and conciseness of IVR program options. Appendix 4 displays
call length data, which combines Trans-AID and WSTA fixed-route calls. IVR does not
break out Trans-AID IVR call lengths. The average call length for Trans-AID and WSTA
fixed-route calls remains within the 50 - 60 second range, before and after IVR.
Synthesizing Stated and Revealed Preference Findings
Revealed preference data (Table 4-2) complement customers’ stated preferences thereby
validating the congruency of customers’ actions and customers’ survey responses. The data
collection methods are consistent and affirm the accomplishments of IVR as a suitable
means of disseminating information to Trans-AID customers. The following discussion
addresses specific similarities between stated and revealed preferences for Trans-AID
information and service characteristics (i.e., survey questions), before and after IVR.

4. Evaluation 44
Information Characteristics
These findings refer to the pre-IVR and post-IVR stated preference survey results
summarized in Tables 4-2 and 4-3. They are compared to revealed preference data in
Figures 4-2 and 4-3.
1. Availability of information such as maps, signs, or brochures;
Stated preference results show very little improvement and revealed preference data
is not applicable for this particular characteristic due to Trans-AID customers’
perceived lack of printed information.
2. Ease of calling Trans-AID to schedule, cancel, or check a trip time;
Customers find it easier to schedule, cancel, or check trip times based on the
improved survey rating, albeit small improvement. Revealed preference results
tend to complement customers’ less than emphatic survey responses. Customers did
not adopt IVR as an alternative to operators for the task of canceling Trans-AID
trips, based on the extremely small percentage of customers using IVR to cancel
trips in Figure 4-3. Moreover, the process of scheduling a trip remains the same, as
customers must still rely exclusively on operators to perform this task. Thus,
customers have little reason to rate this characteristic any differently in the before
and after period. Indeed, passengers may call an operator to cancel and reschedule
a trip with the same call.
3. Helpfulness and courtesy of telephone operators;
An insignificant improvement in this characteristic rating is noted in the after period
according to the surveys. Revealed preference data in Figure 4-2 show that IVR
relieves operators of a portion of Trans-AID calls. A reduction in the number of
Trans-AID operator calls might provide operators more time to devote to each
Trans-AID call, thereby increasing the apparent helpfulness and courtesy of
operators. However, there is no statistical evidence to support a relationship

4. Evaluation 45
between improvements in operator helpfulness and courtesy relative to a reduction
in call frequencies.
4. The amount of time it takes to confirm, cancel, or book a trip;
It is perceived that when confronted with the choice of using an operator or IVR,
customers will choose the most expedient and least time consuming path to
facilitate their desired task, unless they are reluctant to embrace new technology.
Revealed preference results show that of the two available IVR functions for
attribute 4 (trip confirmations and trip cancellations), a large number of customers
abruptly switched from the operator to IVR for automatic trip confirmations. The
increase in customers’ satisfaction with attribute 4 following the implementation of
IVR suggests that some customers find it easier to automatically confirm Trans-
AID trips using IVR, as long as they still have the option of performing trip
confirmations with an operator.
5. Frequency of waiting on “hold” or getting a busy signal when calling Trans-AID;
Customers cast a favorable opinion of this attribute as the average rating improved
significantly. The presence of IVR allows customers to circumvent the operator for
some call functions, thus reducing the possibility of getting a busy signal. Figure 4-
2 shows that 25.6% of Trans-AID calls were processed by IVR between June 2001
and May 2002. Thus, only 74.4% of Trans-AID calls may be put on “hold”.
Assuming that the same proportion of calls fielded by operators are met with a busy
signal, before and after IVR, the proportion of Trans-AID calls met with a busy
signal with respect to total Trans-AID calls will decrease after IVR.
6. Frequency of having to call back to reach a telephone operator;
This characteristic demonstrates the highest customer improvement rating among
all survey questions. Customers’ approval of this attribute suggests that few
customers experience problems reaching operators on their first attempt. Figure 4-2

4. Evaluation 46
confirms that operators are processing fewer Trans-AID calls, thus reducing missed
calls.
Information Characteristics Summary
Throughout the evaluation of information characteristics with stated preference surveys and
revealed preference IVR data, it is apparent that IVR data may be used as a surrogate for
passenger survey data. The data for revealed preference is “real” and it gives quantitative
results as opposed to small sample surveys of passengers’ subjective opinions. Thus, a
careful assessment of revealed preference on a regular basis can uncover passenger
acceptance of various information characteristics for paratransit and thereby infer customer
satisfaction.
Service Characteristics
The effectiveness of IVR is primarily related to the improved communication between
customers, telephone operators and IVR. However, the effects of IVR technology on
customer satisfaction are not necessarily restricted to telephone information. Customers
reported improved perceptions of transit service delivery after IVR, based on positive
changes in satisfaction ratings for Trans-AID arrival time, trip time and wait time
(questions 8 – 11). Revealed preference data are not available to directly correlate the
impacts of IVR on service characteristic improvements, although it is possible that
improvements in Trans-AID customer information services produced residual impacts on
service attributes. The revealed preference data imply a positive acceptance of IVR by
Trans-AID customers as they began to recognize the benefits of IVR as an accessible and
convenient source of trip information. As a result, customers have the ability to confirm or
cancel their trips repeatedly, which should help reduce the occurrence of customers being
caught off-guard when the Trans-AID bus arrives to pick them up. With a reduction in the
number of unprepared customers, Trans-AID bus service could improve for the overall
customer.

4. Evaluation 47
In the next phase of the project dynamic features will be introduced to complement and
expand upon current static IVR information, providing customers with the ability to track
Trans-AID buses as they traverse their scheduled routes. Their locations will be tracked
real-time and this information will allow passengers to ask, “Where’s my bus?” This should
reduce wait times for passengers and improve overall service times for Trans-AID buses,
by giving customers an accurate and reliable way to check the dynamic real-time position
of Trans-AID buses and to be alerted to their impending arrival.
Revealed Preference Summary
Revealed preference analysis presents ‘real’ customer behavioral data. Pre-IVR tally sheets
and post-IVR monthly telephone activity reports are evaluated and compared with respect
to various Trans-AID calling parameters including:
• Total number of monthly Trans-AID calls,
• The proportion of total Trans-AID calls handled by operators and IVR ,
• Average call length per month, and
• Total number of monthly IVR calls performing automatic trip confirmations, trip
cancellations, and information requests.
Findings and conclusions attributed to revealed preference data obtained from IVR reports
are listed below.
1. The total number of Trans-AID calls after IVR was down by 14% for February and
April 2001-2002 compared to February and April 2000 when tallies were taken
(Figure 4-2).
2. The number of operator-assisted calls decreased by 36% for February and April
2001-2002 compared to February and April 2000.
3. Customers were comfortable using IVR to confirm trips and obtain general trip
information for Trans-AID (Figure 4-3).

4. Evaluation 48
4. Customers were either reluctant to use IVR to cancel scheduled Trans-AID trips, or
there was an error associated with the recording of trip cancellations in IVR. The
former assumption suggests that customers selectively exploited certain IVR
functions, while continuing to require the assistance of operators to schedule and
cancel Trans-AID trips.
5. The percentage of fixed-route calls facilitated by IVR was larger than the
percentage of Trans-AID calls handled by IVR.
Derived Importance
Customers’ satisfaction with IVR is multi-faceted. Stated preference and revealed
preference are compatible methods for analyzing customers’ perceived satisfaction.
Derived importance provides a more in-depth look at the relationship between customers’
perceived satisfaction for various components of Trans-AID information and service, and
customers’ overall perceived satisfaction of Trans-AID information and service. Derived
importance analysis expands upon customer satisfaction data gathered from Trans-AID
surveys. The format of derived importance analysis involves the evaluation of information
characteristics and service characteristics separately. The centerpiece of derived
importance is Figure 4-6 and Figure 4-7 illustrating the average customer satisfaction rating
and the magnitudes of importance given to each information and service attribute (i.e.,
survey question). Derived importance is entirely analytical based on the relative
correlation or ‘influence’ of each attribute’s performance on composite performance. The
more influential attributes are more important, thus they receive a higher derived
importance score relative to other attributes.
Figure 4-6 represents derived importance and customer satisfaction for information
attributes before and after the installation of IVR. Trans-AID information questions,
marked with squares, correspond to before IVR survey questions, labeled 1 - 6. Trans-AID
information questions, marked with triangles, correspond to after IVR survey questions,
labeled 1 - 6. The points are plotted along the x-axis according to the average mean rating

4. Evaluation 49
for the particular survey question. The dashed vertical line, established at x = 3.91,
represents the median satisfaction rating of all six information characteristics before IVR.
It separates issues, to its left, that have a below-average rating from those, to its right, that
have an above-average rating the pre-IVR phase of analysis. The solid vertical line,
established at x = 4.25 represents the improved median satisfaction rating of all six
information characteristics after IVR. It separates issues with a below-average rating from
those with an above-average rating in the post-IVR phase of analysis. Points are plotted
along the y-axis according to their correlation ‘r’ with respect to overall Trans-AID
information satisfaction (question 7). The horizontal line y = 100 separates relatively
important issues from relatively unimportant issues, both for pre-IVR and post-IVR results.
Figure 4-5: Pre-IVR and Post-IVR Comparison with Trans-AID Information
Characteristics
11
6 5
42 5
63
324

4. Evaluation 50
Table 4-4 provides a comprehensive account of the pre-IVR and post-IVR derived
importance results for information characteristics displayed in Figure 4-6. Issues are
determined to be either important or unimportant depending on their position with respect
to the horizontal line at y = 100. If the issue falls above the line it is important, and below
the line it is unimportant. This qualification of importance applies to both cases, before and
after IVR. The issue’s performance depends on its position with respect to the pre-IVR line
at x = 3.91 for issues in the pre-IVR period, and the post-IVR line at x = 4.25 for issues in
the post-IVR period. Issues residing to the left of their respective vertical are “below-
average” performers while issues residing to the right are “above-average” performers.
Survey question seven serves as the comprehensive measure of customers’ satisfaction with
information and the basis on which all other information characteristics are correlated.
Thus, it cannot be independently evaluated in the derived importance analysis.
Table 4-4: Summary of Pre-IVR and Post-IVR Comparison with Trans-AID
Information Characteristics
The summary interpretation for pre-IVR information characteristics in Table 4-4 shows that
the frequency of being placed on “hold” and getting a busy signal (Question 5) and having
to call back (Question 6), are the most important attributes (highest correlation) in
determining the level of customers’ overall satisfaction with Trans-AID information. Also,
they are below-average performers and represent potential ‘targets’ for IVR automated
information technology. The other relatively important attribute is Trans-AID operator
helpfulness and courtesy (Question 3), but its performance is above- average. Ease of

4. Evaluation 51
calling (Question 2) and time to confirm (Question 4) are unimportant and are above-
average. In the post-IVR period, Question 4 (time to confirm, cancel, or book a trip),
Question 3 (Trans-AID operator helpfulness) and Question 2 (ease of calling Trans-AID)
emerge as the most important attributes (highest correlation) in determining the level of
customers’ overall satisfaction.
An interesting phenomenon emerges suggesting a strong association between information
attribute pairs. Attributes within each pair are linked by similarities in their derived
importance levels in the pre-IVR and post-IVR periods, and they also share subject matter.
For instance, information attribute 5 (frequency of “holds” and busy signals) and attribute 6
(frequency of having to call back to reach an operator) exhibit similar derived importance
and qualitative characteristics. Attribute 2 (ease of calling to schedule, cancel, or check a
trip time) and attribute 4 (time to confirm, cancel, or schedule a trip) behave similarly, as
they both increase in relative importance after IVR. Also, these two attributes are more
contextually related to changes in Trans-AID information after IVR, suggesting customers’
overall satisfaction with telephone information is most influenced by IVR
Service Characteristics
Figure 4-7 is comparable to Figure 4-6 in structure, however service attributes replace
information attributes as the characteristics of comparison. Similarly, Trans-AID service
questions labeled 8 - 11, marked with squares, correspond to pre-IVR survey questions.
Trans-AID service questions labeled 8 - 11, marked with triangles, correspond to post-IVR
survey questions. The vertical boundary (x = 3.79), distinguishes the median rating of all
four service questions in the pre-IVR phase. The vertical boundary (x = 3.93) distinguishes
the improved median rating of all four service questions in the post-IVR phase. Points are
arranged along the y-axis according to their correlation ‘r’ with respect to overall Trans-
AID service satisfaction (question 12). The vertical line y = 100 separates “below-average”
issues from “above-average” issues, both for pre-IVR and post-IVR results

4. Evaluation 52
Figure 4-6: Pre-IVR and Post-IVR Comparison with Trans-AID Service
Characteristics
Table 4-5 provides a comprehensive account of the pre-IVR and post-IVR derived
importance results for service characteristics displayed in Figure 4-7. Issues are
determined to be either relatively important or relatively unimportant depending on their
position with respect to the horizontal line at y = 100. If the issue falls above the line it is
relatively important, and below the line it is relatively unimportant. This qualification of
importance applies to both cases, before and after IVR.
The issue’s performance depends on its position with respect to the pre-IVR line at x = 3.79
for issues in the pre-IVR period, and the post-IVR line at x = 3.93 for issues in the post-
IVR period. Issues residing to the left of their respective vertical lines are below-average
performers while issues residing to the right are above-average performers. Survey
question twelve serves as the comprehensive measure of customers’ satisfaction with
10
11
1110
8 9 98

4. Evaluation 53
service and the basis by which all other service characteristics are correlated. Thus, it
cannot be independently evaluated in the derived importance analysis.
Table 4-5: Summary of Pre-IVR and Post-IVR Comparison with Trans-AID Service
Characteristics
The locations of points in Figure 4-7 are within close proximity to quadrant boundaries thus
limiting the degree of interpretation and supportable conclusions for service characteristics
in the pre-IVR stage. These results suggest that on-time arrival, waiting time and travel
time are, as expected, relatively important; fare is not important.
In the post-IVR period attributes of service are again concentrated along the boundary
separating relatively important issues from relatively unimportant issues. Waiting time for
Trans-AID and Trans-AID fare are regarded as important relative to on-time arrival and
Trans-AID travel time, which are unimportant. Also, the post-IVR service analysis
suggests that waiting time for Trans-AID vehicles is below-average. Since there is
relatively little point migration left to right of the median, it may be inferred that static IVR,
which represents a communication technology, has little effect on transit service delivery
Synthesizing Stated Preference and Derived Importance Findings
Information Characteristics
A noticeable increase in the median satisfaction rating, shown in Figure 4-6, from x = 3.91
in the pre-IVR stage to x = 4.25 in the post-IVR stage indicates a positive gain of 0.34 in

4. Evaluation 54
customers’ median satisfaction with information characteristics. It is important to note the
distinction between median satisfaction rating in Figure 4-6 and overall satisfaction rating
(survey question 7) in Table 4-2. Median satisfaction is the average statistical rating of all
survey responses for questions 1 – 6. Overall satisfaction is the mean rating of all survey
responses for question 7. Table 4-2 shows the change in overall satisfaction with
information is 0.40 after IVR, while the median satisfaction rating increases by 0.34. The
difference between the two values is relatively small suggesting that customers’ survey
responses to individual attributes of information are complementary to customers’
perception of overall information services. The relative proximity of these two numbers
also suggests that survey questions for information attributes address a range of information
topics covering all relevant points concerning information services. If, for instance, overall
satisfaction were far different than median satisfaction, perhaps an extremely poor or top
performing information attribute is absent from direct assessment as an individual question
in the preference survey. Considering overall satisfaction of information services,
customers are apt to recall this particularly influential aspect of information because of its
exceedingly positive or negative quality, and thus it is likely to influence their overall
satisfaction rating.
In most circumstances, the most accurate measure of customer satisfaction is overall
satisfaction as opposed to median satisfaction because the customer is granted the
opportunity to comprehensively provide an assessment of all features defining information
services and the quality by which they perceive these services are being delivered. The
following list of questions pertains to information survey questions 1 through 6, and
analyzes the underlying themes of stated preference and derived importance findings as
displayed in Tables 4-2, 4-3, 4-4 and 4-5 and Figures 4-6 and 4-7.
1. Availability of information such as maps, signs, or brochures;
Figure 4-6 shows the change in location for point 1 before and after IVR. Point 1
remains in quadrant C (relatively unimportant issue, below-average rating), and
does not alter position with respect to correlation suggesting attribute 1 is a

4. Evaluation 55
marginal issue with very little impact on overall customer satisfaction. The
conclusion is consistent with stated preference results that show an insignificant
improvement in customers’ satisfaction with this attribute in Table 4-2. Revealed
preference results also suggest that IVR does not affect printed material such as
maps, signs, or brochures since IVR mainly affects the exchange of information via
telephone versus the physical distribution of information or printed material.
2. Ease of calling Trans-AID to schedule, cancel, or check a trip time;
Prior to the installation of IVR attribute 2 resides in quadrant D (relatively
unimportant issue, above-average rating). After IVR attribute 2 shifts to quadrant B
(relatively important issue, above-average rating). This suggest that after IVR,
customers re-evaluating ease of calling Trans-AID to schedule, cancel, or check a
trip time, determined that this particular attribute of information deserved a higher
degree of importance after IVR. This shift in customers’ derived importance is
logical based on the automated features presented with IVR that allow customers to
cancel and check trip times seamlessly without the hassle of consulting with an
operator. Revealed preference data corroborates customers’ reliance on IVR as
Figure 4-3 demonstrates that over 19% of all Trans-AID calls in the post-IVR
period are related to customers connecting to IVR for trip confirmation, (i.e., to
check a trip time). Unfortunately survey question 2 asks customers to
simultaneously consider trip confirmation along with trip cancellations and Trans-
AID trip scheduling. When the customer survey was first drafted and administered
in the pre-IVR phase, it was expected that when IVR was installed that customers
would have the ability to automatically schedule, confirm, and cancel Trans-AID
trips through IVR, without requiring the assistance of an operator. In actuality,
once IVR became operational customers were able to confirm and cancel trips;
however they were not able to schedule trips. In a revised survey it would be
advantageous to separate these features into three individual questions, giving
customers the opportunity to express their satisfaction with each one independently.
Then it would be possible to observe the fundamental differences in customers’

4. Evaluation 56
perceived importance of having a choice of performing tasks automatically versus
having to still rely on operators exclusively.
3. How helpful and courteous are telephone operators;
Attribute 3 remains in quadrant B (relatively important issue, above-average
performance) before and after IVR, suggesting that customers remain pleased with
WSTA operators’ diligence and attentiveness. Additionally customers tend to place
a high importance on operator helpfulness and courteousness following the
implementation of IVR. Customers’ continued attachment of importance to
operators’ helpfulness and courteousness, after IVR, might seem counter-intuitive
as IVR helps to alleviate operator-assisted calls; in fact, after IVR, operators process
36.6% fewer Trans-AID calls. Two explanations might shed light on this
ambiguity. First, IVR helps assist operators but it does not replace them, and more
importantly every Trans-AID customer must schedule trips with an operator
regardless of customer status. Figure 4-3 underscores this point showing that the
number of operator-assisted calls to schedule a trip is comparable to the total
number of Trans-AID calls using IVR exclusively. Thus, every Trans-AID
customer in some capacity must interact with WSTA operators, perhaps less
frequently after IVR, but certainly on a periodic basis, compelling customers to rate
operator helpfulness and courteousness as an important attribute.
The second possible factor influencing customers’ continued placement of
importance on operator helpfulness and courteousness might be a result of changes
in complexity of operator-assisted calls. Customers assessing IVR typically have a
working knowledge of the system, are frequent Trans-AID passengers and use the
automated features present in IVR to accomplish routine tasks such as trip
confirmation. Before IVR, operators handled all calls no matter the degree of
complexity of inquiry or customers’ knowledge of the system. Once IVR is in
place, it disseminates discrete information regarding trip times, arrival times and
customer procedures for riding Trans-AID buses. IVR is not capable of addressing

4. Evaluation 57
customers’ questions beyond the scope of what is available on recorded messages.
Thus, operators will be required to field customer calls seeking more specific
information with a higher degree of complexity.
From the customers’ perspective operator helpfulness and courtesy should remain
an important element after the implementation of IVR because customers are still
dependent on operators to address more detailed issues that are much easier to
resolve when the operators are providing helpful and courteous assistance.
Attribute 3 resembles Attribute 1 with respect to changes in derived importance and
average rating following IVR. Both issues are slightly less important, but receive a
small increase in customer satisfaction rating after IVR.
4. The amount of time it takes to confirm, cancel, or book a trip;
Customers acknowledge the importance of completing Trans-AID calls in a timely
manner. Figure 4-6 shows an increase in the importance of attribute 4 as it shifts
from quadrant D (relatively unimportant issue, above-average performance) to
quadrant A (relatively important issue, below-average performance). The increased
importance placed on this issue suggests customers are more aware and sensitive
towards being able to complete trip confirmations, cancellations and scheduling
within a reasonable length of time. IVR provides customers with an automatic
platform in which to systematically complete trip cancellations and trip
confirmations as quickly or as slowly as they see fit. The importance of time to
confirm, cancel, or book a trip might suggest that customers are interested in
controlling the pace of executing these functions. IVR gives customers the
opportunity to repeat previous commands and reinforce information delivered to
them automatically. Thus, customers using IVR are afforded the flexibility of
controlling the time and pace of navigation.
While no data are available in revealed preference analysis to compare the average
call times for operator versus IVR cancellation and confirmation calls, customers at

4. Evaluation 58
least have a choice between the automatic method and speaking to a real person.
Given a choice between using IVR or an operator, intuitively customers may chose
the fastest method to accomplish their desired task, assuming that there is no
qualitative difference in the outcome of each method, or they may choose operators
if they need assistance or feel intimidated by the system. Regardless of which
method customers choose, they are now compelled to evaluate and consider the
amount of time they must devote to accomplish the task. Thus, customers place a
higher importance on time translating into a greater influence in overall satisfaction
because IVR offers an alternative to using an operator.
Customer satisfaction ratings increased for attribute 4 in the after period; however,
relative to the mean satisfaction rating, attribute 4 actually decreased. Likewise,
attribute 4 shifts from needing no improvement, to needing improvement.
Appendix 4 shows no increase in average WSTA call length after IVR; however
average call length data includes both fixed-route and Trans-AID calls. Thus
Appendix 4 does not portray the average call length for Trans-AID calls alone.
With an increase in customers’ derived importance after IVR, customers’
expectations are higher, meaning they would be less satisfied if the average call
length actually remained the same. Only a measurable reduction in average call
length would help to stimulate a higher customer satisfaction rating.
Attribute 4 is complementary to attribute 2 according to changes in derived
importance as both issues are targeted as important after IVR. Also, both attributes
experience a small increase in customer satisfaction. This observation of derived
importance analysis corroborates the methodology by correctly validating the
obvious connection between the two attributes by relating them to overall customer
satisfaction. It is anticipated that the ease of calling to confirm, cancel, or book a
trip should be closely linked to the amount of time it takes to confirm, cancel, or
book a trip, and derived importance illustrates this.

4. Evaluation 59
5. Frequency of waiting on “hold” or getting a busy signal when calling Trans-AID;
Attribute 5 demonstrates a great leap forward in customer satisfaction rating
shifting from quadrant A (relatively important issue, below-average performance) to
quadrant C (relatively unimportant issue, below-average performance). The fact
that attribute 5 remains an issue that needs improvement does not accurately reflect
the improvements in customer satisfaction relative to the median satisfaction rating.
Clearly IVR is most responsible for this improvement in the frequency of waiting
on “hold” or getting a busy signal. As fewer customers require the direct assistance
of an operator to perform tasks such as trip confirmations, trip cancellations, and
information requests, the probability of being put on “hold” or getting a busy signal
drops tremendously. Customers choosing to use automatic IVR features, instead
operators, avoid the possibility of being put on “hold” or getting a busy signal.
Customers only encounter these problems when attempting to reach the operator.
The derived importance of attribute 5 transfers from an important issue to an
unimportant issue. In light of the major advance in customer satisfaction rating for
this attribute, perhaps attribute 5 is a victim of its own success. As customers
gradually adapt to using IVR, they become less reliant on operators. Fewer
operator-assisted calls results in fewer customers being put on “hold” or getting a
busy signal. As with most technological advancements, the ‘old’ difficulties or
inconveniences that are overcome or corrected by the ‘new’ technology tend to
become trivialized over time. Long-standing users become accustomed to the
enhanced services and new users have less appreciation for the enhanced services
due to their lack of recollection to the previous mode of operations. As an enhanced
service, the ability for customers to circumvent the operator and avoid being placed
on “hold” or getting a busy signal is less important to customers as they tend to the
see this communication problem fading with the advent of IVR.
6. Frequency of having to call back to reach a telephone operator;
4. Evaluation 60
In concert with attribute 5, attribute 6 responds in the same manner, before and after
IVR is installed, shifting form quadrant A (relatively important issue, below-
average performance) to quadrant D (relatively unimportant issue, above-average
performance). Attribute 6 eclipses attribute 5 in overall increase of customers’
satisfaction rating placing it in the above-average performance category. Similar to
attribute 5, IVR is the catalyst promoting the increase in customers’ satisfaction
with the frequency of having to call back to reach a telephone operator because
fewer Trans-AID customers actually use the operator after IVR is installed.
The derived importance of attribute 6 shifts from a relatively important issue to a
relatively unimportant issue, in the same manner as attribute 5. The reason for this
shift is most likely akin to the same forces that influenced the reduction in derived
importance for attribute 5.
Service Characteristics
To reiterate previous discussion, IVR has no direct impact on Trans-AID service from the
perspective of WSTA operations. However, IVR may have a secondary influence on
Trans-AID service, as customers are free to use IVR to confirm or check a trip time, thus
allowing them greater freedom to obtain information about specific Trans-AID bus arrival
times. Figure 4-7 shows an increase in the median service satisfaction rating, from x = 3.79
in the pre-IVR stage to x = 3.93 in the post-IVR stage, indicating a positive gain of 0.14 in
customers’ median satisfaction with service characteristics. It is important to note the
distinction between median satisfaction rating in Figure 4-7 and overall satisfaction rating
(survey question 12) in Table 4-2. Median satisfaction is the average statistical rating of all
survey responses for questions 8 - 11. Overall satisfaction is the mean rating of all survey
responses for question 12. Table 4-2 shows the change in overall satisfaction with
information is 0.08 after IVR. The discrepancy between the two differences is relatively
slight proving that customers’ survey responses to individual attributes of service are
complementary to customers’ perception of overall service quality. The overall satisfaction

4. Evaluation 61
rating tends to be a little higher than the median satisfaction rating, suggesting that survey
questions for service attributes may not have addressed all relevant points concerning
service characteristics and service quality. However, it is safe to assume that any
component of service not addressed in the survey is likely to denote a positive outlook on
service since the overall satisfaction rating is higher than the median satisfaction rating for
service questions addressed in the survey. The following list of questions pertains to
information survey questions 8 – 11, and investigates the underlying themes of stated
preference and derived importance findings.
8. On-time arrival of Trans-AID buses;
Attribute 8 shows a slight improvement in customer satisfaction after IVR shifting
from x = 3.77 to x = 3.91. Also, attribute 8 drops from a relatively important issue
to a relatively unimportant issue. IVR may impact on-time arrival as the automatic
IVR trip confirmation service allows customers unrestricted and continuous access
to information regarding their scheduled trip time. This should allow customers to
be more prepared when the Trans-AID bus actually arrives, thus reducing the
amount of time Trans-AID buses have to wait at each residence. In this case service
should be more efficient with fewer incidents of late arrivals. On the other hand,
large gains in service efficiency might negatively influence on-time arrival as
Trans-AID buses arrive earlier than expected. The slight decrease in relative
importance of on-time arrivals signals a transition of public perception from one of
guarded concern about on-time arrival, towards a more relaxed and lenient outlook.
Customers may be less concerned if the bus is 2 minutes late or 5 minutes late, as
long as they can check the expected arrival time using IVR, which helps to
minimize the time customers are held captive, anticipating the bus’ arrival.
9. Length of time for a Trans-AID bus trip;
Similar to attribute 8, attribute 9 demonstrates a small increase in customer
satisfaction and a small decrease in relative importance. There are no data available
that would suggest a reduction in the average length of Trans-AID trips after IVR.

4. Evaluation 62
However, IVR might shorten the length of Trans-AID trips with improved
efficiency at residential pick-up points. The relative importance associated with
length of time for a Trans-AID trip tends to mimic attribute 8, falling slightly below
the threshold separating relatively important issues from relatively unimportant
issues. The same forces influencing a reduction in the derived importance of
attribute 8 may be affecting attribute 9. Specifically, a small improvement in the
length of trip would motivate customers to attach a smaller degree of importance to
this issue.
10. Waiting time for the Trans-AID bus;
Surprisingly, attribute 9 is relatively unchanged. For all service attributes it is
speculated that attribute 9 would be most affected by the implementation of IVR
due to customers increased ability to stay informed about their trip times. One
possible explanation for customers’ lack of acknowledgement of changes in this
service parameter might rest on the notion that IVR can only enhance customers’
ability to get ready for their bus. It does not necessarily improve the probability that
the bus will arrive at the correct time. Furthermore, attribute 8 reflects this
sentiment showing no ‘significant’ improvement in customers’ satisfaction with on-
time arrival of Trans-AID buses.
11. Free fare for riding Trans-AID;
Pre-IVR policy enabled all Trans-AID customers to use Trans-AID free of charge.
In July 2000, WSTA decided to amend their policy and began charging a $1.00 fee
for all Trans-AID trips. After August 2001, the policy reverted back to no fares.
Pre-IVR surveys were administered during the period when customers paid a fare.
Post-IVR surveys were administered once the fare had been cancelled. This helps
to explain the sharp rise in relative importance of attribute 11 in the after period
because customers are likely to place a higher importance on the free fare after
experiencing a brief period with an actual fare.
4. Evaluation 63
Derived Importance Summary
Several observations attributed to the activation of IVR for Trans-AID are apparent in
derived importance data from IVR.
1. A comparison of pre-IVR and post-IVR information characteristics shows that each
attribute exhibits similar behavior with another attribute, creating three sets
containing two common information attributes. These sets are:
A. Attribute 1 (availability of information such as maps) and attribute 3
(telephone operator helpfulness and courtesy): decreasing relative
importance, small increase in average ratings,
B. Attribute 2 (ease of calling Trans-AID) and attribute 4 (time to confirm,
cancel, or book a trip): increasing relative importance, moderate increase in
average ratings, and
C. Attribute 5 (frequency of ‘holds’ and busy signals) and attribute 6
(frequency of having to call back to reach an operator): decreasing relative
importance, large increase in average ratings.
2. Attribute 2 (ease of calling Trans-AID) and Attribute 4 (time to confirm, cancel, or
book a trip) are the only information attributes to increase in relative importance;
their increasing influence on customers’ overall satisfaction with information,
signifies customers’ approval of IVR as a useful device that actually improves
Trans-AID information.
3. A comparison of pre-IVR and post-IVR service characteristics shows that service
attributes are almost unchanged with regard to relative importance and attribute
ratings on the stated preference survey.

4. Evaluation 64
4. Post-IVR reports and pre-IVR tally sheets are helpful in distinguishing how
customers’ telephone calling patterns may influence their perceptions of the
importance of certain attributes. However, without more comprehensive data
including average call lengths for Trans-AID calls, post-IVR tally sheet data
differentiated by calling purpose for operator-assisted calls, and Trans-AID on-time
arrival data, it is impossible to generate ‘defensible’ conclusions from the derived
importance analysis regarding:
• The impacts of IVR on average call lengths for Trans-AID,
• The ratio of operator assisted/automatic IVR assisted trip confirmations, trip
cancellations and Trans-AID information requests in the post-IVR period,
and
• A correlation between customers’ perception of ‘waiting time’ and the
actual on-time arrival of Trans-AID vehicles.
5. Conclusions and Recommendations 65
SECTION 5. CONCLUSIONS AND RECOMMENDATIONS
Introduction
The Winston-Salem Transit Authority installed an automated telephone (interactive voice
response system) to improve customer satisfaction regarding information availability and
transit service. To assess the before and after level of customer satisfaction, WSTA held a
focus group and conducted passenger surveys to capture customers’ stated preferences and
opinions of telephone information and transit service characteristics. Subsequently, a
statistically derived importance model processed the survey data to identify the critical
characteristics that most affected customers’ overall satisfaction. Knowing the critical
characteristics allows WSTA to plan any needed improvements and evaluate the effects of
the IVR automated telephone technology on Trans-AID customer information and services.
Tally counts of telephone calls and the monthly output of selected IVR calling functions
quantified customers’ interaction with IVR based on their revealed preference and provided
important comparison data for the passenger stated preference surveys. The IVR output is
a critical resource in explaining and validating customers’ survey responses as well as
overall customer satisfaction with the Trans-AID system, before and after the installation of
IVR.
Focus Groups
The prevalence of focus groups in recent transit studies reinforces the decision to include
them as a potentially vital resource for the collection of customer satisfaction information.
In this study focus groups were limited to one small gathering of WSTA Trans-AID
customers. The WSTA-organized event was held prior to the installation of IVR giving
participants an opportunity to practice using a demonstration version of IVR. The process
generated customer feedback based on their reactions and first impressions after using the
IVR system. Focus group discussion did not address issues regarding the justifications of
implementing IVR; (i.e., how does IVR improve Trans-AID telephone communication, and

5. Conclusions and Recommendations 66
how does IVR compare to direct operator assistance). The absence of a focus group in the
post-IVR phase prohibited a before-after comparison of focus group perspectives on the
usefulness of IVR. The experience with the focus group resulted in the following
conclusions.
• Focus groups are adequate for the solicitation of input relevant to participants’
personal experiences.
• The number and timing of focus groups should coincide with the various stages of
research, (i.e., a post-IVR focus group should complement a pre-IVR focus group).
Stated Preference
Traditionally user surveys have been effective and practical tools for capturing qualitative
personal information that can be translated into quantitative data. In the focus group,
Trans-AID customers’ opinions and attitudes were highly qualitative and descriptive. User
surveys provide a quantitative element to Trans-AID customer satisfaction evaluation.
This research employed two survey data collection methods. The first method involved
telephone interviews between researchers and Trans-AID customers. Researchers
randomly selected Trans-AID customers from a WSTA telephone list and contacted them
at their residence. This method was slow and cumbersome, as the proportion of customers
unable to answer the telephone or incapable of audibly interpreting the questions presented
a challenge in obtaining an adequate sample size. The second method involved researchers
administering surveys to Trans-AID customers while riding Trans-AID vehicles. This
face-to-face on-board interview style greatly expedited the process of collecting a larger
sample size and enhanced the precision of customers’ feedback. The particular aspects of
on-board survey administration that give it an advantage over telephone interviews are:
• Paratransit trip lengths are usually longer than fixed-route trip lengths, allowing
researchers enough time to interview all passengers,

5. Conclusions and Recommendations 67
• Survey participants are more attentive when answering questions in person,
• Survey participants are more receptive to answering questions regarding transit
issues while riding a transit vehicle because these issues are pertinent to their
present activity, and
• Survey participants have the opportunity to peruse the survey and read the questions
as the questions are posed to them.
As evidence to confirm the advantage of on-board surveys, the telephone interviews
yielded 18 – 35 survey responses while the on-board interviews yielded 57 – 112 survey
responses.
Trans-AID customer surveys elicited customers’ personal views or stated preferences
regarding attributes of Trans-AID telephone information and transit service. Customers’
stated preferences revealed an increased level of satisfaction with Trans-AID telephone
information attributes after the installation of IVR. An improvement in the average survey
ratings for all attributes of Trans-AID telephone information, including overall satisfaction
with information, is represented in the post-IVR survey data. Two attributes of telephone
information (frequency of waiting on “hold” and frequency of having to call back to reach
an operator) registered a significant increase in customers’ satisfaction.
IVR technology affects telephone information characteristics more extensively than service
characteristics. This concept is confirmed in the survey results, which show a small
improvement in customers’ satisfaction for all attributes of Trans-AID service, including
overall satisfaction with service. Customers have little inclination to rate service attributes
any differently after the implementation of IVR because the influence of IVR on Trans-
AID route efficiency and customer ride and wait times is most likely negligible. In
summary the principle conclusions from the stated preference surveys are:
• Trans-AID customers were generally content with Trans-AID telephone
information and transit service before IVR,

5. Conclusions and Recommendations 68
• Customers were more satisfied with Trans-AID telephone information after IVR,
• Customers’ satisfaction with Trans-AID service before and after IVR was
unchanged, and
• Trans-AID customers found it easier to get in touch with telephone operators after
IVR.
Overall, based on the noted improvements in customers’ satisfaction, WSTA’s decision to
implement IVR was justified.
Revealed Preference
Trans-AID customer satisfaction with telephone information and transit service is
commensurate with customers’ Trans-AID experiences and activities. Customers are
presented with a variety of options when calling Trans-AID and the IVR telephone system
maintains a record of selection frequencies for each telephone option. Thus, customers’
IVR selection patterns demonstrate customers’ revealed preferences to choose the most
desirable path to access telephone information.
Prior to the installation of IVR, all telephone calls were processed by operators. Tally
sheets were compiled detailing the number of Trans-AID telephone calls received and the
frequencies of specific customer requests. In the post-IVR period, Trans-AID customers
are greeted by a synthesized voice instructing them to make a selection; customers can
choose to stay on the line and wait for operator assistance or continue using IVR to
automatically cancel scheduled trips, confirm Trans-AID trip times and obtain general
Trans-AID information. All such interactions were automatically counted by IVR.
Comparing pre-IVR tally sheet data to IVR data, customers immediately showed an interest
in the automatic telephone service when it was introduced in August 2000. In the first
three months of service IVR processed a substantial number of trip confirmations and
general Trans-AID information requests. IVR data shows that customers’ enthusiasm for

5. Conclusions and Recommendations 69
these two particular IVR features does not change as the number of trip confirmations and
information requests remains relatively stable throughout the remainder of the study period.
Customers’ utilization of Trans-AID helps to alleviate WSTA operators from routine calls
and gives them freedom to devote more time to addressing customers’ questions, concerns
and criticism. The presence of IVR has a tangible impact on Trans-AID operators’
workload as operators processed 36% fewer Trans-AID calls after IVR. IVR data indicated
operators still answer calls from customers who prefer to cancel trips using direct personal
assistance as an alternative to the automatic IVR service. It is likely that customers are
reluctant to use the automatic IVR services for activities that have an impact on their
ridership status. In summary the major conclusions resulting from the revealed preference
data are:
• Customers accept IVR and trust the technology as a reliable tool for the
dissemination of Trans-AID information,
• Customers prefer using IVR to retrieve personal information without changing what
is already stored in IVR, and
• IVR reduces Trans-AID customers’ reliance on WSTA operators.
Again, WSTA’s decision to implement IVR was justified by customers’ willingness to
utilize a majority of its features and relieve operators from a portion of Trans-AID related
telephone calls.
Derived Importance
Customers’ overall satisfaction with Trans-AID telephone information and transit service
represents customers’ aggregate assessment of telephone information and transit service
attributes. Derived importance methodology investigates the leading factors or attributes
most likely to influence customers’ overall satisfaction. Derived importance analysis
incorporates customers’ survey data by designating each survey question as an attribute of
information or service.

5. Conclusions and Recommendations 70
Derived importance investigation reveals a shift in the relative importance of information
and service attributes after the implementation of IVR. Of the six information attributes
and four service attributes, four increased in relative importance. An interesting
phenomenon emerges suggesting a strong association between information attribute pairs.
Attributes within each pair are linked by similarities in their relative importance levels in
the pre-IVR and post-IVR periods, and they also share subject matter. For instance,
information attribute 5 (frequency of “holds” and busy signals) and attribute 6 (frequency
of having to call back to reach an operator) exhibit similar relative importance and
qualitative characteristics. Attribute 2 (ease of calling to schedule, cancel, or check a trip
time) and attribute 4 (time to confirm, cancel, or schedule a trip) behave similarly, as they
both increase in relative importance after IVR. Also, these two attributes are more
contextually related to changes in Trans-AID information after IVR, suggesting customers’
overall satisfaction with telephone information is most influenced by IVR’s operation.
Thus, IVR is most responsible for customers’ increasing satisfaction with Trans-AID
information.
The analysis of service attributes provides another endorsement of derived importance as a
reliable research tool. Service attributes respond in a homogenous fashion, demonstrating
very little movement in relative importance after IVR. Trans-AID customers are not
compelled to view service attributes any differently after IVR because IVR does not affect
service attributes substantially.
Derived importance analysis is contingent upon the examination of pertinent elements of
telephone information and service. This is achieved through inclusive phrasing of
customer survey questions. If the survey questions incorporate all telephone information
and transit service items, then the median survey rating for the combined items should
resemble the mean rating for overall satisfaction. The discrepancies between these two
measures of customers’ satisfaction for information and service are negligible suggesting

5. Conclusions and Recommendations 71
most aspects of information and service are properly considered and addressed in the
customer surveys.
In summary, derived importance analysis reveals several important conclusions:
• Derived importance results are not arbitrary or random,
• Customers’ value IVR as an important informational device, and
• Customers’ increasing satisfaction with Trans-AID information is related to the
implementation of IVR.
Recommendations for Future Assessments and Research
Many opportunities and challenges were encountered using the four-pronged methodology
approach to ascertain changes in Trans-AID customers’ satisfaction following the
implementation of IVR. Although each method is independent and autonomous, there is
overlap between methods. The application of these methodologies is systematic,
proceeding layer-by-layer, building up a cumulative cache of information. This approach
was time-consuming as deficiencies were encountered by researchers and adjustments had
to be made to the methodology.
Below is a list of problems in the original methodology approach and evaluation process.
Recommendations for overcoming or avoiding these problems are provided.
1. Pre-IVR surveys were administered in October 2000, two months after the initial
activation of IVR. Trans-AID customers already using IVR were excluded as pre-
IVR survey participants, which may have introduced selection bias. Pre-IVR
surveys should have been administered well in advance of the installation of IVR to
ensure that all customers were qualified to participate.
2. Telephone interviews were found to be inadequate for the collection of Trans-AID
survey data. Difficulties arose in contacting and communicating with Trans-AID

5. Conclusions and Recommendations 72
clients. Specifically some clients were not available or unwilling to complete the
Trans-AID survey, while some clients were unable to comprehend or interpret the
survey questions as they were spoken to them.
3. Several information attributes were unnecessarily grouped together in the survey
questions, precluding a separate analysis of each attribute. For example one survey
question asks customers to rate the “time it takes to schedule, cancel, or confirm a
trip.” Survey questions should be very specific and phrased to illicit responses for
singular issues.
4. Some revealed preference information combined Trans-AID and fixed-route data.
For example, the IVR reports did not distinguish between Trans-AID and fixed-
route average call lengths. Proactive steps should be taken to ensure that all internal
and external data are compiled and categorized to achieve a compatibility with
research objectives.
Implications for Future WSTA Service Improvements
The Winston Salem Transit Authority should continue placing emphasis on providing
customers access to new information technologies that are complementary and compatible
with IVR. The potential deployment of MDT and AVL should greatly enhance the
integration of information provided by IVR and real-time Trans-AID service updates, (i.e.,
dynamic IVR). Once dynamic IVR is operational the following services will be available.
• Trans-AID customers will be able to schedule trips automatically using IVR.
• Trans-AID customers will be able to track the real-time position of Trans-AID
vehicles.
• A ‘call-out’ system will alert customers’ a short time before the arrival of a Trans-
AID vehicle.
• Trans-AID drivers will be provided real-time updates of daily itineraries and
corresponding route changes.

5. Conclusions and Recommendations 73
Looking ahead, WSTA’s plan to unite MDT and AVL with IVR will also enhance WSTA’s
ability to evaluate Trans-AID customers’ satisfaction. Customers would be able to
complete an automatic telephone survey using IVR. Survey results could be tallied
immediately, providing WSTA with real-time customer satisfaction data.
Without incentives, education, and practice customers will only adopt and utilize a portion
of the automatic IVR features. Presently customers are not allowed to use IVR to
automatically schedule trips. WSTA should develop a plan for the gradual introduction of
this service. The plan should include a process for monitoring customers’ progress shifting
to automatic trip scheduling. To help facilitate this transition, WSTA could consider
distributing informational brochures or organizing educational meetings where Trans-AID
customers would practice scheduling trips automatically.
Derived importance data shows that WSTA can improve overall customers’ satisfaction
with telephone information most significantly by expediting the processes and increasing
the capacity for trip confirmations, trip cancellations and trips scheduled. Once IVR is
setup for scheduling Trans-AID trips, an unlimited number of customers can
simultaneously confirm, cancel, or schedule trips at their own desired pace and review or
recall these commands automatically. With the implementation of a comprehensive IVR
service, capable of handling automatic trip scheduling, there is potential for further
improvements in customer satisfaction.

6. References 74
SECTION 6. REFERENCES 1. Baugh, J.W., G.K.R. Kakivaya, and J.R. Stone, “Intractability of the Dial-a-Ride
Problem and a Multiobjective Solution Using Simulated Annealing”, Engineering
Optimization, 1998, Vol. 30, pp. 91-123.
2. Dallas Area Rapid Transit. “Dart’s new Automated Booking system Puts Paratransit
Customers In The X-Press Lane.” 6 March 2000: n. pag. 11 November 2002
<http://www.dart.org/news.asp?ID=32>
3. Ewing, Gordon. “Stated Preference/Choice vs. Revealed Preference/Choice.” 2002:
n. pag. 15 February 2002
<http://www.tri.org.nz/NZTRI/NZTRIhtmlPresentations/TouristDemandEstimation
/index.htm>
4. Krueger, Richard. “Focus Group Interviewing.” 2000: n. pag. 11 November 2002
<http://www.tc.umn.edu/~rkrueger/about.html>
5. Marczak, Mary, and Meg Sewell. “Using Focus Groups For Evaluation.” 2002: n.
pag. University of Arizona 15 November 2002
<http://ag.arizona.edu/fcr/fs/cyfar/focus.htm>
6. Milazzo, Joe II, PE. “Overview of Focus Groups” presentation Feb. 25, 2003 at
North Carolina State University.
7. Neal, Albert. (2003, August). Wheels of Wellness. Metro Magazine.
8. Pagano, A.M., Paul Metaxatos and Mark King, “Impact of Computer-Assisted
Scheduling and Dispatching Systems on Paratransit Service Quality.” In
Transportation Research Record 1791, TRB, National Research Council,
Washington D.C., 2002, pp 51-58.

6. References 75
9. Stone, J.R. and P. Gray-Mullen, “Winston-Salem Mobility Management: An
Evaluation of Computer-Aided Dispatch and Scheduling,” 75th Annual Meeting of
the Transportation Research Board, Washington, D.C., January 1996.
10. U.S. DOT, National ITS Guidelines. “Evaluation/Program Assessment.” 2 April
2002: n. pag. 10 December 2002
<http://www.its.dot.gov/eval/eguide_costcoll.htm>
11. Wallace, R.R. “Paratransit Customer Modeling Elements of Satisfaction with
Service.” In Transportation Research Record 1571, TRB, National Research
Council, Washington D.C., 1997, pp. 59-66.
12. Weinstein, A. “Customer Satisfaction Among Transit Riders - How Do Customers
Rank The Relative Importance of Various Service Attributes?” 79th Annual Meeting
of the Transportation Research Board, Washington, D.C., January 2000.

Appendix 1 76
APPENDIX 1. TRANS-AID CUSTOMER SATISFACTION SURVEY

Appendix 2 77
APPENDIX 2. SAMPLE IVR ACTIVITY REPORT

Appendix 3 78
APPENDIX 3. PRE-IVR AND POST-IVR DATA FOR FIGURE 4-3

Appendix 4 79
APPENDIX 4. PRE-IVR AND POST-IVR AVERAGE CALL LENGTH
Pre-IVR IVR Operational