Embed Size (px)
Citation preview

THE JOINT FORCES OF CSIRO & SCION
ISSN 0113-6224 www.ensisjv.com
THE JOINT FORCES OF CSIRO & SCION
WOODPROCESSINGWOODPROCESSINGWOODPROCESSING
ISSUE NO.39DECEMBER 2006
NEWSLETTER
ISSUE NO.39DECEMBER 2006
NEWSLETTER
THE JOINT FORCES OF CSIRO & SCION
WOODPROCESSINGWOODPROCESSINGWOODPROCESSINGWOODPROCESSING
ISSUE NO.39DECEMBER 2006
NEWSLETTER
ISSUE NO.39DECEMBER 2006
NEWSLETTER
WOODPROCESSINGWOODPROCESSING
ISSUE NO.39DECEMBER 2006
NEWSLETTER
ISSUE NO.39DECEMBER 2006
NEWSLETTER
1SSN 0113-6224
MAPPING TREESTIFFNESS
BIOENERGY
BORON SPOT TEST
DRY WITH MINIMUMDELAY!
Sawmilling
1
Issue No. 39 December 2006
Radar scanning offers the potential to non-destructively collect commercially valuableinformation about the internal structure of a log. Suchinformation can then be used to make decisions aboutpruned log grading and cutting. Conventional radar isused to detect objects at a distance such as aircraft andmountains. However, radar can be adapted to detectobjects at much closer range, less than 1 m.
Radar relies on the differences in dielectricpermittivity of materials being detected. Featuresinside the log have differing dielectric properties dueto their moisture content, physical structure, andchemical composition. The presence of water enablesthe radar to identify sapwood, heartwood, and knots.In radiata pine, sapwood has 150% (or more) moisturecontent and heartwood has around 50% moisturecontent. Fortunately, knotty material forming prunedbranch stubs typically gives some dielectric contrastwith surrounding sapwood and heartwood, and henceis visible in the scans.
A scanning study was undertaken to determine theability of radar to reliably identify internal features ofpruned radiata pine logs, particularly the occludedknotty core.
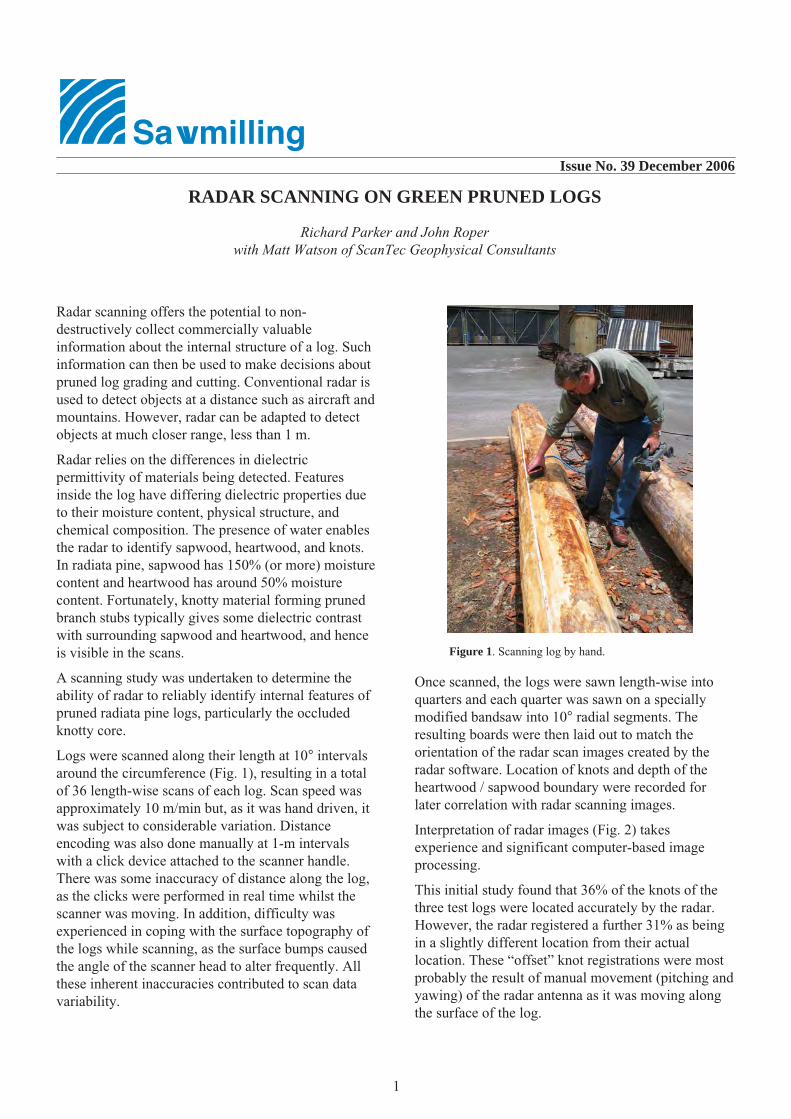
Logs were scanned along their length at 10° intervalsaround the circumference (Fig. 1), resulting in a totalof 36 length-wise scans of each log. Scan speed wasapproximately 10 m/min but, as it was hand driven, itwas subject to considerable variation. Distanceencoding was also done manually at 1-m intervalswith a click device attached to the scanner handle.There was some inaccuracy of distance along the log,as the clicks were performed in real time whilst thescanner was moving. In addition, difficulty wasexperienced in coping with the surface topography ofthe logs while scanning, as the surface bumps causedthe angle of the scanner head to alter frequently. Allthese inherent inaccuracies contributed to scan datavariability.
Once scanned, the logs were sawn length-wise intoquarters and each quarter was sawn on a speciallymodified bandsaw into 10° radial segments. Theresulting boards were then laid out to match theorientation of the radar scan images created by theradar software. Location of knots and depth of theheartwood / sapwood boundary were recorded forlater correlation with radar scanning images.
Interpretation of radar images (Fig. 2) takesexperience and significant computer-based imageprocessing.
This initial study found that 36% of the knots of thethree test logs were located accurately by the radar.However, the radar registered a further 31% as beingin a slightly different location from their actuallocation. These “offset” knot registrations were mostprobably the result of manual movement (pitching andyawing) of the radar antenna as it was moving alongthe surface of the log.
RADAR SCANNING ON GREEN PRUNED LOGS
Richard Parker and John Roperwith Matt Watson of ScanTec Geophysical Consultants
Figure 1. Scanning log by hand.

2
A future study being planned will use a mechanism tokeep the antenna steady while it is moving along thelog. Also, a rotary encoder will be used tocontinuously and accurately record the distance alongthe log. At this stage it is not known why the radarfailed to register the remaining 28% of knots. Thiswill be the subject of further research.
The radar was able to locate the longitudinal positionof 67% of all occluded knots present in the logs. Suchinformation would be of use for log-bucking ofpruned stems where inter-node length is required.Radar, at this stage, cannot determine the depth ofoccluded knots to the accuracy which is required forsawmilling. For this to occur, more accuratedetermination of dielectric constant of the wood has tobe made to calibrate the scan depth.
Figure 2. Radar image of the internal structure of a radiata pine log and actual location ofknots (marked as circles).
Radar scanning of fresh radiata pine logs appears tobe a promising technology for locating internalfeatures. The equipment is relatively portable andlightweight, comparatively inexpensive, and has noknown health and safety occupational risks associatedwith its use. The first challenge is to improve thescanning head accuracy for position by employing arotary encoder, in addition to eliminating yaw andpitch as the head is moved along the log. The secondchallenge is to improve the human factors of thesystem by making the signal processing and featuredepth detection more easily interpreted bynon-specialist users before wider field application tolog scanning can be contemplated.

3
Over the years dedicated sawmillers have by trial anderror determined the most advantageous way toimprove recovery from their logs. For swept logs, the“horns down” position is widely accepted as a way ofproviding good recoveries. For oval shapes, sawingalong the longer axis has generally been accepted asthe “correct” or most beneficial position. The old daysof expensive sawing studies, designed to defineoptimal sawing for different saw patterns, have beenreplaced with sawing simulation models. This articleexemplifies such modelling to show that empiricalfindings for oval logs have been basically confirmedwith mathematical modelling of oval log shapes. Theeffect of ovality on conversion was examined througha series of sawing simulations using AUTOSAW.
In spite of the myth that logs are round, oval logs aremore common than is realised — in fact, morecommon than truly circular shapes. Causes of logovality are not fully understood, but are associatedwith the swaying of stems by the wind, leaning boles,and formation of reaction wood. However, the effectof ovality has been associated with errors in stemvolume estimates and perceived as reducing sawnrecovery. The amount of ovality found in logsgenerally tends to be greater for larger logs, and alsogreater for those logs from the lower parts of the stem.If ovality is defined as the ratio of the perpendiculardiameter to the largest diameter (Fig. 1a), then trulycircular logs would have the maximum possibleovality of 1.0 and oval logs would have ovality less
SAWING OVAL LOGS
Christine L. Todoroki,
with Robert A. Monserud and Dean L. Parry of USDA Forest Service,and Richard Gilbert of Laval University
than 1.0. In a recent study of 119 cross-sections from20 radiata pine stems, ovality ranged from 0.99(nearly circular) down to 0.84 (approaching egg-shaped) (Fig. 1b).
For the computer simulation, five groups of 52digitised logs ranging from full circular cross-sections(control) to those with ovality of 0.8° (in incrementsof ovality of 0.05) were modelled to determinewhether conversions increased or decreased withincreasing ovality. The logs comprised a range ofcross-sectional areas for small-end diameters andtaper. Each group had identical cross-sectional areas,volumes, and taper for each replicate log.
The AUTOSAW log sawing simulator used a cantsawing pattern, cutting 50-mm and 25-mmthicknesses, and produced boards ranging upwardsfrom 100 mm wide in 50-mm increments, and 2.0 min length and longer in 0.3-m increments. Wane wasnot permitted on boards in these simulations, to enablethe full effect of ovality on conversion to beexamined.
Logs were rotated and repeatedly sawn over the fullrange of rotational settings in 5-degree increments(giving some 18 720 simulations in all, 72 rotations ×52 logs × 5 ovality groups). By sawing at 5-degreeincrements, conversions could be tracked acrossrotations and thus the rotation at which the maximumconversion occurred could be identified. For thecircular logs, even though conversions were expected
Figure 1. (a) Definition of ovality as the ratio of the diameter perpendicular to the largest diameter. (b) Frequency distribution of ovality of119 radiata pine cross-sections.
(a) (b)
a
b
Ovality = b / a 0.84 0.88 0.92 0.96 1.00
70
60
50
40
30
20
10
0
Fre
quen
cy

4
to be identical for all rotations, simulations were stillperformed to ensure the programme worked correctly.At the initial orientation of 0° (and at 180°) logs weresawn along the shorter axis, and at 90° (and 270°)they were sawn along the longer axis.
An example is drawn in Figure 2 showing how logconversion changes with rotation. At the initialorientation the log shown in Figure 2 had a conversionof 53%. At 45° conversion was reduced to 46% and at90° conversion reached a maximum of 56%.
Overall the 90° and, due to symmetry, the 270°rotations provided the best orientations for positioningoval logs (Fig 3). At those two orientations averageconversion from oval logs exceeded that of thecircular logs. At the 0° and 180° rotations averageconversions for circular and oval logs were similar.However, at rotations other than 0°, 90°, 180°, and270°, average conversion for the oval logs wassubstantially less than that for the circular logs.Conversion for circular logs naturally remainedconstant for all rotations.
When sawn at their best orientations, oval logs tendedto have greater conversions than circular logs.Maximum conversions also tended to increase withincreasing ovality. However, on average across therange of rotations, and in contrast to maximumconversions, average conversions were lower for ovallogs than for circular logs. So, while maximumconversions increase with increasing ovality, averageconversions decrease. Therefore, orienting oval logscorrectly prior to sawing is important to maximisingconversions, and the rule-of-thumb developed bysawmillers (sawing along the longer axis) is, in theabsence of sweep, a good rule to adopt.
Our research illustrates that we have the tools andtechniques to answer and verify the non-trivialproblems a sawmiller faces on adaily basis.
To focus solely on the effects onconversion of orientation andovality, our log models weresimplified. This simplificationwill be removed in a future studywhere we will include other logcharacteristics that affectconversions, such as sweep.
Figure 2. Conversion of a log with ovality 0.80, at 0°, 45°, and90° rotations respectively.
90°: Conversion 56%
Figure 3. Average conversion across rotations for each ovality class
Ave
rage
con
vers
ion
(%)
54
52
50
48
46
0 45 90 135 180 225 270 315 360Log rotation (degrees)
Circular logs➛
Ovality1.000.950.900.850.80
0°: Conversion 53%
45°: Conversion 46%

Wood QualityIssue No. 39 December 2006
1
Observing the variations of wood properties within atree can give insight into a number of wood qualityissues. One particular issue of concern is stability. Aproperty that provides some insight into stability is thevariability of the “specific stiffness” — the stiffnessper unit mass of wood fibre. The specific stiffness inthe direction of the axis of the tree is determined bythe grain angle of the wood fibres, and the angle of themicrofibrils within the cell walls of the wood fibres.Large microfibril angles tend to result in largerlongitudinal shrinkage of the wood fibres when themoisture content is reduced; large grain angles alsoresult in larger longitudinal shrinkage due to themuch greater shrinkage which occurs across the grain.An important driver of the stability of sawn timber isthe different shrinkages which occur throughout thepiece of timber as the moisture content is changed.
An effective way to measure the specific stiffness of amaterial is to measure the speed at which an acousticcompression wave travels through the material. Sincethe acoustic speed is the square root of the ratio of thestiffness to the density, by taking the square of theacoustic speed we end up with specific stiffness.Applying this to wood, we can find the specificstiffness of the wood fibres as long as we know theamount of water in the wood so that we can removethe effect water has on the calculations.
At Ensis, Rotorua, we used ultrasonic transducers(500 MHz) mounted on pneumatic rams coupled withdigital callipers, interfacing hardware and software tomake a system which is able to quickly measureacoustic speeds at a point on a tree disc. The system inoperation is shown in Fig. 1.
MAPPING THE STIFFNESS PROPERTIES IN TREES
Grant Emms and Charles Hosking
Figure 1. Apparatus designed to measure the longitudinal ultrasonic sound speed across a tree disc. In the picture the ultrasonic transducers(obscured) are placed on the disc faces using pneumatic rams which apply a small force to couple the transducers to the wood moreconsistently.

2
Figure 2 - Top. Disc of radiata pine with obvious signs ofcompression wood. A stress releasing cut was made in the discprior to drying.Bottom. Map of the specific stiffness (Pa/kg) in the disc measuredultrasonically.
By using the system to measure the acoustic speed atpoints across a dry disc we can build up a map of thespecific stiffness across the disc. We can clearly see inthe specific stiffness map in Fig. 2 the low specificstiffness of the juvenile wood and the compressionwood.
Current Research
Current research funded by the Foundation forReaearch, Science and Technology and the WoodQuality Initiative is aimed at quantifying how wellmicrofibril angle can be predicted from specificstiffness (or acoustic speed) for radiata pinespecimens. However, in order to accurately predictmicrofibril angle from acoustic speed measurements,we also need to know the grain angle. Additionalresearch is aimed at developing an acoustic method tomeasure grain angle in a disc.
The aim of this research and development is to be ableto map the microfibril and grain angles in tree discs,enabling a profile of these important properties to begenerated for a tree from successive discs.

3
As part of wood properties enhancement programmeat Ensis we are probing the wood-coating interface ofa wide variety of textured-wood products. We areusing a range of microscopic and analyticaltechniques to obtain information on wood and coatinginteraction, knowledge which is vital for undertakingdevelopments to optimise the performance ofprotective coatings. This article describes a thirdtechnique used to investigate the wood-coatinginterface and complements those described earlier inNewsletters No. 36 and 38.
This third technique uses comparative microscopyemploying light, confocal, and scanning electronmicroscopy performed on the same section from acoated wooden board. This technique was especiallydeveloped for examining the wood-coating interfacein radiata pine boards, which had been sawn toproduce a rough surface texture and subsequentlycoated with a semi-transparent film-forming stain.
The observations and techniques presented are basedon a study of coated wooden boards supplied to us bya product development company based in NewZealand, which is keen to market a pre-finishedproduct they have developed, and who haveapproached us for assistance in evaluating theirproduct.
The coated product examined was radiata pineplywood, which had been band-sawn to produce arough texture and subsequently coated with aspecially formulated semi-transparent acrylic stainsystem. Comparative microscopy was undertaken bysequentially examining the same section using lightmicroscopy (LM), confocal laser scanning microscopy(CLSM), and scanning electron microscopy (SEM) toassess the suitability of the three different types ofmicroscopy for resolving the highly distorted surfacetissues of band-sawn plywood panels in order tounderstand the interaction of the tissues with theapplied coating.
For LM, sliding microtome sections 90 µm thick, cutperpendicular to the surface, were taken from thecoated panels in the region of the wood-coatinginterface. The sections were stained with 0.05%aqueous toluidine blue to enhance the contrast ofwood tissues. The resulting turquoise colour of woodcell walls contrasted well against the natural browncolour of the coating. Stained sections were mounted
in glycerol on a glass slide and examined with a ZeissPhotomicroscope II after a cover glass had beenplaced over the sections. For confocal microscopy, thesame section which had been examined by LM wasimaged with a Leica TCS/NT CLSM. Confocalimages were acquired using an argon/krypton laserwith excitation wavelengths of 568 and 647 nm andemission wavelengths of 600 and 660 nm. A 16xmulti-immersion lens with a numerical aperture of 0.5was used for all images. The same section which hadbeen examined by LM and CLSM was also examinedby SEM. The section was first floated on water fromthe slide, then transferred to ethanol for a fewminutes, before being placed between two glass slidesfor drying at room temperature. Subsequently, thesection was placed on an aluminium stub with anadhesive carbon disc, coated with carbon, andexamined with a Cambridge Stereoscan 240 SEM inthe backscattered mode.
In Figures 1, 2, and 3 are shown LM, CLSM, andSEM images respectively of the same transversesection through a highly distorted surface tissueregion of the coated band-sawn plywood panel.Despite a satisfactory differentiation in contrastbetween the natural brown colour of the coating andthe turquoise colour of wood cell walls after toluidineblue staining, the highly distorted surface tissues arepoorly resolved by LM (Fig. 1) because of its inabilityto bring the distorted surface tissues, underlyingparent tissues and the coating film, into the same focalplane. The use of CLSM readily overcame thisdifficulty as the surface tissues were clearly resolved,providing a clear view of the pattern of distribution of
PROBING WOOD-COATING INTERFACE USING COMPARATIVEMICROSCOPY
Adya Singh and Bernard Dawson
Figure 1. Light micrograph showing greatly distorted surfacetissue masses and associated large cracks. The distorted tissuesappear fuzzy and are not clearly resolved (arrow). Bar = 200 µm.

4
the coating on the plywood panel and within thedamaged surface tissues (Fig. 2). The ability to form acomposite image of a series of successive opticalsections, free of any distortions, is a unique capabilityof CLSM, which enables one to obtain informationfrom relatively thick biological tissues. In our work,we examined the composite images made from opticalsections taken through depths of 12 to 20 µm from thesurface of sections, which made it possible to resolvethe details of even the most highly distorted surfacetissues of panels, as illustrated in Fig. 2. Distortedsurface tissues were also clearly resolved by SEMbecause of its superior depth of focus (Fig. 3).However, this microscopy did not provide anyadditional information beyond that achieved byCLSM. Besides, SEM caused beam damage to therather thin sections, which tended to split in places.
Figure 2. Confocal fluorescence micrograph of the distortedgroup of tissues indicated by an arrow in Fig. 1. The cell walls inthis tissue mass are well defined. Coating in cell lumina and finecracks in cell walls is resolvable (arrowhead). Also resolvable isthe presence of coating within a large crack (arrow) that formedduring band-sawing. Bar = 100 µm.
Figure 3. Scanning electron micrograph of the severely distortedgroup of tissues indicated by an arrow in Fig. 1. The cells in thismass of distorted tissues are well defined. The location of coatingmaterial is also detectable. However, the contrast between thecoating and cell walls is inferior to that in Fig. 2. Cracks (arrow)and cell wall delaminations (arrowhead) have developed due tobeam damage. Bar = 200 µm.
Also, differentiation between the coating and woodtissues was inferior to both LM and CLSM, despitethe use of backscattered mode, which has been widelyused in the studies of composite materials todifferentiate components based on their atomicnumber differences.
The illustrated LM, CLSM, and SEM images of thesame section from a coated plywood panel that hadbeen band-sawn prior to coating application,demonstrate the usefulness of comparativemicroscopy in examining highly distorted surfacetissues in relation to the distribution of appliedcoating. Although use of rough textured plywood ishighly desired in outdoor situations, examining highlydistorted surface tissues of such plywood bymicroscopy is challenging, and can best be achievedby a combination of microscopy, as demonstratedhere.

1
Issue No. 39 December 2006
Wood DryingEach issue we will delve into our files and give answers to frequently asked drying questions, trying to
add to our general understanding of the technical issues behind the art of Wood Drying
The short answer is that delays between cutting anddrying increase the propensity for surface checking.
Remember, as wood dries it begins to shrink as thefree water in its cells is removed and its bound water,in the cell walls, also begins to be removed. Thisoccurs first on the surface, which is unable to shrink,because the bulk of the wood below it has not yetbegun to shrink. Thus if the surface-to-core moisturecontent (MC) difference is too great, the shrinkagestress (tension stress) on the surface will be excessiveand break fibres causing surface checks. The idea ofcontrolled drying is make sure that the core to surfaceMC difference remains below the point at which anyrupturing will occur. As drying temperature increases,the surface drying conditions can become moresevere, but the transport of liquid water to the surface(called diffusion) improves with temperature, thus abalance is maintained. Successful drying schedulescontrol temperature and humidity to maintain thecorrect balance. Now radiata pine is a very forgivingspecies, as it is very permeable. Freshly sawn radiatapine is very difficult to surface check in a kiln,because moisture moves freely to the surface, and soradiata pine can be dried at very high temperatures,because at high temperatures the movement ofmoisture to the surface can be kept in balance with therate of removal from the surface.
All this changes if the surface layer (outer 1 mm) isalready dry when the wood goes into the kiln. Whenthe kiln is turned on, the Dry Bulb temperature rises,and the surface heats up before the core does. Withsurface conditions hot but internal temperatures verylow, the surface layer immediately begins dryingfurther, trying shrink even more. Since the core isn’tshrinking, a large tension stress can develop on thesurface. Often this is beyond the yield point for thattemperature and surface checking occurs.
What can be done?
• Minimise delays between sawing and drying.Less than 2 or 3 days is okay. After a week,especially in summer, remedial action might benecessary.
• If the delay is too long, the situation can bealleviated by pre-steaming before drying. Ideally,boil the water bath to reach 80°–100°C and leavelong enough to heat the wood before dryingcommences. Definitely reach the Wet Bulb withthe bath alone and leave long enough for thesurface to be re-wet. This has the effect ofdelaying shrinkage on the surface until moisturediffusing from the core can begin diminishing theMC gradient.
• Steaming water baths are ideal as humidity isadded with no extra heat. If a water bath is notavailable, heat the kiln with the vents shut andsprays on. Rewetting the surface with hoses hasbeen done but we have no data on how effectivethis is.
WHY IS IT RECOMMENDED THAT RADIATA PINE BEPROCESSED WITH MINIMUM DELAY BETWEENCUTTING AND DRYING?
2
Believe it or not!
• When we were studying surface checking inradiata pine, it was difficult to make it check. Weactually had to get sawn timber and leave it infillet outside for 2–3 weeks.
• Surface checking is not a new phenomenon,but has become more prominent as finishingtechniques for timber have improved. It wasobserved back in the 70s when dehumidifiersfirst arrived. These units unfortunately wereoften undersized, having being designed forslower-drying species, and thus could not copewith the large amount of water so readilyextracted. Air drying prior to dehumidificationwas done to improve throughput; however, the
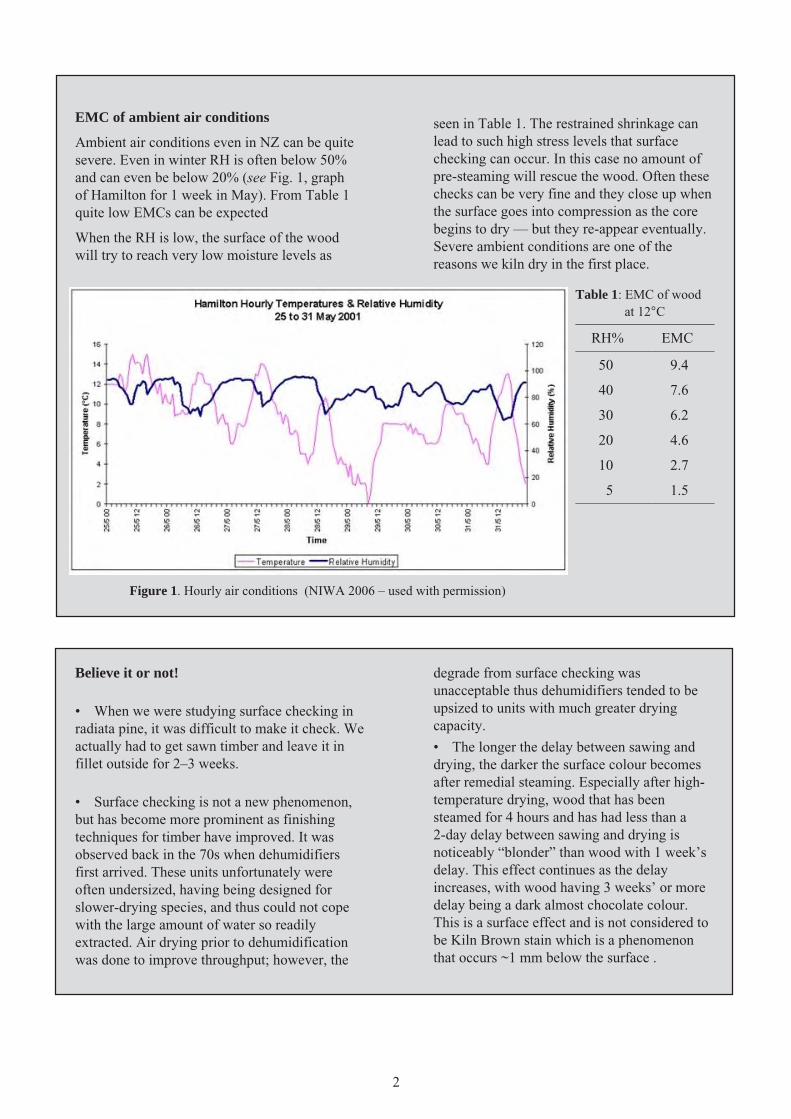
EMC of ambient air conditions
Ambient air conditions even in NZ can be quitesevere. Even in winter RH is often below 50%and can even be below 20% (see Fig. 1, graphof Hamilton for 1 week in May). From Table 1quite low EMCs can be expected
When the RH is low, the surface of the woodwill try to reach very low moisture levels as
seen in Table 1. The restrained shrinkage canlead to such high stress levels that surfacechecking can occur. In this case no amount ofpre-steaming will rescue the wood. Often thesechecks can be very fine and they close up whenthe surface goes into compression as the corebegins to dry — but they re-appear eventually.Severe ambient conditions are one of thereasons we kiln dry in the first place.
Figure 1. Hourly air conditions (NIWA 2006 – used with permission)
degrade from surface checking wasunacceptable thus dehumidifiers tended to beupsized to units with much greater dryingcapacity.
• The longer the delay between sawing anddrying, the darker the surface colour becomesafter remedial steaming. Especially after high-temperature drying, wood that has beensteamed for 4 hours and has had less than a2-day delay between sawing and drying isnoticeably “blonder” than wood with 1 week’sdelay. This effect continues as the delayincreases, with wood having 3 weeks’ or moredelay being a dark almost chocolate colour.This is a surface effect and is not considered tobe Kiln Brown stain which is a phenomenonthat occurs ~1 mm below the surface .
Table 1: EMC of woodat 12°C
–––––––––––––––––––RH% EMC
–––––––––––––––––––50 9.4
40 7.6
30 6.2
20 4.6
10 2.7
5 1.5–––––––––––––––––––

3
Introducing a revamped service to the timber dryingindustry — the OptiKilnTM service.
Ensis now offers two types of kiln audits as part of theOptiKilnTM service:
(1) Acceptance Audit of new kilns againstperformance specifications.
(2) Performance audit of existing operations.
These audits provide a wood processing businessfurther access to the knowledge and equipment of theEnsis Drying team.
OptiKiln Acceptance Audit
The Acceptance Audit is conducted to compare theactual performance of a kiln against a performancespecification. These audits are usually conducted onnew kilns, where the final payment for the kiln isdependent on its satisfactory performance against theperformance specification.
During an Acceptance Audit, the followingparameters are measured on one or two kiln charges:
• Airflow forward and reverse, airflow variabilityacross the kiln stack.
• Kiln heatup time to setpoint.
• Temperature variability during drying.
• Accuracy of temperature control during drying.
• Heatup time and temperature during finalsteaming.
• Conditions achieved during final steaming.
• Final moisture content and stress levels of drykiln charge.
The benefits of conducting an Acceptance Audit are:
• Independent assessment of the performance of anew kiln against performance specifications.
• Identification of kiln performance problemsbefore making the last payment on the kiln.
• Benchmarking the performance of a kiln againstaccepted industry standards.
OptiKiln Performance Audit
The Performance Audit is normally conducted at a sitewith established kilns. The audit offers an independentreview of operating practices and compares the sitepractices against industry standards. The audit mayinclude aspects of other areas of the timber processing
business, including the sawmill, sales, and planning.Activities in these areas of the processing industry,such as sawing variation and kiln charge build, have alarge effect on the drying operation. The audit mayalso include some on-site training of personnel, whichis specific to the equipment and schedules being used.
Areas that are covered by a Performance Auditinclude:
• A review of kiln schedules.
• Standard of kiln stacking.
• Maintenance of kiln equipment.
• Assessment of the quality of dry timber.
ª Use of quality control data to optimise thebusiness.
• Kiln utilisation.
• Level of kiln operator knowledge.
The benefits of conducting a Performance Audit are:
• Specific recommendations on improving kilnperformance.
• Identification of kiln maintenance and designproblems.
• Customised training of your staff on yourpremises.
Examples of the likely benefits from an OptiKilnTM
audit are indicated by the following case studies.
CASE STUDY 1: Acceptance Audit
Company A had purchased a new HT kiln andsteaming chamber worth about $800,000 and hadcompiled a performance specification for the kiln. Thefinal payment to the kiln supplier was dependent onsatisfactory performance of the kiln.
Ensis was employed as an independent group toconduct a Performance Audit of the kiln against theperformance specification. Airflow and temperaturevariation was measured.
The airflow was specified to be at least 8.0 m/s, withthe difference between forward and reverse to be lessthan 10%. The testing showed that the airflow didexceed 8.0 m/s (8.5 and 8.3 m/s) and that the variationin airflow was acceptable.
Heatup of the kiln to 120°C was within the specified2 hours. The temperature variation was within theallowed 5°C temperature variation.
KILN AUDITS IMPROVE KILN PERFORMANCE
Ian Simpson

4
The kiln specification also included an estimatedannual kiln production. This was estimated on thecharge details from the first five kiln charges.
At the completion of testing, the purchaser of the kilnreceived the kiln audit report and was able to make thefinal payment on the kiln with confidence that his kilnwas performing according to the specifications.
Graph showing typical heatup time and control of dry bulbtemperature during six fan circulations.
Testing airflow in a kiln.
Several days were spent on-site with a major focus ontraining of the new kiln operator. The extensivelibrary of schedules was reviewed and whittled downto several schedules for the main product types.
Airflow was measured in two ACT kiln chambers,Kilns 1 and 2. A modern ACT kiln would be expectedto have an airflow of at least 4 m/s. The airflow inKiln 1 was found to be only 2 m/s and highly variable.The airflow in Kiln 2 was almost twice as high as inKiln 1. Missing baffles in Kiln 1 are likely to havecaused the airflow variation, but additional baffleswere unlikely to double the airflow to that measuredin Kiln 2. The lower airflow in Kiln 1 was calculatedto result in a 40% longer drying time than Kiln 2,which the company could now allow for in theirproduction planning.
–––––––––––––––––––––––––––––––––Air velocity (m/s)
––––––––––––––––––––Forward Reverse
–––––––––––––––––––––––––––––––––Kiln 1 2.0 2.3
Kiln 3 4.3 3.7–––––––––––––––––––––––––––––––––
Benefits to the company
• Kiln operator was better informed about theoperation of his kiln.
• The library of kiln schedules was reduced and thepurpose of each schedule step was explained tothe operator.
• Greater understanding of:
♦ The airflow characteristics of the two kilnsand how these affected drying times.
♦ The effect that too lengthy a period of greentimber storage can have on drying variabilityand surface checking.
♦ The importance of baffles and theirmaintenance to minimise uneven airflow.CASE STUDY 2: Performance Audit
The kiln operator at Company B resigned giving shortnotice of his departure. A replacement was foundfrom within the company, but the new kiln operatorhad limited experience at operating kilns and therewas little time for training from the departing kilnoperator.
The new kiln operator was left with the challenge ofoperating several computer-controlled kilns, with alarge selection of kiln schedules. There seemed to be aschedule for each size and type of timber, for each ofthe kilns. The company was also concerned about theperformance of their kilns.
1
Issue No. 39 December 2006
The New Zealand Standard NZS 3640:2003“Chemical preservation of sawn and roundwood”requires complete sapwood penetration. Full sapwoodpenetration is deemed to have been achieved if thepreservative is detectable in the central one-ninth coreof sapwood. For preservatives which have copper asan active ingredient, this is readily confirmed usingrubeanic acid or chrome azurol spot tests because theyproduce strong colour reactions in the presence ofvery low levels of copper. On the other hand, spottests for boron are much less sensitive and checkingfor full sapwood penetration compliance by spot testsalone can be inconclusive.
Low uptake processes for water-based preservatives(considered ≤150 l/m3) can use double vacuum, lowpressure Lowry, or Rueping schedules. Theseschedules are designed to keep the moisture content offraming timber low, and minimise swelling, so there isno need for kiln drying after treatment.
Often very low uptake processes result in a streakypenetration pattern which, from visual assessment, isnot accepted as full sapwood penetration. However, ifcore samples are analysed, penetration compliance isfrequently confirmed.
The Ensis preservation group undertook to investigatethe discrepancy between visual and analytical pass/failure for boron penetration tests when solutionuptakes are low. For the investigation, 30 kiln-dried,4x2, 2.4-m studs containing mostly sapwood were cutinto two end-matched samples for treating in twocharges, A and B. Both treatment charges usedvery low uptake schedules, with charge Btargeting a slightly lower uptake than A. Boardswere treated with a 14.8% boric acid equivalent(BAE) solution. Density of treating solution was105.5 g/100 ml. The moisture content of allboards was measured before treatment and allboards were weighed before and after treatmentto determine treating solution uptake.
From the 30 boards, 10 end-matched samples (the fivehighest and five lowest uptakes) were selected fromboth charges, for analysis for boron penetration andretention. Turmeric Spot test reagent was used todetermine extent of preservative penetration. In thistest, areas containing boron compounds develop anorange red to deep red-pink colour. Treatment resultsare summarised in Table 1.
Cross-section and core analyses for the matched fivehighest and five lowest uptakes in each charge areshown in Table 2. Samples were analysed followingthe procedure for NZS 3640, H1.2, which requirescomplete sapwood penetration (boron detectable byanalysis in the central one-ninth core) with retentionof at least 0.40% BAE w/w oven-dry weight of woodin the cross-section. In Charge A, all sapwood cross-section retentions exceeded the minimum 0.4% w/wBAE cross-section loading. In addition, all sapwoodcores passed the core loading requirement, which alsois indicative of complete penetration of boron. ForCharge B which had lower uptakes, two out of the 10cross-sections analysed were marginal failures (0.37and 0.39% BAE), but five of the 10 samples failed thespot test full sapwood penetration requirement.
In Treatment A, three sapwood samples failed thepenetration spot test, but none failed by chemicalanalyses. In Treatment B, the high failure rate wasobvious, both by spot test (five samples) and byanalyses (four samples).
BORON PENETRATION IN LOW UPTAKE PROCESSES —A COMPARISON OF VISUAL AND ANALYTICAL CORE PENETRATION
Kourosh Nasheri, Mick Hedley, and Gavin Durbin
Table 1. Treatment results––––––––––––––––––––––––––––––––––––––––––––––––––––––
Charge A Charge B––––––––––––––––––––––––––––––––––––––––––––––––––––––MC % before treatment 13.3 (20.4*) 13.3 (20.4)MC % after treatment 20.8 (16.8) 19.5 (18.2)MC % increase 7.5 6.2Solution uptake (l/m3) 34.5 28.1Calculated retention (kg BAE/m3) 5.1 (31.2) 4.2 (31.7)Calculated retention (BAE % w/w) 1.3 (31.2) 1.0 (31.7)––––––––––––––––––––––––––––––––––––––––––––––––––––––* Number in parentheses is coefficient of variability (%)
2
Results clearly demonstrate that, to confirm completesapwood penetration when using low uptaketreatments with boron preservatives, chemical analysisis advisable, spot-testing alone is not reliable.
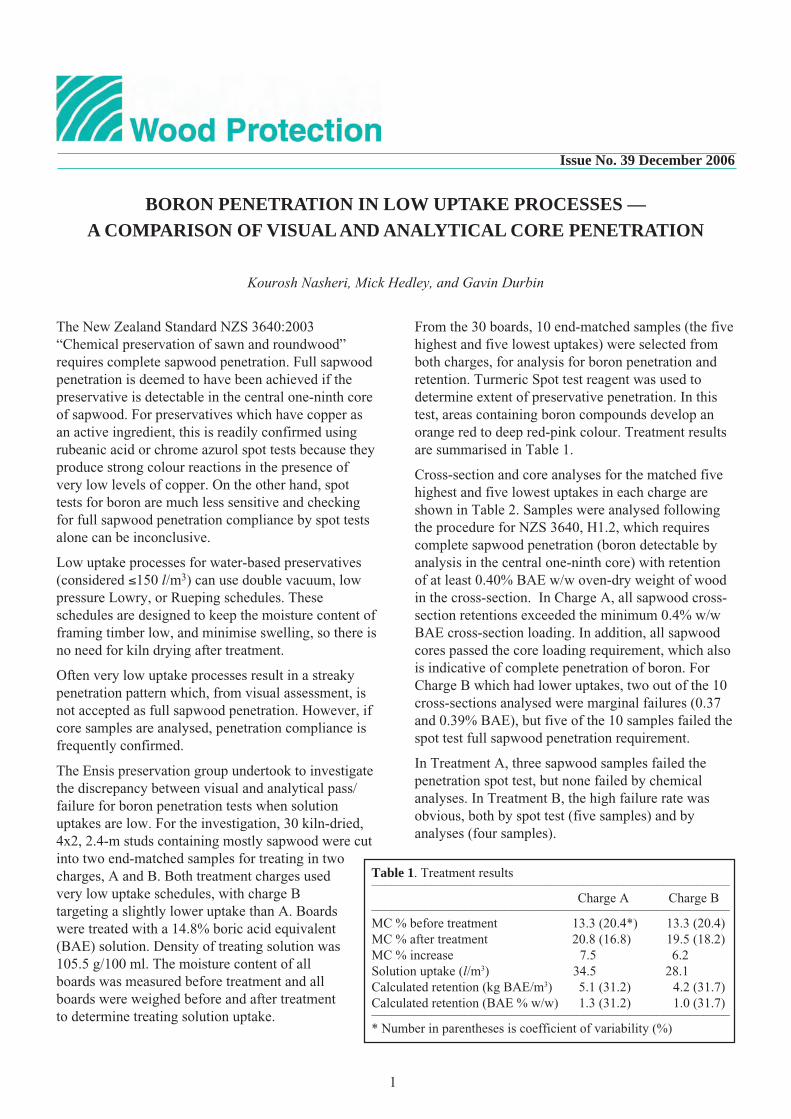
Table 2. Analytical results of loading for selected samples––––––––––––––––––––––––––––––––––––––––––––––––––––––––––––––––––––––––––––––––––––––––––––––––––
Sample Sapwood Penetration BAE % in BAE % PenetrationNumber (%) pass/fail cross sections in cores pass/fail
by spot test (w/w) (w/w) by analysis––––––––––––––––––––––––––––––––––––––––––––––––––––––––––––––––––––––––––––––––––––––––––––––––––
Charge A2 0 Fail 0.42 <0.01 Fail9 100 Fail 0.45 0.02 Pass
10 80 Fail 0.51 0.03 Pass12 100 Pass 1.00 0.42 Pass16 100 Pass 1.34 1.28 Pass18 100 Pass 0.61 0.02 Pass19 100 Fail 0.57 0.02 Pass20 100 Pass 0.80 0.52 Pass22 100 Pass 0.88 0.27 Pass27 90 Pass 1.74 0.11 Pass
Charge B2 80 Fail 0.44 <0.01 Fail9 100 Fail 0.39 <0.01 Fail
10 100 Fail 0.37 <0.01 Fail12 100 Pass 0.86 0.26 Pass16 100 Pass 1.06 0.53 Pass18 100 Fail 0.60 0.02 Pass19 100 Fail 0.53 <0.01 Fail20 100 Pass 0.73 0.34 Pass22 100 Pass 1.18 0.41 Pass27 100 Pass 0.84 0.04 Pass
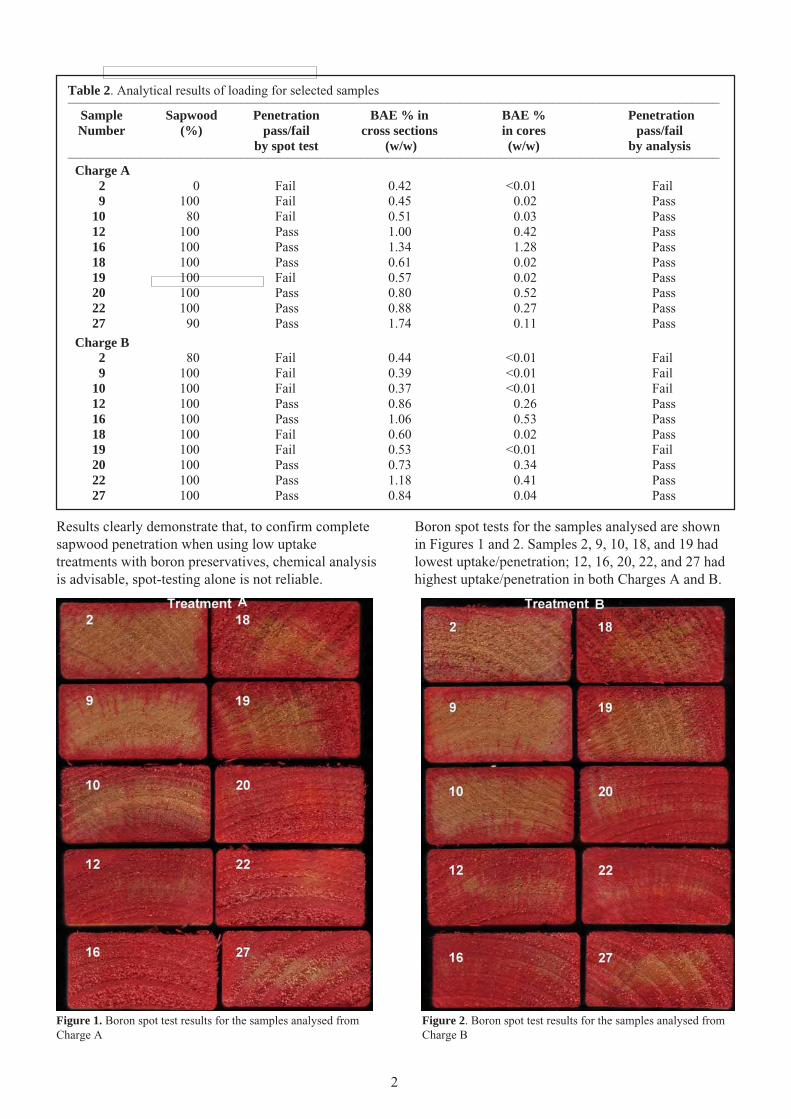
Figure 1. Boron spot test results for the samples analysed fromCharge A
Figure 2. Boron spot test results for the samples analysed fromCharge B
Boron spot tests for the samples analysed are shownin Figures 1 and 2. Samples 2, 9, 10, 18, and 19 hadlowest uptake/penetration; 12, 16, 20, 22, and 27 hadhighest uptake/penetration in both Charges A and B.

3
In Newsletter No. 38 (June 2006) we introduced an areaof research at Ensis concerned with protecting woodand wood products through development and use ofenvironmentally friendly technologies. The aim of thebioactive group is to identify a range of bioactivemolecules which could be used for protection of greenwood, as well as wood placed in service, againstbacteria and fungi. Although we have identified anumber of natural products with potential for theapplications we seek, to date chitosan has received ourclosest attention. The exploratory work done usingchitosan, a naturally abundant polymer, has shownconsiderable promise in controlling the growth ofimportant sapstain and other wood-degrading fungi. Weare presently undertaking fundamental studies tounderstand the primary cellular target(s) of chitosanwithin the hyphae of affected fungi.
The effect of chitosan treatments on the common wood-degrading fungus Sphaeropsis sapinea was examinedusing a range of physiological, biochemical, andmicroscopic methods. The data presented here and theelectron microscopic images suggest that the growth-inhibitory effect of chitosan on S. sapinea is related tosignificant alteration in the composition andorganisation of vital cell components, with plasmamembrane being the primary target of this bioactivemolecule.
We wanted to know whether reactive oxygen species(ROS) are included in fungal responses to thistreatment. Organisms produce ROS during their normalmetabolic processes; however, production of ROS inexcess of requirement under stress conditions can belethal to cells.
Initially, we examined the effect of chitosan onS. sapinea. The fungus was grown on nutrient mediumamended with different concentrations of chitosan (0.01to 0.1%). The formation of superoxide and hydrogenperoxide radicals was monitored after the plates wereflooded with either Nitro Blue Tetrazolium (NBT) inpropane sulfonate-NaOH to detect superoxide thatreacts with NBT to form a blue precipitate, ordimaminobenzidine and horseradish peroxidase inpotassium phosphate buffer to detect peroxide thattriggers the accumulation of a red precipitate. Thecolour intensity that reflected accumulation ofprecipitates is shown in Fig. 1 and 2 expressed asaverage colour intensity for all three colours monitored.
BIOACTIVE RESEARCH AT ENSIS; UNDERSTANDING MODE OF ACTION OFCHITOSAN
Tripti Singh, Damiano Vesentini, Colleen Chittenden, and Adya P. Singh
Figure 2. Effect of increasing chitosan concentrations on peroxideproduction in S. sapinea after 2 days of incubation, as shown bydecreasing colour intensity.
The method for measuring colour intensity providesresults which are inversely proportional to thebrightness or darkness of the colour. Thus a lightprecipitate colour typical of low levels of ROS will beexpressed as high-intensity readings, and vice versa.
The occurrence of oxidative stress caused by thepresence of ROS was evident during the initial stages ofgrowth of S. sapinea. At increasing chitosanconcentrations a decrease in superoxide formation wasobserved, associated with an increase in hydrogenperoxide.
Figure 1 shows a significant (p<0.01) increase in thecolour intensity values recorded, as compared to thecontrols. The decrease in superoxide accumulationobserved was accompanied by an increase (p<0.01) inthe accumulation of hydrogen peroxide at the highestconcentrations of chitosan (Fig. 2). This could beindicative of a rapid conversion of superoxide tohydrogen peroxide in the presence of chitosan.Persistent high levels of hydrogen peroxide can causeoxidative stress, leading to alterations in cell physiologyand metabolism.
The presence of chitosan in the growth medium causedthe leakage of potassium ions K+ from fungal cells.This effect was observed as early as 5 min after
Figure 1. Effect of increasing chitosan concentrations on superoxideproduction in S. sapinea after 2 days of incubation, as shown byincreasing colour intensity.

4
chitosan treatment of fungal cultures. K+ leakagesteadily increased over a period of 30 min aftertreatment. The lowest concentration of chitosan tested(0.01%) was sufficient to initiate the leakage of K+
and the effect was more pronounced at higherconcentrations. These results indicate a profoundeffect of chitosan on the integrity of the cellmembrane, with a consequent loss of functionalitywhich could explain the growth inhibition observed inthe fungi after chitosan treatment.
Microscopic observation revealed that the chitosanaffected the morphology and ultra-structure ofhyphae. Light microscopy showed excessive hyphalbranching and reduction in hyphal diameter andlength, and the alterations were observable even at thelowest concentration of chitosan (0.01%). Hyphaeexposed to 0.1% chitosan showed pronouncedvacuolation, and hyphae appeared almost empty(Fig. 3).
Figure 3. (left) Excessive branching and vacuolation in themycelium of S. sapinea after 4 days’ exposure to 0.1% chitosan.(right) Lack of vacuolation and excessive branching in untreatedmycelium.
Figure 4. Hyphae of S. sapinea under SEM, (a) untreated,(b) exposed to 0.01% chitosan, (c) exposed to 0.1% chitosan(lower magnification), (d) exposed to 0.1% chitosan (highermagnification)
Figure 5. Hyphae of S. sapinea under TEM, (a) treated with0.01% of chitosan, plasma membrane disrupted, cytoplasm isdense and organelles disintegrated, (b) untreated hyphaexhibiting intact cell wall and plasma membrane andwell-preserved organelles.Examination by scanning electron microscopy (SEM)
showed a profound effect of chitosan on the cell wall,even at the lowest concentration tested. The cellsurface became corrugated and this phenomenonbecame more pronounced as the concentration ofchitosan increased. It was also observed that at higherconcentration of chitosan, hyphae tended to aggregateand form hyphal bundles (Fig. 4c). This phenomenonwas also associated with the occurrence of warts onthe hyphal surface, which was observable only athigher magnifications.
The transmission electron microscopy (TEM)examination of chitosan-treated and untreatedS. sapinea hyphae provided evidence of ultrastructuralchanges in all cell components. Disruption in plasmamembrane, vesiculation of membranes, aggregation ofcytoplasmic contents and residues, and delaminationof cell-walls were induced even by the lowestconcentration (0.01%) of chitosan used (Fig. 5a). Incomparison, the untreated S. sapinea hyphaecontained intact cell walls and plasma membrane andwell preserved organelles (Fig. 5b).
Taken together these observations suggest a primaryeffect of chitosan on membrane structure andpermeability. Lipids are important components of cellmembranes, and ROS build-up in excess of normalphysiological requirements can cause lipidperoxidation, resulting in altered membrane structureand properties. The evidence presented in our worksuggests that chitosan has affected S. sapinea hyphaeby triggering oxidative stress.
The fundamental knowledge on the mode of action ofchitosan will help us develop a strategy for applicationsystems where use of bioactives will be based onspecific cellular targets, such as plasma membrane.
A B

Issue No. 39 December 2006
As concern grows about the rising price of fossil fuels,the forest industry is offering a viable alternativethrough the use of wood waste. The opportunity to usethis waste more effectively has been identified by boththe forest industry and the Government. The ForestIndustry Development Agenda (FIDA) BioenergyProgramme is funding a new initiative that will helpdevelop the market for wood waste in this country andprovide growers with the potential to cash in onharvesting residues.
New Zealand already makes good use of renewableenergy sources, particularly in terms of hydro andgeothermal electricity production. However, themarket is growing for other renewable energy sourcessuch as wind, solar energy, and industrial waste(including wood). In order for the forest industry tocapitalise on this opportunity, a market must be createdfor buying and selling wood waste on a larger scale.
To facilitate this market development, the EnergyEfficiency Conservation Authority (EECA), whichadministers the FIDA Bioenergy Programme, hasengaged with Scion, Sysdoc Ltd (the websiteconsultants, www.sysdoc.co.nz), and the EnergyLibrary (www.energylibrary.org.nz to form theBioenergy Knowledge Centre. This KnowledgeCentre has two main services. The first is to provideaccess to a pool of experts via a “call centre” to assistevaluation and analysis of bioenergy opportunities(0800 BIOENERGY). The second is a web-basedservice “Bioenergy Gateway”, provided for forestowners, wood processors, or investors in bioenergyfacilities (www.bioenergy-gateway.org.nz).
The Bioenergy Knowledge Centre will:
• Build the overall profile of bioenergy
• Increase knowledge of technologies both in NewZealand and internationally
• Ensure a broad range of information is availableto potential users
• Build a community of like-minded companieswhere practical experience in implementingbioenergy alternatives can be shared.
The website will also enable forest owners todetermine the potential value of forest residues ontheir cutovers and compare this value to that of theequivalent volume of other fuels.
The forestry sector is already a major user of woodwaste for the generation of process heat in thewood-processing industry. This is used mainly forwood-drying kilns. Large processing sites also usecogeneration to produce electricity from burningwood waste, but much more wood waste could beused for energy production in forestry and othersectors if a better infrastructure were in place for thebuying and selling of forestry residues on harvestingsites.
EECA and Scion envisage that the BioenergyKnowledge Centre will help raise awareness of theseopportunities, provide vital information, and create amarket for the industry. The overall objective of theBioenergy Knowledge Centre is to reduce risks(technical, financial, and operational) and createopportunities related to bioenergy projects.
The Bioenergy Knowledge Centre will be formallylaunched on 24 November 2006. The main targetaudiences during the first year of operation will besawmillers, forest owners, and wood processors. Infuture, the focus of the Bioenergy Knowledge Centrewill expand to include a range of other industries, thegeneral public, and national and local policy makers.
EECA is managing the FIDA Bioenergy project andthe project manager of the Bioenergy KnowledgeCentre is Scion (formerly Forest Research). Co-funding in the establishment phase is provided by theRotorua Trust (the former Rotorua Energy CharitableTrust).
Contact: [email protected]
For more information on the launch [email protected]
OPENING THE BIOENERGY GATEWAY
Per Nielsen
1

The programme Ecological Footprint Plus (EF Plus)will answer this question. It will determine theenvironmental impacts of the wood processingindustry as well as other primary industries in NewZealand. The industries to be studied are forestry,meat and dairy farming, and the processing industriesof wool, meat, milk, and wood.
Scion has been sub-contracted to provide data onresource use and resource outputs (including wastes)from the various wood processing sectors includingsawmilling, panel products, and pulp and paper, andalso the forest management and logging sector.
Results from the EF Plus programme can be used toidentify processes that have a high resource use orlevel of emissions. Minimising the input of material,energy, and land into our rural-based industries, andminimising their production of waste, are critical stepstowards making them (and therefore New Zealand)more sustainable.
The EF Plus programme will develop a model toenable the whole “planetary impact” of a business,process, or technology to be determined. In contrast toexisting ecological footprint analyses, this model willinclude carbon dioxide assimilation, and also theimpacts of solid and liquid effluents and air emissions.
This research programme, which is administered byCanesis (formerly Wool Research), is conducted on acollaborative basis between four main organisations:Massey University, ESR (Environmental Science &Research), Canesis, and Scion.
A further part of this programme concentrates on theeffect of the human dimension on progress towardssustainability. The programme will identify whatfeatures exist within our organisational and culturalstructures that promote or inhibit decisions andbehaviour that support sustainability, and whatprompts are required to encourage sustainability.
HOW “GREEN” IS THE WOOD PROCESSING INDUSTRY?
Carolyn Hodgson
By engaging industry representatives in a process ofconsultation we will gain understanding of thestructural changes necessary to promote sustainablecriteria in industry and in individual everydaydecisions.
Contacts: Carolyn Hodgson, Scion 07 343 [email protected]
Per Nielsen, Scion 07 343 [email protected]
Minimising the use of resources and the production of waste is acritical step towards improving sustainability.
2