Embed Size (px)
Citation preview

Wood Dust Explosion Wood Dust Explosion
Prevention Prevention
John E. John E. BachynskiBachynski B.Sc., B.Sc., P.EngP.Eng..
PresidentPresident
EPM Consulting Ltd.EPM Consulting Ltd.


Brief History of Major Events


The top 100’ of head house atop this 250’ tall grain elevator facility was blown
away, killing 36 and injuring 9, making it the worst such disaster in U.S. history.

Silo holding 300 tons of Ammonium Nitrate. 29 killed, 441 hospitalized. 3000 homes and apartments damaged or destroyed.
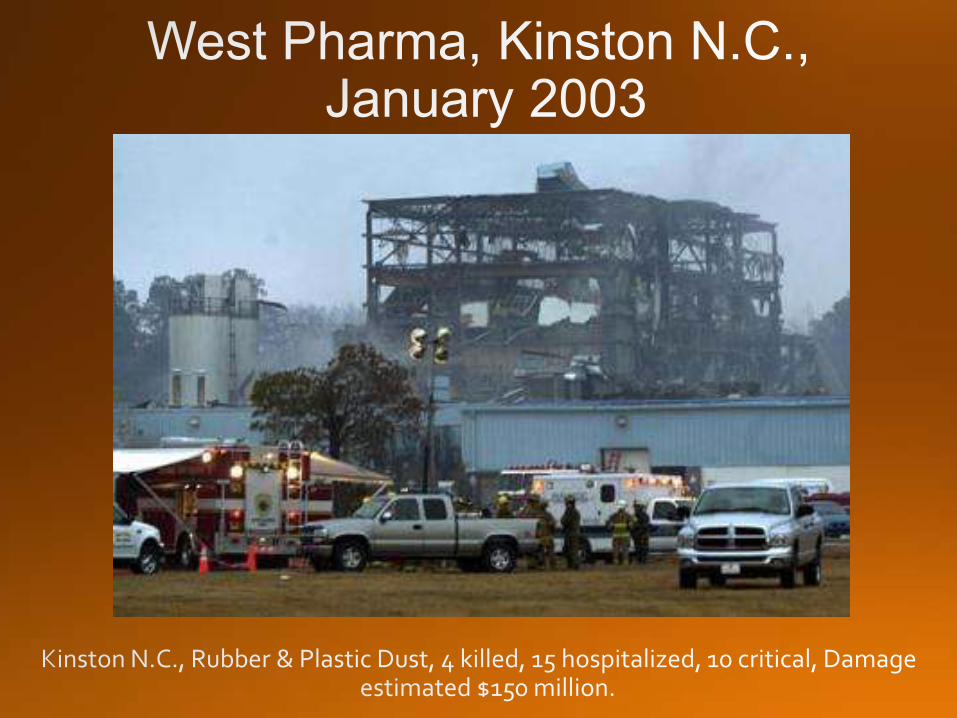
CTA Acoustics, Corbin KY,
February 2003
Resin dust, 7 fatalities, 37 injuries

Tafisa Canada
Particle Board Facility. No injuries. Destroyed plant.

Imperial Sugar Port Wentworth, Ga
February 7, 2008
14 killed, 40+injured. An over heated bearing caused an primary explosion resulting in multiple secondary explosions.

Burns Lake, British Columbia
January 20, 2012
2 killed, 20+injured.

Lakeland Sawmill, Prince George
April 23, 2012
2 killed, 24 injured.

West Fertilizer Company West,
Texas April 2013
15 killed, 160 injured. Plant was leveled along with a near by
assisted living apartment building.
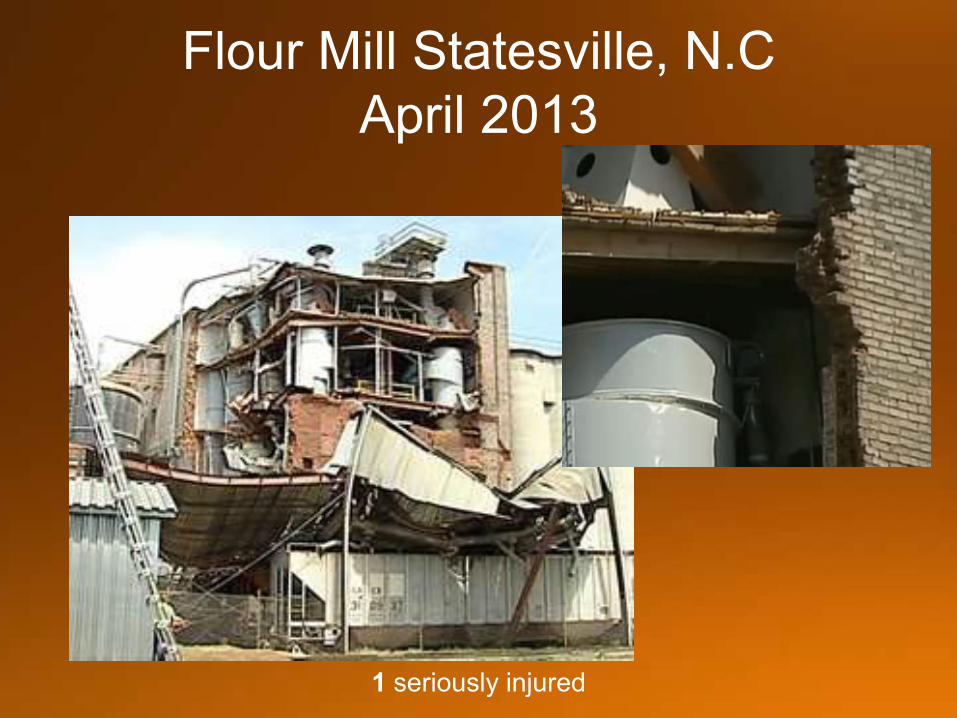
Flour Mill Statesville, N.C
April 2013
1 seriously injured

GM Plant Kunshan, China
August 2014
75 killed, 200+injured.
Fine airborne metal dust from polishing hub caps ignited


Almost 125 dust explosions / year Almost 125 dust explosions / year or or
about ONE every THREE DAYSabout ONE every THREE DAYS

Fatality in Operations
• Worker in a boom lift changing a light bulb
• Multiple events creating sequential suspended dust clouds and explosions
• 3rd degree burns >70% of his body resulting in fatality

38%
15% 12%
9%
7%
7%
6%
4% 3%
Wood Products
Food Products
Primary Metal Ind
Chemical Mfg
Pulp/Paper
Mineral
Plastic/ Rubber
Utility
Other
FM Global property loss prevention data
2007

42%
15%
10% 9%
8%
8%
5%
3%
Wood
Food
Chemical
Metal
Coal
Plastic/Rubber/Resin
Paper
Various
FM Global property loss prevention data
2007

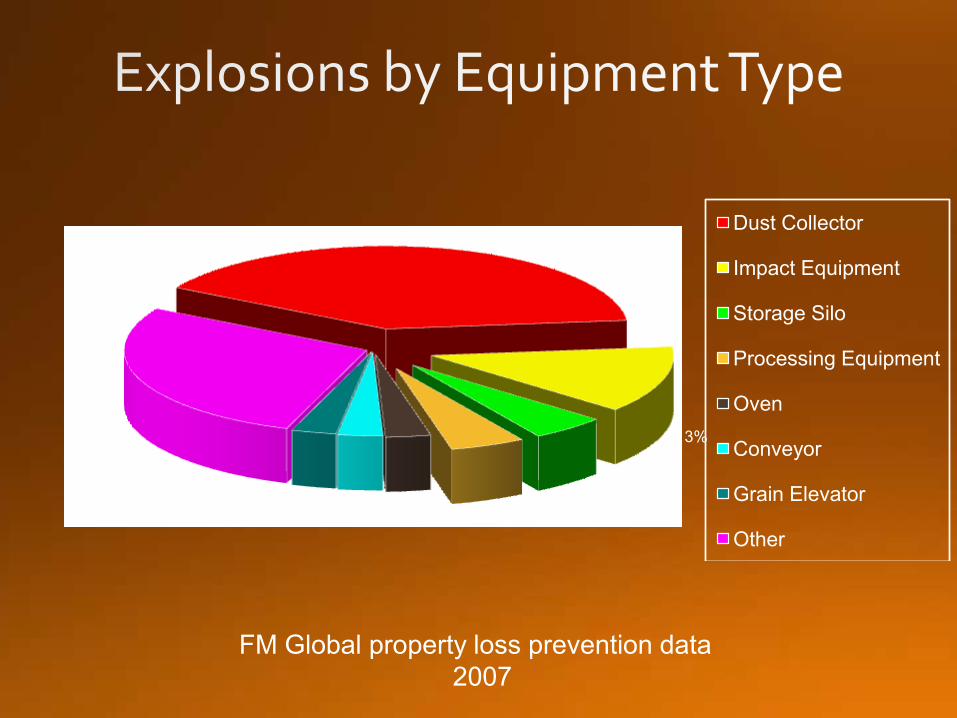
40%
13%
5%
5% 3% 3% 3%
28%
Dust Collector
Impact Equipment
Storage Silo
Processing Equipment
Oven
Conveyor
Grain Elevator
Other
FM Global property loss prevention data
2007

These numbers EXCLUDE gas and mining incidents


Sample MEC DataSample MEC Data
Dust Dust Concentration Concentration
[g/m[g/m33]]
PPmm [bar(g)][bar(g)]
(dP/dt)(dP/dt)mm [bar/s][bar/s]
7070 5050 4040 4040 3030 2020 2020
3.83.8 2.92.9 1.71.7 0.80.8 1.61.6 0.20.2 0.20.2
163163 107107 3434 66 3838 22 11

Most dust explosions occur inside process
equipment. (Optically thick dust clouds in the
flammable range.)
But not always! Primary and secondary explosions!
Explosive RangeExplosive Range


Ignition Source
Fuel
Oxidant

Mixing Confinement
Ignition Source
Fuel
Oxidant


Mixing Confinement
Fuel
Oxidant
Ignition Source

Ignition Source Ignition Source ControlControl
Dust Accumulation Dust Accumulation (Fuel) Management(Fuel) Management


For static electricity to be a hazard, four conditions must be met:
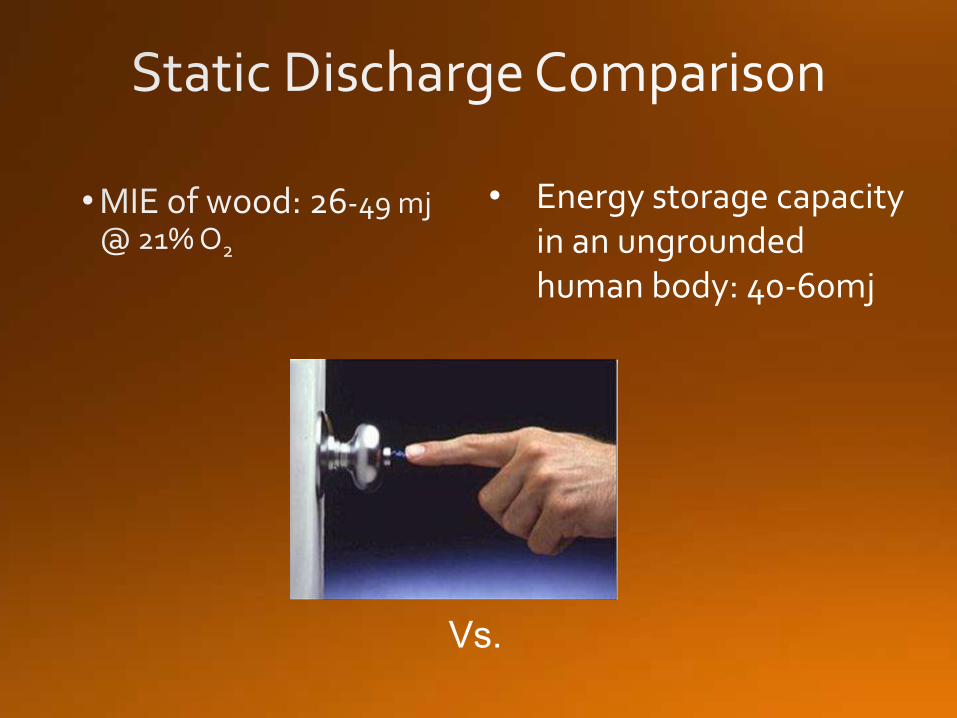
• Energy storage capacity in an ungrounded human body: 40-60mj
Vs.


General Guidelines Where

Dust AccumulationsDust Accumulations

Can you tell the Can you tell the color of this plate?color of this plate?


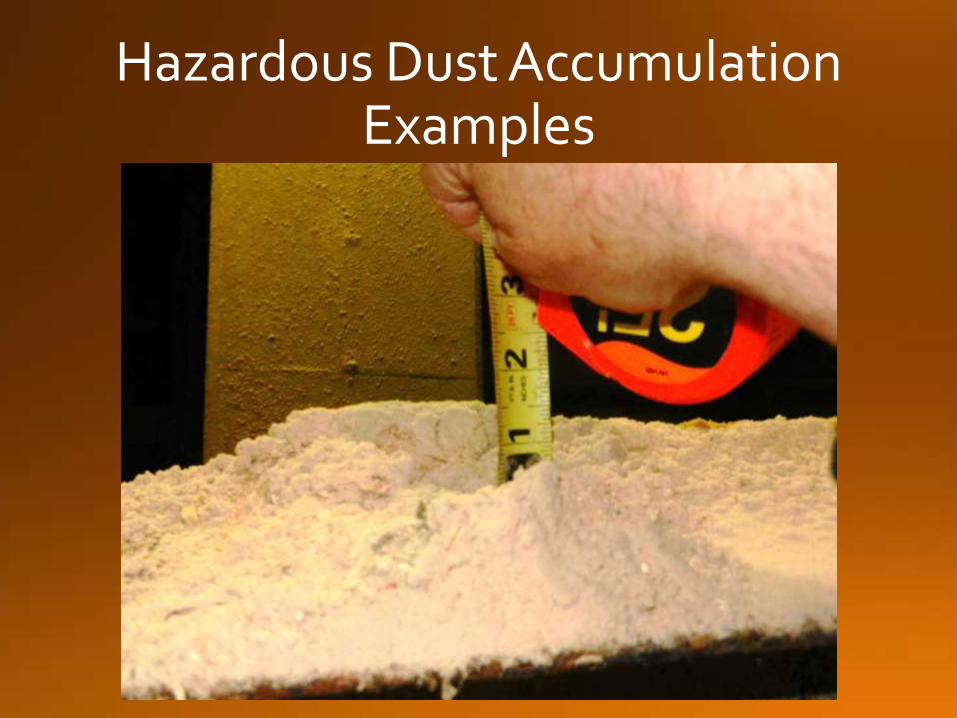
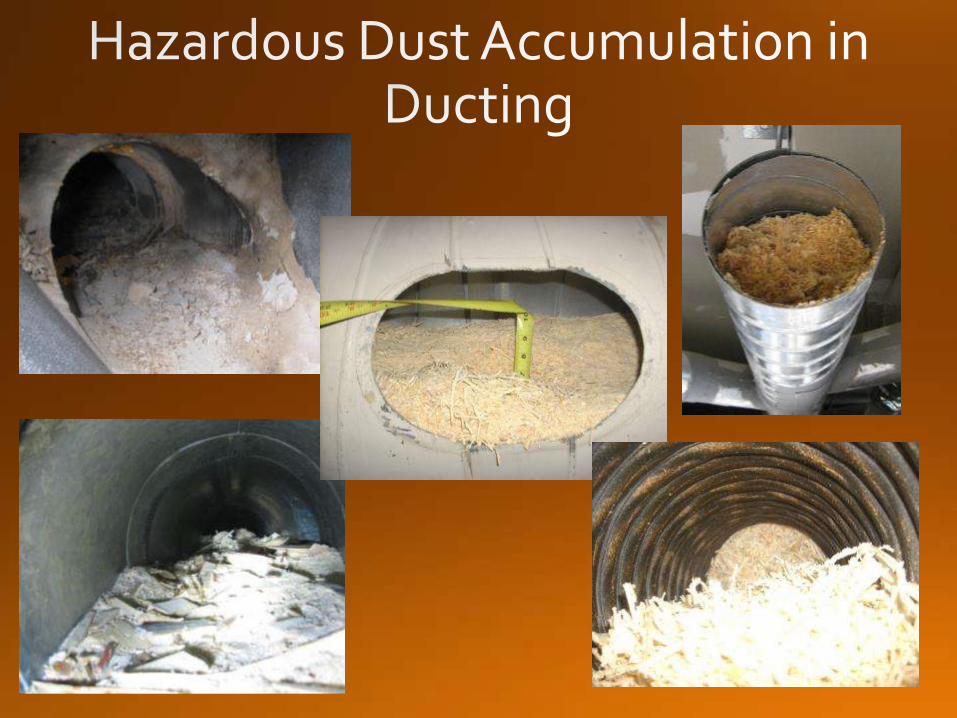
Hazardous Dust Accumulation Examples

Hazardous Dust Accumulation Examples

Hazardous Dust Accumulation Examples

Holes in Equipment

Holes in Equipment

Hazardous Dust Accumulation Examples


Hazardous Dust Accumulation Examples

Hazardous Dust Accumulation Examples

Hazardous Dust Accumulation Examples

Hazardous Dust Accumulation Examples

Hazardous Dust Accumulation Examples

Hazardous Dust Accumulation Examples

Hazardous Dust Accumulation Examples
Hazardous Dust Accumulation Examples


5 – Dust Collection Systems and Associated Risks
40%
13%
5%
5% 3% 3% 3%
28%
Dust Collector
Impact Equipment
Storage Silo
Processing Equipment
Oven
Conveyor
Grain Elevator
Other
FM Global property loss prevention data
2007

Dust Collector

Dust Collector
Vibrating Bag Hangers
Fabric Bags
Dust
Dusty
Air
Clean
Air Dusty
Air
Clean
Air
Fabric Bags
Dust


•• Explosion pressure and flame Explosion pressure and flame willwill propagate propagate through process interconnections to other plant through process interconnections to other plant equipment or personnel occupied areas. equipment or personnel occupied areas.
•• Explosions in connected vessels or dust Explosions in connected vessels or dust containing areas containing areas (secondary explosions)(secondary explosions) tend tend to be of higher severity than explosions occurring to be of higher severity than explosions occurring in single unconnected vessels because of prein single unconnected vessels because of pre--compression, flamecompression, flame--jet ignition, and dust layer jet ignition, and dust layer disbursement. disbursement.
•• StSt--2 & 3 deflagrations 2 & 3 deflagrations can accelerate to can accelerate to detonation velocitiesdetonation velocities while traveling through while traveling through pipelinespipelines..

Successful Successful Explosion Explosion
VentingVenting Explosion Explosion Propagation Propagation
Through Inlet Through Inlet DuctDuct

Explosion Isolation

Inlet Explosion Isolation(sInlet Explosion Isolation(s))
NEW
NEW
NEW
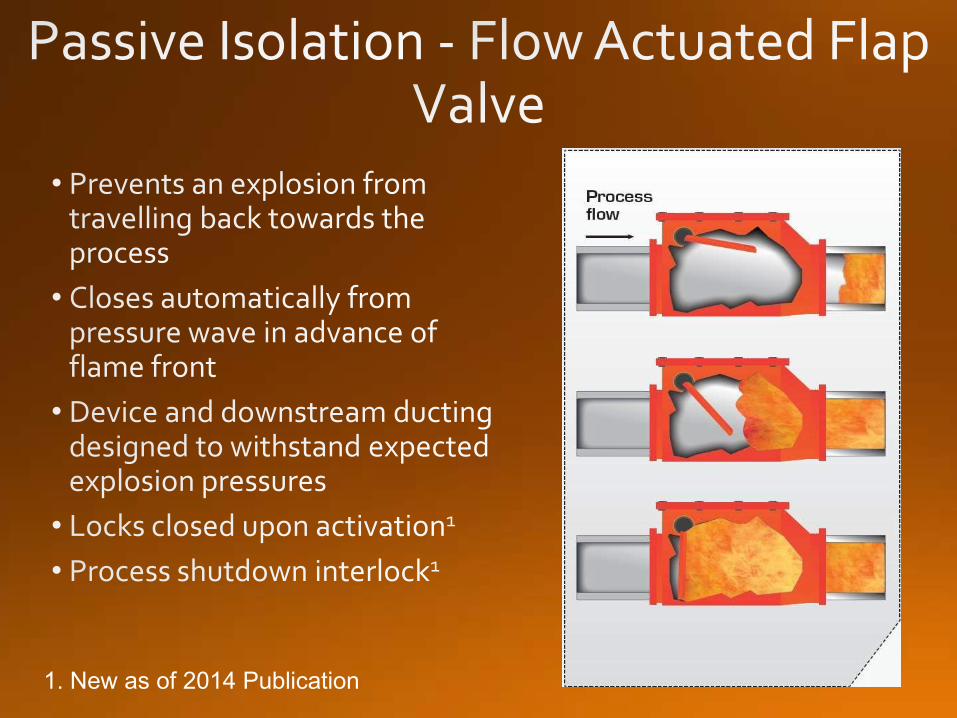
1. New as of 2014 Publication

Pre-2014 NFPA 69
2014 NFPA 69

Abort GateAbort Gate

Abort GateAbort Gate
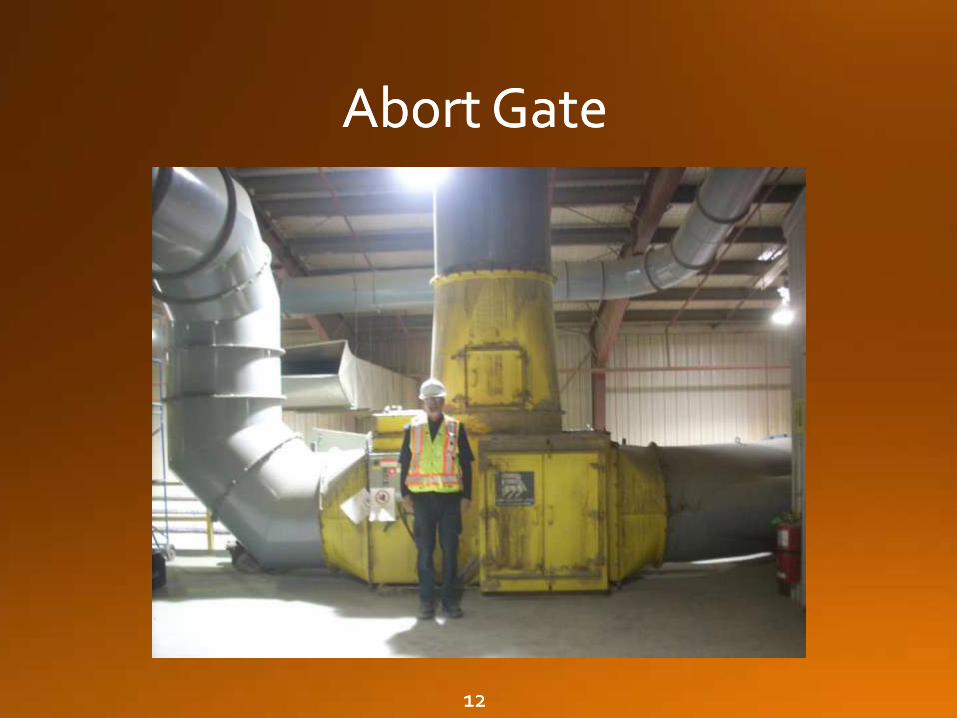
Abort GateAbort Gate
1212

Abort GateAbort Gate

4000 fpm4000 fpm
13 Ft.13 Ft.
66 fps66 fps
Reaction time = 200 millisecondsReaction time = 200 milliseconds
Abort Gate Detection Abort Gate Detection
ExampleExample

4000 fpm4000 fpm
13 Ft.13 Ft.
66 fps66 fps
Reaction time = 200 millisecondsReaction time = 200 milliseconds
Abort Gate Detection Abort Gate Detection
ExampleExample
Proper Duct Velocity For DesignProper Duct Velocity For Design

13 Ft.13 Ft.
Reaction time = 200 millisecondsReaction time = 200 milliseconds
Abort Gate Detection Abort Gate Detection
ExampleExample
5000 fpm5000 fpm
83 fps83 fps

13 Ft.13 Ft.
Reaction time = 200 millisecondsReaction time = 200 milliseconds
Abort Gate Detection Abort Gate Detection
ExampleExample
5000 fpm5000 fpm
83 fps83 fps
Duct Velocity Too HighDuct Velocity Too High


Wood Processing Dust Collection System Example

Storage
Basement
Process Floor

Storage
Basement
Process Floor

Storage
Basement
Process Floor

Storage
Basement
Process Floor

Storage
Basement
Process Floor

Storage
Basement
Process Floor
Explosion Vent


Typical Planer Mill Plan

Typical Sawmill Plan

Typical Debarker Building


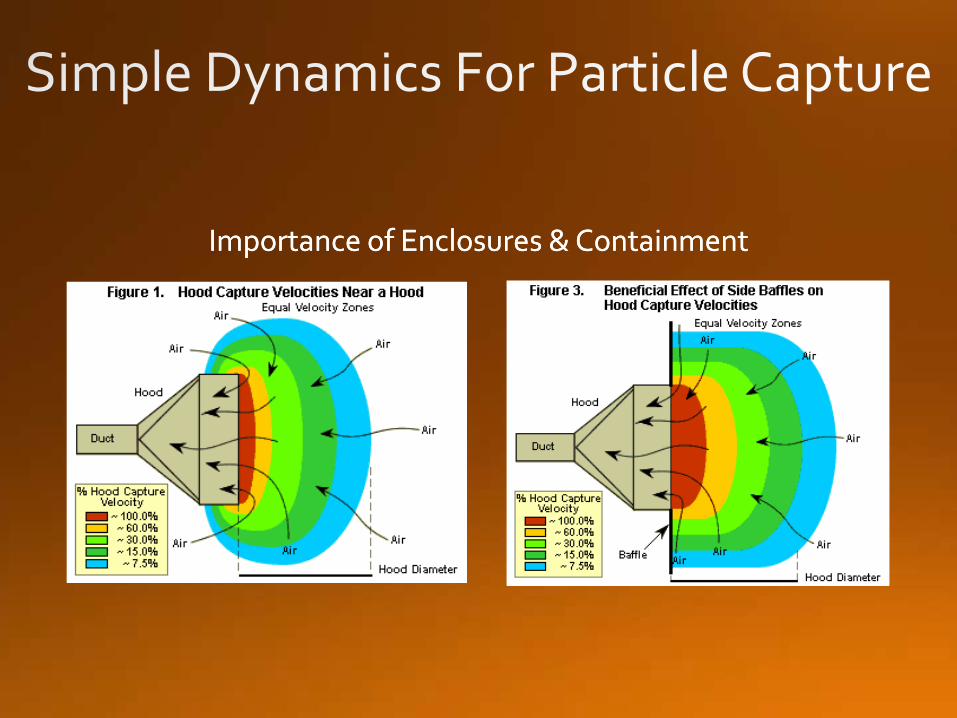
Importance of Enclosures & Containment Importance of Enclosures & Containment

ACGIH Industrial Ventilation Example

ACGIH Industrial Ventilation Example


Material TypeMaterial Type ExamplesExamples Transport VelocityTransport Velocity
Vapors, gases, smokeVapors, gases, smoke All vapors, gases and smokeAll vapors, gases and smoke 10001000--2000 fpm2000 fpm
FumesFumes WeldingWelding 20002000--2500 fpm2500 fpm
Very Fine Light DustVery Fine Light Dust Wood flour cotton lintWood flour cotton lint 25002500--3000 fpm3000 fpm
Dry Dusts & PowdersDry Dusts & Powders Fine rubber dust, cotton dustFine rubber dust, cotton dust 30003000--4000 fpm4000 fpm
Average Industrial DustAverage Industrial Dust Grinding dust, coffee beans, Grinding dust, coffee beans, silica flour, general material silica flour, general material handlinghandling
35003500--4000 fpm4000 fpm
Heavy DustsHeavy Dusts Sawdust (heavy & wet), metal Sawdust (heavy & wet), metal turnings, wood blocksturnings, wood blocks
40004000--4500 fpm4500 fpm

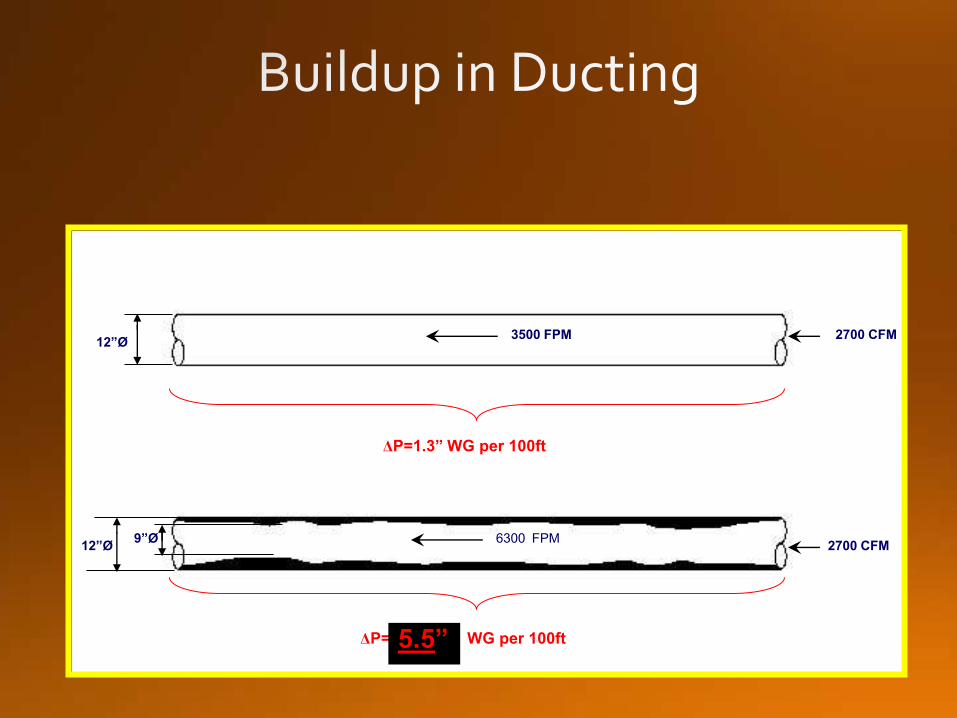
12ӯ
12ӯ 9ӯ
3500 FPM 2700 CFM
2700 CFM 6300 FPM
ΔP=1.3” WG per 100ft
ΔP= 5.5” WG per 100ft 5.5”


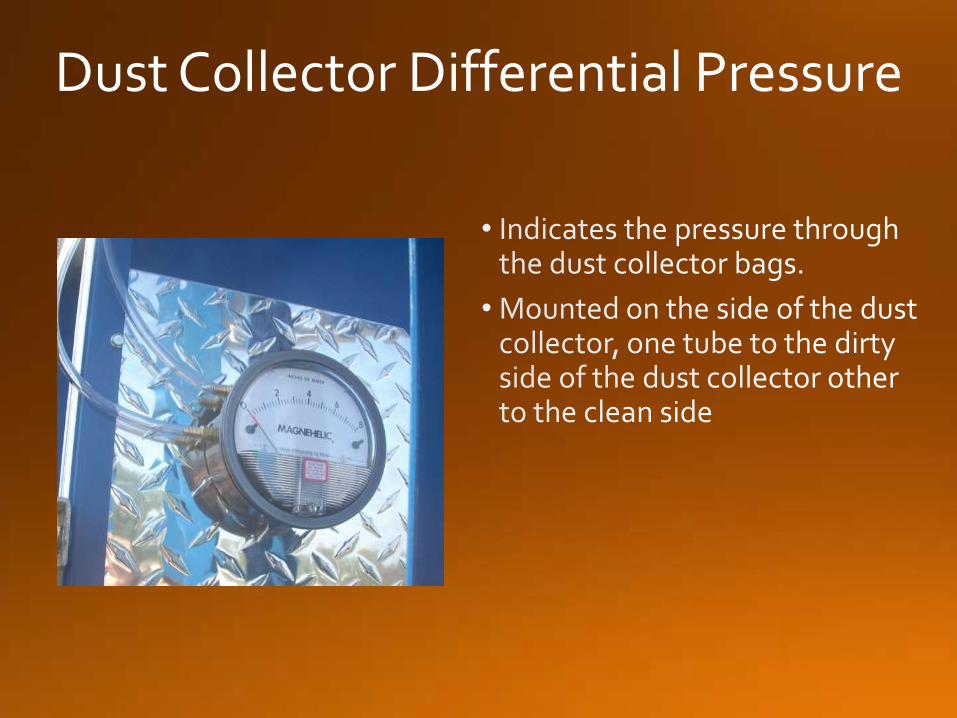
Dust Collector Differential Pressure


6ӯ
18ӯ 16ӯ 14ӯ 11ӯ
20ӯ
System Velocity
= 4000 fpm

6ӯ
18ӯ 16ӯ 14ӯ 11ӯ
20ӯ
System Velocity
= 4000 fpm
Condensation in
ducting, driving up
Static Line Pressure
Higher Static
Pressure Than
With Dry Ducting
Pressure Up
24” w.g.

6ӯ
18ӯ 16ӯ 14ӯ 11ӯ
Dirty Dust
Collector Bags
Higher Static
Pressure Than
With A Clean
Dust Collector
20ӯ
System Velocity
= 4000 fpm
Pressure Up
6” w.g.

6ӯ
Very High
Hood Loss
20ӯ
Higher Static
Pressure Than
The Longest Run
1000
System Velocity
= 4000 fpm
Pressure Up
9” w.g.

4ӯ
20ӯ
Very High Velocity
Pressure (Long, Thin Run)
Higher Static
Pressure Than
The Longest Run
System Velocity
= 4000 fpm
Pressure Up
26” w.g.


Dust Explosion
Prevention
Contributing Factors
HSEHSE ASHRAEASHRAE OSHAOSHA CSBCSB NFPANFPA IEEEIEEE INSURANCEINSURANCE FABFAB--CONTRACTORSCONTRACTORS JOHSJOHS COSTCOST FIRE MARSHALLFIRE MARSHALL AIHAAIHA DEPT OF ENVIRONMENTDEPT OF ENVIRONMENT DOWNTIMEDOWNTIME COMBUSTIBLE DUST POLICY COMBUSTIBLE DUST POLICY
INSTITUTEINSTITUTE DSEARDSEAR EHSREHSR
FCCFCC WSBCWSBC
CSACSA DEPT OF LABOURDEPT OF LABOUR
LEGALLEGAL EQUIPMENT EQUIPMENT SUPPLIERSSUPPLIERS
ENGINEERINGENGINEERING WHIMSWHIMS
OPERATIONSOPERATIONS NECNEC
MSDSMSDS MAINTENANCEMAINTENANCE
SMACNASMACNA DEV. CONTROLDEV. CONTROL
ATEXATEX CORPORATE POLICYCORPORATE POLICY
ACGIHACGIH NEPNEP
AIChEAIChE
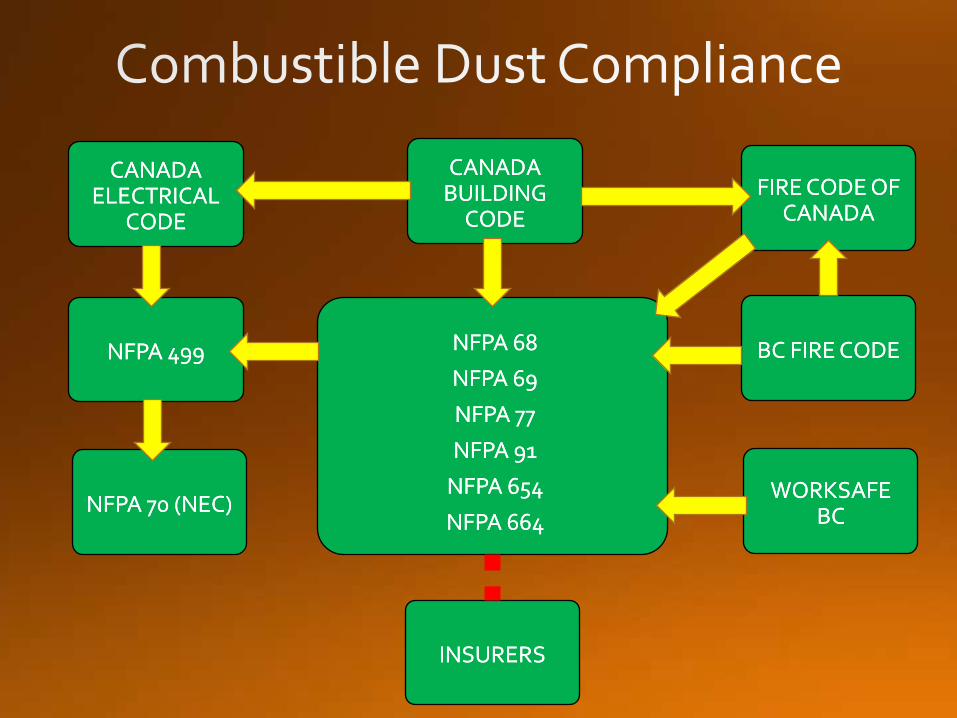
CANADA ELECTRICAL
CODE
CANADA ELECTRICAL
CODE
NFPA 68
NFPA 69
NFPA 77
NFPA 91
NFPA 654
NFPA 664
NFPA 68
NFPA 69
NFPA 77
NFPA 91
NFPA 654
NFPA 664 NFPA 70 (NEC) NFPA 70 (NEC)
NFPA 499 NFPA 499
CANADA BUILDING
CODE
CANADA BUILDING
CODE
FIRE CODE OF CANADA
FIRE CODE OF CANADA
BC FIRE CODE BC FIRE CODE
WORKSAFE BC
WORKSAFE BC
INSURERS INSURERS

• NFPA-61 2013
• NFPA-68 2013
• NFPA-69 2014
• NFPA-70 2014
• NFPA-77 2014
• NFPA-91 2010